
.2
JBS REPORTS FOURTH QUARTER AND FISCAL 2025 RESULTS
March 25, 2026 – JBS N.V. (NYSE: JBS; B3: JBSS32), announces today its 4Q25 and year-end 2025 results. The numbers reported herein are in US dollars, in accordance with International Financial Reporting Standards (IFRS), unless otherwise specified.
(in millions, except per share data)
| Fourth Quarter | Twelve Months Ended | |||||||||||||||
| 2025 | 2024 | 2025 | 2024 | |||||||||||||
| Net Sales | $ | 23,063 | $ | 19,974 | $ | 86,184 | $ | 77,183 | ||||||||
| Adjusted EBITDA (IFRS)² ³ | $ | 1,715 | $ | 1,847 | $ | 6,831 | $ | 7,192 | ||||||||
| Adjusted EBITDA (USGAAP)¹ ² | $ | 1,493 | $ | 1,528 | $ | 5,797 | $ | 6,040 | ||||||||
| Adjusted Operating Income (IFRS)² ³ | $ | 1,092 | $ | 1,291 | $ | 4,523 | $ | 5,002 | ||||||||
| Adjusted Operating Income (USGAAP)¹ ² | $ | 1,116 | $ | 1,187 | $ | 4,425 | $ | 4,734 | ||||||||
| Net Income Attributable to JBS³ | $ | 415 | $ | 413 | $ | 2,024 | $ | 1,767 | ||||||||
| Earnings Per Share Attributable to JBS³ | $ | 0.39 | $ | 0.39 | $ | 1.89 | $ | 1.65 | ||||||||
| Leverage (Net Debt / Adjusted EBITDA LTM)² ³ | 2.4 | x | 1.9 | x | 2.4 | x | 1.9 | x | ||||||||
| Interest Coverage (Adjusted EBITDA LTM / Net Interest Expenses LTM)² ³ | 6.5 | x | 7.4 | x | 6.5 | x | 7.4 | x | ||||||||
| ROE LTM ² ³ | 25.3 | % | 22.1 | % | 25.3 | % | 22.1 | % | ||||||||
| ROIC LTM ² ³ | 17.4 | % | 18.2 | % | 17.4 | % | 18.2 | % | ||||||||
Fourth Quarter Highlights
| ● | Net Sales of $23,063 million, up 15% from prior year |
| ● | IFRS Adjusted EBITDA of $1,715 million, down 7% from prior year |
| ● | USGAAP¹ Adjusted EBITDA of $1,493 million, down 2% from prior year |
| ● | IFRS Adjusted operating income of $1,092 million, down 15% from prior year |
| ● | USGAAP¹ Adjusted operating income of $1,116 million, down 6% from prior year |
| ● | EPS of $0.39, up 1% from prior year |
Fiscal 2025 Highlights
| ● | Net Sales of $86,184 million, up 12% from prior year |
| ● | IFRS Adjusted EBITDA of $6,831 million, down 5% from prior year |
| ● | USGAAP¹ Adjusted EBITDA of $5,797 million, down 4% from prior year |
| ● | IFRS Adjusted operating income of $4,523 million, down 10% from prior year |
| ● | USGAAP¹ Adjusted operating income of $4,425 million, down 7% from prior year |
| ● | EPS of $1.89, up 15% from prior year |
(1) USGAAP (non-audited)
(2) Reconciliations for non-GAAP measures are provided in subsequent sections within this release.
(3) IFRS
“In the fourth quarter and full year 2025, JBS reported record sales, with top-line growth across all business units, reflecting the strength of the Company’s multi-geography and multi-protein platform. Net income totaled US$415 million in the quarter and US$2 billion in 2025, representing year-over-year growth of 1% and 15%, respectively. Free cash flow totaled US$990 million in the quarter and US$400 million for the year. Return on equity (ROE) reached 25%, while return on invested capital (ROIC) was 17%. Leverage ended the fourth quarter at 2.39x, in line with the Company’s long-term target.”, said Gilberto Tomazoni – Global CEO.
JBS Beef North America reported record sales both in the quarter and in 2025. Resilient U.S. demand supported this performance, even with cutout values remaining at historically high levels. However, in both periods, the increase in cattle prices outpaced the change in cutout values, reflecting tighter cattle availability amid the ongoing U.S. cattle cycle. In addition, live cattle imports from Mexico were restricted beginning in May 2025, further constraining supply in the U.S. market for much of the year. As a result, margins remained under pressure in the fourth quarter and throughout 2025.
Pilgrim’s Pride performance reflects the progress and benefits of its long-term strategies. Results in the U.S. demonstrate the strength of its operations and disciplined management. The U.S. Fresh portfolio benefited from strong demand, while Key Customer demand remained solid. The portfolio continues to evolve, becoming more resilient and balanced to capture market opportunities while mitigating risks. The Fresh business outpaced industry growth, and diversification through branded offerings reached a milestone as Just Bare® achieved one billion dollars in sales. In Europe, results continued to improve, supported by manufacturing optimization, management integration, and a better product mix, with positive Key Customer demand and new launches. Despite a challenging scenario in the live commodity market during the quarter, Mexico increased sales and volume compared to 2024. The company continues investing to expand its geographic footprint and grow its prepared foods presence.
JBS Brazil reported record sales in both the quarter and the year, growing 26% and 21%, respectively. Higher prices partially offset the sharp increase in cattle costs during the period. Even in this context, the Company recorded the highest slaughter volume in its history. In the export market, strong global demand combined with geographic diversification drove performance, boosting sales across several strategic regions while also enabling the development of new markets. In the domestic market, results reflected stronger brand equity, solid commercial execution, improved service levels, and continued value-added offerings through Friboi+ (supermarket butcher specialization program). The fourth quarter was particularly strong, with robust demand for barbecue cuts. Friboi was once again recognized as Top of Mind, winning the meat category for the sixth consecutive time and reinforcing its leadership in Brazil.
Seara delivered sales growth both in the quarter and in 2025, driven by higher volumes and prices. In the export market, the Company achieved the highest export volume in its history, despite temporary restrictions in key markets such as China and Europe following a single avian influenza case in Brazil in May. In the domestic market, sales performance reflected strong commercial execution, continued brand strengthening, and ongoing innovation, adding greater value to the portfolio. Seara reached a 93% household penetration in Brazil and record-high repurchase rates. As a result, Seara reported solid performance, reinforcing the consistency of its strategy and operational discipline.
JBS USA Pork also reported record net sales for the year and its highest fourth-quarter net sales, supported by strong domestic market performance driven by solid demand and the Company’s continued efforts to expand its value-added and branded product portfolio. Solid demand, combined with controlled costs and strong operational execution, resulted in margins in line with historical levels, both in the quarter and for the year. In addition, in 2025, the Company announced the expansion of its pre-cooked bacon and breakfast sausage production through the acquisition of a plant in Iowa, as well as a new facility (organic expansion) announced in the second quarter in the same state.
JBS Australia net sales growth in 4Q25 and full-year 2025 was primarily driven by higher prices in both domestic and export markets and was also supported by increased volumes. The beef segment was the primary driver of the year-over-year improvement in profitability in both periods. Strong commercial dynamics, combined with continued operational efficiency gains, more than offset the approximately 30% year-over-year increase in cattle costs in Q4 and the roughly 20% year-over-year increase in 2025, according to Meat & Livestock Australia (MLA). In the other segments, EBITDA improved, particularly in pork and fish, driven by operational execution and higher productivity.
Free Cash Flow & Leverage
Cash generation in the quarter totaled $990 million, driven by improved working capital, mainly reflecting deferred livestock payments. For the full year, free cash flow totaled $400 million. Our leverage ended the quarter at 2.39x, in line with our long-term financial target. As always, we maintained discipline and responsibility, ensuring sound capital allocation and a solid balance sheet.
2
SEGMENT RESULTS
| JBS Beef North America | Fourth Quarter | Twelve Months Ended | ||||||||||||||||||||||
| IFRS - US$ Million | 2025 | 2024 | Var % | 2025 | 2024 | Var % | ||||||||||||||||||
| Net Sales | $ | 7,662 | $ | 6,400 | 19.7 | % | $ | 28,137 | $ | 24,286 | 15.9 | % | ||||||||||||
| Cost of Sales | $ | (7,391 | ) | $ | (6,081 | ) | 21.5 | % | $ | (27,619 | ) | $ | (23,206 | ) | 19.0 | % | ||||||||
| Gross Profit | $ | 271 | $ | 319 | -14.9 | % | $ | 518 | $ | 1,080 | -52.0 | % | ||||||||||||
| Adjusted EBITDA | $ | 56 | $ | 111 | -49.8 | % | $ | (319 | ) | $ | 247 | - | ||||||||||||
| Margin (%) | 0.7 | % | 1.7 | % | -1.0 p.p. | -1.1 | % | 1.0 | % | -2.1 p.p. | ||||||||||||||
| Adjusted Operating Income | $ | (15 | ) | $ | 42 | - | $ | (568 | ) | $ | 16 | - | ||||||||||||
| Margin (%) | -0.2 | % | 0.6 | % | -0.8 p.p. | -2.0 | % | 0.1 | % | -2.1 p.p. | ||||||||||||||
| Fourth Quarter | Twelve Months Ended | |||||||||||||||||||||||
| USGAAP¹ - US$ Million | 2025 | 2024 | Var % | 2025 | 2024 | Var % | ||||||||||||||||||
| Net Sales | $ | 7,662 | $ | 6,400 | 19.7 | % | $ | 28,137 | $ | 24,286 | 15.9 | % | ||||||||||||
| Cost of Sales | $ | (7,621 | ) | $ | (6,292 | ) | 21.1 | % | $ | (28,421 | ) | $ | (24,011 | ) | 18.4 | % | ||||||||
| Gross Profit | $ | 42 | $ | 108 | -61.5 | % | $ | (284 | ) | $ | 275 | - | ||||||||||||
| Adjusted EBITDA | $ | 6 | $ | 82 | -92.4 | % | $ | (417 | ) | $ | 147 | - | ||||||||||||
| Margin (%) | 0.1 | % | 1.3 | % | -1.2 p.p. | -1.5 | % | 0.6 | % | -2.1 p.p. | ||||||||||||||
| Adjusted Operating Income | $ | (52 | ) | $ | 28 | - | $ | (617 | ) | $ | (37 | ) | - | |||||||||||
| Margin (%) | -0.7 | % | 0.4 | % | -1.1 p.p. | -2.2 | % | -0.2 | % | -2.0 p.p. | ||||||||||||||
| Pilgrim's Pride | Fourth Quarter | Twelve Months Ended | ||||||||||||||||||||||
| IFRS - US$ Million | 2025 | 2024 | Var % | 2025 | 2024 | Var % | ||||||||||||||||||
| Net Sales | $ | 4,515 | $ | 4,368 | 3.4 | % | $ | 18,485 | $ | 17,863 | 3.5 | % | ||||||||||||
| Cost of Sales | $ | (3,852 | ) | $ | (3,585 | ) | 7.4 | % | $ | (15,191 | ) | $ | (14,637 | ) | 3.8 | % | ||||||||
| Gross Profit | $ | 663 | $ | 783 | -15.3 | % | $ | 3,294 | $ | 3,226 | 2.1 | % | ||||||||||||
| Adjusted EBITDA | $ | 557 | $ | 644 | -13.6 | % | $ | 2,804 | $ | 2,703 | 3.7 | % | ||||||||||||
| Margin (%) | 12.3 | % | 14.7 | % | -2.4 p.p. | 15.2 | % | 15.1 | % | 0.1 p.p. | ||||||||||||||
| Adjusted Operating Income | $ | 295 | $ | 414 | -28.6 | % | $ | 1,821 | $ | 1,788 | 1.8 | % | ||||||||||||
| Margin (%) | 6.5 | % | 9.5 | % | -3.0 p.p. | 9.9 | % | 10.0 | % | -0.1 p.p. | ||||||||||||||
| Fourth Quarter | Twelve Months Ended | |||||||||||||||||||||||
| USGAAP¹ - US$ Million | 2025 | 2024 | Var % | 2025 | 2024 | Var % | ||||||||||||||||||
| Net Sales | $ | 4,518 | $ | 4,372 | 3.3 | % | $ | 18,498 | $ | 17,878 | 3.5 | % | ||||||||||||
| Cost of Sales | $ | (4,089 | ) | $ | (3,819 | ) | 7.1 | % | $ | (16,139 | ) | $ | (15,566 | ) | 3.7 | % | ||||||||
| Gross Profit | $ | 429 | $ | 553 | -22.5 | % | $ | 2,358 | $ | 2,313 | 2.0 | % | ||||||||||||
| Adjusted EBITDA | $ | 415 | $ | 526 | -21.0 | % | $ | 2,268 | $ | 2,214 | 2.5 | % | ||||||||||||
| Margin (%) | 9.2 | % | 12.0 | % | -2.8 p.p. | 12.3 | % | 12.4 | % | -0.1 p.p. | ||||||||||||||
| Adjusted Operating Income | $ | 293 | $ | 414 | -29.1 | % | $ | 1,812 | $ | 1,780 | 1.8 | % | ||||||||||||
| Margin (%) | 6.5 | % | 9.5 | % | -3.0 p.p. | 9.8 | % | 10.0 | % | -0.2 p.p. | ||||||||||||||
| JBS Brazil | Fourth Quarter | Twelve Months Ended | ||||||||||||||||||||||
| IFRS - US$ Million | 2025 | 2024 | Var % | 2025 | 2024 | Var % | ||||||||||||||||||
| Net Sales | $ | 4,383 | $ | 3,480 | 26.0 | % | $ | 15,294 | $ | 12,591 | 21.5 | % | ||||||||||||
| Cost of Sales | $ | (3,758 | ) | $ | (2,930 | ) | 28.3 | % | $ | (12,989 | ) | $ | (10,353 | ) | 25.5 | % | ||||||||
| Gross Profit | $ | 625 | $ | 550 | 13.7 | % | $ | 2,305 | $ | 2,238 | 3.0 | % | ||||||||||||
| Adjusted EBITDA | $ | 288 | $ | 231 | 24.7 | % | $ | 955 | $ | 965 | -1.0 | % | ||||||||||||
| Margin (%) | 6.6 | % | 6.6 | % | 0.0 p.p. | 6.2 | % | 7.7 | % | -1.5 p.p. | ||||||||||||||
| Adjusted Operating Income | $ | 232 | $ | 183 | 26.9 | % | $ | 739 | $ | 752 | -1.8 | % | ||||||||||||
| Margin (%) | 5.3 | % | 5.3 | % | 0.0 p.p. | 4.8 | % | 6.0 | % | -1.2 p.p. | ||||||||||||||
| Fourth Quarter | Twelve Months Ended | |||||||||||||||||||||||
| USGAAP¹ - US$ Million | 2025 | 2024 | Var % | 2025 | 2024 | Var % | ||||||||||||||||||
| Net Sales | $ | 4,383 | $ | 3,480 | 26.0 | % | $ | 15,294 | $ | 12,591 | 21.5 | % | ||||||||||||
| Cost of Sales | $ | (3,962 | ) | $ | (2,754 | ) | 43.8 | % | $ | (13,706 | ) | $ | (9,616 | ) | 42.5 | % | ||||||||
| Gross Profit | $ | 422 | $ | 726 | -41.9 | % | $ | 1,588 | $ | 2,974 | -46.6 | % | ||||||||||||
| Adjusted EBITDA | $ | 297 | $ | 224 | 32.4 | % | $ | 957 | $ | 944 | 1.3 | % | ||||||||||||
| Margin (%) | 6.8 | % | 6.4 | % | 0.4 p.p. | 6.3 | % | 7.5 | % | -1.2 p.p. | ||||||||||||||
| Adjusted Operating Income | $ | 241 | $ | 179 | 35.0 | % | $ | 749 | $ | 744 | 0.7 | % | ||||||||||||
| Margin (%) | 5.5 | % | 5.1 | % | 0.4 p.p. | 4.9 | % | 5.9 | % | -1.0 p.p. | ||||||||||||||
| (1) | USGAAP (non-audited) |
3
| Seara | Fourth Quarter | Twelve Months Ended | ||||||||||||||||||||||
| IFRS - US$ Million | 2025 | 2024 | Var % | 2025 | 2024 | Var % | ||||||||||||||||||
| Net Sales | $ | 2,493 | $ | 2,275 | 9.6 | % | $ | 9,171 | $ | 8,775 | 4.5 | % | ||||||||||||
| Cost of Sales | $ | (1,866 | ) | $ | (1,605 | ) | 16.3 | % | $ | (6,815 | ) | $ | (6,421 | ) | 6.1 | % | ||||||||
| Gross Profit | $ | 627 | $ | 670 | -6.4 | % | $ | 2,356 | $ | 2,354 | 0.1 | % | ||||||||||||
| Adjusted EBITDA | $ | 413 | $ | 450 | -8.1 | % | $ | 1,553 | $ | 1,539 | 1.0 | % | ||||||||||||
| Margin (%) | 16.6 | % | 19.8 | % | -3.2 p.p. | 16.9 | % | 17.5 | % | -0.6 p.p. | ||||||||||||||
| Adjusted Operating Income | $ | 301 | $ | 363 | -17.1 | % | $ | 1,148 | $ | 1,168 | -1.7 | % | ||||||||||||
| Margin (%) | 12.1 | % | 15.9 | % | -3.8 p.p. | 12.5 | % | 13.3 | % | -0.8 p.p. | ||||||||||||||
| Fourth Quarter | Twelve Months Ended | |||||||||||||||||||||||
| USGAAP¹ - US$ Million | 2025 | 2024 | Var % | 2025 | 2024 | Var % | ||||||||||||||||||
| Net Sales | $ | 2,493 | $ | 2,275 | 9.6 | % | $ | 9,171 | $ | 8,775 | 4.5 | % | ||||||||||||
| Cost of Sales | $ | (1,967 | ) | $ | (1,396 | ) | 40.9 | % | $ | (7,215 | ) | $ | (5,572 | ) | 29.5 | % | ||||||||
| Gross Profit | $ | 527 | $ | 879 | -40.1 | % | $ | 1,956 | $ | 3,202 | -38.9 | % | ||||||||||||
| Adjusted EBITDA | $ | 341 | $ | 400 | -14.7 | % | $ | 1,309 | $ | 1,322 | -1.0 | % | ||||||||||||
| Margin (%) | 13.7 | % | 17.6 | % | -3.9 p.p. | 14.3 | % | 15.1 | % | -0.8 p.p. | ||||||||||||||
| Adjusted Operating Income | $ | 292 | $ | 359 | -18.8 | % | $ | 1,127 | $ | 1,155 | -2.4 | % | ||||||||||||
| Margin (%) | 11.7 | % | 15.8 | % | -4.1 p.p. | 12.3 | % | 13.2 | % | -0.9 p.p. | ||||||||||||||
| JBS USA Pork | Fourth Quarter | Twelve Months Ended | ||||||||||||||||||||||
| IFRS - US$ Million | 2025 | 2024 | Var % | 2025 | 2024 | Var % | ||||||||||||||||||
| Net Sales | $ | 2,151 | $ | 2,001 | 7.5 | % | $ | 8,431 | $ | 8,116 | 3.9 | % | ||||||||||||
| Cost of Sales | $ | (1,852 | ) | $ | (1,618 | ) | 14.5 | % | $ | (7,076 | ) | $ | (6,607 | ) | 7.1 | % | ||||||||
| Gross Profit | $ | 298 | $ | 383 | -22.2 | % | $ | 1,355 | $ | 1,508 | -10.2 | % | ||||||||||||
| Adjusted EBITDA | $ | 180 | $ | 271 | -33.6 | % | $ | 899 | $ | 1,071 | -16.1 | % | ||||||||||||
| Margin (%) | 8.4 | % | 13.5 | % | -5.1 p.p. | 10.7 | % | 13.2 | % | -2.5 p.p. | ||||||||||||||
| Adjusted Operating Income | $ | 104 | $ | 194 | -46.2 | % | $ | 617 | $ | 780 | -21.0 | % | ||||||||||||
| Margin (%) | 4.9 | % | 9.7 | % | -4.8 p.p. | 7.3 | % | 9.6 | % | -2.3 p.p. | ||||||||||||||
| Fourth Quarter | Twelve Months Ended | |||||||||||||||||||||||
| USGAAP¹ - US$ Million | 2025 | 2024 | Var % | 2025 | 2024 | Var % | ||||||||||||||||||
| Net Sales | $ | 2,151 | $ | 2,001 | 7.5 | % | $ | 8,431 | $ | 8,116 | 3.9 | % | ||||||||||||
| Cost of Sales | $ | (1,910 | ) | $ | (1,807 | ) | 5.7 | % | $ | (7,583 | ) | $ | (7,258 | ) | 4.5 | % | ||||||||
| Gross Profit | $ | 241 | $ | 194 | 23.8 | % | $ | 848 | $ | 858 | -1.2 | % | ||||||||||||
| Adjusted EBITDA | $ | 231 | $ | 192 | 20.2 | % | $ | 815 | $ | 831 | -1.9 | % | ||||||||||||
| Margin (%) | 10.7 | % | 9.6 | % | 1.1 p.p. | 9.7 | % | 10.2 | % | -0.5 p.p. | ||||||||||||||
| Adjusted Operating Income | $ | 175 | $ | 139 | 26.0 | % | $ | 618 | $ | 639 | -3.3 | % | ||||||||||||
| Margin (%) | 8.1 | % | 7.0 | % | 1.1 p.p. | 7.3 | % | 7.9 | % | -0.6 p.p. | ||||||||||||||
| JBS Australia | Fourth Quarter | Twelve Months Ended | ||||||||||||||||||||||
| IFRS - US$ Million | 2025 | 2024 | Var % | 2025 | 2024 | Var % | ||||||||||||||||||
| Net Sales | $ | 2,290 | $ | 1,765 | 29.7 | % | $ | 8,077 | $ | 6,648 | 21.5 | % | ||||||||||||
| Cost of Sales | $ | (1,936 | ) | $ | (1,522 | ) | 27.2 | % | $ | (6,714 | ) | $ | (5,597 | ) | 20.0 | % | ||||||||
| Gross Profit | $ | 354 | $ | 244 | 45.5 | % | $ | 1,363 | $ | 1,051 | 29.7 | % | ||||||||||||
| Adjusted EBITDA | $ | 217 | $ | 140 | 54.5 | % | $ | 916 | $ | 664 | 37.9 | % | ||||||||||||
| Margin (%) | 9.5 | % | 7.9 | % | 1.6 p.p. | 11.3 | % | 10.0 | % | 1.3 p.p. | ||||||||||||||
| Adjusted Operating Income | $ | 184 | $ | 107 | 72.1 | % | $ | 791 | $ | 534 | 48.2 | % | ||||||||||||
| Margin (%) | 8.0 | % | 6.0 | % | 2.0 p.p. | 9.8 | % | 8.0 | % | 1.8 p.p. | ||||||||||||||
| Fourth Quarter | Twelve Months Ended | |||||||||||||||||||||||
| USGAAP¹ - US$ Million | 2025 | 2024 | Var % | 2025 | 2024 | Var % | ||||||||||||||||||
| Net Sales | $ | 2,290 | $ | 1,765 | 29.7 | % | $ | 8,077 | $ | 6,648 | 21.5 | % | ||||||||||||
| Cost of Sales | $ | (2,047 | ) | $ | (1,638 | ) | 25.0 | % | $ | (7,108 | ) | $ | (5,972 | ) | 19.0 | % | ||||||||
| Gross Profit | $ | 243 | $ | 127 | 90.9 | % | $ | 969 | $ | 676 | 43.3 | % | ||||||||||||
| Adjusted EBITDA | $ | 198 | $ | 104 | 90.4 | % | $ | 845 | $ | 582 | 45.1 | % | ||||||||||||
| Margin (%) | 8.7 | % | 5.9 | % | 2.8 p.p. | 10.5 | % | 8.8 | % | 1.7 p.p. | ||||||||||||||
| Adjusted Operating Income | $ | 177 | $ | 82 | 116.5 | % | $ | 763 | $ | 495 | 54.0 | % | ||||||||||||
| Margin (%) | 7.7 | % | 4.6 | % | 3.1 p.p. | 9.4 | % | 7.4 | % | 2.0 p.p. | ||||||||||||||
| (1) | USGAAP (non-audited) |
4
CONSOLIDATED STATEMENTS OF INCOME
(In millions, except per share data)
| Fourth Quarter | Twelve Months Ended | |||||||||||||||
| 2025 | 2024 | 2025 | 2024 | |||||||||||||
| Net Sales | $ | 23,063.0 | $ | 19,973.7 | $ | 86,184.2 | $ | 77,182.5 | ||||||||
| Cost of Sales | (20,193.3 | ) | (16,997.0 | ) | (74,884.9 | ) | (65,594.3 | ) | ||||||||
| Gross Profit | 2,869.8 | 2,976.7 | 11,299.3 | 11,588.2 | ||||||||||||
| Selling expenses | (1,338.1 | ) | (1,388.5 | ) | (4,988.7 | ) | (4,827.3 | ) | ||||||||
| General and administrative expenses | (594.8 | ) | (565.8 | ) | (2,187.3 | ) | (2,278.4 | ) | ||||||||
| Other income(expenses) | 15.8 | (56.0 | ) | 36.4 | (104.7 | ) | ||||||||||
| Net Operating Expenses | (1,917.1 | ) | (2,010.3 | ) | (7,139.6 | ) | (7,210.4 | ) | ||||||||
| Operating Income | 952.6 | 966.4 | 4,159.7 | 4,377.8 | ||||||||||||
| Finance Income | 57.2 | 201.8 | 565.2 | 719.4 | ||||||||||||
| Finance Expense | (637.4 | ) | (562.1 | ) | (2,121.5 | ) | (2,389.1 | ) | ||||||||
| Net Finance Expense | (580.2 | ) | (360.3 | ) | (1,556.3 | ) | (1,669.8 | ) | ||||||||
| Share of profit of equity-accounted investees, net of tax | 1.9 | 3.2 | 16.9 | 2.9 | ||||||||||||
| Profit (Loss) Before Taxes | 374.4 | 609.3 | 2,620.3 | 2,711.0 | ||||||||||||
| Current Income Taxes | 126.2 | (471.3 | ) | (450.2 | ) | (870.5 | ) | |||||||||
| Deferred Income Taxes | (65.5 | ) | 320.4 | 59.7 | 127.1 | |||||||||||
| Total Income Taxes | 60.7 | (150.9 | ) | (390.5 | ) | (743.4 | ) | |||||||||
| Effective Rate | 16.2 | % | (24.8 | %) | (14.9 | %) | (27.4 | %) | ||||||||
| Net Income (Loss) | 435.0 | 458.4 | 2,229.8 | 1,967.6 | ||||||||||||
| Attributable to: | ||||||||||||||||
| Company shareholders | 415.1 | 412.9 | 2,024.3 | 1,766.9 | ||||||||||||
| Non-controlling interest | 19.9 | 45.5 | 205.5 | 200.7 | ||||||||||||
| Earnings per Share (US$) | $ | 0.39 | $ | 0.39 | $ | 1.89 | $ | 1.65 | ||||||||
| Fourth Quarter | Twelve Months Ended | |||||||||||||||||||||||
| IFRS - US$ Million | 2025 | 2024 | Var % | 2025 | 2024 | Var % | ||||||||||||||||||
| Adjusted EBITDA | $ | 1,715.5 | $ | 1,846.6 | -7.1 | % | $ | 6,831.4 | $ | 7,191.9 | -5.0 | % | ||||||||||||
| Margin (%) | 7.4 | % | 9.2 | % | -1.8 p.p. | 7.9 | % | 9.3 | % | -1.4 p.p. | ||||||||||||||
| Adjusted Operating Income | $ | 1,091.8 | $ | 1,290.6 | -15.4 | % | $ | 4,522.9 | $ | 5,002.3 | -9.6 | % | ||||||||||||
| Margin (%) | 4.7 | % | 6.5 | % | -1.8 p.p. | 5.2 | % | 6.5 | % | -1.3 p.p. | ||||||||||||||
| Fourth Quarter | Twelve Months Ended | |||||||||||||||||||||||
| USGAAP¹ - US$ Million | 2025 | 2024 | Var % | 2025 | 2024 | Var % | ||||||||||||||||||
| Adjusted EBITDA | $ | 1,492.6 | $ | 1,527.6 | -2.3 | % | $ | 5,797.1 | $ | 6,039.7 | -4.0 | % | ||||||||||||
| Margin (%) | 6.5 | % | 7.6 | % | -1.1 p.p. | 6.7 | % | 7.8 | % | -1.1 p.p. | ||||||||||||||
| Adjusted Operating Income | $ | 1,116.3 | $ | 1,186.9 | -6.0 | % | $ | 4,425.4 | $ | 4,734.3 | -6.5 | % | ||||||||||||
| Margin (%) | 4.8 | % | 5.9 | % | -1.1 p.p. | 5.1 | % | 6.1 | % | -1.0 p.p. | ||||||||||||||
| (1) | USGAAP (non-audited) |
5
CONSOLIDATED BALANCE SHEETS
(In millions)
| December 31, 2025 | December 31, 2024 | |||||||
| Assets | ||||||||
| Current Assets: | ||||||||
| Cash and cash equivalents | $ | 4,565.1 | $ | 5,613.7 | ||||
| Margin Cash | 159.6 | 136.6 | ||||||
| Trade accounts receivable | 4,231.9 | 3,735.5 | ||||||
| Inventories | 6,107.2 | 5,016.0 | ||||||
| Biological assets | 1,826.8 | 1,608.2 | ||||||
| Recoverable taxes | 957.2 | 637.7 | ||||||
| Derivative assets | 155.6 | 84.5 | ||||||
| Dividends receivable | 1.5 | - | ||||||
| Other current assets | 433.4 | 288.8 | ||||||
| Total Current Assets | 18,438.2 | 17,121.0 | ||||||
| Non Current Assets: | ||||||||
| Long-term Investments | 45.8 | - | ||||||
| Recoverable taxes | 1,874.6 | 1,412.5 | ||||||
| Biological assets | 611.8 | 518.2 | ||||||
| Related party receivables | 41.2 | 77.4 | ||||||
| Deferred income taxes | 547.0 | 651.2 | ||||||
| Other non-current assets | 488.8 | 268.7 | ||||||
| 3,609.2 | 2,928.0 | |||||||
| Investments in equity-accounted investees | 171.6 | 38.3 | ||||||
| Property, plant and equipment | 13,645.7 | 11,780.9 | ||||||
| Right of use assets | 1,613.6 | 1,596.9 | ||||||
| Intangible assets | 1,825.6 | 1,803.2 | ||||||
| Goodwill | 5,852.6 | 5,417.1 | ||||||
| Total Non Current Assets | 26,718.3 | 23,564.4 | ||||||
| Total Assets | $ | 45,156.5 | $ | 40,685.4 | ||||
6
| December 31, 2025 | December 31, 2024 | |||||||
| Liabilities and Equity | ||||||||
| Current Liabilities: | ||||||||
| Trade accounts payable | $ | 6,198.1 | $ | 5,465.5 | ||||
| Supply chain finance | 1,134.5 | 728.7 | ||||||
| Loans and financing | 833.1 | 2,084.2 | ||||||
| Income taxes | 288.0 | 233.0 | ||||||
| Other taxes payable | 153.0 | 113.7 | ||||||
| Payroll and social charges | 1,560.2 | 1,435.8 | ||||||
| Lease liabilities | 354.9 | 335.7 | ||||||
| Dividends payable | - | 358.6 | ||||||
| Provisions for legal proceedings | 159.2 | 280.8 | ||||||
| Derivative liabilities | 156.4 | 166.0 | ||||||
| Other current liabilities | 704.5 | 455.0 | ||||||
| Total Current Liabilities | 11,541.8 | 11,657.1 | ||||||
| Non Current Liabilities: | ||||||||
| Loans and financings | 20,257.5 | 17,242.6 | ||||||
| Income and other taxes payable | 407.7 | 406.7 | ||||||
| Payroll and social charges | 288.1 | 352.7 | ||||||
| Lease liabilities | 1,412.4 | 1,398.3 | ||||||
| Deferred income taxes | 1,169.3 | 1,095.3 | ||||||
| Provisions for legal proceedings | 209.4 | 216.7 | ||||||
| Related party payable | 191.0 | - | ||||||
| Derivative liabilities | 114.4 | 100.1 | ||||||
| Other non-current liabilities | 42.2 | 81.6 | ||||||
| Total Non Current Liabilities | 24,091.9 | 20,893.9 | ||||||
| Equity: | ||||||||
| Share capital - common shares | 35.1 | 13,177.8 | ||||||
| Reserves¹ | 6,582.7 | (6,083.4 | ) | |||||
| Undistributed results | 2,085.8 | - | ||||||
| Attributable to company shareholders | 8,703.6 | 7,094.5 | ||||||
| Attributable to non-controlling interest | 819.2 | 1,039.9 | ||||||
| Total Equity | 9,522.8 | 8,134.4 | ||||||
| Total Liabilities and Equity | $ | 45,156.5 | $ | 40,685.4 | ||||
| (1) | The reserves for 2024 have been retrospectively adjusted to ensure comparability in accordance with Dutch law, considering the corporate reorganization that occurred in 2025. |
7
CONSOLIDATED STATEMENTS OF CASH FLOWS
(In millions)
| Fourth Quarter | Twelve Months Ended | |||||||||||||||
| 2025 | 2024 | 2025 | 2024 | |||||||||||||
| Net income | $ | 435.0 | $ | 458.4 | 2,229.8 | 1,967.6 | ||||||||||
| Adjustments for: | ||||||||||||||||
| Depreciation and amortization | 623.7 | 555.9 | 2,308.5 | 2,189.5 | ||||||||||||
| Expected credit losses | 8.9 | 3.7 | 31.7 | 12.9 | ||||||||||||
| Share of profit of equity-accounted investees | (1.9 | ) | (3.2 | ) | (16.9 | ) | (2.9 | ) | ||||||||
| (Gain) loss on assets sales | (4.3 | ) | (4.3 | ) | (19.6 | ) | (8.9 | ) | ||||||||
| Taxes expense | (60.7 | ) | 150.9 | 390.5 | 743.4 | |||||||||||
| Net finance expense | 580.2 | 360.3 | 1,556.3 | 1,669.8 | ||||||||||||
| Share-based compensation | 9.0 | 5.7 | 28.9 | 15.8 | ||||||||||||
| Provisions for legal procedings | 128.9 | 16.1 | 189.4 | 47.2 | ||||||||||||
| Impairment of goodwill and property, plant and equipment | - | 1.6 | 12.8 | 28.3 | ||||||||||||
| Net realizable value inventory adjustments | (2.0 | ) | 5.1 | 18.2 | 14.0 | |||||||||||
| Fair value adjustment of biological assets | 47.9 | (102.6 | ) | (19.1 | ) | (158.6 | ) | |||||||||
| DOJ (Department of Justice) and antitrust agreements | 38.6 | 172.8 | 182.3 | 253.7 | ||||||||||||
| Extemporaneous litigation | 20.7 | 61.0 | 20.7 | 61.0 | ||||||||||||
| Extemporaneous reversal of tax credits | - | 58.7 | - | 58.7 | ||||||||||||
| Provision for avian influenza related costs | 4.0 | - | 17.1 | - | ||||||||||||
| 1,828.0 | 1,740.1 | 6,930.4 | 6,891.4 | |||||||||||||
| Changes in assets and liabilities: | ||||||||||||||||
| Trade accounts receivable | (328.6 | ) | (387.0 | ) | (347.3 | ) | (333.6 | ) | ||||||||
| Inventories | 409.6 | 196.9 | (793.7 | ) | (377.4 | ) | ||||||||||
| Recoverable taxes | 10.8 | 32.3 | 54.0 | 45.4 | ||||||||||||
| Other current and non-current assets | 433.3 | 85.6 | (123.6 | ) | (7.6 | ) | ||||||||||
| Biological assets | (247.9 | ) | (165.4 | ) | (820.6 | ) | (520.5 | ) | ||||||||
| Trade accounts payable and supply chain finance | 702.8 | 647.8 | 612.6 | 344.5 | ||||||||||||
| Taxes paid in installments | (1.2 | ) | (12.9 | ) | (55.7 | ) | (61.0 | ) | ||||||||
| Other current and non-current liabilities | (350.2 | ) | (53.9 | ) | (198.6 | ) | 62.4 | |||||||||
| DOJ and Antitrust agreements payment | (63.8 | ) | (113.9 | ) | (402.8 | ) | (170.6 | ) | ||||||||
| Income taxes paid | (156.8 | ) | (159.9 | ) | (809.0 | ) | (348.7 | ) | ||||||||
| Changes in operating assets and liabilities | 408.1 | 69.5 | (2,884.7 | ) | (1,367.2 | ) | ||||||||||
| Cash provided by operating activities | 2,236.1 | 1,809.6 | 4,045.8 | 5,524.2 | ||||||||||||
| Interest paid | (354.0 | ) | (310.2 | ) | (1,302.2 | ) | (1,486.8 | ) | ||||||||
| Interest received | 53.5 | 40.4 | 188.4 | 192.2 | ||||||||||||
| Cash net of interest provided by (used in) operating activities | 1,935.6 | 1,539.8 | 2,932.0 | 4,229.5 | ||||||||||||
| Cash flow from investing activities: | ||||||||||||||||
| Purchases of property, plant and equipment | (838.3 | ) | (529.7 | ) | (2,099.3 | ) | (1,480.3 | ) | ||||||||
| Purchases and disposals of intangible assets | (2.4 | ) | (4.5 | ) | (7.1 | ) | (10.6 | ) | ||||||||
| Proceeds from sale of property, plant and equipment | 16.3 | 21.2 | 73.2 | 47.2 | ||||||||||||
| Additional/Acquistion investments in equity-accounted investees | 0.8 | - | (185.7 | ) | - | |||||||||||
| Acquisitions, net of cash acquired | - | (1.6 | ) | - | (5.8 | ) | ||||||||||
| Dividends received | 1.1 | 2.0 | 7.3 | 10.7 | ||||||||||||
| Related party transactions | (31.0 | ) | 20.5 | (53.9 | ) | 21.2 | ||||||||||
| Others | - | - | (45.8 | ) | - | |||||||||||
| Cash provided by (used in) investing activities | (853.5 | ) | (492.1 | ) | (2,311.4 | ) | (1,417.7 | ) | ||||||||
| Cash flow from financing activities: | ||||||||||||||||
| Proceeds from loans and financings | 632.0 | 941.5 | 10,087.3 | 2,976.3 | ||||||||||||
| Payments of loans and financings | (287.6 | ) | (352.6 | ) | (8,752.8 | ) | (2,990.3 | ) | ||||||||
| Derivative instruments received (settled) | 4.9 | (59.4 | ) | (86.8 | ) | (232.0 | ) | |||||||||
| Dividends paid / Share premium distribution | - | (759.3 | ) | (1,573.9 | ) | (759.3 | ) | |||||||||
| Dividends paid to non-controlling interest | (0.5 | ) | (1.2 | ) | (356.2 | ) | (4.3 | ) | ||||||||
| Margin Cash | (25.0 | ) | 21.3 | (16.6 | ) | 20.1 | ||||||||||
| Payments of leasing contracts | (107.5 | ) | (103.7 | ) | (432.5 | ) | (417.8 | ) | ||||||||
| Purchase of treasury shares | (237.5 | ) | - | (600.0 | ) | - | ||||||||||
| Acquisition of non-controlling interests in the subsidiary PPC | - | - | (1.3 | ) | - | |||||||||||
| Purchase of Diamond Pork treasury shares | - | (7.6 | ) | - | (7.6 | ) | ||||||||||
| Others | (16.7 | ) | - | (39.3 | ) | - | ||||||||||
| Cash provided by (used in) financing activities | (38.0 | ) | (321.0 | ) | (1,771.9 | ) | (1,414.8 | ) | ||||||||
| Effect of exchange rate changes on cash and cash equivalents | (37.2 | ) | (183.1 | ) | 102.8 | (352.9 | ) | |||||||||
| Net change in cash and cash equivalents | 1,006.9 | 543.6 | (1,048.5 | ) | 1,044.2 | |||||||||||
| Cash and cash equivalents at the beggining of period | 3,558.2 | 5,070.1 | 5,613.7 | 4,569.5 | ||||||||||||
| Cash and cash equivalents at the end of period | $ | 4,565.1 | $ | 5,613.7 | $ | 4,565.1 | $ | 5,613.7 | ||||||||
8
Adjusted EBITDA IFRS to USGAAP (non-audited) Reconciliations
(In
millions)
(Unaudited)
| Adjusted EBITDA 4Q25 | ||||||||||||||||||||||||||||||||
| JBS Beef North America | PPC | JBS Brazil | Seara | JBS USA Pork | Australia | Others and Eliminations | Total | |||||||||||||||||||||||||
| Adjusted EBITDA IFRS | $ | 55.6 | $ | 556.8 | $ | 288.2 | $ | 413.2 | $ | 179.8 | $ | 216.6 | $ | 5.2 | $ | 1,715.5 | ||||||||||||||||
| Leasing adjustments | (14.3 | ) | (22.2 | ) | (7.5 | ) | (20.8 | ) | (22.9 | ) | (13.7 | ) | (0.6 | ) | (102.0 | ) | ||||||||||||||||
| Inventory adjustments at market value | (35.2 | ) | - | - | - | 16.9 | - | - | (18.3 | ) | ||||||||||||||||||||||
| Biological assets adjustments | - | (120.1 | ) | 15.9 | (51.4 | ) | 56.9 | (4.7 | ) | - | (103.4 | ) | ||||||||||||||||||||
| Other adjustments | 0.2 | 0.7 | - | - | - | - | (0.1 | ) | 0.8 | |||||||||||||||||||||||
| Adjusted EBITDA USGAAP¹ | $ | 6.3 | $ | 415.1 | $ | 296.6 | $ | 341.1 | $ | 230.7 | $ | 198.2 | $ | 4.6 | $ | 1,492.6 | ||||||||||||||||
| Adjusted EBITDA 4Q24 | ||||||||||||||||||||||||||||||||
| JBS Beef North America | PPC | JBS Brazil | Seara | JBS USA Pork | Australia | Others and Eliminations | Total | |||||||||||||||||||||||||
| Adjusted EBITDA IFRS | $ | 110.7 | $ | 644.1 | $ | 231.1 | $ | 449.6 | $ | 271.0 | $ | 140.2 | $ | (0.2 | ) | $ | 1,846.6 | |||||||||||||||
| Leasing adjustments | (22.9 | ) | (21.2 | ) | (3.6 | ) | (12.5 | ) | (27.2 | ) | (13.4 | ) | (0.5 | ) | (101.3 | ) | ||||||||||||||||
| Inventory adjustments at market value | (5.9 | ) | - | - | - | 20.5 | - | - | 14.6 | |||||||||||||||||||||||
| Biological assets adjustments | - | (98.3 | ) | (3.5 | ) | (37.2 | ) | (72.2 | ) | (22.6 | ) | - | (233.8 | ) | ||||||||||||||||||
| Other adjustments | 0.3 | 1.1 | - | - | - | - | (0.0 | ) | 1.4 | |||||||||||||||||||||||
| Adjusted EBITDA USGAAP¹ | $ | 82.3 | 525.7 | $ | 224.1 | $ | 400.0 | $ | 192.0 | $ | 104.2 | $ | (0.7 | ) | $ | 1,527.6 | ||||||||||||||||
| Adjusted EBITDA 2025 | ||||||||||||||||||||||||||||||||
| JBS Beef North America | PPC | JBS Brazil | Seara | JBS USA Pork | Australia | Others and Eliminations | Total | |||||||||||||||||||||||||
| Adjusted EBITDA IFRS | $ | (319.5 | ) | $ | 2,804.5 | $ | 955.1 | $ | 1,553.4 | $ | 898.9 | $ | 916.0 | $ | 23.0 | $ | 6,831.4 | |||||||||||||||
| Leasing adjustments | (57.4 | ) | (82.4 | ) | (18.0 | ) | (64.7 | ) | (98.7 | ) | (51.8 | ) | (2.5 | ) | (375.5 | ) | ||||||||||||||||
| Inventory adjustments at market value | (40.6 | ) | - | - | - | (5.1 | ) | - | - | (45.7 | ) | |||||||||||||||||||||
| Biological assets adjustments | - | (455.3 | ) | 19.7 | (180.1 | ) | 19.3 | (19.5 | ) | - | (615.9 | ) | ||||||||||||||||||||
| Other adjustments | 0.3 | 1.6 | - | - | - | - | 0.9 | 2.8 | ||||||||||||||||||||||||
| Adjusted EBITDA USGAAP¹ | $ | (417.2 | ) | 2,268.4 | $ | 956.8 | $ | 1,308.5 | $ | 814.5 | $ | 844.7 | $ | 21.5 | $ | 5,797.1 | ||||||||||||||||
| Adjusted EBITDA 2024 | ||||||||||||||||||||||||||||||||
| JBS Beef North America | PPC | JBS Brazil | Seara | JBS USA Pork | Australia | Others and Eliminations | Total | |||||||||||||||||||||||||
| Adjusted EBITDA IFRS | $ | 247.3 | $ | 2,703.4 | $ | 965.0 | $ | 1,538.6 | $ | 1,071.2 | $ | 664.3 | $ | 2.1 | $ | 7,191.9 | ||||||||||||||||
| Leasing adjustments | (61.0 | ) | (86.8 | ) | (13.9 | ) | (55.7 | ) | (113.1 | ) | (52.7 | ) | (2.9 | ) | (385.9 | ) | ||||||||||||||||
| Inventory adjustments at market value | (40.1 | ) | - | - | - | (11.8 | ) | - | - | (51.8 | ) | |||||||||||||||||||||
| Biological assets adjustments | - | (404.3 | ) | (6.8 | ) | (161.2 | ) | (115.8 | ) | (29.2 | ) | - | (717.3 | ) | ||||||||||||||||||
| Other adjustments | 0.3 | 1.6 | - | - | - | - | 0.9 | 2.8 | ||||||||||||||||||||||||
| Adjusted EBITDA USGAAP¹ | $ | 146.6 | $ | 2,213.9 | $ | 944.3 | $ | 1,321.7 | $ | 830.6 | $ | 582.3 | $ | 0.2 | $ | 6,039.7 | ||||||||||||||||
| (1) | USGAAP (non-audited) |
9
Adjusted Operating Income IFRS to
USGAAP (non-audited) Reconciliations
(In millions)
(Unaudited)
| Adjusted Operating Income (Loss) 4Q25 | ||||||||||||||||||||||||||||||||
| JBS Beef North America | PPC | JBS Brazil | Seara | JBS USA Pork | Australia | Others and Eliminations | Total | |||||||||||||||||||||||||
| Adjusted Operating Income IFRS | $ | (14.7 | ) | $ | 295.5 | $ | 232.1 | $ | 300.6 | $ | 104.4 | $ | 183.8 | $ | (10.0 | ) | $ | 1,091.8 | ||||||||||||||
| Leasing adjustments | (2.2 | ) | (3.2 | ) | (6.6 | ) | (8.9 | ) | (3.0 | ) | (2.4 | ) | (0.0 | ) | (26.4 | ) | ||||||||||||||||
| Inventory adjustments at market value | (35.2 | ) | - | - | - | 16.9 | - | - | (18.3 | ) | ||||||||||||||||||||||
| Biological assets adjustments | - | - | 15.9 | - | 56.9 | (4.7 | ) | - | 68.1 | |||||||||||||||||||||||
| Other adjustments | 0.5 | 1.2 | - | - | - | - | (0.6 | ) | 1.1 | |||||||||||||||||||||||
| Adjusted Operating Income USGAAP¹ | $ | (51.6 | ) | $ | 293.4 | $ | 241.4 | $ | 291.7 | $ | 175.2 | $ | 176.7 | $ | (10.6 | ) | $ | 1,116.3 | ||||||||||||||
| Adjusted Operating Income (Loss) 4Q24 | ||||||||||||||||||||||||||||||||
| JBS Beef North America | PPC | JBS Brazil | Seara | JBS USA Pork | Australia | Others and Eliminations | Total | |||||||||||||||||||||||||
| Adjusted Operating Income IFRS | $ | 41.5 | $ | 414.1 | $ | 182.9 | $ | 362.6 | $ | 194.2 | $ | 106.8 | $ | (11.4 | ) | $ | 1,290.6 | |||||||||||||||
| Leasing adjustments | (8.7 | ) | (3.1 | ) | (0.6 | ) | (3.4 | ) | (3.4 | ) | (2.5 | ) | (0.0 | ) | (21.7 | ) | ||||||||||||||||
| Inventory adjustments at market value | (5.9 | ) | - | - | - | 20.5 | - | - | 14.6 | |||||||||||||||||||||||
| Biological assets adjustments | - | - | (3.5 | ) | - | (72.2 | ) | (22.6 | ) | - | (98.3 | ) | ||||||||||||||||||||
| Other adjustments | 0.6 | 2.8 | - | - | - | - | (1.8 | ) | 1.6 | |||||||||||||||||||||||
| Adjusted Operating Income USGAAP¹ | $ | 27.6 | $ | 413.9 | $ | 178.8 | $ | 359.2 | $ | 139.1 | $ | 81.6 | $ | (13.3 | ) | $ | 1,186.9 | |||||||||||||||
| Adjusted Operating Income (Loss) 2025 | ||||||||||||||||||||||||||||||||
| JBS Beef North America | PPC | JBS Brazil | Seara | JBS USA Pork | Australia | Others and Eliminations | Total | |||||||||||||||||||||||||
| Adjusted Operating Income IFRS | $ | (568.3 | ) | $ | 1,820.8 | $ | 738.5 | $ | 1,147.6 | $ | 616.6 | $ | 791.4 | $ | (23.7 | ) | $ | 4,522.9 | ||||||||||||||
| Leasing adjustments | (9.9 | ) | (12.1 | ) | (9.5 | ) | (21.0 | ) | (13.1 | ) | (9.4 | ) | (0.1 | ) | (75.1 | ) | ||||||||||||||||
| Inventory adjustments at market value | (40.6 | ) | - | - | - | (5.1 | ) | - | - | (45.7 | ) | |||||||||||||||||||||
| Biological assets adjustments | - | - | 19.7 | - | 19.3 | (19.5 | ) | - | 19.5 | |||||||||||||||||||||||
| Other adjustments | 1.4 | 3.5 | - | - | - | - | $ | (1.0 | ) | 3.9 | ||||||||||||||||||||||
| Adjusted Operating Income USGAAP¹ | $ | (617.4 | ) | $ | 1,812.2 | $ | 748.7 | $ | 1,126.6 | $ | 617.7 | $ | 762.5 | $ | (24.8 | ) | $ | 4,425.4 | ||||||||||||||
| Adjusted Operating Income (Loss) 2024 | ||||||||||||||||||||||||||||||||
| JBS Beef North America | PPC | JBS Brazil | Seara | JBS USA Pork | Australia | Others and Eliminations | Total | |||||||||||||||||||||||||
| Adjusted Operating Income IFRS | $ | 15.7 | $ | 1,787.9 | $ | 752.4 | $ | 1,167.6 | $ | 780.5 | $ | 533.9 | $ | (35.6 | ) | $ | 5,002.3 | |||||||||||||||
| Leasing adjustments | (13.7 | ) | (16.2 | ) | (1.8 | ) | (12.7 | ) | (14.1 | ) | (9.5 | ) | (0.2 | ) | (68.3 | ) | ||||||||||||||||
| Inventory adjustments at market value | (40.1 | ) | - | - | - | (11.8 | ) | - | - | (51.8 | ) | |||||||||||||||||||||
| Biological assets adjustments | - | - | (6.8 | ) | - | (115.8 | ) | (29.2 | ) | - | (151.8 | ) | ||||||||||||||||||||
| Other adjustments | 1.4 | 8.6 | - | - | - | - | (6.1 | ) | 3.9 | |||||||||||||||||||||||
| Adjusted Operating Income USGAAP¹ | $ | (36.6 | ) | 1,780.3 | $ | 743.8 | $ | 1,154.8 | $ | 638.8 | $ | 495.1 | $ | (42.0 | ) | $ | 4,734.3 | |||||||||||||||
| (1) | USGAAP (non-audited) |
10
EBITDA to Adjusted EBITDA and Free Cash Flow Reconciliation
(In millions)
| Fourth Quarter | Twelve Months Ended | |||||||||||||||
| 2025 | 2024 | 2025 | 2024 | |||||||||||||
| Profit before Taxes | $ | 374.4 | $ | 609.3 | $ | 2,620.3 | $ | 2,711.0 | ||||||||
| Share of profit of equity-accounted investees, net of tax | (1.9 | ) | (3.2 | ) | (16.9 | ) | (2.9 | ) | ||||||||
| Net finance results | 580.2 | 360.3 | 1,556.3 | 1,669.8 | ||||||||||||
| (+) Depreciation and amortization | 623.7 | 542.8 | 2,308.5 | 2,189.5 | ||||||||||||
| EBITDA | $ | 1,576.3 | $ | 1,509.2 | $ | 6,468.2 | $ | 6,567.4 | ||||||||
| Adjustments to EBITDA: | ||||||||||||||||
| Other operating income (expense), net | $ | 24.1 | $ | 15.0 | $ | 41.2 | $ | 32.0 | ||||||||
| Tax Assesment Notice | 33.7 | - | 43.2 | - | ||||||||||||
| Reestructuring | 9.7 | 12.6 | 33.4 | 95.6 | ||||||||||||
| Impairment of assets | 8.4 | - | 21.1 | - | ||||||||||||
| Antitrust agreements | 38.6 | 172.8 | 182.3 | 253.7 | ||||||||||||
| Donations and Social Programs | 0.1 | 4.3 | 1.8 | 22.5 | ||||||||||||
| Rio Grande do Sul claim | - | - | - | 19.3 | ||||||||||||
| Fiscal payments and installments | - | - | 2.4 | 81.8 | ||||||||||||
| Extemporaneous litigation | 20.7 | 61.0 | 20.7 | 61.0 | ||||||||||||
| Reversal of tax credits | - | 58.7 | - | 58.7 | ||||||||||||
| Avian influenza | 4.0 | - | 17.1 | - | ||||||||||||
| Total Adjusted EBITDA | $ | 1,715.5 | $ | 1,833.5 | $ | 6,831.4 | $ | 7,191.9 | ||||||||
| (-) Depreciation and amortization | 623.7 | 542.8 | 2,308.5 | 2,189.5 | ||||||||||||
| Adjusted Operating Income (IFRS) | $ | 1,091.8 | $ | 1,290.6 | $ | 4,522.9 | $ | 5,002.3 | ||||||||
| Total Gross Debt | 21,090.6 | 19,326.8 | 21,090.6 | 19,326.8 | ||||||||||||
| (-)Cash and Equivalents | 4,565.1 | 5,613.7 | 4,565.1 | 5,613.7 | ||||||||||||
| (-) Cash Margin | 159.6 | 136.6 | 159.6 | 136.6 | ||||||||||||
| (-) Financial Investments | 45.8 | - | 45.8 | - | ||||||||||||
| Total Net Debt | $ | 16,320.1 | $ | 13,576.6 | $ | 16,320.1 | $ | 13,576.6 | ||||||||
| Ratio Calculations: | ||||||||||||||||
| Gross Debt/Adjusted EBITDA | 3.09x | 2.69x | ||||||||||||||
| Net Debt/Adjusted EBITDA | 2.39x | 1.89x | ||||||||||||||
| Fourth Quarter | Twelve Months Ended | |||||||||||||||
| 2025 | 2024 | 2025 | 2024 | |||||||||||||
| Cash provided by operating activities | $ | 2,236.1 | $ | 1,809.6 | $ | 4,045.8 | $ | 5,524.2 | ||||||||
| Interest paid and received | (300.5 | ) | (269.8 | ) | (1,113.8 | ) | (1,294.7 | ) | ||||||||
| Purchases of property, plant and equipment | (838.3 | ) | (529.7 | ) | (2,099.3 | ) | (1,480.3 | ) | ||||||||
| Payments of leasing contracts | (107.5 | ) | (103.7 | ) | (432.5 | ) | (417.8 | ) | ||||||||
| Free Cash Flow | $ | 989.8 | $ | 906.4 | $ | 400.2 | $ | 2,331.5 | ||||||||
11
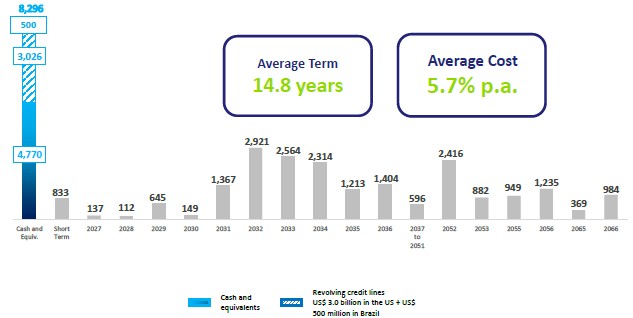
Net Debt Bridge and Debt Amortization Schedule
(In millions)
(Unaudited)
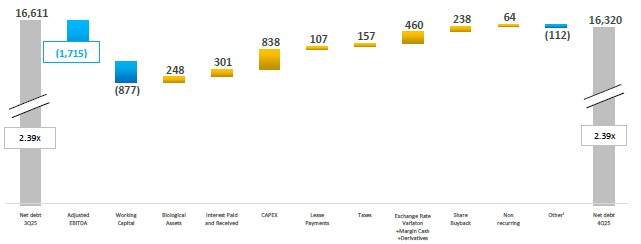
| (1) | Considering acquisitions, non-cash items and Others. |
12
ROE, ROIC and Interest Coverage Reconciliation
(In millions)
(Unaudited)
| Last twelve months ended in December 31, | ||||||||
| 2025 | 2024 | |||||||
| Net Income LTM (A) | $ | 2,229.8 | $ | 1,967.6 | ||||
| Average Shareholder Equity (B) | $ | 8,828.6 | $ | 8,921.1 | ||||
| Current Shareholder Equity | $ | 9,522.8 | $ | 8,134.4 | ||||
| Previous Year Shareholder Equity | $ | 8,134.4 | $ | 9,707.8 | ||||
| ROE (A/B) | 25.3 | % | 22.1 | % | ||||
| Last twelve months ended in December 31, | ||||||||
| 2025 | 2024 | |||||||
| NOPAT (A) | $ | 4,132.4 | $ | 4,258.9 | ||||
| Adjusted Operating Income (IFRS) | $ | 4,522.9 | $ | 5,002.3 | ||||
| Taxes | $ | -390.5 | $ | -743.4 | ||||
| Average Net Debt (B) | $ | 14,948.3 | $ | 14,436.9 | ||||
| Current Net Debt | $ | 16,320.1 | $ | 13,576.6 | ||||
| Previous Year Net Debt | $ | 13,576.6 | $ | 15,297.2 | ||||
| Average Shareholder Equity (C) | $ | 8,828.6 | $ | 8,921.1 | ||||
| Current Shareholder Equity | $ | 9,522.8 | $ | 8,134.4 | ||||
| Previous Year Shareholder Equity | $ | 8,134.4 | $ | 9,707.8 | ||||
| Invested Capital (B+C) | $ | 23,776.9 | $ | 23,357.9 | ||||
| ROIC [A/(B+C)] | 17.4 | % | 18.2 | % | ||||
| Last twelve months ended in December 31, | ||||||||
| 2025 | 2024 | |||||||
| Total Adjusted EBITDA | $ | 6,831.4 | $ | 7,191.9 | ||||
| Net Financial Expense | $ | 1,051.5 | $ | 970.1 | ||||
| Interest Coverage | 6.50x | 7.41x | ||||||
13
Conference Call Information and Other Selected Data
A conference call to discuss the Company’s financial results will be held at 9 a.m. Eastern time on Thursday, March 26, 2026. A link for the webcast of the conference call is available on the JBS Investor Relations website at https://ir.jbsglobal.com/, where a replay of the live webcast and the accompanying slides will also be available, as well as other supplemental data, such as the press release and financial information . The webcast also can be accessed by the following direct link: Click here to access.
This press release is being made in respect of JBS N.V. and its subsidiaries (collectively, the “JBS Group”).
Forward-Looking Statements
We make statements about future events that are subject to risks and uncertainties. Such statements are based on the beliefs and assumptions of our Management and information to which the Company currently has access. Statements about future events include information about our current intentions, beliefs or expectations, as well as those of the members of the Company’s Board of Directors and Officers.
Forward-looking statements may include information on possible or presumed operating results, as well as statements that are preceded, followed or that include the words “believe,“ “may,” “will,” “continue,” “expects,“ “predicts,” “intends,” “plans,” “estimates,” or similar expressions.
Forward-looking statements and information are not guarantees of performance. They involve risks, uncertainties and assumptions because they refer to future events, depending, therefore, on circumstances that may or may not occur. Future results and shareholder value creation may differ materially from those expressed or implied by the forward-looking statements. Many of the factors that will determine these results and values are beyond our ability to control or predict.
IFRS and Non-GAAP Financial Measures
This release is prepared under IFRS and also includes certain non-GAAP financial measures. These measures are not calculated in accordance with any generally accepted accounting principles (GAAP) or International Financial Reporting Standards (IFRS) and should not be viewed as substitutes for IFRS metrics such as net income, operating cash flow, or other measures of operating performance or liquidity.
We present non-GAAP financial measures to provide additional information that we believe is useful and meaningful to investors. However, such measures do not have standardized definitions and may therefore not be comparable to similarly titled measures presented by other companies. Non-GAAP financial measures should always be considered together with, and not as alternatives to, the financial results reported in accordance with IFRS as issued by the International Accounting Standards Board.
Additionally, the consolidated US GAAP figure includes non-audited accounting GAAP adjustments in Seara and JBS Brazil, in addition to the Business Units that already report under US GAAP.
Investor Contact: ir@jbs.com.br
Guilherme Cavalcanti (Global CFO)
Christiane Assis (IRO)
Pedro Bueno
Felipe Brindo
Vítor Figueira
Amanda Harumi
14