
1 September 3, 2025 Investor Presentation Company Overview
2 Disclaimer Forward-Looking Statements This presentation includes statements that express our management’s opinions, expectations, beliefs, plans, objectives, assumptions or projections regarding future events or future results and therefore are, or may be deemed to be, “forward-looking statements.” These forward-looking statements can generally be identified by the use of forward-looking terminology, including the terms “believes,” “estimates,” “anticipates,” “expects,” “seeks,” “projects,” “forecasts,” “intends,” “plans,” “may,” “will” or “should” or, in each case, their negative or other variations or comparable terminology. These forward-looking statements include all matters that are not historical facts. They appear in a number of places throughout this presentation, including, but not limited to, statements relating to the anticipated benefits of our transformation and expansion plans; our 2025 outlook and guidance; our potential for growth; the anticipated benefits of our international initiatives; and the long-term prospects of the Company. Such forward-looking statements are based on available current market and management’s expectations, beliefs and forecasts concerning future events impacting the business. Although we believe that these forward-looking statements are based on reasonable assumptions at the time they are made, you should be aware that these forward-looking statements involve a number of risks, uncertainties (some of which are beyond our control) or other assumptions that may cause actual results or performance to be materially different from those expressed or implied by these forward-looking statements. These factors include: loss of our clients, particularly our largest clients; the ability to achieve the goals of our strategic plans and recognize the anticipated strategic, operational, growth and efficiency benefits when expected; our ability to enter new lines of business and broaden the scope of our services; the loss of key members of our management team or inability to maintain sufficient qualified personnel; our ability to continue to attract, motivate and retain a large number of skilled employees, and adapt to the effects of inflationary pressure on wages; trends in the U.S. healthcare system, including recent trends of unknown duration of reduced healthcare utilization and increased patient financial responsibility for services; effects of competition; effects of pricing pressure; the inability of our clients to pay for our services; changes in our industry and in industry standards and technology; adverse outcomes related to litigation or governmental proceedings; interruptions or security breaches of our information technology systems and other cybersecurity attacks; our ability to maintain the licenses or right of use for the software we use; our ability to protect proprietary information, processes and applications; our inability to expand our network infrastructure; inability to preserve or increase our existing market share or the size of our preferred provider organization networks; decreases in discounts from providers; pressure to limit access to preferred provider networks; changes in our regulatory environment, including healthcare law and regulations; the expansion of privacy and security laws; heightened enforcement activity by government agencies; our ability to obtain additional financing; our ability to pay interest and principal on our notes and other indebtedness; lowering or withdrawal of our credit ratings; changes in accounting principles or the incurrence of impairment charges; the possibility that we may be adversely affected by other political, economic, business, and/or competitive factors; other factors disclosed in our Securities and Exchange Commission filings; and other factors beyond our control. Should one or more of these risks or uncertainties materialize, or should any of the assumptions prove incorrect, actual results may vary in material respects from those projected in these forward-looking statements. There can be no assurance that future developments affecting our business will be those that we have anticipated. Forward-looking statements speak only as of the date made. We do not undertake any obligation to update or revise any forward-looking statements, whether as a result of new information, future events or otherwise, except as may be required under applicable securities laws. Non-GAAP Measures In addition to the financial measures prepared in accordance with generally accepted accounting principles in the United States (“GAAP”), this presentation contains certain non-GAAP financial measures, including EBITDA, Adjusted EBITDA, Free Cash Flow, and Unlevered Free Cash Flow. A non-GAAP financial measure is generally defined as a numerical measure of a company’s financial or operating performance that excludes or includes amounts so as to be different than the most directly comparable measure calculated and presented in accordance with GAAP. EBITDA, Adjusted EBITDA, Free Cash Flow, and Unlevered Free Cash Flow are supplemental measures of Claritev’s performance that are not required by or presented in accordance with GAAP. These measures are not measurements of our financial or operating performance under GAAP, have limitations as analytical tools and should not be considered in isolation or as an alternative to net income (loss), cash flows or any other measures of performance prepared in accordance with GAAP. EBITDA represents net income (loss) before interest expense, interest income, income tax provision (benefit), depreciation and amortization of intangible assets, and non-income taxes. Adjusted EBITDA is EBITDA as further adjusted by certain items as described in the table below. In addition, in evaluating EBITDA and Adjusted EBITDA you should be aware that in the future, we may incur expenses similar to the adjustments in the presentation of EBITDA and Adjusted EBITDA. The presentation of EBITDA and Adjusted EBITDA should not be construed as an inference that our future results will be unaffected by unusual or non-recurring items. The calculations of EBITDA and Adjusted EBITDA may not be comparable to similarly titled measures reported by other companies. Based on our industry and debt financing experience, we believe that EBITDA and Adjusted EBITDA are customarily used by investors, analysts and other interested parties to provide useful information regarding a company’s ability to service and/or incur indebtedness. We also believe that Adjusted EBITDA is useful to investors and analysts in assessing our operating performance during the periods these charges were incurred on a consistent basis with the periods during which these charges were not incurred. Both EBITDA and Adjusted EBITDA have limitations as analytical tools, and you should not consider either in isolation, or as a substitute for analysis of our results as reported under GAAP. Some of the limitations are: • EBITDA and Adjusted EBITDA do not reflect changes in, or cash requirements for, our working capital needs; • EBITDA and Adjusted EBITDA do not reflect interest expense, or the cash requirements necessary to service interest or principal payments on our debt; • EBITDA and Adjusted EBITDA do not reflect our tax expense or the cash requirements to pay our taxes; and • Although depreciation and amortization are non-cash charges, the tangible assets being depreciated will often have to be replaced in the future, and EBITDA and Adjusted EBITDA do not reflect any cash requirements for such replacements. Claritev’s presentation of Adjusted EBITDA should not be construed as an inference that our future results and financial position will be unaffected by unusual items. Free Cash Flow as defined as net cash provided by operating activities less capital expenditures, all as disclosed in the Statement of Cash Flows. Unlevered Free Cash Flow is defined as net cash provided by (used in) operating activities less capital expenditures, plus cash interest paid, all as disclosed in the Statements of Cash Flows. Free Cash Flow and Unlevered Free Cash Flow are measures of our operational performance used by management to evaluate our business after purchases of property and equipment and, in the case of Unlevered Free Cash Flow, prior to the impact of our capital structure, in the case of Unlevered Free Cash Flow, and after purchases of property and equipment. Unlevered Free Cash Flow should be considered in addition to, rather than as a substitute for, consolidated net income as a measure of our performance and net cash provided by operating activities as a measure of our liquidity. Additionally, Claritev’s definition of Free Cash Flow and Unlevered Free Cash Flow are limited, in that they do not represent residual cash flows available for discretionary expenditures, due to the fact that the measures do not deduct the payments required for debt service, in the case of Unlevered Free Cash Flow, and other contractual obligations or payments made for business acquisitions. ACV Bookings represents our estimate of the annualized value of all closed opportunities in the second quarter of 2025. Claritev believes that the presentation of ACV Bookings provides useful information to investors because it is a financial performance measure that allows our investors to understand the value of our contracts and track our sales performance.
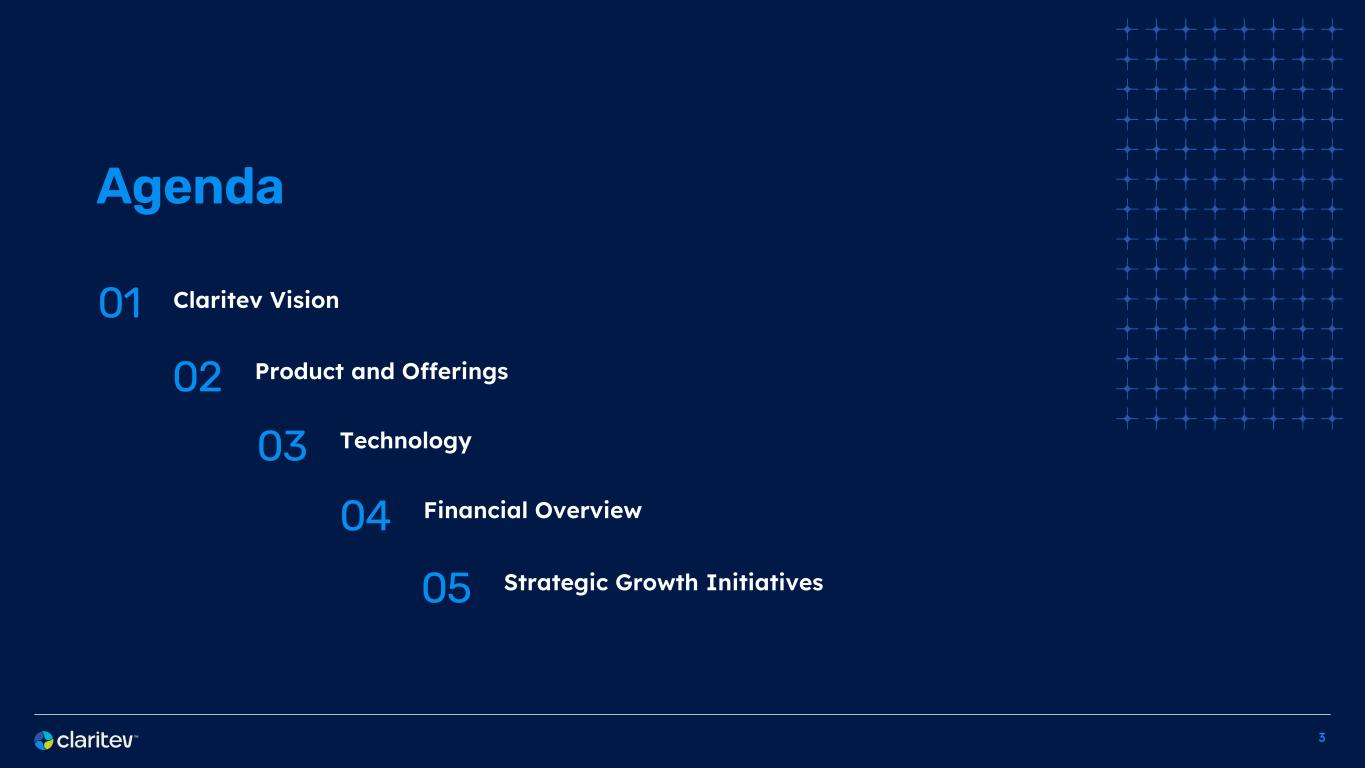
3 01 Claritev Vision 02 Product and Offerings 03 Technology 04 Financial Overview Agenda 05 Strategic Growth Initiatives

4 Claritev Vision
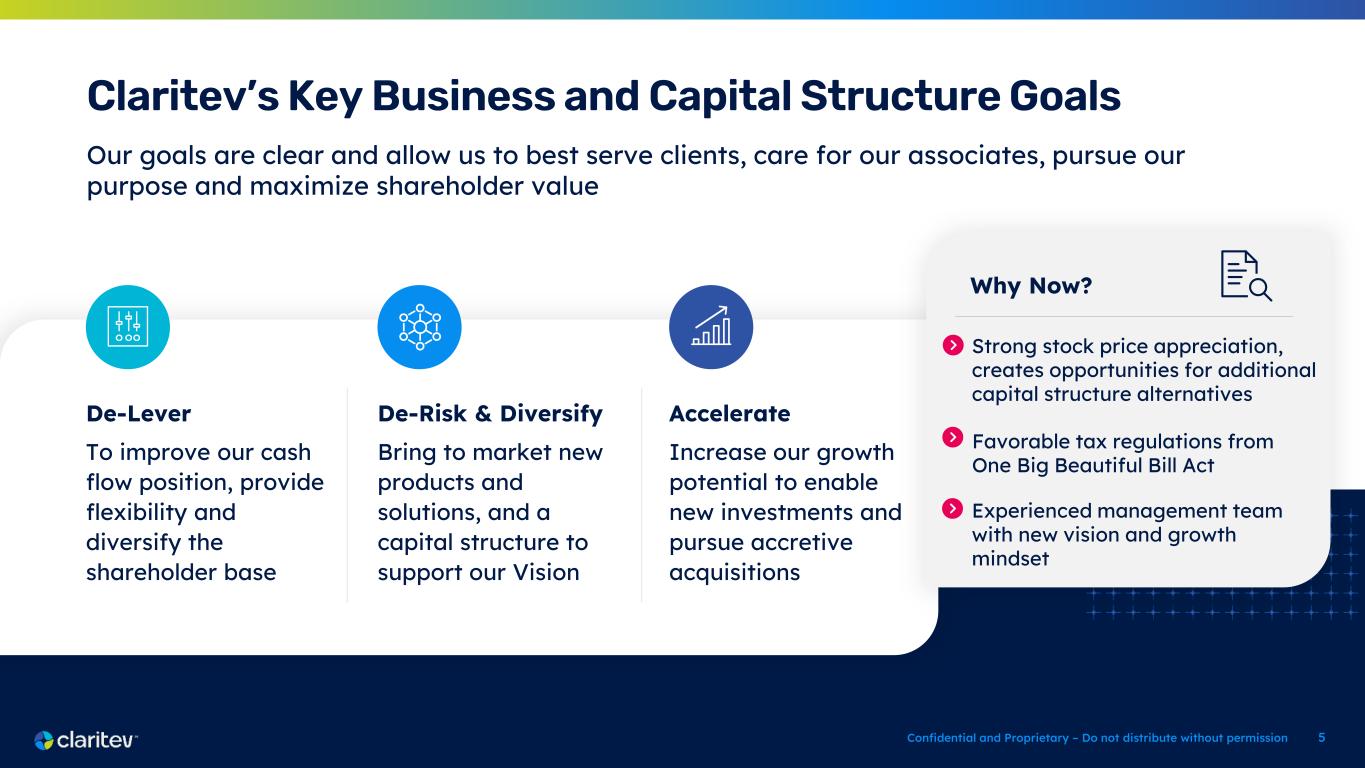
5 Claritev’s Key Business and Capital Structure Goals Our goals are clear and allow us to best serve clients, care for our associates, pursue our purpose and maximize shareholder value De-Lever To improve our cash flow position, provide flexibility and diversify the shareholder base De-Risk & Diversify Bring to market new products and solutions, and a capital structure to support our Vision Accelerate Increase our growth potential to enable new investments and pursue accretive acquisitions Confidential and Proprietary – Do not distribute without permission Why Now? Strong stock price appreciation, creates opportunities for additional capital structure alternatives Favorable tax regulations from One Big Beautiful Bill Act Experienced management team with new vision and growth mindset
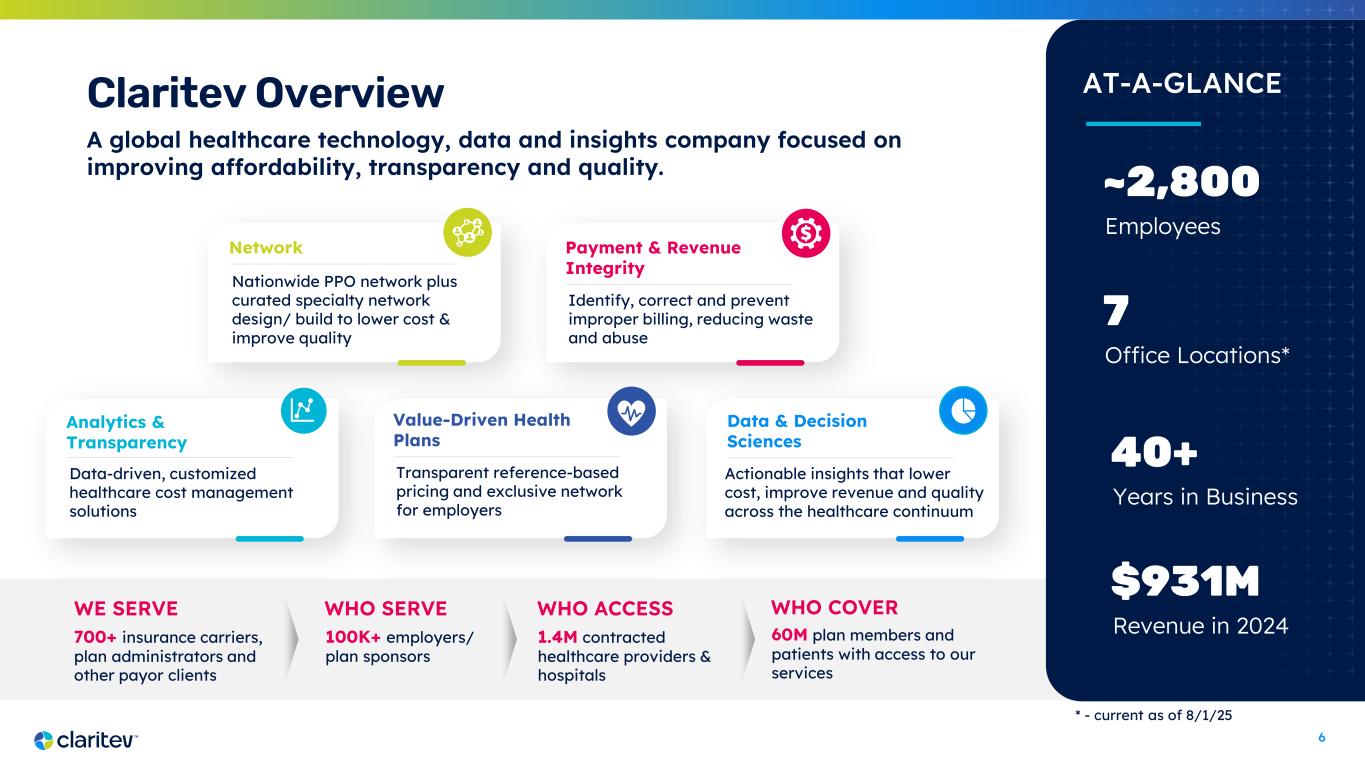
6 Claritev Overview 700+ insurance carriers, plan administrators and other payor clients 100K+ employers/ plan sponsors WHO SERVEWE SERVE A global healthcare technology, data and insights company focused on improving affordability, transparency and quality. 60M plan members and patients with access to our services WHO COVER 1.4M contracted healthcare providers & hospitals WHO ACCESS 40+ Years in Business $931M Revenue in 2024 ~2,800 Employees 7 Office Locations* AT-A-GLANCE Nationwide PPO network plus curated specialty network design/ build to lower cost & improve quality Network Identify, correct and prevent improper billing, reducing waste and abuse Payment & Revenue Integrity Data-driven, customized healthcare cost management solutions Analytics & Transparency Transparent reference-based pricing and exclusive network for employers Value-Driven Health Plans Actionable insights that lower cost, improve revenue and quality across the healthcare continuum Data & Decision Sciences * - current as of 8/1/25
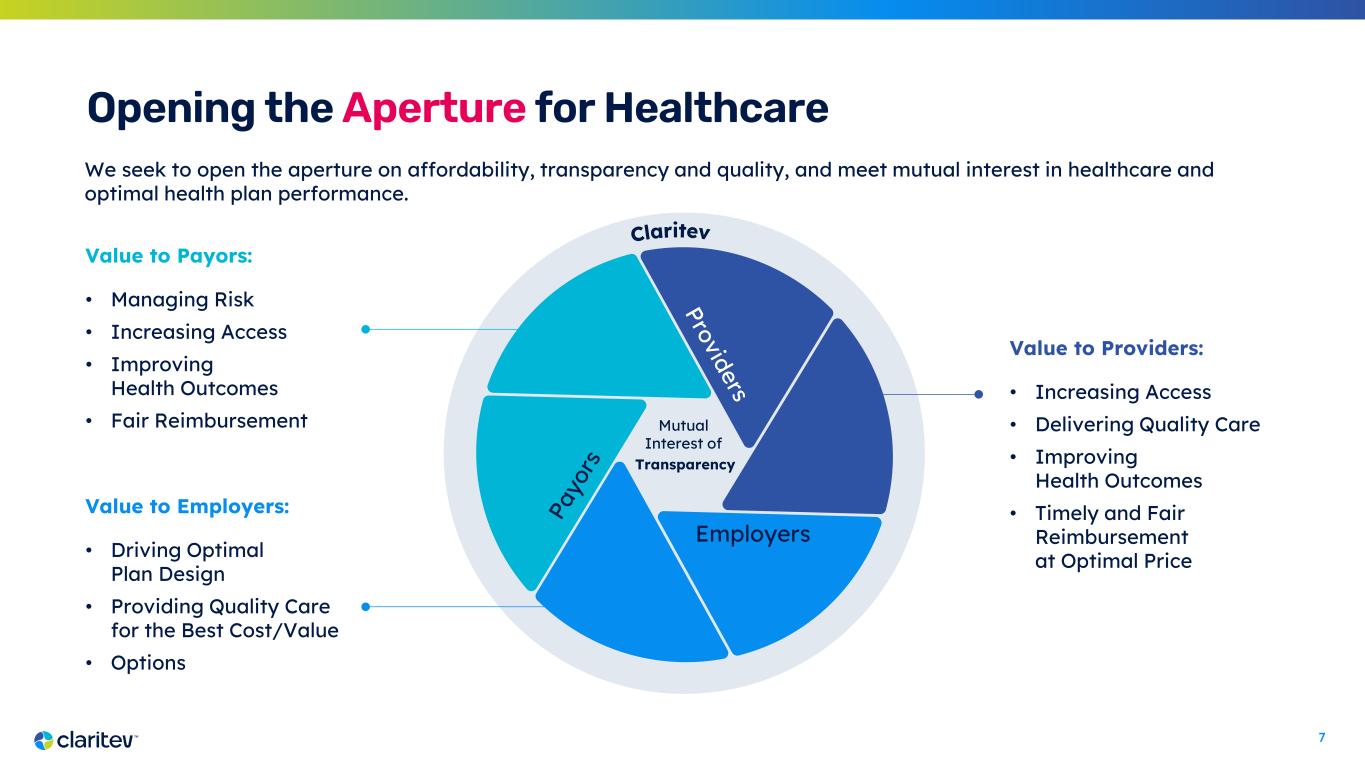
7 Opening the Aperture for Healthcare We seek to open the aperture on affordability, transparency and quality, and meet mutual interest in healthcare and optimal health plan performance. Value to Payors: • Managing Risk • Increasing Access • Improving Health Outcomes • Fair Reimbursement Value to Employers: • Driving Optimal Plan Design • Providing Quality Care for the Best Cost/Value • Options Value to Providers: • Increasing Access • Delivering Quality Care • Improving Health Outcomes • Timely and Fair Reimbursement at Optimal Price Mutual Interest of Transparency Employers
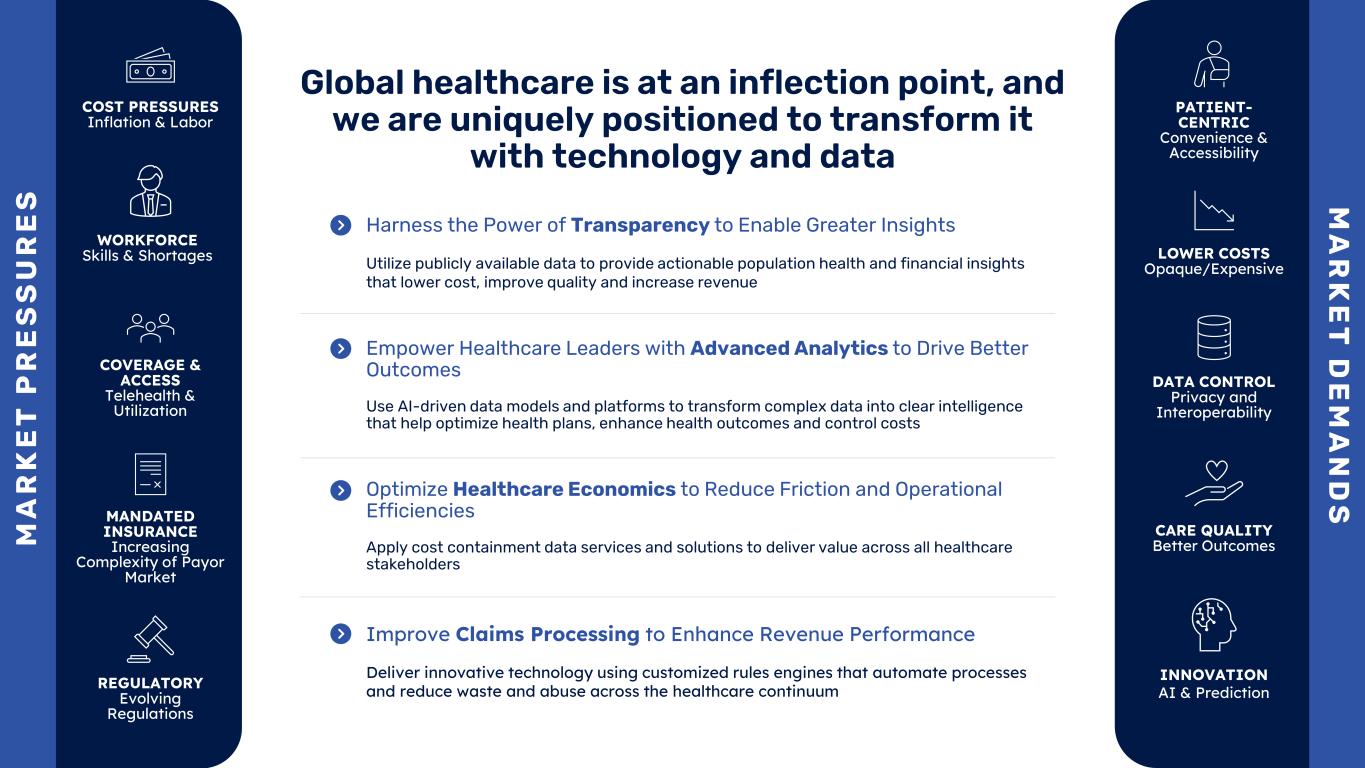
8 Global healthcare is at an inflection point, and we are uniquely positioned to transform it with technology and data Harness the Power of Transparency to Enable Greater Insights Utilize publicly available data to provide actionable population health and financial insights that lower cost, improve quality and increase revenue Empower Healthcare Leaders with Advanced Analytics to Drive Better Outcomes Use AI-driven data models and platforms to transform complex data into clear intelligence that help optimize health plans, enhance health outcomes and control costs Optimize Healthcare Economics to Reduce Friction and Operational Efficiencies Apply cost containment data services and solutions to deliver value across all healthcare stakeholders Improve Claims Processing to Enhance Revenue Performance Deliver innovative technology using customized rules engines that automate processes and reduce waste and abuse across the healthcare continuum M A R K E T P R E S S U R E S COST PRESSURES Inflation & Labor WORKFORCE Skills & Shortages COVERAGE & ACCESS Telehealth & Utilization MANDATED INSURANCE Increasing Complexity of Payor Market REGULATORY Evolving Regulations M A R K E T D E M A N D S PATIENT- CENTRIC Convenience & Accessibility LOWER COSTS Opaque/Expensive DATA CONTROL Privacy and Interoperability CARE QUALITY Better Outcomes INNOVATION AI & Prediction
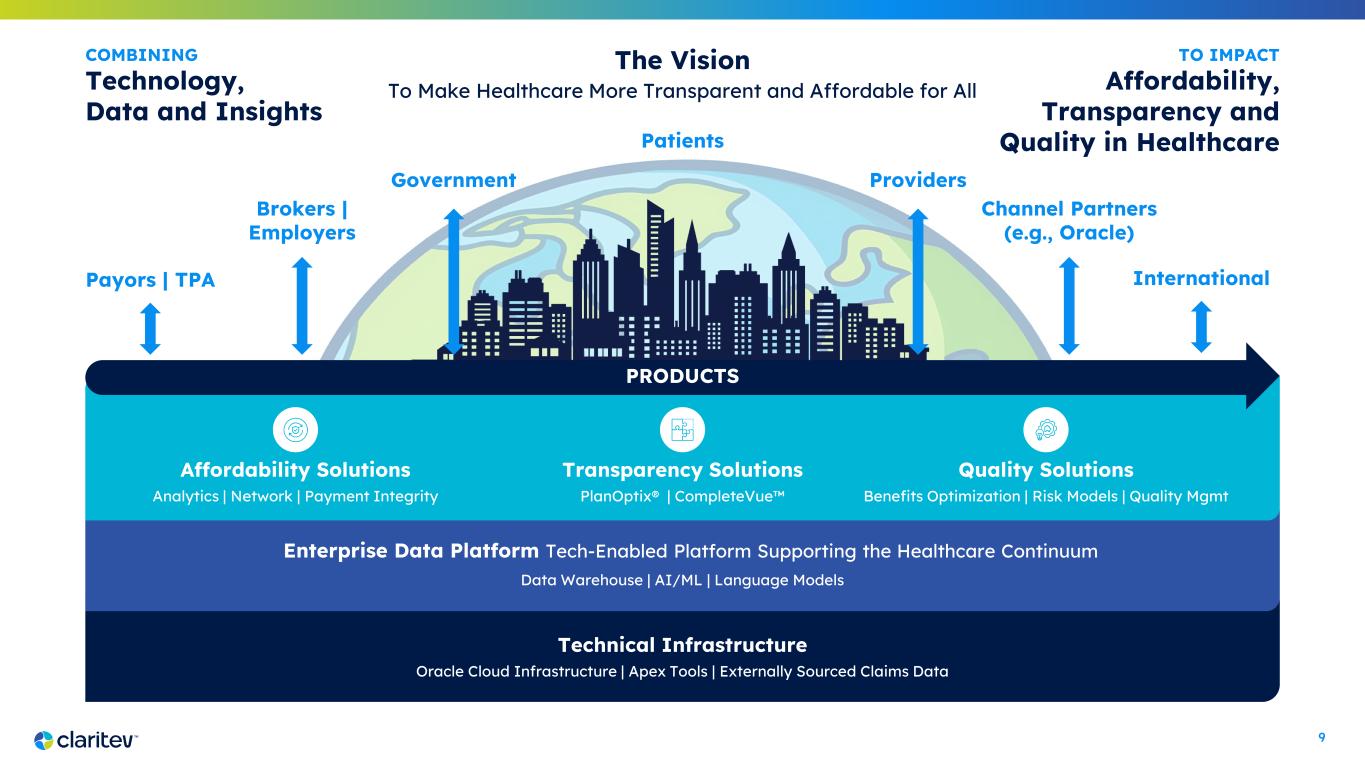
9 Enterprise Data Platform Tech-Enabled Platform Supporting the Healthcare Continuum Data Warehouse | AI/ML | Language Models Technical Infrastructure Oracle Cloud Infrastructure | Apex Tools | Externally Sourced Claims Data The Vision To Make Healthcare More Transparent and Affordable for All COMBINING Technology, Data and Insights TO IMPACT Affordability, Transparency and Quality in HealthcarePatients Payors | TPA Brokers | Employers Government Channel Partners (e.g., Oracle) Providers Affordability Solutions Analytics | Network | Payment Integrity Transparency Solutions PlanOptix® | CompleteVue Quality Solutions Benefits Optimization | Risk Models | Quality Mgmt PRODUCTS International
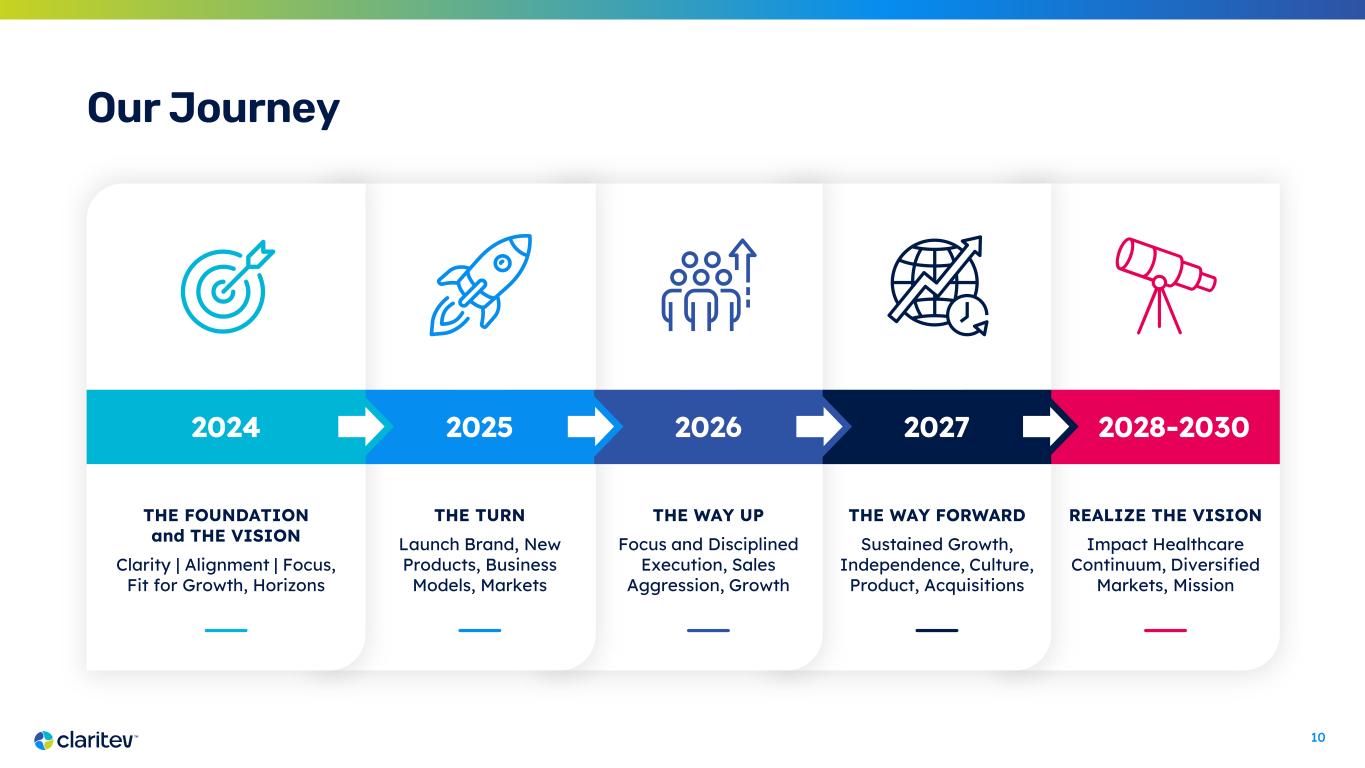
10 Our Journey THE FOUNDATION and THE VISION Clarity | Alignment | Focus, Fit for Growth, Horizons THE TURN Launch Brand, New Products, Business Models, Markets THE WAY UP Focus and Disciplined Execution, Sales Aggression, Growth THE WAY FORWARD Sustained Growth, Independence, Culture, Product, Acquisitions REALIZE THE VISION Impact Healthcare Continuum, Diversified Markets, Mission 2024 2025 2026 2027 2028-2030
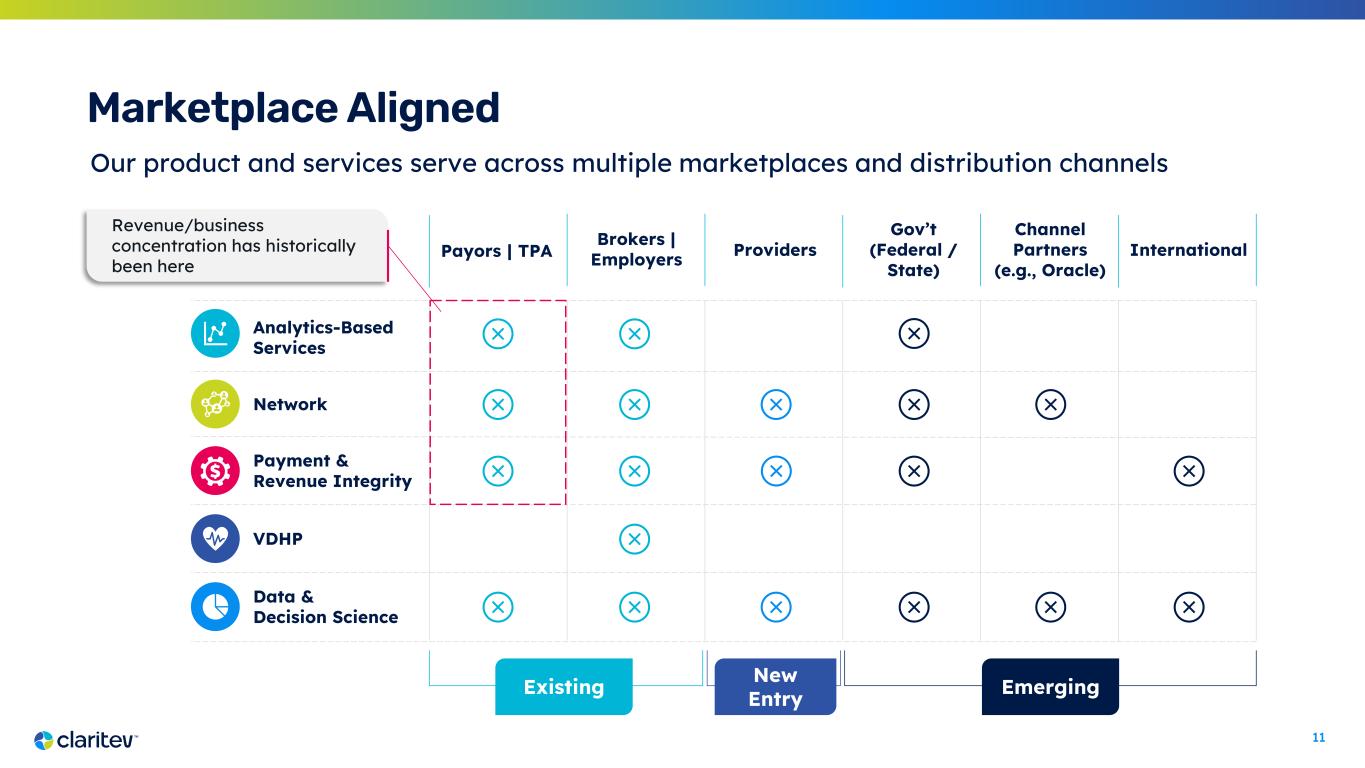
11 Marketplace Aligned Our product and services serve across multiple marketplaces and distribution channels Analytics-Based Services Payment & Revenue Integrity Network VDHP Data & Decision Science Existing New Entry Emerging Revenue/business concentration has historically been here Payors | TPA Brokers | Employers Providers Gov’t (Federal / State) Channel Partners (e.g., Oracle) International
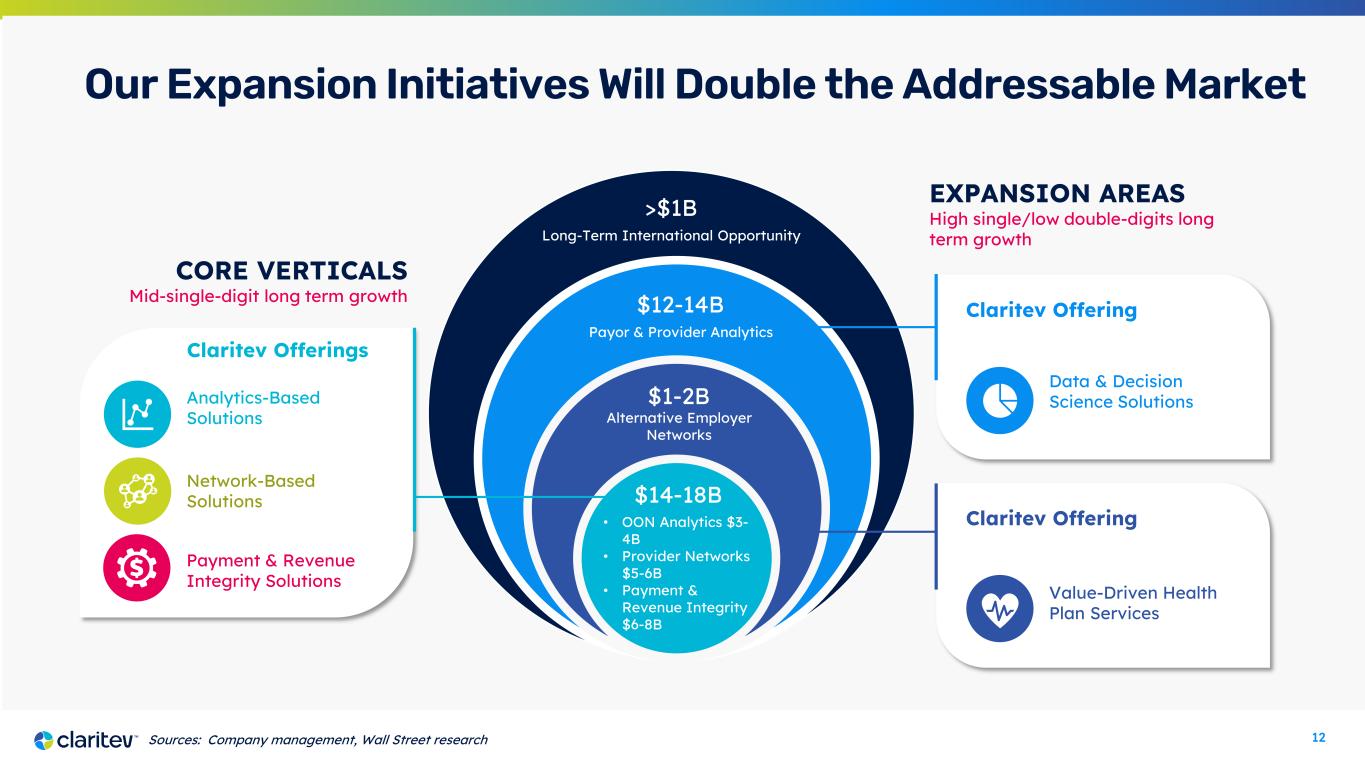
12 Claritev Offering Value-Driven Health Plan Services Our Expansion Initiatives Will Double the Addressable Market $14-18B Claritev Offerings CORE VERTICALS Mid-single-digit long term growth EXPANSION AREAS High single/low double-digits long term growth • OON Analytics $3- 4B • Provider Networks $5-6B • Payment & Revenue Integrity $6-8B Alternative Employer Networks Payor & Provider Analytics Claritev Offering Data & Decision Science Solutions Network-Based Solutions Analytics-Based Solutions Payment & Revenue Integrity Solutions Sources: Company management, Wall Street research $1-2B $12-14B Long-Term International Opportunity >$1B
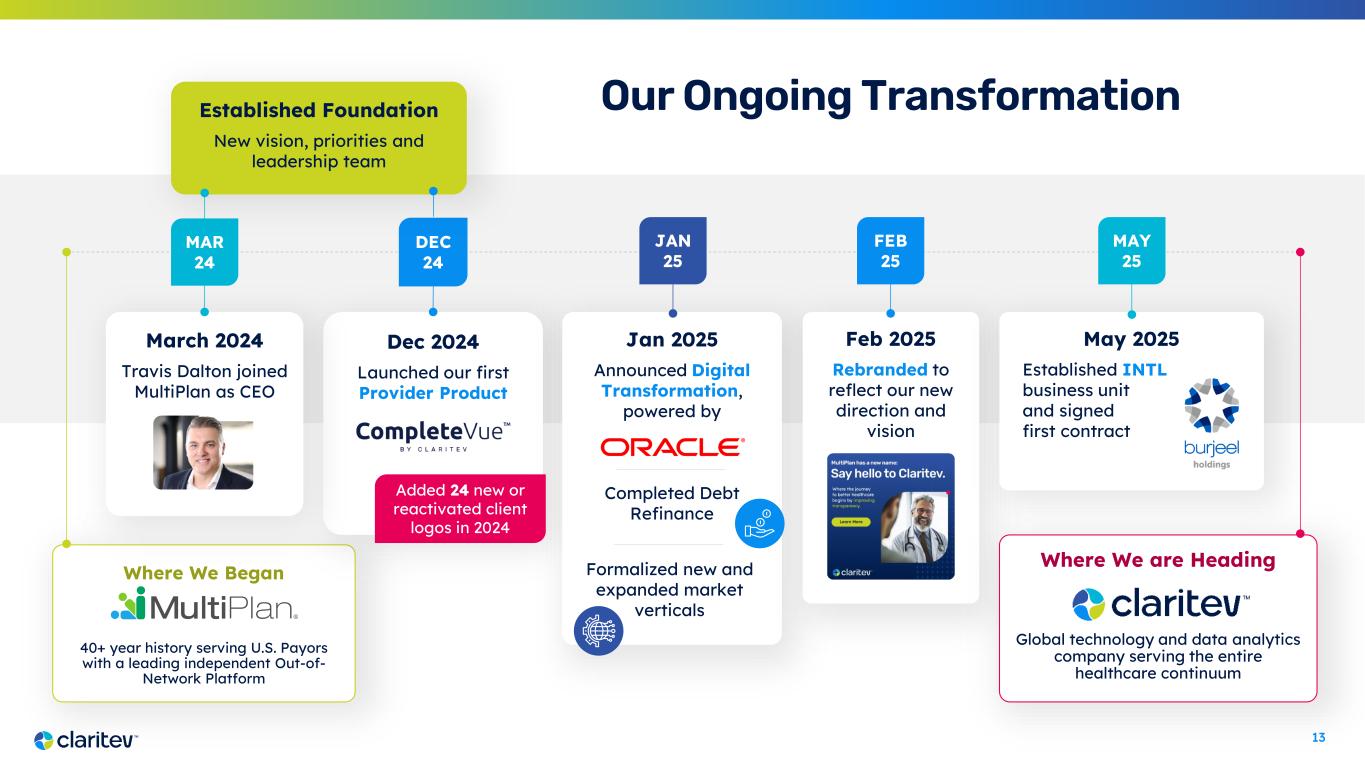
13 Our Ongoing Transformation Where We Began 40+ year history serving U.S. Payors with a leading independent Out-of- Network Platform DEC 24 Dec 2024 Launched our first Provider Product JAN 25 Jan 2025 Announced Digital Transformation, powered by Completed Debt Refinance FEB 25 Feb 2025 Rebranded to reflect our new direction and vision Where We are Heading Global technology and data analytics company serving the entire healthcare continuum MAY 25 May 2025 Established INTL business unit and signed first contract MAR 24 March 2024 Travis Dalton joined MultiPlan as CEO Established Foundation New vision, priorities and leadership team Formalized new and expanded market verticals Added 24 new or reactivated client logos in 2024
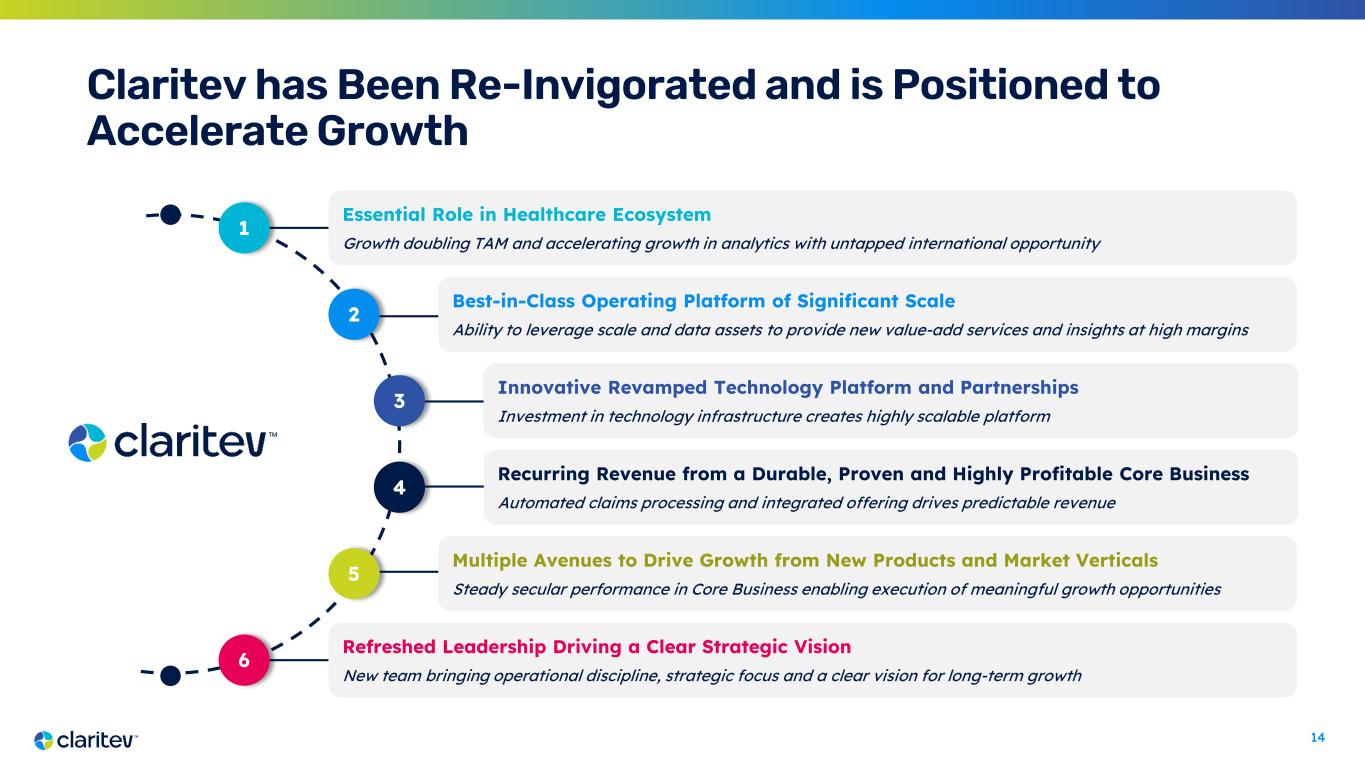
14 Claritev has Been Re-Invigorated and is Positioned to Accelerate Growth 6 2 3 1 4 5 Recurring Revenue from a Durable, Proven and Highly Profitable Core Business Automated claims processing and integrated offering drives predictable revenue Multiple Avenues to Drive Growth from New Products and Market Verticals Steady secular performance in Core Business enabling execution of meaningful growth opportunities Best-in-Class Operating Platform of Significant Scale Ability to leverage scale and data assets to provide new value-add services and insights at high margins Innovative Revamped Technology Platform and Partnerships Investment in technology infrastructure creates highly scalable platform Refreshed Leadership Driving a Clear Strategic Vision New team bringing operational discipline, strategic focus and a clear vision for long-term growth Essential Role in Healthcare Ecosystem Growth doubling TAM and accelerating growth in analytics with untapped international opportunity
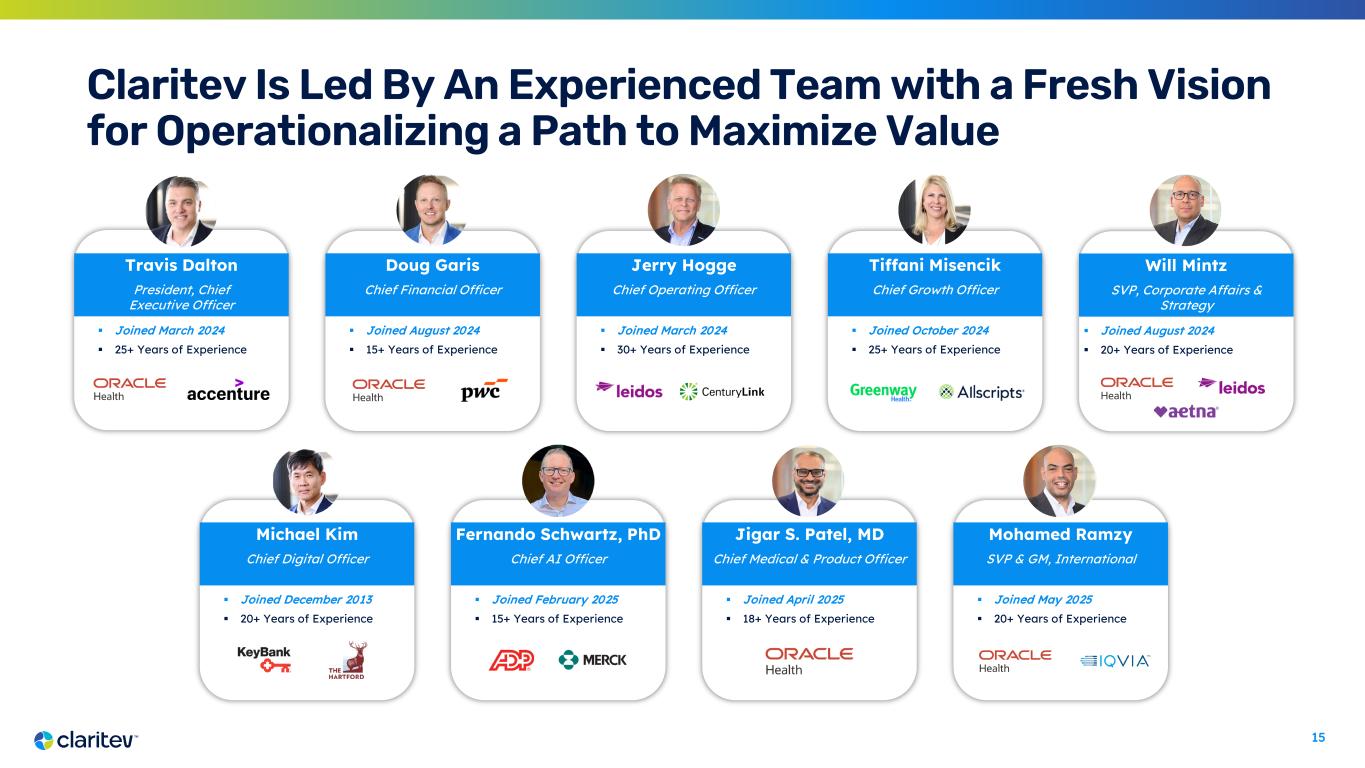
15 Claritev Is Led By An Experienced Team with a Fresh Vision for Operationalizing a Path to Maximize Value Travis Dalton President, Chief Executive Officer Joined March 2024 25+ Years of Experience Doug Garis Chief Financial Officer Joined August 2024 15+ Years of Experience Jerry Hogge Chief Operating Officer Joined March 2024 30+ Years of Experience Michael Kim Chief Digital Officer Joined December 2013 20+ Years of Experience Will Mintz SVP, Corporate Affairs & Strategy Joined August 2024 20+ Years of Experience Tiffani Misencik Chief Growth Officer Joined October 2024 25+ Years of Experience Fernando Schwartz, PhD Chief AI Officer Joined February 2025 15+ Years of Experience Jigar S. Patel, MD Chief Medical & Product Officer Joined April 2025 18+ Years of Experience Mohamed Ramzy SVP & GM, International Joined May 2025 20+ Years of Experience

16 Products and Offerings
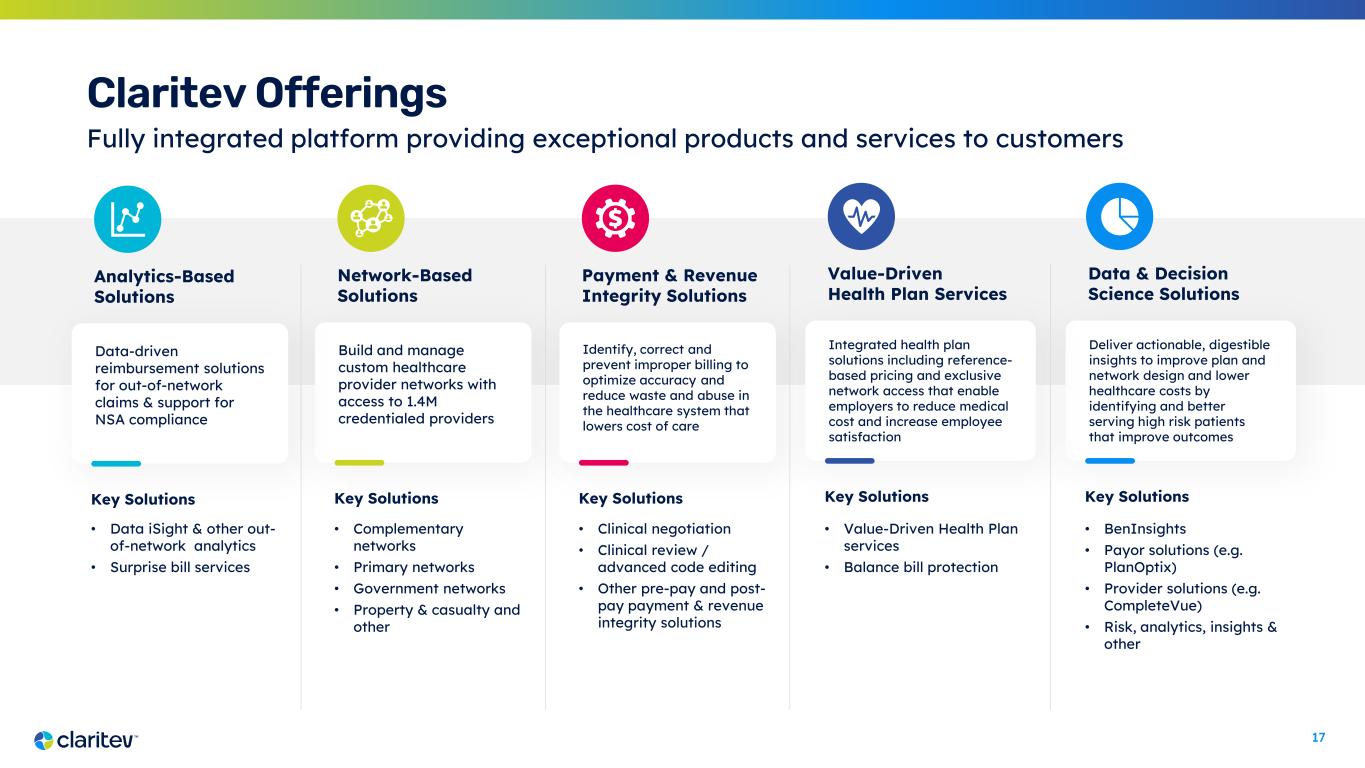
17 Build and manage custom healthcare provider networks with access to 1.4M credentialed providers Data-driven reimbursement solutions for out-of-network claims & support for NSA compliance Identify, correct and prevent improper billing to optimize accuracy and reduce waste and abuse in the healthcare system that lowers cost of care Deliver actionable, digestible insights to improve plan and network design and lower healthcare costs by identifying and better serving high risk patients that improve outcomes Integrated health plan solutions including reference- based pricing and exclusive network access that enable employers to reduce medical cost and increase employee satisfaction Network-Based Solutions Key Solutions • Complementary networks • Primary networks • Government networks • Property & casualty and other Analytics-Based Solutions Key Solutions • Data iSight & other out- of-network analytics • Surprise bill services Payment & Revenue Integrity Solutions Key Solutions • Clinical negotiation • Clinical review / advanced code editing • Other pre-pay and post- pay payment & revenue integrity solutions Data & Decision Science Solutions Key Solutions • BenInsights • Payor solutions (e.g. PlanOptix) • Provider solutions (e.g. CompleteVue) • Risk, analytics, insights & other Value-Driven Health Plan Services Key Solutions • Value-Driven Health Plan services • Balance bill protection Claritev Offerings Fully integrated platform providing exceptional products and services to customers
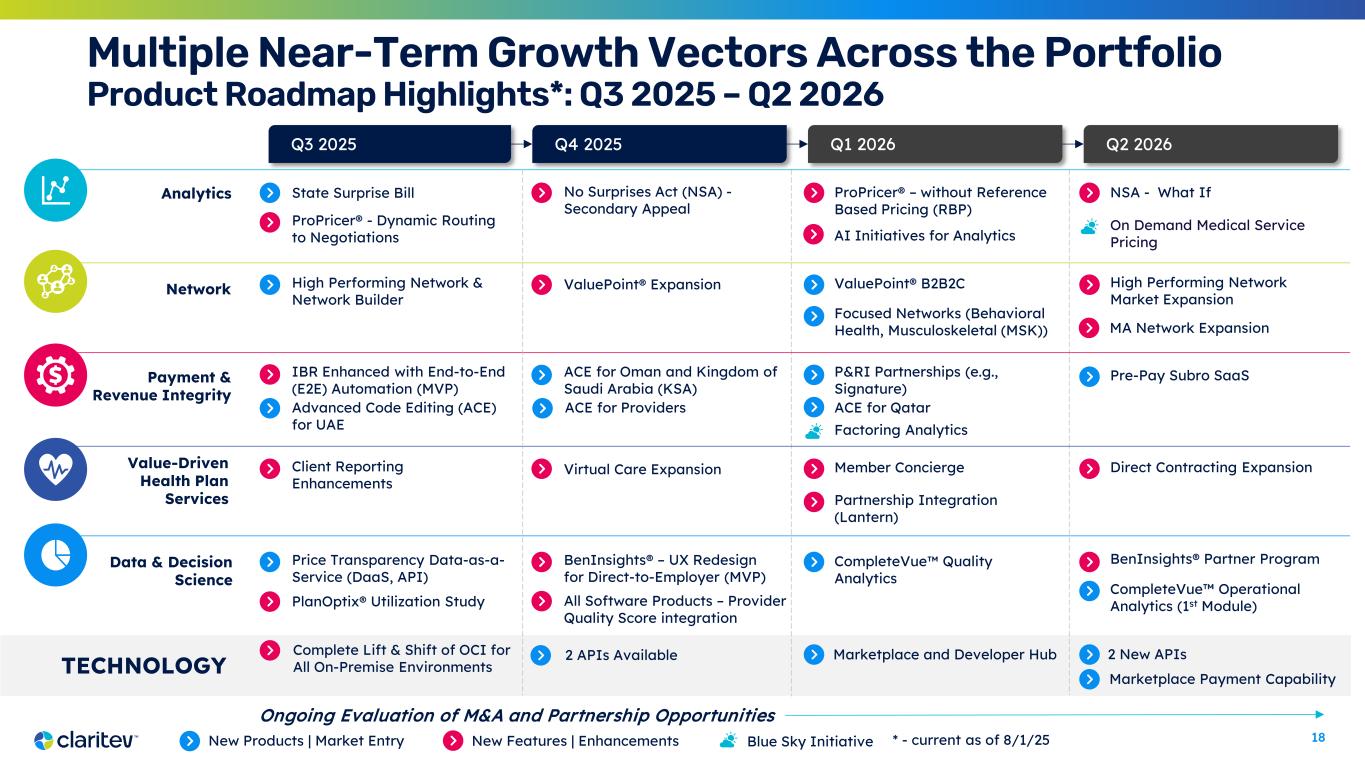
18 Multiple Near-Term Growth Vectors Across the Portfolio Product Roadmap Highlights*: Q3 2025 – Q2 2026 Analytics Network Payment & Revenue Integrity Data & Decision Science State Surprise Bill ValuePoint® Expansion Q3 2025 Q4 2025 Q1 2026 Q2 2026 IBR Enhanced with End-to-End (E2E) Automation (MVP) ACE for Oman and Kingdom of Saudi Arabia (KSA) Price Transparency Data-as-a- Service (DaaS, API) BenInsights® Partner ProgramBenInsights® – UX Redesign for Direct-to-Employer (MVP) No Surprises Act (NSA) - Secondary Appeal ValuePoint® B2B2C Value-Driven Health Plan Services New Products | Market Entry New Features | Enhancements High Performing Network & Network Builder P&RI Partnerships (e.g., Signature) TECHNOLOGY Complete Lift & Shift of OCI for All On-Premise Environments ACE for Providers Marketplace and Developer Hub Virtual Care ExpansionClient Reporting Enhancements Member Concierge ProPricer® – without Reference Based Pricing (RBP) NSA - What If Partnership Integration (Lantern) High Performing Network Market Expansion Factoring Analytics Direct Contracting Expansion Focused Networks (Behavioral Health, Musculoskeletal (MSK)) Pre-Pay Subro SaaS All Software Products – Provider Quality Score integration CompleteVue Quality Analytics CompleteVue Operational Analytics (1st Module)PlanOptix® Utilization Study On Demand Medical Service Pricing Advanced Code Editing (ACE) for UAE ACE for Qatar ProPricer® - Dynamic Routing to Negotiations Blue Sky Initiative 2 APIs Available 2 New APIs Marketplace Payment Capability Ongoing Evaluation of M&A and Partnership Opportunities AI Initiatives for Analytics MA Network Expansion * - current as of 8/1/25
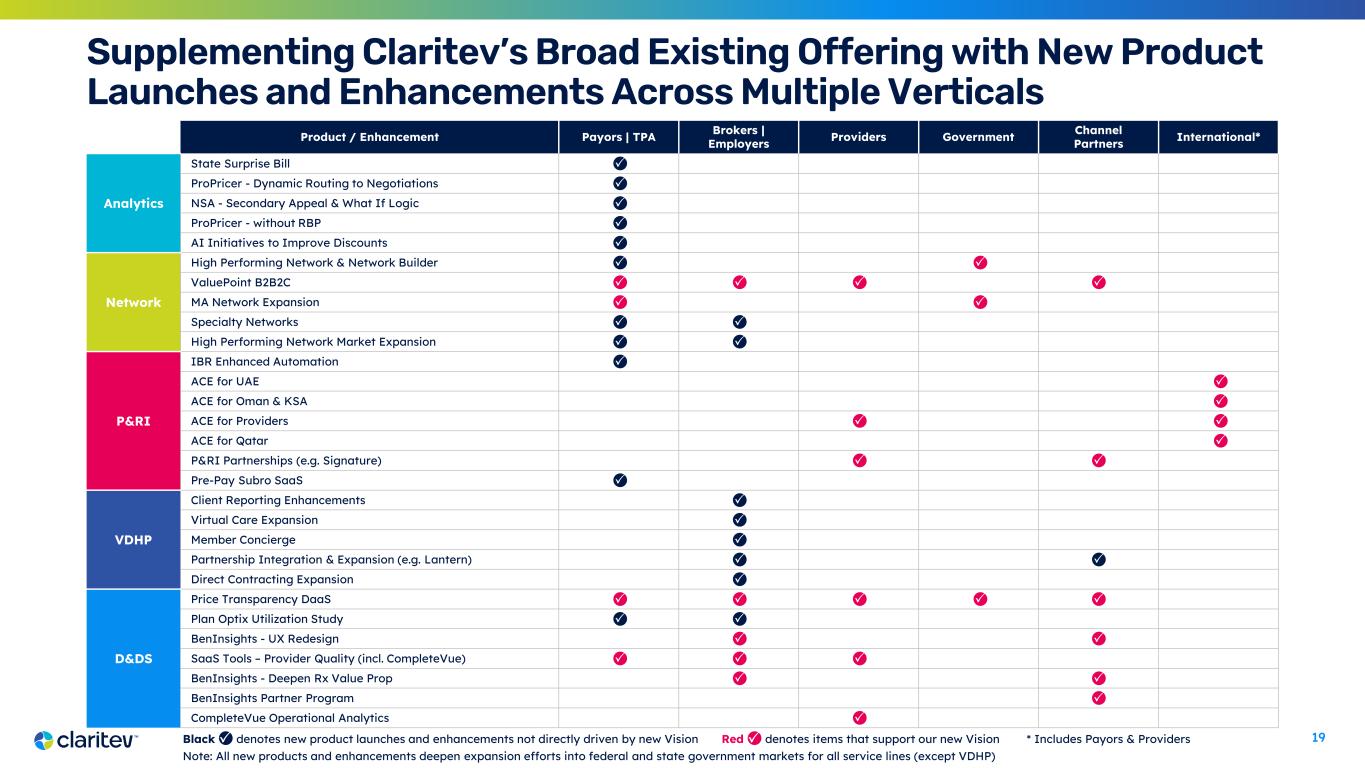
19 Supplementing Claritev’s Broad Existing Offering with New Product Launches and Enhancements Across Multiple Verticals Red denotes items that support our new Vision * Includes Payors & Providers Note: All new products and enhancements deepen expansion efforts into federal and state government markets for all service lines (except VDHP) Product / Enhancement Payors | TPA Brokers | Employers Providers Government Channel Partners International* Analytics State Surprise Bill ProPricer - Dynamic Routing to Negotiations NSA - Secondary Appeal & What If Logic ProPricer - without RBP AI Initiatives to Improve Discounts Network High Performing Network & Network Builder ValuePoint B2B2C MA Network Expansion Specialty Networks High Performing Network Market Expansion P&RI IBR Enhanced Automation ACE for UAE ACE for Oman & KSA ACE for Providers ACE for Qatar P&RI Partnerships (e.g. Signature) Pre-Pay Subro SaaS VDHP Client Reporting Enhancements Virtual Care Expansion Member Concierge Partnership Integration & Expansion (e.g. Lantern) Direct Contracting Expansion D&DS Price Transparency DaaS Plan Optix Utilization Study BenInsights - UX Redesign SaaS Tools – Provider Quality (incl. CompleteVue) BenInsights - Deepen Rx Value Prop BenInsights Partner Program CompleteVue Operational Analytics Black denotes new product launches and enhancements not directly driven by new Vision
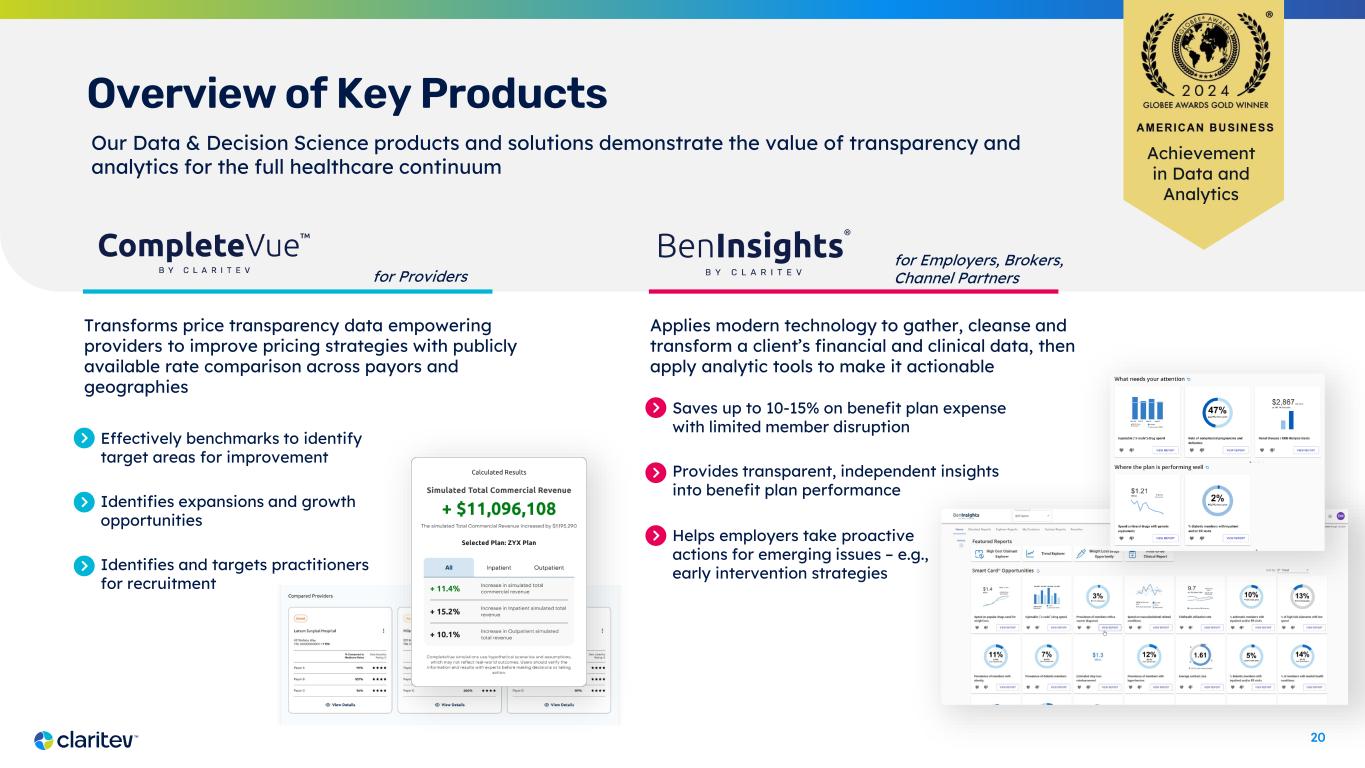
20 Overview of Key Products Applies modern technology to gather, cleanse and transform a client’s financial and clinical data, then apply analytic tools to make it actionable Achievement in Data and Analytics Transforms price transparency data empowering providers to improve pricing strategies with publicly available rate comparison across payors and geographies Saves up to 10-15% on benefit plan expense with limited member disruption Provides transparent, independent insights into benefit plan performance for Providers for Employers, Brokers, Channel Partners Effectively benchmarks to identify target areas for improvement Identifies expansions and growth opportunities Identifies and targets practitioners for recruitment Our Data & Decision Science products and solutions demonstrate the value of transparency and analytics for the full healthcare continuum Helps employers take proactive actions for emerging issues – e.g., early intervention strategies
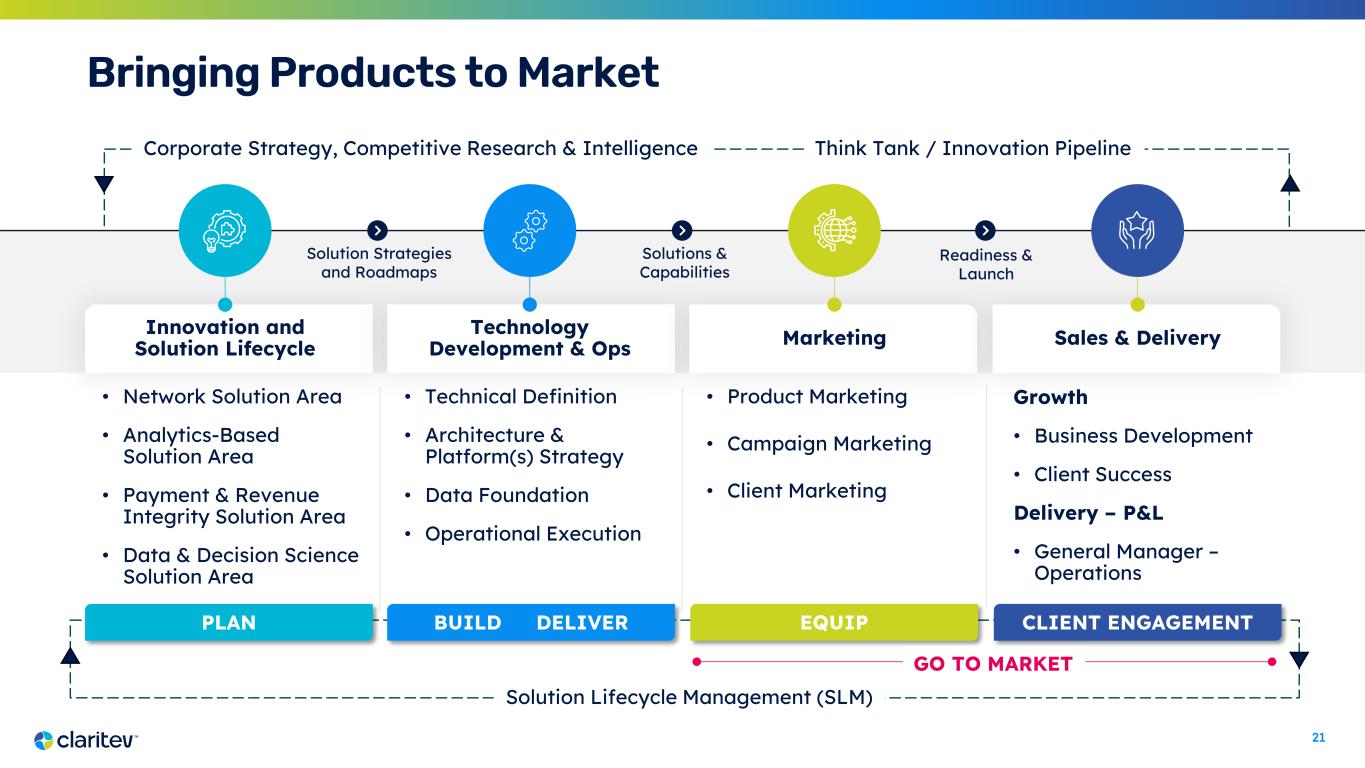
21 Bringing Products to Market Innovation and Solution Lifecycle Technology Development & Ops Marketing • Network Solution Area • Analytics-Based Solution Area • Payment & Revenue Integrity Solution Area • Data & Decision Science Solution Area • Technical Definition • Architecture & Platform(s) Strategy • Data Foundation • Operational Execution • Product Marketing • Campaign Marketing • Client Marketing Sales & Delivery Solution Strategies and Roadmaps Solutions & Capabilities Readiness & Launch Growth • Business Development • Client Success Delivery – P&L • General Manager – Operations Corporate Strategy, Competitive Research & Intelligence Think Tank / Innovation Pipeline PLAN BUILD DELIVER EQUIP CLIENT ENGAGEMENT Solution Lifecycle Management (SLM) GO TO MARKET

22 Technology
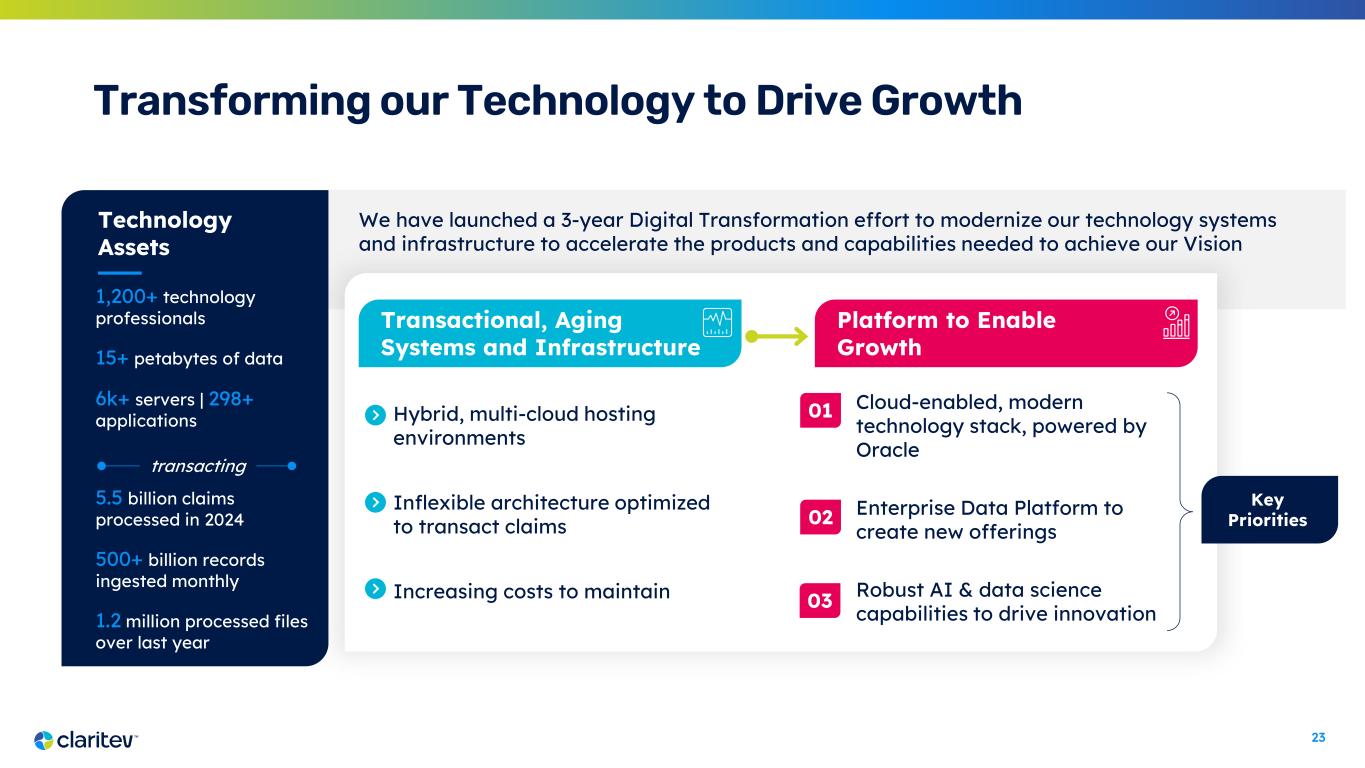
23 Transforming our Technology to Drive Growth Transactional, Aging Systems and Infrastructure Platform to Enable Growth Hybrid, multi-cloud hosting environments Inflexible architecture optimized to transact claims Increasing costs to maintain We have launched a 3-year Digital Transformation effort to modernize our technology systems and infrastructure to accelerate the products and capabilities needed to achieve our Vision Technology Assets 1,200+ technology professionals 15+ petabytes of data 6k+ servers | 298+ applications 5.5 billion claims processed in 2024 500+ billion records ingested monthly 1.2 million processed files over last year transacting Cloud-enabled, modern technology stack, powered by Oracle Enterprise Data Platform to create new offerings Robust AI & data science capabilities to drive innovation Key Priorities 01 03 02
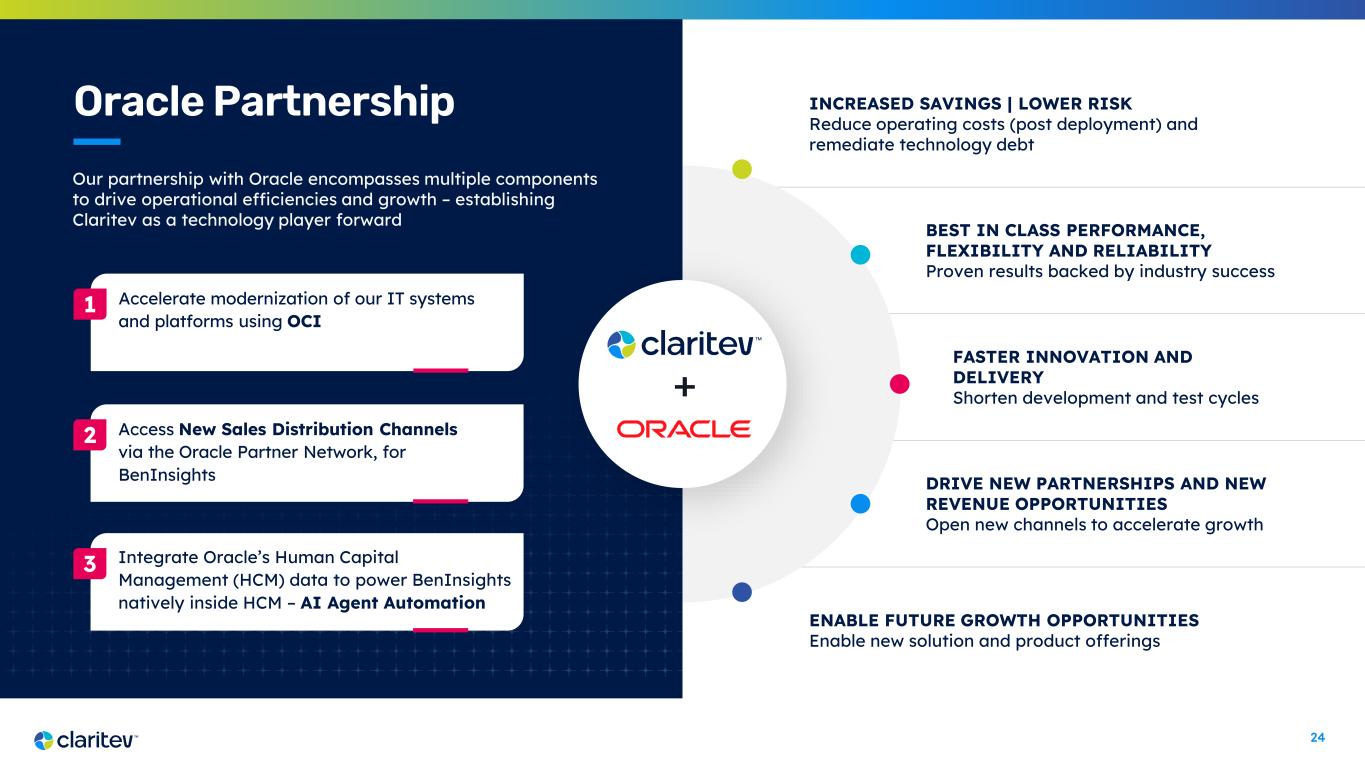
24 INCREASED SAVINGS | LOWER RISK Reduce operating costs (post deployment) and remediate technology debt BEST IN CLASS PERFORMANCE, FLEXIBILITY AND RELIABILITY Proven results backed by industry success FASTER INNOVATION AND DELIVERY Shorten development and test cycles DRIVE NEW PARTNERSHIPS AND NEW REVENUE OPPORTUNITIES Open new channels to accelerate growth ENABLE FUTURE GROWTH OPPORTUNITIES Enable new solution and product offerings Oracle Partnership + Our partnership with Oracle encompasses multiple components to drive operational efficiencies and growth – establishing Claritev as a technology player forward Accelerate modernization of our IT systems and platforms using OCI 1 Access New Sales Distribution Channels via the Oracle Partner Network, for BenInsights 2 Integrate Oracle’s Human Capital Management (HCM) data to power BenInsights natively inside HCM – AI Agent Automation 3
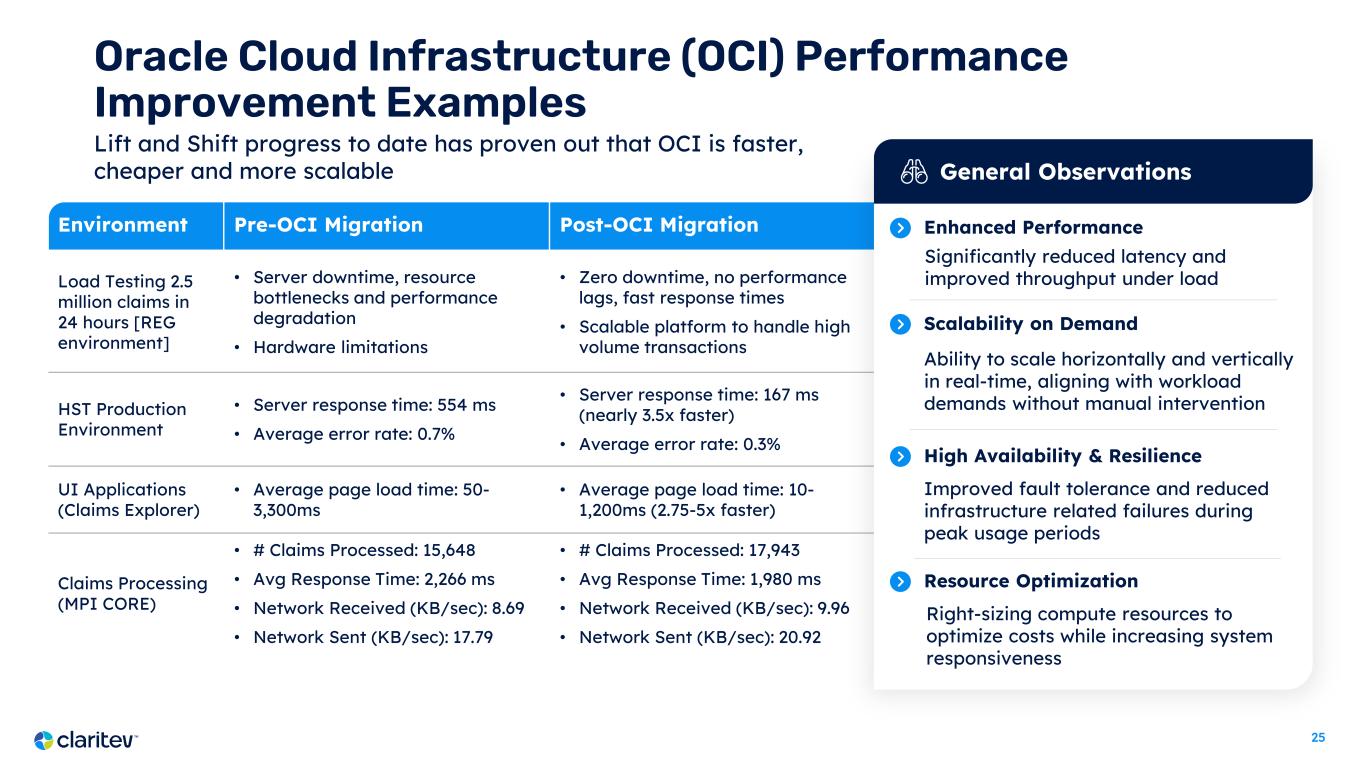
25 Environment Pre-OCI Migration Post-OCI Migration Load Testing 2.5 million claims in 24 hours [REG environment] • Server downtime, resource bottlenecks and performance degradation • Hardware limitations • Zero downtime, no performance lags, fast response times • Scalable platform to handle high volume transactions HST Production Environment • Server response time: 554 ms • Average error rate: 0.7% • Server response time: 167 ms (nearly 3.5x faster) • Average error rate: 0.3% UI Applications (Claims Explorer) • Average page load time: 50- 3,300ms • Average page load time: 10- 1,200ms (2.75-5x faster) Claims Processing (MPI CORE) • # Claims Processed: 15,648 • Avg Response Time: 2,266 ms • Network Received (KB/sec): 8.69 • Network Sent (KB/sec): 17.79 • # Claims Processed: 17,943 • Avg Response Time: 1,980 ms • Network Received (KB/sec): 9.96 • Network Sent (KB/sec): 20.92 Oracle Cloud Infrastructure (OCI) Performance Improvement Examples General Observations Enhanced Performance Ability to scale horizontally and vertically in real-time, aligning with workload demands without manual intervention Scalability on Demand Significantly reduced latency and improved throughput under load Improved fault tolerance and reduced infrastructure related failures during peak usage periods High Availability & Resilience Right-sizing compute resources to optimize costs while increasing system responsiveness Resource Optimization Lift and Shift progress to date has proven out that OCI is faster, cheaper and more scalable
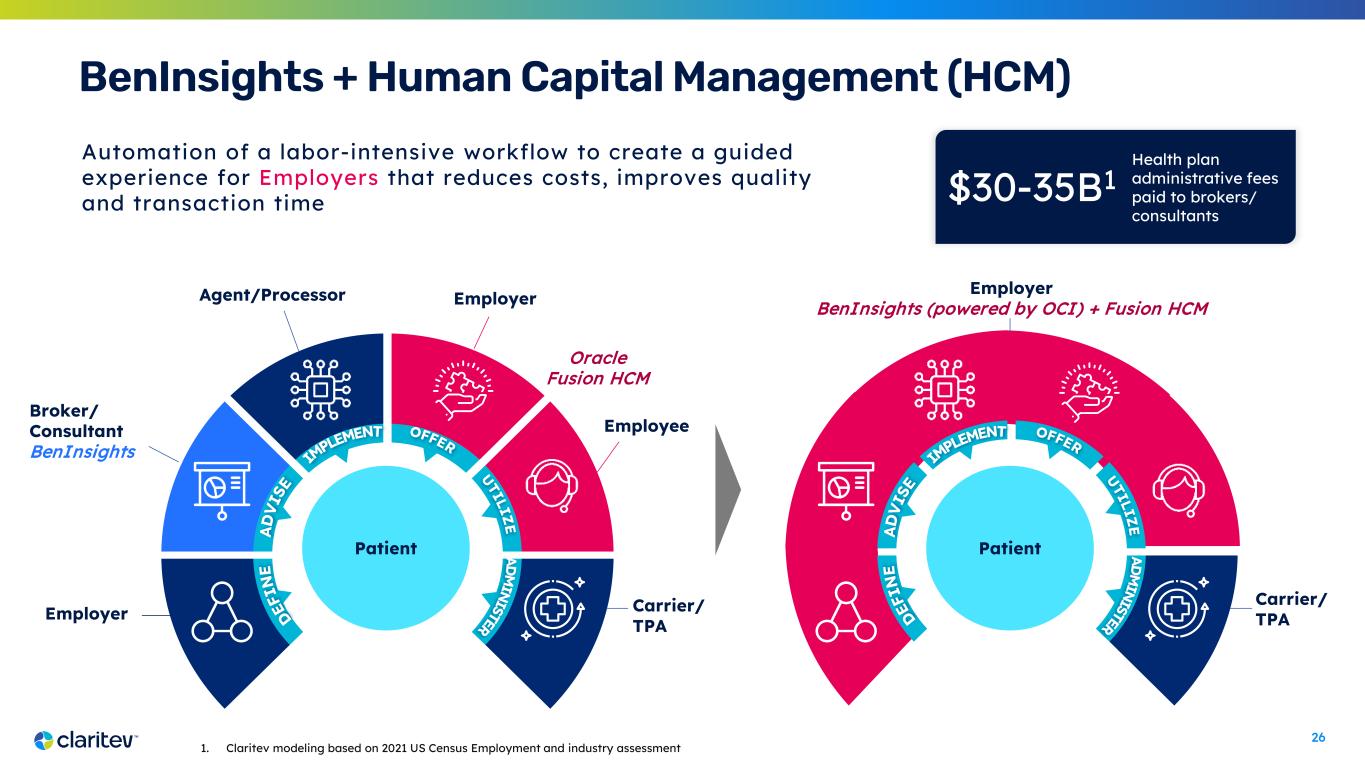
26 Automation of a labor-intensive workflow to create a guided experience for Employers that reduces costs, improves quality and transaction time BenInsights + Human Capital Management (HCM) Employer Broker/ Consultant BenInsights Agent/Processor Employer Employee Carrier/ TPA Patient Employer BenInsights (powered by OCI) + Fusion HCM Carrier/ TPA Patient 1. Claritev modeling based on 2021 US Census Employment and industry assessment Oracle Fusion HCM Health plan administrative fees paid to brokers/ consultants $30-35B1
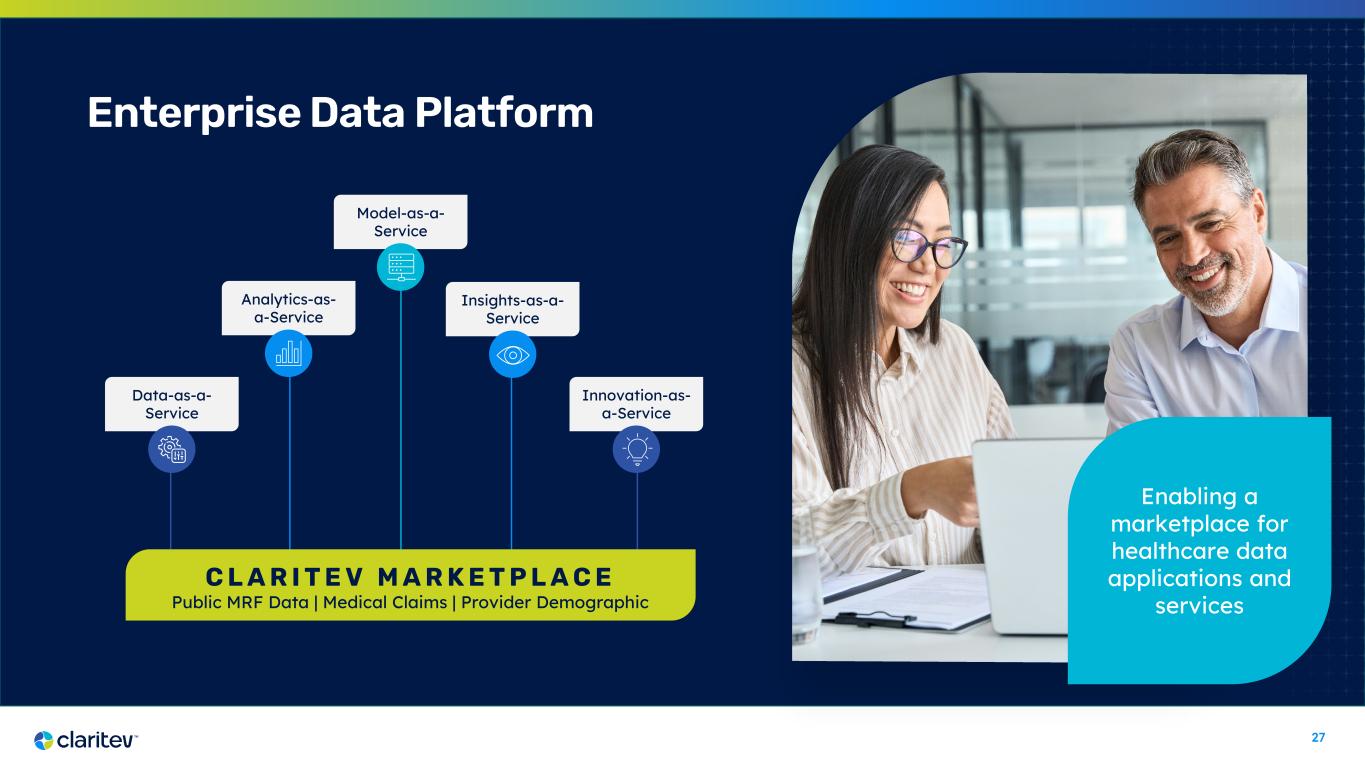
27 Data-as-a- Service C L A R I T E V M A R K E T P L A C E Analytics-as- a-Service Innovation-as- a-Service Insights-as-a- Service Model-as-a- Service Enterprise Data Platform Enabling a marketplace for healthcare data applications and servicesPublic MRF Data | Medical Claims | Provider Demographic
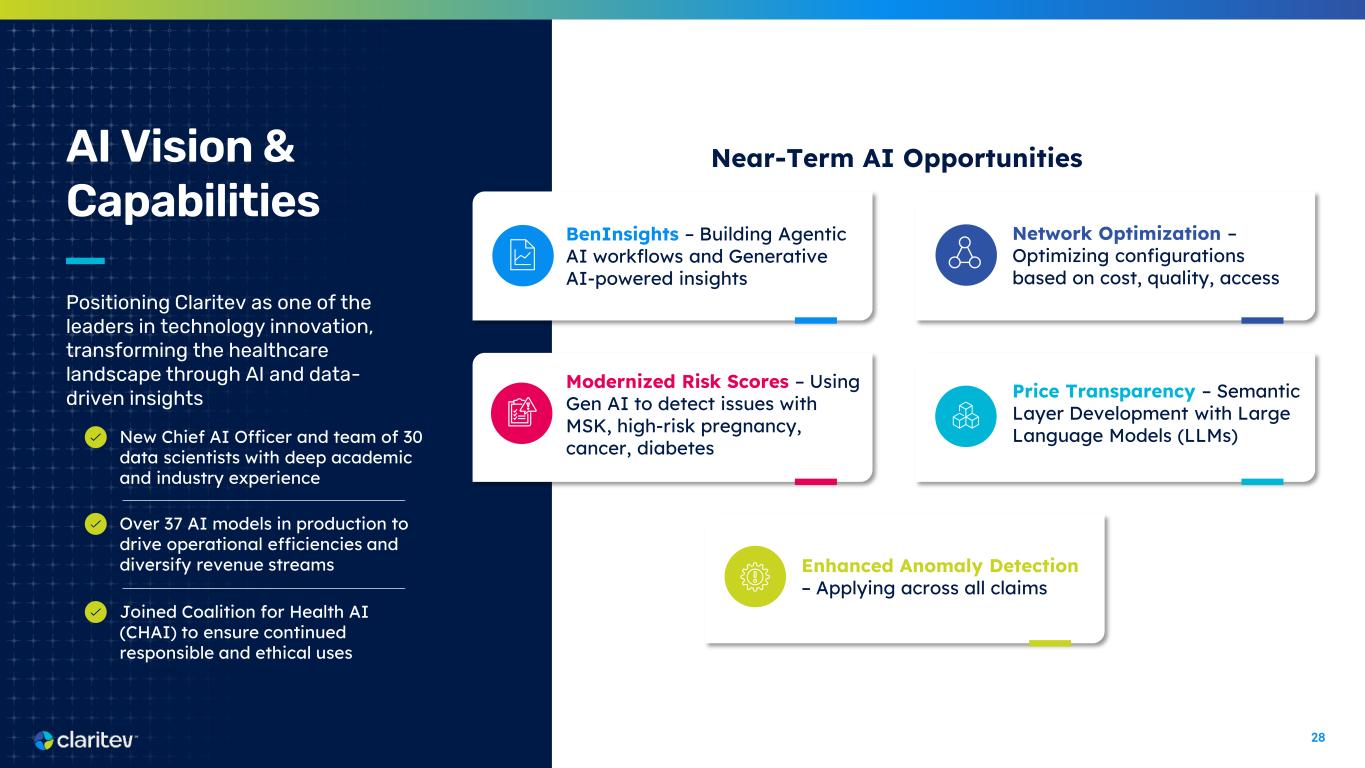
28 AI Vision & Capabilities Positioning Claritev as one of the leaders in technology innovation, transforming the healthcare landscape through AI and data- driven insights BenInsights – Building Agentic AI workflows and Generative AI-powered insights Modernized Risk Scores – Using Gen AI to detect issues with MSK, high-risk pregnancy, cancer, diabetes Enhanced Anomaly Detection – Applying across all claims Network Optimization – Optimizing configurations based on cost, quality, access Price Transparency – Semantic Layer Development with Large Language Models (LLMs)New Chief AI Officer and team of 30 data scientists with deep academic and industry experience Over 37 AI models in production to drive operational efficiencies and diversify revenue streams Joined Coalition for Health AI (CHAI) to ensure continued responsible and ethical uses Near-Term AI Opportunities

29 Financial Overview
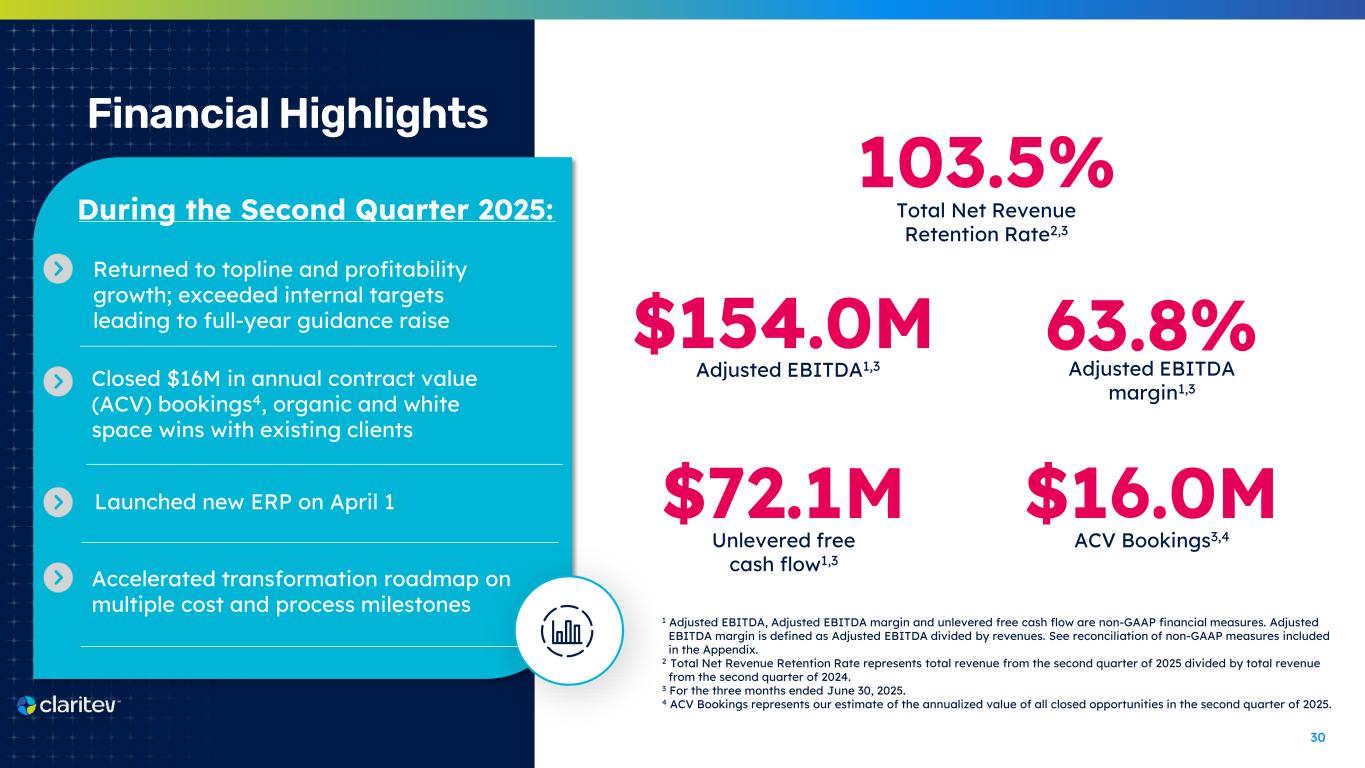
30 Financial Highlights During the Second Quarter 2025: $154.0M $72.1M 103.5% Adjusted EBITDA1,3 63.8% Adjusted EBITDA margin1,3 Unlevered free cash flow1,3 $16.0M ACV Bookings3,4 Total Net Revenue Retention Rate2,3 1 Adjusted EBITDA, Adjusted EBITDA margin and unlevered free cash flow are non-GAAP financial measures. Adjusted EBITDA margin is defined as Adjusted EBITDA divided by revenues. See reconciliation of non-GAAP measures included in the Appendix. 2 Total Net Revenue Retention Rate represents total revenue from the second quarter of 2025 divided by total revenue from the second quarter of 2024. 3 For the three months ended June 30, 2025. 4 ACV Bookings represents our estimate of the annualized value of all closed opportunities in the second quarter of 2025. Closed $16M in annual contract value (ACV) bookings4, organic and white space wins with existing clients Launched new ERP on April 1 Returned to topline and profitability growth; exceeded internal targets leading to full-year guidance raise Accelerated transformation roadmap on multiple cost and process milestones
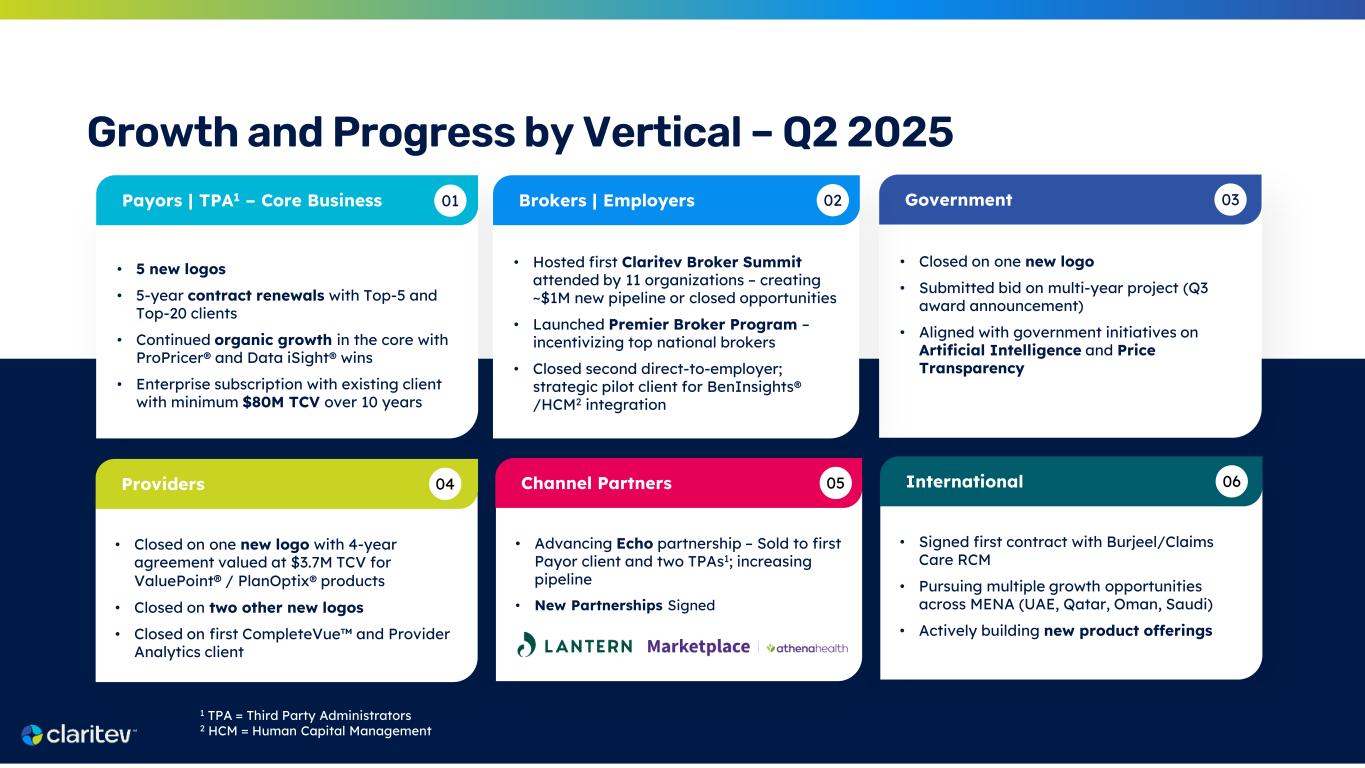
31 Growth and Progress by Vertical – Q2 2025 • 5 new logos • 5-year contract renewals with Top-5 and Top-20 clients • Continued organic growth in the core with ProPricer® and Data iSight® wins • Enterprise subscription with existing client with minimum $80M TCV over 10 years Payors | TPA1 – Core Business 01 • Closed on one new logo • Submitted bid on multi-year project (Q3 award announcement) • Aligned with government initiatives on Artificial Intelligence and Price Transparency Government 03 • Hosted first Claritev Broker Summit attended by 11 organizations – creating ~$1M new pipeline or closed opportunities • Launched Premier Broker Program – incentivizing top national brokers • Closed second direct-to-employer; strategic pilot client for BenInsights® /HCM2 integration Brokers | Employers 02 • Closed on one new logo with 4-year agreement valued at $3.7M TCV for ValuePoint® / PlanOptix® products • Closed on two other new logos • Closed on first CompleteVue and Provider Analytics client Providers 04 • Advancing Echo partnership – Sold to first Payor client and two TPAs1; increasing pipeline • New Partnerships Signed Channel Partners 05 • Signed first contract with Burjeel/Claims Care RCM • Pursuing multiple growth opportunities across MENA (UAE, Qatar, Oman, Saudi) • Actively building new product offerings International 06 1 TPA = Third Party Administrators 2 HCM = Human Capital Management
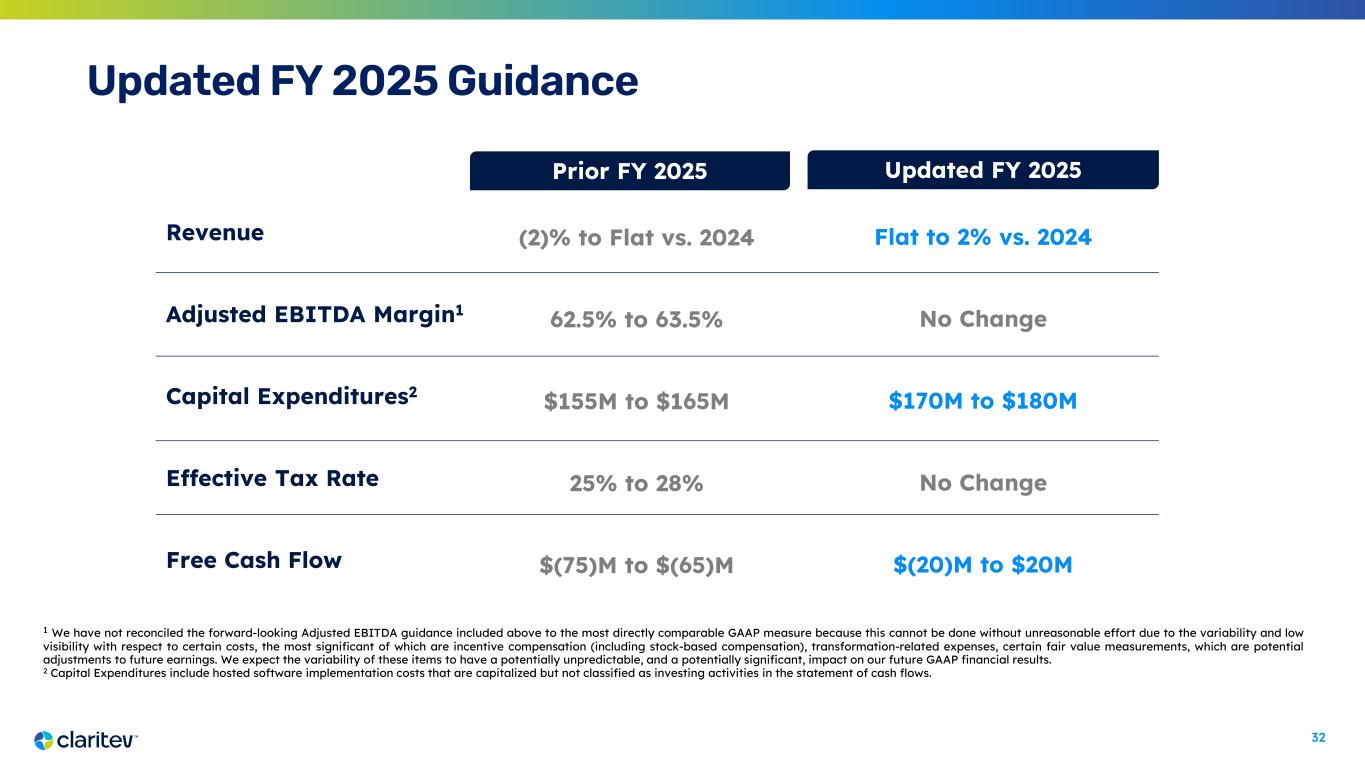
32 1 We have not reconciled the forward-looking Adjusted EBITDA guidance included above to the most directly comparable GAAP measure because this cannot be done without unreasonable effort due to the variability and low visibility with respect to certain costs, the most significant of which are incentive compensation (including stock-based compensation), transformation-related expenses, certain fair value measurements, which are potential adjustments to future earnings. We expect the variability of these items to have a potentially unpredictable, and a potentially significant, impact on our future GAAP financial results. 2 Capital Expenditures include hosted software implementation costs that are capitalized but not classified as investing activities in the statement of cash flows. Revenue Adjusted EBITDA Margin1 Capital Expenditures2 Effective Tax Rate Free Cash Flow Flat to 2% vs. 2024 No Change $170M to $180M No Change $(20)M to $20M (2)% to Flat vs. 2024 62.5% to 63.5% $155M to $165M 25% to 28% $(75)M to $(65)M Prior FY 2025 Updated FY 2025 Updated FY 2025 Guidance
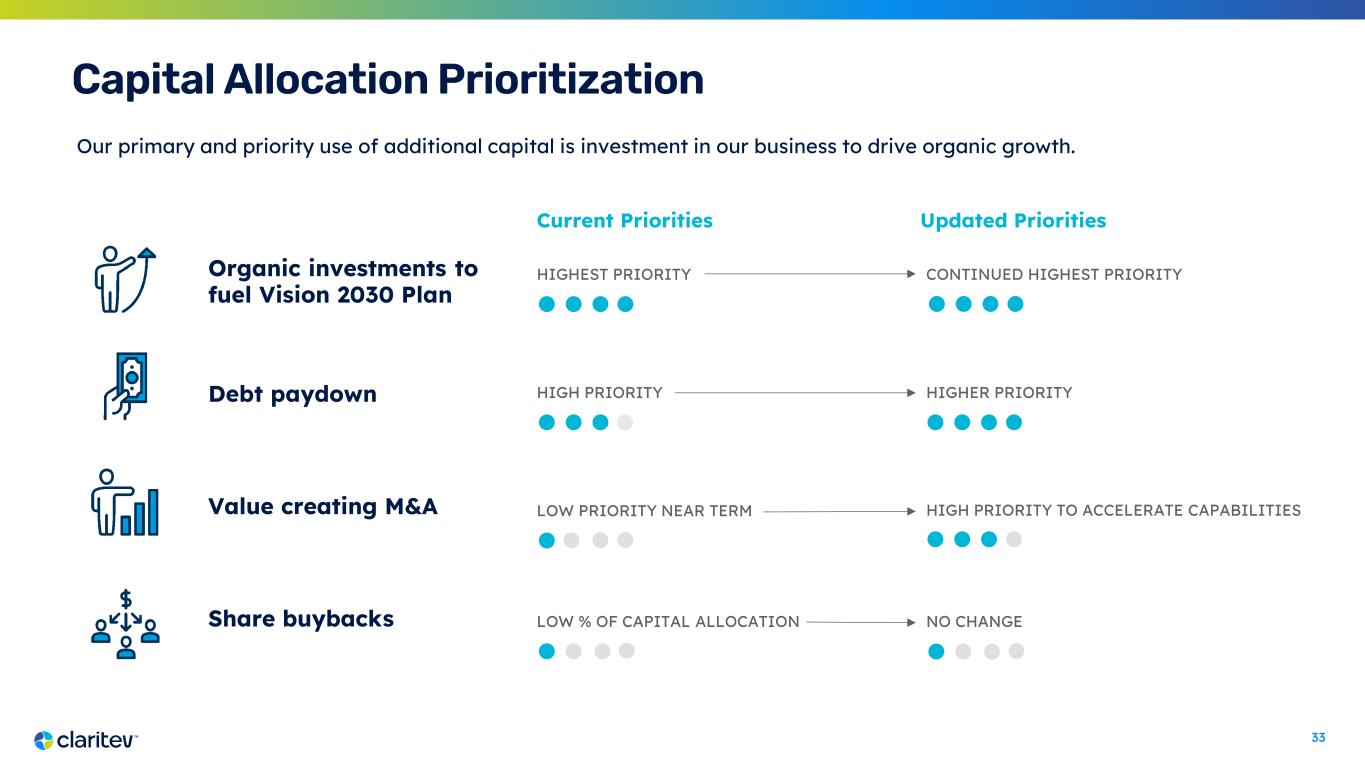
33 Capital Allocation Prioritization Our primary and priority use of additional capital is investment in our business to drive organic growth. HIGHEST PRIORITYOrganic investments to fuel Vision 2030 Plan Debt paydown Value creating M&A Share buybacks HIGH PRIORITY LOW PRIORITY NEAR TERM LOW % OF CAPITAL ALLOCATION Current Priorities Updated Priorities CONTINUED HIGHEST PRIORITY HIGHER PRIORITY HIGH PRIORITY TO ACCELERATE CAPABILITIES NO CHANGE

34 Strategic Growth Initiatives
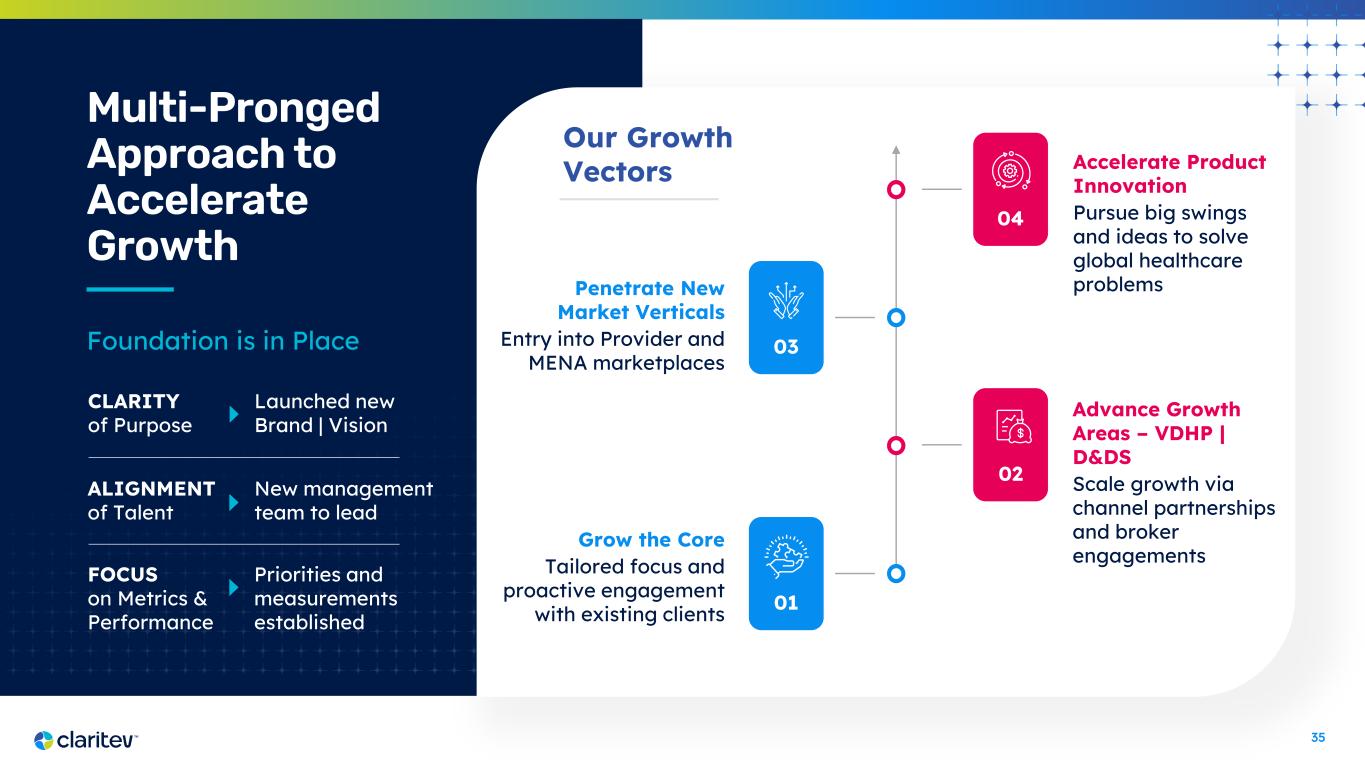
35 Foundation is in Place Multi-Pronged Approach to Accelerate Growth 04 03 02 01 Grow the Core Tailored focus and proactive engagement with existing clients Penetrate New Market Verticals Entry into Provider and MENA marketplaces Accelerate Product Innovation Pursue big swings and ideas to solve global healthcare problems Advance Growth Areas – VDHP | D&DS Scale growth via channel partnerships and broker engagements Our Growth Vectors CLARITY of Purpose Launched new Brand | Vision ALIGNMENT of Talent New management team to lead FOCUS on Metrics & Performance Priorities and measurements established
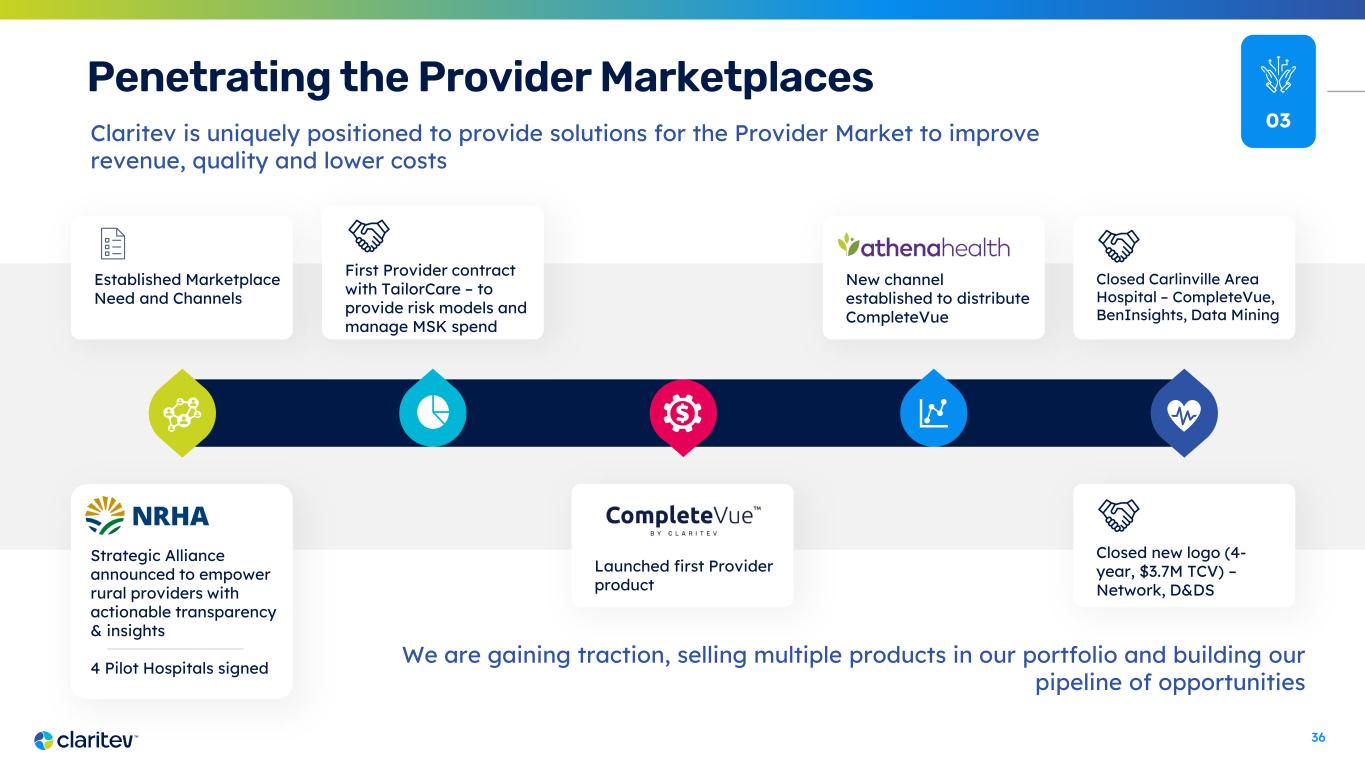
36 Penetrating the Provider Marketplaces 03 Established Marketplace Need and Channels First Provider contract with TailorCare – to provide risk models and manage MSK spend New channel established to distribute CompleteVue Closed Carlinville Area Hospital – CompleteVue, BenInsights, Data Mining Strategic Alliance announced to empower rural providers with actionable transparency & insights 4 Pilot Hospitals signed Launched first Provider product Claritev is uniquely positioned to provide solutions for the Provider Market to improve revenue, quality and lower costs Closed new logo (4- year, $3.7M TCV) – Network, D&DS We are gaining traction, selling multiple products in our portfolio and building our pipeline of opportunities
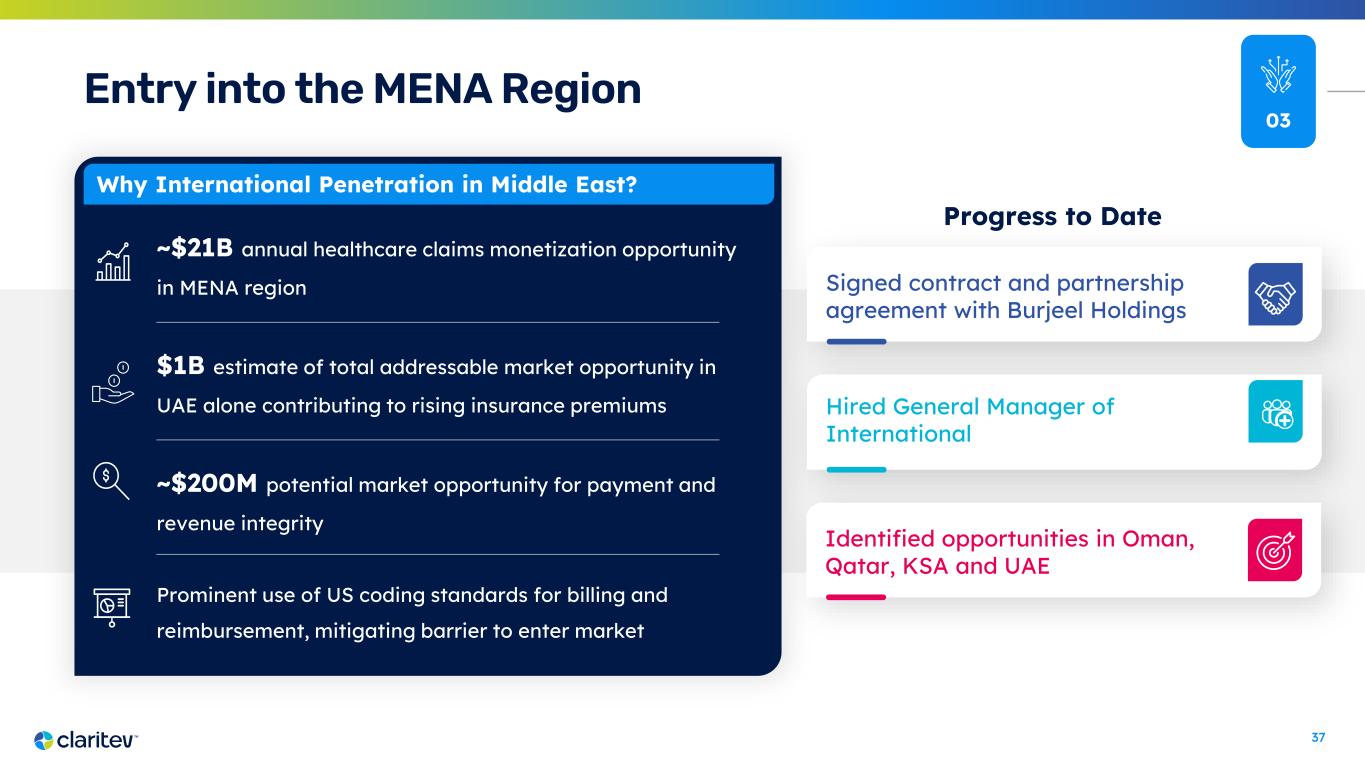
37 Why International Penetration in Middle East? ~$21B annual healthcare claims monetization opportunity in MENA region $1B estimate of total addressable market opportunity in UAE alone contributing to rising insurance premiums ~$200M potential market opportunity for payment and revenue integrity Prominent use of US coding standards for billing and reimbursement, mitigating barrier to enter market 03 Entry into the MENA Region Signed contract and partnership agreement with Burjeel Holdings Hired General Manager of International Progress to Date Identified opportunities in Oman, Qatar, KSA and UAE
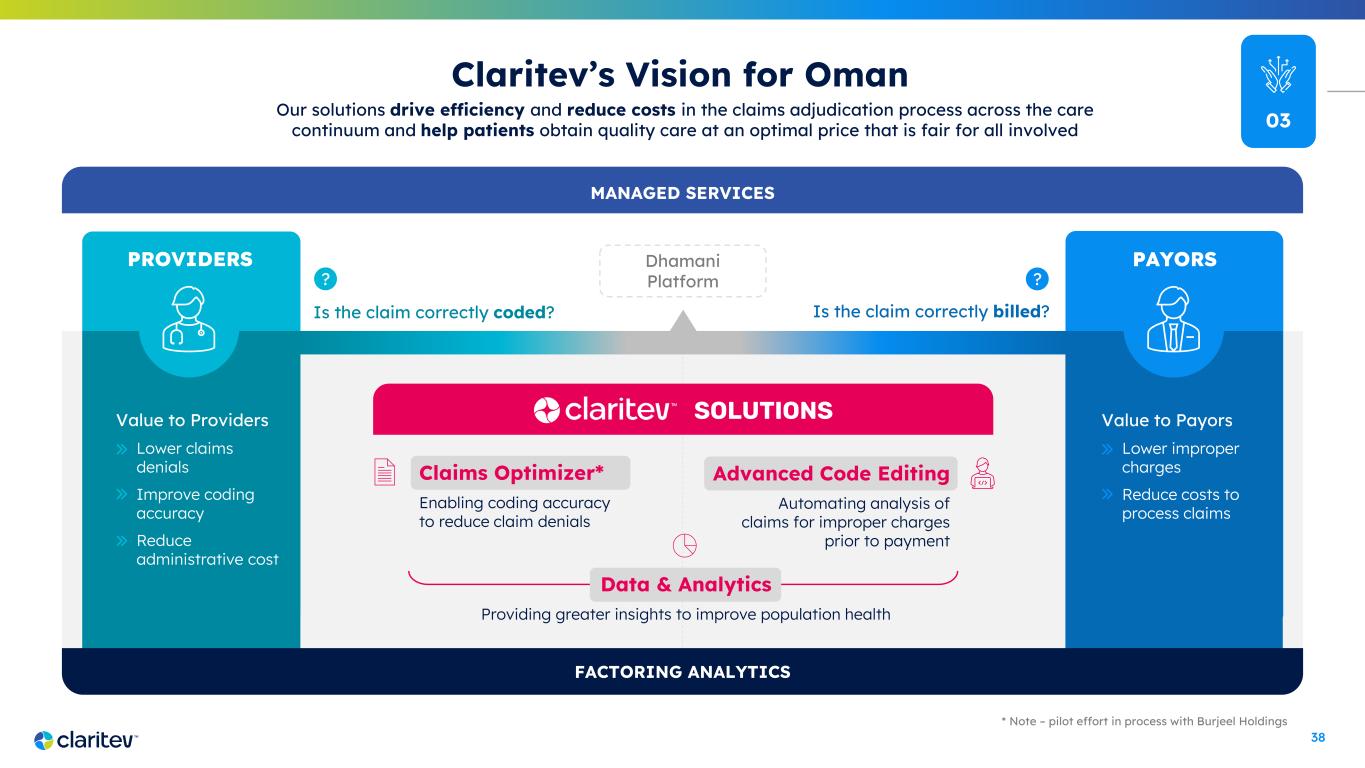
38 Claims Optimizer* Enabling coding accuracy to reduce claim denials PROVIDERS Dhamani Platform Claritev’s Vision for Oman Is the claim correctly billed?Is the claim correctly coded? Our solutions drive efficiency and reduce costs in the claims adjudication process across the care continuum and help patients obtain quality care at an optimal price that is fair for all involved SOLUTIONSValue to Providers Lower claims denials Improve coding accuracy Reduce administrative cost * Note – pilot effort in process with Burjeel Holdings FACTORING ANALYTICS MANAGED SERVICES PAYORS Value to Payors Lower improper charges Reduce costs to process claims Data & Analytics Providing greater insights to improve population health Advanced Code Editing Automating analysis of claims for improper charges prior to payment ?? 03
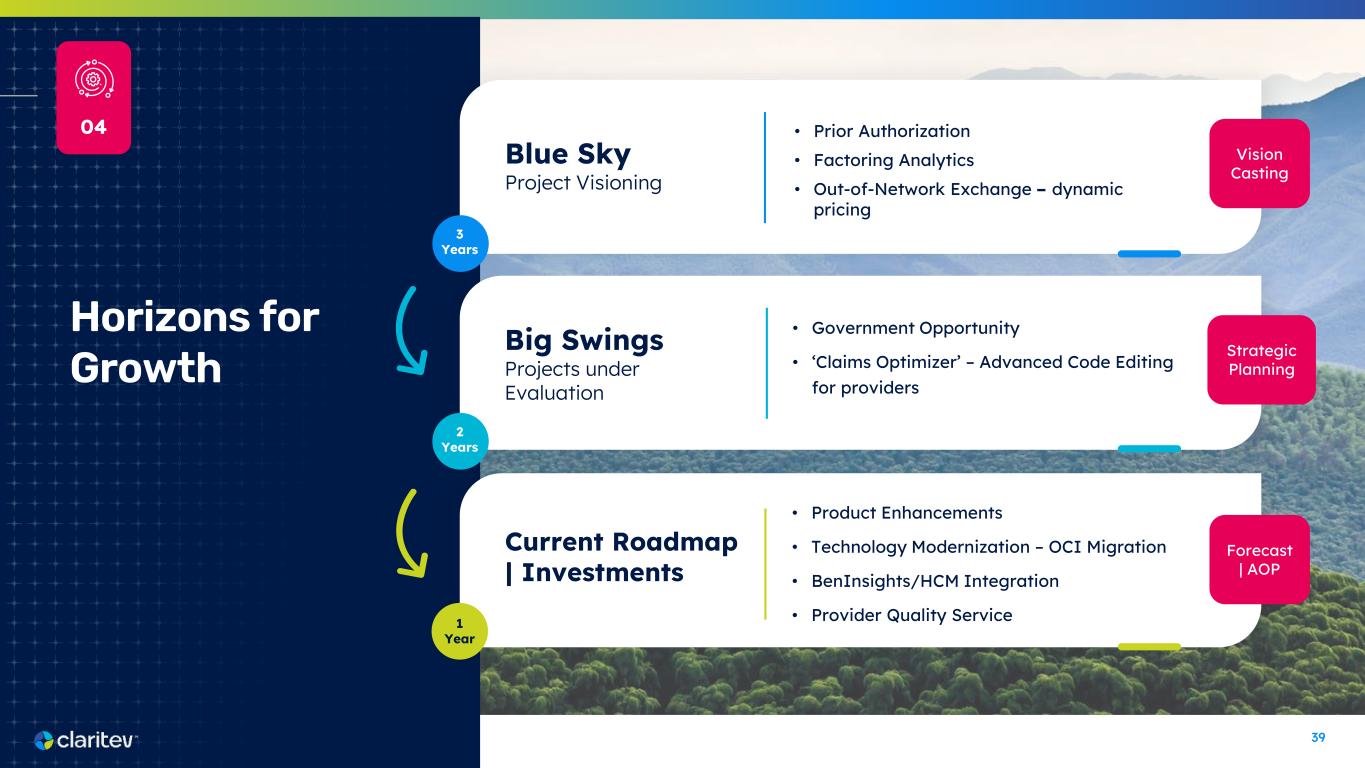
39 Horizons for Growth 1 Year 3 Years 2 Years Current Roadmap | Investments • Product Enhancements • Technology Modernization – OCI Migration • BenInsights/HCM Integration • Provider Quality Service Forecast | AOP Big Swings Projects under Evaluation • Government Opportunity • ‘Claims Optimizer’ – Advanced Code Editing for providers Blue Sky Project Visioning • Prior Authorization • Factoring Analytics • Out-of-Network Exchange – dynamic pricing Strategic Planning Vision Casting 04
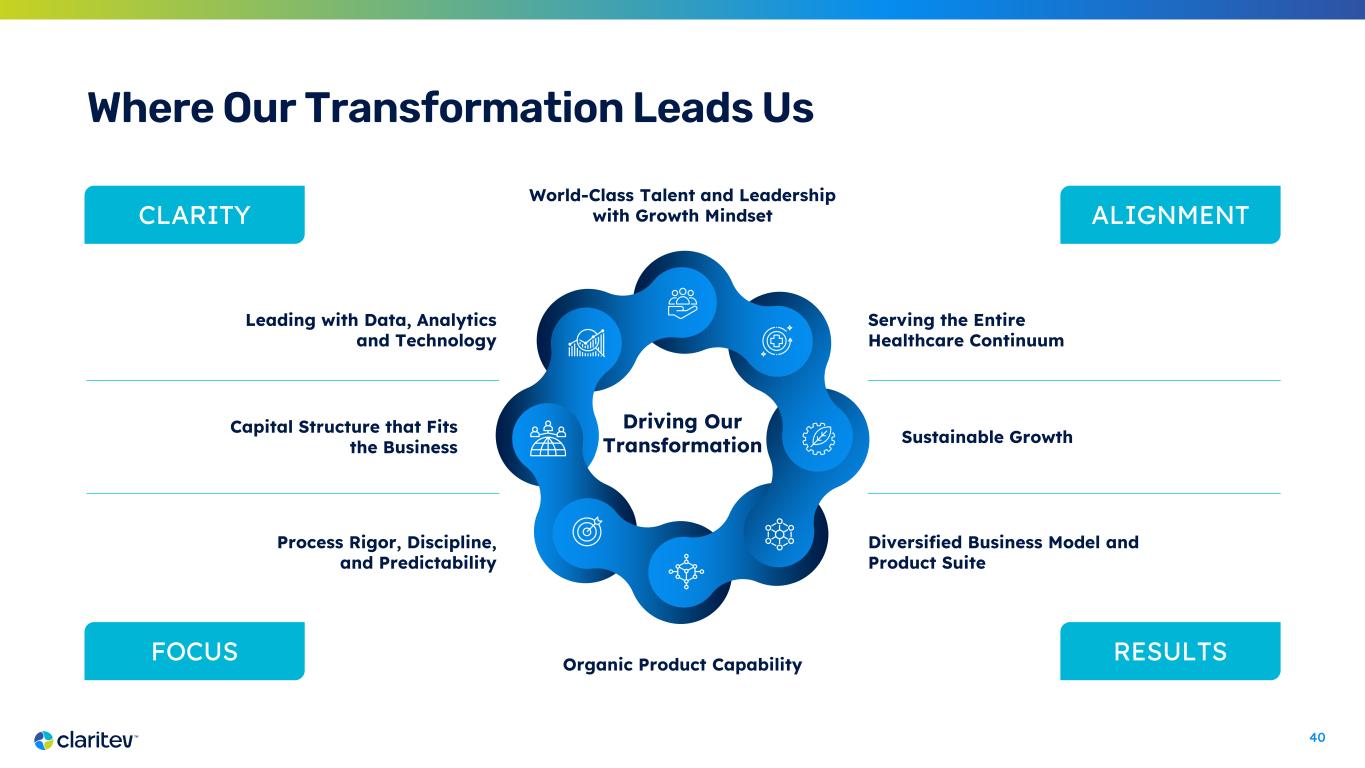
40 Where Our Transformation Leads Us World-Class Talent and Leadership with Growth Mindset Serving the Entire Healthcare Continuum Sustainable Growth Diversified Business Model and Product Suite Organic Product Capability Leading with Data, Analytics and Technology Capital Structure that Fits the Business Process Rigor, Discipline, and Predictability CLARITY ALIGNMENT FOCUS RESULTS Driving Our Transformation