2026
NOTICE OF ANNUAL
MEETING OF STOCKHOLDERS
AND PROXY STATEMENT

2 | 2026 PROXY STATEMENT |


3 | 2026 PROXY STATEMENT |


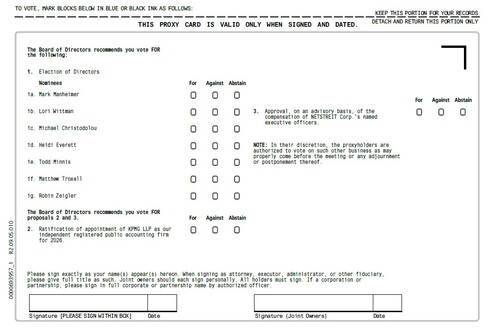
1 | To elect the seven nominees to the Board of Directors (the “Board”) named in the accompanying proxy statement (the “Proxy Statement”) to hold office until the 2027 Annual Meeting of Stockholders or until their successors are duly elected and qualify (Proposal One); | ||
2 | To ratify the retention of KPMG LLP as our independent registered public accounting firm for the fiscal year ending December 31, 2026 (Proposal Two); | ||
3 | To approve, on an advisory basis, the compensation of the Company’s named executive officers as disclosed in the Proxy Statement (Proposal Three); and | ||
4 | To transact such other business as may properly come before the Annual Meeting or any adjournments or postponements thereof. |


4 | 2026 PROXY STATEMENT |
5 | 2026 PROXY STATEMENT |
6 | 2026 PROXY STATEMENT |
Proposal | Our Board’s Recommendation | ||
FOR | |||
FOR | |||
FOR | |||
YOUR VOTE IS IMPORTANT. WHETHER OR NOT YOU PLAN TO ATTEND THE ANNUAL MEETING, PLEASE VOTE YOUR SHARES OVER THE TELEPHONE, VIA THE INTERNET OR BY COMPLETING, DATING, SIGNING AND RETURNING A PROXY CARD, AS DESCRIBED IN THE PROXY STATEMENT. YOUR PROMPT COOPERATION IS GREATLY APPRECIATED. | |||
Name | Director Since | Board Committees | ||||||||||||
Independent | Audit | Comp | Nominating | Investment | ||||||||||
Mark Manheimer | 2019 | |||||||||||||
Lori Wittman | 2019 |  |  | | ||||||||||
Michael Christodolou | 2020 | | | | ||||||||||
Heidi Everett | 2020 | | | | ||||||||||
Todd Minnis | 2019 | | | | ||||||||||
Matthew Troxell | 2019 | | | | ||||||||||
Robin Zeigler | 2020 | | | | ||||||||||

7 | 2026 PROXY STATEMENT |
Portfolio Metrics | December 31, 2025 | |||
Annualized Base Rent (“ABR”)(1) (in thousands) | $198,252 | |||
Number of investments(2) | 761 | |||
Number of states | 45 | |||
Square feet | 13,721,337 | |||
Tenants | 129 | |||
Industries | 28 | |||
Occupancy(3) | 99.9% | |||
Weighted average lease term remaining (years)(4) | 10.1 | |||


8 | 2026 PROXY STATEMENT |
Environmental | Social | Governance | |||
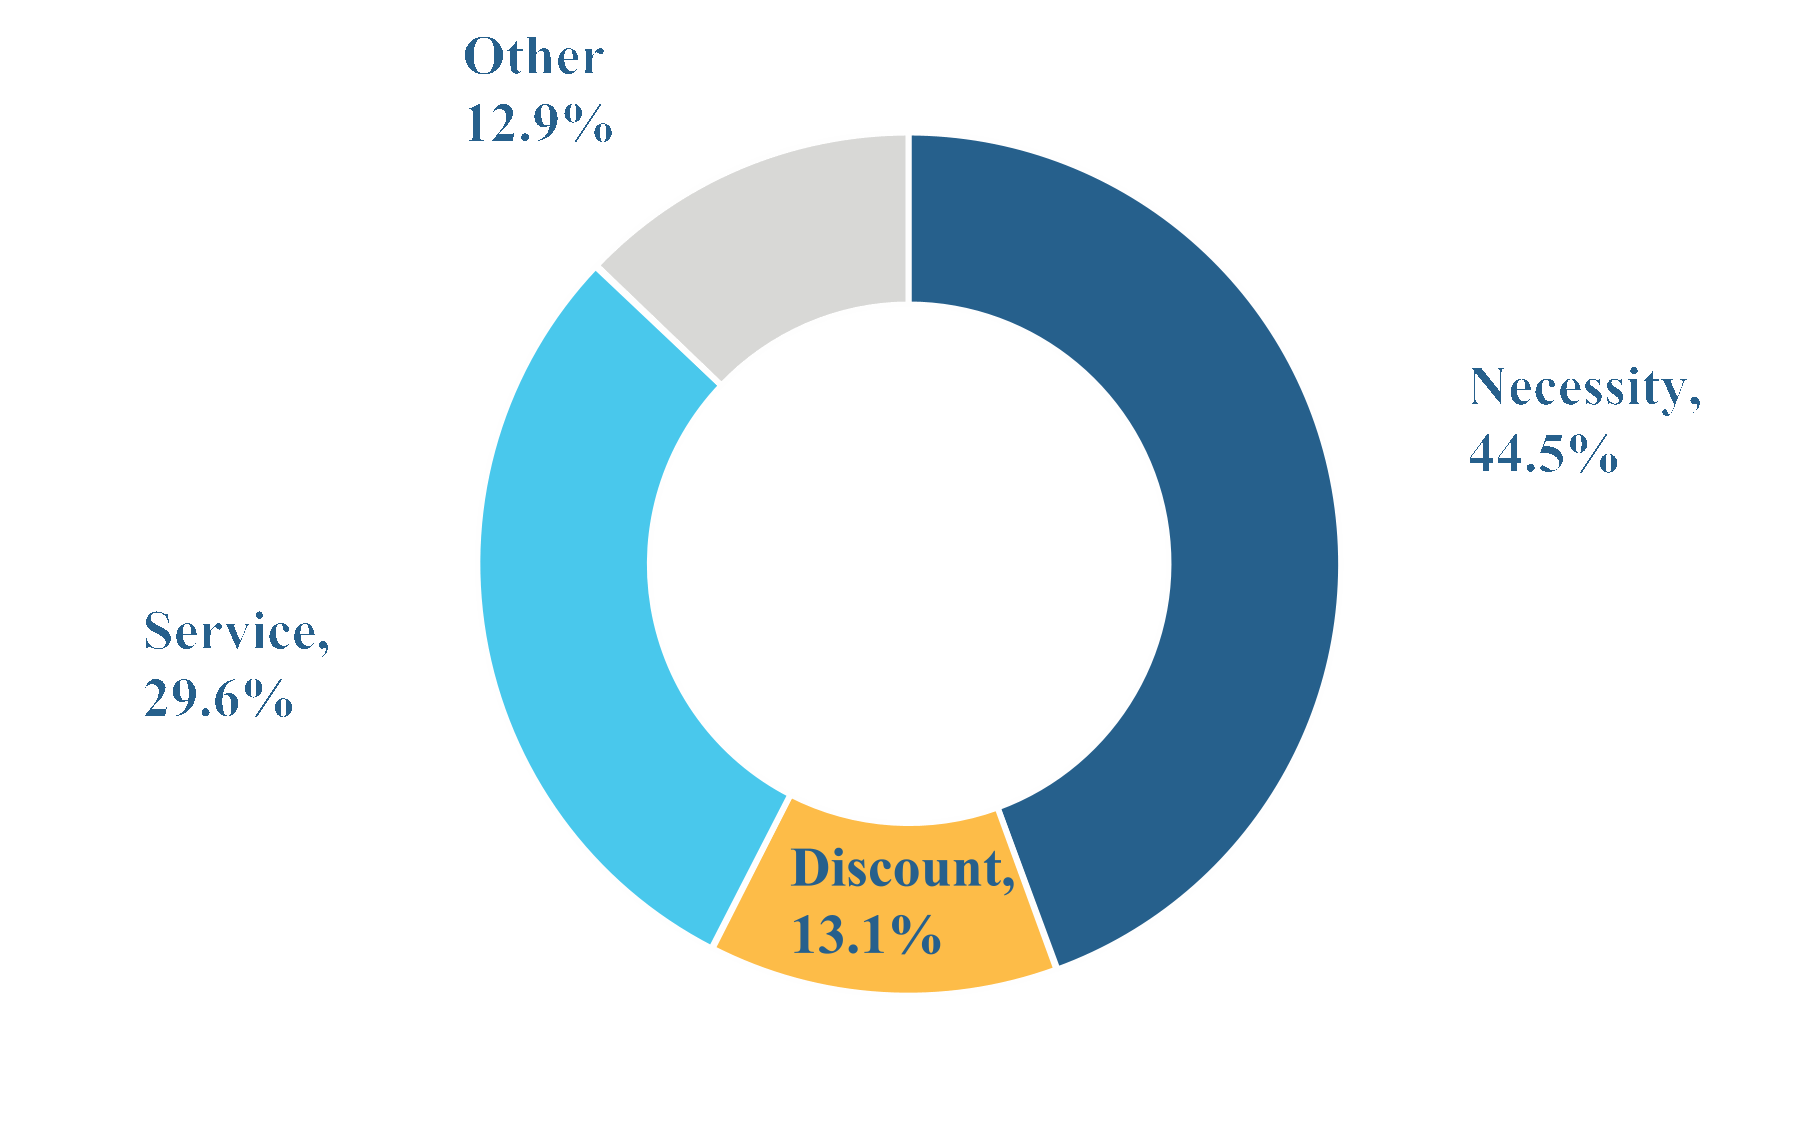
•Consider tenants’ commitment to ESG as part of our investment process •As of December 31, 2025, 16 of our top 20 tenants had ESG commitments, representing 83% of ABR of our top 20 tenants and 44% of our total ABR •Elements of our headquarters, such as building automation systems, lighting controls, green cleaning, and recycling programs, significantly decrease natural resource use by conserving energy and water, minimizing waste, and reducing CO2 emissions •We adopted green lease language in our standard lease form and corporate policies, and have executed leases with numerous tenants to better collaborate with tenants in sharing data •Annual participation in GRESB public disclosure submission •Annual calculation of Scope 1 and Scope 2 Greenhouse Gas inventory | •Competitive compensation and benefits, including stock awards for all employees •Employee Experience Committee facilitates employee feedback on workplace experiences •We partner with local charities providing volunteer hours and financial contributions to give back to the community •Maintain Human Rights Policy to advance fundamental human rights within our Company •Annual Employee Engagement Survey | •43% of our Board, including 50% of our independent directors, are women •29% of our directors are racially or ethnically diverse •Six out of seven directors are independent •Independent committees •Separate Chair of the Board and CEO •Directors elected annually •Directors are elected by majority of votes cast in uncontested elections with a director resignation policy •Annual director and committee assessments •We have opted out of the Maryland Control Share Acquisition Act of the MGCL, and we may not opt into the provisions of the Maryland Control Share Acquisition Act without the approval of our stockholders •No poison pill or differential voting stock structure to chill shareholder participation •Our Bylaws may be amended by the vote of stockholders entitled to cast at least a majority of the votes entitled to be cast upon at a duly organized meeting of stockholders •Our Nominating and Corporate Governance Committee reviews and recommends ESG policies and procedures | |||
9 | 2026 PROXY STATEMENT |
Name | Position | ||
Mark Manheimer | Director, President, Chief Executive Officer and Secretary | ||
Lori Wittman | Chair of the Board | ||
Michael Christodolou | Director | ||
Heidi Everett | Director | ||
Todd Minnis | Director | ||
Matthew Troxell | Director | ||
Robin Zeigler | Director |
10 | 2026 PROXY STATEMENT |


11 | 2026 PROXY STATEMENT |


12 | 2026 PROXY STATEMENT |


13 | 2026 PROXY STATEMENT |

Mark Manheimer | Lori Wittman | Michael Christodolou | Heidi Everett | Todd Minnis | Matthew Troxell | Robin Zeigler | |||||||||
Expertise | |||||||||||||||
Other Public Company Board | ✓ | ✓ | ✓ | ||||||||||||
Public Company CEO | ✓ | ||||||||||||||
Public Company CFO | ✓ | ||||||||||||||
Executive Management | ✓ | ✓ | ✓ | ✓ | ✓ | ✓ | |||||||||
Real Estate | ✓ | ✓ | ✓ | ✓ | ✓ | ✓ | ✓ | ||||||||
REIT | ✓ | ✓ | ✓ | ✓ | ✓ | ✓ | |||||||||
Capital Markets | ✓ | ✓ | ✓ | ✓ | ✓ | ✓ | ✓ | ||||||||
Strategic Planning/M&A | ✓ | ✓ | ✓ | ✓ | ✓ | ✓ | ✓ | ||||||||
External Risk Oversight | ✓ | ✓ | ✓ | ✓ | ✓ | ✓ | |||||||||
Internal Risk Oversight | ✓ | ✓ | ✓ | ✓ | ✓ | ✓ | ✓ | ||||||||
Human Capital Management | ✓ | ✓ | ✓ | ✓ | ✓ | ✓ | |||||||||
Legal/Regulatory | ✓ | ✓ | ✓ | ✓ | ✓ | ||||||||||
Technology | ✓ | ✓ | ✓ | ✓ | ✓ | ||||||||||
Growth Company Experience | ✓ | ✓ | ✓ | ✓ | ✓ | ✓ | ✓ | ||||||||
ESG | ✓ | ✓ | ✓ | ✓ | ✓ | ✓ | ✓ | ||||||||
Marketing | ✓ | ✓ | ✓ | ✓ | ✓ | ✓ | |||||||||
14 | 2026 PROXY STATEMENT |

15 | 2026 PROXY STATEMENT |
16 | 2026 PROXY STATEMENT |


17 | 2026 PROXY STATEMENT |

18 | 2026 PROXY STATEMENT |
Board Committees | |||||||||||||
Name | Director Since | Independent | Audit | Comp | Nominating | Investment | |||||||
Mark Manheimer | 2019 | ||||||||||||
Lori Wittman | 2019 | | | | |||||||||
Michael Christodolou | 2020 | | | | |||||||||
Heidi Everett | 2020 | | | | |||||||||
Todd Minnis | 2019 | | | | |||||||||
Matthew Troxell | 2019 | | | | |||||||||
Robin Zeigler | 2020 | | | | |||||||||


19 | 2026 PROXY STATEMENT |
20 | 2026 PROXY STATEMENT |
Name | Fees Earned or Paid in Cash ($) | Stock Awards ($)(1) | Total ($) | ||||
Lori Wittman | 137,500 | 105,000 | 242,500 | ||||
Michael Christodolou | 97,500 | 105,000 | 202,500 | ||||
Heidi Everett | 85,000 | 105,000 | 190,000 | ||||
Todd Minnis | 92,500 | 105,000 | 197,500 | ||||
Matthew Troxell | 95,000 | 105,000 | 200,000 | ||||
Robin Zeigler | 92,500 | 105,000 | 197,500 | ||||
21 | 2026 PROXY STATEMENT |
Common Stock and Securities Exchangeable for Common Stock | |||||
Name of Beneficial Owner | Number of Shares of Common Stock Beneficially Owned | Percent of Class(1) | |||
5% or Greater Stockholders | |||||
Affiliates of Cohen & Steers, Inc.(2) | 13,224,279 | 13.6% | |||
Principal Real Estate Investors, LLC (3) | 8,935,308 | 9.2% | |||
Blackrock, Inc.(4) | 8,908,035 | 9.2% | |||
The Vanguard Group(5) | 7,352,295 | 7.6% | |||
Millennium Management LLC (6) | 5,246,726 | 5.4% | |||
Named Executive Officers and Directors | |||||
Mark Manheimer | 410,260 | * | |||
Daniel Donlan(7) | 48,259 | * | |||
Lori Wittman(8) | 30,065 | * | |||
Michael Christodolou | 34,264 | * | |||
Heidi Everett | 25,248 | * | |||
Todd Minnis | 22,744 | * | |||
Matthew Troxell | 43,998 | * | |||
Robin Zeigler | 25,536 | * | |||
All executive officers and directors as a group (8 persons) | 640,374 | * | |||
22 | 2026 PROXY STATEMENT |
Named Executive Officer | Title | ||
Mark Manheimer | President, Chief Executive Officer and Secretary | ||
Daniel Donlan | Chief Financial Officer and Treasurer |


✓ | What We Do: | X | What We Don’t Do: | ||
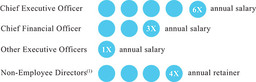
✓ | We Pay for Performance: A substantial portion of our compensation is not guaranteed but rather is at risk in that it is linked to the achievement of key operating and financial goals as measured by clear pre-established metrics. For 2025, 84% of our CEO’s target compensation and 75% of our CFO’s target compensation was performance-based and/or at-risk. Performance- based equity for our CEO represents 60% of his annual long-term incentive opportunity (as compared to an average of only 45% in our peer group) | X | No Automatic Salary Increases or Guaranteed Bonuses: We do not guarantee annual salary increases or bonuses and none of the employment agreements with our named executive officers contain such provisions. | ||
✓ | We Balance Short-Term and Long-Term Incentives: Our incentive programs provide a balance of annual and longer-term incentives, including a variety of performance metrics that measure both absolute and relative performance. | X | No Guaranteed Incentives: We do not provide multi-year guaranteed incentive awards for our named executive officers. | ||
23 | 2026 PROXY STATEMENT |
✓ | What We Do: | X | What We Don’t Do: | ||
✓ | X | No Current Payment of Dividends or Dividend Equivalents on Unvested Awards: Dividend equivalents accrue during the vesting period and are only paid to the extent the underlying awards vest. | |||
✓ | We Seek the Input of our Stockholders: Annually, we present our executive compensation to a “Say-on-Pay” vote by our stockholders. | X | No Excessive Perquisites: We generally do not provide perquisites or personal benefits to our named executive officers. | ||
✓ | We Seek Alignment with Our Stockholders: We require both our named executive officers and our directors to maintain a meaningful ownership stake in the Company through our stock ownership policy. We also design our executive compensation program to align with long-term objectives that support the creation of stockholder value. | X | No Hedging or Pledging: We have policies that prohibit our directors, officers and employees from (1) entering into hedging or monetization transactions involving Company stock and (2) holding Company stock in a margin account or pledging Company stock as collateral for a loan. | ||
✓ | We Align Compensation Practices with Market: As part of our annual review of executive compensation, we evaluate and consider market data for applicable peers. | X | No Tax Gross-Ups: We do not provide tax gross-ups on any severance, change-in-control or other payments. | ||
✓ | We Retain an Independent Compensation Consultant: Our Compensation Committee engages an independent compensation consultant to provide guidance on a variety of compensation matters. | X | No Automatic Change in Control Acceleration: We do not provide “single-trigger” accelerated vesting of equity-based awards upon a change in control. See “— Potential Payments Upon Termination or Change in Control” below. | ||
24 | 2026 PROXY STATEMENT |
2025 Peer Group(1) | |||
Agree Realty (ADC) | Getty Realty (GTY) | ||
Chatham Lodging Trust (CLDT) | Peakstone Realty Trust (PKST) | ||
Community Healthcare Trust (CHCT) | Plymouth Industrial REIT (PLYM) | ||
Essential Properties Realty Trust (EPRT) | Retail Opportunity Investments (ROIC) | ||
Four Corners Property Trust (FCPT) | Sila Realty Trust (SILA) | ||
FrontView FREIT (FVR) | Urban Edge Properties (UE) | ||
Executive Compensation Component | Mark Manheimer | Daniel Donlan | |||
Base Salary ($) | 700,000 | 400,000 | |||
(year-over-year change) | (no change) | (increased from 375,000) | |||
Target STI ($) | 700,000 | 425,000 | |||
(year-over-year change) | (no change) | (no change) | |||
Target LTI ($) | 3,000,000 | 700,000 | |||
(year-over-year change) | (no change) | (no change) | |||
Target Total Compensation ($) | 4,400,000 | 1,525,000 | |||
(year-over-year change) | (no change) | (increased from 1,500,000) |
25 | 2026 PROXY STATEMENT |
Name | 2025 Base Salary Rate ($) (Effective January 1, 2025) | |||
Mark Manheimer | 700,000 | |||
Daniel Donlan | 400,000 | |||
Short-Term Incentive Opportunity as % of Base Salary(1) | ||||||||||
Name | Threshold | Target | Maximum | Target STI ($) | ||||||
Mark Manheimer | 50% | 100% | 200% | 700,000 | ||||||
Daniel Donlan | 53% | 106% | 212% | 425,000 | ||||||
Corporate Performance Goal | Weighting | Threshold (50%) | Target (100%) | Maximum (200%) | Actual Performance | Achievement Level (% of Target) | Weighted Payout | |||||||||
AFFO/Share(1) | 35% | $1.27 | $1.29 | $1.31 | $1.31 | 200.0% | 70.0% | |||||||||
Tenant Concentration: Top 5(2) | 0 . 1 | 10% | 0 . 2 7 5 | 30% | 0 . 2 4 9 8 | 28% | 0 . 2 | 25% | 25.0% | 200.0% | 20.0% | |||||
Tenant Concentration: Top 10(2) | 0 . 0 5 | 5% | 0 . 4 2 5 | 45% | 0 . 4 0 2 3 | 43% | 9 . 5 5 | 40% | 40.2% | 191.0% | 9.6% | |||||
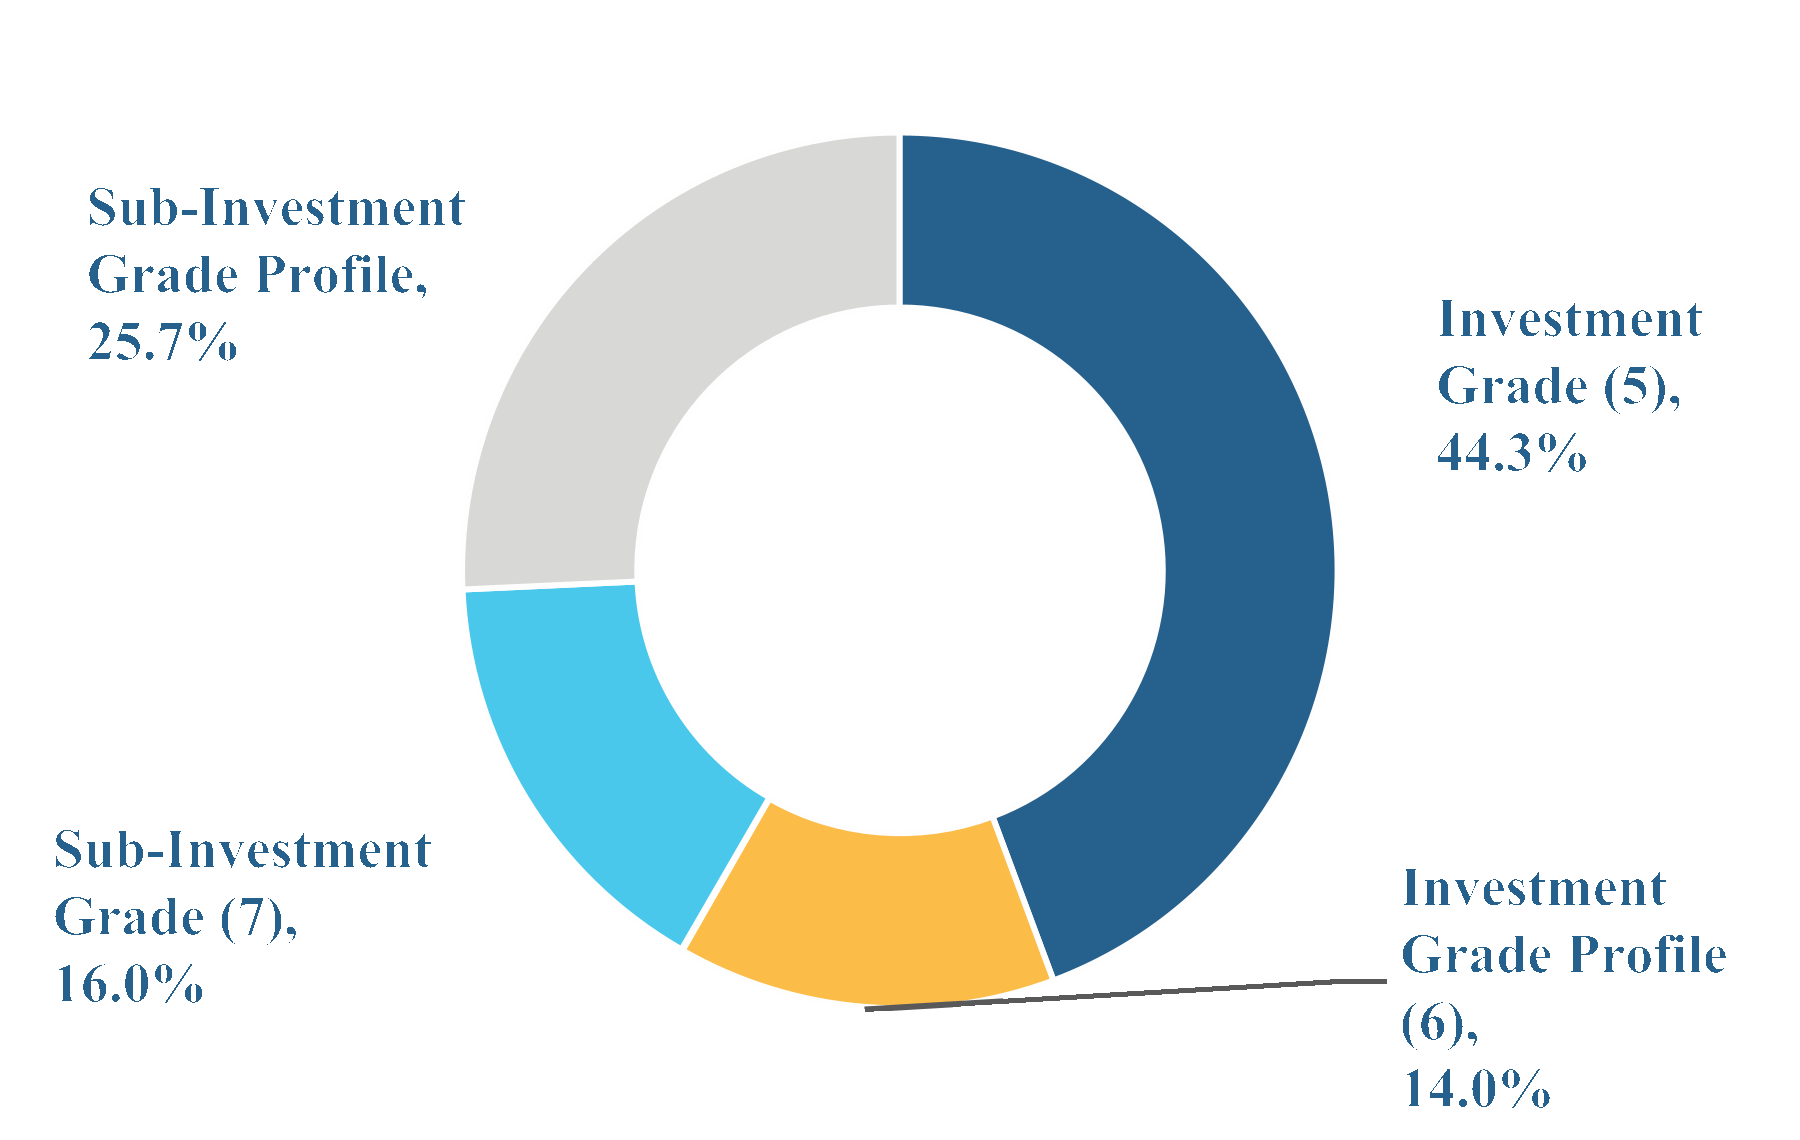
Portfolio Credit: Investment Grade Profile %(3) | 5% | 63% | 65% | 68% | 65.0% | 99.0% | 5.0% | |||||||||
Portfolio Credit: Investment Grade %(3) | 5% | 48% | 50% | 53% | 49.5% | 90.5% | 4.5% | |||||||||
Leverage(4) | 20% | 5.25x | 5.00x | 4.25x | 4.25x | 200.0% | 40.0% | |||||||||
Subjective(5) | 20% | 1 | 3 | 5 | 4 | 150.0% | 30.0% | |||||||||
Total: | 100% | 179.0% |
26 | 2026 PROXY STATEMENT |
Name | 2025 Annual STI Payout Percentage (% of Target) | 2025 Annual STI ($)(1) | ||||
Mark Manheimer | 179.0% | 1,253,175 | ||||
Daniel Donlan | 179.0% | 760,856 | ||||
Name | Shares Underlying RSU Grant (#) | Aggregate Fair Value of RSU Grant ($) | ||||
Mark Manheimer | 82,192 | 1,200,000 | ||||
Daniel Donlan | 20,548 | 300,000 | ||||
27 | 2026 PROXY STATEMENT |
Name | Target Shares Underlying PSU Grant (#) | Aggregate Fair Value of PSU Grant ($) | ||||
Mark Manheimer | 123,287 | 1,800,000 | ||||
Daniel Donlan | 30,822 | 450,000 | ||||
Performance Level(1) | ||||||||||
Performance Goal | Weighting | Threshold (50% Earned) | Target (100% Earned) | Maximum (200% Earned) | ||||||
Absolute TSR | 60% | 15% | 24% | 30% | ||||||
Relative TSR | 40% | 35th percentile | 55th percentile | 75th percentile | ||||||
2025 PSU Awards — RTSR Comparator Group | ||||||
Agree Realty | Global Medical REIT | Peakstone Realty Trust | ||||
Alexandria Real Estate | Global Net Lease | Physicians Realty Trust | ||||
CareTrust REIT | Healthpeak Properties | Plymouth Industrial REIT | ||||
Community Healthcare Trust | LTC Properties | Postal Realty Trust | ||||
EPR Properties | LXP Industrial Trust | Realty Income | ||||
Essential Properties Realty Trust | Medical Properties Trust | Sabra Health Care REIT | ||||
Four Corners Property Trust | National Health Investors | Safehold | ||||
FrontView REIT | NNN REIT | STAG Industrial | ||||
Gaming and Leisure Properties | Omega Healthcare Investors | VICI Properties | ||||
Getty Realty | One Liberty Properties | W. P. Carey | ||||
Gladstone Commercial | ||||||
Performance Level(1) | ||||||||||||||
Performance Goal | Weighting | Threshold (50% Earned) | Target (100% Earned) | Maximum (200% Earned) | Actual Performance | Weighted Payout | ||||||||
Absolute TSR | 60% | 21% | 27% | 33% | 0% | 0% | ||||||||
Relative TSR | 40% | 35th percentile | 55th percentile | 75th percentile | 30th percentile | 0% | ||||||||
Actual Payout (% of Target) | 0% | |||||||||||||
28 | 2026 PROXY STATEMENT |
29 | 2026 PROXY STATEMENT |
30 | 2026 PROXY STATEMENT |
31 | 2026 PROXY STATEMENT |
Name and Principal Position | Year | Salary ($) | Stock Awards ($)(1) | Non-Equity Incentive Plan Compensation ($)(2) | All Other Compensation ($)(3) | Total ($) | ||||||||
Mark Manheimer President, Chief Executive Officer and Secretary | 2025 | 700,000 | 3,194,416 | 1,253,175 | 17,936 | 5,165,527 | ||||||||
2024 | 700,000 | 3,375,044 | 831,775 | 13,928 | 4,920,747 | |||||||||
2023 | 700,000 | 2,385,917 | 978,426 | 13,872 | 4,078,215 | |||||||||
Daniel Donlan(4) Chief Financial Officer and Treasurer | 2025 | 400,000 | 822,734 | 760,856 | 11,489 | 1,995,079 | ||||||||
2024 | 375,000 | 700,009 | 505,006 | 13,297 | 1,593,312 | |||||||||
2023 | 255,208 | 650,000 | 489,213 | 107,912 | 1,502,333 | |||||||||
PSU Grant Date Value ($) | RSU Grant Date Value ($) | 2025 Additional RSU Grant Date Value ($) | Total Grant Date Value ($) | |||||||
Mark Manheimer | 1,838,456 | 1,200,003 | 155,957 | 3,194,416 | ||||||
Daniel Donlan | 459,618 | 300,000 | 63,116 | 822,734 | ||||||
32 | 2026 PROXY STATEMENT |
Estimated Possible Payouts Under Non-Equity Incentive Plan Awards(1) | Estimated Future Payouts Under Equity Incentive Plan Awards(2) | All Other Stock Awards: Number of Shares of Stock or Units (#)(3) | Grant Date Fair Value of Stock Awards ($)(4) | |||||||||||||||||||
Name | Grant Type | Grant Date | Threshold ($) | Target ($) | Maximum ($) | Threshold (#) | Target (#) | Maximum (#) | ||||||||||||||
Mark Manheimer | Annual Incentive | — | 350,000 | 700,000 | 1,400,000 | |||||||||||||||||
PSU Grant | 2/26/25 | 61,644 | 123,287 | 246,574 | 1,838,456 | |||||||||||||||||
Annual RSU Grant | 2/26/25 | 82,192 | 1,200,003 | |||||||||||||||||||
2025 Additional RSU Grant(5) | 2/26/25 | 10,682 | 155,957 | |||||||||||||||||||
Daniel Donlan | Annual Incentive | — | 212,500 | 425,000 | 850,000 | |||||||||||||||||
PSU Grant | 2/26/25 | 15,411 | 30,822 | 61,644 | 459,618 | |||||||||||||||||
Annual RSU Grant | 2/26/25 | 20,548 | 300,000 | |||||||||||||||||||
2025 Additional RSU Grant(5) | 2/26/25 | 4,323 | 63,116 | |||||||||||||||||||
33 | 2026 PROXY STATEMENT |
34 | 2026 PROXY STATEMENT |
Stock Awards | |||||||||||||
Name | Number of Shares or Units of Stock That Have Not Vested (#)(g) | Market Value of Shares or Units of Stock That Have Not Vested ($)(h)(1) | Equity Incentive Plan Awards: Number of Unearned Shares, Units, or Other Rights That Have Not Vested (#)(i) | Equity Incentive Plan Awards: Market or Payout Value of Unearned Shares, Units or Other Rights That Have Not Vested ($)(j) | |||||||||
Mark Manheimer | 82,192 | (2) | 1,449,867 | 246,574 | (3) | 4,349,565 | (3) | ||||||
46,163 | (2) | 814,315 | 114,109 | (4) | 2,012,883 | (4) | |||||||
15,190 | (5) | 267,952 | 63,968 | (6) | 1,128,396 | (6) | |||||||
42,728 | (7) | 753,722 | |||||||||||
10,682 | (8) | 188,430 | |||||||||||
18,820 | (9) | 331,985 | |||||||||||
4,705 | (10) | 82,996 | |||||||||||
5,674 | (11) | 100,089 | |||||||||||
1,419 | (12) | 25,031 | |||||||||||
9,684 | (13) | 170,826 | |||||||||||
Daniel Donlan | 20,548 | (2) | 362,467 | 61,644 | (3) | 1,087,400 | (3) | ||||||
10,772 | (2) | 190,018 | 26,626 | (4) | 469,683 | (4) | |||||||
17,294 | (7) | 305,066 | |||||||||||
4,323 | (8) | 76,258 | |||||||||||
11,681 | (14) | 206,053 | |||||||||||
35 | 2026 PROXY STATEMENT |
Stock Awards | ||||||
Name | Number of Shares Acquired on Vesting (#)(1) | Value Realized on Vesting ($)(2) | ||||
Mark Manheimer | 90,229 | 1,336,617 | ||||
Daniel Donlan | 17,065 | 250,645 | ||||
Potential Amounts Payable on Termination Without Cause and/or Resignation for Good Reason | ||||||||
Name | Without a Change in Control ($) | With a Change in Control ($) | Potential Amount Payable on Death or Disability ($) | |||||
Mark Manheimer | ||||||||
Cash severance(1) | 2,800,000 | 4,200,000 | 116,667 | |||||
Accelerated vesting of RSUs(2) | 1,793,194 | 1,793,194 | 1,793,194 | |||||
Accelerated vesting of PSUs(3) | 3,141,278 | 3,141,278 | 3,141,278 | |||||
COBRA premiums(4) | 46,604 | 46,604 | 46,604 | |||||
2025 short-term incentives(5) | 1,253,175 | 1,253,175 | 1,253,175 | |||||
Total payments | 9,034,251 | 10,434,251 | 6,350,917 | |||||
Daniel Donlan | ||||||||
Cash severance(1) | 825,000 | 1,650,000 | 66,667 | |||||
Accelerated vesting of RSUs(2) | 396,071 | 396,071 | 396,071 | |||||
Accelerated vesting of PSUs(3) | 469,683 | 469,683 | 469,683 | |||||
COBRA premiums(4) | 49,868 | 49,868 | 49,868 | |||||
2025 short-term incentives(5) | 760,856 | 760,856 | 760,856 | |||||
Total payments | 2,501,478 | 3,326,478 | 1,743,145 | |||||
36 | 2026 PROXY STATEMENT |
37 | 2026 PROXY STATEMENT |
38 | 2026 PROXY STATEMENT |
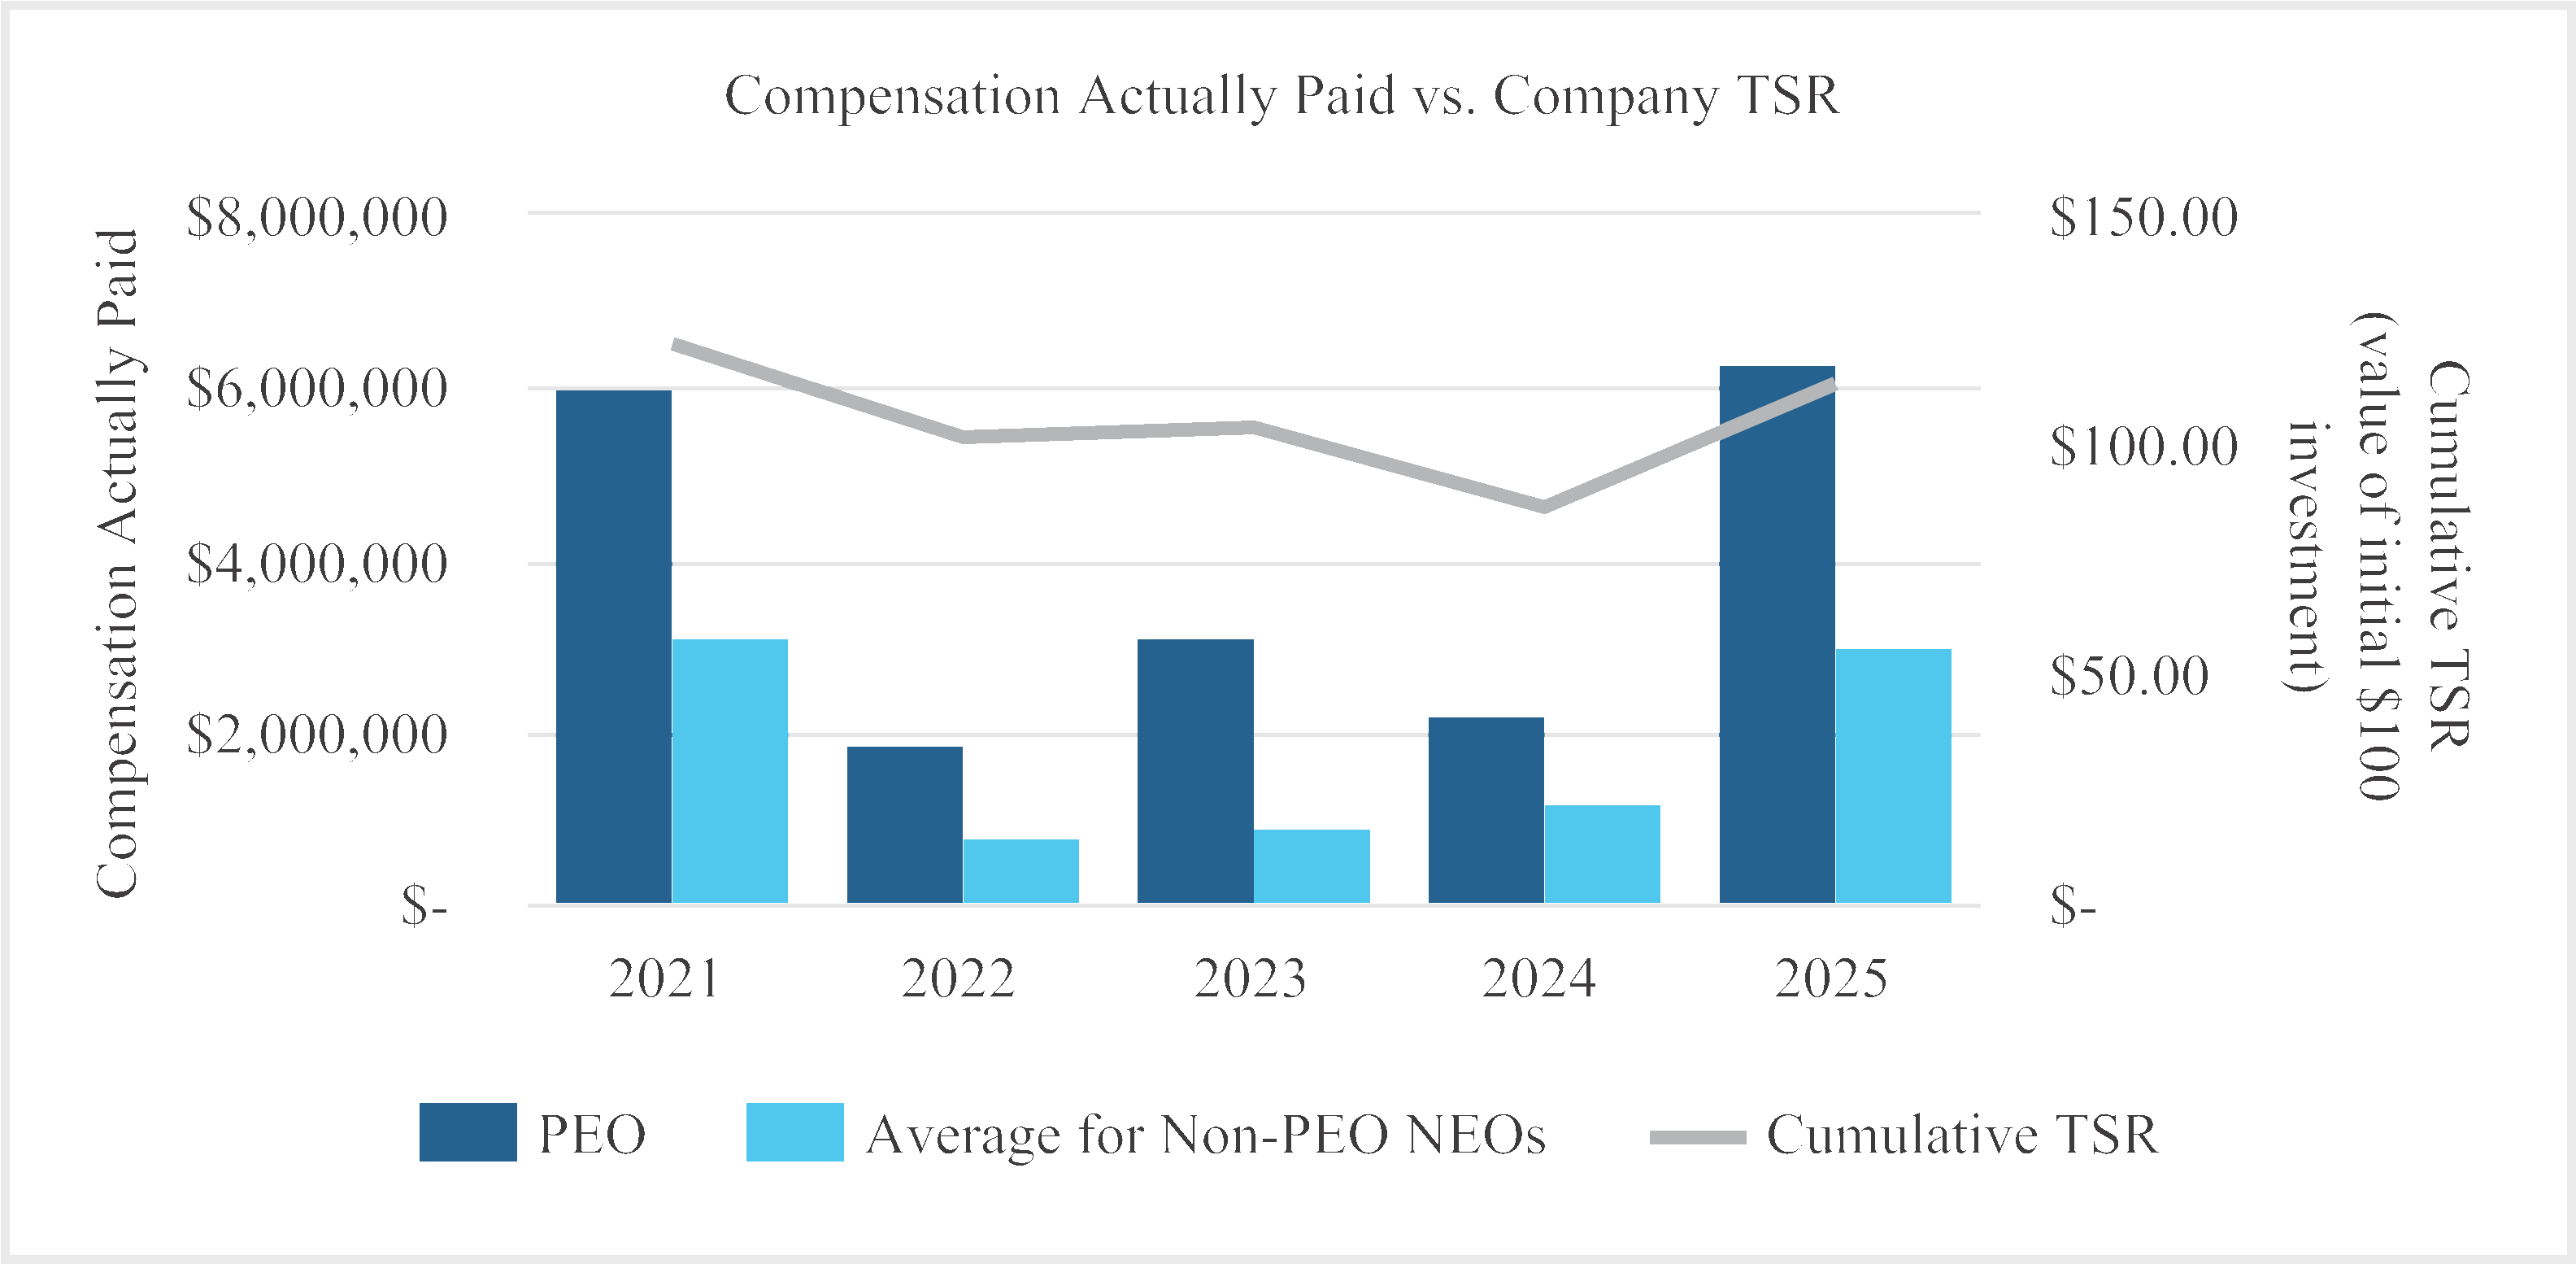
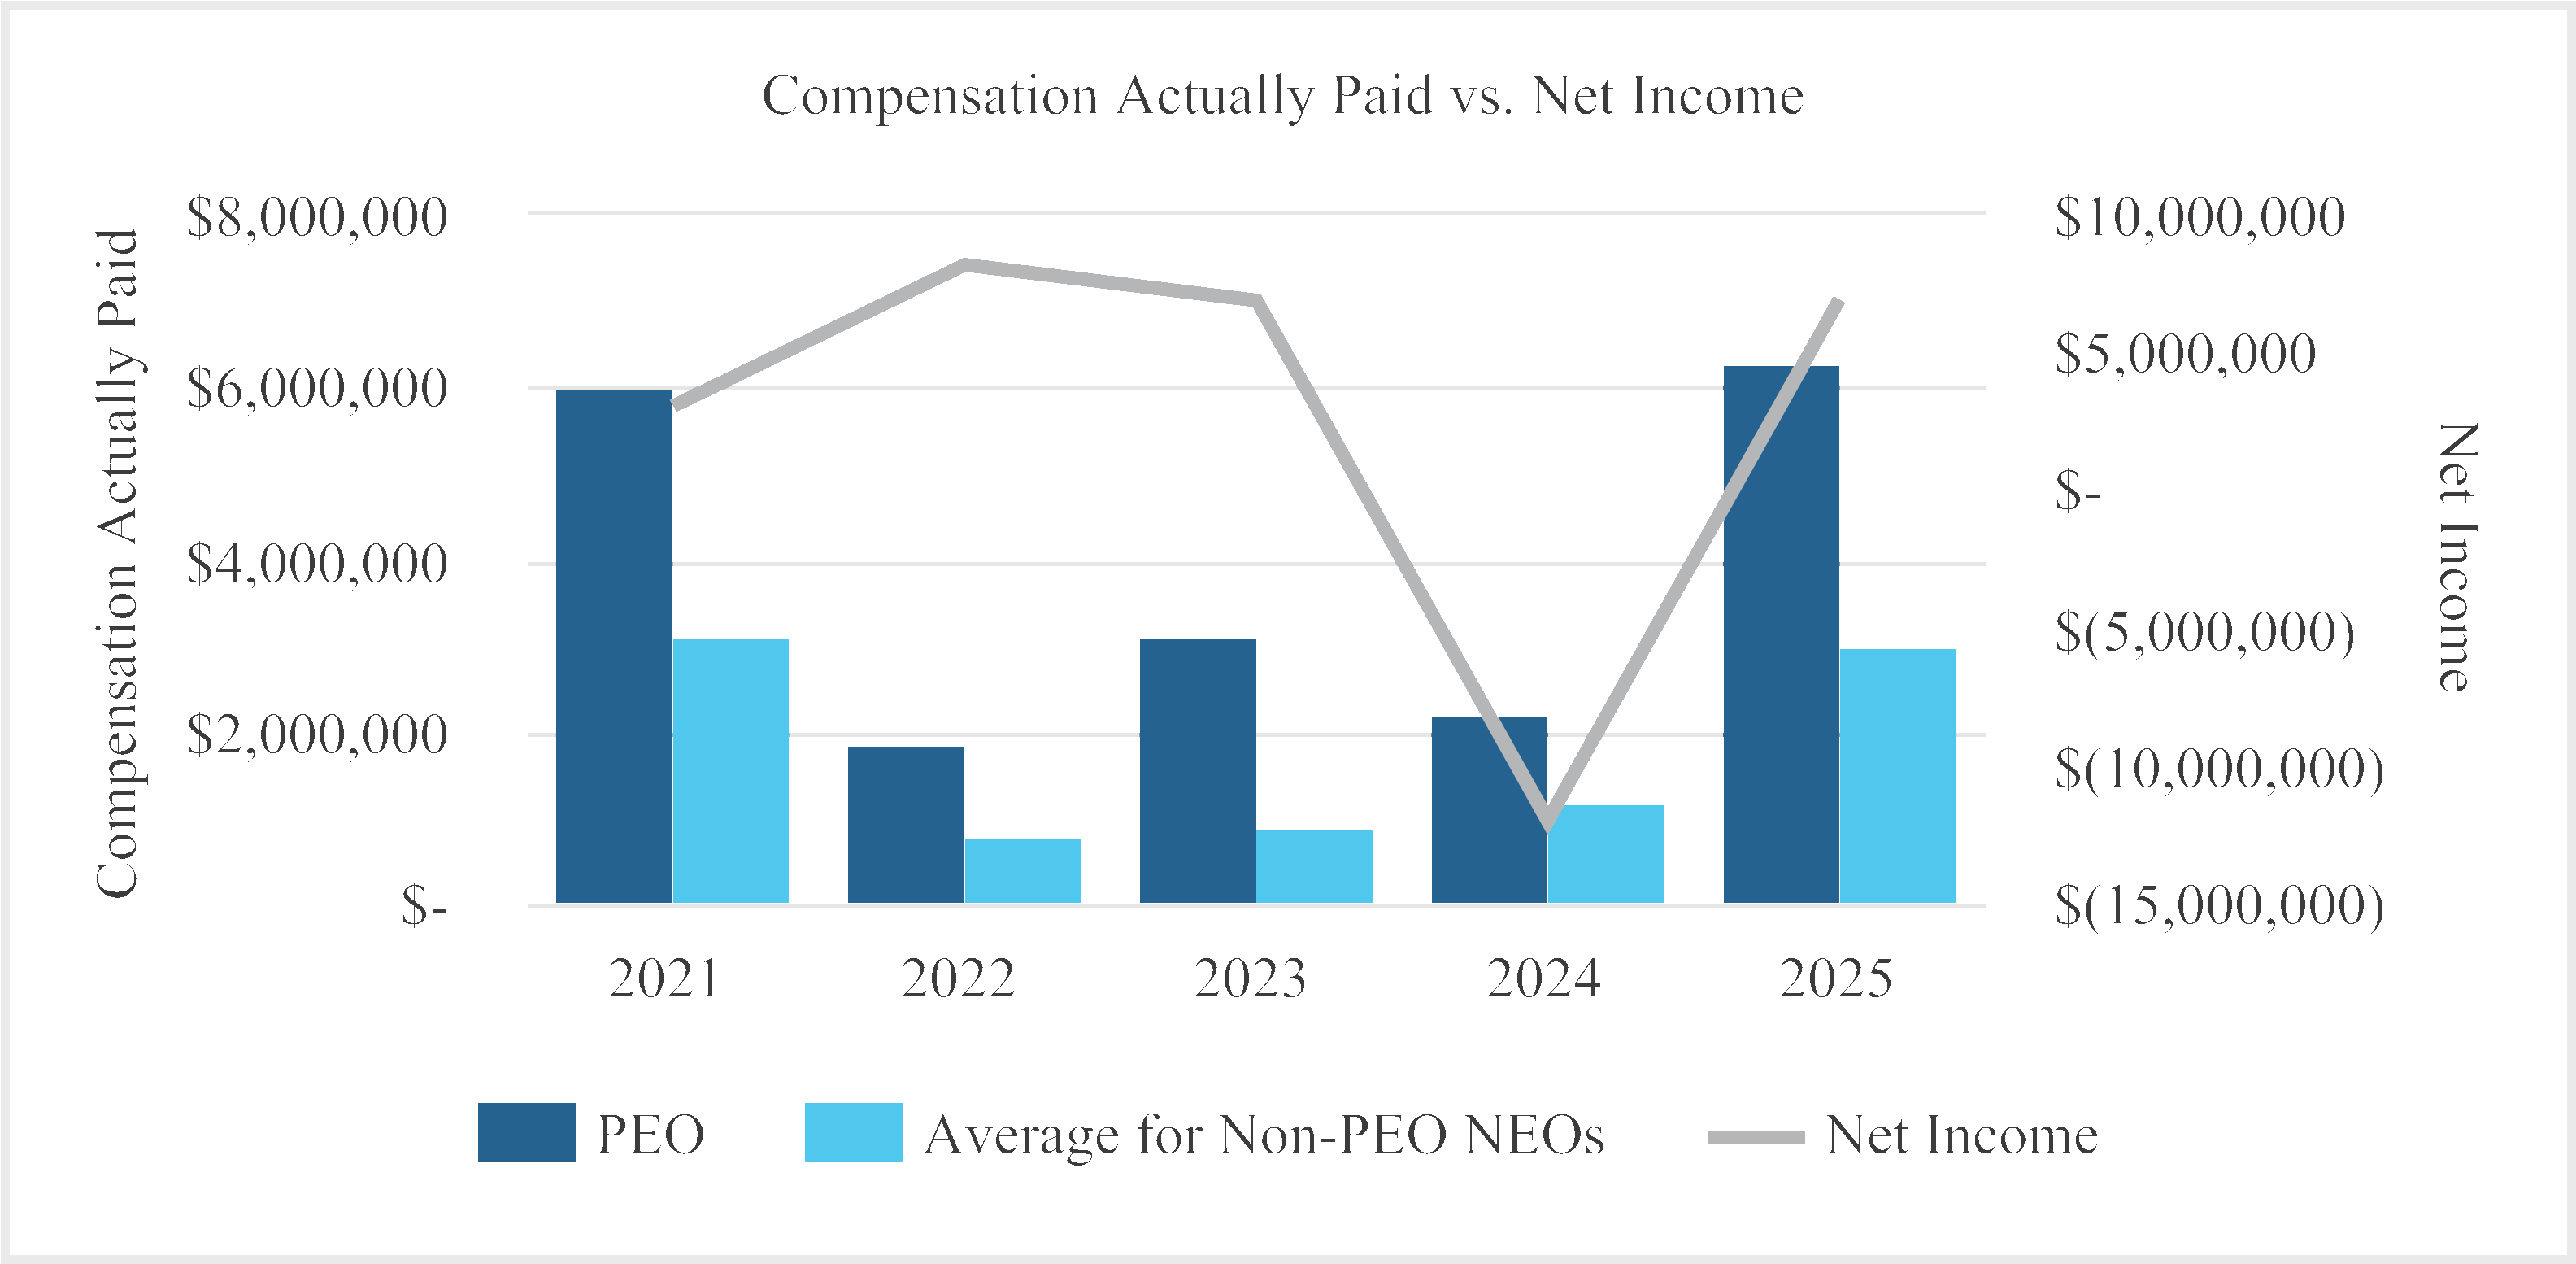
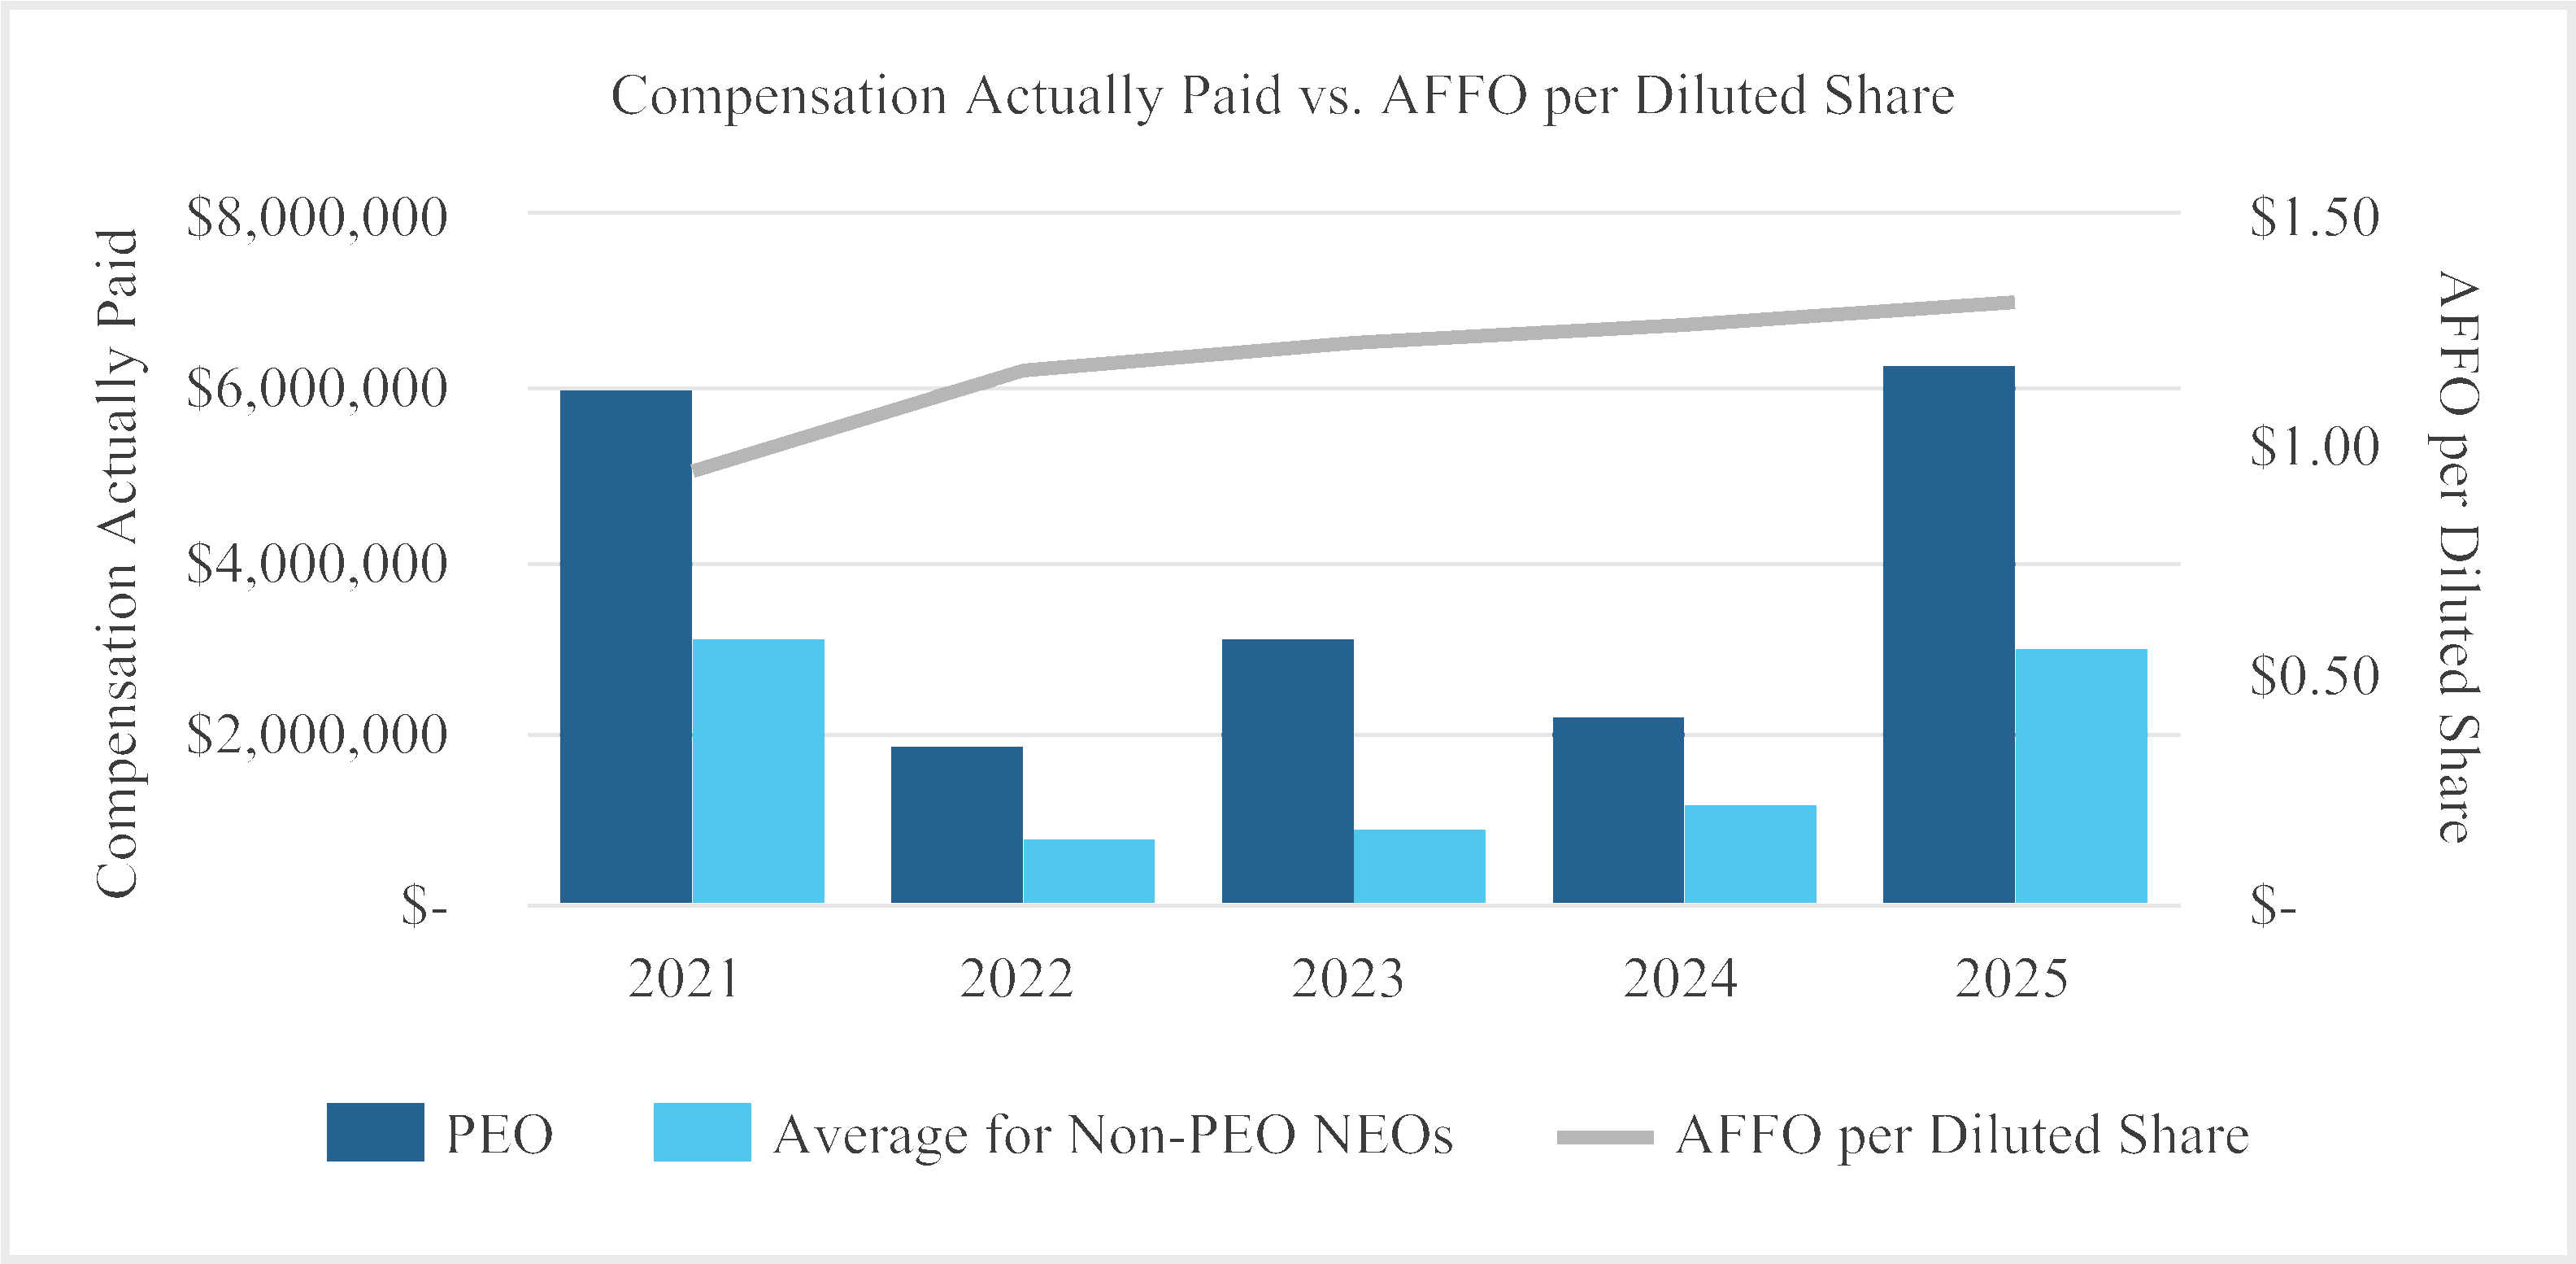
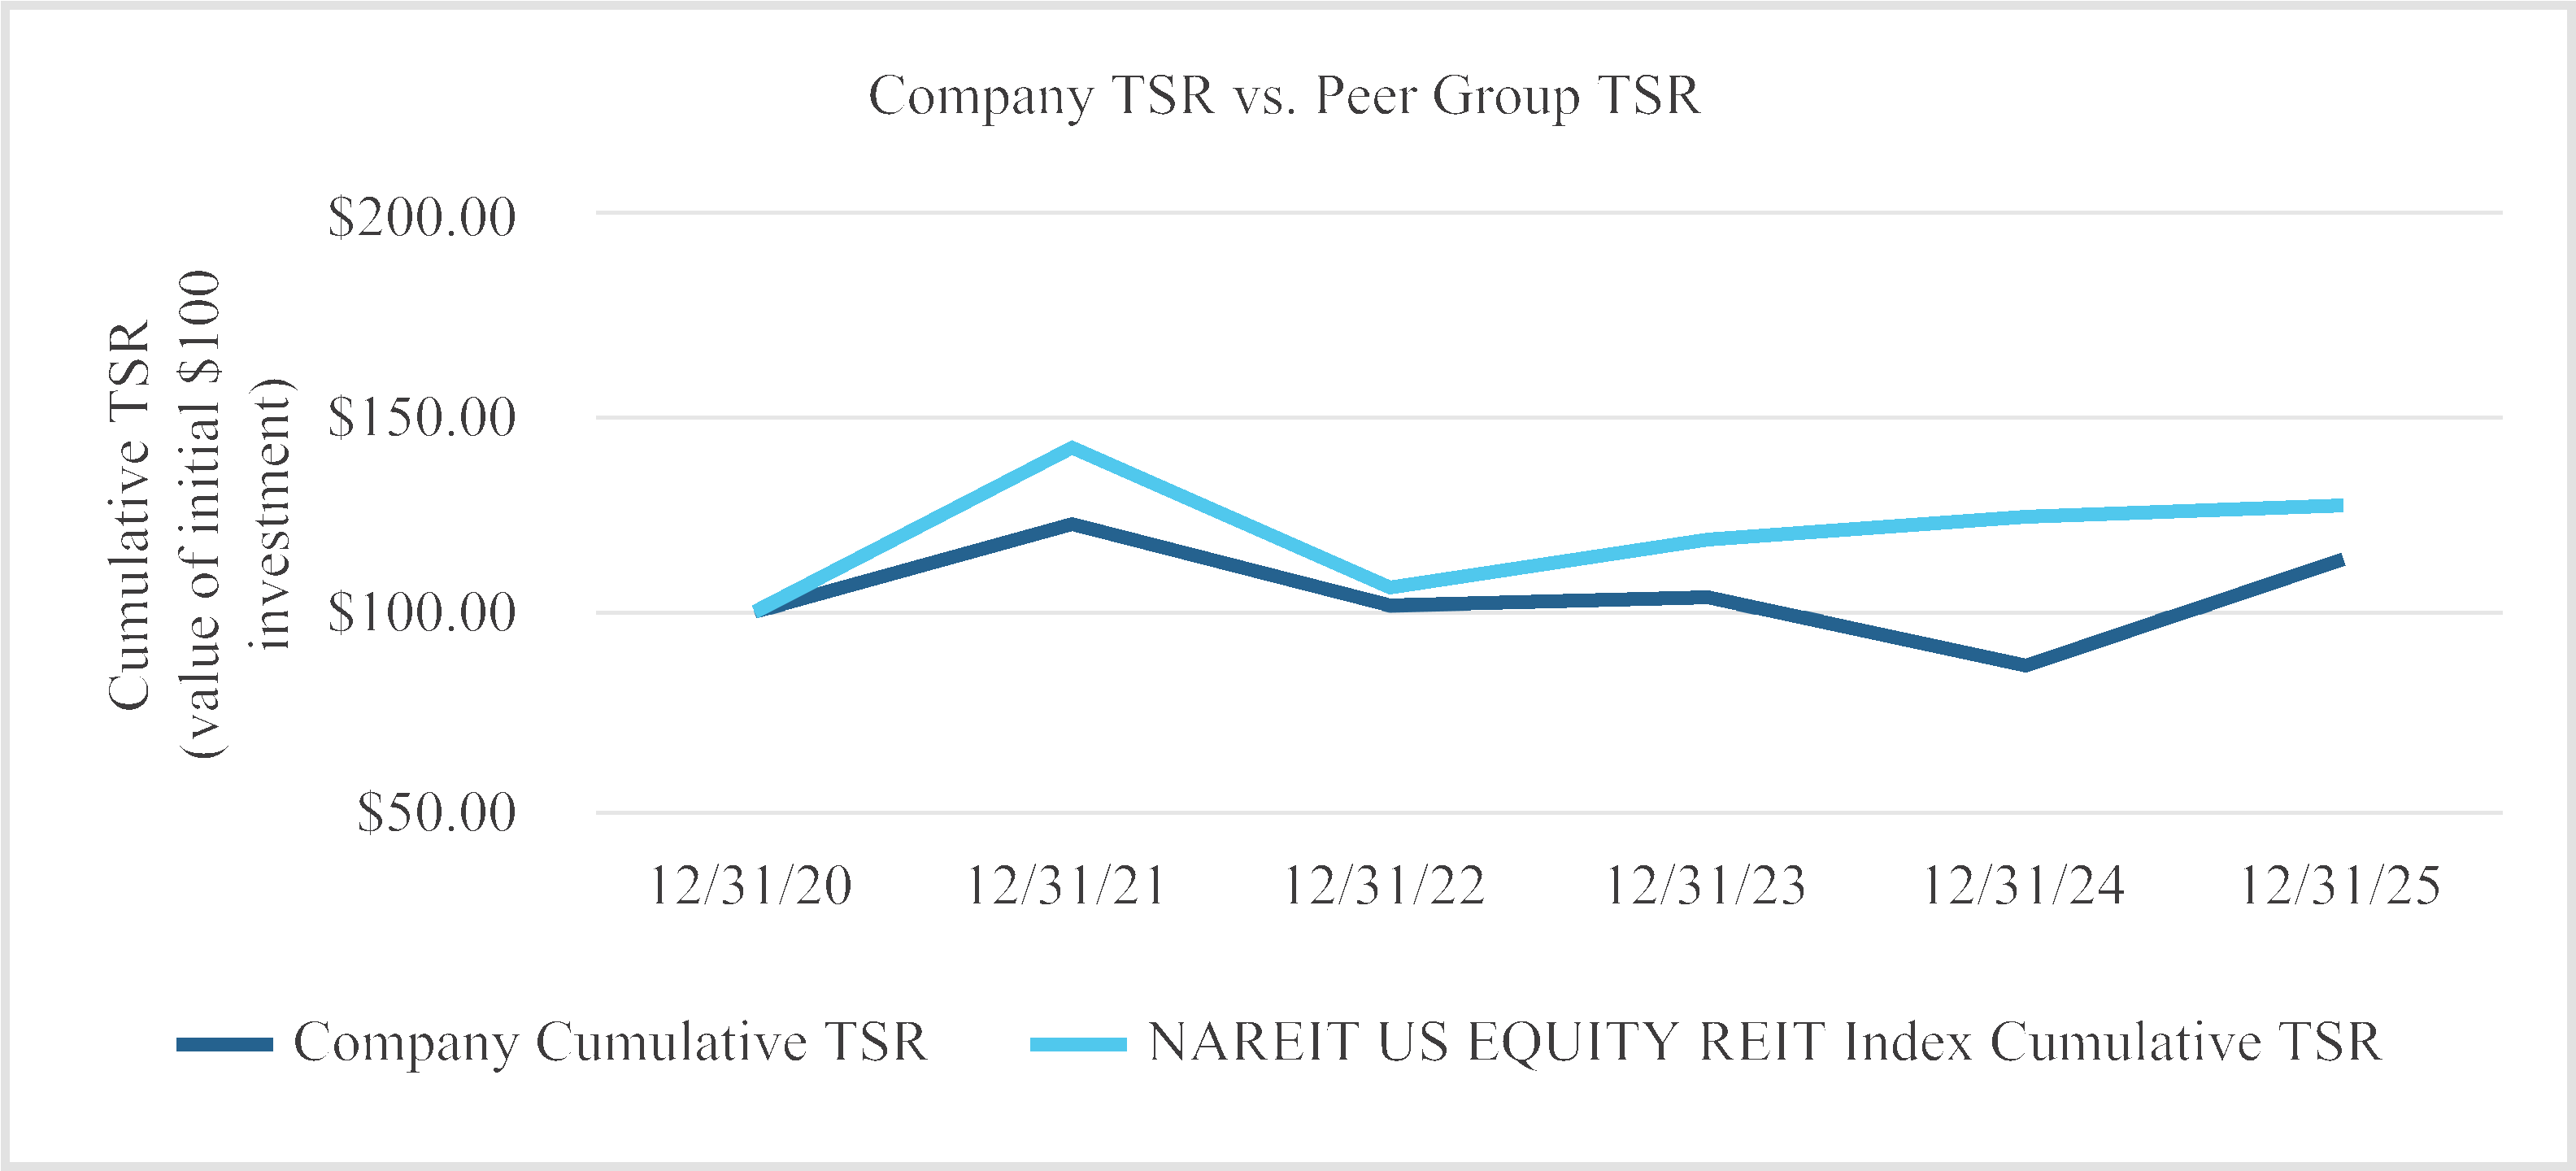
Year | Summary Compensation Table Total for PEO(1) ($) | Compensation Actually Paid to PEO(2) ($) | Average Summary Compensation Table Total for Non-PEO NEOs(3) ($) | Average Compen sation Actually Paid to Non-PEO NEOs(4) ($) | Value of Initial Fixed $100 Investment Based on: | Company Selected Measure — AFFO / Diluted Share(8) ($) | ||||||||||
Total Shareholder Return(5) ($) | Peer Group Total Shareholder Return(5)(6) ($) | Net (Loss) Income (thousands)(7) ($) | ||||||||||||||
2025 | ||||||||||||||||
2024 | ( | |||||||||||||||
2023 | ||||||||||||||||
2022 | ||||||||||||||||
2021 | ||||||||||||||||
Year | Reported Summary Compensation Table Total for PEO ($) | Less: Reported Value of Equity Awards(a) ($) | Add: Equity Award Adjustments(b) ($) | Compensation Actually Paid to PEO ($) | ||||
2025 | ( |
39 | 2026 PROXY STATEMENT |
Year | Year End Fair Value of Equity Awards Granted in the Year ($) | Change in Fair Value from End of Prior Year to End of Covered Year of Equity Awards Granted in Prior Years ($) | Fair Value as of Vesting Date of Equity Awards Granted and Vested in the Year ($) | Change in Fair Value on the Vesting Date of Equity Awards Granted in Prior Years that Vested in the Year ($) | Fair Value at the End of the Prior Year of Equity Awards that Failed to Meet Vesting Conditions in the Year ($) | Value of Dividends or other Earnings Paid on Stock or Option Awards not Otherwise Reflected in Fair Value or Total Compensation ($) | Total Equity Award Adjustments ($) | |||||||
2025 |
Year | Average Reported Summary Compensation Table Total for Non-PEO NEOs ($) | Less: Average Reported Value of Equity Awards ($) | Add: Average Equity Award Adjustments(a) ($) | Average Compensation Actually Paid to Non-PEO NEOs ($) | ||||
2025 | ( |
Year | Average Year End Fair Value of Equity Awards Granted in the Year ($) | Average Change in Fair Value from End of Prior Year to End of Covered Year of Equity Awards Granted in Prior Years ($) | Average Fair Value as of Vesting Date of Equity Awards Granted and Vested in the Year ($) | Average Change in Fair Value on the Vesting Date of Equity Awards Granted in Prior Years that Vested in the Year ($) | Average Fair Value at the End of the Prior Year of Equity Awards that Failed to Meet Vesting Conditions in the Year ($) | Average Value of Dividends or other Earnings Paid on Stock or Option Awards not Otherwise Reflected in Fair Value or Total Compensation ($) | Total Average Equity Award Adjustments ($) | |||||||
2025 |
40 | 2026 PROXY STATEMENT |
41 | 2026 PROXY STATEMENT |
42 | 2026 PROXY STATEMENT |
43 | 2026 PROXY STATEMENT |
44 | 2026 PROXY STATEMENT |
(in thousands) | 2025 | 2024 | |||
Audit Fees(1) | $1,109 | $1,059 | |||
Audit-Related Fees | — | — | |||
Tax Fees(2) | 342 | 413 | |||
All Other Fees | — | — | |||
Total | $1,451 | $1,472 | |||
45 | 2026 PROXY STATEMENT |
46 | 2026 PROXY STATEMENT |
47 | 2026 PROXY STATEMENT |
48 | 2026 PROXY STATEMENT |
 | Internet www.proxyvote.com |  | Calling 1-800-690-6903 Toll-free from the U.S. or Canada |  | Mail Return the signed proxy card |
49 | 2026 PROXY STATEMENT |
Proposal | Voting Options | Vote Required to Adopt the Proposal | Effect of Abstentions | Effect of “Broker Non-Votes” | |||||
Election of directors | FOR, AGAINST or ABSTAIN with respect to each director nominee. | Majority of total votes cast for and against a nominee; each director nominee must receive more votes FOR than AGAINST.* Stockholders may not cumulate votes for directors. | No effect. An abstention does not count as a vote cast. | No effect; no broker discretion to vote. | |||||
Ratification of retention of KPMG LLP | FOR, AGAINST or ABSTAIN. | Majority of the votes cast; shares voted FOR the proposal must exceed the number of shares voted AGAINST the proposal. | No effect. An abstention does not count as a vote cast. | No broker non-votes; brokers have discretion to vote. | |||||
Advisory vote to approve executive compensation | FOR, AGAINST or ABSTAIN. | Majority of the votes cast; shares voted FOR the proposal must exceed the number of shares voted AGAINST the proposal.** | No effect. An abstention does not count as a vote cast. | No effect; no broker discretion to vote. |
50 | 2026 PROXY STATEMENT |
51 | 2026 PROXY STATEMENT |
52 | 2026 PROXY STATEMENT |
By Order of the Board of Directors, | ||
| ||
Mark Manheimer | ||
President, Chief Executive Officer and Secretary |
A-1 | 2026 PROXY STATEMENT |  |
A-2 | 2026 PROXY STATEMENT | |
Year Ended December 31, 2025 (unaudited) | ||||
Net income | $ | |||
Depreciation and amortization of real estate | 86,081 | |||
Provisions for impairment | 15,909 | |||
Gain on sales of real estate, net | (7,686) | |||
FFO | 101,242 | |||
Adjustments: | ||||
Non-recurring executive transition costs, severance, and related charges | 124 | |||
Loss on debt extinguishment and other related costs | 495 | |||
Other non-recurring loss, net | 1,314 | |||
Core FFO | 103,175 | |||
Adjustments: | ||||
Straight-line rent adjustments | (4,793) | |||
Amortization of deferred financing costs | 3,136 | |||
Amortization of above/below-market assumed debt | 114 | |||
Amortization of loan origination costs and discounts | (342) | |||
Amortization of lease-related intangibles | (157) | |||
Earned development interest | 184 | |||
Capitalized interest expense | (154) | |||
Non-cash interest expense | 2,859 | |||
Non-cash compensation expense | 5,898 | |||
AFFO | $109,920 | |||
Weighted average common shares outstanding, diluted | 84,204,748 | |||
FFO per common share, diluted | $1.20 | |||
Core FFO per common share, diluted | $1.23 | |||
AFFO per common share, diluted | $ | |||