AMC Consultants Pty Ltd
ABN 58 008 129 164
Level
12, 477 Collins Street
Melbourne Vic 3000
Australia
T +61
3 8601 3300
E melbourne@amcconsultants.com
amcconsultants.com

Exhibit 96.1
AMC Consultants Pty Ltd
Level
12, 477 Collins Street
T +61
3 8601 3300
amcconsultants.com |
|
Report
Technical Report Summary of Prefeasibility Study of NORI Area D, Clarion Clipperton Zone
TMC the metals company Inc.
AMC Project 0225054
30 July 2025
Effective Date: 4 August 2025
Qualified Persons:
AMC Consultants Pty Ltd
MARGIN - Marine Geoscience Innovation
APYS Subsea Ltd
Canadian Engineering Associates Ltd
Lanasera Pty Ltd
Anthony O’Sullivan, Chief Development Officer, TMC the metals company Inc.
Dr. Michael Clarke, Environmental Manager, TMC the metals company Inc.
Rutger Bosland, Chief Innovation and Offshore Technology Officer, TMC the metals company Inc.
Adam Price, Project Controls Manager, TMC the metals company Inc.

| Technical Report Summary of Prefeasibility Study of NORI Area D, Clarion Clipperton Zone | |
| TMC the metals company Inc. | 0225054 |
Contents
| 1 | Executive summary | 24 | ||
| 1.1 | Property description (including mineral rights) and ownership | 24 | ||
| 1.2 | Location | 26 | ||
| 1.3 | Regulatory environment and the NORI tenement | 26 | ||
| 1.4 | Geology and Mineral Resources | 27 | ||
| 1.5 | Development plan | 30 | ||
| 1.6 | Mining concept | 30 | ||
| 1.7 | Mineral Processing and metallurgical testing | 31 | ||
| 1.8 | Market studies | 32 | ||
| 1.9 | Environmental studies, permitting, community, or social impact | 33 | ||
| 1.10 | Mining and Mineral Reserve estimates | 34 | ||
| 1.11 | Summary capital and operating cost estimates | 36 | ||
| 1.12 | PFS economic assessment | 37 | ||
| 1.13 | Qualified Person's conclusions and recommendations | 39 | ||
| 2 | Introduction | 40 | ||
| 2.1 | Registrant, terms of reference and purpose of report | 40 | ||
| 2.2 | Sources of information | 40 | ||
| 2.3 | Qualified Persons and personal inspections | 40 | ||
| 2.4 | Update to a previously filed Technical Report | 43 | ||
| 3 | Property description | 44 | ||
| 3.1 | United Nations Convention on the Law of the Sea (UNCLOS) | 44 | ||
| 3.1.1 | International Seabed Authority (ISA) | 46 | ||
| 3.2 | Tenements and permits under the ISA | 47 | ||
| 3.3 | NORI obligations and sponsorship under the ISA | 48 | ||
| 3.3.1 | Work Program under the ISA | 49 | ||
| 3.4 | Deep Seabed Hard Mineral Resources Act (DSHMRA) | 50 | ||
| 3.4.1 | National Oceanic and Atmospheric Administration (NOAA) | 50 | ||
| 3.4.2 | License and permit applications under NOAA | 51 | ||
| 3.5 | Royalties and taxes | 51 | ||
| 4 | Accessibility, climate, local resources, infrastructure and physiography | 53 | ||
| 4.1 | Accessibility and infrastructure | 53 | ||
| 4.2 | Climate | 53 | ||
| 5 | History | 54 | ||
| 5.1 | Overview | 54 | ||
| 5.2 | Pioneer Investors | 54 | ||
| 5.3 | Sampling methods | 56 | ||
| 5.4 | Sample preparation and analysis | 58 | ||
| 5.4.1 | Ocean Minerals Company | 58 | ||
| 5.4.2 | Yuzhmorgeologiya | 59 | ||
| 5.4.3 | IOM | 59 | ||
| 5.4.4 | Preussag | 59 | ||
| 5.5 | Quality Assurance/Quality Control Procedures | 60 | ||
| 5.6 | Pioneer Investor sample data supplied to NORI | 60 | ||
| 6 | Geological setting, mineralization, and deposit | 63 | ||
| 6.1 | Global distribution of nodules | 63 | ||
| 6.2 | Sedimentation and nodule formation | 64 | ||
| 6.3 | Polymetallic mineralization | 65 | ||
| 6.3.1 | Nodule grades | 65 | ||
| 6.3.2 | Nodule abundance | 65 | ||
| 6.3.3 | Nodule facies | 71 | ||
| amcconsultants.com | i |
| Technical Report Summary of Prefeasibility Study of NORI Area D, Clarion Clipperton Zone | |
| TMC the metals company Inc. | 0225054 |
| 6.4 | Geological domains | 74 | |||
| 6.5 | Nodule morphology and formation | 75 | |||
| 7 | Exploration | 76 | |||
| 7.1 | NORI 2012 campaign | 76 | |||
| 7.2 | NORI 2018 campaign | 77 | |||
| 7.2.1 | Objectives and approach | 77 | |||
| 7.2.2 | AUV survey | 78 | |||
| 7.2.3 | Camera imagery | 81 | |||
| 7.2.4 | Box coring | 81 | |||
| 7.2.5 | Nodule sampling | 86 | |||
| 7.2.6 | Image classification and size measurement | 87 | |||
| 7.2.7 | Biological sampling | 88 | |||
| 7.2.8 | Geotechnical sampling | 88 | |||
| 7.2.9 | Exploration results | 89 | |||
| 7.2.9.1 | Box core abundance | 89 | |||
| 7.2.9.2 | Buried nodules | 93 | |||
| 7.2.9.3 | AUV data | 93 | |||
| 7.2.10 | Nodule abundance estimation derived from AUV camera data | 95 | |||
| 7.3 | NORI 2019 campaign | 100 | |||
| 7.3.1 | Box coring | 100 | |||
| 7.3.2 | Nodule sampling | 101 | |||
| 7.3.3 | Biological sampling | 103 | |||
| 7.3.4 | Geotechnical sampling | 103 | |||
| 7.3.5 | Exploration results | 107 | |||
| 7.3.6 | Analysis of grade distribution by size fraction | 114 | |||
| 7.4 | The 2022 test mining campaign | 117 | |||
| 7.5 | NORI 2022 Campaign 7A and 7B | 117 | |||
| 7.5.1 | Box coring | 117 | |||
| 7.5.2 | Nodule sampling | 118 | |||
| 7.5.3 | Biological sampling | 119 | |||
| 7.5.4 | Geotechnical sampling | 119 | |||
| 7.5.5 | Exploration results | 123 | |||
| 7.5.5.1 | Campaign 7A | 123 | |||
| 7.5.5.2 | Campaign 7B | 125 | |||
| 7.6 | NORI 2023 Campaign 8a | 131 | |||
| 7.6.1 | Box coring | 131 | |||
| 7.6.2 | Nodule sampling | 131 | |||
| 7.6.3 | Biological sampling | 131 | |||
| 7.6.4 | Exploration results | 131 | |||
| 7.7 | Analysis of abundance of nodules | 134 | |||
| 7.8 | Analysis of nodule size distribution | 136 | |||
| 7.8.1 | Physical measurement of size and estimation of abundance from nodule dimensions | 137 | |||
| 7.8.2 | Measurement of nodule dimensions using ImageJ software | 137 | |||
| 7.9 | Analysis of nodule shape, texture and fragmentation | 142 | |||
| 7.10 | Analysis of moisture content of nodules | 144 | |||
| 7.11 | Analysis of density of nodules | 147 | |||
| 7.12 | Multielement chemistry | 149 | |||
| 7.12.1 | Nodules | 149 | |||
| 7.12.2 | Sediments | 150 | |||
| 7.13 | Analysis of bathymetric data | 151 | |||
| 7.13.1 | Geological domains | 153 | |||
| amcconsultants.com | ii |
| Technical Report Summary of Prefeasibility Study of NORI Area D, Clarion Clipperton Zone | |
| TMC the metals company Inc. | 0225054 |
| 7.13.2 | Seafloor slopes | 159 | |||
| 7.13.2.1 | Background | 159 | |||
| 7.13.2.2 | Observations at different mapping scales (Data resolutions) | 159 | |||
| 7.13.2.3 | Slope prediction using EM120 dataset | 161 | |||
| 7.13.2.4 | Summary | 164 | |||
| 7.13.3 | Geo-obstacles | 164 | |||
| 7.13.3.1 | Background | 164 | |||
| 7.13.3.2 | Geo obstacle mapping | 167 | |||
| 7.13.3.3 | Geo-obstacle probability model mapping | 171 | |||
| 7.13.3.4 | Model calibration and improvement | 172 | |||
| 7.14 | Analysis of geotechnical data | 176 | |||
| 7.14.1 | Data collection campaigns | 176 | |||
| 7.14.2 | Geotechnical soils summary | 179 | |||
| 7.14.3 | Shear strength | 180 | |||
| 7.14.4 | Soil classification | 185 | |||
| 7.14.5 | Variation in seafloor soil measurements | 185 | |||
| 8 | Sample preparation, analyses, and security | 187 | |||
| 8.1 | Sample security | 187 | |||
| 8.2 | Sample preparation and assaying | 188 | |||
| 8.3 | Quality Assurance and Quality Control procedures | 189 | |||
| 8.3.1 | Certified Reference Materials | 189 | |||
| 8.3.2 | Blanks | 190 | |||
| 8.3.3 | Duplicates | 192 | |||
| 8.3.3.1 | Campaign 3, 2018 | 192 | |||
| 8.3.3.2 | Campaign 6, 2018 | 193 | |||
| 8.3.3.3 | Campaign 7A, 2022 | 196 | |||
| 8.3.3.4 | Campaign 8A, 2023 | 198 | |||
| 9 | Data verification | 200 | |||
| 10 | Mineral processing and metallurgical testing | 201 | |||
| 10.1 | Bulk sample collection testwork | 202 | |||
| 10.2 | Bulk sampling testing laboratories | 203 | |||
| 10.3 | Summary of test work results | 203 | |||
| 10.3.1 | Round robin assaying program | 203 | |||
| 10.3.2 | Key findings of calcination at FLS | 207 | |||
| 10.3.3 | Piloting – Electric furnace smelting at XPS – Metallurgical summary | 207 | |||
| 10.3.4 | Smelting: metallurgical results | 209 | |||
| 10.3.4.1 | Partition coefficients (PC) in smelting | 209 | |||
| 10.3.4.2 | Slag chemistry | 213 | |||
| 10.3.4.3 | Elemental distribution – partition coefficients in converting | 214 | |||
| 10.3.5 | Demonstration scale trials at PAMCO | 218 | |||
| 10.3.6 | Hydrometallurgical refinery bench scale testing | 219 | |||
| 10.3.6.1 | Two-stage leaching | 219 | |||
| 10.3.6.2 | Cobalt refining | 220 | |||
| 10.3.6.3 | Nickel refining | 221 | |||
| 10.4 | Processing factors or deleterious elements that may impact extraction | 221 | |||
| 10.5 | Summary and QP’s opinion | 222 | |||
| 11 | Mineral Resource estimates for NORI Area D | 223 | |||
| 11.1 | Software | 223 | |||
| 11.2 | Sample data | 223 | |||
| 11.2.1 | TOML sample data | 223 | |||
| 11.2.1.1 | NORI 2018 sample data | 223 | |||
| 11.2.1.2 | NORI 2019 sample data | 224 | |||
| amcconsultants.com | iii |
| Technical Report Summary of Prefeasibility Study of NORI Area D, Clarion Clipperton Zone | |
| TMC the metals company Inc. | 0225054 |
| 11.2.1.3 | NORI 2022 sample data | 225 | |||
| 11.2.1.4 | NORI 2023 sample data | 225 | |||
| 11.2.1.5 | Representativeness of sampling | 225 | |||
| 11.3 | Backscatter | 226 | |||
| 11.4 | Bathymetry | 226 | |||
| 11.5 | Geological domains | 226 | |||
| 11.6 | Nodule type and sediment drift | 228 | |||
| 11.7 | Data processing | 230 | |||
| 11.7.1 | Exploratory data analysis | 230 | |||
| 11.7.2 | Top-cuts | 232 | |||
| 11.7.3 | Relationships between nodules and domains | 234 | |||
| 11.7.4 | Relationships between nodule abundance and backscatter | 237 | |||
| 11.7.5 | Data transformations | 239 | |||
| 11.7.6 | Spatial continuity | 239 | |||
| 11.7.6.1 | Nodule abundance and nodule grades | 239 | |||
| 11.7.7 | Estimation of nodule abundance and grades | 244 | |||
| 11.8 | Cut-off grade | 246 | |||
| 11.9 | Mineral Resource classification | 247 | |||
| 11.10 | Estimation results | 250 | |||
| 11.11 | Comparison with previous resource estimates | 252 | |||
| 12 | Mineral Reserve estimates | 254 | |||
| 12.1 | Introduction | 254 | |||
| 12.1.1 | Basis of the mine plan | 254 | |||
| 12.1.2 | Qualified Person responsibility | 256 | |||
| 12.2 | Key assumptions and methods used | 257 | |||
| 12.2.1 | Environmental Modifying Factors | 257 | |||
| 12.2.2 | Geotechnical analysis Modifying Factors | 257 | |||
| 12.2.3 | Geotechnical design Modifying Factors | 258 | |||
| 12.2.4 | Seafloor topography model Modifying Factors | 259 | |||
| 12.2.5 | Nodule loss from Geo-obstacle Modifying Factors | 260 | |||
| 12.2.6 | Resource model Modifying Factors | 261 | |||
| 12.2.7 | Nodule collection Modifying Factors | 261 | |||
| 12.2.8 | Nodule recovery Modifying Factors | 267 | |||
| 12.2.9 | Marine operations Modifying Factors | 271 | |||
| 12.2.10 | Mine planning Modifying Factors | 271 | |||
| 12.2.11 | Nodule processing Modifying Factors | 273 | |||
| 12.2.12 | Nodule marketing Modifying Factors | 274 | |||
| 12.2.13 | Production target Modifying Factors summary | 275 | |||
| 12.2.14 | Economic Modifying Factors | 276 | |||
| 12.2.15 | Mine planning method | 277 | |||
| 12.2.16 | Resource model used for conversion to Mineral Reserves | 277 | |||
| 12.2.17 | Consideration of losses during mining | 278 | |||
| 12.2.18 | Defining economic limits of extraction | 278 | |||
| 12.2.19 | Initial Mining Area (Project Zero) development strategy | 281 | |||
| 12.3 | Mineral Reserve estimate | 287 | |||
| 12.4 | Cut-off values to define ore | 287 | |||
| 12.5 | Economic assessment | 288 | |||
| 12.6 | Mineral Reserve classification | 288 | |||
| 12.7 | Qualified Persons conclusion on risk factors | 288 | |||
| 13 | Mining methods | 291 | |||
| 13.1 | Overview | 291 | |||
| 13.2 | Production Vessel (PV) | 291 | |||
| 13.2.1 | Collector System | 293 | |||
| amcconsultants.com | iv |
| Technical Report Summary of Prefeasibility Study of NORI Area D, Clarion Clipperton Zone | |
| TMC the metals company Inc. | 0225054 |
| 13.2.1.1 | Collector propulsion system | 294 | |||
| 13.2.1.2 | Nodule pick-up and internal separation system | 295 | |||
| 13.2.1.3 | Power, control and monitoring system | 298 | |||
| 13.2.2 | Launch and Recovery System | 298 | |||
| 13.2.3 | Vertical Transport System (VTS) – Overview | 299 | |||
| 13.2.4 | Vertical transport system – functional description | 301 | |||
| 13.2.4.1 | Riser | 301 | |||
| 13.2.4.2 | Riser head | 302 | |||
| 13.2.4.3 | Contingency overflow tank | 302 | |||
| 13.2.4.4 | Compressor spread | 302 | |||
| 13.2.5 | Riser/jumper handling equipment | 303 | |||
| 13.2.6 | Nodule dewatering and storage system | 303 | |||
| 13.2.7 | Nodule handling system – functional description | 305 | |||
| 13.2.7.1 | Nodule dewatering system | 305 | |||
| 13.2.7.2 | Bulk cargo classification | 306 | |||
| 13.2.7.3 | Return water system | 306 | |||
| 13.2.7.4 | Nodule storage system | 307 | |||
| 13.2.7.5 | Nodule storage holds | 309 | |||
| 13.2.7.6 | Nodule offloading system | 309 | |||
| 13.2.8 | Nodule Transfer Vessel (TV) | 314 | |||
| 14 | Processing and recovery methods | 316 | |||
| 14.1 | Overview | 316 | |||
| 14.2 | Flowsheet options screening and selection | 317 | |||
| 14.2.1 | Manganese product and associated market | 317 | |||
| 14.2.2 | Near zero solid waste generation | 319 | |||
| 14.3 | Process description | 319 | |||
| 14.3.1 | Alloy production | 320 | |||
| 14.3.2 | Matte production | 320 | |||
| 14.3.3 | Matte refining | 321 | |||
| 14.4 | Flowsheet development | 321 | |||
| 14.4.1 | Literature review | 321 | |||
| 14.4.2 | Bench-scale test work | 322 | |||
| 14.4.3 | Concept engineering | 322 | |||
| 14.4.4 | Piloting | 323 | |||
| 14.4.4.1 | Piloting overview | 323 | |||
| 14.4.4.2 | Calcining at FLSmidth | 323 | |||
| 14.4.4.3 | Smelting, sulfidizing and converting at XPS | 324 | |||
| 14.4.5 | Demonstration scale calcining and smelting trial | 326 | |||
| 14.4.6 | Manganese silicate slag quality | 328 | |||
| 15 | Metallurgical plant (onshore) | 330 | |||
| 15.1 | Strategy of employing existing assets | 331 | |||
| 15.1.1 | Overview and context | 331 | |||
| 15.1.2 | Ramp up of commercial operations | 331 | |||
| 15.2 | PAMCO | 332 | |||
| 15.2.1 | Overview and context | 332 | |||
| 15.2.2 | Plant | 332 | |||
| 15.2.2.1 | PAMCO RKEF Plant | 334 | |||
| 15.2.3 | PAMCO MOU | 338 | |||
| 15.2.4 | Basis for tolling fee | 338 | |||
| 15.2.5 | Alloy to matte | 339 | |||
| 15.2.6 | Product quality specifications | 341 | |||
| 15.2.7 | PAMCO Sustainability | 342 | |||
| 15.3 | Long-Term Processing Strategy | 342 | |||
| amcconsultants.com | v |
| Technical Report Summary of Prefeasibility Study of NORI Area D, Clarion Clipperton Zone | |
| TMC the metals company Inc. | 0225054 |
| 15.3.1 | Nodule Processing Beyond 1.3 Mwmtpa | 342 | |||
| 15.3.2 | Indonesian processing cost benchmarking | 344 | |||
| 15.3.3 | Further processing of nodules in the United States | 345 | |||
| 15.4 | Production Plan | 345 | |||
| 16 | Market studies | 347 | |||
| 16.1 | TMC offtake agreement | 347 | |||
| 16.2 | Marketing analysis | 347 | |||
| 16.3 | Market outlook | 348 | |||
| 16.3.1 | Nickel | 348 | |||
| 16.3.2 | Cobalt | 349 | |||
| 16.3.3 | Manganese | 350 | |||
| 16.3.3.1 | EMM and MnSO4 | 350 | |||
| 16.3.4 | Copper | 350 | |||
| 16.4 | TMC manganese silicate | 351 | |||
| 16.5 | TMC matte | 352 | |||
| 16.6 | TMC alloy | 352 | |||
| 16.7 | Refinery Products | 352 | |||
| 16.8 | Revenue forecasts | 352 | |||
| 17 | Environmental studies, permitting, and plans, negotiations, or agreements with local individuals or groups | 355 | |||
| 17.1 | Permitting process | 355 | |||
| 17.1.1 | Overview of Environmental Regulatory Frameworks under international law and the law of the United States of America | 355 | |||
| 17.1.1.1 | International Seabed Authority (ISA) | 355 | |||
| 17.1.1.2 | Role of Sponsoring States | 356 | |||
| 17.1.1.3 | ISA Regulatory Framework | 356 | |||
| 17.1.1.6 | Relevance to the Project | 358 | |||
| 17.1.1.7 | ISA Compliance Status | 359 | |||
| 17.1.2 | National Oceanic and Atmospheric Administration (NOAA) | 359 | |||
| 17.1.2.1 | NOAA Regulatory Framework | 359 | |||
| 17.1.2.1.1. | DSHMRA Regulations for Exploration Licenses | 360 | |||
| 17.1.2.1.2. | DSHMRA Regulations for Commercial Recovery Permit | 360 | |||
| 17.1.2.2 | Relevance to the Project | 362 | |||
| 17.1.2.3 | Compliance status | 362 | |||
| 17.2 | Project approval pathway | 362 | |||
| 17.3 | Environmental Impact Assessment status | 363 | |||
| 17.4 | Environmental Impacts and Mitigation | 365 | |||
| 17.4.1 | Nodule removal | 365 | |||
| 17.4.2 | Benthic plume | 366 | |||
| 17.4.3 | Return water plume | 367 | |||
| 17.4.4 | Carbon | 367 | |||
| 17.4.5 | Noise | 368 | |||
| 17.4.6 | Biodiversity loss | 368 | |||
| 17.4.7 | Reduction in habitat quality and ecosystem function | 368 | |||
| 17.5 | Commitments to local benefits | 369 | |||
| 17.5.1 | Updated Sponsorship Agreement | 369 | |||
| 17.5.2 | Scholarships | 369 | |||
| 17.5.3 | Community Investment | 369 | |||
| 17.5.4 | Stakeholder engagement | 370 | |||
| 18 | Capital and operating costs | 372 | |||
| 18.1 | Execution strategy | 372 | |||
| 18.2 | Detailed operations plan | 373 | |||
| amcconsultants.com | vi |
| Technical Report Summary of Prefeasibility Study of NORI Area D, Clarion Clipperton Zone | |
| TMC the metals company Inc. | 0225054 |
| 18.3 | Baseline operating assumptions | 374 | ||
| 18.4 | CAPEX and OPEX estimate preparation | 375 | ||
| 18.5 | CAPEX | 375 | ||
| 18.5.1 | Production vessel | 376 | ||
| 18.5.2 | Transfer vessel/bulk carriers | 379 | ||
| 18.5.3 | Support vessels | 379 | ||
| 18.5.4 | Processing | 379 | ||
| 18.5.5 | Operations Facilities initial setup | 380 | ||
| 18.5.6 | Professional Services | 380 | ||
| 18.5.7 | Project owners cost | 380 | ||
| 18.5.8 | Contingency | 381 | ||
| 18.5.9 | Escalation | 381 | ||
| 18.5.10 | Allseas capital contribution | 381 | ||
| 18.5.11 | System #2, #3, #4 | 381 | ||
| 18.5.12 | Refining facility | 382 | ||
| 18.5.13 | Sustaining CAPEX | 382 | ||
| 18.5.14 | Closure CAPEX | 383 | ||
| 18.5.15 | CAPEX exclusions | 383 | ||
| 18.6 | OPEX | 384 | ||
| 18.6.1 | Collection Cost | 385 | ||
| 18.6.2 | Transfer and Shipping Costs | 386 | ||
| 18.6.3 | Contractor (offshore) Costs | 387 | ||
| 18.6.4 | Consumables (offshore fuel) Costs | 387 | ||
| 18.6.5 | Processing Costs | 388 | ||
| 18.6.6 | Refining Costs | 389 | ||
| 18.6.7 | Corporate Costs | 390 | ||
| 19 | Economic analysis | 391 | ||
| 19.1 | Cautionary statement regarding forward-looking information | 391 | ||
| 19.2 | Methodology used | 392 | ||
| 19.3 | Economic model parameters | 392 | ||
| 19.4 | Total capital costs | 392 | ||
| 19.5 | Total sustaining costs | 393 | ||
| 19.6 | Total closure costs | 393 | ||
| 19.7 | Total operating costs | 393 | ||
| 19.8 | Commodity prices | 393 | ||
| 19.9 | Recovery rates | 394 | ||
| 19.10 | Payable terms | 394 | ||
| 19.11 | Royalty/continuity payments | 394 | ||
| 19.11.1 | Nauru Continuity Benefits | 395 | ||
| 19.11.2 | Low Carbon Royalty (LCR) | 395 | ||
| 19.12 | Taxes | 395 | ||
| 19.13 | Economic analysis | 395 | ||
| 19.14 | Sensitivity analysis | 417 | ||
| 19.15 | Cash Cost Analysis | 418 | ||
| 19.16 | Conclusion Economic Analysis | 419 | ||
| 20 | Adjacent properties | 420 | ||
| 21 | Other relevant data and information | 421 | ||
| 22 | Interpretation and conclusions | 422 | ||
| 22.1 | Mineral tenure | 422 | ||
| 22.2 | Exploration and data verification | 422 | ||
| 22.3 | Mineral processing testwork | 424 | ||
| 22.4 | Mineral Resource | 424 | ||
| amcconsultants.com | vii |
| Technical Report Summary of Prefeasibility Study of NORI Area D, Clarion Clipperton Zone | |
| TMC the metals company Inc. | 0225054 |
| 22.5 | Mineral Reserve | 425 | |
| 22.6 | Mining methods | 426 | |
| 22.7 | Processing | 427 | |
| 22.8 | Infrastructure | 427 | |
| 22.9 | Market studies | 428 | |
| 22.10 | Environmental studies | 428 | |
| 22.11 | Capital and operating costs | 428 | |
| 22.12 | Economic evaluation | 429 | |
| 23 | Recommendations | 430 | |
| 24 | References | 431 | |
| 25 | Reliance on information provided by registrant | 436 | |
Tables
| Table 1.1 | Mineral Resource for NORI Area D, at 30 June 2025, at 4 wet kg/m2 abundance cut-off inclusive of Mineral Reserve | 29 |
| Table 1.2 | Mineral Resource for NORI Area D, at 30 June 2025, at 4 wet kg/m2 abundance cut-off exclusive of Mineral Reserve | 29 |
| Table 1.3 | Metallurgical recoveries | 32 |
| Table 1.4 | NORI Area D Mineral Reserve at 30 June 2025 | 34 |
| Table 1.5 | Project CAPEX system #1 summary | 36 |
| Table 1.6 | Project CAPEX US refining summary | 36 |
| Table 1.7 | NORI Area D operating cost summary | 37 |
| Table 1.8 | Average product prices assumed in PFS | 37 |
| Table 2.1 | List of Qualified Persons responsible for each Section | 40 |
| Table 2.2 | TMC Qualified Persons responsible for each section | 41 |
| Table 3.1 | NORI Area extents | 48 |
| Table 3.2 | NORI Area block details | 48 |
| Table 5.1 | Summary of historical FFG samples in the NORI Area | 61 |
| Table 6.1 | Nodule Facies in NORI Area D | 71 |
| Table 7.1 | Summary of Data Types Collected by the AUV during the 2018 NORI Campaign | 80 |
| Table 7.2 | Sampling protocol | 86 |
| Table 7.3 | Box Core Sample Coordinates and Nodule Weights- Campaign 3 | 90 |
| Table 7.4 | Box core sample coordinates and nodule weights – Campaign 6 | 107 |
| Table 7.5 | Box Core Sample Coordinates and Nodule Weights - Campaign 7A | 124 |
| Table 7.6 | Box Core Sample Coordinates and Nodule Weights - Campaign 7B | 126 |
| Table 7.7 | Summary of the nodule abundance for the paired sites before and after the test mining | 127 |
| Table 7.8 | Box core sample coordinates and nodule weights - Campaign 8A | 132 |
| Table 7.9 | Masses of nodules recovered by depth and campaign | 136 |
| Table 7.10 | Shape, texture and fragmentation descriptors | 142 |
| Table 7.11 | Summary statistics of multielement chemistry of nodule samples from box cores | 149 |
| Table 7.12 | Summary statistics of multielement chemistry of sediment samples from box cores | 151 |
| Table 7.13 | Chronological summary of MBES acquisition, processing and analysis for NORI Area D. | 152 |
| amcconsultants.com | viii |
| Technical Report Summary of Prefeasibility Study of NORI Area D, Clarion Clipperton Zone | |
| TMC the metals company Inc. | 0225054 |
| Table 7.14 | NORI Area D summary geotechnical soil classification | 179 |
| Table 8.1 | Assay results for NOD-P-1 from off-shore campaigns in 2018, 2019, and 2023 | 190 |
| Table 8.2 | Assay results for NOD-P-1 from off-shore campaigns in 2018, 2019, and 2023 | 191 |
| Table 8.3 | Duplicate average sample grades by laboratory | 193 |
| Table 8.4 | Duplicate average sample grades from ALS | 194 |
| Table 8.5 | Duplicate average sample grades from ALS and BV | 195 |
| Table 8.6 | Primary and duplicate average sample grades from ALS | 197 |
| Table 8.7 | Duplicate average sample grades from ALS | 199 |
| Table 10.1 | Comparison of bulk sample analyses with NORI Area D measured resource for the test mining area | 202 |
| Table 10.2 | Location and testing methods of laboratories used | 203 |
| Table 10.3 | Analytical methods undertaken by each laboratory | 204 |
| Table 10.4 | Nickel laboratory results | 205 |
| Table 10.5 | Copper laboratory results | 205 |
| Table 10.6 | Cobalt laboratory results | 206 |
| Table 10.7 | Manganese laboratory results | 206 |
| Table 10.8 | CRM results for each laboratory | 206 |
| Table 10.9 | Updates to process design criteria after pilot kiln test work | 207 |
| Table 10.10 | Pilot calcine blend assay vs. PEA update mass balance | 207 |
| Table 10.11 | Pilot metal assays vs. PEA update mass balance | 208 |
| Table 10.12 | Pilot smelting slag assays vs. PEA update mass balance | 208 |
| Table 10.13 | Pilot matte assays vs. PEA update mass balance | 209 |
| Table 10.14 | Optimum leach parameters and extractions | 219 |
| Table 10.15 | Optimum leach assays | 220 |
| Table 10.16 | Assays of input and output streams from the CoSX | 220 |
| Table 10.17 | Comparison between TMC's lab-generated cobalt sulfate crystals with an external third-party specification | 220 |
| Table 10.18 | Comparison between TMC's lab-generated nickel sulfate crystals with two external third-party specifications | 221 |
| Table 10.19 | Target specifications for manganese silicate | 222 |
| Table 11.1 | Summary statistics of TOML Area F nodule assays | 223 |
| Table 11.2 | Summary statistics of the 2018 NORI Area D primary assay data | 224 |
| Table 11.3 | Summary statistics of the 2019 NORI Area D primary assay data | 224 |
| Table 11.4 | Summary statistics of the 2022 NORI Area D primary assay data | 225 |
| Table 11.5 | Summary statistics of the 2023 NORI Area D primary assay data | 225 |
| Table 11.6 | Variogram models | 241 |
| Table 11.7 | NORI Area D Grid Model Extents | 244 |
| Table 11.8 | NORI-TOML breakeven cut-off abundance estimate | 247 |
| Table 11.9 | Mineral Resource for NORI Area D, at 30 June 2025, at 4 wet kg/m2 abundance cut-off inclusive of Mineral Reserve | 251 |
| Table 11.10 | Mineral Resource for NORI Area D, at 30 June 2025, at 4 wet kg/m2 abundance cut-off exclusive of Mineral Reserve | 252 |
| Table 12.1 | Environmental Modifying Factors | 257 |
| Table 12.2 | Geotechnical Modifying Factors | 259 |
| Table 12.3 | Geo-obstacle probability in Run 19 by probability class | 261 |
| Table 12.4 | Resource model Modifying Factors | 261 |
| Table 12.5 | Collector system Modifying Factors | 267 |
| Table 12.6 | Nodule Recovery by collection system component (Type 1 nodules) | 268 |
| Table 12.7 | Estimated Nodule Recovery by boxcore location (Type 1 nodules) | 268 |
| Table 12.8 | Deltares test run 6 base case Type 1 Nodule Recovery results | 269 |
| Table 12.9 | Deltares test run 10 Type 2/3 Nodule Recovery results | 271 |
| Table 12.10 | Collection recovery by type and probability class Modifying Factors | 271 |
| Table 12.11 | Nodule processing Modifying Factors | 274 |
| Table 12.12 | Commodity price Modifying Factors | 275 |
| amcconsultants.com | ix |
| Technical Report Summary of Prefeasibility Study of NORI Area D, Clarion Clipperton Zone | |
| TMC the metals company Inc. | 0225054 |
| Table 12.13 | Production targets | 276 |
| Table 12.14 | NORI Area D production schedule | 284 |
| Table 12.15 | NORI Area D Mineral Reserve at 30 June 2025 | 287 |
| Table 14.1 | Simple screening process for various nodule processing flowsheet options | 317 |
| Table 14.2 | Summary of bench-scale test work | 322 |
| Table 14.3 | Summary of pilot scale test work | 323 |
| Table 15.1 | Key Data for PAMCO’s core unit operations at the hachinohe site | 334 |
| Table 15.2 | Agreed upon grades of key pay metals for the alloy as set in the Binding MOU between TMC and PAMCO. | 341 |
| Table 15.3 | Specification for the manganese silicate product generated at PAMCO per the Binding MOU between TMC and PAMCO | 341 |
| Table 15.4 | Total Indonesian processing cost | 345 |
| Table 15.5 | TMC USA PFS production plan, updated July 2025 | 346 |
| Table 16.1 | Metal and metal sulfate price forecasts 2026 onwards (real US$ 2025) | 352 |
| Table 16.2 | Metallurgical recoveries | 353 |
| Table 16.3 | NiCoCu Alloy/Matte Payable terms percentage of LME benchmark prices | 353 |
| Table 16.4 | Forecast payable metal production - metal in alloy | 353 |
| Table 16.5 | Forecast payable metal production - metal in matte | 353 |
| Table 16.6 | Forecast payable refined metal production - metal in sulfate and cathode | 354 |
| Table 16.7 | Forecast production – Mn in Mn silicate | 354 |
| Table 16.8 | Revenue Forecast US$ 2025 Real | 354 |
| Table 17.1 | Stakeholder analysis and engagement | 370 |
| Table 18.1 | Project CAPEX system #1 summary | 376 |
| Table 18.2 | Project CAPEX US refining summary | 376 |
| Table 18.3 | Production vessel CAPEX | 377 |
| Table 18.4 | Transfer vessel/bulk carrier CAPEX | 379 |
| Table 18.5 | Support Vessels CAPEX | 379 |
| Table 18.6 | Operations Facilities CAPEX | 380 |
| Table 18.7 | Professional Services CAPEX | 380 |
| Table 18.8 | Project owners cost CAPEX | 380 |
| Table 18.9 | System #2, #3, #4 recovered summary | 381 |
| Table 18.10 | Refining facility summary | 382 |
| Table 18.11 | Sustaining CAPEX summary | 382 |
| Table 18.12 | Closure CAPEX summary | 383 |
| amcconsultants.com | x |
| Technical Report Summary of Prefeasibility Study of NORI Area D, Clarion Clipperton Zone | |
| TMC the metals company Inc. | 0225054 |
| Table 18.13 | OPEX Summary | 385 |
| Table 18.14 | OPEX Unit Cost US$/wmt Summary | 385 |
| Table 18.15 | Collection Cost OPEX | 385 |
| Table 18.16 | Transfer and Shipping OPEX | 386 |
| Table 18.17 | Contractor (offshore) costs OPEX | 387 |
| Table 18.18 | Consumables (offshore fuel) Costs | 387 |
| Table 18.19 | Processing Costs | 388 |
| Table 18.20 | Refining Costs | 389 |
| Table 18.21 | Corporate Costs | 390 |
| Table 19.1 | Project capital system #1 costs | 392 |
| Table 19.2 | Project capital us refining costs | 393 |
| Table 19.3 | Total operating costs | 393 |
| Table 19.4 | Average LOM commodity prices | 394 |
| Table 19.5 | Recovery rates | 394 |
| Table 19.6 | LOM Average Payable Terms | 394 |
| Table 19.7 | Nauru Continuity Benefits Payment Schedule | 395 |
| Table 19.8 | Summary of forecast Project economics | 396 |
| Table 19.9 | Project Cash Flow on an Annualized basis | 399 |
| Table 19.10 | C1 Nickel Cash Cost | 418 |
| Table 19.11 | All-in Sustaining Cost | 418 |
| Table 20.1 | TOML Area F Mineral Resource estimate, in situ, at a 4 kg/m2 nodule abundance cut-off | 420 |
| Table 20.2 | Summary of Mineral Resources reported for BGR exploration contract area | 420 |
Figures
| Figure 1.1 | Forecast Project Post-Tax Cash Flow (US$M) | 38 |
| Figure 1.2 | Tornado diagram of NPV sensitivity to variables | 39 |
| Figure 3.1 | Map of seafloor jurisdictions | 45 |
| Figure 3.2 | Maritime space under the 1982 UNCLOS | 46 |
| Figure 3.3 | Location of NORI and other exploration areas within the CCZ | 47 |
| Figure 3.4 | Location of NORI blocks in the CCZ | 48 |
| Figure 4.1 | Global cargo shipping network in 2007 | 53 |
| Figure 5.1 | Schematic of Lockheed Group’s 1970s trial mining system | 55 |
| Figure 5.2 | Remote operated collector used by the Lockheed Group in 1970s trial mining | 56 |
| Figure 5.3 | Free fall grab sampler operation | 57 |
| Figure 5.4 | Box core sampler operation | 57 |
| Figure 5.5 | Box plot sample grades in NORI Area compared with data from Reserved Blocks | 62 |
| Figure 6.1. | Location of the CCZ and other deep sea nodule fields | 63 |
| Figure 6.2. | Bathymetric map of the Clarion-Clipperton fracture zone | 64 |
| Figure 6.3 | Map of nickel grade distribution in the CCZ | 66 |
| Figure 6.4 | Map of cobalt grade distribution in the CCZ | 67 |
| Figure 6.5 | Map of copper grade distribution in the CCZ | 68 |
| Figure 6.6 | Map of manganese grade distribution in the CCZ | 69 |
| Figure 6.7 | Map of nodule abundance distribution in the CCZ | 70 |
| amcconsultants.com | xi |
| Technical Report Summary of Prefeasibility Study of NORI Area D, Clarion Clipperton Zone | |
| TMC the metals company Inc. | 0225054 |
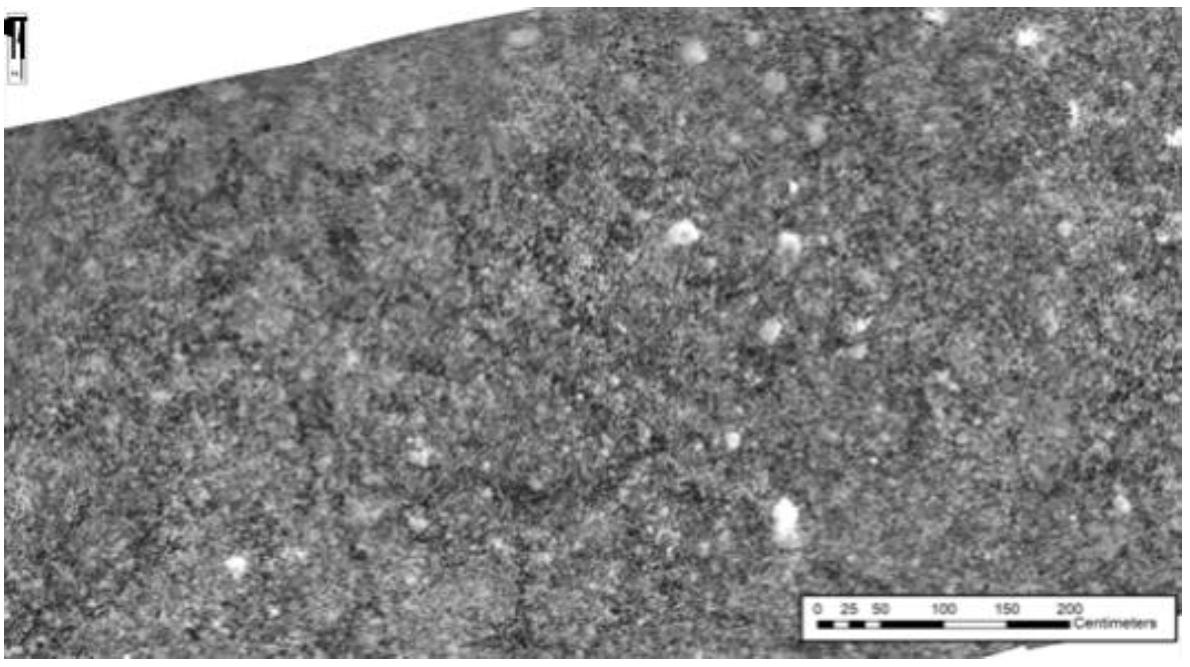
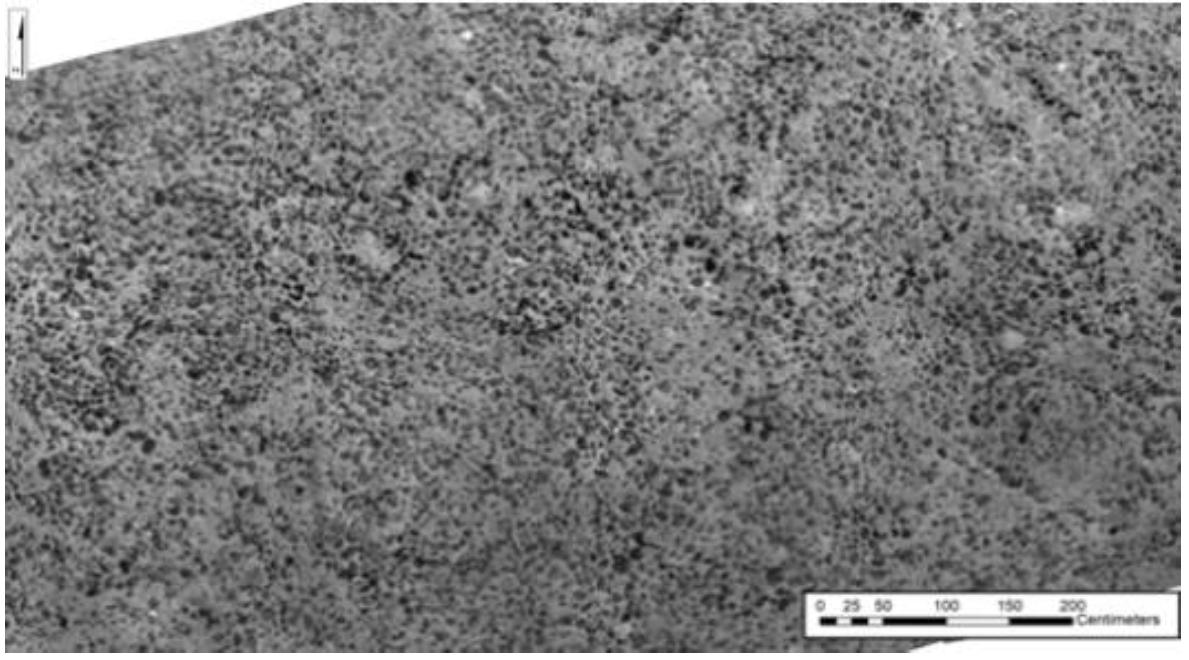
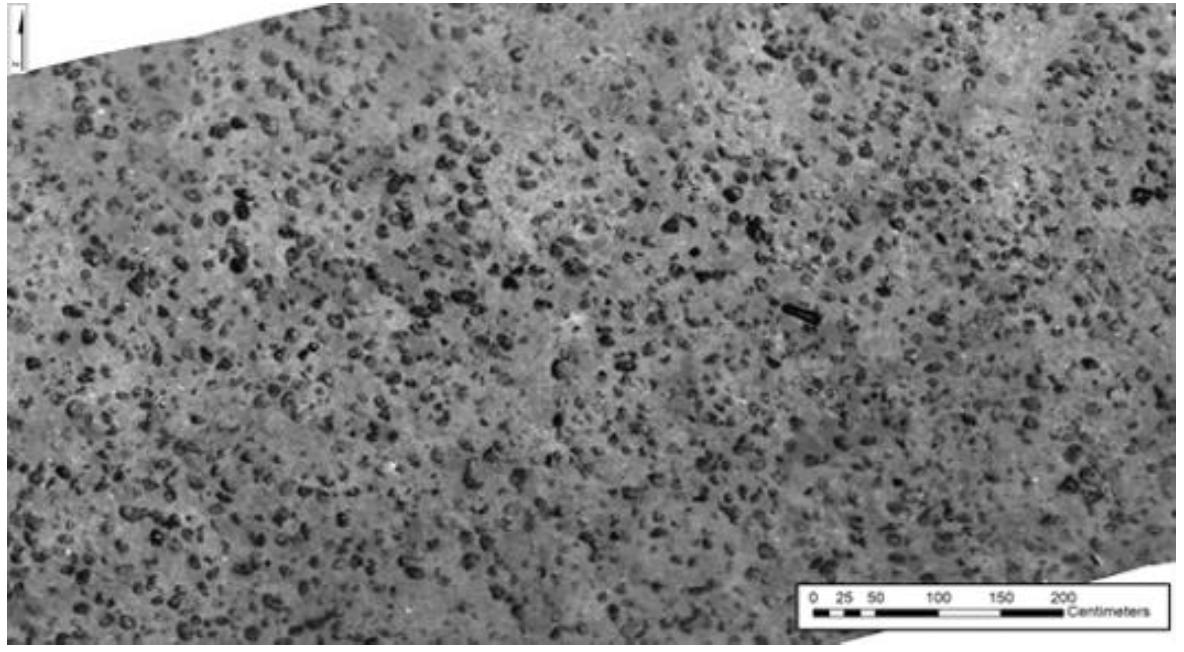
| Figure 6.8 | Camera Imagery Showing Change from Type 3 Nodules (right) to Type 2 (left) | 72 |
| Figure 6.9 | Map of Nodule Classification According to Photographic Traversing by AUV Compared to Backscatter Intensity | 73 |
| Figure 6.10 | Nodule types | 75 |
| Figure 7.1 | Map showing NORI Area D Bathymetry | 76 |
| Figure 7.2 | Reprocessed EM120 Backscatter Data from NORI Area D 2012 Survey | 78 |
| Figure 7.3 | Deployment ESVII Kongsberg Hugin AUV from the stern of the Maersk Launcher | 79 |
| Figure 7.4 | AUV Geosurvey Data Acquired during the 2018 NORI Campaign | 80 |
| Figure 7.5 | KC Denmark 0.75 m² box corer | 82 |
| Figure 7.6 | Box core locations for 2018 NORI Campaign 3 | 83 |
| Figure 7.7 | Sequence of Box Core Land-out Footage from GoPro Camera | 84 |
| Figure 7.8 | On-deck sample processing | 85 |
| Figure 7.9 | Coning and quartering process | 87 |
| Figure 7.10 | Comparison of Image Classifier Results vs. Caliper Measurements | 88 |
| Figure 7.11 | Plan of Box Core locations and Abundance (in wet kg/m²) Campaign 3 | 92 |
| Figure 7.12 | Profile of Nodule Weight by Depth in BC_043 | 93 |
| Figure 7.13 | Comparison of AUV MBES Data (Ribbon) against EM120 Vessel-based MBES | 94 |
| Figure 7.14 | Example of AUV Camera Photo Mosaic and Insets, Showing Nodules | 95 |
| Figure 7.15 | Comparison of Nodule Long Axis Measurements, Taken Using Digital Callipers, and Individual Nodule Wet Weight for BC_001, BC_002, BC_003, and BC_005 | 96 |
| Figure 7.16 | Detail of image processing | 97 |
| Figure 7.17 | Comparison of mean long axes lengths from AUV camera imagery and box cores | 97 |
| Figure 7.18 | Comparison of Felix method and multiple linear regression method | 98 |
| Figure 7.19 | Multiple linear regression model for nodule abundance | 99 |
| Figure 7.20 | Plan of nodule abundance estimates in the test mining site | 100 |
| Figure 7.21 | Box corer on deck showing the USBL beacon mounting position | 101 |
| Figure 7.22 | Box core processing flow sheet for campaign 6B | 102 |
| Figure 7.23 | Plan of box core and gravity core locations, 2019 Campaign 6 | 105 |
| Figure 7.24 | Photographs of geotechnical vane and CPT (left) and plate load test (right) | 106 |
| Figure 7.25 | Photographs of biological and geotechnical tube sampling (C6A left, C6B right) | 106 |
| Figure 7.26 | Plan of NORI Area D showing box core abundances and bathymetry | 113 |
| Figure 7.27 | Relative difference of grade by size fraction - NiO (%) | 114 |
| Figure 7.28 | Relative difference of grade by size fraction - CuO (%) | 115 |
| Figure 7.29 | Relative difference of grade by size fraction - CoO (%) | 115 |
| Figure 7.30 | Relative difference of grade by size fraction - MnO (%) | 116 |
| Figure 7.31 | Proportions of size fractions by mass (relative percentage) | 116 |
| Figure 7.32 | Layout of the nodule processing side of the geology laboratory | 118 |
| Figure 7.33 | Plan of location of CPT tests in box cores and in situ on the seafloor (ROV CPT), Campaign 7A | 120 |
| Figure 7.34 | Box core testing set-up with biological zone divider in place | 121 |
| Figure 7.35 | 10 kN Seabed CPT system mounted to Schilling HD WROV | 122 |
| Figure 7.36 | Plan of test mining site showing C7A box core locations, abundances and bathymetry | 128 |
| amcconsultants.com | xii |
| Technical Report Summary of Prefeasibility Study of NORI Area D, Clarion Clipperton Zone | |
| TMC the metals company Inc. | 0225054 |
| Figure 7.37 | Plan of test mining site showing C7B box core locations, abundances and bathymetry | 129 |
| Figure 7.38 | Plan of box core abundances for campaign 7A and 7B and test mining runs | 130 |
| Figure 7.39 | Plan of C8a box core locations, abundances and bathymetry | 133 |
| Figure 7.40 | Schematic representation of average weight of nodules by depth in the box cores in campaign C3 | 134 |
| Figure 7.41 | Scatter plots showing the contribution by layer to total nodule abundance in box cores | 135 |
| Figure 7.42 | Scatter plot comparing axis lengths of 500 manually measured nodules | 137 |
| Figure 7.43 | Scatter plot of nodule major axis dimension versus nodule intermediate axis dimension for all nodules | 139 |
| Figure 7.44 | Box plots of nodule major axis dimension for all box cores | 140 |
| Figure 7.45 | Log probability plot of nodule major axis dimensions, subdivided by interpreted nodule type domain | 141 |
| Figure 7.46 | Examples of nodules recovered during the NORI 2018 campaign | 143 |
| Figure 7.47 | Pie graphs showing morphology of nodules collected during the 2018 campaign | 144 |
| Figure 7.48 | Histograms of nodule moisture content, NORI Area D | 146 |
| Figure 7.49 | Density data from TOML Areas B, C, D and F and data from Hessler and Jumars (1974) | 148 |
| Figure 7.50 | EM120 bathymetric slope plotted against occurrence of outcropping footwall (hardground), based on SBP, camera and backscatter interpretations (top), and volcanic outcrop occurrence (bottom) | 154 |
| Figure 7.51 | SBP profile and AUV camera transect across outcropping hardground associated with an abyssal hill. | 155 |
| Figure 7.52 | Map of Reprocessed EM120 MBES Slope derivative data | 156 |
| Figure 7.53 | Map of Footwall domains | 157 |
| Figure 7.54 | Map of Nodule facies domains produced from backscatter interpretations, plotted with nodule type from box core logging | 158 |
| Figure 7.55 | Comparison of EM120 vessel-based MBES and AUV EM2040 MBES over an abyssal hill | 160 |
| Figure 7.56 | Comparison of EM120 vessel-based MBES and AUV EM2040 MBES over hummocky terrain. | 160 |
| Figure 7.57 | Map of Slope Probability for NORI Area D | 162 |
| Figure 7.58 | Detail of probability map, showing relationship of intermediate slope probability values with Type 2 and 3 nodule distribution and associated hummocky terrain. | 163 |
| Figure 7.59 | Map of collector test survey site and test mining site, showing location of type-examples of geo-obstacles | 166 |
| Figure 7.60 | Bathymetric derivatives | 168 |
| Figure 7.61 | Comparison of 1 m resolution slope attribute (left) with focal statistic slope, based on a 15 x 15 m focal statistic kernel | 169 |
| Figure 7.62 | Geo-obstacle depression features detected within the collector test survey area | 170 |
| Figure 7.63 | Geo-obstacle data points – including data from collector test survey site and DSAO survey | 171 |
| Figure 7.64 | Geo-obstacle probability heat map | 174 |
| Figure 7.65 | Detail of the northern end of the Campaign 8B survey, showing geo-obstacle mapping | 175 |
| Figure 7.66 | Overview of NORI Area D with geotechnical sample locations | 177 |
| amcconsultants.com | xiii |
| Technical Report Summary of Prefeasibility Study of NORI Area D, Clarion Clipperton Zone | |
| TMC the metals company Inc. | 0225054 |
| Figure 7.67 | NORI Area D collector Test Area with geotechnical locations | 178 |
| Figure 7.68 | NORI Area D maximum measured shear strength (Su kPa by Laboratory Vane) 0.00 to 0.10 m depth | 181 |
| Figure 7.69 | NORI Area D maximum measured shear strength (Su kPa Laboratory Vane) 0.11 to 0.15 m depth | 182 |
| Figure 7.70 | NORI Area D maximum measured shear strength (Su kPa Laboratory Vane) 0.15 to 0.45 m depth | 183 |
| Figure 7.71 | Initial Mining Area measured undrained shear strength by depth | 184 |
| Figure 7.72 | Overlay of in situ seafloor CPT and in Box Core CPT Profiles | 186 |
| Figure 8.1 | Sample storage | 187 |
| Figure 8.2 | Comparison of primary samples assayed at ALS and duplicate samples assayed at ALS | 192 |
| Figure 8.3 | Comparison of primary samples assayed at ALS and duplicate samples assayed at BV | 193 |
| Figure 8.4 | Comparison of primary samples assayed at ALS and duplicate samples assayed at ALS | 194 |
| Figure 8.5 | Comparison of primary samples assayed at ALS and duplicate samples assayed at BV | 195 |
| Figure 8.6 | Comparison of primary and duplicate samples assayed at ALS | 197 |
| Figure 8.7 | Comparison of primary samples assayed at ALS and duplicate samples assayed at ALS | 198 |
| Figure 10.1 | Bulk sampling dredge used to collect the bulk sample for metallurgical pilot tests | 203 |
| Figure 10.2 | Copper partition coefficients during smelting | 210 |
| Figure 10.3 | Nickel and cobalt partition coefficients during smelting | 211 |
| Figure 10.4 | Manganese in metal vs. iron in slag | 212 |
| Figure 10.5 | Phosphorus partition coefficients | 213 |
| Figure 10.6 | Manganese and phosphorus in slag versus iron in slag | 214 |
| Figure 10.7 | Nickel partition coefficients in converting | 215 |
| Figure 10.8 | Copper partition coefficients in converting | 216 |
| Figure 10.9 | Cobalt partition coefficients in converting | 217 |
| Figure 10.10 | Manganese partition coefficients in converting | 218 |
| Figure 11.1 | Map of geological domains in NORI Area D | 227 |
| Figure 11.2 | Proportions of geological domains in NORI Area D | 228 |
| Figure 11.3 | Map of nodule type domains in NORI Area D | 229 |
| Figure 11.4 | Map of Location of Data Points and the NORI Area D Boundary | 230 |
| Figure 11.5 | Pairs plot showing correlations between NORI Area D sample values | 231 |
| Figure 11.6 | Histogram, cumulative probability and mean-variance plots of abundance and grades for NORI Area D nodule samples | 232 |
| Figure 11.7 | Histogram, cumulative probability and mean-variance plots of abundance and grades for NORI Area D nodule samples | 233 |
| Figure 11.8 | Frequency of NORI Area D nodule samples by geological domains | 234 |
| Figure 11.9 | Frequency of NORI Area D nodule samples by nodule type domains | 234 |
| Figure 11.10 | Boxplots of NORI Area D nodule abundance and assays by geological domain | 235 |
| Figure 11.11 | Boxplots of NORI Area D nodule grades by slope angle | 236 |
| Figure 11.12 | Boxplots of NORI Area D nodule abundance and assays by nodule facies domain | 237 |
| amcconsultants.com | xiv |
| Technical Report Summary of Prefeasibility Study of NORI Area D, Clarion Clipperton Zone | |
| TMC the metals company Inc. | 0225054 |
| Figure 11.13 | Scatter plot of NORI Area D nodule abundance versus backscatter | 238 |
| Figure 11.14 | Omni-directional, 065° and 155° directional variograms of acoustic backscatter | 238 |
| Figure 11.15 | Variogram maps of NORI Area D nodule sample assays | 240 |
| Figure 11.16 | Abundance omni-directional, 075° and 165° directional variograms | 241 |
| Figure 11.17 | Nickel omni-directional, 075° and 165° directional variograms | 241 |
| Figure 11.18 | Copper omni-directional, 075°, and 165° directional variograms | 242 |
| Figure 11.19 | Cobalt omni-directional, 075°, and 165° directional variograms | 242 |
| Figure 11.20 | Manganese omni-directional, 075°, and 165° directional variograms | 242 |
| Figure 11.21. | Silicon omni-directional, 075°, and 165° directional variograms | 243 |
| Figure 11.22 | Iron omni-directional, 075°, and 165° directional variograms | 243 |
| Figure 11.23 | Phosphorus omni-directional, 075°, and 165° directional variograms | 243 |
| Figure 11.24. | NORI Area D 500 m by 500 m grid model showing percentage coverage of nodules | 244 |
| Figure 11.25 | Cumulative probability plots comparing nodule samples with IDW and SK estimates | 246 |
| Figure 11.26 | Abundance: probability of exceeding 15% of mean at 90% confidence for quarterly and yearly production | 248 |
| Figure 11.27 | Mineral Resource classification boundaries | 249 |
| Figure 11.28 | Nodule abundance and nodule grades 3.5 km by 3.5 km SK panel estimates for NORI Area D | 250 |
| Figure 11.29 | NORI Area D abundance-tonnage curve | 251 |
| Figure 12.1 | Graphic depicting nodule collection system | 254 |
| Figure 12.2 | Graphic depicting the collector | 255 |
| Figure 12.3 | Graphic depicting seafloor Geo-obstacles in the central section of Runs 19 and 20 | 260 |
| Figure 12.4 | Basic working principle of airlift | 265 |
| Figure 12.5 | Main components of the VTS | 266 |
| Figure 12.6 | Deltares base case Type 1 Nodule Recovery photos | 270 |
| Figure 12.7 | Initial Mining Area within the proposed NORI Area D | 280 |
| Figure 12.8 | Proposed Initial Mining area long collector paths | 281 |
| Figure 12.9 | Proposed Initial Mining Area systematic collector paths | 283 |
| Figure 12.10 | NORI Area D nodule tonnage (wet) production graph | 285 |
| Figure 12.11 | NORI Area D nodule grade | 286 |
| Figure 12.12 | Collector paths mined by year | 286 |
| Figure 13.1 | Illustration of proposed PV (Hidden Gem) with a collector and TV alongside | 290 |
| Figure 13.2 | Drone picture of Hidden Gem, September 2022 | 292 |
| Figure 13.3 | Illustration of the proposed 15 m wide collector on seabed | 293 |
| Figure 13.4 | Illustration of collector track system | 294 |
| Figure 13.5 | Illustration of collector thrust system | 295 |
| Figure 13.6 | Illustration of General Arrangement – nodule pick-up and internal separation system | 296 |
| Figure 13.7 | Illustration of General Arrangement – nozzle height adjustment sensor layout | 297 |
| Figure 13.8 | Flow mixture overview – nodule pick-up system | 297 |
| Figure 13.9 | Illustration of General Arrangement – LARS | 299 |
| Figure 13.10 | Basic airlift configuration | 300 |
| amcconsultants.com | xv |
| Technical Report Summary of Prefeasibility Study of NORI Area D, Clarion Clipperton Zone | |
| TMC the metals company Inc. | 0225054 |
| Figure 13.11 | Block diagram – VTS | 301 |
| Figure 13.12 | General Arrangement – riser handling equipment | 303 |
| Figure 13.13 | Illustration of General Arrangement – nodule handling and storage system | 304 |
| Figure 13.14 | Block diagram – nodule dewatering, handling and storage system | 305 |
| Figure 13.15 | Illustration of General Arrangement – nodule dewatering | 306 |
| Figure 13.16 | Illustration of feeder belt and transverse shuttle conveyor belt, conveyor cover is transparent blue | 307 |
| Figure 13.17 | Illustration of Transverse shuttle conveyor belts, conveyor cover is transparent blue | 308 |
| Figure 13.18 | Illustration of Longitudinal shuttle conveyor belt, conveyor cover in blue | 308 |
| Figure 13.19 | Illustration of General Arrangement – storage holds | 309 |
| Figure 13.20 | Illustration of General Arrangement – nodule offloading system | 310 |
| Figure 13.21 | Illustration of transverse conveyor | 311 |
| Figure 13.22 | Illustration of C-Loop vertical transport conveyor | 312 |
| Figure 13.23 | Illustration of reversible transfer conveyor | 312 |
| Figure 13.24 | Illustration of portside elevating conveyor | 313 |
| Figure 13.25 | Illustration of portside unloading conveyor boom | 314 |
| Figure 13.26 | Illustration of typical Allseas designed nodule transfer vessel | 314 |
| Figure 13.27 | Illustration of TV | 315 |
| Figure 14.1 | 2018 production of manganese ore (blue) compared to TMC’s equivalent project (green) | 318 |
| Figure 14.2 | 2017 Manganese ore consumption by end-use project | 318 |
| Figure 14.3 | Major equipment and associated stream from the pyrometallurgical complex | 319 |
| Figure 14.4 | Major equipment and associated stream from the hydrometallurgical refinery | 321 |
| Figure 14.5 | Schematic of kiln and ancillary equipment as originally configured | 325 |
| Figure 14.6 | Pilot plant rotary kiln, feed-end to right. | 326 |
| Figure 14.7 | Pilot plant dc furnace and ancillary equipment | 327 |
| Figure 14.8 | DC Furnace Dimensions | 328 |
| Figure 15.1 | Google satellite view of the PAMCO facility and adjacent port and stockyard | 333 |
| Figure 15.2 | Google satellite view of the port unloading area and identification of conveying system used to transport nodules into process plant | 334 |
| Figure 15.3 | Nodules are fed into the PAMCO kiln through a conveying system | 335 |
| Figure 15.4 | PAMCO’s #6 kiln | 336 |
| Figure 15.5 | PAMCO’s slag storage area: slag is left to cool and organized before shipment | 337 |
| Figure 15.6 | Molten alloy tapped into moulds at PAMCO | 337 |
| Figure 15.7 | PAMCO facility layout with potential location of converter aisle | 340 |
| Figure 15.8 | Total 2023 production capacity for ferronickel and nickel pig iron smelting, and number of existing smelting facilities by country | 342 |
| Figure 15.9 | Rapid increase in Indonesian laterite ore demand, decreasing saprolite ore grades and increased ore imports from the Philippines. | 343 |
| Figure 17.1 | Plan of Work approval process | 358 |
| Figure 17.2 | Commercial Recovery Permit Approval Process | 361 |
| Figure 17.3 | Status of the NORI Area D the environmental assessment process | 363 |
| Figure 17.4 | Data to inform the NORI D Environmental Impact Statement has been collected from 22 offshore campaigns over 12 years | 364 |
| amcconsultants.com | xvi |
| Technical Report Summary of Prefeasibility Study of NORI Area D, Clarion Clipperton Zone | |
| TMC the metals company Inc. | 0225054 |
| Figure 17.5 | Primary work packages and list of original studies | 364 |
| Figure 17.6 | Qualitative data show individual organisms are present and alive one year following collection test, even right next to the collector tracks | 365 |
| Figure 17.7 | Test mining footage showing that the benthic plume stays just above the seafloor | 367 |
| Figure 18.1 | Illustration depicting proposed execution strategy | 373 |
| Figure 19.1 | Forecast Project post-tax free cash flow (US$ M) | 396 |
| Figure 19.2 | Tornado Graph | 417 |
| amcconsultants.com | xvii |
| Technical Report Summary of Prefeasibility Study of NORI Area D, Clarion Clipperton Zone | |
| TMC the metals company Inc. | 0225054 |
List of acronyms
| AAS | Atomic absorption spectroscopy |
| AC | Alternating current |
| AL | Atmospheric Leach |
| ALS | ALS Laboratory Group |
| AMC | AMC Consultants Pty Ltd |
| AMR | Arbeitsgemeinschaft Meerestechnisch Rohstoffe |
| APEI | Area of Particular Environmental Interest |
| AUV | Autonomous underwater vehicle |
| BC | Box core |
| BGR | German Federal Institute for Geosciences and Natural Resources |
| BMI | Benchmark Mineral Intelligence |
| BV | Bureau Veritas laboratory |
| CAGR | Compound annual growth rate |
| CCZ | Clarion-Clipperton Zone |
| CIF | Cost, insurance and freight |
| CIM | Canadian Institute of Mining, Metallurgy and Petroleum |
| CoV | Coefficient of variation |
| CRU | CRU International Limited |
| CV | Collector vehicle |
| The Convention | United Nations Convention on the Law of the Sea 1982 |
| DC | Direct current |
| DeepGreen | DeepGreen Metals Inc. |
| DGE | DeepGreen Engineering Pte. Ltd. |
| DHI | DHI Water and Environment |
| DISCOL | Disturbance and Recolonisation Experiment |
| DOMES | Deep Ocean Mining Environmental Study |
| DP | Dynamic positioning |
| DRC | Democratic Republic of Congo |
| DSHMRA | Deep Sea Hard Mineral Resources Act |
| EF | Electric furnace |
| EIA | Environmental Impact Assessment |
| EIS | Environmental Impact Statement |
| EMMP | Environmental Management and Monitoring Plan |
| EMS | Environmental Management System |
| ESG | Environment, social and governance |
| ESIA | Environmental and social impact assessment |
| EV | Electric vehicle |
| FFG | Free-fall grab samplers |
| FLS | FLSmidth |
| FOB | Free on board |
| FV | Finishing vessel |
| Glencore | Glencore International Ag |
| Golder | Golder Associates Pty Ltd. |
| HPAL | High-pressure acid leaching |
| amcconsultants.com | 18 |
| Technical Report Summary of Prefeasibility Study of NORI Area D, Clarion Clipperton Zone | |
| TMC the metals company Inc. | 0225054 |
| HPMSM | High-purity MnSO₄ monohydrate |
| Hs | Significant wave height |
| IA | Initial Assessment |
| ICP-MS | Inductively coupled plasma mass spectrometry |
| ID | Inside diameter |
| IDW | Inverse Distance Weighting – an estimation method utilising distance-weighted local averages |
| Inco | International Nickel Corporation |
| IOM | lnteroceanmetal Joint Organisation |
| IMDG | The International Maritime Dangerous Goods Code |
| IMSBC | International Maritime Solid Bulk Cargoes Code |
| IRR | Internal rate of return |
| ISA | International Seabed Authority |
| IX | Ion exchange |
| KPM | Kingston Process Metallurgy |
| LARS | Launch and recovery system |
| LED | Light-emitting diode |
| LME | London Metal Exchange |
| LRMC | Long Run Marginal Cost |
| MBES | Multi-beam echo sounder |
| MHP | mixed hydroxide precipitate |
| MSP | mixed sulfide precipitate |
| MOU | Memorandum of understanding |
| NI 43-101 | Canadian National Instrument 43-101 |
| NOAA | National Oceanic and Atmospheric Administration |
| NORI | Nauru Ocean Resources Inc. |
| NN | Nearest neighbour estimation method |
| NOAA | National Oceanic and Atmospheric Administration |
| NPI | Nickel pig iron |
| NPV | Net present value |
| OD | Outside diameter |
| OK | Ordinary kriging – an estimation method utilising distance-weighted local averages |
| OMI | Ocean Mining Inc. |
| OMCO | Ocean Minerals Company |
| PAMCO | Pacific Metals Company |
| PEA | Preliminary economic assessment |
| PFS | Pre-feasibility study |
| PLS | Pregnant liquor/leach solution |
| POX | Pressure oxidative leaching |
| PRZ | Preservation reference zone |
| PSD | Particle size distribution |
| PV | Production vessel |
| QA/QC | Quality assurance and quality control |
| QP | Qualified Person, as defined by Canadian National Instrument 43-101 |
| R-type | Rough type nodules |
| Regulations | Regulations on Prospecting and Exploration for Polymetallic Nodules in the Area |
| ROV | Remotely operated vehicle |
| amcconsultants.com | 19 |
| Technical Report Summary of Prefeasibility Study of NORI Area D, Clarion Clipperton Zone | |
| TMC the metals company Inc. | 0225054 |
| RKEF | Rotary kiln and electric furnace |
| SBP | Sub-bottom profiler |
| SGS | SGS Lakefield, Ontario |
| SLN | Société le Niquel |
| SMM | Shanghai Metal Markets |
| S-R-type | Smooth-rough type nodules |
| SSS | Sidescan sonar |
| S-K 1300 | Subpart 1300 of Regulation S-K promulgated by the US Securities and Exchange Commission |
| S-type | Smooth type nodules |
| SV | Support vessel |
| SVP | Sound velocity profiler |
| SX | Solvent extraction |
| TOC | Total organic carbon |
| TOML | Tonga Off-shore Mining Limited |
| TMC | TMC the metals company Inc. |
| TMC USA | The Metals Company USA LLC |
| TV | Transfer vessel |
| UN | United Nations |
| UNCLOS | United Nations Convention on the Law of the Sea |
| USBL | Ultra-short baseline |
| U.S. | United States |
| UTM | Universal Transverse Mercator Cartesian coordinate system |
| UTP | Underwater transponder array |
| Var | Variance |
| VTS | Vertical transport system |
| WROV | Work Class remotely operated vehicle |
| XPS | eXpert Process Solutions, a division of Glencore |
| XRF | X-ray fluorescence analysis |
| Yuzhmorgeologiya | State Enterprise Yuzhmorgeologiya (Russian Federation) |
| amcconsultants.com | 20 |
| Technical Report Summary of Prefeasibility Study of NORI Area D, Clarion Clipperton Zone | |
| TMC the metals company Inc. | 0225054 |
List of elements
| Al | Aluminium |
| As | arsenic |
| Ba | barium |
| Ca | calcium |
| Cd | cadmium |
| Ce | cerium |
| Cl | chlorine |
| Co | cobalt |
| Cu | copper |
| Fe | iron |
| H2O | hydrogen dioxide |
| H2S | hydrogen sulphide |
| K | potassium |
| La | lanthanum |
| Mg | magnesium |
| Mn | manganese |
| MnO | manganese oxide |
| MnO2 | manganese dioxide |
| Mo | molybdenum |
| Na | sodium |
| NaHS | sodium hydro sulphide |
| Na2S | sodium sulphide |
| Nd | neodymium |
| Ni | nickel |
| P | phosphorus |
| Pb | lead |
| REE | rare earth elements |
| S | sulphur |
| SiO2 | silicon dioxide |
| Sr | strontium |
| Ti | titanium |
| V | vanadium |
| Y | yttrium |
| Zn | zinc |
| Zr | zirconium |
| amcconsultants.com | 21 |
| Technical Report Summary of Prefeasibility Study of NORI Area D, Clarion Clipperton Zone | |
| TMC the metals company Inc. | 0225054 |
List of units
| ° | degree |
| °C | degrees Celsius |
| % | percent |
| % w/w | % mass/mass or weight |
| µm | microns |
| cm | centimetre |
| cm/s | centimetre per second |
| dmtu | dry metric tonne unit |
| G | gram |
| GWh | gigawatt-hours |
| kg | kilogram |
| kg/m² | kilograms per square metre (surface abundance) |
| km | kilometre |
| km² | square kilometre |
| kPa | kilopascal |
| kt | kilotonne (metric) |
| kt/a | kilotonnes (metric) per annum |
| kWh/h | kilowatt hours per hour |
| kWh/t | kilowatt hours per tonne |
| Kn | Knots (nautical miles per hour) |
| Lb | pound |
| m | metre |
| m/h | metres per hours |
| m/s | metres per second |
| m2 | square metre |
| m3 | cubic metre |
| m³/y | cubic metres per year |
| mbsl | metres below sea level |
| mg/L | milligrams per litre |
| mm | millimetre |
| MPa | megapascal |
| mt | metric tonnes |
| Mmt | million tonnes |
| Mmtpa | million tonnes per annum |
| Mwmt | million wet metric tonnes |
| Mwmtpa | million wet metric tonnes per annum |
| mV | millivolt |
| MW | megawatt |
| nm | nautical mile |
| ppm | parts per million |
| ppmw | parts per million weight |
| s | second |
| t | tonne (metric) |
| t/d | tonnes (metric) per day |
| t/h | tonnes (metric) per hour |
| amcconsultants.com | 22 |
| Technical Report Summary of Prefeasibility Study of NORI Area D, Clarion Clipperton Zone | |
| TMC the metals company Inc. | 0225054 |
| US$ | United States dollar |
| wmt | Wet metric tonnes |
| y | year |
| amcconsultants.com | 23 |
| Technical Report Summary of Prefeasibility Study of NORI Area D, Clarion Clipperton Zone | |
| TMC the metals company Inc. | 0225054 |
| 1 | Executive summary |
| 1.1 | Property description (including mineral rights) and ownership |
The world’s largest undeveloped deposit of manganese, nickel and cobalt and significant copper resource is hosted by polymetallic nodules (nodules) located on the seafloor in the Clarion-Clipperton Zone (CCZ) of the north-east Pacific Ocean. TMC the metals company Inc. (TMC) has identified the potential to recover metals from polymetallic nodules to support increasing demand from electrification, electric vehicle battery and stainless-steel demand. TMC, working with offshore partner Allseas SA (Allseas) and onshore partner Pacific Metals Co Ltd (PAMCO), has developed and demonstrated nodule collection and processing systems that can generate nickel, copper, cobalt and manganese products with little to no solid waste.
Four consortia of offshore development companies demonstrated the technical feasibility of collecting, lifting, and converting nodules into metals in the 1970s, but development of the industry was frustrated by the absence of regulation and a governing body. In 1994, the United Nations (UN) established the International Seabed Authority (ISA) pursuant to the UN Convention on the Law of the Sea (UNCLOS). The ISA governs the development of seabed
resources for UNCLOS member states in the territories beyond the exclusive economic zones governed by coastal states. This international territory is known as the Area.
In 2010, the ISA adopted Regulations on Prospecting and Exploration for Polymetallic Nodules in the Area. In July 2011, the ISA granted TMC subsidiary, Nauru Ocean Resources Inc (NORI) an exploration contract covering four areas in the CCZ (NORI Area A, B, C, and D (the Property)). The NORI Exploration Contract was granted by the ISA for a period of 15 years which may be extended for periods of five years at a time, provided NORI has made efforts in good faith to comply with the requirements of the plan of work. The Exploration Contract does not confer any commercial production rights. A separate Plan of Work for exploitation must be submitted and approved by the ISA Council in accordance with the Mining Code before any commercial recovery may occur.
NORI is sponsored, under the ISA, to carry out its mineral exploration activities in the Property by the Republic of Nauru, pursuant to a certificate of sponsorship signed by the Government of Nauru on 11 April 2011.
The ISA is in the process of negotiating the exploitation regulations for development of seabed resources from the CCZ and other resources in the Area. At the time of this report, the ISA is yet to finalize the Mining Code, including Regulations on the Exploitation of Mineral Resources in the Area as required under UNCLOS.
In 1980, the United States (U.S.) enacted the Deep Seabed Hard Mineral Resources Act ((DSHMRA) 30 U.S.C. §1401 et seq.) authorizing the National Oceanic and Atmospheric Administration (NOAA) to issue licenses for exploration and permits for commercial recovery from the deep seabed. These activities are limited to areas beyond national jurisdiction and are intended to ensure that U.S. entities can participate in seabed mining despite the United States not being a party to the UNCLOS or the 1994 Implementation Agreement.
TMC, through its wholly owned subsidiary The Metals Company USA LLC (TMC USA) applied for exploration licences and commercial recovery permits over the NORI D area under DSHMRA. The relevant applications are summarized below:
| · | Exploration License for the USA-A Area which covers 65,186 km2 in the CCZ. | |
| · | Commercial Recovery Permit for USA-A which covers 25,160 km2 in the CCZ (NORI Area D). | |
| · | USA-A includes the existing ISA approved exploration Area identified as NORI Area D. |
| amcconsultants.com | 24 |
| Technical Report Summary of Prefeasibility Study of NORI Area D, Clarion Clipperton Zone | |
| TMC the metals company Inc. | 0225054 |
These applications are still under review and commencement of Commercial Recovery by TMC USA is subject to approval of the license and permit under DSHMRA.
At the time of writing this report, TMC USA does not hold any exploration licenses or commercial recovery permits under the DSHMRA framework. However as stated above, TMC USA has submitted applications for such rights, and subject to regulatory review and approval, anticipates that any future commercial recovery activities would be conducted pursuant to a permit issued by NOAA under the U.S. legal regime. Any reference in this Technical Report Summary to activities proposed to be conducted by TMC USA is inherently uncertain and should be considered forward-looking in nature. No assurance can be given that any permit under DSHMRA will be issued, or that if issued, such permit will contain terms and conditions commercially or operationally viable for the Project.
TMC, in conjunction with Allseas, PAMCO, and specialist service providers, has now completed a pre-feasibility study (PFS) to evaluate collection and processing systems and the technical and economic viability of collecting, transporting and processing nodules from NORI Area D and marketing the products. As part of that PFS, TMC commissioned AMC Consultants Pty Ltd (AMC) to provide specialist independent advice throughout the PFS, develop an updated estimate of Mineral Resources contained in NORI Area D, undertake evaluation of relevant modifying factors required to convert Mineral Resources to Mineral Reserves at a minimum of a PFS level of assessment, and compile a Technical Report Summary, compliant with SEC Regulation S-K (subpart 1300), to report the updated Mineral Resource and the initial Mineral Reserve.
A phased development is outlined for NORI Area D. Each offshore collection system comprises collectors on the seafloor, a vertical transport system, and production vessel that will collect polymetallic nodules. The nodules will be transferred from the production vessel to a transfer vessel. The transfer vessel will load bulk carriers, and the polymetallic nodules will be shipped to on-shore processing facilities, where established processing technology will be used to produce manganese silicate, a feedstock for silico-manganese alloy production used in steel making, and nickel-cobalt-copper alloy and nickel-cobalt-copper matte, which is used in energy, defense, manufacturing, and infrastructure.
TMC, Allseas, and AMC have developed a mine plan for NORI Area D including an Initial Mining Area. The Initial Mining Area was selected based on similarity to the Test Mining Area and includes planned initial runs 19 and 20.
A converted drillship, the Hidden Gem, reclassed as the world’s first deepwater mining ship, was used by NORI to support successful test mining in 2022 (Test Mining), where 3,000 wet metric tonnes (wmt) of nodules were lifted to the surface. Learnings from the Test Mining and further testing and modelling completed by Allseas has informed development of the commercial-scale system, which will initially involve further modification of the Hidden Gem to incorporate two 15 m collectors (one operating on the seabed and one on deck being maintained) to commence production with an annual production rate of 1.5 million wet metric tonnes per annum (Mwmtpa). Production will be upgraded to two collectors operating in parallel on the seabed once operating procedures are refined (3.0 Mwmtpa per production vessel). This PFS envisages that subsequently, three further production vessels will be progressively deployed to achieve a nominal production rate of 12 Mwmtpa and average annual production of 10.5 Mwmtpa nodules (allowing for 5 yearly vessel dry dock inspections). This phased approach to development allows TMC USA to manage risk by progressively developing engineering and operating systems and adopting an adaptive management approach to environmental management. This development plan is preliminary in nature and subject to significant regulatory, technical, and financing contingencies.
In November 2023, TMC signed a binding memorandum of understanding (MOU) with PAMCO to complete a feasibility study (PAMCO FS) to process nodules through their Hachinohe facility to produce nickel-cobalt-copper alloy and nickel-cobalt-copper matte, and manganese silicate product. This followed flowsheet definition and piloting at 70 mt scale by TMC, in association with Hatch Pty Ltd (Hatch), FLSmidth Inc. (FLS) and XPS Expert Process Solutions (XPS, is a subsidiary of Glencore) and completion of a PFS by PAMCO, during which a 22 mt nodule sample was tested.
| amcconsultants.com | 25 |
| Technical Report Summary of Prefeasibility Study of NORI Area D, Clarion Clipperton Zone | |
| TMC the metals company Inc. | 0225054 |
TMC and PAMCO together conducted the first commercial scale calcining operations on nodules. NORI supplied 2,000 wmt of nodules from their Test Mining, with roughly 500 wmt of calcined material generated. A subsequent commercial scale smelting test using PAMCO’s 4,000 kVA furnace, previously used for fly ash processing, was completed in Q1 2025.
As of the effective date of this Report, no binding commercial agreement has been entered into for the processing of NORI nodules by PAMCO, and all references to tolling or processing in Japan are forward-looking and contingent on further negotiation, permitting, and technical validation.
Existing capacity to process and refine nodules does not currently exist in the United States, and this has informed TMC’s strategy to use PAMCO and Indonesia to generate matte. In early years of operation, the matte will be sold to customers who will then process in their existing refineries. Beginning in Year 6 of operations, TMC USA intends to begin processing matte at a newly built US-based refinery. The refining facility will produce nickel sulfate, cobalt sulfate, copper cathode, and ammonium sulfate.
TMC recently completed a study evaluating possible refinery site locations in the U.S. The study also included a preliminary refinery design, plant layout, permitting and construction execution schedule schedules and 2025 basis capital and operating costs.
For the PFS, TMC has adopted an execution strategy in the economic analysis based on capital-light strategic partnerships. The PFS indicates that development of the NORI Area D Property is technically and economically viable.
| 1.2 | Location |
The CCZ is located in international waters between Hawaii and Mexico. The western end of the CCZ is approximately 1,000 km south of the Hawaiian island group. From here, the CCZ extends over 4,500 km east-northeast, in an approximately 750 km wide trend, with the eastern limits approximately 2,000 km west of southern Mexico. The region is well-located to ship nodules to the American continent or across the Pacific to Japan and Indonesia. NORI Area D, for which the Mineral Resource and Mineral Reserve were estimated, covers 25,160 km2 and is the easternmost of the four NORI exploration areas. Its center point is at latitude 10° 29’ N and longitude 116° 57’ W, approximately 850 km due west of the nearest land—the uninhabited Clipperton Island.
| 1.3 | Regulatory environment and the NORI tenement |
The principal regulatory environments governing the international seabed area include:
| · | The UN Convention on the Law of the Sea, of 10 December 1982 (The Convention). | |
| · | The 1994 Agreement relating to the Implementation of Part XI of the UN Convention on the Law of the Sea of 10 December 1982 (the 1994 implementation Agreement). | |
| · | The Deep Seabed Hard Mineral Resources Act (DSHMRA) (30 U.S.C. §1401 et seq.) |
Part XI of the Convention and the 1994 Implementation Agreement deals with mineral exploration and exploitation in the Area, providing a framework for entities to obtain legal title to areas of the seafloor from the ISA for the purpose of exploration and eventually exploitation of resources.
| amcconsultants.com | 26 |
| Technical Report Summary of Prefeasibility Study of NORI Area D, Clarion Clipperton Zone | |
| TMC the metals company Inc. | 0225054 |
The Convention entered into force on 16 November 1994. As of October 2024, the Convention had been signed by 169 States Parties1 and the European Union. The United States of America is currently not a party to the Convention.
The Deep Seabed Hard Mineral Resources Act, enacted in 1980 by the U.S., authorizes the issuance of Exploration Licenses and Commercial Recovery Permits over the deep seabed. These activities are limited to areas beyond national jurisdiction and are intended to ensure U.S. entities can participate in seabed mining despite not being party to UNCLOS.
To date, the ISA has issued regulations on prospecting and exploration for polymetallic nodules in the Area.
At the time of this report, the ISA is yet to finalize the Mining Code, including Regulations on the Exploitation of Mineral Resources in the Area as required under UNCLOS.
Consequently, TMC, through its wholly owned subsidiary TMC USA on 28 April 2025 submitted applications for two exploration licenses and a commercial recovery permit under the U.S. regulatory regime governed by DSHMRA.
These applications are still under review and TMC’s claim to these areas under DSHMRA are subject to approval of these licenses and permits by NOAA. NOAA has advised TMC USA that the exploration license applications are substantially complete, which provides TMC USA with the priority right to areas subject to application, which includes NORI Area D, for the duration of the application process. TMC hold minerals rights to the NORI Area D through their subsidiary NORI under an Exploration Contract with the ISA.
| 1.4 | Geology and Mineral Resources |
Seafloor polymetallic nodules occur in all oceans, but the CCZ hosts a relatively high abundance of particularly nickel and copper-rich nodules. The CCZ seafloor forms part of the Abyssal Plains, which are the largest physiographic province on Earth.
The average depth of the seafloor in the Project Area is 3,800 to 4,200 m. The Abyssal Plains are traversed by ridges, with amplitude of 50 to 300 m (maximum 1,000 m) to the west and wavelength of 1 to 10 km. The Abyssal Plains are punctuated by inactive volcanoes rising 500 to 2,000 m above the seafloor.
Seafloor polymetallic nodules rest on the seafloor at the seawater - sediment interface. They are composed of nuclei and concentric layers of manganese and iron hydroxides and are formed by precipitation of metals from surrounding seawater and sediment pore waters. Nickel, cobalt and copper are also precipitated and occur within the structure of the manganese and iron minerals.
Nodules are abundant in abyssal areas with oxygenated bottom waters and low sedimentation rates (less than 10 cm per thousand years). Nodules generally range from about 1 to 12 cm in their longest dimension. Nodules of 1 to 5 cm are typically the most common in NORI Area D, where they have been classified as Type 1 nodules.
The specific conditions of the CCZ (water depth, latitude, and seafloor sediment type) are considered to be the key controls for the formation of polymetallic nodules.
Information on the mineralization within NORI Area D comprises a combination of sampling undertaken by NORI as well as free-fall grab sampler (FFG) and box core sampler (BC) data supplied by the ISA at the time of the NORI Area D exploration application. Additional regional data, assembled by the ISA as part of its Geological Model Project during 2008 to 2010 (ISA 2010), are available. The data provides significant coverage over NORI Area D and indicates a high abundance of nodules in this region, as has been confirmed by NORI's exploration.
1 https://itlos.org/en/main/the-tribunal/states-parties/
| amcconsultants.com | 27 |
| Technical Report Summary of Prefeasibility Study of NORI Area D, Clarion Clipperton Zone | |
| TMC the metals company Inc. | 0225054 |
NORI completed offshore exploration campaigns in 2012, 2013, 2018, 2019, 2020, 2021, 2022, and 2023 / 2024. During these campaigns, a variety of resource evaluation data was collected including:
| · | Bathymetric mapping of the whole of NORI Area D using a hull-mounted Kongsberg Simrad EM120 12 kHz, full-ocean depth multibeam echo-sounding system (MBES). This system also provided backscatter data from which seafloor characteristics could be interpreted. | |
| · | Detailed seafloor survey work with an autonomous underwater vehicle (AUV), utilizing an MBES, Side Scan Sonar (SSS), Sub-Bottom Profiler (SBP), and camera payload. | |
| · | A total of 252 box core samples collected using a 0.75 m2 box corer, mainly on a 10 km by 10 km square grid. | |
| · | Additional 36 box core samples were collected to better define resources ahead of the 2022 Test Mining and to evaluate mining nodule recovery. | |
| · | 57 in-situ cone penetrometer tests were completed ahead of and following the 2022 Test Mining. |
The nodules in the box cores were collected and their characteristics measured and recorded in detail. Samples of nodules were collected in duplicate and for initial campaigns assayed at two reputable, well-qualified laboratories: ALS Limited (ALS) and Bureau Veritas SA (Bureau Veritas). Subsequently, samples were assayed at ALS, with every tenth samples checked by Bureau Veritas. Certified reference material, and blank samples were inserted to provide additional levels of quality control. No significant issues were identified with the assay results.
The backscatter data and the sidescan sonar and seafloor photography indicate strong continuity of nodule abundance across NORI Area D. There is a clear relationship between nodule long axis length and nodule weight and, therefore, it is possible to estimate nodule abundance from photographs. Several estimation techniques were tested, and methodologies were developed that are suitable for closely packed (Type 1) and less closely packed (Type 2 and 3) nodules.
Interpretation of detailed AUV derived bathymetric data identified geo-obstacles that have the potential to impact nodule collection efficiency. A computer model was developed to predict where these features are likely to occur. The model used data about slopes, ruggedness, and other landscape details and identified patterns linked to geological structures like ridges and volcanic seamounts. The model, correlating well with observed data, highlights geological trends influencing obstacle distribution and informs mine-planning by predicting regions likely to impact collector performance.
Mineral Resources were estimated using a two-dimensional block model. Estimates of nodule abundance and nickel, manganese, cobalt, and copper grades were performed using kriging. A variety of methods was used to validate the estimates, including conditional simulation. The estimates of nodule abundance were used to calculate the tonnage of the Mineral Resources.
Bathymetric mapping enabled the interpretation of parts of seafloor that are possibly too steep for recovery of nodules using the systems considered in this Technical Report summary. Seafloor areas with slopes steeper than 6° were excised from the 2024 Mineral Resource estimate.
The Mineral Resource at 30 June 2025, at an abundance cut-off of 4 wet kg/m2, and in accordance with SEC Regulation S-K (subpart 1300) (S-K 1300) is stated inclusive of those Mineral Resources converted to Mineral Reserves in Table 1.1. Estimates are reported on a wet nodule abundance basis, assuming 28% moisture content (mass of water)/(mass of solids + water).
| amcconsultants.com | 28 |
| Technical Report Summary of Prefeasibility Study of NORI Area D, Clarion Clipperton Zone | |
| TMC the metals company Inc. | 0225054 |
| Table 1.1 | Mineral Resource for NORI Area D, at 30 June 2025, at 4 wet kg/m2 abundance cut-off inclusive of Mineral Reserve |
| Category | Tonnes (Mwmt) |
Abundance (wet kg/m2) |
Ni (%) |
Cu (%) |
Co (%) |
Mn (%) |
Si (%) |
Fe (%) |
P (%) |
MnO: SiO2 |
| Inferred | 11 | 15.4 | 1.38 | 1.14 | 0.12 | 30.96 | 5.46 | 6.92 | 0.16 | 3.42 |
| Indicated | 347 | 17.4 | 1.40 | 1.14 | 0.14 | 31.15 | 5.45 | 6.84 | 0.16 | 3.46 |
| Measured | 5 | 20.6 | 1.41 | 1.15 | 0.13 | 31.91 | 5.16 | 6.59 | 0.15 | 3.73 |
| All | 363 | 17.4 | 1.40 | 1.14 | 0.14 | 31.15 | 5.44 | 6.83 | 0.16 | 3.46 |
Notes:
| 1. | Effective date of the Mineral Resource is 30 June 2025. |
| 2. | Moisture content assumed to be 28% (mass of solid/(mass of solid + mass of water). |
| 3. | The volcanic outcrop, volcanic high, volcanic cones, sediment drift, and high-slope (>6°) domains were excluded from the estimate. |
| 4. | Samples collected by the Pioneer Contractors were excluded due to the lower level of confidence associated with this data and their replacement by box core data collected by TMC. |
| 5. | Abundance cut-off and assumption of reasonable prospects for economic extraction are based on the engineering, metallurgical, environmental, scientific and other studies presented in this report. |
| 6. | Rounding estimates to two significant figures may result in computational discrepancies. |
The Mineral Resource at 30 June 2025, at an abundance cut-off of 4 wet kg/m2, and in accordance with SEC Regulation S-K (subpart 1300) (S-K 1300) exclusive of those Mineral Resources converted to Mineral Reserves is stated in Table 1.1. Estimates are reported on a wet nodule abundance basis, assuming 28% moisture content (mass of water)/(mass of solids + water).
| Table 1.2 | Mineral Resource for NORI Area D, at 30 June 2025, at 4 wet kg/m2 abundance cut-off exclusive of Mineral Reserve |
| Category | Tonnes (Mwmt) |
Abundance (wet kg/m2) |
Ni (%) |
Cu (%) |
Co (%) |
Mn (%) |
Si (%) |
Fe (%) |
P (%) |
MnO: SiO2 |
| Inferred | 10 | 15.4 | 1.4 | 1.1 | 0.12 | 31 | 5.46 | 6.92 | 0.16 | 3.42 |
| Indicated | 261 | 17.4 | 1.4 | 1.1 | 0.14 | 31 | 5.45 | 6.84 | 0.16 | 3.46 |
| Measured | 4 | 20.6 | 1.4 | 1.2 | 0.13 | 32 | 5.16 | 6.59 | 0.15 | 3.73 |
| All | 274 | 17.4 | 1.4 | 1.1 | 0.14 | 31 | 5.44 | 6.83 | 0.16 | 3.46 |
Notes:
| 1. | Effective date of the Mineral Resource is 30 June 2025. |
| 2. | Moisture content assumed to be 28% (mass of solid/(mass of solid + mass of water). |
| 3. | The volcanic outcrop, volcanic high, volcanic cones, sediment drift, and high-slope (>6°) domains were excluded from the estimate. |
| 4. | Samples collected by the Pioneer Contractors were excluded due to the lower level of confidence associated with this data and their replacement by box core data collected by TMC. |
| 5. | Abundance cut-off and assumption of reasonable prospects for economic extraction are based on the engineering, metallurgical, environmental, scientific and other studies presented in this report. |
| 6. | Si, Fe, P, MnO:SiO2 are not tracked in Mineral Reserve estimation and Mineral Resource averages are used. |
| 7. | Rounding estimates to two significant figures may result in computational discrepancies. |
The Mineral Resource was classified on the basis of the quality and uncertainty of the sample data and sample spacing, in accordance with SEC Regulation S-K (subpart 1300).
The Inferred Mineral Resource was assigned to the areas of abyssal plain in the southeast corner of NORI Area D that are largely unsampled. The volcanic high in the southeast corner was excluded from the Mineral Resource estimate due to the high level of uncertainty about nodule abundance and grades in this domain.
The Indicated Mineral Resource was assigned to the area within NORI Area D where box-core sampling was conducted on a nominal spacing of 7 km by 7 km or 10 km by 10 km but without additional photo-estimates of nodule abundance.
| amcconsultants.com | 29 |
| Technical Report Summary of Prefeasibility Study of NORI Area D, Clarion Clipperton Zone | |
| TMC the metals company Inc. | 0225054 |
Measured Mineral Resource classification was assigned to the area within NORI Area D where box-core sampling was conducted on a nominal 7 km by 7 km spacing and infilled with estimates of nodule abundance from seafloor photography to a spacing of 3.5 km by 3.5 km.
| 1.5 | Development plan |
TMC proposes to implement the Project in multiple phases that will allow the seafloor mining systems to be commissioned and then nodule production to be ramped up. The phased approach will facilitate de-risking of the project for relatively low initial capital investment. Additionally, this phased development will allow for an adaptive approach to environmental management providing learning at small-scale which will be applied as the development increases in scale.
The mine plan proposed for seafloor production development phases is as follows:
| · | Commencement of production with a single collector deployed from the Hidden Gem with a nominal production rate of 1.5 Mwmtpa of nodules. | |
| · | Deployment of a second collector from the Hidden Gem, operating in tandem on the seafloor, with a nominal system production rate of 3.0 Mwmtpa of nodules. |
Once operating procedures have been refined and operating and environmental monitoring systems have demonstrated that collection of nodules can be undertaken satisfactorily, TMC expects further phased development as follows:
| · | Development and deployment of a second vessel, essentially similar to the Hidden Gem, providing additional production of 3.0 Mwmtpa of nodules for a combined nominal production rate of 6.0 Mwmtpa. | |
| · | Development and deployment of a third and fourth production vessel, each adding nominal production of 3.0 Mtpa of nodules, for an average full system production rate of 10.5 Mwmtpa of nodules, once the required 5-year dry dock inspections are taken into account. |
Processing of polymetallic nodules will also be ramped up in a similar phased approach:
| · | TMC proposes to toll treat polymetallic nodules at existing rotary kiln electric furnace (RKEF) smelters, utilizing excess industry capacity. | |
| · | Production is planned to commence at PAMCO at a rate of 1.3 Mwmtpa of nodules initially, producing nickel-cobalt-copper alloy and subsequently nickel-cobalt-copper matte, once alloy to matte conversion facilities have been installed. | |
| · | Tolling will then be scaled up to meet the 3 Mwmtpa of the Hidden Gem by utilizing excess RKEF processing capacity that has been developed in Indonesia in the last 5 years. | |
| · | Additional production up to the 12 Mwmtpa mine plan rate will utilize existing RKEF processing plants, most likely in Indonesia, and refining capacity at a greenfield hydrometallurgical plant in the United States. | |
| · | From year 6 matte product from 6 Mwmtpa of nodules will be shipped to the United States, most likely Texas, with all matte products expected to be shipped to the US from year 10. | |
| · | Refining in the U.S. will produce nickel sulfate, cobalt sulfate and copper cathode. |
| 1.6 | Mining concept |
In 2022, NORI completed Test Mining, where 4,500 wmt of nodules were collected and approximately 3,000 wmt of nodules were lifted to surface. The Test Mining demonstrated the mining concept and provided information for detailed design of the commercial-scale system. The Test Mining was monitored from both the Hidden Gem and a second vessel, the Island Pride, where AUVs, remotely operated vehicles (ROV), and bottom mounted sensors and samplers collected environmental data to understand the system’s environmental impacts to inform completion of the NORI Area D Environmental Impact Assessment and Environmental Monitoring and Management Plans.
| amcconsultants.com | 30 |
| Technical Report Summary of Prefeasibility Study of NORI Area D, Clarion Clipperton Zone | |
| TMC the metals company Inc. | 0225054 |
The main items of offshore infrastructure proposed are the nodule collectors, the vertical transport system (VTS), production vessels (PV) and transfer vessel (TV) required to transfer nodules from the PV to bulk carrier vessels.
The nodules will be collected from the seafloor by self-propelled, tracked, collectors. No rock cutting, digging, drill-and-blast, or other breakage will be required at the point of collection. The collectors will be remotely controlled and supplied with electric power via umbilical cables from the PV. The collectors will traverse the seabed at a speed of approximately 0.4 m/s. Coandă nozzles on each collector will entrain nodules, sediment, and water from the seafloor. A hopper on each vehicle will separate sediment and excess water from the nodules, which will pass out of the hopper overflow and diffusers and be emitted behind the collector. The hopper underflow, comprising higher concentration nodule slurry, will be pumped via a flexible hose (jumper) to the VTS.
The VTS consists of a riser, which is a steel pipe through which nodules will be transferred to the surface by means of an airlift. The riser system consists of three main sections, each designed to meet specific flow dynamics and operational requirements. Above the air injection point, the upper section conveys a three-phase mixture of nodules, sediment, water, and air. This section also includes an auxiliary line for the supply of compressed air. To accommodate the expansion of air during the lift process, the riser diameter gradually increases from the air injection point upward. The airlift works by lowering the average density of the slurry inside the riser to less than the surrounding seawater. The difference between the hydrostatic pressure of the seawater at depth and the pressure inside the riser forces the slurry column to rise. The energy to achieve the lift will be supplied by air compressors housed on the PV, which will be capable of generating high air pressures.
The PVs will support the collector and riser system and its handling equipment, house the airlift compressors, collector control stations, and material handling equipment. All power for offshore equipment, including the nodule collecting vehicles, will be generated on the PVs. The PVs will be equipped with controllable thrusters and will be capable of dynamic positioning (DP), which will allow the vessels to track the collectors on the seafloor. Nodules will be pumped by the VTS to the PV, where air is released to atmosphere and the nodules will be dewatered using screens and cyclones and temporarily stored in the hold of the PV No processing involving the use of chemicals or the generation of tailings will be undertaken on the PV.
Nodules will be recovered from the hold of the PV using axial conveyors located beneath the storage holds. They will then be lifted to deck level via sandwich conveyors and offloaded through a boom conveyor system capable of both luffing and slewing. Offloading will occur at a rate of 2,500 wmt per hour to a dynamically positioned transfer vessel with 50,000 mt storage capacity. The transfer vessel will in subsequently load Capesize bulk carriers, each with a storage capacity of approximately 200,000 mt, using a similar recovery and offloading system.
| 1.7 | Mineral Processing and metallurgical testing |
TMC initially developed a combined pyrometallurgical and hydrometallurgical flowsheet to produce nickel and cobalt sulfate Li-ion battery cathode feedstocks, copper cathode, and manganese silicate. TMC completed bench-scale test-work and pilot-scale testing demonstrating the feasibility of this proposed flowsheet. As work progressed, TMC identified the opportunity to pursue a lower capital cost development by utilizing existing RKEF processing plants that were underutilized as a result of the decision by the Government of Indonesia to ban the export of unprocessed (nickel laterite) ores, resulting in facilities outside of Indonesia being underutilised as they cannot source feedstock laterite ore. Additionally, an overbuild of RKEF processing capacity in Indonesia has resulted in significant available processing capacity. It was decided to focus initially on production of intermediate products – nickel-cobalt-copper alloy and nickel-cobalt-copper matte to further reduce capital costs. In early years of operation, the matte will be sold to customers who will then process in their existing refineries.
| amcconsultants.com | 31 |
| Technical Report Summary of Prefeasibility Study of NORI Area D, Clarion Clipperton Zone | |
| TMC the metals company Inc. | 0225054 |
In November 2023, TMC signed a binding MOU with PAMCO to complete a feasibility study to process nodules through their Hachinohe facility in Japan to produce nickel-cobalt-copper alloy and nickel-cobalt-copper matte and manganese silicate product. This followed flowsheet definition and piloting at 70 mt scale, by TMC in association with Hatch, FLS and XPS and completion of a PFS by PAMCO where they tested a 22 mt nodule sample. The PAMCO commercial scale testing of a 2,000 mt nodule sample has been successfully completed.
The plant will use RKEF lines that calcine and smelt the nodules to form an alloy. The alloy will then be sulfidized to form a matte and converted in a Peirce-Smith converter operation.
The pyrometallurgical process generates a manganese silicate stream that can be sold to the manganese industry and a small converter slag stream that can be used for industrial applications. No value has been ascribed to converter slag. The flowsheet has neither tailings ponds nor permanent slag repositories and does not generate substantial waste streams.
The development plan envisages construction and operation of hydrometallurgical refining facilities in Texas commencing in the sixth year of operations. The refinery will process matte to produce nickel and cobalt sulfate crystal, copper cathode and ammonium sulfate fertilizer.
The initial mine plan in this Technical Report targets 3 Mwmtpa of nodules from the first vessel, the Hidden Gem. However, as discussed above, the average targeted processing rate at full capacity is proposed to be 10.5 Mwmtpa of nodules.
Expected metallurgical recoveries used in the mine plan and economic evaluation are summarized in Table 1.3.
| Table 1.3 | Metallurgical recoveries |
| Process Step | Nickel
Recovery (%) |
Cobalt
Recovery (%) |
Copper
Recovery (%) | |
| Nodule to alloy | 96.9% | 93.1% | 93.6% | |
| Nodule to matte | 94.8% | 77.5% | 86.4% | |
| Nodule to sulfate | 94.6% | 77.2% | 86.2% | |
In addition to the above base metals, 98.9% of the manganese contained in the feed will be recovered to the manganese silicate product, containing 52.6% MnO.
| 1.8 | Market studies |
Benchmark Mineral Intelligence (BMI) was contracted by TMC to provide market overviews for three commodities from NORI and TOML areas: nickel, cobalt, and copper and to provide forecasts for the premia/discounts that nickel and cobalt sulfate over nickel metal price forecasts.
CRU International Limited (CRU) was requested by NORI to examine the marketability and pricing for the three intermediate products that will be produced by TMC USA for the NORI and TOML areas (CRU report dated 24 September 2024):
| · | Nickel-cobalt-copper alloy. | |
| · | Nickel-cobalt-copper matte. | |
| · | Manganese silicate. |
| amcconsultants.com | 32 |
| Technical Report Summary of Prefeasibility Study of NORI Area D, Clarion Clipperton Zone | |
| TMC the metals company Inc. | 0225054 |
Additionally, CRU was retained to provide manganese ore market forecasts.
The global market for critical metals like nickel, cobalt, and copper is forecast to grow significantly, driven by demand from sectors such as the transportation, electrical infrastructure and consumer goods sectors. BMI and CRU forecast the following metal supply, demand and price scenarios:
| · | Nickel production, led by Indonesia, is expected to rise from 3.6 Mt in 2025 to 4.9 Mt by 2035, fuelled by about equally its demand in stainless steel and EV batteries. | |
| · | Cobalt demand expected to grow at a 5.8% compound annual growth rate through 2030, dominated by battery production, with supply heavily reliant on the Democratic Republic of Congo and China. But as mines begin to run through reserves and the visibility for new assets into the 2030s is limited, BMI expectation for mine supply is a slight decline into the 2030s. | |
| · | Manganese remains essential for steelmaking, although projected demand is forecast to remain flat. However, this is expected to be tempered by rapid demand growth in battery-grade products. | |
| · | Copper, critical for green energy infrastructure, faces an 8 Mt shortfall by 2035, despite production increases in Africa. | |
| · | Prices for these metals are forecast to rise steadily due to tightening supply-demand dynamics. |
TMC manganese silicate and TMC matte are expected by CRU to gain market traction given their inherent high quality. CRU expects market acceptance for TMC products will be as follows:
| · | TMC manganese silicate offers advantages as feedstock for silico-manganese alloy production and battery applications, with demand projected to grow alongside manganese markets. | |
| · | TMC matte, used in refining processes, requires stable partnerships with key facilities to maximize its value amid a buyer-dominated market. | |
| · | Limited immediate demand for TMC alloy, can be mitigated through strategic blending, partnerships, to enhance market acceptance and value over time for the nickel-cobalt-copper alloy product. |
| 1.9 | Environmental studies, permitting, community, or social impact |
Historically, a significant amount of technical work has been undertaken within the CCZ by the ISA and a significant body of information has been acquired during the past 50 years on the likely environmental impacts of collecting nodules from the sea floor.
NORI has completed the most extensive environmental baseline for the deep ocean extending from below the seabed, the seabed, the water column and above the sea surface. In total, more than 100 separate studies have been undertaken by world leading scientific and commercial organizations. This involved a comprehensive program of physical and chemical oceanographic studies, full characterization of biota from micro to mega and detailed seafloor studies at the Test Mining site and control sites in NORI Area D. Studies have been designed to define temporal and spatial variation with at least three years of baseline data and sufficient sampling to define spatial variation.
In 2022, NORI undertook Test Mining, which was subject to thorough environmental monitoring, particularly for critical impacts during testing: Benthic sediment plume, mid water discharge plume and sound impacts. Baseline studies were completed ahead of Test Mining, repeated immediately on completion, and then again 12 months later to differentiate the impacts from the Test Mining from natural temporal and spatial variation. This data is now being compiled with impact assessment methodologies, including expert workshops to inform the NORI Area D EIA and NORI Area D Project Environmental Impact Study.
TMC intends to manage the Project under the governance of an Environmental Management System (EMS), which is to be developed in accordance with the international EMS standard, ISO 14001:2004. The EMS will provide the overall framework for the Environmental Management and Monitoring Plan (EMMP) that will be required.
| amcconsultants.com | 33 |
| Technical Report Summary of Prefeasibility Study of NORI Area D, Clarion Clipperton Zone | |
| TMC the metals company Inc. | 0225054 |
The EMMP will specify the objectives and purpose of all monitoring requirements, the components to be monitored, frequency of monitoring, methods of monitoring, analysis required in each monitoring component, monitoring data management and reporting. The plan will involve an ecosystem approach incorporating an adaptive management system.
The CCZ is uninhabited by people, and there are no landowners associated with the NORI Area D project. No significant commercial fishing is carried out in the area. The Project will provide financial benefits and training to Nauru, and a source of supply of minerals critical to industrial development.
The planned metallurgical process will not generate significant volumes of solid waste products such as tailings and residues, indicating that with careful management the environmental impacts of the onshore processing operation could be very low. Other emissions will be within best practice benchmarks and compliance regulations.
| 1.10 | Mining and Mineral Reserve estimates |
The NORI Area D Mineral Reserve is defined in the selected Initial Mining Area, which has similar geo-habitat as that encountered in the Test Mining. Unmined buffers of 1,000 m were left around the lease boundary and environmentally sensitive zones. The underlying Mine Plan was developed in conjunction with an experienced marine contractor, Allseas, and TMC to reflect the characteristics of the proposed nodule collection system.
The NORI Area D Mineral Reserve at 30 June 2025, under the guidelines of Regulation S-K subpart 1300, is stated in Table 1.4.
| Table 1.4 | NORI Area D Mineral Reserve at 30 June 2025 |
| Classification | Tonnes (Mwmt) |
Co (%) |
Cu (%) |
Mn (%) |
Ni (%) |
| Proven | - | - | - | - | - |
| Probable | 51 | 0.13 | 1.1 | 31 | 1.4 |
| Total | 51 | 0.13 | 1.1 | 31 | 1.4 |
Notes:
| 1. | Mineral Reserve estimated in Initial Mining Area only with 1,000 m buffers for the lease and seamounts. | |
| 2. | Measured and Indicated Mineral Resources are converted to probable Mineral Reserves. | |
| 3. | Grades are quoted on a dry basis. | |
| 4. | Zero abundance cut-off used, with nodules <4 kg/m2 used to define the Mineral Resource included as dilution to generate viable mining blocks. | |
| 5. | Moisture content assumed to be 28% (mass of solid/(mass of solid + mass of water). | |
| 6. | Metal prices US$20,295/t Ni, US$21,633/t Ni sulfate, US$11,440/t Cu, US$56,117/t Co, US$55,198/t Co sulfate, US$5.45/dmtu Mn in manganese-silicate. | |
| 7. | Nodule recovery by the Collector is estimated as 77% for Type 1 and 62% for Type 2 and 3 nodules. | |
| 8. | Metallurgical recovery to sulfate is estimated as 94.6% Ni, 77.2% Co and 86.2% Cu, and to matte is 94.8% Ni, 77.5% Co, 86.4% Cu and for 98.9% for Mn. | |
| 9. | Rounding estimates to two significant figures may result in computational discrepancies. |
The Initial Mining Area contains approximately 25% of the NORI Area D Mineral Resource and conversion of Mineral Resources in the Initial Mining Area to Mineral Reserves is approximately 57%.
| amcconsultants.com | 34 |
| Technical Report Summary of Prefeasibility Study of NORI Area D, Clarion Clipperton Zone | |
| TMC the metals company Inc. | 0225054 |
The QPs responsible for the Mineral Reserve are set out in Table 2.1. The Mineral Reserves are classified by the QPs as Probable Mineral Reserve, due to:
| · | Lack of operating experience with the nodule collection system proposed for NORI Area D to confirm production rates, nodule recovery assumptions, field efficiencies, and operating and capital cost parameters. | |
| · | Lack of other commercial nodule operations to confirm the reasonableness of mine planning parameters, Modifying Factors and Mine Plan outcomes. | |
| · | Lack of commercial recovery permit terms and conditions issued by NOAA on how management of nodule collection operations will be regulated and with which the Mine Plan needs to comply. |
Mine planning parameters were developed from results observed during the Test Mining, extensive test work and analysis undertaken by Allseas and TMC. Numerous workshops were conducted with Allseas, TMC and technical specialists to develop the nodule collection strategy on which the mine plan is based. Testwork and analysis by marine specialists engaged by TMC included seafloor geotechnical data collection and analysis, analysis of seafloor surveys, plume modelling of disturbed sediments and geological data to identify and characterise the seafloor areas suitable for nodule collection. Testwork undertaken by Allseas while developing the nodule collection system included nodule collection simulation trials, and testwork specific to identifying the design and operating parameters for each of the various components of the system, and the Test Mining, using a 40% width scale prototype collector.
The mine plan for the Initial Assessment completed by AMC in 2021 followed a strategy of using relatively equidimensional mining blocks aligned N-S, targeting the highest value blocks first. The experience gained in the Test Mining and analysis by Allseas resulted in a revision to the mining strategy to adopt long Collector runs to maximize the time collecting nodules and minimize turning times to achieve high field efficiencies. Collector paths were designed along a preferred mining direction of NNW-SSE to align with the strike of seafloor ridges.
Although the mine plan covered the whole of the NORI Area D, initial mining for the first eight years was confined to a subset of NORI Area D in the southwest of the lease, referred to as Project Zero by TMC. This area is close to the Test Mining area and so confidence in the modifying factors is sufficient to define Mineral Reserves. It was also largely devoid of steep (>4) terrain and so was considered the most suitable area for initial collection operations. The collector runs for the initial two years were generated to be as long as possible to allow for initial operations to be as simple as possible while operating procedures are refined. As a result, the initial collector runs (dubbed Runs 19-20) were forced to deviate from the preferred NNW-SSE trend to avoid seamounts and the proposed environmental impact reference zone (see section 17.4.1). Mining blocks subsequent to Runs 19-20 were generated in a more systematic fashion along the NNW-SSE direction. While this resulted in shorter mining blocks, it is expected that short term planning will be able to amalgamate adjacent mining blocks to form longer collector runs that enable production and cost targets to be maintained.
Key inputs used to estimate the Mineral Reserve are the Mineral Resource model developed by AMC, the nodule collection system specifications provided by TMC to Allseas (including production capability and ability to collect on slopes up to 4°), collector dimensions and capabilities provided by Allseas, geotechnical data reports and specific location analysis by APYS Subsea Ltd (APYS), analysis and modelling by Allseas to determine seafloor trafficability, geological analysis by Marine Geoscience Innovation (MARGIN) to determine areas where nodules could be collected (geo-obstacle probability model), and the parameters developed by AMC from the work of all of the above. Key physical parameters used by AMC to estimate the Mineral Reserve included collector recovery, geo-obstacle probability, gap left between collection paths to ensure collector efficiency, and metallurgical recoveries for each of the proposed products. An economic model of production, product prices, payabilities, revenue, and operating and capital costs developed by TMC was used to assess economic viability.
| amcconsultants.com | 35 |
| Technical Report Summary of Prefeasibility Study of NORI Area D, Clarion Clipperton Zone | |
| TMC the metals company Inc. | 0225054 |
| 1.11 | Summary capital and operating cost estimates |
Capital and operating costs were prepared using the AACE (Association for the Advancement of Cost Engineering) Recommended Practice 47R-11 Class 4 estimate standards for Mining and Mineral Processing Industries. Through June 2025 Production Vessel engineering was 21.6% complete (Allseas Monthly Report), with some elements already approaching the technical maturity required for a Class 3 estimate. The project capital cost estimate to develop a phased 12 Mtwmpa nodule operation as per the mine plan is US$4,971M comprising of US$544.8M for Production Vessel #1 and associated costs (System #1) inclusive of Allseas credit2 and is summarized in Table 1.5 and US$4,426M for two 6 Mwmt nodule equivalent refining facilities in the US, is summarized in Table 1.6.
| Table 1.5 | Project CAPEX system #1 summary |
| Description | US$ M |
| Production Vessel | 468.4 |
| Transfer Vessel/Bulk Carriers | 89.6 |
| Support Vessel | 15.2 |
| Processing/Refining | - |
| Operations Facilities initial setup | 2.3 |
| Direct Subtotal | 575.5 |
| Professional Services | 59.4 |
| Owners Cost | 44.6 |
| Indirect Subtotal | 104.0 |
| Contingency | 101.4 |
| Escalation | 53.3 |
| Allseas Credit | (289.3) |
| Total Project CAPEX | 544.8 |
| Table 1.6 | Project CAPEX US refining summary |
| Description | US$ M |
| General/Infrastructure | 144.8 |
| Port Facilities | 281.1 |
| Hydrometallurgy | 1027.7 |
| Direct Subtotal | 1,453.7 |
| Indirect Costs | 477.2 |
| Contingency | 282.2 |
| Refining Facility Capital | 2,213.0 |
| Number of 6 Mwtpa refining facility | 2 |
| Total Project CAPEX | 4,426.0 |
The operating cost estimate for a phased 12 Mwmtpa operation as per the mine plan is reported in 30 June 2025 US$ as total life-of-mine (LOM) and unit costs per wet metric tonne in Table 1.7.
| 2 | Allseas is a strategic partner. Refer to 10-K disclosures on the non-binding agreement and intention of NORI and Allseas to equally finance all costs related to developing and getting the Offshore Nodule Collection System into production. |
| amcconsultants.com | 36 |
| Technical Report Summary of Prefeasibility Study of NORI Area D, Clarion Clipperton Zone | |
| TMC the metals company Inc. | 0225054 |
| Table 1.7 | NORI Area D operating cost summary |
| OPEX component | Total
LOM (US$M) |
Unit
Cost (US$/wmt) |
LOM
Cost (%) |
| Collection Costs | 12,344 | 75.2 | 30.9 |
| Transfer & Shipping Costs | 3,071 | 18.7 | 7.7 |
| Contractor (offshore) Costs | 1,855 | 11.3 | 4.6 |
| Consumables (offshore fuel) Costs | 3,848 | 23.4 | 9.6 |
| Processing Cost | 13,622 | 83.0 | 34.1 |
| Refining Cost | 3,254 | 19.8 | 8.1 |
| Corporate Cost | 1,985 | 12.1 | 5.0 |
| Total OPEX | 39,978 | 243.6 | 100 |
| 1.12 | PFS economic assessment |
The PFS used manganese silicate product prices forecast by CRU (CRU, 2024) and metals prices forecast by Benchmark (BMI, 2025). The averages of the forecast prices used (from 2027 onwards) are listed in Table 1.8.
| Table 1.8 | Average product prices assumed in PFS |
| Parameter | Unit | Value |
| Ni metal (C1 LME) | Avg. US$/t | 20,295 |
| Ni contained in Ni sulfate | Avg. US$/t | 21,633 |
| Manganese | Avg. US$/t | 545 |
| Manganese | Avg. US$/dmtu | 5.45 |
| Cu Cathode (C1 LME) | Avg. US$/t | 11,440 |
| Co metal (C1 LME) | Avg. US$/t | 56,117 |
| Co contained in Co sulfate | Avg. US$/t | 55,198 |
The PFS indicates a positive economic outcome. Undiscounted post-tax net cash flow of US$20.0 billion is expected. An internal rate of return of 26.8% has been estimated from the financial model. Discounted cash flow analysis of real cash flows, discounting at 8% per annum, indicates a post-tax project net present value (NPV) of US$5.51 billion. The forecast project post-tax unlevered cash flow (US$M) is shown in Figure 1.1.
The project payback is 7 years and the Probable Mineral Reserve in the Initial Mining Area of 51 Mwmt is all mined by the end of year 7 (50.7 Mwmt) with a post-tax cumulative free cash flow of US$170.2M (year 7). The development plan then assumes that an additional 113 Mwmt of Mineral Resource (based on the same modifying factors as the Initial Mining area) will be recoverable to market outside the Initial Mining Area (NORI Area D Total = 164 Mwmt).
| amcconsultants.com | 37 |
| Technical Report Summary of Prefeasibility Study of NORI Area D, Clarion Clipperton Zone | |
| TMC the metals company Inc. | 0225054 |
| Figure 1.1 | Forecast Project Post-Tax Cash Flow (US$M) |
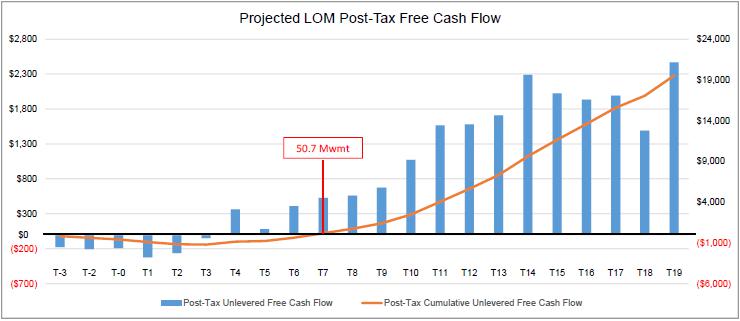
The sensitivity of project economics to changes in the main variables was tested by selecting high and low values that represent a likely range of potential operating conditions. The variables with the biggest negative impact on NPV are nickel sulfate and manganese prices, OPEX items, and metal prices. In general, revenue drivers have the biggest impact, followed by OPEX variables (Figure 1.2).
| amcconsultants.com | 38 |
| Technical Report Summary of Prefeasibility Study of NORI Area D, Clarion Clipperton Zone | |
| TMC the metals company Inc. | 0225054 |
| Figure 1.2 | Tornado diagram of NPV sensitivity to variables |
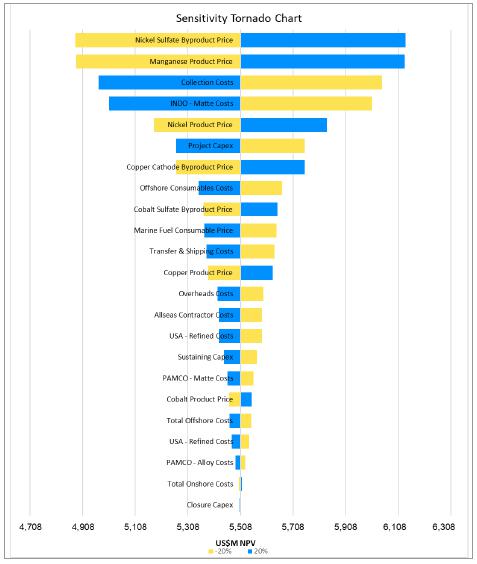
| 1.13 | Qualified Person's conclusions and recommendations |
The key risks to the Mineral Reserve identified by the QPs are:
| · | NOAA has not yet granted an exploration license and commercial recovery permit to TMC USA to extract the nodules contained within the Mineral Reserve. | |
| · | NOAA has not yet finalized the terms and conditions of the commercial recovery permit, and the mine plan may need to be revised to comply with provisions. | |
| · | Lack of other commercial operations against which comparison and validation of production rates, OPEX, and CAPEX could be made. | |
| · | The price forecasts for the proposed products. | |
| · | Nodule recovery, which is a function of collector recovery, geo-obstacle loss, gap between collector runs, and seafloor slope domains. | |
| · | Impact of sedimentation and seafloor currents. | |
| · | The design of the nodule collection system has not yet been finalized, nor has the system been constructed to demonstrate that scale up from the 40% scale prototype used in the Test Mining can be successful. |
To account for these risks, the Mineral Reserve has been classified as Probable.
The QPs consider that sufficient testwork and analysis on being able to collect the nodules within NORI Area D has been undertaken to achieve a PFS level of assessment on the modifying factors used to convert the Mineral Resource to Mineral Reserve. Specifically, the QPs have estimated the tonnage and grade of the Probable Mineral Reserve, that in the opinion of the QPs, can be the basis of an economically viable project. Modifying factors were evaluated and applied in the areas of mining, processing, metallurgy, infrastructure, economic evaluation, marketing, legal, and environmental compliance.
| amcconsultants.com | 39 |
| Technical Report Summary of Prefeasibility Study of NORI Area D, Clarion Clipperton Zone | |
| TMC the metals company Inc. | 0225054 |
| 2 | Introduction |
| 2.1 | Registrant, terms of reference and purpose of report |
The registrant is TMC the metals company Inc. (TMC). TMC commissioned AMC Consultants Pty Ltd (AMC) to compile a Technical Report Summary (Technical Report) for the recovery of polymetallic nodules (nodules) located on the seafloor of NORI Area D in the Clarion-Clipperton Zone (CCZ) of the north-east Pacific Ocean.
The Technical Report presents an update to the Mineral Resource estimates and the first estimate of Mineral Reserves for NORI Area D under Subpart 1300 of Regulation S-K promulgated by the US Securities and Exchange Commission (S-K 1300).
| 2.2 | Sources of information |
The primary source of information used for the Technical Report is the NORI Area D pre-feasibility study (PFS) report (Nauru Ocean Resources Inc (NORI), 2025)(TMC 2024) and supporting documentation undertaken by TMC, working with offshore partner Allseas SA (Allseas) and onshore partner Pacific Metals Co Ltd (PAMCO) and several specialist service providers. Key documents used in the preparation of this Technical Report are listed in Section 24 References.
| 2.3 | Qualified Persons and personal inspections |
This Technical Report is authored by several experts or “qualified persons” (QPs), as defined in S-K 1300. Not all of the QPs have visited the site, as the nodules, which are the subject of the Technical Report, are located in the north-east Pacific Ocean and lie at a depth of approximately 4,500 m below sea level. As permitted by Item 1302(b)(2)(iii), personal inspection has been substituted with inspection of sample material and survey data collected using remotely operated vehicles, which the QPs consider reasonable given the depth and location of the deposit. Nodules are only accessible to autonomous or remotely operated specialist underwater vehicles. Those QPs that have visited the site, have done so in the process of collecting and analyzing specialist aspects of seafloor samples from surface vessels.
The Sections that each QP was responsible for are summarized in Table 2.1 and Table 2.2, noting whether the QP has visited the site.
| Table 2.1 | List of Qualified Persons responsible for each Section |
| Qualified Person | Responsible for the following report Sections: |
| AMC Consultants Pty Ltd | Sections, 1.4, 1.10, 1.13, 2, 4, 5, 7.3.6, 7.4, 7.5.1 – 7.5.3, 7.5.5, 7.6, 7.7, 7.8.2, 7.10 - 7.12, 8.2 – 8.3, 9, 11, 12.1,12.2.5,12.2.6, 12.2.8, 12.2.10, 12.3 – 12.5, 12.7, 20, 22.2, 22.4, 22.5, 24, and 25. |
| MARGIN - Marine Geoscience Innovation | Sections 6, 7.1, 7.2.1 – 7.2.7, 7.2.9, 7.2.10, 7.3.1 – 7.3.3, 7.3.5, 7.8.1, 7.9, 7.13, 8.1, and 12.2.4. |
| APYS Subsea Ltd | Sections 7.2.8, 7.3.4, 7.5.4, 7.14, and 12.2.2. |
| Canadian Engineering Associates Ltd | Sections 1.7, 10, 12.2.11, 14, 15, and 22.7. |
| Lanasera Pty Ltd | Sections 1.12, 12.6, 19 and 22.12 |
| TMC the metals company Inc. | Sections 1.1 - 1.3, 1.5, 1.6, 1.8, 1.9, 1.11, 3, 7.1, 12.2.1, 12.2.3, 12.2.7, 12.2.9, 12.2.12-12.2.14, 13, 16 - 18, 21, 22.1, 22.3, 22.6, 22.8 - 22.11, and 23. |
| amcconsultants.com | 40 |
| Technical Report Summary of Prefeasibility Study of NORI Area D, Clarion Clipperton Zone | |
| TMC the metals company Inc. | 0225054 |
| Table 2.2 | TMC Qualified Persons responsible for each section |
| Qualified Person | Responsible for the following report sections: |
Anthony O’Sullivan, Chief Development Officer Anthony is a mining executive with over 30 years of experience in mineral exploration and project development. As Chief Development Officer at TMC, he oversees technical and strategic development of deep-sea polymetallic nodule projects. He has over 20 years’ experience in subsea resource development with 10 of these years’ experience in polymetallic nodule development involving, exploration, development of environmental impact statements and permitting, project development, offshore equipment design, onshore processing and product marketing. He has held senior roles at Nautilus Minerals and BHP Billiton, and is a co-inventor on multiple subsea mining patents. He is a current fellow of the AusIMM. |
Sections 1.1, 1.2, 1.3, 1.5, 1.8, 3, 12.2.12-12.2.14, 16, 21, 22.1, 22.3, 22.8, 22.9, 22.12, and 23. |
Rutger Bosland, Chief Innovation and Offshore Technology Officer Rutger is an offshore engineer and project leader with a track record of delivering pioneering technologies in deep-sea mining and heavy-lift engineering. He led the technical development of Pioneering Spirit, the world’s largest offshore construction vessel, and oversaw the successful design, build, and testing of Allseas’ integrated nodule collection system aboard Hidden Gem. Under his direction, Allseas executed the first integrated nodule collection trials in the Pacific Ocean since the 1970s. At TMC, he now leads the development and commercial scaling of the polymetallic nodule collection system. He is a current member of AusIMM. |
Sections 1.6, 12.2.3, 12.2.7, 12.2.9, 13, and 22.6.. |
Dr. Michael Clarke, Environmental Program Director Michael is an environmental scientist with extensive experience in marine biology, mining, environmental impact assessments, and regulatory compliance. At TMC, he leads the Environmental Program for the project, overseeing baseline studies, monitoring, and stakeholder engagement. He has contributed to the development of novel adaptive management systems and environmental monitoring protocols tailored to deep-sea mining.
Michael is certified as an Environmental Practitioner and Impact Assessment Specialist by the Environmental Institute of Australia and New Zealand (EIANZ) and has participated in the planning and offshore execution of multiple research campaigns to the NORI Area D site. |
Sections 1.9, 12.2.1, 17, and 22.10. |
 |
 |
| amcconsultants.com | 41 |
| Technical Report Summary of Prefeasibility Study of NORI Area D, Clarion Clipperton Zone | |
| TMC the metals company Inc. | 0225054 |
| Qualified Person | Responsible for the following report sections: |
Adam Price, Project Control Manager Adam is a seasoned project controls and analysis professional with over 15 years’ of experience managing estimate, cost, schedule, financial economics/planning /reporting and risk performance across large-scale, complex construction and infrastructure projects. In his current role at TMC, Adam leads the strategic planning, capital and operating estimating, economic analysis, modelling, implementation, and oversight of integrated project controls systems across all phases of project delivery—from Pre-Feasibility (PFS) and Feasibility Studies (FS) through to execution.
Adam has worked across a wide range of estimating and contracting models and has a deep understanding of commercial structures and their implications on project performance and risk. His expertise spans the full project lifecycle, with a strong focus on establishing robust estimates, baselines, developing earned value management systems, and driving data-informed decision-making to optimize outcomes. Adam is a member of AACE International and AusIMM. |
Sections 1.11, 18, and 22.11. |
Personal inspections were undertaken by the following QPs:
| · | Margin - Marine Geoscience Innovation was a participant in the 2018 offshore campaign (Campaign 3) on board the Maersk Launcher, which carried out surveys and sampling in NORI Area D from 26 April - 4 June 2018 and the bulk-dredging campaign C4B from 6 January – 7 February 2020 also onboard Maersk Launcher as the Client Representative. | |
| · | APYS Subsea Ltd was either Offshore or Onshore Geotechnical Team Leader/Project Manager in campaigns 6A, 6B, 7A, and 7B during the periods August to December 2019, October to September 2020, July to September 2022, and November to December 2022 respectively. Work undertaken was carrying out seabed sampling, on-deck soil testing and analysis, including in-situ seabed testing from onboard remotely operated vehicle systems and soil logging alongside geological and environmental sampling, technical support to offshore geotechnical soil sampling and testing development of techniques and methodology for soil testing and study, including development of ultra deep-water deployable systems and the deployment and testing strategy. | |
| · | AMC was involved in the development of sampling strategies and procedures and was in daily contact with the offshore sampling campaigns as they were implemented, providing input as required to ensure data quality and veracity. | |
| · | TMC, through their wholly owned subsidiary NORI, participated in multiple exploration campaigns and test mining within NORI Area D. These campaigns included direct physical sampling of nodules and sediments, deployment and recovery of autonomous underwater vehicles (AUVs), and monitoring of the Test Mining. TMC personnel and qualified experts participated in these offshore operations to oversee data quality, conduct geological and environmental assessments, and support the development and refinement of mining and environmental management plans. These personnel include: |
| - | Rutger Bosland: Was the lead Allseas representative on the Test Mining conducted in NORI Area D and responsible for deep sea mining development from 2019 until 2024. Mr. Bosland’s qualifications are based on his direct inspection, leadership, and technical oversight of the pilot nodule collection program conducted in NORI Area D in 2022 and subsequent development into 1st generation commercial mining system. The pilot program provided the engineering foundation and operational experience that underpin the design and risk mitigation strategies of the current system. |
| amcconsultants.com | 42 |
| Technical Report Summary of Prefeasibility Study of NORI Area D, Clarion Clipperton Zone | |
| TMC the metals company Inc. | 0225054 |
| - | Michael Clarke: Dr Michael Clarke was the client representative on Campaign 5A to the NORI Area D site in the CCZ. This campaign ran from 22 October to 6 December 2020 and focused on sampling of benthic biota and sediment geochemistry. |
| · | Canadian Engineering Associates Ltd (CEA) are consulting engineers specializing in non-ferrous pyrometallurgical processing plants and have been supporting the project with process calculations relating to the on-shore plant. CEA has considerable experience in the RKEF technology that will be applied to the nodules to produce various products. CEA visited the PAMCO site in Hachinohe Japan and reviewed the operation, paying attention to the size and type of equipment, its current physical state and quality of maintenance, along with the technical and operating skill of the personnel. CEA also reviewed the necessary changes that will be required to be made so PAMCO is ready to accept nodules. |
| 2.4 | Update to a previously filed Technical Report |
This Technical Report discloses the results of continuing investigations and evaluation at a pre-feasibility level of assessment on recovery, transport, processing and marketing of nodules, and is an update of the “Initial Assessment of the NORI Property, Clarion-Clipperton Zone” for Deep Green Metals Inc prepared by AMC in March 2021 (AMC 2021). Unlike the Initial Assessment, this Technical Report includes Mineral Reserve estimates, and economic analysis demonstrating economic viability as required by Item 1302(e).
| amcconsultants.com | 43 |
| Technical Report Summary of Prefeasibility Study of NORI Area D, Clarion Clipperton Zone | |
| TMC the metals company Inc. | 0225054 |
| 3 | Property description |
| 3.1 | United Nations Convention on the Law of the Sea (UNCLOS) |
The international seabed area (otherwise known as the Area) is defined as the seabed and subsoil beyond the limits of national jurisdiction (UNCLOS Article 1).
The principal policy documents governing the Area under UNCLOS include:
| · | The UN Convention on the Law of the Sea, of 10 December 1982 (The Convention). | |
| · | The 1994 Agreement relating to the Implementation of Part XI of the UN Convention on the Law of the Sea of 10 December 1982 (the 1994 implementation Agreement). |
The Convention deals with, among other things, navigational rights, territorial sea limits, exclusive economic zone jurisdiction, the continental shelf, freedom of the high seas, legal status of resources on the seabed beyond the limits of national jurisdiction, passage of ships through narrow straits, conservation and management of living marine resources in the high seas, protection of the marine environment, marine scientific research, and settlement of disputes.
Part XI of the Convention and the 1994 Implementation Agreement deals with mineral exploration and exploitation in the Area, providing a framework for entities to obtain legal title to areas of the seafloor from the ISA for the purpose of exploration and eventually exploitation of resources.
The Convention entered into force on 16 November 1994. A subsequent agreement relating to the implementation of Part XI of the Convention was adopted on 28 July 1994 and entered into force on 28 July 1996. The 1994 Implementation Agreement and Part XI of the Convention are to be interpreted and applied together as a single instrument.
The Convention has been ratified by 170 States Parties3, which includes 169 states (166 UN member states plus the UN observer state, Palestine, and non-member states, the Cook Islands and Niue) and the European Union. An additional 14 UN member states have signed but not ratified the Convention. The United States of America (USA) is currently not a party to the Convention.
Figure 3.1 shows a map of the Area (blue zone) as well as 200 nautical mile exclusive economic zones (grey zone) and extended continental shelf zones (orange zone). Figure 3.2 shows the relationships between depth, distance, and jurisdiction.
| 3 | https://itlos.org/en/main/the-tribunal/states-parties/ |
| amcconsultants.com | 44 |
| Technical Report Summary of Prefeasibility Study of NORI Area D, Clarion Clipperton Zone | |
| TMC the metals company Inc. | 0225054 |
| Figure 3.1 | Map of seafloor jurisdictions |
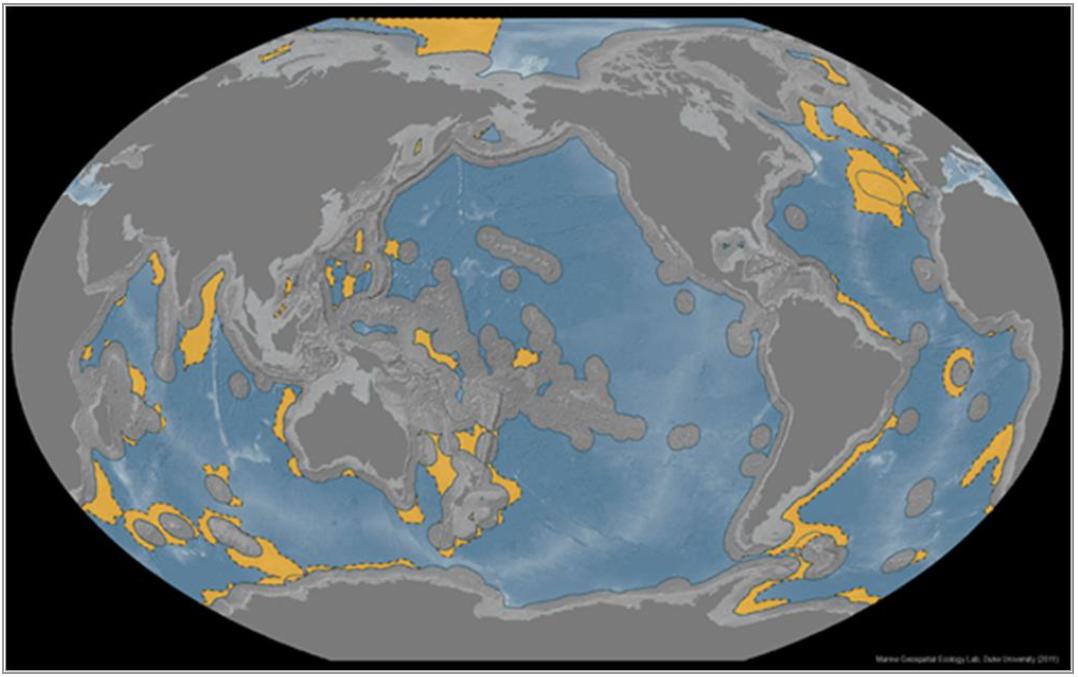
Note: International seabed area map (blue zone) as well as 200 nautical mile exclusive economic zones (grey zone) and extended continental shelf zones (orange zone).
Source: Marine Geospatial Ecology Lab, Duke University (2011).
| amcconsultants.com | 45 |
| Technical Report Summary of Prefeasibility Study of NORI Area D, Clarion Clipperton Zone | |
| TMC the metals company Inc. | 0225054 |
| Figure 3.2 | Maritime space under the 1982 UNCLOS |
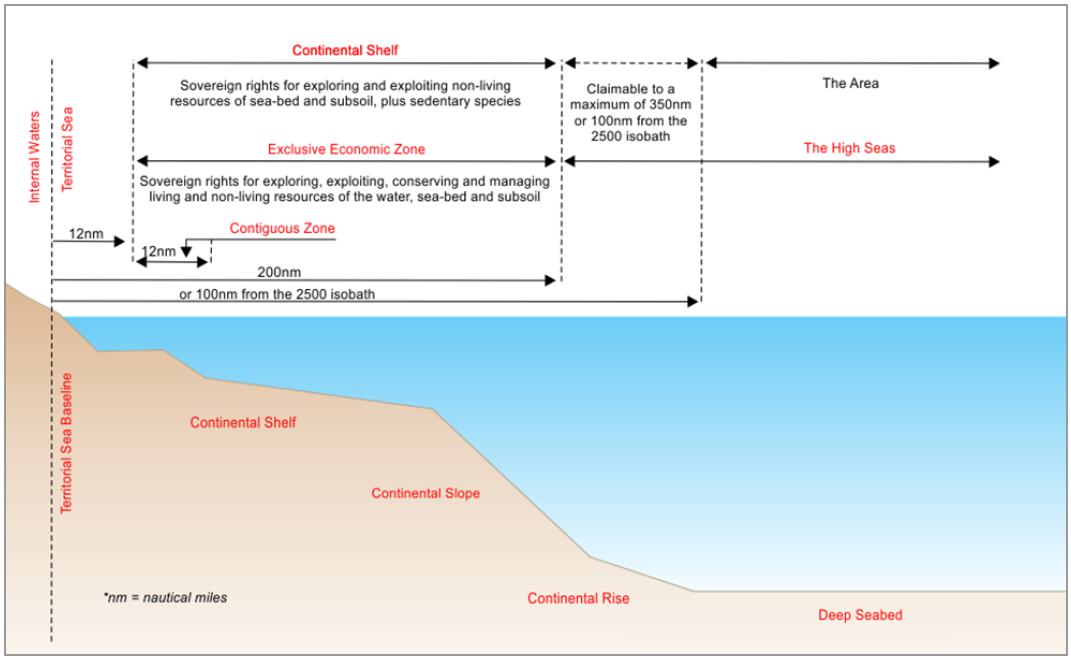
Source: DeepGreen - adapted from UNCLOS, 1982
| 3.1.1 | International Seabed Authority (ISA) |
The ISA is an autonomous international organization established under the Convention and the 1994 Implementation Agreement to organize and control activities in the Area, particularly with a view to administering and regulating the development of the resources of the Area in accordance with the legal regime established in the Convention and the 1994 Implementation Agreement.
All rules, regulations, and procedures issued by the ISA to regulate prospecting, exploration, and exploitation of marine minerals in the Area are issued within a general legal framework established by the Convention and the 1994 Implementation Agreement.
To date, the ISA has issued (https://www.isa.org.jm/mining-code/ Regulations):
| · | The 2010 Regulations on Prospecting and Exploration for Polymetallic Nodules in the Area (adopted 13 July 2000; the Regulations); amended by the 2013 Regulations on Prospecting and Exploration for Polymetallic Nodules in the Area and Related Matters (Amended)4 | |
| · | The
Regulations on Prospecting and Exploration for Polymetallic Sulphides (adopted 7 May 2010). | |
| · | The Regulations on Prospecting and Exploration for Cobalt-Rich Ferromanganese Crusts in the Area (July 2012). |
The ISA is currently working on the development of the legal framework to regulate the exploitation of nodules in the Area.
| 4 | 2013 Regulations in Prospecting and Exploration for Polymetallic Nodules (Amended) adopted on 25 July 2013. |
| amcconsultants.com | 46 |
| Technical Report Summary of Prefeasibility Study of NORI Area D, Clarion Clipperton Zone | |
| TMC the metals company Inc. | 0225054 |
In February 2024, the Council of the ISA released draft regulations on exploitation of Mineral Resources in the Area (ISBA/29/C/CRP.1) which formed the basis for this Technical Report.
| 3.2 | Tenements and permits under the ISA |
In July 2011, NORI was granted a nodule exploration contract by the ISA (NORI Exploration Contract). The contract was granted for a term of 15 years with a program of activities for the first five-year period (NORI Exploration Contract). The contract also formalises the rights of NORI around tenure. This contract does not convey exploitation rights. As of the effective date of this Report, no exploitation contract has been granted. In addition, as of the effective date of this Report, the International Seabed Authority has never granted an exploitation contract.
The NORI Property is located within the CCZ of the northeast Pacific Ocean (Figure 3.3). The CCZ is located in international waters between Hawaii and Mexico. The western end of the CCZ is approximately 1,000 km south of the Hawaiian island group. From here, the CCZ extends over 4,500 km east-northeast, in an approximately 750 km wide trend, with the eastern limits approximately 2,000 km west of southern Mexico. The region is well-located to ship nodules to the American continent or across the Pacific to Asian markets.
| Figure 3.3 | Location of NORI and other exploration areas within the CCZ |
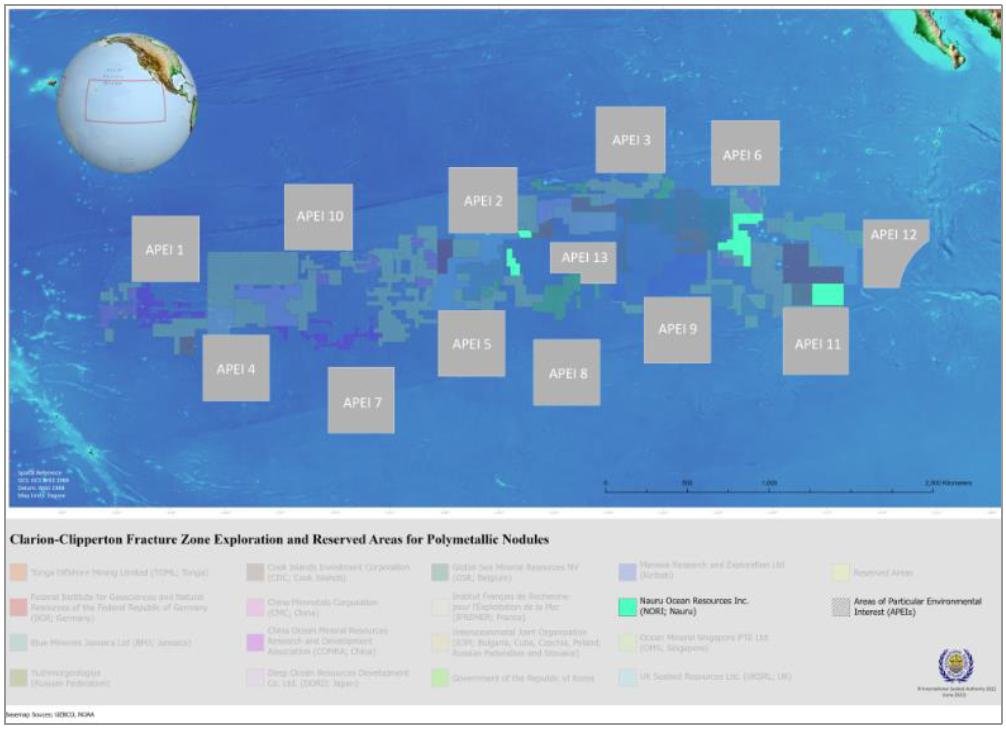
Source: https://www.isa.org.jm/map/clarion-clipperton-fracture-zone, downloaded 7 February 2025.
The NORI contract area comprises four separate blocks (A, B, C and D) in the CCZ with a combined area of 74,830 km2 (Figure 3.4 and Table 3.1). These areas were previously explored by three Pioneer Investors (Table 3.2).
| amcconsultants.com | 47 |
| Technical Report Summary of Prefeasibility Study of NORI Area D, Clarion Clipperton Zone | |
| TMC the metals company Inc. | 0225054 |
| Figure 3.4 | Location of NORI blocks in the CCZ |
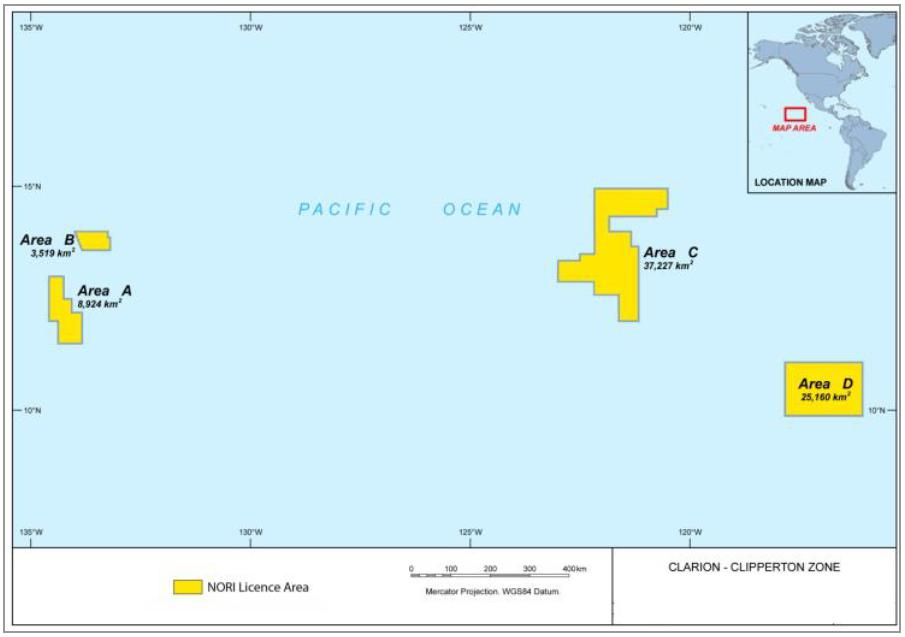
Source: NORI
| Table 3.1 | NORI Area extents |
| Area | Minimum Latitude (DD) | Maximum Latitude (DD) | Minimum Longitude (DD) | Maximum Longitude (DD) |
Minimum UTM X (m) |
Maximum UTM X (m) |
Minimum UTM Y (m) |
Maximum UTM Y (m) |
UTM Zone |
| A | 11.5000 | 13.00000 | -134.5830 | -133.8330 | 545220.4 | 627276.0 | 1271339 | 1437255 | 8 |
| B | 13.5801 | 14.00000 | -134.0000 | -133.2000 | 607995.7 | 694759.8 | 1501590 | 1548425 | 8 |
| C | 12.0000 | 14.93500 | -123.0000 | -120.5000 | 500000.0 | 769458.3 | 1326941 | 1652649 | 10 |
| D | 9.8950 | 11.08333 | -117.8167 | -116.0667 | 410465.2 | 602326.1 | 1093913 | 1225353 | 11 |
Note: DD – Decimal degrees, UTM – Universal Transverse Mercator map projection
| Table 3.2 | NORI Area block details |
| Area | Size (km2) | ISA block number | Pioneer investor |
| A | 8,924 | 13 | Yuzhmorgeologiya |
| B | 3,519 | 15 | Yuzhmorgeologiya |
| C | 37,227 | 22 | Interoceanmetal Joint Organisation (IOM) |
| D | 25,160 | 25 | Arbeitsgemeinschaft Meerestechnisch Rohstoffe (AMR) |
Source: NORI
To date, no ISA exploitation licences for extracting minerals from the seafloor within the Area have been granted.
| 3.3 | NORI obligations and sponsorship under the ISA |
During exploration NORI, is required to, among other things:
| · | Submit an annual report to the ISA. | |
| · | Meet certain performance and expenditure commitments. |
| amcconsultants.com | 48 |
| Technical Report Summary of Prefeasibility Study of NORI Area D, Clarion Clipperton Zone | |
| TMC the metals company Inc. | 0225054 |
| · | Pay an annual overhead charge (currently US$60,000) to cover the costs incurred by the ISA in administering and supervising the contract. | |
| · | Implement training programs for personnel of the ISA and developing countries in accordance with a training program proposed by NORI in its licence application and five-year work plans. | |
| · | Take measures to prevent, reduce, and control pollution and other hazards to the marine environment arising from its activities in the Area. | |
| · | Maintain appropriate insurance policies. | |
| · | Establish environmental baselines against which to assess the likely effects of its program of activities on the marine environment. | |
| · | Establish and implement a program to monitor and report on such effects. |
NORI is sponsored to carry out its mineral exploration activities in the Area by the Republic of Nauru, pursuant to a certificate of sponsorship signed by the Government of Nauru on 11 April 2011. Sponsorship of an entity requires the sponsoring State to certify that it assumes responsibility for the entity's activities in the Area in accordance with the Convention. NORI is a Nauruan incorporated entity and is subject to applicable Nauruan legislation and regulations.
In 2015 the Republic of Nauru enacted the International Seabed Minerals Act 2015, which establishes the Nauru Seabed Minerals Authority to administer Nauru’s sponsorship of activities carried out in the Area by companies sponsored by Nauru.
In June 2017, the Republic of Nauru and NORI entered into a Sponsorship Agreement formalising certain obligations of the parties in relation to NORI's exploration and potential exploitation of the NORI Contract Area of the CCZ.
Under the Sponsorship Agreement, NORI has the exclusive right to explore for nodules in the Area pursuant to the contract for exploration dated 11 July 2011 between the ISA and NORI (the “Exploration Contract”).
The term of the Sponsorship Agreement is aligned with the duration of the Exploration Contract (15 years) and contains provisions for automatic extension for a further 20 years upon NORI reaching the Minimum Recovery Level (as such term is defined in the Sponsorship Agreement). This agreement was revised on 4 June 2025, to allow for TMC USA application under DSHMRA as outlined in the section below.
| 3.3.1 | Work Program under the ISA |
As of the date of this Technical Report, NORI is in the fourteenth year of its exploration contract.
NORI’s current 5-year program, covering the period from 2022 to 2026, includes the following key elements:
| · | Collector Test and Exploitation Application: Conducting a full system collector test completed in late-2022 (Test Mining), which included deploying and testing a collector and airlift riser system, as well as collecting 3,000 wmt of nodules, with intent to submit an application for exploitation. | |
| · | Environmental Management: The program emphasizes ongoing environmental baseline studies, delivery of an Environmental Impact Statement to support any application for exploitation and development and implementation of an Environmental Management and Monitoring Plan (EMMP) upon project approval, including an adaptive management system for ongoing operations. |
| amcconsultants.com | 49 |
| Technical Report Summary of Prefeasibility Study of NORI Area D, Clarion Clipperton Zone | |
| TMC the metals company Inc. | 0225054 |
| · | Training and Capacity Building: Providing training opportunities for developing state nationals, including participation in offshore campaigns and support for relevant degree programs at the University of South Pacific. | |
| · | Stakeholder Engagement: The program includes enhanced stakeholder engagement efforts to maintain transparency and gather input on project activities, particularly ahead of the submission of the application for an exploitation contract. |
NORI submits detailed annual reports to the ISA which include financial statements on levels of expenditure on the NORI Contract Area. The NORI Exploration Contract may be extended for periods of 5 years at a time beyond the initial 15-year period, provided NORI has made efforts in good faith to comply with the requirements of the plan of work.
| 3.4 | Deep Seabed Hard Mineral Resources Act (DSHMRA) |
The U.S. legal framework for seabed mineral activities in areas beyond national jurisdiction is primarily governed by the Deep Seabed Hard Mineral Resources Act (DSHMRA), enacted in 1980 (30 U.S.C. §1401 et seq.). This Act authorizes the National Oceanic and Atmospheric Administration (NOAA) to issue licenses for exploration and permits for commercial recovery of polymetallic nodules containing manganese, nickel, cobalt, and copper from the deep seabed.
These activities are limited to areas beyond national jurisdiction and are intended to ensure that U.S. entities can participate in seabed mining despite the United States not being a party to the United Nations Convention on the Law of the Sea (UNCLOS) or the 1994 Implementation Agreement.
Under DSHMRA, NOAA is responsible for reviewing and processing applications for exploration licenses and commercial recovery permits, which include environmental assessments and opportunities for public comment.
While the International Seabed Authority (ISA) regulates seabed mining for UNCLOS member states, the U.S. maintains its own regulatory regime under DSHMRA. In April 2025, a Presidential Executive Order reaffirmed U.S. commitment to advancing leadership in seabed mineral exploration and responsible commercial recovery, emphasizing both economic and environmental priorities.
| 3.4.1 | National Oceanic and Atmospheric Administration (NOAA) |
NOAA is the U.S. federal agency responsible for administering the Deep Seabed Hard Mineral Resources Act (DSHMRA), which establishes a legal regime for the exploration and commercial recovery of hard Mineral Resources from the deep seabed in areas beyond national jurisdiction. All rules, regulations, and procedures issued by NOAA to regulate prospecting, exploration, and recovery of marine minerals under DSHMRA are issued within the legal framework established by the Act and its implementing regulations under 15 CFR, Subchapter D. To date, NOAA has issued:
| · | The regulations governing the issuance of exploration licenses for polymetallic nodules in areas beyond national jurisdiction (15 CFR Part 970). | |
| · | The regulations governing the issuance of commercial recovery permits for polymetallic nodules (15 CFR Part 971). |
NOAA is currently responsible for reviewing and processing applications for both exploration licenses and commercial recovery permits submitted by U.S. entities.
In May 2025, NOAA released a draft update to its DSHMRA regulatory framework, including proposed revisions to streamline the application process for commercial recovery permits and enhance environmental safeguards. The draft incorporated feedback from interagency consultations, industry stakeholders, and environmental groups, and was published for public comment via the Federal Register. NOAA has stated its intent to finalize the revised regulations by early 2026, in alignment with the Executive Order’s directive to modernize the permitting process and ensure timely access to critical minerals.
| amcconsultants.com | 50 |
| Technical Report Summary of Prefeasibility Study of NORI Area D, Clarion Clipperton Zone | |
| TMC the metals company Inc. | 0225054 |
Pursuant to DSHMRA and 15 CFR § 970.209, a licensee who submits a timely and substantially complete application for a commercial recovery permit for the same area covered by their exploration license is granted a priority of right over other applicants, provided regulatory requirements are met.
| 3.4.2 | License and permit applications under NOAA |
TMC USA currently does not hold any exploration licenses or commercial recovery permits under the DSHMRA framework. However, TMC USA has submitted applications for such rights, and subject to regulatory review and approval, anticipates that any future commercial recovery activities would be conducted pursuant to a permit issued by NOAA under the U.S. legal regime.
In April 2025, TMC USA has submitted application requests directly to NOAA under the U.S. regulatory regime governed by DSHMRA. The relevant applications for NORI Area D are summarized below:
| · | Exploration License for the USA-A Area which covers 65,186 km2 in the CCZ. | |
| · | Commercial Recovery Permit for USA-A which covers 25,160 km2 in the CCZ (the area defined as NORI Area D under the ISA exploration contract). |
On 28 May 2025 NOAA advised TMC USA that the exploration licence application for USA-A is substantially compliant with requirements under DSHMRA, and have a priority right providing exclusivity to the areas subject to the exploration license application for the duration of application process. No assurance can be given that exploration licenses or commercial recovery permits will be granted or that regulatory approvals will be obtained on the anticipated timeline or terms.
Further details regarding DSHMRA application process and timelines are defined in Section 17.1.
As of the effective date of this Report, no license or permit has been issued, and no rights under DSHMRA currently exist. In addition, any references to processing within the U.S. are forward-looking and contingent on receipt of such license or permit. In addition, as of the date of this report NOAA has never issued a Commercial Recovery Permit under DSHMRA.
| 3.5 | Royalties and taxes |
Under the Deep Seabed Hard Mineral Resources Act (DSHMRA), royalties and taxes payable on any future commercial recovery of polymetallic nodules by U.S. entities in areas beyond national jurisdiction are governed by domestic U.S. law rather than international frameworks such as UNCLOS, to which the U.S. is not a party.
DSHMRA does not prescribe specific royalty rates, it authorizes the National Oceanic and Atmospheric Administration (NOAA) to issue exploration licenses and commercial recovery permits, with terms and conditions that may include financial obligations. These obligations are determined on a case-by-case basis during the permitting process and are designed to ensure that U.S. seabed mining activities are conducted responsibly and in alignment with national interests, specifically the sourcing of critical minerals.
NOAA’s regulatory framework under DSHMRA includes provisions for public comment and environmental review but does not currently mandate a fixed royalty or taxation regime akin to the ISA’s proposed ad valorem models. As such, financial terms are negotiated individually and may evolve with future legislative or executive directives, such as the April 2025 Executive Order promoting U.S. leadership in seabed mineral recovery.
| amcconsultants.com | 51 |
| Technical Report Summary of Prefeasibility Study of NORI Area D, Clarion Clipperton Zone | |
| TMC the metals company Inc. | 0225054 |
In June 2025, the Government of Nauru and TMC’s subsidiary, Nauru Ocean Resources Inc. (NORI), signed a revised Sponsorship Agreement updating the terms of their agreement signed in 2017. This agreement ensures that the Republic of Nauru will continue to receive financial benefits, training, and community development support. The revised agreement introduces "continuity benefits" that will be activated once commercial production begins, either by NORI or another TMC subsidiary.
Until such time as the minimum recovery level is reached within the tenement area, no continuity benefits, or other amounts or payments, are payable by TMC to the Republic of Nauru, except for the Administration Fee contemplated in the Sponsorship Agreement. This is discussed in more detail in Section 19 of this report.
TMC will comply with all applicable tax laws and regulations in the USA. Taxation is discussed in more detail in Section 19 of this report.
| amcconsultants.com | 52 |
| Technical Report Summary of Prefeasibility Study of NORI Area D, Clarion Clipperton Zone | |
| TMC the metals company Inc. | 0225054 |
| 4 | Accessibility, climate, local resources, infrastructure and physiography |
| 4.1 | Accessibility and infrastructure |
The CCZ lies between Hawaii and Mexico and is accessible by ship from various ports in the USA and South America. The CCZ deposit does not include any habitable land and is not near coastal waters. All personnel and material will be transported to the project area by ship. The region is well located to ship nodules to the American continent or across the Pacific Ocean to Asian markets. The CCZ is generally outside major shipping lanes as indicated in Figure 4.1 which depicts the global cargo shipping network during 2007, illustrating the trajectories of all cargo ships bigger than 10,000 t gross.
There are no permanent facilities in the Project area, and all operations are contingent on marine infrastructure. The absence of fixed infrastructure increases dependence on vessel availability, which introduces material risks under Item 1302(e)(7).
| Figure 4.1 | Global cargo shipping network in 2007 |
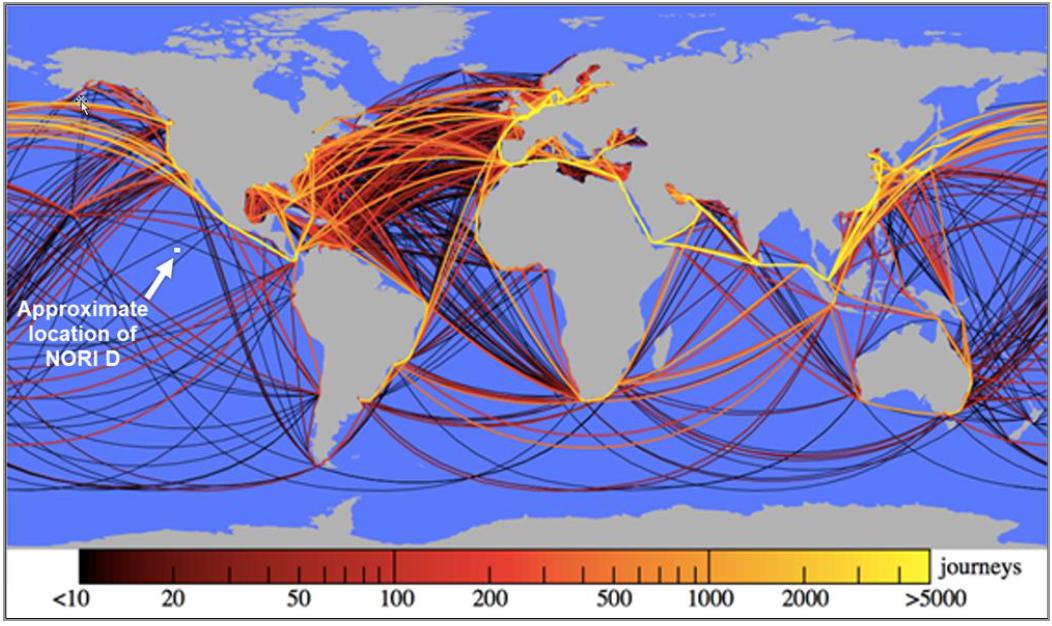
Note: The colour scale indicates the number of journeys along each route.
Source: Adapted from Kaluza et al. 2010.
| 4.2 | Climate |
The CCZ has a tropical oceanic climate, with average temperatures between 20 to 32°C. Minimum and maximum temperatures generally occur in March and September, respectively (ISA 2001), and the average sea surface temperature is 25°C. The CCZ is located in open ocean and is subject to tropical weather patterns.
Off-shore operations are planned to run throughout the year, with the exception of hurricane events, which are expected to occur once every three years. Tropical hurricanes are difficult to predict due to their erratic frequency but have high intensity over short periods and occur mostly during the period from May to October (Tilot 2006 and GSR 2018).
| amcconsultants.com | 53 |
| Technical Report Summary of Prefeasibility Study of NORI Area D, Clarion Clipperton Zone | |
| TMC the metals company Inc. | 0225054 |
| 5 | History |
| 5.1 | Overview |
Submarine ferromanganese concretions were first discovered in the Kara Sea off Siberia in 1868 (ISA 2010, citing Earney 1990). HMS Challenger, during its round the world expedition from 1873 to 1876, collected many small dark brown balls, rich in manganese and iron, which were named manganese nodules (ISA 2010 citing Murray and Reynard [1891], Manheim [1978], and Earney [1990]).
Since the 1960s, nodules have been recognized as a potential source of nickel, copper, cobalt, and manganese, and have been comparatively well studied because of their potential economic importance (Mero 1965). Scientific expeditions demonstrated that nodules have a widespread occurrence in the world's oceans although their metal content and concentration vary from region to region.
During the International Decade of Ocean Exploration and prior to the implementation of UNCLOS, many offshore exploration campaigns were completed by international organizations and consortia. A number of at-sea trial mining operations were successfully carried out in the CCZ in the 1970s to test potential mining concepts. These system tests evaluated the performance of a self-propelled and several towed collection and mining devices, along with submersible pumps and airlift technology for lifting the nodules from the deep ocean floor to the support vessel.
The US National Oceanic and Atmospheric Administration (NOAA) monitored some of these tests as the principal effort of the Deep Ocean Mining Effects Study (DOMES II) program. The information collected during these activities provided key inputs to the impact analysis presented by NOAA in its Final Programmatic Deep-Sea Mining Environmental Impact Statement.
| 5.2 | Pioneer Investors |
For the purpose of this report the Pioneer Investors include those entities that carried out substantial exploration in the Area prior to the entry into force of the Convention, as well as those entities that inherited such exploration data. This Section describes some of the more important activities of the Pioneer Investors.
NORI Area D was originally explored by Arbeitsgemeinschaft Meerestechnisch Rohstoffe (AMR). AMR subsequently joined Ocean Management Inc. (OMI). The OMI consortium comprised Inco Ltd (Canada), AMR (Federal Republic of Germany), SEDCO Inc. (US), and Deep Ocean Mining Co. Ltd (Japan). OMI completed a successful trial mining operation in 1978. Hydraulic pumps, an air lift system, and towed collectors were tested in approximately 4,500 m of water. Approximately 800 t of nodules were recovered.
Kennecott consortium (now a division of Rio Tinto) first became seriously interested in nodules in 1962 (Agarwal et al. 1979). In the 1970s, Kennecott developed and tested components and subsystems of a seafloor mining system and also carried out significant nodule metallurgical processing test work.
Using a different system to OMI, Ocean Mining Associates recovered approximately 500 t of nodules during its trial mining in the 1970s.
Between 1969 and 1974, Deepsea Ventures Inc. carried out 16 survey cruises of three to four weeks' duration each, to define the extent of the nodule deposit discovered by them in 1969 in the CCZ. As reported by Deepsea Ventures Inc:
| amcconsultants.com | 54 |
| Technical Report Summary of Prefeasibility Study of NORI Area D, Clarion Clipperton Zone | |
| TMC the metals company Inc. | 0225054 |
“These activities included the taking of some 294 discrete samples, including the bulk dredging of some 164 tons of manganese nodules from some 263 dredge stations, 28 core stations and three grab sample stations, cutting of some 28 cores, approximately 1000 lineal miles of survey of seafloor recorded by television and still photography, etc. As a result, the deposit of nodules identified with the discovery has been proved to extend generally throughout the entire area (American Society of International Law, 1975).”
Also active in the CCZ was the Ocean Minerals Company (OMCO), comprising Amoco Minerals Co. (USA), Lockheed Missiles and Space Company Inc. (USA), Billiton International Metals BV, and dredging company Bos Kalis Westminster (Netherlands). In a program lasting 16 years, OMCO collected thousands of free-fall grab and box core samples of nodules from its claim area (Spickermann 2012) and carried out trial mining. Lockheed's design efforts resulted in over 80 patents, a seafloor production system that consisted of a remote-controlled collector and crusher, a seafloor to surface slurry riser system, the first industrial scale dynamic positioning system for a vessel, and a metallurgical processing plant (Spickermann 2012).
In 1978, OMCO used a remote controlled fully manoeuvrable self-propelled miner with conveyor and crusher (Figure 5.1 and Figure 5.2) to trial mine nodules in the CCZ at approximately 4,500 m below sea level. The miner used an Archimedes screw drive system to provide traction and accurate manoeuvrability on the seafloor. Nodules were picked up by the miner and transferred to the buffer, where they were to be pumped to the surface by an airlift system.
| Figure 5.1 | Schematic of Lockheed Group’s 1970s trial mining system |
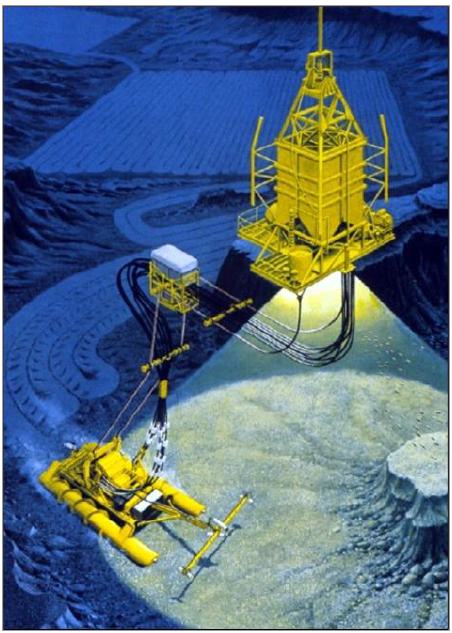
Source: Deep Green. Used with permission of Prof. Jin Chung
| amcconsultants.com | 55 |
| Technical Report Summary of Prefeasibility Study of NORI Area D, Clarion Clipperton Zone | |
| TMC the metals company Inc. | 0225054 |
| Figure 5.2 | Remote operated collector used by the Lockheed Group in 1970s trial mining |
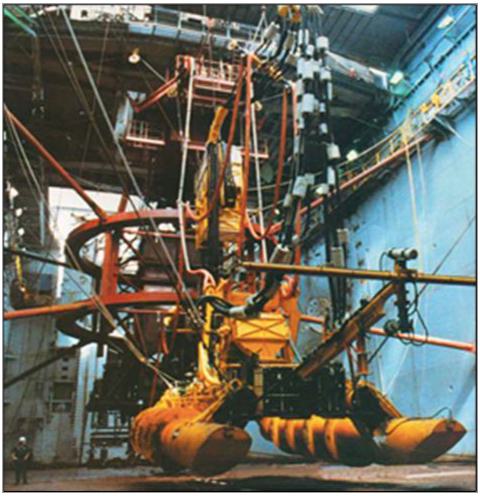
Source: Spickerman 2012
| 5.3 | Sampling methods |
Prior to NORI obtaining its exploration contract, sampling of nodules within the NORI Area was conducted by three Pioneer Investors: AMR, State Enterprise Yuzhmorgeologiya of the Russian Federation and lnteroceanmetal Joint Organisation (IOM), a consortium formed by Bulgaria, Cuba, the Czech Republic, Poland, the Russian Federation, and Slovakia.
Nodule samples collected by the Pioneer Investors from within the NORI Area were obtained by free-fall grab samplers (FFG) along with a few from box corers. For each sample the nodule abundance (wet kg/m2) was derived by dividing the weight of recovered nodules by the surface area covered by the open jaws of the sampler or corer (typically 0.25 to 0.5 m2 but in some cases as much as 1 m2). Sample splits were dried and assayed by atomic absorption spectrophotometry (AAS) and X-ray fluorescence (XRF).
Free-fall grab samplers are currently the most productive tool available for sampling nodules. This is because a number of them can be deployed at any one time from the survey vessel allowing an order of magnitude increase in collection efficiency compared to box core sampling (i.e., approximately 10 to 20 samples per day for a FFG versus 2 to 3 samples per day for a box core (BC) that is winched to and from the seafloor). Figure 5.3 shows the operation of an FFG sampler.
The box core is the preferred sampling method for retrieving nodule samples for resource evaluation and environmental studies. The box core consists of a trigger, plunger, and cutting shovel. Upon land out on the seafloor, the trigger is released which allows the plunger to push a box cutter into the substrate during retraction. Upon retraction, the cutting shovel rotates under the box while cutting into the seafloor and sealing the sample box from below (Figure 5.4).
| amcconsultants.com | 56 |
| Technical Report Summary of Prefeasibility Study of NORI Area D, Clarion Clipperton Zone | |
| TMC the metals company Inc. | 0225054 |
| Figure 5.3 | Free fall grab sampler operation |
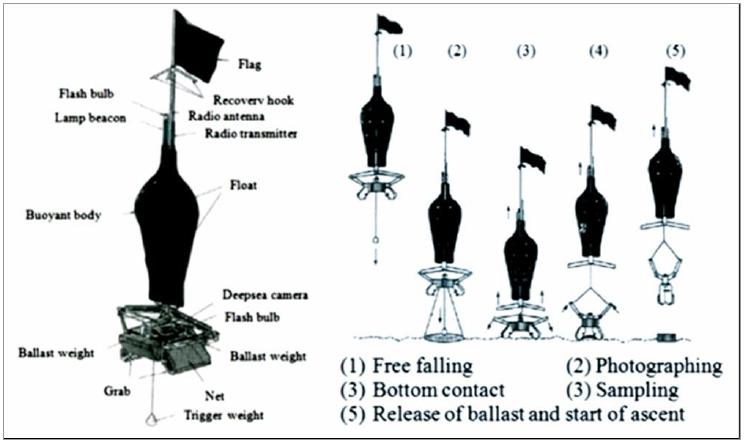
Source: ISA 1999b
| Figure 5.4 | Box core sampler operation |
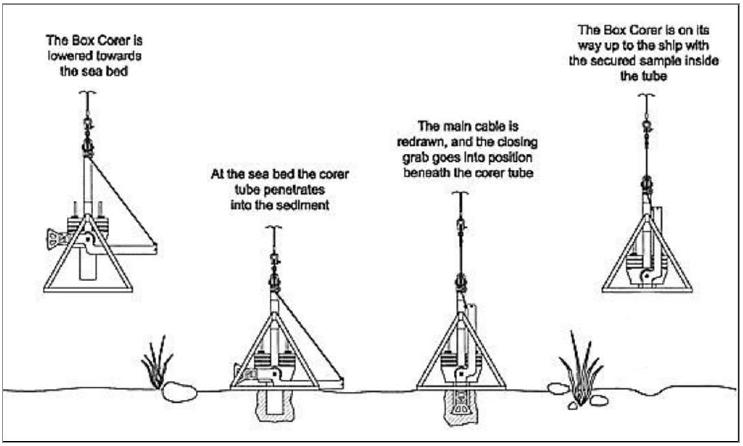
Source: KC Denmark box corer manual
| amcconsultants.com | 57 |
| Technical Report Summary of Prefeasibility Study of NORI Area D, Clarion Clipperton Zone | |
| TMC the metals company Inc. | 0225054 |
Comparison of nodule abundance measurements by free-fall grab samplers and box cores suggests that free-fall grab samplers commonly underestimate the actual abundance. This is due to smaller nodules escaping the sampler during ascent and larger nodules around the edge of the sampler being knocked out during the sampling process. Additionally, free-fall grab samplers occasionally fail to return any nodules where nodule abundance is known to be very high because the sampler fails to penetrate the layer of nodules.
Lee et al. (2008) examined correction factors between FFG and BC in some detail. They found a wide range but consistent differences with FFG under-reporting compared to BC. They recommended an overall correction factor of 1.4 to convert FFG abundance to BC abundance. However, they acknowledged that any simple factor lacks precision. One of the key issues is the size of the FFG or BC relative to the nodule diameter.
The FFG data were not used in the 2024 estimates of Mineral Resources in NORI Area D.
| 5.4 | Sample preparation and analysis |
Information on sample preparation and analysis by the Pioneer Investors is summarized below.
| 5.4.1 | Ocean Minerals Company |
While OMCO data are not included in the datasets used for resource estimation in the NORI Area, they are discussed here as the method described below is believed to be similar to the method practiced by those contractors that did contribute to the NORI Area data.
Nodule samples were laid out separately on a white surface marked with a scaled grid and photographed to permit determination of nodule size distribution. They were then sealed in labelled fiberglass-reinforced collection bags and stored in the ship's hold for the balance of the exploration cruise. The samples were transported from the ship to the Lockheed Ocean Laboratory in San Diego.
Prior to weighing, the samples were removed from the sample bags and placed in a single layer in labelled open trays on tables in the air-conditioned laboratory for at least 12 hours to ensure a uniform degree of air drying. The samples were then weighed using a high-capacity laboratory scale and divided into two subsamples of approximately equal weight.
The second subsample was crushed using a jaw crusher to produce a product with a maximum size of less than about 1 mm. The crushed sample was then mixed and passed through a laboratory sample splitter to produce a 5 to 10 g subsample. The subsample was further ground to a fine powder using a laboratory ball mill prior to assaying.
The powdered subsample was placed in an oven at 110°C for at least six hours to remove adsorbed water. It was then immediately transferred to a sealed desiccator to cool to ambient temperature.
A three-acid digest was used to dissolve the samples before analysis by AAS using a Hewlett Packard instrument. Standard analysis included determination of manganese, iron, cobalt, nickel, copper, zinc, silica, calcium, and magnesium.
Analytical accuracy was confirmed by periodic introduction of standards made from crushed, mixed, and powdered bulk nodule samples that had also been sent to three independent commercial laboratories for determination of these metal contents. Additional confirmation was achieved using standards formulated by the US Geological Survey (A-1 and P-1; Flanagan and Gottfried 1980). These standards were subjected to the entire preparation procedure to ensure that no significant contamination was occurring and that no systematic analytical errors were being included in the process.
| amcconsultants.com | 58 |
| Technical Report Summary of Prefeasibility Study of NORI Area D, Clarion Clipperton Zone | |
| TMC the metals company Inc. | 0225054 |
| 5.4.2 | Yuzhmorgeologiya |
The Yuzhmorgeologiya method was very similar to the method practiced by OMCO. The Yuzhmorgeologiya data cover NORI Area A and B.
The measurement of abundance of nodules at the sample site was carried out using an "enclosed" Ocean-0.25 FFG sampler with a 0.25 m2 gripped surface and a depth of sampling of approximately 30 cm. The FFG sampler was combined with GFU-6-8 photography unit. This device took ocean bottom photos at the sampling point.
The procedure for sub-sampling was as follows:
| 1 | Extraction of all nodules from the grab sampler. |
| 2 | Crushing of all nodules to a maximum particle size of up to 10 mm. |
| 3 | Drying (approximately 24 h) of all samples at 105°C until constant weight was achieved. |
| 4 | Crushing of all samples to 1 to 2 mm particle size and splitting of 400 to 500 g using a splitting device. |
| 5 | Pulverising of the split sample (not less than 400 g) was carried out in the vibrating grinder up to 100 mesh particle size (0.074 mm). |
| 6 | Formation of analytical sample (200 g) and its duplicate (200 g). |
Chemical analyses were carried out on subsamples with an approximate weight of 0.5 g, selected from the analytical sample. Determination of nickel, copper, cobalt, and iron content was carried out by AAS and the content of manganese by a method of photometric (electrometric) titration.
| 5.4.3 | IOM |
Information regarding IOM procedures is not available. However, procedures used by IOM for sample collection and assaying are likely to be similar to the sampling and assaying procedures used by the other Pioneer Investors. The results of the IOM sampling are consistent with the results obtained by other Pioneer Investors within the NORI area and within the broader CCZ.
| 5.4.4 | Preussag |
Preussag completed nodule exploration programs in the CCZ aboard the Valdivia in the 1970s. Nodule sampling was mainly carried out using free-fall grab samplers and box corers.
After the sampling devices arrived on the working deck of the research vessel, nodules were removed from the sediment surface (box corer) or taken from the FFG samplers and transported in plastic boxes to the geological laboratory. There, several sample treatments were carried out:
| · | Nodules were cleaned (if necessary) from adhering mud using filtered seawater. | |
| · | Nodules were carefully dried with paper towels. | |
| · | Nodules were photographed on the surface with a scaled grid. | |
| · | Individual nodules were measured. | |
| · | Individual nodules and the total nodules from one device were weighed with a special balance (determination of wet weight). |
A detailed description including the identification of the types of nodules was conducted.
One part of the nodules was used for further investigations in the ship's laboratory. The other nodules were stored in plastic bags, which were weighed once more. Then the plastic bags were filled with seawater in order to keep the nodules in a water-saturated state. These samples were required for further studies and investigations in the home laboratories (e.g., physical properties, detailed chemical analyses, X-ray phase analysis, metallurgical tests, polished sections).
| amcconsultants.com | 59 |
| Technical Report Summary of Prefeasibility Study of NORI Area D, Clarion Clipperton Zone | |
| TMC the metals company Inc. | 0225054 |
The first part of the nodules taken from one sampling device were crushed to a particle size smaller than 10 mm and then dried in an oven at ±105°C until constant weight was achieved. Further steps of grinding in the ship's laboratory took place with a final procedure of pulverising with a ball mill producing a fine powder with a particle size of less than 100 mesh (less than 74 µm). Then the sample was passed through a laboratory sample splitter to produce several representative subsamples.
One subsample was taken as representative archive sample. Two other subsamples were dried again for at least five hours to remove the rest of adsorbed water prior to analysis.
Two methods were used to determine key metals of nickel, copper, cobalt, manganese, iron, and zinc. The first was AAS analysis to measure nickel, copper, zinc, and cobalt, and the second was energy-dispersive XRF with ratio-isotope excitation to determine manganese and iron. A sample digestion was necessary to carry out the AAS determination. For this, the dried powder was treated with a mixture of acids in a high-pressure Teflon vessel and heated for several hours to complete the digestion. The digested fluid was diluted with distilled water and analysed with the spectrometer, and the residue was weighed. The XRF analysis was performed with the powder (pressed tablets). Data quality and analytical reliability were confirmed by intermediate introduction and measurement of reference nodule samples. These reference standards consisted of powdered material which was subjected to the same procedure as described above.
| 5.5 | Quality Assurance/Quality Control Procedures |
Free-fall grab samplers are considered to underestimate the actual abundance but provide adequate samples for determining the grade of the nodules (Hennigar et al. 1986).
Quality Assurance/Quality Control was known to be undertaken at the time of sampling as part of the scientific process used by each Pioneer Investor. However, no systematic quality assurance and quality control (QA/QC) information is available for these programs, as this information was not provided by the ISA. Nonetheless, the acceptance of the data by the ISA suggests the ISA was satisfied with the quality of the data.
The quality of the data was assessed (Golder 2015) using comparative measures between the different datasets. The QP considers that correlation of data from different sources, including Pioneer Investors and government scientific institutes, provides a satisfactory level of quality assurance to support Mineral Resource estimates at an Inferred level of confidence.
For the estimate of Mineral Resources at NORI Area D described in this report, the availability of higher quality data collected by NORI since 2012 made it unnecessary to rely on the Pioneer Contractor data. Therefore, the Pioneer Contractor data was not used in the estimation of Mineral Resources for NORI Area D in 2025.
| 5.6 | Pioneer Investor sample data supplied to NORI |
Upon making an application, the Pioneer Investors were required to submit sufficient data and information to enable designation of a reserved area based on the estimated commercial value. These sample data provide the basis of a database held by the ISA and were used initially to define the areas of the NORI application.
The sample sites were sampled by a combination of grab samplers and box corers of different sizes and designs, with the full details of the sampling tools at a given site mostly being unavailable. As a result, sample quality, spacing, and assay reliability vary from contractor to contractor, sample to sample, and block to block. Average sample spacing (based on the data supplied by the ISA) varies across the CCZ, ranging from less than 1 km and averaging approximately 10 km within the NORI Area.
| amcconsultants.com | 60 |
| Technical Report Summary of Prefeasibility Study of NORI Area D, Clarion Clipperton Zone | |
| TMC the metals company Inc. | 0225054 |
Statistics for the samples that contain both abundance and grade data inside the NORI Area are tabulated in Table 5.1 and illustrated as boxplots in Figure 5.5. The box plots show the range of grades; the box represents the range of grades in the middle 50% of the samples, centered on the median (middle value) and box width reflects number of samples. The dashed lines represent the range of the lowest 25% and highest 25% of the data.
Cobalt in NORI Area D is significantly lower than other NORI areas and abundance consistently higher in NORI Area D than other NORI areas and CCZ Reserved Blocks in general (Figure 5.5).
The range of the assays (as summarized by the coefficient of variation) is remarkably low compared to most terrestrial Mineral Resources. Abundance values vary more widely, making abundance estimates the key variable of uncertainty in Mineral Resource estimation.
The abundance of buried nodules is poorly known at this time. Thus, buried nodules are not included in exploration information or Mineral Resource estimates.
| Table 5.1 | Summary of historical FFG samples in the NORI Area |
| NORI Area | Grade | Number | Missing | Min | Max | Mean | Median | Var | cv |
| A | Abundance (wet kg/m2) | 50 | 0 | 0 | 28.7 | 9.3 | 8.2 | 57.366 | 0.81 |
| Ni (%) | 40 | 10 | 1.04 | 1.75 | 1.37 | 1.39 | 0.016 | 0.09 | |
| Cu (%) | 40 | 10 | 0.66 | 1.29 | 1.07 | 1.1 | 0.017 | 0.12 | |
| Mn (%) | 40 | 10 | 19.77 | 32.6 | 28.06 | 28.98 | 8.577 | 0.1 | |
| Co (%) | 40 | 10 | 0.16 | 0.28 | 0.22 | 0.22 | 0.001 | 0.11 | |
| B | Abundance (wet kg/m2) | 31 | 0 | 0 | 25.55 | 11.24 | 12 | 50.536 | 0.63 |
| Ni (%) | 26 | 5 | 1.01 | 1.61 | 1.42 | 1.44 | 0.021 | 0.1 | |
| Cu (%) | 26 | 5 | 0.72 | 1.26 | 1.12 | 1.16 | 0.016 | 0.11 | |
| Mn (%) | 26 | 5 | 20.8 | 32.2 | 28.88 | 29.8 | 9.939 | 0.11 | |
| Co (%) | 26 | 5 | 0.21 | 0.31 | 0.25 | 0.25 | 0.001 | 0.09 | |
| C | Abundance (wet kg/m2) | 152 | 0 | 0 | 44.1 | 10.55 | 10.33 | 52.902 | 0.69 |
| Ni (%) | 135 | 17 | 0.68 | 1.53 | 1.27 | 1.31 | 0.025 | 0.12 | |
| Cu (%) | 135 | 17 | 0.4 | 1.46 | 1.05 | 1.11 | 0.048 | 0.21 | |
| Mn (%) | 135 | 17 | 12.84 | 33.54 | 28.63 | 29.42 | 11.648 | 0.12 | |
| Co (%) | 135 | 17 | 0.12 | 0.33 | 0.21 | 0.21 | 0.001 | 0.17 | |
| D | Abundance (wet kg/m2) | 159 | 0 | 0.2 | 52.2 | 14.12 | 13.9 | 72.243 | 0.6 |
| Ni (%) | 159 | 0 | 1.09 | 1.41 | 1.28 | 1.29 | 0.004 | 0.05 | |
| Cu (%) | 159 | 0 | 0.88 | 1.5 | 1.14 | 1.13 | 0.012 | 0.1 | |
| Mn (%) | 159 | 0 | 23.8 | 33.9 | 30.58 | 31 | 3.12 | 0.06 | |
| Co (%) | 159 | 0 | 0.05 | 0.2 | 0.12 | 0.11 | 0.001 | 0.26 |
Note: Var = variance; CoV = coefficient of variation
| amcconsultants.com | 61 |
| Technical Report Summary of Prefeasibility Study of NORI Area D, Clarion Clipperton Zone | |
| TMC the metals company Inc. | 0225054 |
| Figure 5.5 | Box plot sample grades in NORI Area compared with data from Reserved Blocks |
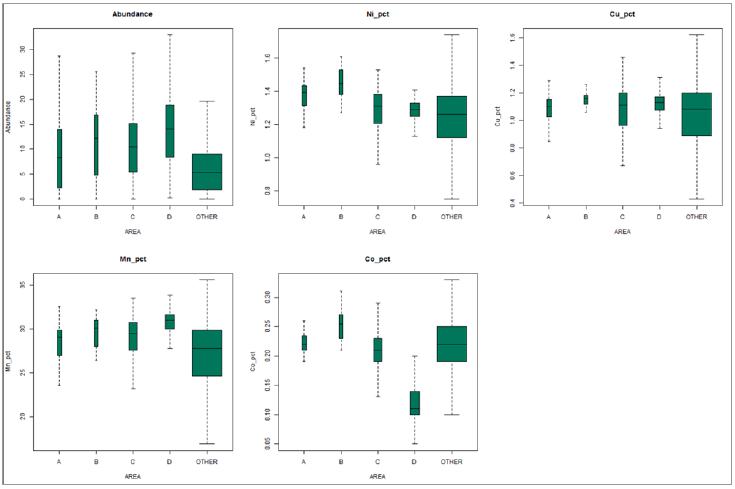
Note: Box size represents 1st and 3rd quartiles centred on the median and box width reflects number of samples
| amcconsultants.com | 62 |
| Technical Report Summary of Prefeasibility Study of NORI Area D, Clarion Clipperton Zone | |
| TMC the metals company Inc. | 0225054 |
| 6 | Geological setting, mineralization, and deposit |
| 6.1 | Global distribution of nodules |
Nodules occur in all oceans, and the CCZ hosts a relatively high abundance of nodules. Other zones of nodules with relatively high base-metal content and high abundance are found in the Peru Basin in the southeast Pacific, the center of the north Indian Ocean, and the Cook Islands (Figure 6.1). Metal grades vary significantly between these zones.
| Figure 6.1. | Location of the CCZ and other deep sea nodule fields |
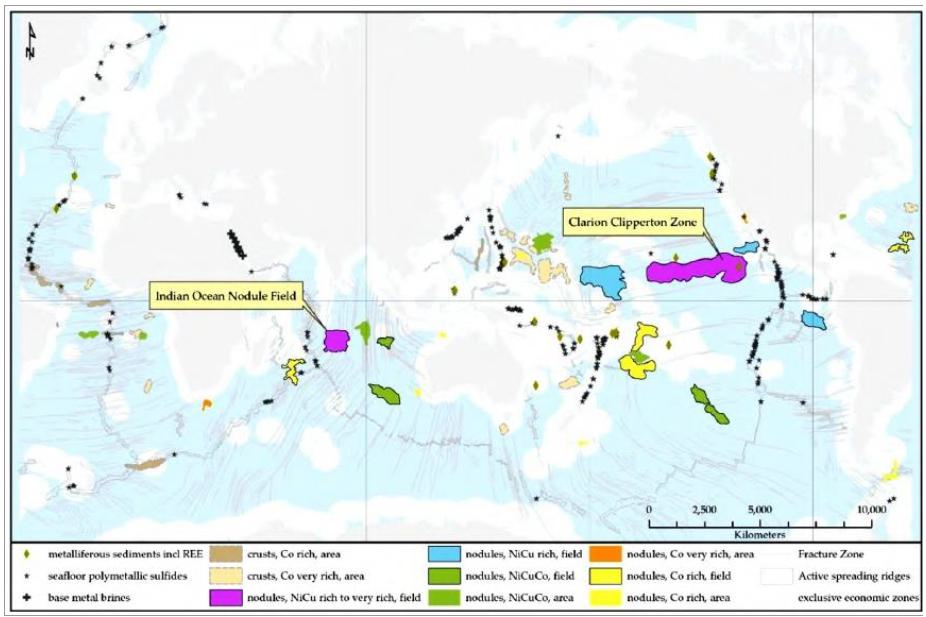
Source: Parianos 2021
Two major west-south-west and east-north-east trending fracture zones that run through the seafloor define the CCZ: the Clipperton Fracture Zone to the south and the Clarion Fracture Zone to the north. These fractures zones can be seen clearly on the bathymetric map (see Figure 6.2). The eastern and western limits can be defined by the Mathematicians Seamounts or Ridge in the east and the Republic of Kiribati or Line Islands in the west.
The CCZ seafloor is part of the abyssal plain, the largest physiographic habitat type on Earth that covers approximately 70% of ocean basins and 30% of the Earth's surface (UN Division for Ocean Affairs and the Law of the Sea and the ISA, 2004). Ridges believed to have formed from the process of seafloor spreading traverse the CCZ. The ridges have a north-north-west to south-south-east (locally ±20˚) orientation with amplitudes of 50 to 300 m (maximum 1,000 m; Hoffert, 2008) and wavelengths of 1 to 10 km. The bathymetric map of NORI Area D (The whole of NORI Area D (25,439 km2) was surveyed. Due to swath width and vessel orientation relative to course-made-good, some data was recorded beyond the bounds of those areas. An image of the bathymetric data for NORI Area D, in plan view, is shown in Figure 7.1) shows these ridges clearly.
| amcconsultants.com | 63 |
| Technical Report Summary of Prefeasibility Study of NORI Area D, Clarion Clipperton Zone | |
| TMC the metals company Inc. | 0225054 |
Extinct volcanoes that rise 500 to 2,000 m above the seafloor punctuate the seafloor of the CCZ. Depth in the CCZ increases from 3,800 to 4,200 m at 115˚ west to 4,800 to 5,200 m at 130˚ west and 5,400 to 5,600 m at 145˚ west. The sediment types exhibit trends perpendicular to the bounding fracture zones, from predominant carbonate sediments in the south-eastern extreme to predominant siliceous red clay in the west north-west.
| Figure 6.2. | Bathymetric map of the Clarion-Clipperton fracture zone |
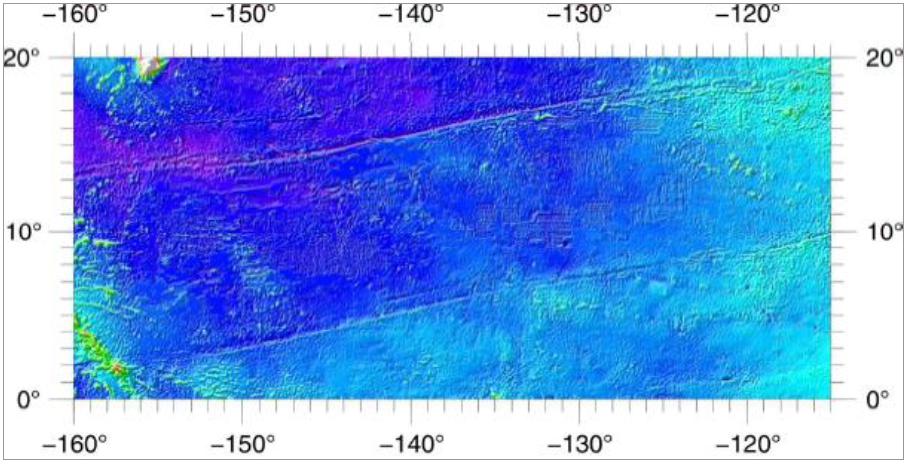
Source: ISA, 2010a
| 6.2 | Sedimentation and nodule formation |
Nodules comprise nuclei and concentric layers of iron and manganese hydroxides and form via the precipitation of metals from seawater and sediment pore-water. The metal accumulates slowly, and it generally takes millions of years for a nodule to form (Skowronek et al. 2021).
Nodules are abundant in abyssal areas with oxygenated bottom waters, low sedimentation rates (less than 10 cm per thousand years), and where sources of abundant nuclei occur (Hein et al., 2013). Nodules grow on 0.1 to 1 cm nuclei (e.g., pieces of pumice and older broken nodules) and generally range from about 1 to 12 cm in their longest dimension, with the low to middle-range typically the most common (1 to 5 cm).
The specific conditions of the CCZ (water depth, latitude, and seafloor sediment type) are considered to be the key controls for nodule formation along with the following factors:
| · | Supply of metals to the growing surface | |
| · | Presence of a nucleus | |
| · | The corrosive / erosive forces caused by benthic currents | |
| · | Occurrence of a semi-liquid surface layer on the seafloor (sediment water interface) | |
| · | Bioturbation |
The highest values of metals in nodules are thought to be best developed on the seafloor in the equatorial regions away from land sources of sediments. In these regions, surface waters have high primary productivity. Tiny plants and animals concentrate the metals from seawater and, when they die, they sink to the seafloor, dissolve, and release the metals into the pore water of seafloor sediments. It is believed that the upper portion of the nodules accumulate metals that precipitate from seawater, while the lower portion of the nodules, partially buried in sediment, accumulate metals from pore water in the underlying sediments.
| amcconsultants.com | 64 |
| Technical Report Summary of Prefeasibility Study of NORI Area D, Clarion Clipperton Zone | |
| TMC the metals company Inc. | 0225054 |
Sediments from the CCZ consist mostly of clays and siliceous biological casts. Sands and larger sediments are not generally found so far from land, and the commonly formed carbonate biological casts dissolve on the seafloor in these deep-water regions faster than they accumulate.
| 6.3 | Polymetallic mineralization |
The ISA completed a geological modelling project in 2009, based on data collected by contractors over the preceding 30 years (ISA, 2009, 2010a, 2010b).
| 6.3.1 | Nodule grades |
Nodule chemistry varies only slightly within the CCZ. Figure 6.3 to Figure 6.6 show the distribution of nickel, cobalt, copper, and manganese grades across the CCZ, as estimated by the ISA (ISA, 2009). The high continuity and low variability of grades across vast distances is remarkable. Copper and manganese generally increase towards the southeast, cobalt is generally higher towards the north, and nickel is generally higher towards the center and southwest of the CCZ. The reason for these very large-scale trends is not clear. The German data for NORI Area D were not included in the ISA geological model.
| 6.3.2 | Nodule abundance |
Nodules lie on the seafloor sediment, often partly buried. Some nodules are completely buried, although the frequencies of such subsurface occurrences are very poorly defined. Kotlinski and Stoyanova (2006) document up to five discrete layers of buried nodules, although all were within 45 cm of the surface despite using sediment cores of 250 to 380 cm depth (i.e., all of these nodules are near surface). Other images of box corers also suggest that all or most of the nodules are at the surface. Consequently, drilling is not required for defining the Mineral Resources.
During the 2018 – 2022 NORI Area D campaigns, 93% of nodules sampled were situated at surface These include nodules on the surface and nodules with their top surfaces in the upper 1 cm of sediment. At least 96% are inferred to be within the top 5 cm of sediment. A few nodules were found at depth; most of these were usually clustered around the edges of the box core and are considered to have been pushed below surface by the box coring process.
Nodules vary in abundance, in some cases touching one another and covering more than 70% of the seafloor. The highest concentrations of nodules have been found on abyssal plains between 4,000 and 6,000 m below sea level.
Figure 6.7 shows estimated nodule abundance data from the ISA geological model project. Data analysis shows that variability of nodule abundance is significantly higher than variability of metal grades.
| amcconsultants.com | 65 |
| Technical Report Summary of Prefeasibility Study of NORI Area D, Clarion Clipperton Zone | |
| TMC the metals company Inc. | 0225054 |
| Figure 6.3 | Map of nickel grade distribution in the CCZ |
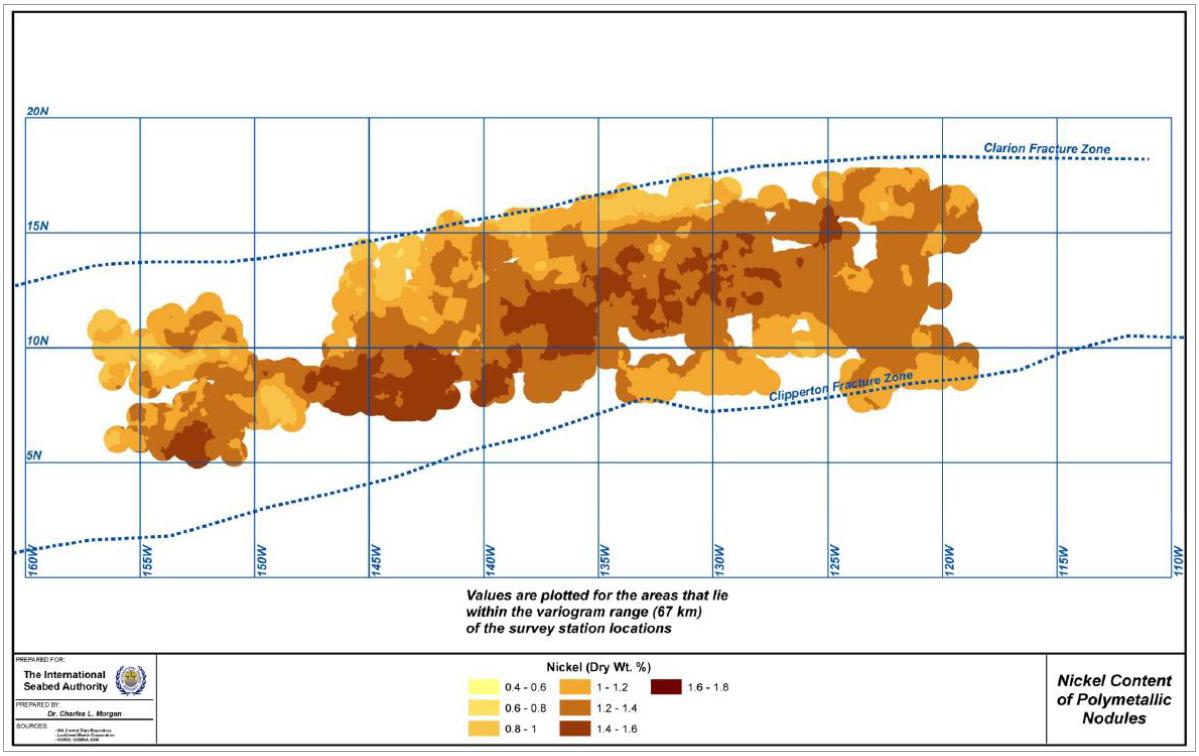
Source: ISA, 2009
| amcconsultants.com | 66 |
| Technical Report Summary of Prefeasibility Study of NORI Area D, Clarion Clipperton Zone | |
| TMC the metals company Inc. | 0225054 |
| Figure 6.4 | Map of cobalt grade distribution in the CCZ |
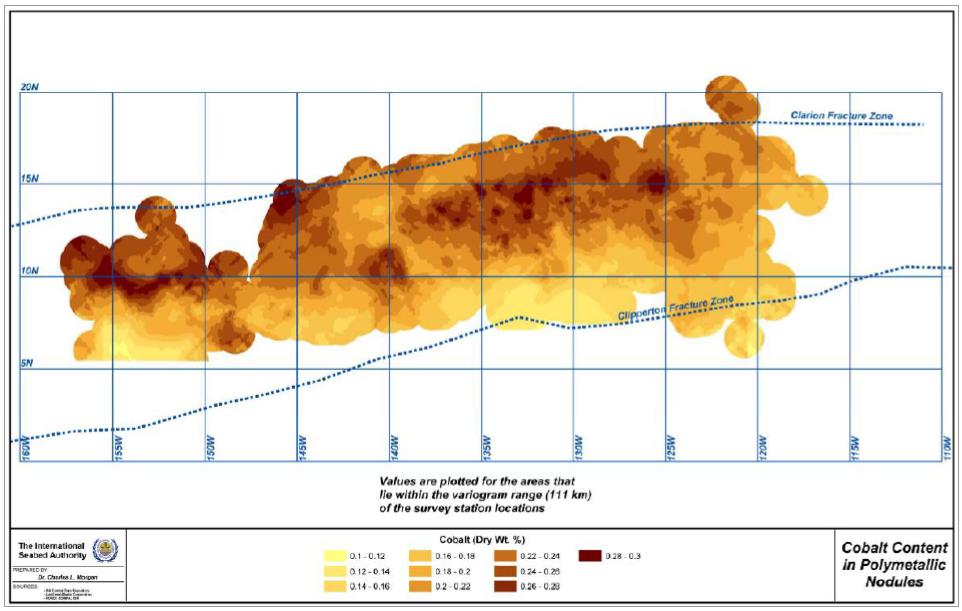
Source: ISA, 2009
| amcconsultants.com | 67 |
| Technical Report Summary of Prefeasibility Study of NORI Area D, Clarion Clipperton Zone | |
| TMC the metals company Inc. | 0225054 |
| Figure 6.5 | Map of copper grade distribution in the CCZ |
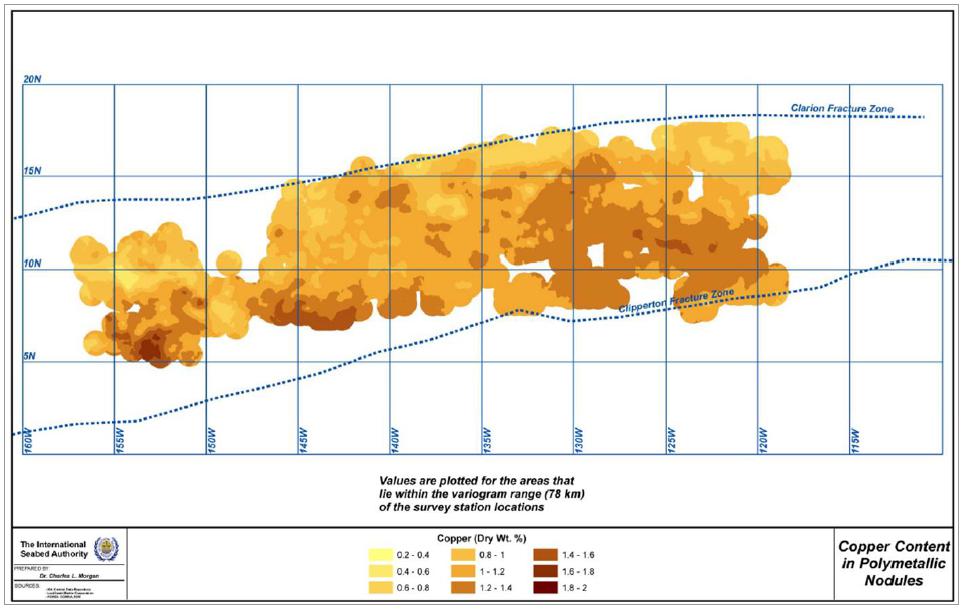
Source: ISA, 2009
| amcconsultants.com | 68 |
| Technical Report Summary of Prefeasibility Study of NORI Area D, Clarion Clipperton Zone | |
| TMC the metals company Inc. | 0225054 |
| Figure 6.6 | Map of manganese grade distribution in the CCZ |
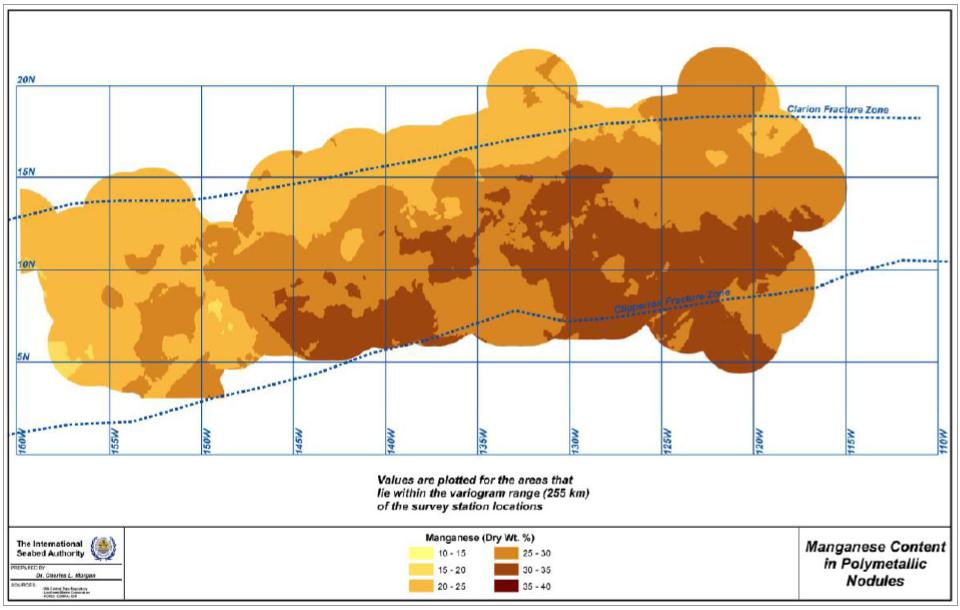
Source: ISA, 2009
| amcconsultants.com | 69 |
| Technical Report Summary of Prefeasibility Study of NORI Area D, Clarion Clipperton Zone | |
| TMC the metals company Inc. | 0225054 |
| Figure 6.7 | Map of nodule abundance distribution in the CCZ |
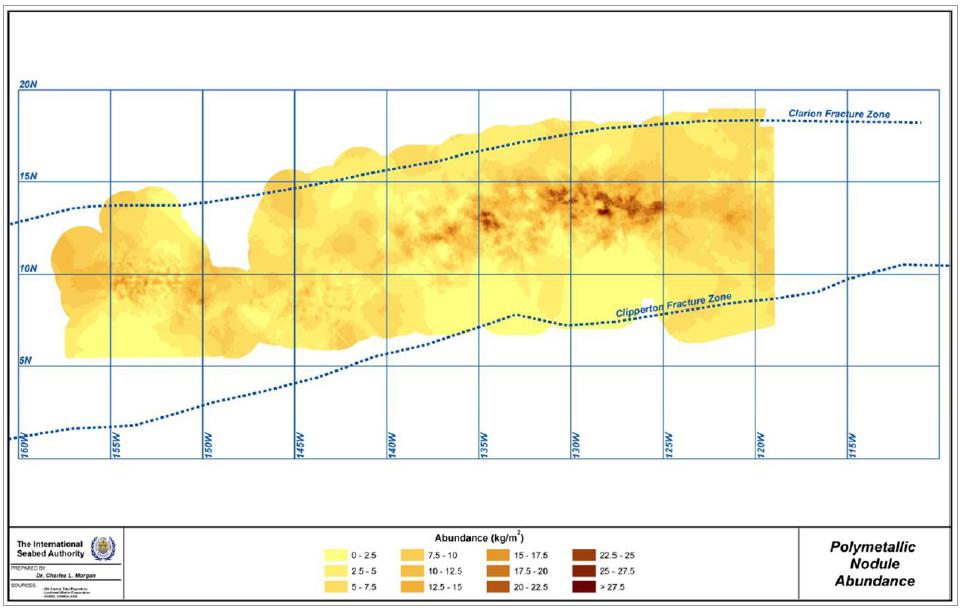
Source: ISA, 2009
| amcconsultants.com | 70 |
| Technical Report Summary of Prefeasibility Study of NORI Area D, Clarion Clipperton Zone | |
| TMC the metals company Inc. | 0225054 |
| 6.3.3 | Nodule facies |
NORI identified three broad facies of nodule distribution on the seafloor (distribution pattern with similar nodule coverage and nodule sizes), based on camera imagery. They are summarized in Table 6.1.
| Table 6.1 | Nodule Facies in NORI Area D |
| Nodule camera facies type | Description | Example |
| Type 1 - densely packed / interconnected | >50% of seafloor covered by nodules ~1 – 10 cm length |
|
| Type 2 - mostly individual / locally interconnected | ~20 – 40% of seafloor covered by nodules Mostly 5 – 20 cm length
|
|
| Type 3 – mostly individual / sparse | 10 – 20% of seafloor covered by nodules Mostly 5 – 20 cm length
|
|
| Other | Volcanic outcrop - associated with NW-SE ridges |
|
| amcconsultants.com | 71 |
| Technical Report Summary of Prefeasibility Study of NORI Area D, Clarion Clipperton Zone | |
| TMC the metals company Inc. | 0225054 |
Type 1 nodule facies is typically characterized by >50% nodules (by area of coverage). The majority of these nodules are typically medium-sized and are closely packed, with many nodules in contact with their neighbors.
Types 2 and 3 are characterized by larger nodules, and the nodules are typically separated (i.e., there are noticeable sediment gaps between individual nodules).
In high-resolution camera imagery, facies boundaries may be quite sharp (i.e., not gradational) and variable over short distances (<100 m), as illustrated in Figure 6.8.
| Figure 6.8 | Camera Imagery Showing Change from Type 3 Nodules (right) to Type 2 (left) |
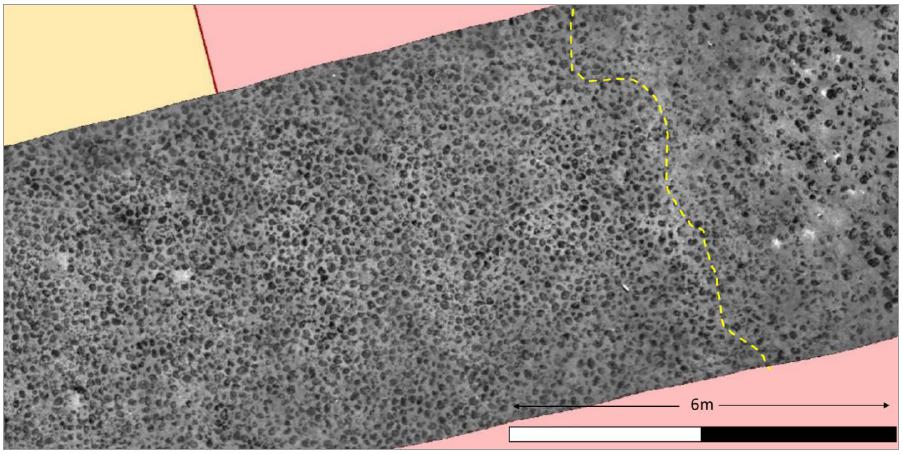
Nodule distributions can be mapped by measuring the backscatter (return signal) response from multi-beam echo sounding (MBES) from vessels on the ocean surface. Type 1 nodule facies correlates with moderate-amplitude backscatter areas and is the most common facies. Type 2 and 3 nodule facies typically correlate with higher-amplitude backscatter areas. These correlations are shown in Figure 6.9, which shows nodule classification according to photographic traversing by autonomous underwater vehicle (AUV). In Figure 6.9, the ribbon-tracks are colored as Type 1 (green), Type 2 (yellow), Type 3 (red) against a background of backscatter data. The backscatter data are colored by amplitude; high-amplitude areas associated with Type 2 and 3 nodule facies shown in warmer colors, with Type 1 represented by colder colors. The highest amplitude signals indicate volcanic outcrops associated with seamounts and ridge-tops.
| amcconsultants.com | 72 |
| Technical Report Summary of Prefeasibility Study of NORI Area D, Clarion Clipperton Zone | |
| TMC the metals company Inc. | 0225054 |
| Figure 6.9 | Map of Nodule Classification According to Photographic Traversing by AUV Compared to Backscatter Intensity5 |
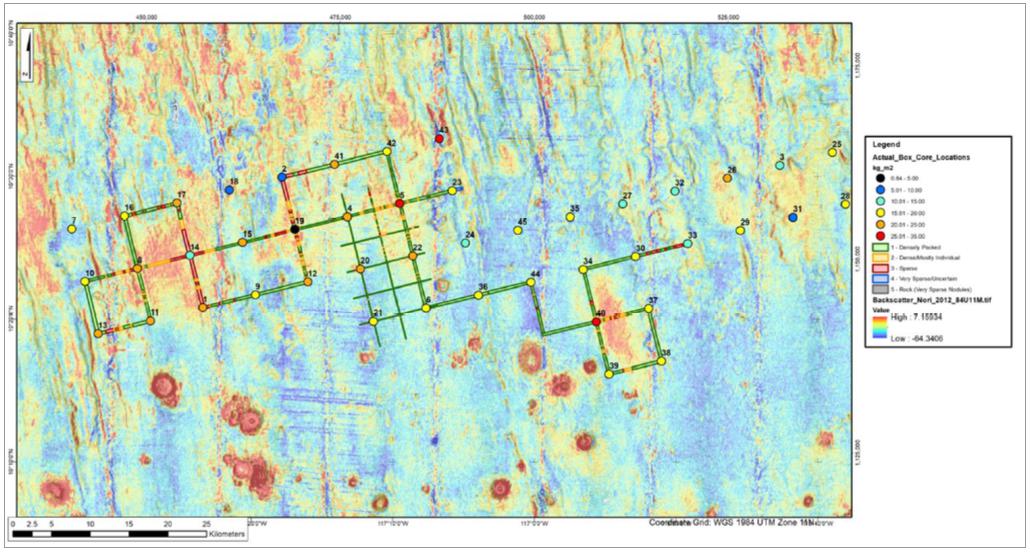
| 5 | Note: box core locations are labelled with box core number and coloured by abundance. Ribbon-track coloured by facies Type: Type 1 (green), Type 2 (yellow), Type 3 (red)) against a background of backscatter data. The backscatter responses are coloured by amplitude; high-amplitude areas associated with Type 2 and 3 nodule facies shown in warmer colours, with Type 1 represented by colder colours. |
| amcconsultants.com | 73 |
| Technical Report Summary of Prefeasibility Study of NORI Area D, Clarion Clipperton Zone | |
| TMC the metals company Inc. | 0225054 |
| 6.4 | Geological domains |
Based on analysis of bathymetric data from the 2012 and 2018 campaigns, together with box core data, eight geological domains which characterize nodule prospectivity were interpreted:
| 1) | Abyssal plains: these constitute the majority of NORI Area D and are characterised by gentle slopes of 0˚ to 6˚, and nodules lying on soft sediment. Nodules were observed to be ubiquitous in this domain wherever it was surveyed and sampled. It is considered a highly- prospective domain for nodules. |
The abyssal plains can be further divided into three subdomains based on backscatter response and ground-truthing (box core samples and land-out video footage):
| · | Areas considered indicative of Type 2 and 3 nodule facies, as determined from high amplitude backscatter response. | |
| · | Areas considered indicative of Type 1 nodule facies, as determined from moderate amplitude backscatter response. | |
| · | Sediment drift domains—characterised by a soft sediment ooze with low amplitude backscatter response, and extremely low to no nodule abundance (1% area coverage). |
The remaining 4% of the abyssal plains are occupied by the volcanic cones (see below):
| 1) | Abyssal hills: these are topographically higher features, oriented NNW-SSE, and are parallel to one another. Slopes of the hills are mostly gentle on the western side, while they are very steep at the eastern side, likely representing horsts (fault blocks) bounded by inward-dipping normal faults and outward-dipping volcanic growth faults respectively. |
| 2) | Abyssal hills (hard): abyssal hills where the hill crests are associated with the occurrence of hardgrounds, caused by proximity of underlying (harder) Neogene-age footwall sediment succession at the seafloor, typically covered by a veneer of unconsolidated sediment. |
| 3) | Slopes ³ 6°: these are associated with the flanks of abyssal hills, where the slope is 6° or greater, and are likely associated with hardgrounds and/or volcanic debris and volcanic outcrop development typically associated with NNW trending faults. These steep slopes are considered to have low nodule prospectivity but have not been fully tested with sampling or photography. |
| 4) | Slopes ³ 6° (hard): these are associated with the flanks of abyssal hills where the slope is 6˚ or greater, and are associated with hardground development, typified by outcropping (harder) Neogene-age sedimentary rocks. These steep slopes are considered to have low nodule prospectivity, based on limited box core sampling, AUV SBP data and photography. |
| 5) | Volcanic outcrops: these are associated with volcanic growth-faults along the abyssal hill flanks, which trend NNW-SSE, and are elongated, narrow bodies mapped through integration of AUV SBP and camera data with EM 122 MBES data backscatter data. |
| 6) | Volcanic cones: these are typically grouped in chains and follow the east-southeast “Hawaiian trend”. These are isolated features and were not sampled during the 2018 or 2019 NORI campaigns. However, due to their volcanic origin, steep slopes (>6˚) and dominant high-intensity backscatter (typically associated with volcanic outcrop), they are also considered to have low nodule prospectivity. |
| 7) | Volcanic high: this is a macro-scale topographic feature situated in the SE corner of NORI Area D. It is interpreted as a relic volcanic intersection high, which also includes a relic transform parallel trough. Both are volcanic related features associated with the Clipperton transform zone, situated to the south of NORI Area D. |
These domains are described further in Section 11.5.
| amcconsultants.com | 74 |
| Technical Report Summary of Prefeasibility Study of NORI Area D, Clarion Clipperton Zone | |
| TMC the metals company Inc. | 0225054 |
| 6.5 | Nodule morphology and formation |
A variety of nodule classification systems were used in previous studies of the CCZ (for example, Haynes et al. 1985), but the three-class system promoted by the ISA (ISA 2010) prevails today (see Figure 6.10). Nodules are classified according to their morphology or texture, as:
| · | S-type (smooth type) | |
| · | R-type (rough type) | |
| · | S-R-type (smooth-rough mixed type) |
It is postulated that the different textures are related to the position of the growing nodule, relative to the seafloor, as shown in Figure 6.10. The S-type nodules are interpreted to have grown by absorption of metals directly from seawater (hydrogenetic processes), the R-type are interpreted to have absorbed metals from the water within the seafloor sediment (diagenetic processes), and the S-R-type are interpreted to have grown as a result of both hydrogenetic and diagenetic processes. These formation mechanisms affect grade distribution and are considered in the development of estimation domains under S-K 1300.
There is a general association between this textural classification and the nodule facies observed in seafloor photographs and interpreted from backscatter response. Type 1 facies appears to be characterized by smaller S-type or S-R type nodules and Type 2 and 3 facies appear to be characterized by larger R-type or S-R -type nodules.
| Figure 6.10 | Nodule types |
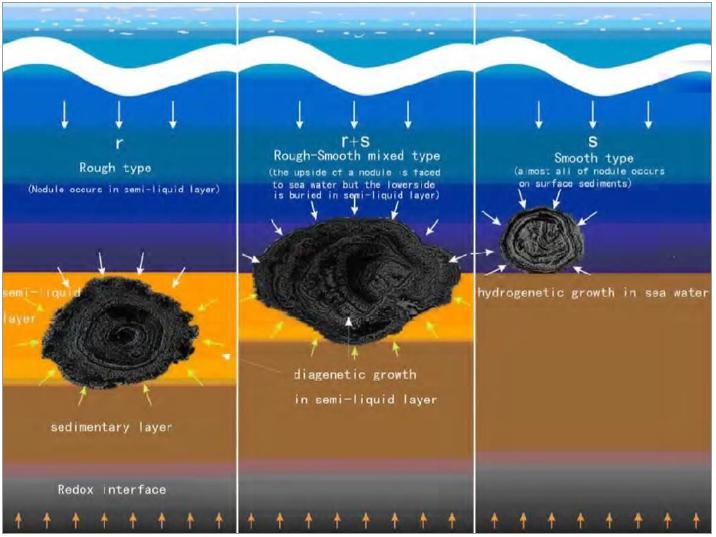
Source: ISA, 2010a
| amcconsultants.com | 75 |
| Technical Report Summary of Prefeasibility Study of NORI Area D, Clarion Clipperton Zone | |
| TMC the metals company Inc. | 0225054 |
| 7 | Exploration |
NORI completed offshore exploration campaigns in NORI Area D in 2012, 2018 and 2019. In addition, exploration data was gathered as part of test mining in 2022. Additional campaigns were completed in 2020 and 2021, but these were focussed on collecting environmental base-line data. A campaign was completed in late 2023 and early 2024 to examine recovery 12 months after completion of the collector test.
| 7.1 | NORI 2012 campaign |
The RV Mt. Mitchell, which sailed from the port of Seattle, was used for the NORI 2012 campaign. NORI conducted bathymetric mapping of the seafloor, using a hull-mounted Kongsberg Simrad EM120 12 kHz, full-ocean depth multibeam system, within NORI Area C and D, as well as bulk nodule sampling for metallurgical test work. Due to the nature of the bulk sampling, these samples are not suitable for use in Mineral Resource estimation and were therefore excluded from the data used in estimating the Mineral Resources disclosed herein.
The whole of NORI Area D (25,439 km2) was surveyed. Due to swath width and vessel orientation relative to course-made-good, some data were recorded beyond the bounds of those areas. An image of the bathymetric data for NORI Area D, in plan view, is shown in Figure 7.1.
| Figure 7.1 | Map showing NORI Area D Bathymetry6 |
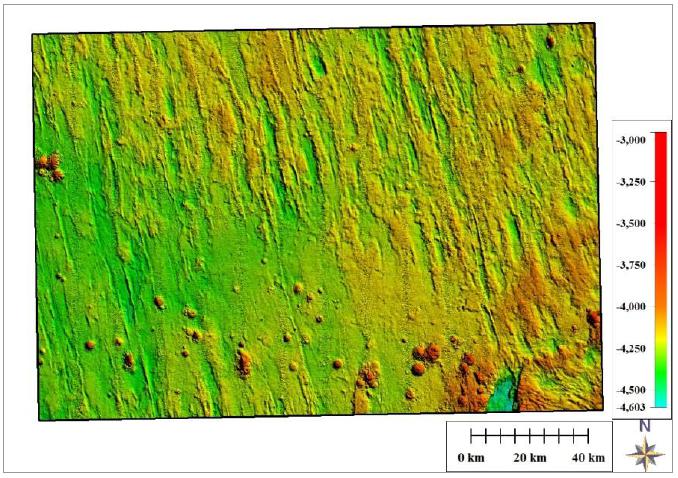
Note: the canted box is a result of projecting a large geographic area (bounds given in latitude / longitude format) into UTM 10 N, WGS 84. Colour scale units are metres below sea level.
| 6 | Note: the canted box is a result of projecting a large geographic area (bounds given in latitude / longitude format) into UTM 10 N, WGS 84. Colour scale units are metres below sea level. |
| amcconsultants.com | 76 |
| Technical Report Summary of Prefeasibility Study of NORI Area D, Clarion Clipperton Zone | |
| TMC the metals company Inc. | 0225054 |
MBES data was processed during the 2012 NORI Campaign and used to locate areas of high nodule density for dredge sampling, based on the bathymetric surfaces and the backscatter intensities. Overall, the geophysical interpretation of the multibeam data was remarkably successful.
Bulk samples were collected by dredging from NORI Area D (28 dredge deployments). Approximately 4,500 kg of nodules were collected from NORI Area D. Video footage was also obtained during dredge deployments and, together with the samples recovered, provided verification of nodules within NORI Area D. Eighteen (18) nodule samples from NORI Area D were assayed. The samples grades were consistent with the mean grades derived from the historical grab samples in NORI Area D. A large suite of additional elements was also assayed. A drying test undertaken on a nodule sample collected during the NORI 2012 campaign indicated moisture loss of 24% at 120°C.
| 7.2 | NORI 2018 campaign |
| 7.2.1 | Objectives and approach |
Marine Geoscience Innovation (MARGIN) reprocessed the MBES backscatter data from the 2012 MV Mt Mitchell vessel-based MBES survey using the time-series data. This greatly improved the image quality (see Figure 7.2) compared to the original beam-averaged data and enabled geological interpretations of the data to be refined. These interpretations provided the foundation for selecting candidate test mining site targets for follow-up detailed AUV surveys. These targets were located within the central portion of NORI Area D and were designated the Detailed Survey Area Outline (DSAO) (Figure 7.2, red outline).
During April to June 2018, NORI conducted a successful survey and seafloor sampling program in NORI Area D using the OSV Maersk Launcher and mobilizing out of San Diego (Campaign 3). The work completed is summarized below. AMC 2019 provides additional information.
The key objectives of this program were to conduct detailed bathymetric and sonar imaging (MBES backscatter, side scan sonar (SSS), and photogrammetry surveys to help:
| · | Identify and select enough suitable ground for trials of a collector (the test mining). | |
| · | Provide sufficient geological and geotechnical detail to ensure that future sampling and test mining programs can be appropriately designed. | |
| · | Provide appropriate seafloor imagery to assist with selection of suitable environmental monitoring sites – particularly for physical oceanographic mooring studies. | |
| · | Identify smaller environmental baseline reference zones. An important consideration was that the habitats of these reference sites were similar in character to the site for the test mining. | |
| · | Demonstrate the methodology to upgrade resource confidence from Inferred to Indicated and Measured categories. |
Fugro provided turnkey survey and seafloor sampling support for the campaign, including:
| · | AUV operational support. | |
| · | Hydrographic survey support. | |
| · | Data processing. | |
| · | Geoscience support for AUV survey (data compilation and preliminary data analysis). | |
| · | Geoscience support for box coring operations (core logging, nodule processing, geotechnical testing). |
ERIAS Group environmental consultants provided biological sampling support. MARGIN conducted data QA/QC, survey design and data interpretation as a client representative on behalf of NORI.
| amcconsultants.com | 77 |
| Technical Report Summary of Prefeasibility Study of NORI Area D, Clarion Clipperton Zone | |
| TMC the metals company Inc. | 0225054 |
The data acquired formed the primary basis for the Resource and Reserve estimates disclosed in this Report. All exploration results have been verified by the Qualified Person as required by Item 1302(b)(2)(ii).
| Figure 7.2 | Reprocessed EM120 Backscatter Data from NORI Area D 2012 Survey |
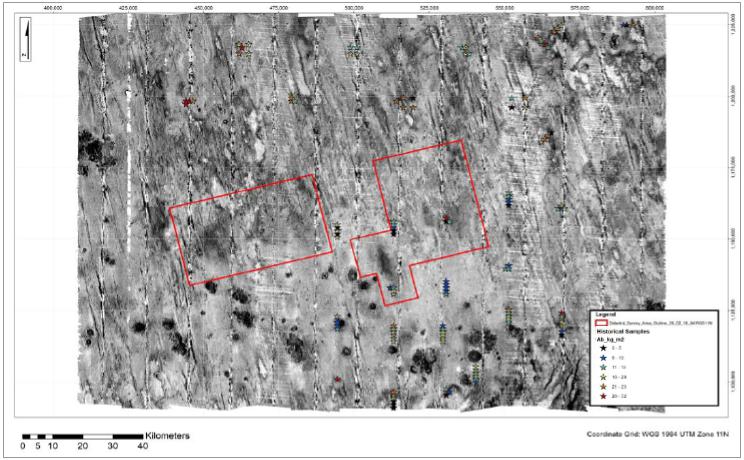
Note: NB – areas designated for AUV detailed survey are shown outlined in red, constituting targets deemed to have high-nodule potential and characterised by dominantly flat-lying topography.
| 7.2.2 | AUV survey |
AUV survey methods were identified as the best technological fit for follow-up investigation at a site-survey scale. An AUV has the capability to provide co-registered multi-sensor datasets at the appropriate resolutions necessary to confidently select the most suitable site for test mining and provide a framework on which to build associated ongoing engineering and environmental studies.
Fugro’s ESVII 4500 m-rated Kongsberg Hugin AUV was used to conduct the detailed survey work using an MBES, SSS, sub-bottom profiler (SBP), and camera payload (see Figure 7.3). The AUV typically navigates using a combination of Inertial Navigation System (INS) housed within the AUV and an acoustic navigation system (Kongsberg HiPAP 501 ultra-short baseline (USBL) system) communicating between the AUV and the support vessel. The USBL acoustically tethers the AUV to the support vessel, which follows the AUV during its survey and provides the AUV with navigation corrections to counteract drift in the INS system over time. This mode of operation was used for all reconnaissance mapping with the AUV. For survey of the test mining site, the AUV was positioned within an array of transponders positioned on the seafloor—termed an underwater transponder protocol (UTP) array. This enabled the AUV to operate autonomously to complete its survey, whilst the support vessel conducted other work in the exploration contract area.
| amcconsultants.com | 78 |
| Technical Report Summary of Prefeasibility Study of NORI Area D, Clarion Clipperton Zone | |
| TMC the metals company Inc. | 0225054 |
There were four main AUV survey focus areas:
| · | Reconnaissance lines were collected at a 35 m AUV altitude in order to assess geological and near-surface conditions prior to acquiring low-altitude camera data. These data were also used to select the test mining site location and to assess possible areas for preservation reference zones (PRZ) in NORI Area D. | |
| · | Camera lines were run at a 6 m AUV altitude in order to map the distribution and abundance of the nodules. This data was also used to select the test mining site location. | |
| · | In the test mining site, data were collected at a 22 m altitude and were used to evaluate geologic and near-surface conditions for future test mining activities. | |
| · | Within the mooring sites, data were collected at a 90 m altitude and were used to evaluate geologic and near-surface conditions for future mooring locations. |
| Figure 7.3 | Deployment ESVII Kongsberg Hugin AUV from the stern of the Maersk Launcher |
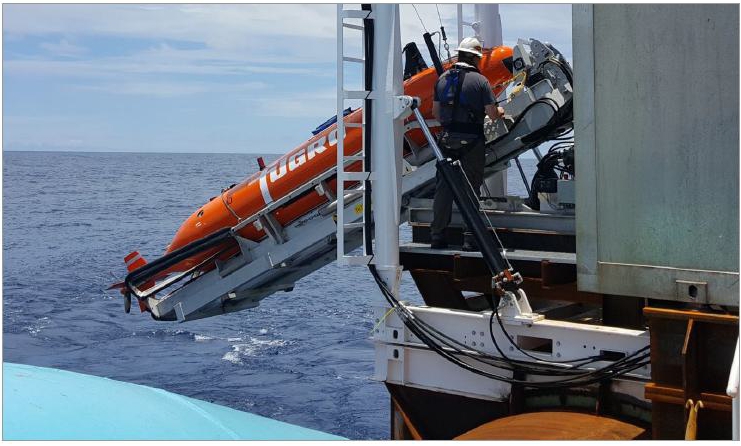
Source: J. Croucher
Initial reconnaissance AUV survey traverses were conducted within the DSAO (see Figure 7.4) using MBES, SSS, and SBP payloads to provide confirmation of topographic and geological features observed in the 2012 vessel-based MBES dataset but at a higher level of detail and confidence. There was an excellent correlation between the AUV bathymetric data and that collected by hull-based multibeam methods in 2012, providing confidence in both sets of results. These traverses were then followed-up with low-altitude surveys using the AUV’s camera payload (termed Camera High Priority survey (CHP)) to provide visual confirmation of nodule distribution.
The reconnaissance traverses were also designed in such a manner as to provide information on nodule continuity (through acquisition of sonar and camera data) between proposed sampling sites on a 7 km rectilinear sampling grid. A key component of the success of the campaign was the ability to conduct simultaneous box coring operations along the DSAO survey traverses, whilst the AUV was engaged with unsupervised ultra-high resolution MBES survey within the selected test mining site, through use of the UTP seafloor acoustic positioning array.
A total of 2286 line km of data was acquired with the AUV, covering an area of approximately 375 km2 of seafloor.
| amcconsultants.com | 79 |
| Technical Report Summary of Prefeasibility Study of NORI Area D, Clarion Clipperton Zone | |
| TMC the metals company Inc. | 0225054 |
Table 7.1 summarizes data types and associated data resolutions collected by the AUV during the 2018 NORI campaign.
| Figure 7.4 | AUV Geosurvey Data Acquired during the 2018 NORI Campaign |
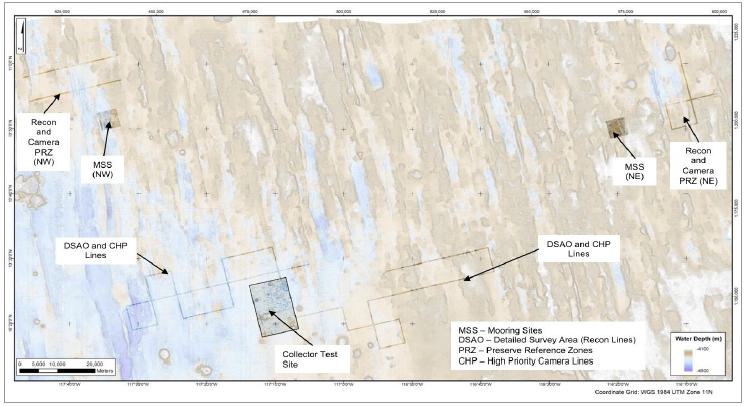
Source: MARGIN
All data acquired by the AUV was processed on board the vessel to a level where preliminary interpretation could be made on the data by the Fugro geoscience team and NORI client representative on board. This was key in enabling on-site decision making for follow-up survey optimization, particularly with regards to selecting the most suitable test mining site.
| Table 7.1 | Summary of Data Types Collected by the AUV during the 2018 NORI Campaign |
| AUV altitude | Survey area | |||||||||
| 90 m | 35 m | 22 m | 6 m | |||||||
| Sensor | Data item | Details | MSS (NE) |
MSS (NW) |
DSAO | Recon PRZ (NE) |
Recon PRZ (NW) |
test
mining area |
CHP | Camera PRZ (NW) |
| MBES | Bathy | Bin size | 3 m | 3 m | 1 m | 50 cm | 50 cm | 27 cm | 15 cm | 15 cm |
| Backscatter | Bin size | 3 m | 3 m | 1 m | 50 cm | 50 cm | 15 cm | 15 cm | 15 cm | |
| Side scan sonar | SSL | Bin size | 50 cm | 50 cm | 50 cm | 25 cm | 25 cm | 27 cm | N/A | N/A |
| SSH | Bin size | N/A | N/A | 50 cm | 25 cm | 25 cm | 15 cm | N/A | N/A | |
| SSX | Bin size | N/A | N/A | N/A | N/A | N/A | N/A | 7 cm | 7 cm | |
| Camera | Orthos | Bin size | N/A | N/A | N/A | N/A | N/A | N/A | 3 mm | 3 mm |
| Sub bottom profiler | Sub bottom | Frequency | N/A | N/A | 1-10 khz | 1-10 khz | 1-10 khz | 1-10 khz | 3.5-20.5 khz | 3.5-20.5 khz |
Note: MBES operated at 200 or 400 kHz, depending on survey resolution requirements. SSS was operated at 240 kHz, 540 kHz, or 1,600 kHz.Note: MBES operated at 200 or 400 kHz, depending on survey resolution requirements. SSS was operated at 240 kHz, 540 kHz, or 1,600 kHz.
| amcconsultants.com | 80 |
| Technical Report Summary of Prefeasibility Study of NORI Area D, Clarion Clipperton Zone | |
| TMC the metals company Inc. | 0225054 |
| 7.2.3 | Camera imagery |
Camera imagery and data acquired by the Fugro ESVII AUV was logged to the AUV’s internal payload processing data storage disk. This data is co-registered, and time-date stamped with the vehicle’s other geophysical sensors (such as SSS) and navigation systems and resultant navigation data. The vehicle was positioned with a combination of INS and USBL navigation.
Once each dive was completed and the AUV returned to deck, the data was transferred across from the payload data disk bottle to the Fugro data processing server and backed-up.
Preliminary processing of the data was undertaken on board to aid follow-up survey site selection and optimization. Review of the data was undertaken by the Fugro geoscience team and NORI client representative on the vessel. The data was fully processed post campaign completion at Fugro’s Layfette offices in Louisiana.
Additional image classification and nodule long-axes automated extraction was undertaken by the same Fugro 2018 NORI campaign Geoscience members at Fugro’s offices in Houston, Texas.
| 7.2.4 | Box coring |
Box coring was undertaken using a 0.75 m2 box corer built by KC Denmark A/S, deployed from a H-frame situated amid ships of the Maersk Launcher (see Figure 7.5). A total of 45 box cores were acquired during the campaign. All box cores were acquired in the detailed survey area on a 7 km square grid (see Figure 7.6). The sampling grid was designed prior to the mobilization of the 2018 NORI campaign; therefore, the samples were selected without reference to any of the detailed geophysical data to avoid any bias.
Each box core site was located by positioning the vessel over the proposed box core location and acoustically monitoring the box core’s position during descent using the vessel’s USBL system communicating with a USBL transponder attached to the box core frame. Once the box core was lowered to approximately 30 m above the seafloor, the surveyor monitored when it was within a 35 m target circle displayed over the proposed target location on the USBL navigation workstation monitor. Once this condition was met, the instruction was given to lower the box core to bottom. Once on bottom a series of position fixes were acquired to solve the on-bottom position. The mean distance between the proposed target location and actual box core position was 18.4 m ±7.9 m.
It is important to note that the hydrographic surveyors guiding the landing out of box cores were only supplied the expected seafloor datum at the proposed core site location. They did not have access to any geophysical data (backscatter, SSS, camera, etc.) during these operations. This ensured that the sampling was conducted without any bias.
Once the position fix was taken, the cutting shovel was released to seal and secure the sample and the box corer was winched up off the seafloor. Once the sample was secured on deck, the samples follow three processing paths - environmental, geotechnical, and mineralogy.
A standalone GoPro camera system in a pressure-rated underwater housing and LED lights were attached to the legs of the box corer. This enabled post-recovery analysis of land-outs to be made and comparison of actual box core nodule recovery and in-situ nodule distribution on seafloor.
Figure 7.7 shows a sequence of box core land-out footage from the GoPro camera. The top image shows the land out site visual as box core is deployed to seafloor. The middle image shows the box corer sitting on the seafloor, before sample is taken (shovel open). The bottom image shows the box corer retracting from seafloor following successful closure of shovel. Loss of the laser-scale early in the campaign meant that nodule dimensions could not be accurately measured from the GoPro images.
| amcconsultants.com | 81 |
| Technical Report Summary of Prefeasibility Study of NORI Area D, Clarion Clipperton Zone | |
| TMC the metals company Inc. | 0225054 |
| Figure 7.5 | KC Denmark 0.75 m² box corer |
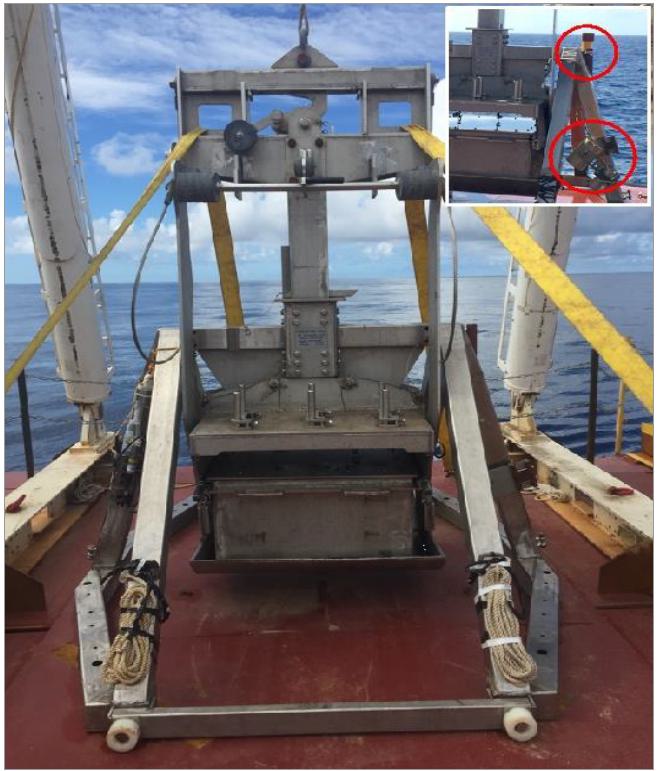
Source:MARGIN
| amcconsultants.com | 82 |
| Technical Report Summary of Prefeasibility Study of NORI Area D, Clarion Clipperton Zone | |
| TMC the metals company Inc. | 0225054 |
| Figure 7.6 | Box core locations for 2018 NORI Campaign 3 |
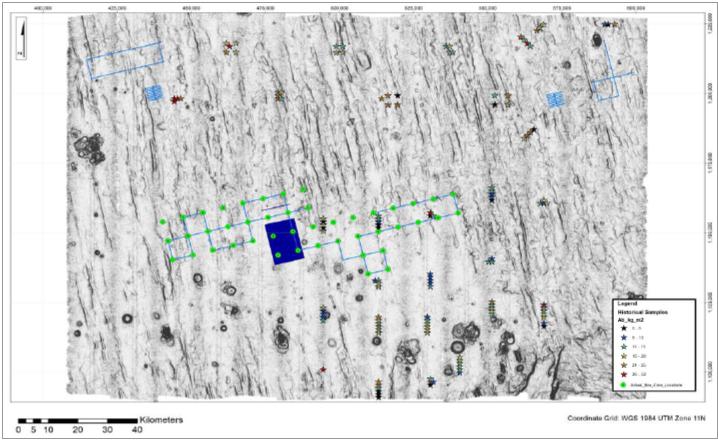
Source: MARGIN. Note: Historical sampling shown by stars. NORI 2018 campaign AUV geosurvey traverses shown in blue.
| amcconsultants.com | 83 |
| Technical Report Summary of Prefeasibility Study of NORI Area D, Clarion Clipperton Zone | |
| TMC the metals company Inc. | 0225054 |
| Figure 7.7 | Sequence of Box Core Land-out Footage from GoPro Camera |
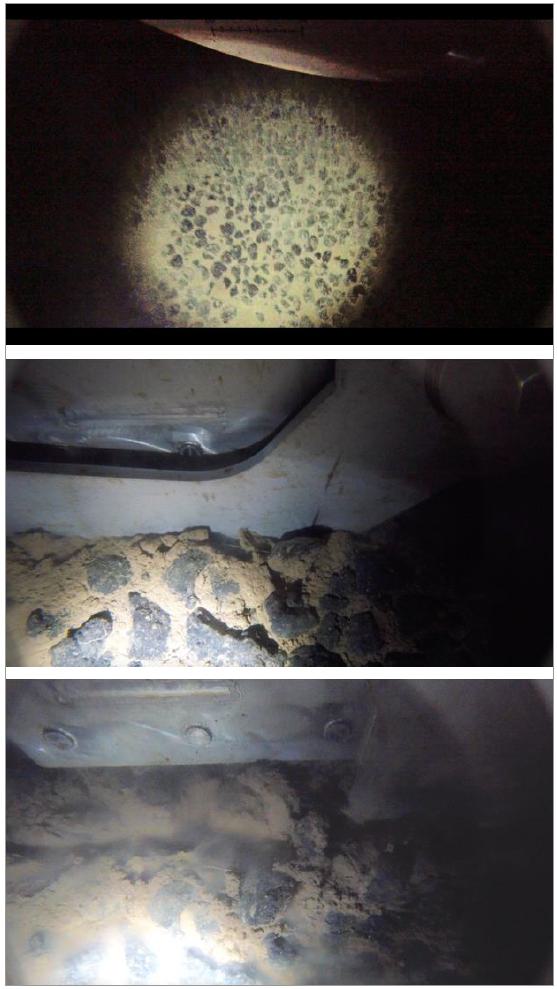
Source: NORI
| amcconsultants.com | 84 |
| Technical Report Summary of Prefeasibility Study of NORI Area D, Clarion Clipperton Zone | |
| TMC the metals company Inc. | 0225054 |
All samples were processed on board post-retrieval of a box core sample to deck (see Figure 7.8). The vessel was equipped with a biology cold laboratory and geoscience laboratory.
Once the box core was landed out on deck and safely secured, the box was separated from the box corer frame. Three processing protocols for environmental, geotechnical, and resource began immediately after collection of each box core. The processing flow on deck was undertaken in the following sequence:
| · | The top of the sample with the supernatant water still in place was photographed. | |
| · | The water was then carefully siphoned, bailed and / or suctioned off the sample and processed for biological analysis by the biological team on board. | |
| · | The undisturbed surface of the retrieved material (nodule surface) was photographed. | |
| · | A 50 × 50 cm area of the retrieved material was cordoned for biological study. | |
| · | Three subsamples were obtained from the undisturbed areas outside of the biology exclusion area for geotechnical purposes. All nodules except for possible buried nodules captured in the 2.638-inch push samples followed the Mineral Resource processing path. | |
| · | All surface nodules, when extracted from the box, proceeded to the biology wet laboratory where they were washed with cold seawater through a sieve. | |
| · | All buried nodules in the 50 × 50 cm area reserved for biologic sampling also proceeded to the biology wet laboratory. After washing, these nodules were returned to the geology wet laboratory. | |
| · | All buried nodules outside of the area of biologic investigation were washed of mud on deck and proceeded to the geology wet laboratory for description, measurement, photography, and sequestration in sample bags within gasket sealed pails. |
| Figure 7.8 | On-deck sample processing |
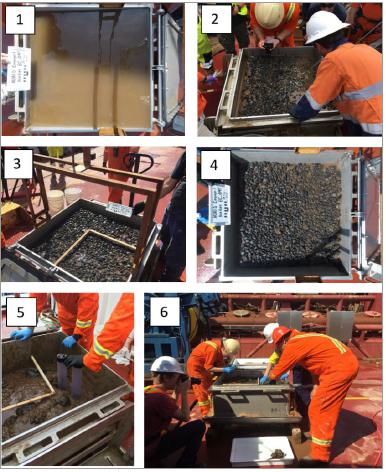
Source: NORI
| amcconsultants.com | 85 |
| Technical Report Summary of Prefeasibility Study of NORI Area D, Clarion Clipperton Zone | |
| TMC the metals company Inc. | 0225054 |
| 7.2.5 | Nodule sampling |
Each box core was sampled by depth interval. Four intervals were used:
| · | 0–1 cm | |
| · | 1–5 cm | |
| · | 5–15 cm | |
| · | >15 cm |
By weight, 91% of nodules occurred in the top layer and were exposed at the seafloor, and 99% occurred within the top 15 cm.
Nodules were processed through three stations (a weighing station, volume station and photography station) before being divided into samples and stored in labelled, gasket sealed 6-gallon pails. All data was collated in a series of Excel spreadsheets.
The geology team measured the density of samples of individual nodules or batches of nodules from each box core. Non-breakable beakers ranging from 200 ml to 2L were used to measure the volume displaced by the nodules. These measurements were used to calculate wet density values. The average of the results was 2.0 wmt/m3.
Samples for distribution to assay laboratories were prepared at sea so that the samples could be sent to their destinations upon demobilization. The mass of nodules recovered in the box cores was generally much more than required for assaying, so it was necessary to divide the nodules in an unbiased manner, to produce samples for assay and for reference. This was done by the cone and quarter method (see Figure 7.9). The sampling protocol varied according to the weight of the nodules (see Table 7.2 for summary).
After samples were split, the samples were divided into series of subsamples for marketing, primary assay, reference, duplicate primary sample and secondary primary sample. These were placed in sealed bags. Each sample was given a unique numbered zip tie placed inside the bag. Bar codes were generated from these unique numbers and adhered to the side of the bag, plus written on the side of the bag in permanent marker pen. Bar codes were linked to the Excel sampling database.
Certified blank samples were purchased from ALS laboratories in Reno, Nevada and inserted into the primary and duplicate sequence at a rate of 1 for every 10. One blank from the primary sequence and one blank in the duplicate sequence was spiked with approximately 50 g of nodules sourced from a marketing split. Certified nodule reference materials were purchased from the United States Geological Survey (USGS) and inserted randomly into the sample stream at the assay laboratory.
All samples were placed in gasket-sealed 6-gallon pails and sealed with tamper-proof tape.
| Table 7.2 | Sampling protocol |
| Total nodule weight |
Procedure | Primary assay sample |
Reference sample (retained) |
Duplicate (primary lab) |
Duplicate (secondary lab) |
Marketing sample |
| 0–4 kg | Crush oversize, cone and quarter. Combine opposite quarters to make two samples. | Yes | Yes | No | No | No |
| 4–8 kg | Crush oversize, cone and quarter. Bag separately. |
Yes | Yes | Yes | Yes | No |
| amcconsultants.com | 86 |
| Technical Report Summary of Prefeasibility Study of NORI Area D, Clarion Clipperton Zone | |
| TMC the metals company Inc. | 0225054 |
| Figure 7.9 | Coning and quartering process |
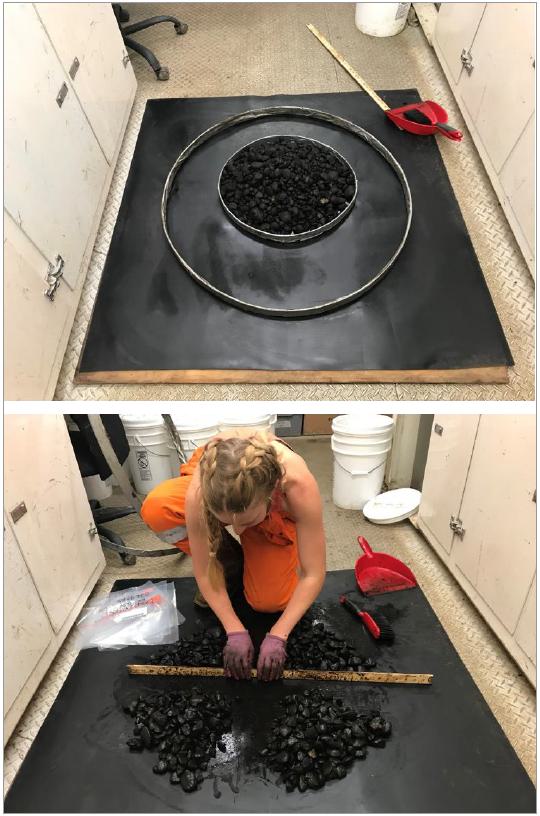
Source: NORI
| 7.2.6 | Image classification and size measurement |
Image-classification software was used to provide an alternative automated approach to measuring nodule dimensions using photographs. The QP has reviewed the outputs of the image classification method and deemed them consistent with physical measurements, permitting their use in tonnage estimation. Figure 7.10 compares the automated image-processing method and hand-held calliper measurements and shows a very good correlation between the two datasets. The average (mean) lengths of the long axes of the nodules using the classification approach and the measured approach were both 3.31 cm. The mean for short axis estimation using the classification approach was 2.68 cm, whilst the mean for the measured approach was 2.72 cm. The test demonstrated that the image-classification method was a practical, accurate method for measuring two orthogonal axes of the nodules, and it was used from box core BC_006 onwards.
| amcconsultants.com | 87 |
| Technical Report Summary of Prefeasibility Study of NORI Area D, Clarion Clipperton Zone | |
| TMC the metals company Inc. | 0225054 |
| Figure 7.10 | Comparison of Image Classifier Results vs. Caliper Measurements |
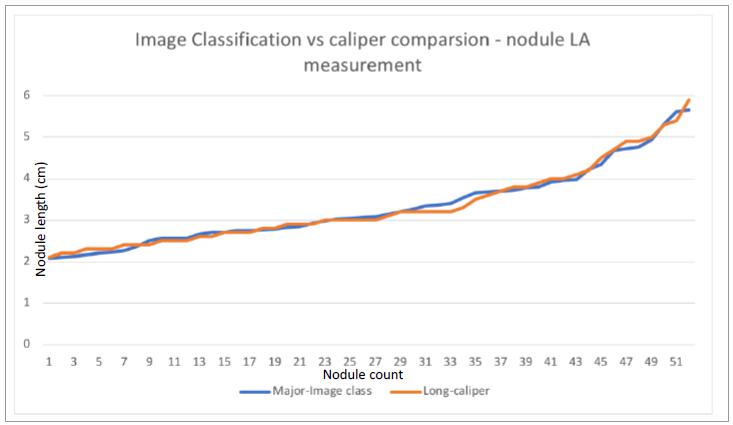
Source: MARGIN
| 7.2.7 | Biological sampling |
The biological sampling was completed in 35 of the box cores and consisted of the following:
| · | 239 nodule biota specimens were sampled. | |
| · | 62 megafauna (>2 cm) specimens were sampled. |
Samples were placed in cold storage for further analysis once ashore.
| 7.2.8 | Geotechnical sampling |
The geotechnical component of the NORI 2018 Campaign was designed to investigate the soil properties and develop an understanding of the soil geology and engineering parameters and thereby support the development of the ground model of NORI Area D.
Forty-three (43) box cores retrieved sufficient undisturbed soil for geotechnical testing. Figure 7.6 shows the box core locations. Three (3) soil subsamples for geotechnical study were obtained from the undisturbed areas outside of the biological sampling area of each box core. These consisted of one 54 mm (2.125 inch) inside diameter (ID) liner sample, and two 67 mm (2.638 inch) ID clear polycarbonate tubes pushed into the box core sample. The focus of the geotechnical sampling was the footwall sediment sequence: the nodules were removed prior to geotechnical sampling.
The liner sample was used to conduct basic offshore index and strength laboratory tests, comprised of soil descriptions, wet density measurements, and undrained shear strength index tests. Torvane tests and intact and residual laboratory vane tests were conducted.
| amcconsultants.com | 88 |
| Technical Report Summary of Prefeasibility Study of NORI Area D, Clarion Clipperton Zone | |
| TMC the metals company Inc. | 0225054 |
The two (2) subsamples taken in polycarbonate tubes were retained for onshore laboratory testing. The following standard laboratory tests were performed onshore by the Fugro laboratory in Houston, Texas: water content, Atterberg limits, total wet (bulk) density, grainsize analyses (sieve and hydrometer), organic content, carbonate content, specific gravity; and undisturbed/intact and remoulded laboratory vane. Additional onshore testing was conducted to establish the presence of sulfate within samples due to abnormal results noted in water content, Atterberg limits and carbonate testing.
Results from the field tests revealed that the shallow soil stratigraphy consists of a veneer (about 15 cm thick) of surficial, dark brown, very soft clay of which the top 6 cm presented in a semi-liquid state. The semi-liquid state was later interpreted to be the result of degassing and disturbance during box core retrieval. At about 15 cm depth, typically, a color change from dark brown to light brown occurs. Evidence of bioturbation of the light brown layer is indicated by mottling with dark brown and brown clays. It was noted on the high-resolution geophysical survey data that a reflector at about 15 cm to 20 cm depth was consistently present across all the box core sites sampled. This depth corresponds with the top of the light brown clay. Qualitative carbonate content testing typically indicates no reaction with dilute hydrochloric acid (10% concentration).
Full details of the operations, testing and results are contained in the Fugro reports No. 1803-1344, Volume I Geotech Field Report and No. 1803-1344_Volume II Geotechnical Data Report. Fugro, 2019).
Further consolidated analysis of the geotechnical investigation data is contained in Section 7.14.
| 7.2.9 | Exploration results |
The exploration results discussed herein include all data relevant to the Mineral Resource estimate. Additional data was acquired throughout the campaign for the purposes of selecting and mapping a test mining site, environmental preservation reference zones and oceanographic mooring site. These results are not discussed in any detail in this report.
| 7.2.9.1 | Box core abundance |
Table 7.3 lists the box core locations and recorded abundances. Figure 7.11 shows the spatial distribution of nodule abundance. The box cores had an average nodule abundance of 17.8 wet kg/m2, with the highest abundance reported at 30.9 wet kg/m2 (BC_005). The two lowest recorded abundances are BC_019 (0.8 wet kg/m2) and BC_031 (6.5 wet kg/m2).
| amcconsultants.com | 89 |
| Technical Report Summary of Prefeasibility Study of NORI Area D, Clarion Clipperton Zone | |
| TMC the metals company Inc. | 0225054 |
| Table 7.3 | Box Core Sample Coordinates and Nodule Weights- Campaign 3 |
| Box
core number |
Campaign | Actual location | Weight (kg) | Abundance (wet kg/m2) | Nodule facies (Type) | |||
| Easting (E) | Northing (N) | Offshore (kg) | Onshore (kg) | Offshore | Onshore | |||
| BC_001 | C3 | 457264.18 | 1143766.99 | 15.58 | 15.71 | 20.77 | 20.94 | 3 |
| BC_002 | C3 | 467489.80 | 1160647.52 | 6.28 | 6.31 | 8.37 | 8.41 | 2 |
| BC_003 | C3 | 531639.01 | 1162171.82 | 9.28 | 9.31 | 12.37 | 12.41 | 1 |
| BC_004 | C3 | 475895.81 | 1155523.38 | 17.55 | 17.47 | 23.40 | 23.30 | 1 |
| BC_005 | C3 | 482648.26 | 1157201.28 | 23.15 | 23.40 | 30.86 | 31.20 | 2 |
| BC_006 | C3 | 486026.80 | 1143693.04 | 13.81 | 13.56 | 18.41 | 18.08 | 1 |
| BC_007 | C3 | 440386.88 | 1153952.45 | 12.73 | 12.73 | 16.97 | 16.97 | 1 |
| BC_008 | C3 | 448824.28 | 1148843.81 | 15.75 | 15.47 | 21.00 | 20.63 | 1 |
| BC_009 | C3 | 464057.30 | 1145434.46 | 14.99 | 14.71 | 19.98 | 19.62 | 1 |
| BC_010 | C3 | 442086.43 | 1147143.64 | 12.76 | 12.68 | 17.01 | 16.90 | 1 |
| BC_011 | C3 | 450513.22 | 1142091.06 | 15.52 | 15.44 | 20.69 | 20.59 | 1 |
| BC_012 | C3 | 470813.45 | 1147104.99 | 15.86 | 15.78 | 21.14 | 21.04 | 1 |
| BC_013 | C3 | 443768.58 | 1140414.61 | 16.40 | 16.30 | 21.87 | 21.73 | 1 |
| BC_014 | C3 | 455617.96 | 1150528.98 | 8.28 | 8.20 | 11.04 | 10.93 | 3 |
| BC_015 | C3 | 462378.55 | 1152222.79 | 15.89 | 15.78 | 21.19 | 21.04 | 1 |
| BC_016 | C3 | 447191.82 | 1155620.92 | 13.25 | 13.18 | 17.67 | 17.58 | 1 |
| BC_017 | C3 | 453928.14 | 1157280.46 | 15.47 | 15.35 | 20.62 | 20.47 | 1 |
| BC_018 | C3 | 460688.57 | 1158972.55 | 5.69 | 5.67 | 7.59 | 7.55 | 3 |
| BC_019 | C3 | 469145.11 | 1153888.38 | 0.63 | 0.63 | 0.84 | 0.83 | 3 |
| BC_020 | C3 | 477585.44 | 1148784.89 | 16.16 | 16.02 | 21.54 | 21.35 | 1 |
| BC_021 | C3 | 479247.80 | 1142022.94 | 13.11 | 13.09 | 17.48 | 17.46 | 1 |
| BC_022 | C3 | 484339.47 | 1150470.78 | 18.12 | 17.84 | 24.16 | 23.79 | 1 |
| BC_023 | C3 | 489431.84 | 1158888.64 | 11.42 | 11.35 | 15.22 | 15.14 | 1 |
| BC_024 | C3 | 491116.75 | 1152147.24 | 10.52 | 10.57 | 14.03 | 14.09 | 1 |
| BC_025 | C3 | 538408.67 | 1163835.29 | 11.74 | 11.69 | 15.65 | 15.59 | 1 |
| BC_026 | C3 | 524878.08 | 1160503.75 | 16.22 | 16.07 | 21.62 | 21.43 | 1 |
| BC_027 | C3 | 511391.09 | 1157166.93 | 10.94 | 11.16 | 14.58 | 14.88 | 1 |
| amcconsultants.com | 90 |
| Technical Report Summary of Prefeasibility Study of NORI Area D, Clarion Clipperton Zone | |
| TMC the metals company Inc. | 0225054 |
| Box
core number |
Campaign | Actual location | Weight (kg) | Abundance (wet kg/m2) | Nodule facies (Type) | |||
| Easting (E) | Northing (N) | Offshore (kg) | Onshore (kg) | Offshore | Onshore | |||
| BC_028 | C3 | 540079.38 | 1157106.54 | 14.39 | 14.25 | 19.18 | 19.00 | 1 |
| BC_029 | C3 | 526559.98 | 1153748.98 | 11.69 | 11.86 | 15.59 | 15.81 | 1 |
| BC_030 | C3 | 513057.43 | 1150386.46 | 11.39 | 11.60 | 15.19 | 15.46 | 1 |
| BC_031 | C3 | 533316.49 | 1155426.44 | 4.85 | 4.92 | 6.47 | 6.56 | 2 |
| BC_032 | C3 | 518134.54 | 1158832.84 | 10.23 | 10.11 | 13.64 | 13.48 | 1 |
| BC_033 | C3 | 519774.61 | 1152069.76 | 10.55 | 10.53 | 14.07 | 14.04 | 1 |
| BC_034 | C3 | 506284.21 | 1148723.41 | 13.55 | 13.71 | 18.06 | 18.28 | 2 |
| BC_035 | C3 | 504623.76 | 1155493.21 | 14.10 | 14.26 | 18.80 | 19.01 | 1 |
| BC_036 | C3 | 492779.55 | 1145366.06 | 14.40 | 14.50 | 19.20 | 19.33 | 1 |
| BC_037 | C3 | 514726.70 | 1143626.38 | 11.45 | 11.53 | 15.27 | 15.38 | 1 |
| BC_038 | C3 | 516391.93 | 1136877.00 | 12.98 | 13.02 | 17.30 | 17.36 | 1 |
| BC_039 | C3 | 509642.18 | 1135206.95 | 13.70 | 13.50 | 18.27 | 17.99 | 1 |
| BC_040 | C3 | 507980.37 | 1141953.14 | 22.44 | 22.16 | 29.92 | 29.55 | 1 |
| BC_041 | C3 | 474238.07 | 1162296.03 | 16.31 | 16.02 | 21.75 | 21.36 | 1 |
| BC_042 | C3 | 480998.40 | 1163967.76 | 11.61 | 11.52 | 15.48 | 15.35 | 1 |
| BC_043 | C3 | 487762.32 | 1165645.34 | 21.26 | 20.98 | 28.34 | 27.98 | 1 |
| BC_044 | C3 | 499538.57 | 1147044.90 | 14.72 | 14.90 | 19.62 | 19.86 | 1 |
| BC_045 | C3 | 497864.92 | 1153783.30 | 12.82 | 12.87 | 17.09 | 17.16 | 1 |
| amcconsultants.com | 91 |
| Technical Report Summary of Prefeasibility Study of NORI Area D, Clarion Clipperton Zone | |
| TMC the metals company Inc. | 0225054 |
| Figure 7.11 | Plan of Box Core locations and Abundance (in wet kg/m²) Campaign 3 |
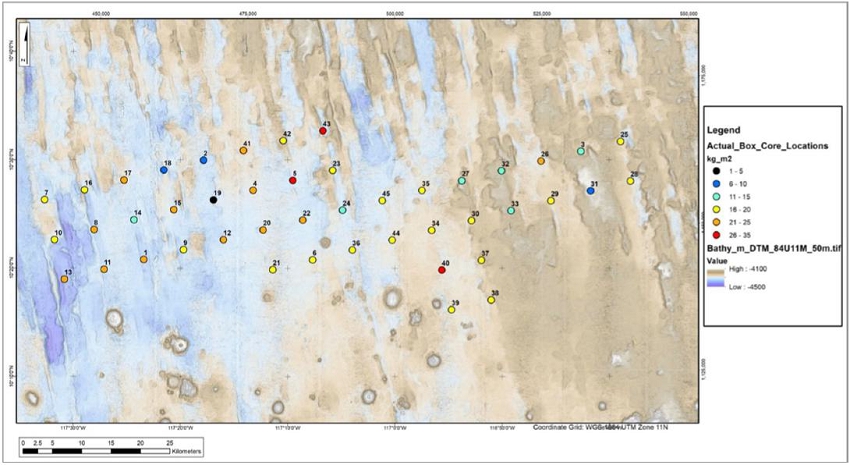
Source: MARGIN. Note: box cores labelled by box core number
| amcconsultants.com | 92 |
| Technical Report Summary of Prefeasibility Study of NORI Area D, Clarion Clipperton Zone | |
| TMC the metals company Inc. | 0225054 |
| 7.2.9.2 | Buried nodules |
On average, 91% of nodules by weight were located at 0–1 cm (exposed at seafloor). This is an important consideration as it implies that a representative nodule abundance can be estimated using seafloor camera imagery to map and characterize nodule surficial distribution at seafloor.
A few nodules pushed down deeper from upper layers by the sides of the box core, typified by accumulation along the sidewalls of the box corer were observed below 5 cm depth. BC_043 was an exception and returned a significant weight of nodules that may have been in situ, at all levels (see Figure 7.12). The buried nodules were very friable.
| Figure 7.12 | Profile of Nodule Weight by Depth in BC_043 |
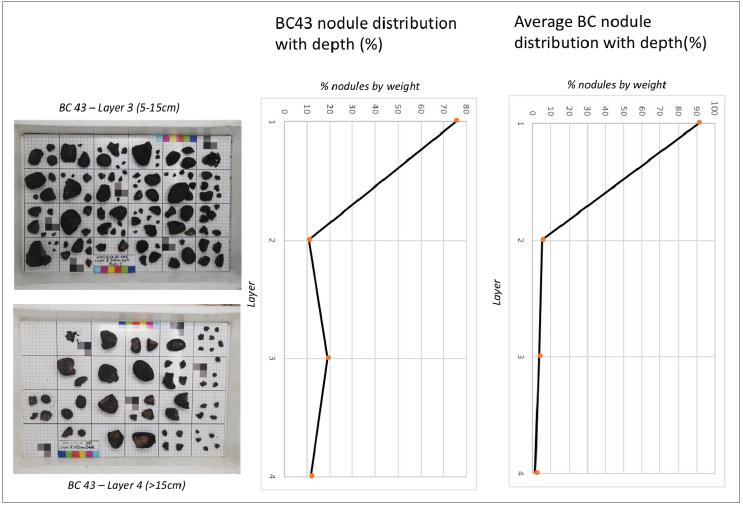
Source: MARGIN. Note: photo trays from layers 3 and 4 (left), nodule distribution with depth for BC43 (centre) compared to average nodule distribution with depth for all box cores (right).
| 7.2.9.3 | AUV data |
Reconnaissance AUV MBES traverses were conducted over the candidate test mining sites to provide confirmation of topographic and geological features observed in the 2012 vessel-based MBES dataset but at a higher level of detail and confidence. Traverses were followed up with low-altitude surveys using the AUV’s camera payload to provide visual confirmation of nodule distribution. The reconnaissance lines also enabled calibration and refinement of the NORI Area D regional geological interpretation. Based on these revised interpretations a geomorphological domain interpretation was developed and preliminary relationships between backscatter and nodule distribution facies observed in camera data were established.
| amcconsultants.com | 93 |
| Technical Report Summary of Prefeasibility Study of NORI Area D, Clarion Clipperton Zone | |
| TMC the metals company Inc. | 0225054 |
Figure 7.13 shows examples of AUV MBES data (colored ribbons) from reconnaissance traverses, overlain on EM120 vessel-based MBES data, shown as the grey-scale background image, shaded by slope intensity. The AUV data provides much finer-scale resolution (1 m) than vessel-based bathymetry (50 m) and shows good spatial correlation with macro-features. Further detail concerning slope-comparisons between the two datasets is provided in Section 7.13.2. The comparison of backscatter data (bottom image of Figure 7.13) shows AUV backscatter (1 m resolution), overlain on vessel-based backscatter data (30 m resolution). Differences in backscatter imagery between the two datasets shown are a result of differing seafloor responses due to the different frequencies used by the two systems. The AUV system acquired backscatter data at 400 kHz, and the vessel-based system at 12 kHz. Figure 7.14 illustrates the fine geological detail provided by the AUV MBES. This type of detailed data will be useful for designing the operating path of the nodule collectors.
| Figure 7.13 | Comparison of AUV MBES Data (Ribbon) against EM120 Vessel-based MBES |
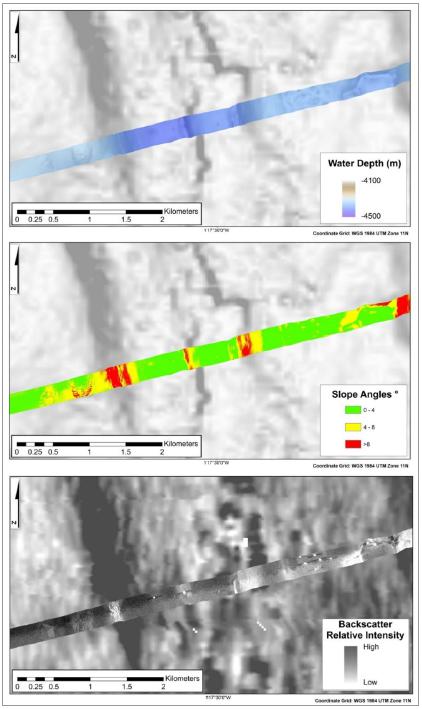
Source: MARGIN. Note: bathymetry (top), bathymetric slope (middle: hot colours indicate steeper slopes), backscatter (bottom).
AUV camera data was acquired at 6 m altitude for 89% of the reconnaissance traverses, providing visual continuity of nodule distribution between the majority of the physical box core sample sites. In addition, a 3.5 × 3.5 km grid of camera data was acquired over the test mining site. Camera data is near-continuous over the reconnaissance traverses. Photomosaic coverage along the 3.5 × 3.5 km spaced camera traverses over the selected test mining site are continuous. Each camera frame is 6 m across-track and 4 m along-track. Figure 7.14 provides an example.
| amcconsultants.com | 94 |
| Technical Report Summary of Prefeasibility Study of NORI Area D, Clarion Clipperton Zone | |
| TMC the metals company Inc. | 0225054 |
| Figure 7.14 | Example of AUV Camera Photo Mosaic and Insets, Showing Nodules |
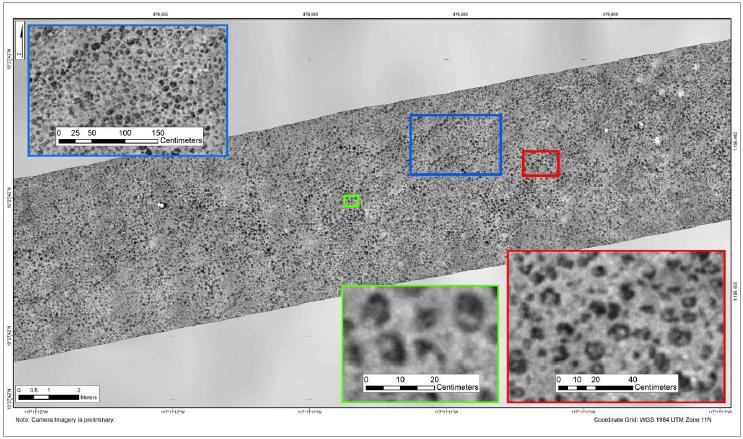
Source: MARGIN
| 7.2.10 | Nodule abundance estimation derived from AUV camera data |
Although box coring is an effective method for measuring nodule abundance, it is slow and expensive. Therefore, it is advantageous if box core estimates can be supplemented by an alternative method.
There is a well-documented relationship between nodule length and wet weight (Felix 1980). NORI confirmed this relationship by taking measurements of individual nodule length, using digital callipers, and wet weight, for nodules from box core samples BC_001, BC_002, BC_003, and BC_005 (Figure 7.15).
In areas where nodules are not closely packed, image processing techniques can be used to identify each nodule unambiguously and measure its dimensions. In this case, it is possible to estimate nodule abundance from photographs. However, when the images were processed in 2018, the image processing techniques were unable to reliably discriminate each individual nodule, if nodules were closely packed and touching each other. An alternative methodology for estimating nodule abundance from AUV images was developed using a combination of long-axis measurement and percentage nodule coverage which was applied to the data.
| amcconsultants.com | 95 |
| Technical Report Summary of Prefeasibility Study of NORI Area D, Clarion Clipperton Zone | |
| TMC the metals company Inc. | 0225054 |
| Figure 7.15 | Comparison of Nodule Long Axis Measurements, Taken Using Digital Callipers, and Individual Nodule Wet Weight for BC_001, BC_002, BC_003, and BC_005 |
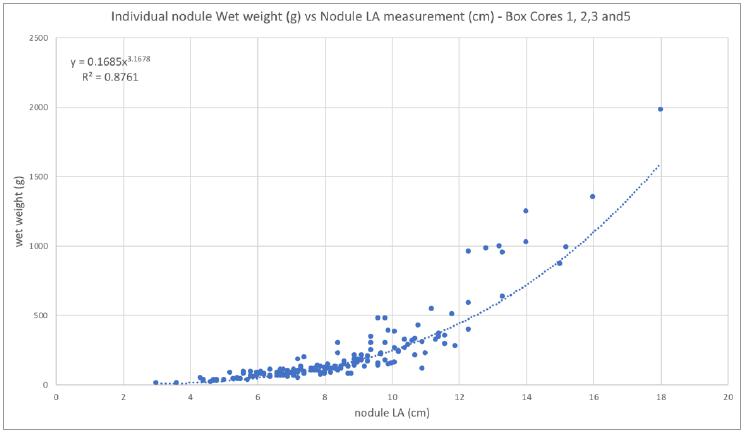
A multiple linear regression relationship between percentage nodule coverage estimated from the photographs and mean nodule long-axis measurement from six box core samples in the test mining site was found to provide a good correlation with nodule abundance. The relationship is of the form:
Y = –15.20 + (0.24 X1) + (5.19 X2)
where Y is the estimated nodule abundance, X1 is the percentage nodule cover, and X2 is the mean Long Axis measurement.
The percentage nodule coverage was determined by thresholding the image and calculating the percentage area covered by nodules in the image. Nodule long-axes were manually measured where possible, for each nodule in the image.
It was possible to obtain enough measurements to calculate representative mean long axis lengths which compared well with the mean long axis measurements from the actual box core samples (see Figure 7.17).
Because photographs were not taken at the exact box core sites (due to loss of the camera laser-calibration system mounted on the box corer), 1 × 1 m subsets of the closest calibrated AUV camera data were used for this analysis. The average offset between the camera data and the actual box core site locations was 26 m. The offsets will have introduced some imprecision to the analysis, and it is expected that, in future, collocated photographs and box core samples will produce a better correlation.
Figure 7.18 shows the estimated abundance vs. actual abundance for Felix method (top), and the multiple linear regression method (bottom) for six box cores in the test mining site. Although the correlation is high for the Felix method, the multiple linear regression method provided a better correlation and estimates that are closer to the actual nodule abundances. This is because the method is not dependent on measurement of each-and-every nodule in the image, which is not possible with some of the images typical of Type 1 nodule facies.
| amcconsultants.com | 96 |
| Technical Report Summary of Prefeasibility Study of NORI Area D, Clarion Clipperton Zone | |
| TMC the metals company Inc. | 0225054 |
| Figure 7.16 | Detail of image processing |
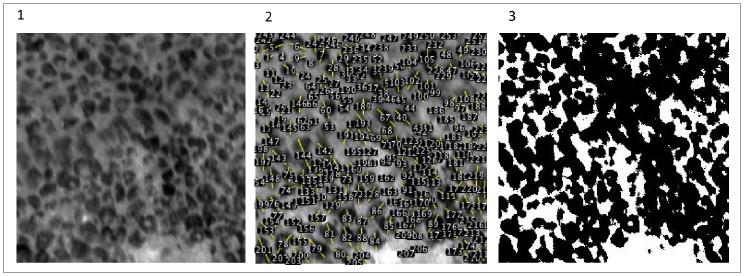
Note:
| 1. | Camera image. | |
| 2. | Manual measurement of nodule long axes on calibrated image. | |
| 3. | Image thresholding to determine percentage nodule coverage. |
| Figure 7.17 | Comparison of mean long axes lengths from AUV camera imagery and box cores |
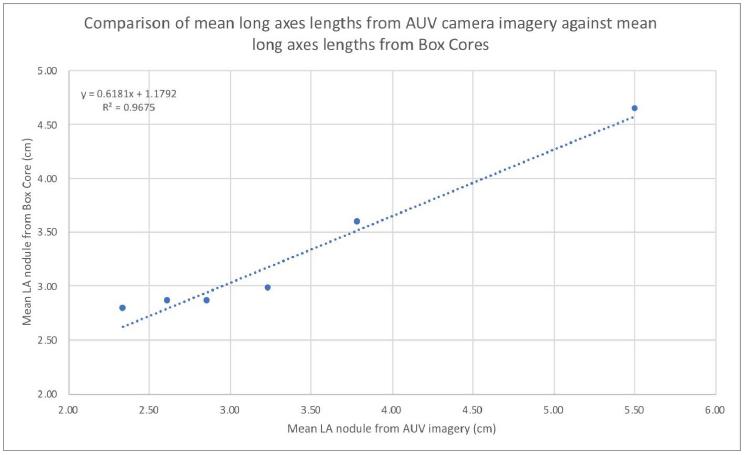
| amcconsultants.com | 97 |
| Technical Report Summary of Prefeasibility Study of NORI Area D, Clarion Clipperton Zone | |
| TMC the metals company Inc. | 0225054 |
| Figure 7.18 | Comparison of Felix method and multiple linear regression method |
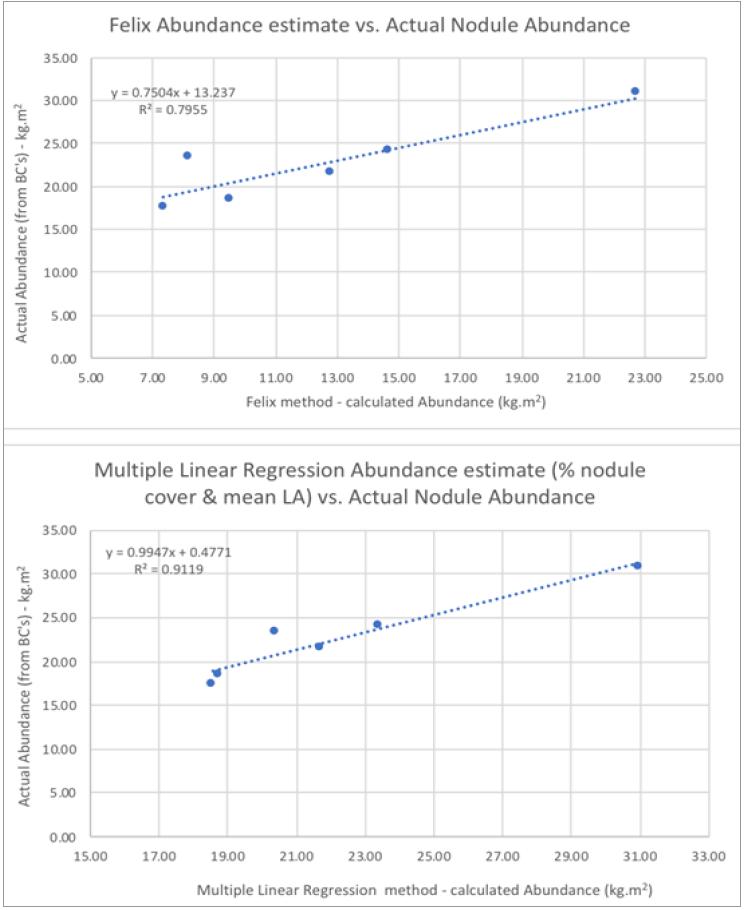
The multiple linear regression method was subsequently applied to a set of 29 box cores with satisfactory AUV images to derive a more representative relationship. Image locations were within an average offset of 15 m from actual box core site locations. Figure 7.19 shows the results. An acceptable correlation (with an R2 coefficient of 0.62) was obtained.
| amcconsultants.com | 98 |
| Technical Report Summary of Prefeasibility Study of NORI Area D, Clarion Clipperton Zone | |
| TMC the metals company Inc. | 0225054 |
| Figure 7.19 | Multiple linear regression model for nodule abundance |
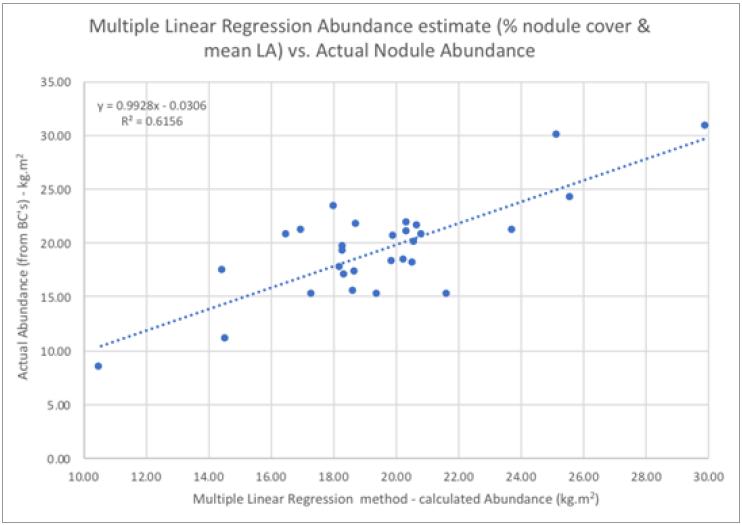
AUV camera transects were acquired on a 3.5 × 3.5 km grid pattern over the test mining site. Subsets (1 × 1 m) of AUV camera data were extracted for each intersection point of the survey lines and the percentage nodule coverage was extracted as per the methods outlined above. Mean nodule long axis measurements were manually extracted from these images. This was necessary, as the majority of these extraction points are situated in Type 1 nodule facies, which were therefore not suited to the automated nodule detection method. Nodule abundance estimates were then derived for each of these intersection points, resulting in a 3.5 × 3.5 km grid of nodule estimation points over the test mining site (see Figure 7.20). These estimates were used to supplement the Mineral Resource estimate.
| amcconsultants.com | 99 |
| Technical Report Summary of Prefeasibility Study of NORI Area D, Clarion Clipperton Zone | |
| TMC the metals company Inc. | 0225054 |
| Figure 7.20 | Plan of nodule abundance estimates in the test mining site |
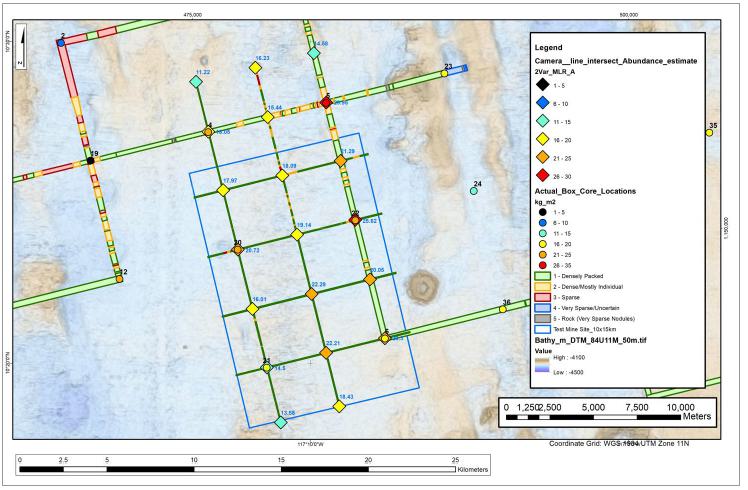
| 7.3 | NORI 2019 campaign |
Exploration in 2019 was divided into two campaigns (6A and 6B) due to the maximum duration of 45 days that OSV Maersk Launcher could remain out at sea. Campaign 6A was undertaken from 19/08/2019 to 03/10/2019 and Campaign 6B was undertaken from 10/11/2019 to 21/12/2019. The vessel was mobilized out of San Diego, California, USA. Sampling, logging, and assay methods were consistent with prior campaigns and contributed materially to the Resource model.
Leap Energy was subcontracted to provide geological support for the box coring operations. Bluefield Geoservices was subcontracted to provide the geotechnical logging and testing component of the program, and ERIAS was subcontracted to undertake environmental biological of the box cores.
| 7.3.1 | Box coring |
An 86.6 cm x 86.6 cm x 50 cm stainless steel box corer built by KC Denmark, and a Kongsberg Maritime HiPAP 501 ultra-short baseline (USBL) system were used for survey location during the sampling campaigns. The box corer was operated by an MSS marine crew and was fitted with a large Kongsberg USBL beacon for positioning (see Figure 7.21) and a sound velocity profiler (SVP) to monitor sound velocity variations in the water column. The positioning was monitored by two certified surveyors from the Leap Energy team. Fixes were taken during each box core landing and all sample coordinates were recorded in WGS84 UTM 11N.
| amcconsultants.com | 100 |
| Technical Report Summary of Prefeasibility Study of NORI Area D, Clarion Clipperton Zone | |
| TMC the metals company Inc. | 0225054 |
| Figure 7.21 | Box corer on deck showing the USBL beacon mounting position |
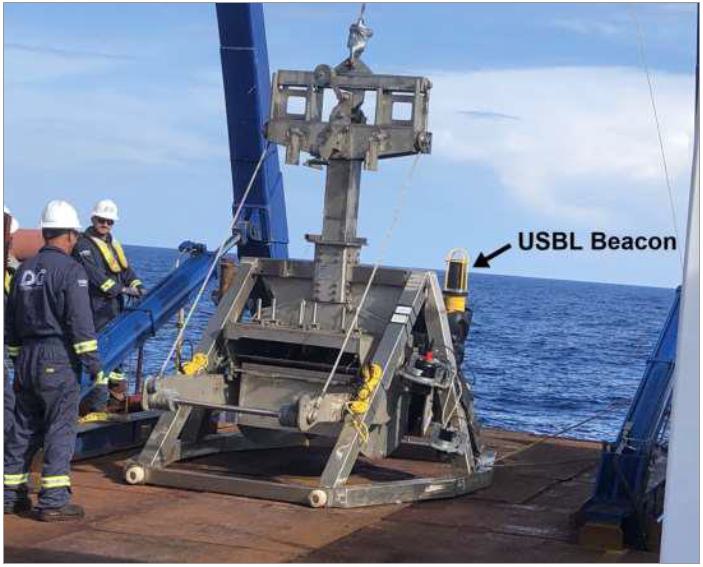
The procedures for sampling the nodules in Campaigns 6A and 6B were essentially the same as in 2018, with only minor changes in workflow to improve the efficiency of the process. The main changes were that the sampling intervals were simplified to 0–1 cm, 1–15 cm, and greater than 15 cm, and the samples were not coned and quartered on board the vessel. In Campaign 6A, the geotechnical sample tubes were inserted by Bluefield after the geotechnical tests in the box core, whereas in Campaign 6B, the sample tubes were inserted before the geotechnical tests. A flow chart of the sampling procedure is provided in Figure 7.22. Note for Campaign 6A, the processing flow was similar, with the absence of biological push-cores.
| 7.3.2 | Nodule sampling |
The dominant nodule shape, texture, degree of fragmentation, degree of botryoidal development together with the sample weight and nodule abundance were logged. The nodule facies classification system, description and measurement procedures developed during the 2018 campaign were used. For the clay footwall succession, the sediment lithology and color were recorded.
The dominant nodule facies in the NORI Area D contract area for the samples recovered during Campaigns 6A and B was Type 1 (82%).
Sample preparation procedures were the same as used in 2018, with the exception that they were coned and quartered at the on-shore laboratory, rather than on board the vessel.
| amcconsultants.com | 101 |
| Technical Report Summary of Prefeasibility Study of NORI Area D, Clarion Clipperton Zone | |
| TMC the metals company Inc. | 0225054 |
| Figure 7.22 | Box core processing flow sheet for campaign 6B |
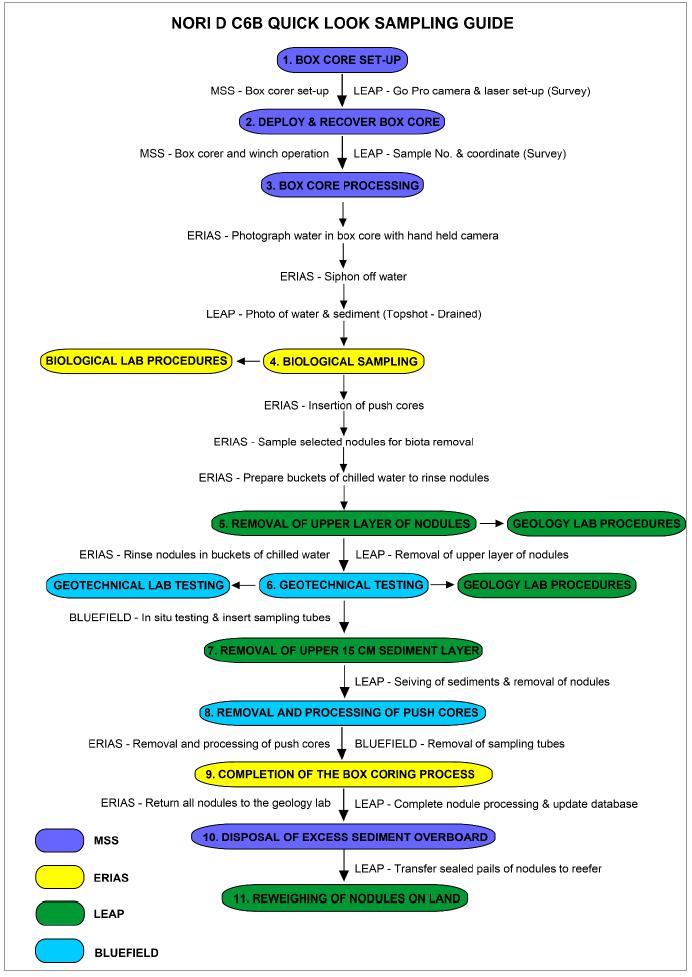
| amcconsultants.com | 102 |
| Technical Report Summary of Prefeasibility Study of NORI Area D, Clarion Clipperton Zone | |
| TMC the metals company Inc. | 0225054 |
| 7.3.3 | Biological sampling |
Biological sampling involved the collection of specimens of mega, macro, meio, and microfauna from the samples of nodules and underlying sediments collected in the box cores. Specimens of biota were collected from a number of horizons in the box core sample, including sieving of the water layer overlying the sediments to collect motile specimens; physical removal of specimens of megafauna from sediment and attached to nodules and preserving them for later analysis; washing nodules to dislodge macro fauna; and using cores pushed into the sediment to collect meio and macrofauna from different sediment horizons. Sediment samples were also retained and preserved for environmental DNA (eDNA) analysis.
Biological material was collected and preserved from 100 box cores during Campaign 6A adding to the samples collected from 45 box cores during Campaign 3. All the samples and specimens collected during the campaigns were appropriately preserved and are stored for identification and analysis at a later date.
Marine mammal observations were made from the bridge of the vessel and logged in a database.
| 7.3.4 | Geotechnical sampling |
The geotechnical component of the NORI 2019 campaign, Campaigns 6A and 6B, was designed to investigate the soil properties and develop a more detailed understanding of the soil geology and engineering parameters and thereby support the design and development of the systems and equipment for resource recovery. The geotechnical data is also a key input into the ground model of NORI Area D.
The geotechnical sampling was conducted alongside the geology and environmental sampling and was split into two phases: in phase one (C6A) 121 box cores were attempted with 106 successfully recovering a full soil sample; in phase two (C6B) 107 box cores were attempted with 105 successfully recovering a full soil sample. Figure 7.23 shows the box core locations. The discrepancy between geotechnical BC and nodule BC numbers in Section 7.3.5is due to some BCs being rejected for nodules but assessed as okay for geotechnical testing and vice versa.
All 211 successful box cores and five of the failed box cores were subsampled for geotechnical sampling and testing. Following the removal of the nodules by the geology team, a Cone Penetration Test (CPT) and optionally a laboratory vane profile or plate load test were conducted in the box core. During Campaign 6A the geotechnical and biological subsample tubes were inserted after the testing in the box core, during Campaign 6B the geotechnical and biological subsample tubes were inserted prior to the testing in the box core. Four soil subsamples for geotechnical study were obtained from the undisturbed areas outside of the biological sampling area of each box core. These consisted of one 100 mm inside diameter (ID) split sample, and three 76.2 mm ID clear PVC tubes pushed into the box core sample. The focus of the geotechnical sampling was the footwall sediment sequence. Figure 7.24 and Figure 7.25 respectively show the testing in the box core and the insertion of the sub sample tubes into the box core sample situated on deck. The testing in the box core was conducted using a custom developed rig (BOXcone) derived from the proven ROVcone ROV CPT system designed to fit over the box core box and provide a stable platform to deploy the CPT, intact and residual laboratory vane test, and Plate Load Test.
The box core split liner sample was used to conduct basic offshore index and strength laboratory tests, comprised of soil descriptions with core photography, wet and dry density measurements. Undrained shear strength index tests (Torvane tests) were conducted on the geotechnical subsamples obtained from the box cores. Intact and residual laboratory vane tests were conducted in the box core.
| amcconsultants.com | 103 |
| Technical Report Summary of Prefeasibility Study of NORI Area D, Clarion Clipperton Zone | |
| TMC the metals company Inc. | 0225054 |
The three (3) box core subsamples taken in PVC tubes were capped and retained in temperature-controlled conditions, stored vertically for onshore laboratory testing. One set of the subsamples were transferred to Geolabs United Kingdom (UK) soils laboratory in Watford, UK. The following standard laboratory tests were performed onshore by Geolabs: water content, Atterberg limits, total wet (bulk) density, grainsize (sieve and hydrometer) analyses, organic content, carbonate content, specific gravity; and undisturbed/intact and remoulded laboratory vane. Additional onshore testing was conducted including: Oedometer Test (NGI, Oslo, Norway), Direct Simple Shear (NGI, Oslo, Norway), X-Ray Diffraction (Geolabs, UK) and Thixotropy Testing (Geolabs, UK).
Four (4) gravity cores were successfully recovered during campaign C6A and four gravity cores successfully recovered during campaign C6B. The sample recovery ranged from 1.45 m to 2.95 m below seafloor. These samples were logged for basic index testing and sample in liners retained for onshore storage.
A set of bulk sub samples were collected during campaign C6A. These consisted of 166 25 kg bulk bags taken from the residual box core sediment and were segregated into three zones (upper, middle and lower box core) within individual bags. These samples were stored and shipped ashore for further analysis by Allseas.
| amcconsultants.com | 104 |
| Technical Report Summary of Prefeasibility Study of NORI Area D, Clarion Clipperton Zone | |
| TMC the metals company Inc. | 0225054 |
| Figure 7.23 | Plan of box core and gravity core locations, 2019 Campaign 6 |
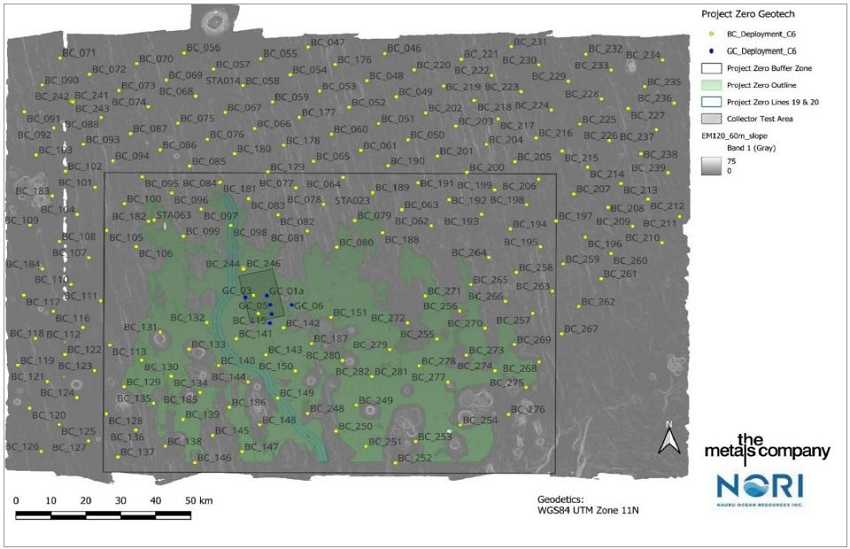
Source: APYS Subsea Ltd.
| amcconsultants.com | 105 |
| Technical Report Summary of Prefeasibility Study of NORI Area D, Clarion Clipperton Zone | |
| TMC the metals company Inc. | 0225054 |
| Figure 7.24 | Photographs of geotechnical vane and CPT (left) and plate load test (right) |
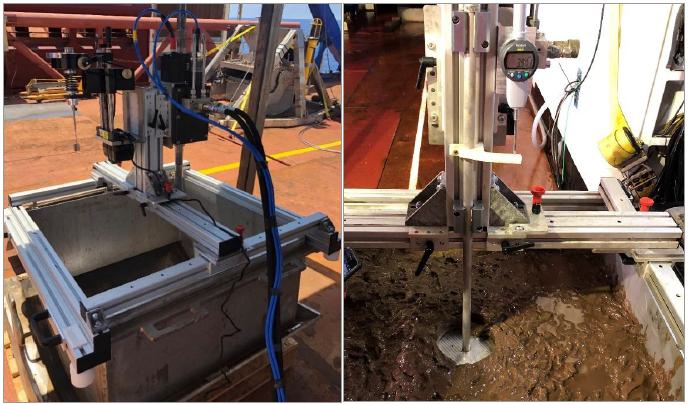
Source: Bluefield Geoservices Ltd.
| Figure 7.25 | Photographs of biological and geotechnical tube sampling (C6A left, C6B right) |
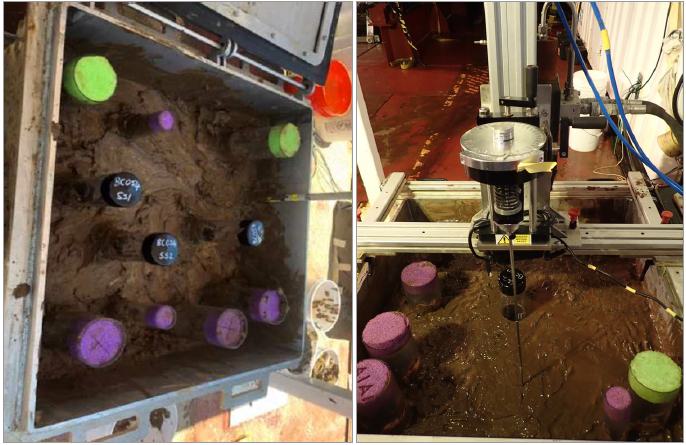
Notes: Sample tubes with green and purple inserts are designated for biologic assessment. Sample tubes with black caps are designated for geotechnical storage. Not shown is the split sample tube for onsite geotechnical assessment. Right hand photo shows a laboratory shear vane test in progress.
Source: Bluefield Geoservices Ltd.
| amcconsultants.com | 106 |
| Technical Report Summary of Prefeasibility Study of NORI Area D, Clarion Clipperton Zone | |
| TMC the metals company Inc. | 0225054 |
Full details of the operations, testing and results are contained in the Bluefield Geosciences reports MAE001-FAC-01, Geotechnical Factual Data Report NORI Area D Campaign 6A, Aug-Oct 2019 and MAE001-FAC-02, Geotechnical Factual Data Report NORI Area D Campaign 6B, Nov-Dec 2019. Additional field operation details are contained in the Bluefield Geosciences Field Reports.
Further consolidated analysis of the geotechnical investigation data is contained in Section 7.14.
| 7.3.5 | Exploration results |
A total of 106 box cores (BC_046 – BC_151) and four gravity cores were acquired in the NORI Area D contract area during Campaign 6A and 101 box cores (BC_176 – BC_280) and four gravity cores were acquired during Campaign 6B. Disturbed samples, considered to be unreliable, were omitted from the sample sequence. Table 7.4 lists box core sample coordinates and nodule weights and Figure 7.26 shows the abundance values in the box cores.
The majority of the nodules (92%) were found on the sediment surface (0 cm to 1 cm interval), with the remainder being predominantly encountered buried in the sediment at depths between 1 cm and 15 cm. Occasionally, nodules were found buried deeper in the box core (15 cm to 30 cm), but these were generally in advanced stages of breakdown and were very easily broken when any attempt was made to recover them. The nodules from the deeper sedimentary layers (15 cm to 30 cm) were noted but were not collected or processed along with the nodule samples destined for the assay laboratory.
The nodules collected during the sampling campaign ranged in size from 10 mm to 250 mm in diameter. The dominant nodule shape encountered was discoidal, whilst polynucleic shaped nodules were confined to the smaller Type 1 nodules.
The two sampling campaigns returned similar average nodule abundances, with Campaign 6A at 18.1 wet kg/m2 and Campaign 6B at 17.0 wet kg/m2. In general, nodule abundance is higher in the north and west of NORI Area D and diminishes towards the southeast.
| Table 7.4 | Box core sample coordinates and nodule weights – Campaign 6 |
| Box
core number |
Campaign | Actual location | Weight (kg) | Abundance |
Nodule facies | |||
| Easting (E) |
Northing (N) |
Off-shore (kg) |
Onshore (kg) |
Off- shore |
Onshore | |||
| BC_046 | 6A | 516607.65 | 1222981.94 | 16.02556 | 16.0642 | 21.37 | 21.42 | 1 |
| BC_047 | 6A | 494699.86 | 1224747.78 | 13.78932 | 13.891 | 18.39 | 18.52 | 1 |
| BC_048 | 6A | 511534.73 | 1214549.64 | 23.9472 | 24.0276 | 31.93 | 32.04 | 2 |
| BC_049 | 6A | 519947.78 | 1209474.13 | 16.62136 | 16.604 | 22.16 | 22.14 | 1 |
| BC_050 | 6A | 523284.31 | 1195972.15 | 11.88762 | 11.842 | 15.85 | 15.79 | 1 |
| BC_051 | 6A | 514872.31 | 1201070.85 | 17.10605 | 17.0536 | 22.81 | 22.74 | 2 |
| BC_052 | 6A | 506434.69 | 1206129.37 | 15.71338 | 15.6634 | 20.95 | 20.88 | 2 |
| BC_053 | 6A | 498012.48 | 1211234.86 | 12.26207 | 12.2216 | 16.35 | 16.30 | 1 |
| BC_054 | 6A | 489587.78 | 1216348.58 | 14.2689 | 14.2255 | 19.03 | 18.97 | 1 |
| BC_055 | 6A | 481141.59 | 1221418.01 | 22.27297 | 22.3188 | 29.70 | 29.76 | 3 |
| BC_056 | 6A | 459186.71 | 1223177.39 | 14.00777 | 13.945 | 18.68 | 18.59 | 1 |
| BC_057 | 6A | 467625.44 | 1218090.78 | 13.5955 | 13.5602 | 18.13 | 18.08 | 1 |
| BC_058 | 6A | 476068.70 | 1212995.08 | 11.80235 | 11.7452 | 15.74 | 15.66 | 1 |
| BC_059 | 6A | 484494.43 | 1207897.25 | 16.25776 | 16.2132 | 21.69 | 21.62 | 1 |
| BC_060 | 6A | 501354.11 | 1197701.54 | 14.59081 | 14.522 | 19.45 | 19.36 | 1 |
| amcconsultants.com | 107 |
| Technical Report Summary of Prefeasibility Study of NORI Area D, Clarion Clipperton Zone | |
| TMC the metals company Inc. | 0225054 |
| Box
core number |
Campaign | Actual location | Weight (kg) | Abundance |
Nodule facies | |||
| Easting (E) |
Northing (N) |
Off-shore (kg) |
Onshore
(kg) |
Off- shore |
Onshore | |||
| BC_061 | 6A | 509744.18 | 1192623.25 | 14.17769 | 13.7906 | 18.90 | 18.39 | 3 |
| BC_062 | 6A | 529959.77 | 1168937.39 | 11.92477 | 11.9114 | 15.90 | 15.88 | 1 |
| BC_063 | 6A | 521539.08 | 1174008.22 | 11.18427 | 11.1644 | 14.91 | 14.89 | 1 |
| BC_064 | 6A | 504687.57 | 1184187.24 | 11.99619 | 11.9978 | 15.99 | 16.00 | 2 |
| BC_065 | 6A | 496247.62 | 1189262.13 | 12.86045 | 12.8506 | 17.15 | 17.13 | 1 |
| BC_066 | 6A | 479387.41 | 1199464.57 | 16.49572 | 16.4812 | 22.00 | 21.97 | 1 |
| BC_067 | 6A | 470959.14 | 1204558.24 | 18.9512 | 18.947 | 25.27 | 25.26 | 2 |
| BC_068 | 6A | 462522.78 | 1209648.28 | 13.16105 | 13.1526 | 17.55 | 17.54 | 1 |
| BC_069 | 6A | 454099.31 | 1214738.71 | 17.5744 | 17.5698 | 23.43 | 23.43 | 2 |
| BC_070 | 6A | 445655.22 | 1219855.64 | 10.34846 | 10.3302 | 13.80 | 13.77 | 1 |
| BC_071 | 6A | 423700.42 | 1221601.55 | 11.30465 | 11.283 | 15.07 | 15.04 | 1 |
| BC_072 | 6A | 432117.69 | 1216503.17 | 13.69547 | 13.674 | 18.26 | 18.23 | 1 |
| BC_073 | 6A | 440560.65 | 1211410.19 | 12.90316 | 12.9 | 17.20 | 17.20 | 1 |
| BC_074 | 6A | 448984.92 | 1206313.30 | 17.04071 | 17.0428 | 22.72 | 22.72 | 1 |
| BC_075 | 6A | 457429.71 | 1201201.58 | 17.31903 | 17.3008 | 23.09 | 23.07 | 2 |
| BC_076 | 6A | 465872.41 | 1196137.90 | 10.49147 | 10.424 | 13.99 | 13.90 | 3 |
| BC_077 | 6A | 491182.38 | 1180846.76 | 14.74507 | 14.7456 | 19.66 | 19.65 | 1 |
| BC_078 | 6A | 499123.23 | 1175721.79 | 14.2055 | 14.1934 | 18.94 | 18.92 | 1 |
| BC_079 | 6A | 508024.00 | 1170680.10 | 10.85474 | 10.8406 | 14.47 | 14.45 | 1 |
| BC_080 | 6A | 502935.60 | 1162237.17 | 11.54862 | 11.6512 | 15.53 | 15.53 | 1 |
| BC_081 | 6A | 494488.51 | 1167334.36 | 14.57712 | 14.5718 | 19.44 | 19.43 | 1 |
| BC_082 | 6A | 486070.94 | 1172431.49 | 14.53504 | 14.5266 | 19.38 | 19.37 | 1 |
| BC_083 | 6A | 477643.41 | 1177492.78 | 11.09514 | 11.0816 | 14.79 | 14.78 | 1 |
| BC_084 | 6A | 469212.18 | 1182594.20 | 0.22081 | 0.2152 | 0.29 | 0.29 | 3 |
| BC_085 | 6A | 460772.24 | 1187696.49 | 12.0924 | 12.0718 | 16.12 | 16.10 | 1 |
| BC_086 | 6A | 452336.33 | 1192782.56 | 16.59518 | 16.5884 | 22.13 | 22.12 | 1 |
| BC_087 | 6A | 443900.13 | 1197890.45 | 16.30036 | 16.295 | 21.73 | 21.73 | 1 |
| BC_088 | 6A | 435462.90 | 1202979.23 | 14.60069 | 14.4481 | 19.47 | 19.26 | 2 |
| BC_089 | 6A | 427028.99 | 1208062.11 | 22.52526 | 22.3786 | 30.17 | 29.84 | 2 |
| BC_090 | 6A | 418571.39 | 1213165.55 | 16.29064 | 16.2818 | 21.72 | 21.71 | 1 |
| BC_091 | 6A | 413487.58 | 1204727.92 | 12.08875 | 12.0572 | 16.12 | 16.08 | 1 |
| BC_092 | 6A | 421917.19 | 1199644.93 | 11.26413 | 11.237 | 15.02 | 14.98 | 1 |
| BC_093 | 6A | 430365.98 | 1194549.71 | 22.07454 | 22.0586 | 29.43 | 29.41 | 2 |
| BC_094 | 6A | 438798.78 | 1189430.79 | 12.82568 | 12.7992 | 17.10 | 17.07 | 1 |
| BC_095 | 6A | 447230.62 | 1184361.20 | 13.48456 | 13.473 | 17.98 | 17.95 | 1 |
| BC_096 | 6A | 455676.00 | 1179261.70 | 14.37345 | 14.3573 | 19.16 | 19.14 | 1 |
| BC_097 | 6A | 464120.48 | 1174172.38 | 14.42651 | 14.4194 | 19.24 | 19.23 | 1 |
| BC_098 | 6A | 472559.36 | 1169073.14 | 21.51717 | 21.3622 | 28.69 | 28.48 | 3 |
| BC_099 | 6A | 459028.38 | 1165736.53 | 12.43137 | 12.3634 | 16.58 | 16.48 | 3 |
| BC_100 | 6A | 442142.17 | 1175923.18 | 16.18182 | 16.168 | 21.58 | 21.56 | 1 |
| BC_101 | 6A | 433707.25 | 1181010.15 | 12.45181 | 12.4348 | 16.60 | 16.58 | 1 |
| BC_102 | 6A | 425252.79 | 1186103.71 | 12.98788 | 12.9608 | 17.32 | 17.28 | 1 |
| BC_103 | 6A | 416833.40 | 1191215.07 | 11.2295 | 11.203 | 14.97 | 14.94 | 1 |
| amcconsultants.com | 108 |
| Technical Report Summary of Prefeasibility Study of NORI Area D, Clarion Clipperton Zone | |
| TMC the metals company Inc. | 0225054 |
| Box
core number |
Campaign | Actual location | Weight (kg) | Abundance |
Nodule facies | |||
| Easting (E) |
Northing (N) |
Off-shore (kg) |
Onshore
(kg) |
Off- shore |
Onshore | |||
| BC_104 | 6A | 428607.47 | 1172556.05 | 12.33715 | 12.3134 | 16.45 | 16.42 | 1 |
| BC_105 | 6A | 437046.52 | 1167487.01 | 14.53293 | 14.614 | 19.51 | 19.49 | 1 |
| BC_105 | 6A | 445500.53 | 1162398.24 | 8.57768 | 8.5522 | 11.44 | 11.40 | 1 |
| BC_107 | 6A | 431972.50 | 1159031.23 | 11.92445 | 11.9074 | 15.90 | 15.88 | 1 |
| BC_108 | 6A | 423515.81 | 1164114.75 | 12.42569 | 12.3972 | 16.57 | 16.53 | 1 |
| BC_109 | 6A | 415075.99 | 1169212.06 | 13.13595 | 13.1134 | 17.51 | 17.48 | 1 |
| BC_110 | 6A | 426873.12 | 1150607.91 | 12.73691 | 12.7186 | 16.98 | 16.95 | 1 |
| BC_111 | 6A | 435327.90 | 1145511.28 | 12.14001 | 12.1106 | 16.19 | 16.15 | 1 |
| BC_112 | 6A | 430226.54 | 1137045.40 | 12.63216 | 12.5962 | 16.84 | 16.79 | 1 |
| BC_113 | 6A | 437965.37 | 1131586.20 | 12.29276 | 12.2552 | 16.39 | 16.34 | 1 |
| BC_114 | 6A | 479116.50 | 1147163.22 | 15.95706 | 15.9884 | 21.28 | 21.32 | 1 |
| BC_115 | 6A | 480444.37 | 1141434.45 | 11.41333 | 11.4294 | 15.22 | 15.24 | 1 |
| BC_116 | 6A | 421777.08 | 1142152.38 | 12.06031 | 12.0862 | 16.08 | 16.11 | 1 |
| BC_117 | 6A | 413318.88 | 1147228.51 | 16.52079 | 16.5528 | 22.03 | 22.07 | 1 |
| BC_118 | 6A | 416702.07 | 1133703.33 | 13.72593 | 13.7608 | 18.30 | 18.35 | 1 |
| BC_119 | 6A | 411614.90 | 1125256.57 | 12.21826 | 12.222 | 16.29 | 16.30 | 1 |
| BC_120 | 6A | 414967.55 | 1111724.82 | 12.72899 | 12.7548 | 16.97 | 17.01 | 1 |
| BC_121 | 6A | 420050.48 | 1120169.32 | 15.10089 | 15.1248 | 20.13 | 20.17 | 1 |
| BC_122 | 6A | 425138.06 | 1128617.52 | 19.61851 | 19.6562 | 26.16 | 26.21 | 2 |
| BC_123 | 6A | 433585.66 | 1123545.46 | 13.17885 | 13.203 | 17.57 | 17.60 | 1 |
| BC_124 | 6A | 428507.42 | 1115095.64 | 11.919 | 11.9486 | 15.89 | 15.93 | 1 |
| BC_125 | 6A | 423436.54 | 1106629.06 | 13.3223 | 13.336 | 17.76 | 17.78 | 1 |
| BC_126 | 6A | 418331.13 | 1098177.44 | 13.47486 | 13.59 | 17.97 | 18.12 | 3 |
| BC_127 | 6A | 431877.82 | 1101547.08 | 15.19952 | 15.1348 | 20.27 | 20.18 | 3 |
| BC_128 | 6A | 436945.09 | 1109998.57 | 6.91858 | 6.91 | 9.22 | 9.21 | 3 |
| BC_129 | 6A | 442029.06 | 1118448.01 | 8.43266 | 8.445 | 11.24 | 11.26 | 1 |
| BC_130 | 6A | 447096.97 | 1126874.92 | 14.87212 | 14.8974 | 19.83 | 19.86 | 1 |
| BC_131 | 6A | 452375.98 | 1135655.66 | 10.19886 | 10.2194 | 13.60 | 13.63 | 1 |
| BC_132 | 6A | 465726.38 | 1138672.94 | 13.98023 | 14.0094 | 18.64 | 18.68 | 1 |
| BC_133 | 6A | 460643.69 | 1130253.24 | 12.70846 | 12.7284 | 16.94 | 16.97 | 1 |
| BC_134 | 6A | 455543.23 | 1121815.98 | 12.89784 | 12.9402 | 17.20 | 17.25 | 1 |
| BC_135 | 6A | 450465.49 | 1113352.74 | 14.05746 | 14.0842 | 18.74 | 18.78 | 2 |
| BC_136 | 6A | 445381.03 | 1104906.32 | 13.45611 | 13.4854 | 17.94 | 17.98 | 1 |
| BC_137 | 6A | 440298.77 | 1096461.35 | 14.18014 | 14.208 | 18.91 | 18.94 | 1 |
| BC_138 | 6A | 453831.90 | 1099841.45 | 10.87809 | 10.8968 | 14.50 | 14.53 | 1 |
| BC_139 | 6A | 458910.51 | 1108271.81 | 14.7575 | 14.7822 | 19.68 | 19.71 | 1 |
| BC_140 | 6A | 469079.49 | 1125145.80 | 9.44779 | 9.4656 | 12.60 | 12.62 | 1 |
| BC_141 | 6A | 474166.09 | 1133580.71 | 21.84486 | 21.8806 | 29.13 | 29.17 | 1 |
| BC_142 | 6A | 487678.37 | 1136931.37 | 14.11873 | 14.1478 | 18.83 | 18.86 | 1 |
| BC_143 | 6A | 482613.51 | 1128514.00 | 13.49911 | 13.5304 | 18.00 | 18.04 | 1 |
| BC_144 | 6A | 477520.76 | 1120066.87 | 9.59831 | 9.6198 | 12.80 | 12.83 | 1 |
| BC_145 | 6A | 467366.44 | 1103210.54 | 12.54903 | 12.585 | 16.73 | 16.78 | 1 |
| BC_146 | 6A | 462269.37 | 1094753.25 | 5.83656 | 5.8444 | 7.78 | 7.79 | 3 |
| amcconsultants.com | 109 |
| Technical Report Summary of Prefeasibility Study of NORI Area D, Clarion Clipperton Zone | |
| TMC the metals company Inc. | 0225054 |
| Box
core number |
Campaign | Actual location | Weight (kg) | Abundance |
Nodule facies | |||
| Easting (E) |
Northing (N) |
Off-shore (kg) |
Onshore
(kg) |
Off- shore |
Onshore | |||
| BC_147 | 6A | 475793.37 | 1098104.81 | 10.64722 | 10.6652 | 14.20 | 14.22 | 1 |
| BC_148 | 6A | 480870.43 | 1106563.83 | 9.56179 | 9.5776 | 12.75 | 12.77 | 1 |
| BC_149 | 6A | 485963.55 | 1114979.73 | 10.78484 | 10.8058 | 14.38 | 14.41 | 1 |
| BC_150 | 6A | 491042.63 | 1123414.84 | 13.29108 | 13.317 | 17.72 | 17.76 | 1 |
| BC_151 | 6A | 501214.83 | 1140282.91 | 10.38492 | 10.4166 | 13.85 | 13.89 | 1 |
| BC_176 | 6B | 502418.14 | 1219582.70 | 11.54004 | 13.72970 | 15.39 | 18.31 | 1 |
| BC_177 | 6B | 492165.51 | 1203027.33 | 14.60021 | 14.65020 | 19.47 | 19.53 | 1 |
| BC_178 | 6B | 487723.34 | 1194277.13 | 16.00780 | 16.15610 | 21.34 | 21.54 | 2 |
| BC_179 | 6B | 483224.08 | 1185931.07 | 11.14656 | 11.09160 | 14.86 | 14.79 | 1 |
| BC_181 | 6B | 469612.58 | 1182708.01 | 0.19222 | 0.19140 | 0.26 | 0.26 | 3 |
| BC_182 | 6B | 449011.77 | 1170456.99 | 13.27437 | 13.29930 | 17.70 | 17.73 | 1 |
| BC_183 | 6B | 421474.25 | 1178380.02 | 10.93965 | 11.01570 | 14.59 | 14.69 | 1 |
| BC_184 | 6B | 418645.62 | 1155452.39 | 8.82356 | 8.83100 | 11.76 | 11.77 | 1 |
| BC_185 | 6B | 463750.70 | 1116692.88 | 10.38200 | 10.39870 | 13.84 | 13.86 | 1 |
| BC_186 | 6B | 472185.88 | 1112042.30 | 6.83673 | 6.85280 | 9.12 | 9.14 | 1 |
| BC_187 | 6B | 495681.84 | 1132079.90 | 14.03420 | 13.99820 | 18.71 | 18.66 | 1 |
| BC_188 | 6B | 516031.76 | 1166786.72 | 9.80714 | 9.77200 | 13.08 | 13.03 | 1 |
| BC_189 | 6B | 513218.81 | 1179435.87 | 11.50072 | 11.49160 | 15.33 | 15.32 | 1 |
| BC_190 | 6B | 517597.21 | 1187822.19 | 12.37787 | 12.38550 | 16.50 | 16.51 | 1 |
| BC_191 | 6B | 526154.72 | 1182536.17 | 10.58192 | 10.57820 | 14.11 | 14.10 | 1 |
| BC_192 | 6B | 535083.05 | 1177206.95 | 14.50646 | 14.50970 | 19.34 | 19.35 | 1 |
| BC_193 | 6B | 544069.68 | 1172577.00 | 14.92652 | 14.95270 | 19.90 | 19.94 | 1 |
| BC_194 | 6B | 552336.85 | 1167991.04 | 13.35410 | 13.27920 | 17.81 | 17.71 | 1 |
| BC_195 | 6B | 560928.71 | 1162375.98 | 11.43600 | 11.45130 | 15.25 | 15.27 | 1 |
| BC_196 | 6B | 573820.21 | 1165454.13 | 11.99416 | 12.00280 | 15.99 | 16.00 | 1 |
| BC_197 | 6B | 565398.99 | 1170534.36 | 11.69162 | 11.69590 | 15.59 | 15.59 | 1 |
| BC_198 | 6B | 556962.56 | 1175622.59 | 9.29602 | 9.31230 | 12.39 | 12.42 | 1 |
| BC_199 | 6B | 547798.50 | 1180216.72 | 8.82048 | 8.74950 | 11.76 | 11.67 | 1 |
| BC_200 | 6B | 540137.69 | 1185771.66 | 9.65192 | 9.66100 | 12.87 | 12.88 | 1 |
| BC_201 | 6B | 531718.84 | 1190879.71 | 15.60665 | 15.62500 | 20.81 | 20.83 | 1 |
| BC_202 | 6B | 528382.18 | 1204379.93 | 17.56128 | 17.59670 | 23.42 | 23.46 | 1 |
| BC_203 | 6B | 536982.07 | 1200221.05 | 12.10241 | 12.08520 | 16.14 | 16.11 | 1 |
| BC_204 | 6B | 545479.10 | 1194520.87 | 14.06640 | 14.09410 | 18.76 | 18.79 | 1 |
| BC_205 | 6B | 553642.77 | 1189125.33 | 14.47215 | 14.48590 | 19.30 | 19.31 | 1 |
| BC_206 | 6B | 560423.45 | 1183620.69 | 15.88279 | 15.89460 | 21.18 | 21.19 | 1 |
| BC_207 | 6B | 570491.07 | 1178957.69 | 20.45660 | 20.46870 | 27.28 | 27.29 | 1 |
| BC_208 | 6B | 580315.46 | 1174714.26 | 15.68094 | 15.70670 | 20.91 | 20.94 | 1 |
| BC_209 | 6B | 587324.63 | 1168794.39 | 13.52294 | 13.55710 | 18.03 | 18.08 | 1 |
| BC_210 | 6B | 595751.30 | 1163719.65 | 11.41743 | 11.43540 | 15.22 | 15.25 | 1 |
| BC_211 | 6B | 600796.45 | 1171870.83 | 2.10299 | 2.10700 | 2.80 | 2.81 | 3 |
| BC_212 | 6B | 591732.46 | 1177389.59 | 12.94277 | 12.96020 | 17.26 | 17.28 | 1 |
| BC_213 | 6B | 583989.66 | 1182277.47 | 18.71487 | 18.93940 | 24.95 | 25.25 | 1 |
| BC_214 | 6B | 574436.49 | 1187355.09 | 12.59742 | 12.62280 | 16.80 | 16.83 | 1 |
| amcconsultants.com | 110 |
| Technical Report Summary of Prefeasibility Study of NORI Area D, Clarion Clipperton Zone | |
| TMC the metals company Inc. | 0225054 |
| Box
core number |
Campaign | Actual location | Weight (kg) | Abundance |
Nodule facies | |||
| Easting (E) |
Northing (N) |
Off-shore (kg) |
Onshore
(kg) |
Off- shore |
Onshore | |||
| BC_215 | 6B | 567154.67 | 1192456.64 | 12.88151 | 12.91070 | 17.18 | 17.21 | 1 |
| BC_216 | 6B | 559694.23 | 1196570.59 | 10.16900 | 10.18430 | 13.56 | 13.58 | 1 |
| BC_217 | 6B | 548810.93 | 1202550.23 | 13.27286 | 13.28510 | 17.70 | 17.71 | 1 |
| BC_218 | 6B | 542208.73 | 1208372.45 | 10.80441 | 10.81310 | 14.41 | 14.42 | 1 |
| BC_219 | 6B | 533463.71 | 1212793.71 | 19.10461 | 19.64000 | 25.47 | 26.19 | 1 |
| BC_220 | 6B | 525043.93 | 1217890.82 | 12.55892 | 12.56290 | 16.75 | 16.75 | 1 |
| BC_221 | 6B | 538555.15 | 1221240.58 | 13.65917 | 13.66380 | 18.21 | 18.22 | 1 |
| BC_222 | 6B | 546971.72 | 1216147.52 | 9.86255 | 9.85740 | 13.15 | 13.14 | 1 |
| BC_223 | 6B | 555398.86 | 1211052.66 | 20.69955 | 20.72350 | 27.60 | 27.63 | 2 |
| BC_224 | 6B | 564054.77 | 1205256.71 | 22.38086 | 22.34700 | 29.84 | 29.80 | 2 |
| BC_225 | 6B | 572221.70 | 1200875.38 | 17.19870 | 17.21670 | 22.93 | 22.96 | 1 |
| BC_226 | 6B | 580647.66 | 1195781.78 | 11.72413 | 11.73510 | 15.63 | 15.65 | 1 |
| BC_227 | 6B | 586058.88 | 1205747.69 | 2.33487 | 2.28760 | 3.11 | 3.05 | 3 |
| BC_228 | 6B | 578405.69 | 1208794.06 | 11.56571 | 11.57990 | 15.42 | 15.44 | 1 |
| BC_229 | 6B | 568914.77 | 1214387.60 | 0.06436 | 0.05870 | 0.09 | 0.08 | 3 |
| BC_230 | 6B | 560490.86 | 1219464.34 | 22.76269 | 22.83590 | 30.35 | 30.45 | 2 |
| BC_231 | 6B | 552569.22 | 1224867.76 | 15.83721 | 15.84900 | 21.12 | 21.13 | 1 |
| BC_232 | 6B | 573974.86 | 1222797.89 | 18.21135 | 18.25390 | 24.28 | 24.34 | 2 |
| BC_233 | 6B | 581162.85 | 1217819.97 | 15.54404 | 14.93740 | 20.73 | 19.92 | 1 |
| BC_234 | 6B | 595905.10 | 1221029.60 | 10.22326 | 10.22780 | 13.63 | 13.64 | 3 |
| BC_235 | 6B | 590812.89 | 1212611.81 | 0.07280 | 0.06800 | 0.10 | 0.09 | 3 |
| BC_236 | 6B | 599245.09 | 1207536.70 | 15.76633 | 15.77690 | 21.02 | 21.04 | 2 |
| BC_237 | 6B | 594141.85 | 1199119.57 | 15.14613 | 15.13090 | 20.19 | 20.17 | 1 |
| BC_238 | 6B | 589718.56 | 1191576.21 | 12.87776 | 12.88160 | 17.17 | 17.18 | 1 |
| BC_239 | 6B | 597473.20 | 1185632.05 | 16.33166 | 16.60740 | 21.78 | 22.14 | 1 |
| BC_240 | 6B | 427521.58 | 1208175.68 | 24.68888 | 24.74570 | 32.92 | 32.99 | 2 |
| BC_241 | 6B | 427181.38 | 1208336.73 | 23.96558 | 23.97810 | 31.95 | 31.97 | 2 |
| BC_242 | 6B | 427026.80 | 1208053.74 | 21.66339 | 21.68060 | 28.88 | 28.91 | 2 |
| BC_243 | 6B | 427372.60 | 1207869.27 | 19.79228 | 19.83340 | 26.39 | 26.44 | 2 |
| BC_244 | 6B | 475892.75 | 1155507.57 | 15.43054 | 15.45830 | 20.57 | 20.61 | 1 |
| BC_245 | 6B | 476075.26 | 1155822.88 | 14.91209 | 14.93730 | 19.88 | 19.92 | 1 |
| BC_246 | 6B | 476383.82 | 1155639.43 | 16.44459 | 16.47350 | 21.93 | 21.96 | 1 |
| BC_247 | 6B | 476221.61 | 1155336.85 | 20.57729 | 21.44420 | 27.44 | 28.59 | 1 |
| BC_248 | 6B | 494570.63 | 1110107.21 | 10.87185 | 10.80680 | 14.50 | 14.41 | 1 |
| BC_249 | 6B | 508506.11 | 1112715.00 | 10.74484 | 10.77530 | 14.33 | 14.37 | 1 |
| BC_250 | 6B | 502703.96 | 1104576.73 | 11.25303 | 11.27970 | 15.00 | 15.04 | 1 |
| BC_251 | 6B | 511267.52 | 1099766.40 | 12.49379 | 12.51860 | 16.66 | 16.69 | 1 |
| BC_253 | 6B | 525492.22 | 1101354.00 | 10.66706 | 10.67910 | 14.22 | 14.24 | 1 |
| BC_254 | 6B | 538281.77 | 1106479.92 | 9.11155 | 9.13100 | 12.15 | 12.17 | 1 |
| BC_255 | 6B | 531570.91 | 1133475.91 | 9.22072 | 9.24050 | 12.29 | 12.32 | 1 |
| BC_256 | 6B | 538131.10 | 1142242.69 | 9.58975 | 9.61210 | 12.79 | 12.82 | 1 |
| BC_257 | 6B | 558767.44 | 1141508.87 | 10.28829 | 10.33230 | 13.72 | 13.78 | 1 |
| BC_259 | 6B | 567441.46 | 1157040.38 | 9.30402 | 9.32910 | 12.41 | 12.44 | 1 |
| amcconsultants.com | 111 |
| Technical Report Summary of Prefeasibility Study of NORI Area D, Clarion Clipperton Zone | |
| TMC the metals company Inc. | 0225054 |
| Box
core number |
Campaign | Actual location | Weight (kg) | Abundance |
Nodule facies | ||||
| Easting (E) |
Northing (N) |
Off-shore (kg) |
Onshore
(kg) |
Off- shore |
Onshore | ||||
| BC_260 | 6B | 581121.73 | 1160276.52 | 11.07592 | 11.09250 | 14.77 | 14.79 | 1 | |
| BC_261 | 6B | 578322.44 | 1152403.20 | 10.80130 | 10.82450 | 14.40 | 14.43 | 1 | |
| BC_262 | 6B | 571914.91 | 1143656.28 | 11.13739 | 11.16800 | 14.85 | 14.89 | 1 | |
| BC_263 | 6B | 564367.04 | 1148482.10 | 14.13325 | 14.10520 | 18.84 | 18.81 | 1 | |
| BC_264 | 6B | 546195.42 | 1159070.82 | 11.85999 | 12.31040 | 15.81 | 16.41 | 1 | |
| BC_265 | 6B | 541265.30 | 1150568.10 | 14.68998 | 14.71810 | 19.59 | 19.62 | 1 | |
| BC_266 | 6B | 550937.75 | 1145366.82 | 14.23761 | 14.27500 | 18.98 | 19.03 | 1 | |
| BC_267 | 6B | 567009.16 | 1135090.99 | 10.33807 | 10.36310 | 13.78 | 13.82 | 1 | |
| BC_268 | 6B | 560576.99 | 1126326.33 | 12.70976 | 12.73120 | 16.95 | 16.97 | 1 | |
| BC_269 | 6B | 553508.53 | 1131754.58 | 9.75852 | 9.84910 | 13.01 | 13.13 | 1 | |
| BC_271 | 6B | 528228.26 | 1146990.38 | 10.17807 | 10.19650 | 13.57 | 13.60 | 1 | |
| BC_272 | 6B | 523132.39 | 1138565.91 | 9.51211 | 9.75400 | 12.68 | 13.01 | 1 | |
| BC_273 | 6B | 540012.64 | 1128404.50 | 9.36063 | 9.38670 | 12.48 | 12.52 | 1 | |
| BC_274 | 6B | 547906.56 | 1123487.95 | 11.03703 | 11.07510 | 14.72 | 14.77 | 1 | |
| BC_275 | 6B | 556862.35 | 1118254.55 | 9.40559 | 9.44960 | 12.54 | 12.60 | 1 | |
| BC_276 | 6B | 551793.40 | 1109834.92 | 10.00252 | 10.03040 | 13.34 | 13.37 | 1 | |
| BC_277 | 6B | 534693.27 | 1119985.85 | 10.01188 | 10.04040 | 13.35 | 13.39 | 1 | |
| BC_278 | 6B | 526496.86 | 1125044.81 | 9.88382 | 9.90200 | 13.18 | 13.20 | 1 | |
| BC_279 | 6B | 518071.02 | 1130133.75 | 12.37066 | 12.40100 | 16.49 | 16.53 | 1 | |
| BC_280 | 6B | 504544.16 | 1126772.68 | 9.89743 | 9.91170 | 13.20 | 13.22 | 1 | |
| amcconsultants.com | 112 |
| Technical Report Summary of Prefeasibility Study of NORI Area D, Clarion Clipperton Zone | |
| TMC the metals company Inc. | 0225054 |
| Figure 7.26 | Plan of NORI Area D showing box core abundances and bathymetry |
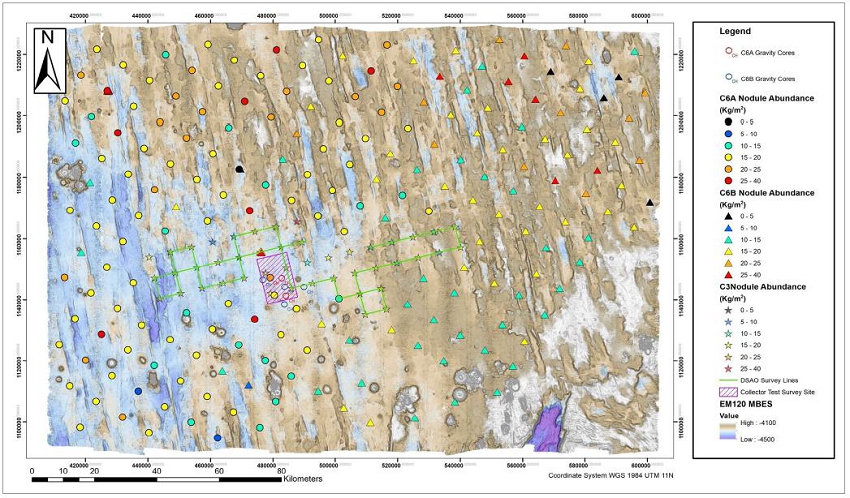
| amcconsultants.com | 113 |
| Technical Report Summary of Prefeasibility Study of NORI Area D, Clarion Clipperton Zone | |
| TMC the metals company Inc. | 0225054 |
| 7.3.6 | Analysis of grade distribution by size fraction |
As part of the Campaign 6A and 6B box core sampling
program, a preliminary examination of the relationship between nodule size and grade was carried out. Twenty-four (24) nodule box core
samples were separated, at ALS Laboratory in Brisbane, into four size fractions
(+50 mm, –50 mm + 25 mm, –25 mm +10 mm, and –10 mm) using sieves.
Plots of the relative difference in grade between the assays for individual size fractions and the weight-averaged grade of the whole sample are shown in Figure 7.27 to Figure 7.30. The masses of the size fractions, in relative percentage, are shown in Figure 7.31. In general, the proportion of material less than 10 mm (the -10 mm fraction) is very small.
Twenty-four samples are too few to make firm statistical conclusions, but the data is sufficient to show that distribution of nickel, cobalt, copper and manganese is not uniform across particles of different sizes. The particles may be whole nodules or abraded pieces of larger nodules. The samples show that selection of the particle size range that will be recovered by the seafloor collection system, and loss of fines by abrasion in the ore handling systems, may have small impacts on the grade of the ore recovered to the production vessel.
| Figure 7.27 | Relative difference of grade by size fraction - NiO (%) |
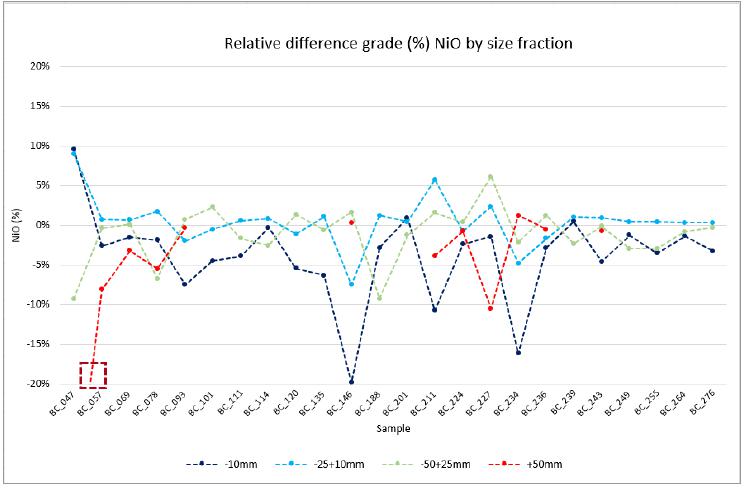
Note: Brown rectangle highlights anomalous grades in BC047
| amcconsultants.com | 114 |
| Technical Report Summary of Prefeasibility Study of NORI Area D, Clarion Clipperton Zone | |
| TMC the metals company Inc. | 0225054 |
| Figure 7.28 | Relative difference of grade by size fraction - CuO (%) |
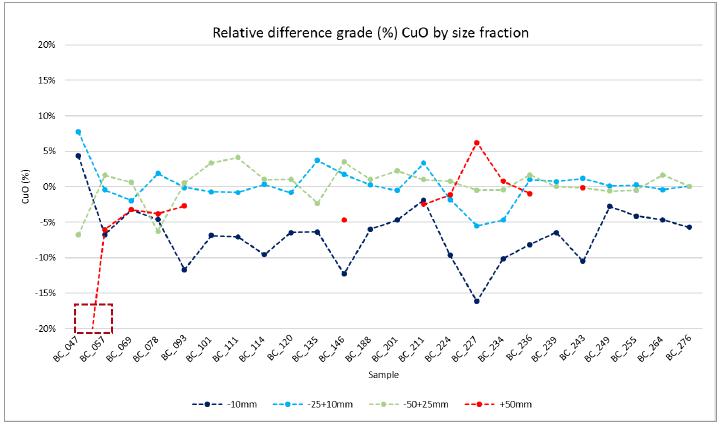
Note: Brown rectangle highlights anomalous grades in BC047
| Figure 7.29 | Relative difference of grade by size fraction - CoO (%) |
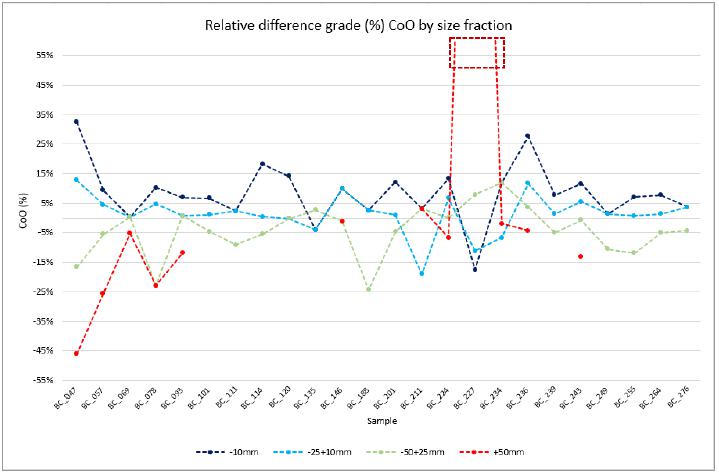
Note: Brown rectangle highlights anomalous grades in BC227
| amcconsultants.com | 115 |
| Technical Report Summary of Prefeasibility Study of NORI Area D, Clarion Clipperton Zone | |
| TMC the metals company Inc. | 0225054 |
| Figure 7.30 | Relative difference of grade by size fraction - MnO (%) |
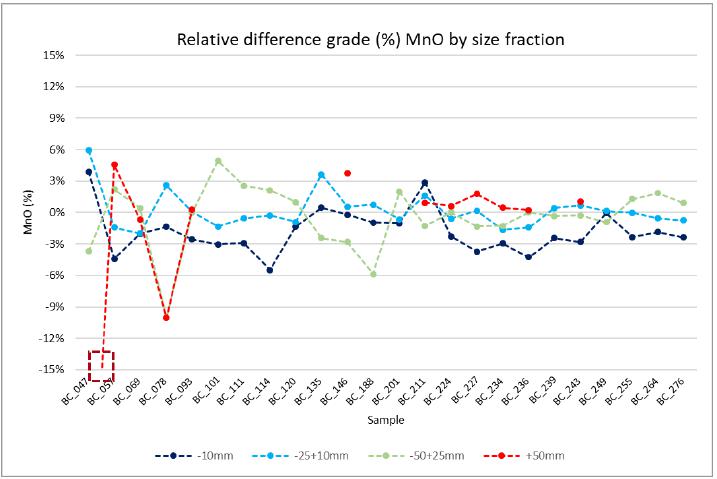
Note: Brown rectangle highlights anomalous grades in BC047
| Figure 7.31 | Proportions of size fractions by mass (relative percentage) |
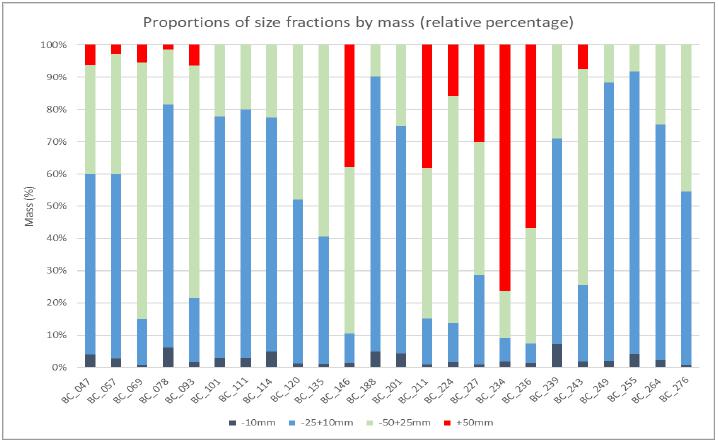
| amcconsultants.com | 116 |
| Technical Report Summary of Prefeasibility Study of NORI Area D, Clarion Clipperton Zone | |
| TMC the metals company Inc. | 0225054 |
| 7.4 | The 2022 test mining campaign |
TMC conducted an integrated test mining on the seafloor in October-November 2022 from the Hidden Gem. During the test, Allseas engineers drove the test collector across over 80 km of seafloor, collecting approximately 4,500 t of nodules and lifting over 3,000 t up a 4,300 m riser system to the surface production vessel, Hidden Gem. The Allseas-designed test nodule collection system achieved all test production milestones and reached a sustained production rate of 86.4 t per hour.
The Test Mining was conducted within a small test area in NORI Area D, selected after completion of detailed bathymetric and photographic surveys in 2018. The test area is very flat, abyssal plain, and is dominated by Type 1 nodules. Data from this campaign was critical to deriving the modifying factors used to support the classification of Mineral Reserves as Probable under S-K 1300 Item 1302(e).
| 7.5 | NORI 2022 Campaign 7A and 7B |
Prior to the test mining, off-shore Campaign 7A was conducted to collect data from the test area before disturbance by the test activities. In Campaign 7B, data was collected after the test mining had been completed. C7A was undertaken from 15/07/2022 to 23/09/2022 and C7B was undertaken from 09/11/2022 to 19/12/2022, from MV Island Pride, mobilised out of San Diego, California, USA.
In 2022 NORI completed an integrated collection system test, supported by the Hidden Gem collector vessel and observed by the survey vessel Island Pride. This work comprised five campaigns: 1) Campaign 7A1 and 7A2 (prior to the integrated collection system test), Campaign 7C (during the test), and Campaign 7B1 and 7B2 (after the test) using the Island Pride vessel that Ocean infinity supplied. NORI conducted these campaigns to:
| · | Campaign 7A1/2: collect bathymetric, geological, and environmental baseline data for the seafloor and water column. | |
| · | Campaign 7B1/2: largely repeat the surveys completed in Campaign 7A to assess what impact the test had on the bathymetric, geological, and environmental baseline for the seafloor and water column. | |
| · | Campaign 7C: monitor the test operations to obtain real-time data on the seafloor and midwater plumes that the integrated collection system generated and to monitor the noise that the system generated during operations. |
Campaigns 7A and 7B were primarily concerned with collecting environmental data. Box cores were collected and environmental sampling and geotechnical testing were carried out. Geological logging and the nodule sampling were completed for the box cores obtained from the area traversed by the collector during the test mining. THRE360 Energy (previously Leap Energy) was subcontracted to provide geological support for the box coring operations. Bluefield Geoservices was subcontracted to provide the geotechnical logging and testing component of the program.
In addition, high resolution AUV MBES bathymetric, side scan and sub-bottom profiler surveying from within the test mining area was completed. ROV- and AUV-supported high-resolution camera imagery within the test mining area and over control sites was also completed.
| 7.5.1 | Box coring |
A 75 cm x 75 cm x 50 cm stainless steel box corer (model BX-750, area of 0.526 m2) built by Ocean Innovations was used for box core sampling. The positioning of the final land-out coordinates of box cores deployments were carried out using a combination of USBL and LBL positioning solutions, whereby the initial deployment to the seabed was monitored by the Hi PAP USBL system and the LBL array was used for more precise positioning once the box core was within 50 m of the seafloor. The LBL array consisted of seven cNODE Maxi transponders deployed in a hexagonal configuration with one transponder located at the centre. The box corer was operated by an Ocean Infinity marine crew and was fitted with an LBL beacon for positioning and a sound velocity profiler (SVP) to monitor sound velocity variations in the water column. The positioning was monitored by two certified surveyors from Ocean Infinity. Fixes were taken during each box core landing and all sample coordinates were recorded in WGS84 UTM 11N.
| amcconsultants.com | 117 |
| Technical Report Summary of Prefeasibility Study of NORI Area D, Clarion Clipperton Zone | |
| TMC the metals company Inc. | 0225054 |
In Campaign 7A, 22 box cores (BC_425 – BC_447) were successfully acquired for resource definition purposes. BC_432 failed to trigger and no sample was collected. In Campaign 7B, 14 box cores (BC_473 – BC_486) were successfully acquired for the purpose of measuring the nodules left behind by the collector.
| 7.5.2 | Nodule sampling |
The nodule description and measurement procedures were the same as those used in Campaigns 6A and 6B. The dominant nodule shape, texture, degree of fragmentation, degree of botryoidal development together with the sample weight and nodule abundance were logged. For the clay footwall succession, the sediment lithology and color were recorded. The nodule facies in the area sampled during Campaigns 7A and 7B was Type 1. Figure 7.32 shows the layout of the nodule processing side of the geology laboratory.
The procedures for sampling the nodules in Campaigns 7A and 7B were the same as in 2019, with the addition of temperature and humidity sensors in the offshore laboratory and the measuring of the four corner nodules from each batch / tray with digital calipers.
| Figure 7.32 | Layout of the nodule processing side of the geology laboratory |
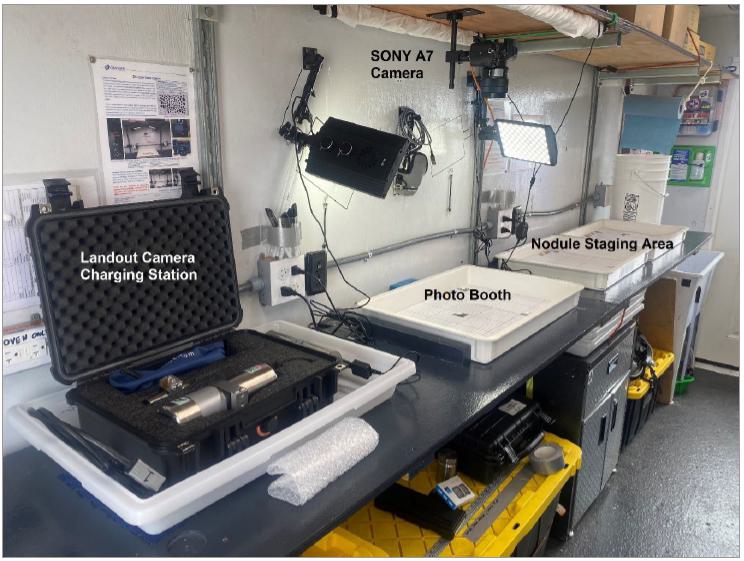
Source: TMC
| amcconsultants.com | 118 |
| Technical Report Summary of Prefeasibility Study of NORI Area D, Clarion Clipperton Zone | |
| TMC the metals company Inc. | 0225054 |
| 7.5.3 | Biological sampling |
The primary purpose of Campaigns 7A and 7B was environmental sampling and monitoring. Biological sampling of the box cores was carried out. These activities are documented elsewhere.
| 7.5.4 | Geotechnical sampling |
The geotechnical component of the NORI 2022 campaign, Campaigns 7A and 7B, was intended to investigate the soil properties prior to the test mining and then to repeat the survey following the completion of the trial. The geotechnical results were intended to be used to inform the evaluation of the collector performance and to refine the ground model of the test mining area.
The geotechnical sampling was conducted alongside the geology and environmental sampling. During Campaign 7A, geotechnical studies were conducted on 21 box cores and 27 in situ seafloor CPTs were completed. During Campaign 7B, geotechnical studies were conducted on 26 box cores and 30 in situ seafloor CPTs were completed at 15 locations. Figure 7.33 shows the plan of all sampling and testing.
| amcconsultants.com | 119 |
| Technical Report Summary of Prefeasibility Study of NORI Area D, Clarion Clipperton Zone | |
| TMC the metals company Inc. | 0225054 |
| Figure 7.33 | Plan of location of CPT tests in box cores and in situ on the seafloor (ROV CPT), Campaign 7A |
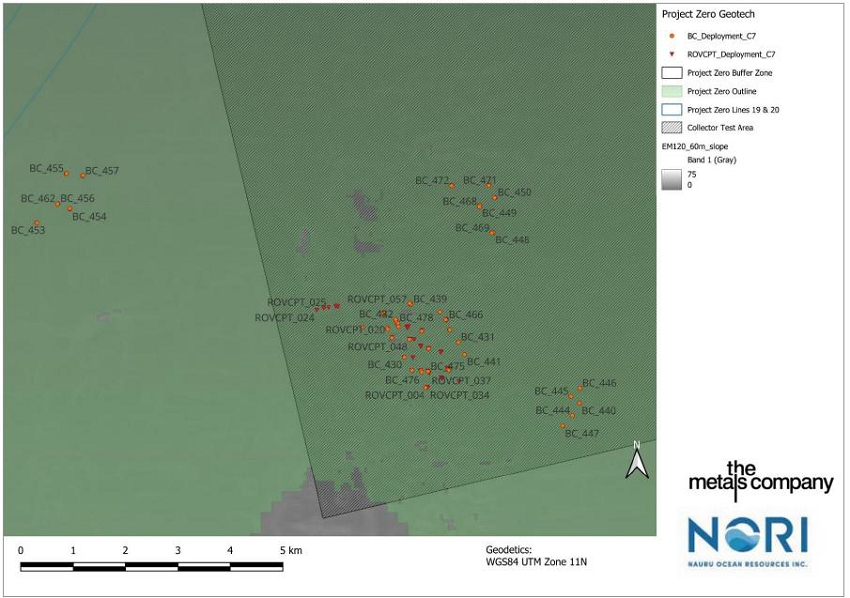
Source: APYS Subsea Ltd
| amcconsultants.com | 120 |
| Technical Report Summary of Prefeasibility Study of NORI Area D, Clarion Clipperton Zone | |
| TMC the metals company Inc. | 0225054 |
All box cores were subsampled for geotechnical sampling and testing. The focus of the geotechnical sampling was the surface and footwall sediment sequence. A CPT test and optionally laboratory vane profile were conducted in the box core prior to insertion of the geotechnical or other subsample tubes. The nodules were not disturbed during the testing and tube sampling in the box cores. A single soil subsample for geotechnical study was obtained from the undisturbed areas outside of the biological sampling area of each box core. This box core split sample consisted of one 100 mm inside diameter (ID) x 3 mm wall thickness split aluminium tube.
The testing in the box core was conducted using a custom developed rig (BOXcone) derived from the ROVcone system designed to fit over the box core box and provide a stable platform to deploy the CPT and Laboratory Vane. The same ROVcone system was used for the in situ testing of the seafloor. Figure 7.34 Figure shows the testing system (BOXcone) and the box core on deck.
The box core split sample was used to conduct basic offshore index and strength laboratory tests, comprised of soil descriptions with core photography, wet and dry density measurements, and undrained shear strength index tests (Torvane tests). Intact and residual laboratory vane tests were conducted in the box core. Additionally, a repeat of the sulfate test was conducted to confirm the findings of the Fugro report from 2018.
Additional shear strength readings were taken in the horizontal plane within the box core to allow comparison with the perpendicular readings taken from the split core.
No box core subsamples were taken for storage or onshore testing.
| Figure 7.34 | Box core testing set-up with biological zone divider in place |
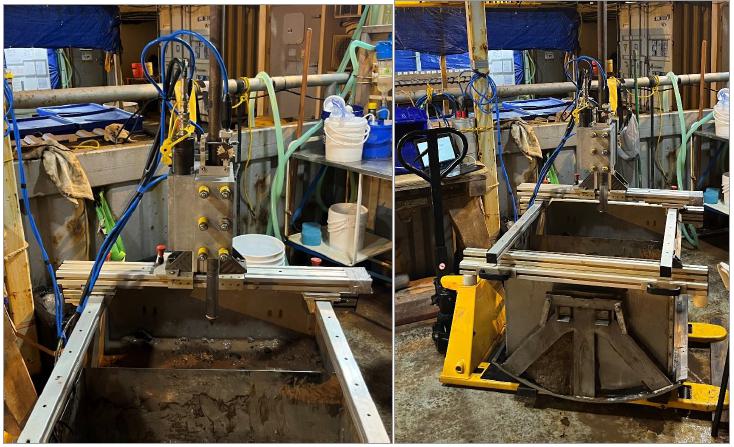
Source: Bluefield Geoservices Ltd.
The focus of the geotechnical testing was the immediate seawater-seafloor interface and footwall sediment sequence underneath. During the first phase (Campaign 7A) the nodules and seafloor were undisturbed and the nodules recovered in the box cores were not removed before the geotechnical testing was carried out. This created a baseline for the later test minings. Data was obtained at 25 locations, with two locations tested twice. During the second phase the testing focused on the test mining area, with one test positioned between the track marks and one test positioned on a track mark at each location, providing data at 15 locations.
| amcconsultants.com | 121 |
| Technical Report Summary of Prefeasibility Study of NORI Area D, Clarion Clipperton Zone | |
| TMC the metals company Inc. | 0225054 |
Figure 7.35 shows the in situ CPT testing system (ROVcone) mounted to the Schilling HD14 WROV onboard the MV Island Pride.
| Figure 7.35 | 10 kN Seabed CPT system mounted to Schilling HD WROV |
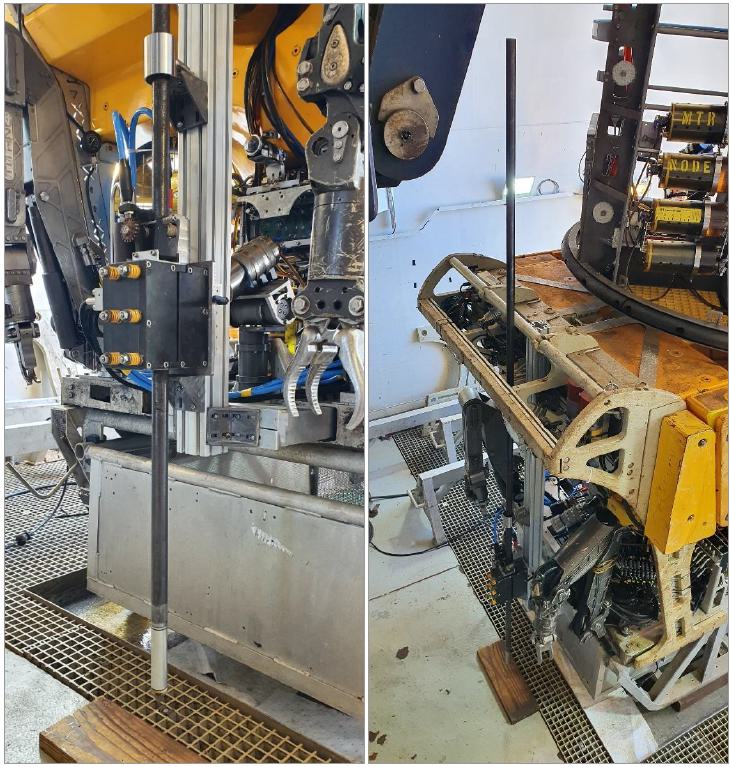
Source: Bluefield Geoservices Ltd.
Full details of the operations, testing and results are contained in the Bluefield Geosciences report OCI001-FAC-01, Geotechnical Factual Data Report (Field) NORI_D Campaign 7A, Jul-Sep 2022 & Nov-Dec 2022.
| amcconsultants.com | 122 |
| Technical Report Summary of Prefeasibility Study of NORI Area D, Clarion Clipperton Zone | |
| TMC the metals company Inc. | 0225054 |
Further consolidated analysis of the geotechnical investigation data is contained in Section 7.14.
| 7.5.5 | Exploration results |
In Campaign 7A, 22 box cores were collected from 21 sites, prior to the test mining (see Figure 7.36). The abundances in the box cores provided measurements of the in situ abundance of nodules. The average nodule abundance was 17.4 wet kg/m2. BC_425 (18.1 wet kg/m2) and BC_427 (17.7 wet kg/m2) were collected from the same nominal sample location. BC_432 failed to trigger and no sample was collected.
In Campaign 7B, 14 box cores were collected from 14 sites over which test minings had been conducted (see Figure 7.37).
Nodules were reweighed on-shore at the end of the campaigns. The differences between off-shore and on-shore weights were not significant and generally less than 1%.
| 7.5.5.1 | Campaign 7A |
The box core results for Campaign 7A are presented in Table 7.5. Nodule abundance ranged from 12.6 wet kg/m2 to 27.9 wet kg/m2 and an average abundance of 17.4 wet kg/m2. Figure 7.36 shows the location of the C7A box cores and the nodule abundances and bathymetry derived from the AUV data.
| amcconsultants.com | 123 |
| Technical Report Summary of Prefeasibility Study of NORI Area D, Clarion Clipperton Zone | |
| TMC the metals company Inc. | 0225054 |
| Table 7.5 | Box Core Sample Coordinates and Nodule Weights - Campaign 7A |
| Box core number | Campaign | Actual location | Weight (kg) | Abundance (wet kg/m2) | Nodule facies | |||
| Easting (E) | Northing (N) | Offshore (kg) | Onshore (kg) | Offshore | Onshore | |||
| BC_425 | 7A | 479476.170 | 1142206.14 | 10181.35 | 10177.18 | 18.10 | 18.09 | 1 |
| BC_426 | 7A | 479006.364 | 1142230.21 | 7994.14 | 7983.58 | 14.21 | 14.19 | 1 |
| BC_427 | 7A | 479488.283 | 1142184.90 | 9928.30 | 9905.92 | 17.65 | 17.61 | 1 |
| BC_428 | 7A | 479568.067 | 1142019.76 | 9101.90 | 9079.12 | 16.18 | 16.14 | 1 |
| BC_429 | 7A | 479668.085 | 1142305.07 | 9603.38 | 9637.01 | 17.07 | 17.13 | 1 |
| BC_430 | 7A | 479804.700 | 1141645.08 | 8530.79 | 8514.58 | 15.16 | 15.14 | 1 |
| BC_431 | 7A | 480838.491 | 1141937.99 | 15656.07 | 15672.52 | 27.83 | 27.86 | 1 & 2 |
| BC_432 | 7A | Box core did not trigger – no sample | ||||||
| BC_433 | 7A | 480675.771 | 1142174.33 | 8828.40 | 8808.38 | 15.69 | 15.66 | 1 |
| BC_434 | 7A | 480489.665 | 1142513.83 | 10308.50 | 10303.92 | 18.32 | 18.32 | 1 |
| BC_435 | 7A | 480600.406 | 1142367.82 | 7741.50 | 7726.78 | 13.76 | 13.74 | 1 |
| BC_436 | 7A | 479951.432 | 1141394.36 | 10510.17 | 10499.32 | 18.68 | 18.67 | 1 |
| BC_437 | 7A | 480121.824 | 1141388.34 | 8479.88 | 8459.72 | 15.08 | 15.04 | 1 |
| BC_438 | 7A | 480152.033 | 1142155.70 | 7097.26 | 7070.12 | 12.62 | 12.57 | 1 |
| BC_439 | 7A | 479926.715 | 1142659.33 | 8085.28 | 8071.38 | 14.37 | 14.35 | 1 |
| BC_440 | 7A | 483147.461 | 1140769.56 | 8817.28 | 8823.98 | 15.68 | 15.69 | 1 |
| BC_441 | 7A | 480956.333 | 1141701.63 | 8606.56 | 8592.12 | 15.30 | 15.27 | 1 |
| BC_442 | 7A | 480267.249 | 1141814.42 | 12218.98 | 12197.00 | 21.72 | 21.68 | 1 |
| BC_443 | 7A | 480642.923 | 1141410.75 | 7962.92 | 7952.98 | 14.16 | 14.14 | 1 |
| BC_444 | 7A | 483012.096 | 1140534.43 | 10862.31 | 10840.12 | 19.31 | 19.27 | 1 |
| BC_445 | 7A | 482989.024 | 1140900.47 | 10490.74 | 10466.72 | 18.65 | 18.61 | 1 |
| BC_446 | 7A | 483158.143 | 1141053.27 | 11635.60 | 11629.72 | 20.69 | 20.68 | 1 |
| BC_447 | 7A | 482828.985 | 1140337.7 | 12412.49 | 12433.64 | 22.07 | 22.10 | 1 & 2 |
| amcconsultants.com | 124 |
| Technical Report Summary of Prefeasibility Study of NORI Area D, Clarion Clipperton Zone | |
| TMC the metals company Inc. | 0225054 |
In Campaign 7A, the majority of the nodules (94%) were found on the sediment surface (0 cm to 1 cm interval), with most of the remainder buried in the sediment at depths between 1 cm and 15 cm.
The dominant nodule facies was Type 1. The nodules ranged in size from 8 mm to 193 mm in diameter, with an average major axis length of 2.9 mm. The nodules were mainly smooth (S type) on both the upper and lower surfaces. The dominant nodule shape encountered was discoidal. A few larger nodules with rough lower surfaces and poorly developed botryoidal texture were observed in two box cores (BC_431 and BC_447), where they were found sitting on the clay surface amongst the smaller smooth nodules, not in a semi-liquid clay as was noted on previous campaigns. The box cores with the mixed nodule assemblages returned the highest nodule abundances of all samples processed through the geology laboratory during this campaign.
The soils encountered in the box cores generally consisted of a homogenous, very soft dark brown upper clay layer of 100 mm to 150 mm in thickness and an underlying mottled soft clay layer with strong evidence of bioturbation.
| 7.5.5.2 | Campaign 7B |
In Campaign 7B, 14 box cores (BC_473 – BC_486) were successfully acquired for the purpose of measuring the nodules left behind by the collector. Nodule abundances before and after the Trial Mining Test have not yet been fully reconciled with the parameters under which the collector was operating (mode, speed, etc) to estimate nodule recovery factors. This was due to problems with the activity data recordings and a paucity of box core samples. TMC had intended to supplement box core samples with photograph-based nodule abundance assessment from the widespread high resolution photo data of the area. However, a reliable image recognition and nodule estimation methodology had not been identified at the time of this Technical Report, and as a consequence, the operating status of the collector cannot be accurately matched to its location on the seafloor.
The box core results for Campaign 7B are presented in Table 7.6. Nodule abundances ranged from 0.51 wet kg/m2 to 15.66 wet kg/m2. In most cases, the collector had been picking up nodules and therefore the nodules collected in the box cores were only those that the collector and riser and lift system did not recover. Figure 7.37 shows the location of the C7B box cores and the nodule abundances and bathymetry derived from the AUV data.
| amcconsultants.com | 125 |
| Technical Report Summary of Prefeasibility Study of NORI Area D, Clarion Clipperton Zone | |
| TMC the metals company Inc. | 0225054 |
| Table 7.6 | Box Core Sample Coordinates and Nodule Weights - Campaign 7B |
| Box core number | Campaign | Actual location | Weight (kg) | Abundance (wet kg/m2) | Nodule facies | |||
| Easting (E) | Northing (N) | Offshore (kg) | Onshore (kg) | Offshore | Onshore | |||
| BC_473 | 7B | 480214.886 | 1141062.88 | 909.30 | 914.88 | 1.62 | 1.63 | 1 |
| BC_474 | 7B | 480654.723 | 1141395.17 | 8389.32 | 8420.98 | 14.91 | 14.97 | 1 |
| BC_475 | 7B | 480262.876 | 1141373.01 | 1842.05 | 1846.68 | 3.27 | 3.28 | 1 |
| BC_476 | 7B | 480135.360 | 1141355.88 | 763.27 | 767.68 | 1.36 | 1.36 | 1 |
| BC_477 | 7B | 480271.559 | 1141815.45 | 2353.44 | 2360.68 | 4.18 | 4.20 | 1 |
| BC_478 | 7B | 479663.974 | 1142304.58 | 1741.45 | 1742.68 | 3.10 | 3. 10 | 1 |
| BC_479 | 7B | 479689.994 | 1142237.93 | 1974.77 | 1978.08 | 3.51 | 3.52 | 1 |
| BC_480 | 7B | 479675.189 | 1142304.36 | 1695.88 | 1699.68 | 3.01 | 3.02 | 1 |
| BC_481 | 7B | 479643.178 | 1142344.95 | 8788.59 | 8811.04 | 15.62 | 15.66 | 1 |
| BC_482 | 7B | 479637.306 | 1142373.92 | 4529.66 | 4542.22 | 8.05 | 8.08 | 1 |
| BC_483 | 7B | 479898.954 | 1141990.15 | 1624.73 | 1636.88 | 2.89 | 2.91 | 1 |
| BC_484 | 7B | 480132.675 | 1142147.55 | 1532.92 | 1536.48 | 2.73 | 2.73 | 1 |
| BC_485 | 7B | 479903.330 | 1142679.75 | 283.66 | 288.48 | 0.50 | 0.51 | 1 |
| BC_486 | 7B | 479405.490 | 1142494.03 | 1731.74 | 1734.68 | 3.08 | 3.08 | 1 |
| amcconsultants.com | 126 |
| Technical Report Summary of Prefeasibility Study of NORI Area D, Clarion Clipperton Zone | |
| TMC the metals company Inc. | 0225054 |
The nodules collected during Campaign 7B ranged in size from 5 mm to 70 mm in diameter. By mass, 81.8% of the nodules occurred on the surface of the box core and 18.2% of the nodules were recovered from depths between 1 and 15 cm. Nodules were typical Type 1 surface nodules, many displaying evidence of fresh fracturing, with the buried nodule population being more skewed towards angular nodule fragments.
The significant reduction in surface nodules and lesser reduction in buried nodules between the two campaigns is the result of pick-up of nodules by the collector during the test mining.
Six of the Campaign 7B box cores were located at sites within 80 m of Campaign 7A box cores, allowing comparison of nodule abundances before and after the test mining. The paired sampling sites and the abundances recorded in the box cores are listed in Table 7.7 and shown in Figure 7.36. The nodule abundances prior to collection (Campaign 7A) ranged from 12.57 kg/m2 to 21.68 kg/m2 with an average of 15.8 kg/m2 at the paired sites. The nodule abundances for the same sites after collection (Campaign 7B) ranged from 0.51 kg/m2 to 15.66 kg/m2 with an average of 5.72 kg/m2.
BC_481 and BC_474 are likely to have sampled seafloor not traversed by the collector or traversed while the collector was not in pick up mode. Excluding these two results, the average recovery of nodules was 80%.
| Table 7.7 | Summary of the nodule abundance for the paired sites before and after the test mining |
| Sample LocatioN |
Campaign 7A Box Core ID |
Campaign 7B Box Core ID |
Campaign 7A | Campaign 7B | Recovery (%) |
Distance
between pair (m) |
| Nodule Abundance (wet kg/m2) |
Nodule
Abundance (wet kg/m2) | |||||
| TF_001 | BC_438 | BC_484 | 12.57 | 2.73 | 78 | 21.0 |
| TF_003 | BC_437 | BC_476 | 15.04 | 1.36 | 91 | 35.2 |
| TF_007 | BC_429 | BC_478 | 17.13 | 3.10 | 82 | 4.1 |
| BC_479 | 3.52 | 79 | 70.6 | |||
| BC_480 | 3.02 | 82 | 7.1 | |||
| BC_481 | 15.66 | 9 | 47.0 | |||
| BC_482 | 8.08 | 53 | 75.4 | |||
| TF_009 | BC_443 | BC_474 | 14.14 | 14.97 | -6 | 19.5 |
| TF_015 | BC_442 | BC_477 | 21.68 | 4.20 | 81 | 4.4 |
| TF_016 | BC_439 | BC_485 | 14.35 | 0.51 | 96 | 31.0 |
| Averages | 15.82 | 5.72 | 64 | 31.6 |
| amcconsultants.com | 127 |
| Technical Report Summary of Prefeasibility Study of NORI Area D, Clarion Clipperton Zone | |
| TMC the metals company Inc. | 0225054 |
| Figure 7.36 | Plan of test mining site showing C7A box core locations, abundances and bathymetry |

Source: MARGIN
| amcconsultants.com | 128 |
| Technical Report Summary of Prefeasibility Study of NORI Area D, Clarion Clipperton Zone | |
| TMC the metals company Inc. | 0225054 |
| Figure 7.37 | Plan of test mining site showing C7B box core locations, abundances and bathymetry |
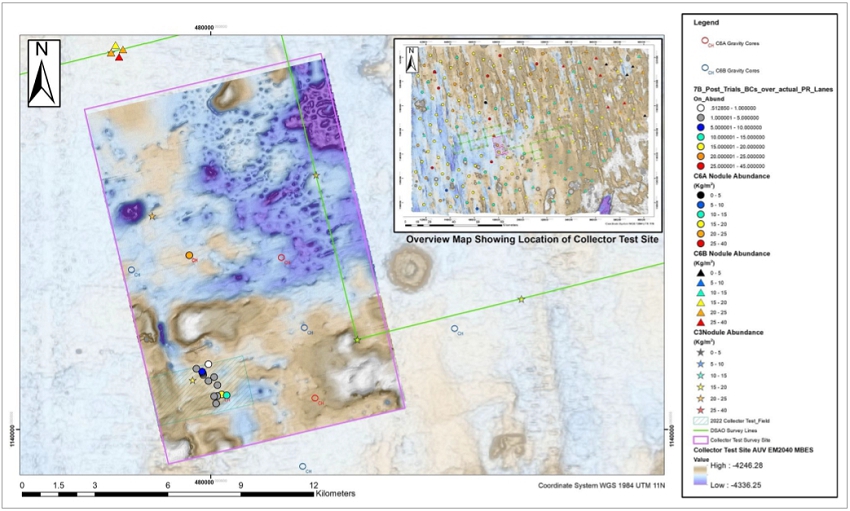
Source: MARGIN
| amcconsultants.com | 129 |
| Technical Report Summary of Prefeasibility Study of NORI Area D, Clarion Clipperton Zone | |
| TMC the metals company Inc. | 0225054 |
| Figure 7.38 | Plan of box core abundances for campaign 7A and 7B and test mining runs |
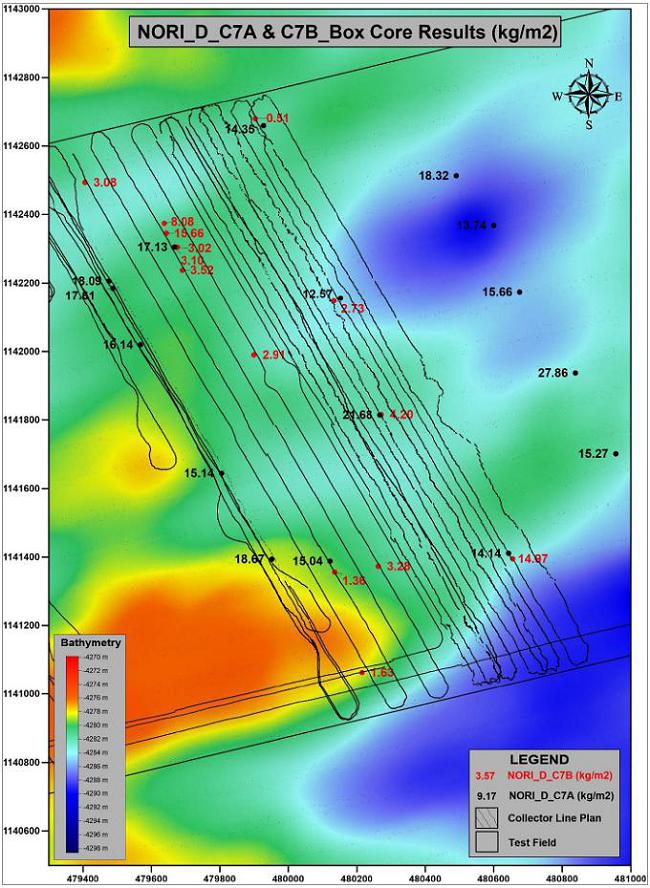
Source: TMC
| amcconsultants.com | 130 |
| Technical Report Summary of Prefeasibility Study of NORI Area D, Clarion Clipperton Zone | |
| TMC the metals company Inc. | 0225054 |
| 7.6 | NORI 2023 Campaign 8a |
Campaign 8a was focused on collecting benthic biological data 12 months after completion of the collector Test. During this campaign the opportunity was taken to collect six (6) box cores to provide additional resource information in areas which had not been directly impacted by collection.
Additionally, 196.4 line km of AUV deployed MBES, side scan sonar (SSS), sub-bottom profiler (SBP), and 245.5 line km of camera data were collected over an area of 245.7 km2 in areas delineated as runs 19 and 20.
THRE360 Energy (previously Leap Energy) was subcontracted to provide geological support for the box coring operations. Bluefield Geoservices was subcontracted to provide the geotechnical logging and testing component of the program.
Box scores were only collected from two sites, namely a control site (zero impact from the 2022 test mining) and an area of thick re-sedimentation near collector tracks (Zone 1). Box cores from the control site (BC_492, BC_501 and BC_502) yielded nodule abundances ranging from 18.8 kg/m2 to 21.6 kg/m2 and averaged 20.2 kg/m2. Box cores from Zone 1 (BC_488, BC_493, BC_500), yielded nodule abundances that ranged from 9.3 kg/m2 to 17.0 kg/m2 and averaged 14.4 kg/m2.
| 7.6.1 | Box coring |
A 75 cm x 75 cm x 50 cm stainless steel box corer (area of 0.526 m2) built by Ocean Instruments was used. The positioning of the final land-out coordinates of box cores deployments were carried out using USBL positioning equipment. The box corer was operated by Continental Shelf Associates (CSA) deck crew and was fitted with an USBL transponder for positioning. A sound velocity profiler (SVP) was used to monitor sound velocity variations in the water column. The positioning was monitored by two certified surveyors from Magellan. Fixes were taken during each box core landing and all sample coordinates were recorded in WGS84 UTM 11N.
| 7.6.2 | Nodule sampling |
Geological logging and nodule sampling were completed. The procedures for sampling the nodules were the same as used in Campaigns 6 and 7. Nodules are removed from the box core, geologically logged, photographed, weighed, sealed in plastic bags and packed into plastic buckets.
As a quality control measure, five out of the six box core samples were split into duplicates for assaying by selecting nodules randomly from the buckets. Random sampling was chosen as an alternative to coning and quartering as it was considered that this would reduce exposure of the samples to air and result in more accurate measurement of moisture content without introducing significant variability into the assays. The nodules were selected from the buckets containing the 0 – 1 cm layer, which on average was 96% of the total mass of nodules collected from the box core, and did not include nodules from the 1 – 15 cm layer. AMC considers that this is not a significant risk to the accuracy of the assays from the box cores.
The nodule facies of the samples recovered during Campaign 8A was Type 1.
| 7.6.3 | Biological sampling |
The primary purpose of Campaign 8A was environmental sampling and monitoring. Biological sampling of the box cores was carried out. These activities are documented elsewhere.
| 7.6.4 | Exploration results |
In Campaign 8A, 6 box cores (BC_488, BC_492, BC_493, BC_500, BC_501, BC_502) were successfully sampled for resource definition purposes. The abundances in the box cores provided measurements of the in situ abundance of nodules.
| amcconsultants.com | 131 |
| Technical Report Summary of Prefeasibility Study of NORI Area D, Clarion Clipperton Zone | |
| TMC the metals company Inc. | 0225054 |
Nodules were reweighed on-shore at the end of the campaigns. The differences between off-shore and on-shore weights were not significant and generally less than 1%.
The box core results for Campaign 8A are presented in Table 7.8. Nodule abundance ranged from 9.2 wet kg/m2 to 21.5 wet kg/m2 and an average abundance of 17.2 wet kg/m2. Figure 7.39 shows the location of the C8A box cores.
| Table 7.8 | Box core sample coordinates and nodule weights - Campaign 8A |
| Box
core number |
Campaign | Actual location | Weight (kg) |
Abundance (wet kg/m2) |
Nodule facies | |||
| Easting (E) | Northing (N) | Offshore (kg) |
Onshore (kg) |
Offshore | Onshore | |||
| BC_488 | 8A | 480,145.31 | 1,141,698.67 | 9.55 | 9.52 | 16.97 | 16.93 | 1 |
| BC_492 | 8A | 473,079.21 | 1,144,556.35 | 12.14 | 12.07 | 21.58 | 21.45 | 1 & 2 |
| BC_493 | 8A | 480,119.98 | 1,141,684.64 | 5.24 | 5.17 | 9.32 | 9.19 | 1 |
| BC_500 | 8A | 480,081.27 | 1,141,692.19 | 9.46 | 9.43 | 16.82 | 16.77 | |
| BC_501 | 8A | 473,463.88 | 1,144,574.42 | 10.60 | 10.64 | 18.85 | 18.92 | 1 |
| BC_502 | 8A | 473,079.78 | 1,144,667.59 | 11.27 | 11.30 | 20.03 | 20.09 | 1 |
| amcconsultants.com | 132 |
| Technical Report Summary of Prefeasibility Study of NORI Area D, Clarion Clipperton Zone | |
| TMC the metals company Inc. | 0225054 |
| Figure 7.39 | Plan of C8a box core locations, abundances and bathymetry |
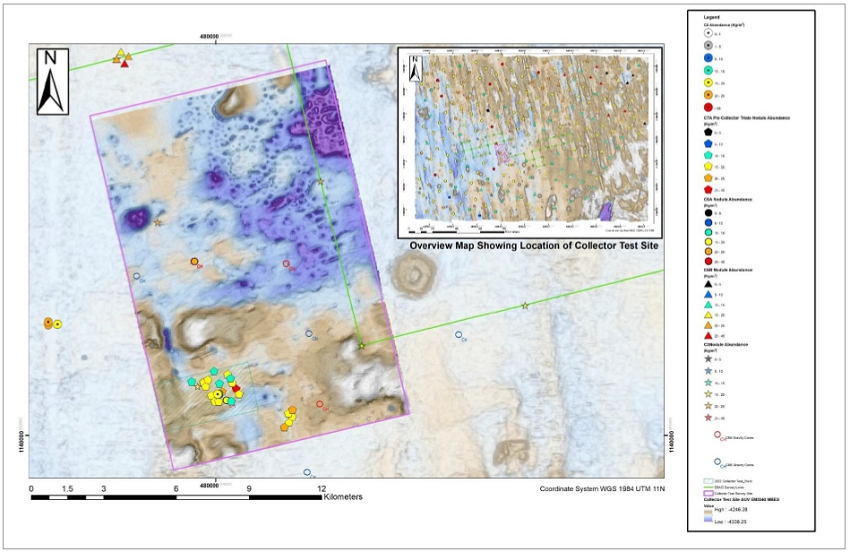
Source: MARGIN
| amcconsultants.com | 133 |
| Technical Report Summary of Prefeasibility Study of NORI Area D, Clarion Clipperton Zone | |
| TMC the metals company Inc. | 0225054 |
| 7.7 | Analysis of abundance of nodules |
The design of the seafloor collection systems and planning production must consider both the average nodule abundance and the variations in nodule abundance over short distances. In 2023, AMC and MARGIN Marine Geoscience completed several studies of nodule abundance.
The nodule abundance data collected in campaigns C3, C6A, C6B, and C7A was reviewed to check the integrity of the data stored in the new NORI project database. All recorded weights were confirmed to be internally consistent with the previously reported nodule abundances.
In campaign C3, nodules in the box cores were sampled by depth according to the intervals shown in Figure 7.40. On average, 96% of the nodules were recovered between the surface and a depth of 5 cm. The nodules recovered between 5 cm and 15 cm depth all horizons were interpreted to have been pushed into the soft clay by the box core frame. There were only two box cores where nodules deeper than 15 cm were confidently observed in situ, but these
nodules were so friable that they crumbled when attempts were made to remove the surrounding clay and were not recoverable.
| Figure 7.40 | Schematic representation of average weight of nodules by depth in the box cores in campaign C3 |
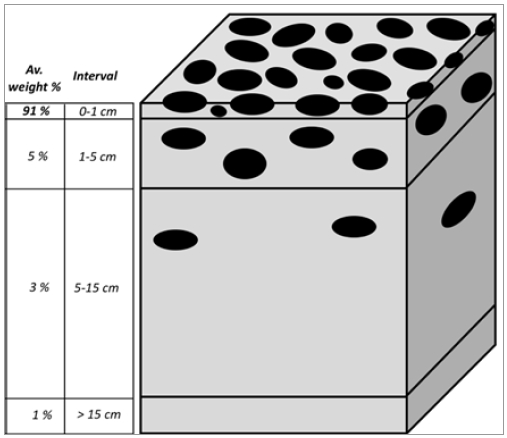
Source: TMC
In Campaign 6 (6A plus 6B), the majority of the nodules (92%) were found on the sediment surface (0 cm to 1 cm interval), with the remainder being predominantly encountered buried in the sediment at depths between 1 cm and 15 cm. The 1 cm to 5 cm interval and 5 cm to 15 cm intervals were not sampled separately. Occasionally, nodules were found buried deeper in the box core (15 cm to 30 cm), but these were generally in advanced stages of breakdown and were very easily broken when any attempt was made to recover them. The nodules from deeper than 15 cm were not collected. Nodule sampling in campaign C7A and C7B, was carried out using the same practice as in Campaign 6.
| amcconsultants.com | 134 |
| Technical Report Summary of Prefeasibility Study of NORI Area D, Clarion Clipperton Zone | |
| TMC the metals company Inc. | 0225054 |
The reported nodule abundance in box cores in all campaigns was calculated from the mass of all nodules recovered to a depth of 15 cm. The contribution of each layer to the total abundance is shown for each box core in Figure 7.41.
| Figure 7.41 | Scatter plots showing the contribution by layer to total nodule abundance in box cores |
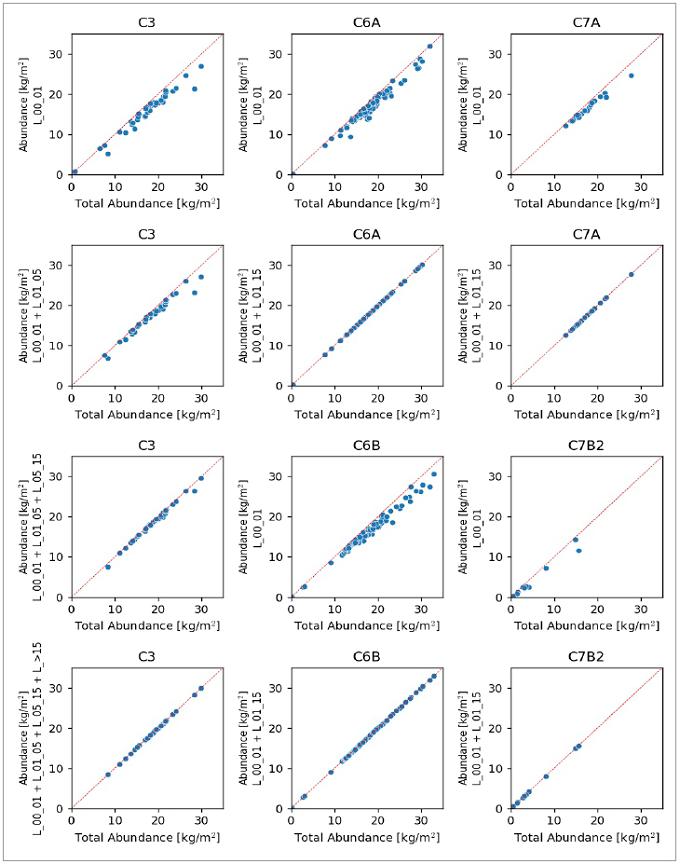
| amcconsultants.com | 135 |
| Technical Report Summary of Prefeasibility Study of NORI Area D, Clarion Clipperton Zone | |
| TMC the metals company Inc. | 0225054 |
Table 7.9 summarizes the masses of nodules recovered by depth and campaign. The summary shows that there is consistency between the proportions of nodules by layer in each campaign of box core sampling of in situ nodules. There was an average of 92% in 0 – 1 cm layer, 7% in 1 – 15 cm layer, of which the measurements in campaign C3 indicate 4% – 5% was in the 1 – 5 cm layer. There is an insignificant proportion of nodules at greater than 15 cm depth.
The data indicates that, for a collector designed to cut the seafloor to a maximum depth of 5 cm, 96% of the measured box core nodule abundance is expected to be available for collection by the seafloor mining system.
| Table 7.9 | Masses of nodules recovered by depth and campaign |
| Campaign C3 | Number of box cores = | 45 | |||
| Depth (cm) | 0 - 1 | 1 - 5 | 5 - 15 | >15 | Total |
| Total mass by layer (kg) | 540 | 28 | 20 | 8 | 596 |
| Mean percentage mass by layer | 91% | 5% | 3% | 1% | 100 |
| Campaign C6A | Number of box cores = | 106 | |||
| Depth (cm) | 0 - 1 | 1 - 15 | >15 | Total | |
| Total mass by layer (kg) | 1346 | 96 | 0 | 1441 | |
| Mean percentage mass by layer | 93% | 7% | 0% | 100 | |
| Campaign C6B | Number of box cores = | 101 | |||
| Depth (cm) | 0 - 1 | 1 - 15 | >15 | Total | |
| Total mass by layer (kg) | 1178 | 101 | 1279 | ||
| Mean percentage mass by layer | 92% | 8% | 0% | 100 | |
| Campaign C7A | Number of box cores = | 22 | |||
| Depth (cm) | 0 - 1 | 1 - 15 | >15 | Total | |
| Total mass by layer (kg) | 201 | 14 | 215 | ||
| Mean percentage mass by layer | 94% | 6% | 0% | 100 | |
| Campaigns 3, 6A, 6B, 7A | Number of box cores = | 274 | |||
| Depth (cm) | 0 - 1 | 1 - 15 | >15 | Total | |
| Total mass by layer (kg) | 3265 | 258 | 8 | 3532 | |
| Mean percentage mass by layer | 92% | 7% | 0% | 100% | |
| Campaign C7B (post-mining) | Number of box cores = | 14 | |||
| Depth (cm) | 0 - 1 | 1 - 15 | >15 | Total | |
| Total mass by layer (kg) | 31 | 7 | 38 | ||
| Mean percentage mass by layer | 82% | 18% | 0% | 100% | |
The nodules recorded in box cores of Campaign 7B were residual material not recovered by the collector during the test mining and are not included in Mineral Resource or Reserve estimates. Nodule abundances before and after the test mining have not been reconciled, and the data is not relied upon in the Mineral Reserve statement pursuant to Item 1302(b)(2)(ii).
| 7.8 | Analysis of nodule size distribution |
Understanding the particle size distributions (PSD) of the nodules is important for the engineering design of the collector and for estimating nodule recovery during mining operations. The collector will pick up nodules up to a certain maximum size and nodules greater than this size may be left on the seafloor. Therefore, measurements of nodule dimensions and understanding of how nodule dimensions vary across NORI Area D will help determine optimum collector design parameters and enhance the accuracy of mine plans and recovery predictions.
| amcconsultants.com | 136 |
| Technical Report Summary of Prefeasibility Study of NORI Area D, Clarion Clipperton Zone | |
| TMC the metals company Inc. | 0225054 |
| 7.8.1 | Physical measurement of size and estimation of abundance from nodule dimensions |
Subsea imagery, box core top shots, and laboratory photographs of trays of nodules, only provide measurements of the major and intermediate axes of the nodules. During Campaign 7A the axial lengths of selected nodules were manually measured during off-shore nodule processing. The objective was to assess whether addition of the short (vertical) axis measurement can be used to significantly improve the estimation of nodule abundance from subsea imagery.
For each tray of nodules presented for photography in the off-shore laboratory, the major, intermediate, and minor axes of the four nodules in the corners of each tray were measured. This resulted in 500 individual measurements acquired over the campaign, from 22 box cores.
The first step in the analysis of the data was to assess whether there was a relationship between major (X), intermediate (Y) and short (Z) axes data. Figure 7.42 shows scatter plots comparing the axial lengths of the 500 nodules. It is clear that the axial lengths are positively, linearly correlated. Variability in these relationships increase as the size of the nodule increases (seen as a comet-tail distribution, widening with increase in axes length).
| Figure 7.42 | Scatter plot comparing axis lengths of 500 manually measured nodules |
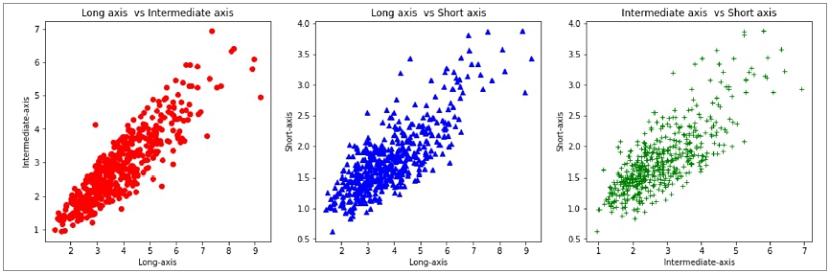
Source: MARGIN
| 7.8.2 | Measurement of nodule dimensions using ImageJ software |
During Campaign 3 an image classification approach was tested for measuring the long and intermediate axes of individual nodules taken from box core samples, using ImageJ software. This approach was driven by a need to find a more efficient method of performing nodule measurements over manual hand-held calliper measurements, as the majority of box cores recovered much higher nodule counts than were initially anticipated, resulting in an onboard processing backlog. The image classification method showed a very good correlation against hand-held calliper measurement (see Section 7.2.10).
This approach was subsequently adopted across campaigns 6A to 7B. Section 7.2.6 provides an overview of the image classification methodology. NORI collected nodule size measurements from the box core samples by photographing all the nodules nominally greater than 1 cm in length and then using image processing software (ImageJ) to automate the measurement of the orthogonal major and intermediate axes of the nodules. The minor axis of the nodules is the vertical axis of the nodules which cannot be seen in the photographs. Nodules < 1 cm diameter were bagged and sealed into small clear sample packets and included in the photographs but not measured by the image processing software. They were included in the weighing process and are included in the abundance measurements.
| amcconsultants.com | 137 |
| Technical Report Summary of Prefeasibility Study of NORI Area D, Clarion Clipperton Zone | |
| TMC the metals company Inc. | 0225054 |
Box core locations were compiled from Fugro and Three60/LEAP reports. The locations were combined with the nodule weight and abundance data using the box core IDs, and all campaigns were compiled into a template suitable for archive purposes.
The ImageJ data went through an extensive QA/QC process. Possible low-quality data were identified on the following basis:
| · | Very small nodules – these were usually artifacts in the image that the software counted as nodules. |
| · | Any nodules with a very large major: minor axis ratio – these were usually grid lines that had been counted as nodules. |
| · | Nodules with a very large perimeter value – this was usually down to either poor thresholding or two nodules that had been counted as one. |
| · | Very large values for nodules – the scale had not been set correctly in the ImageJ software. |
Box core images with low-quality datasets were visually examined and then re-processed to a higher standard. Once all the individual datasets were clean and consistent, they were combined into a single dataset. The cleaned ImageJ data can be linked back to the box core locations and layer abundance data via the box core ID.
There are slight differences between the image data in Campaign 3 and campaigns 6 and 7. In Campaign 3, the graticules behind the nodules in the images were black and if the lighting was poor, parts of the thicker graticules were sometimes falsely detected as nodules. Reprocessing of the data in 2023 largely removed this problem but small anomalies in the proportion of nodules < 1 cm are still visible in the C3 data compared to the C6 data. From C6 onwards, the color of the graticules was changed to red so they could be masked out during object detection.
The data consists of 232,068 individual nodule measurements from 287 box cores. Figure 7.43 shows a scatter plot of the major axis length versus the intermediate axis length for all the nodules in this data set. The points are colored according to the local density of points, where the light green cloud highlights the region with the most points. A curve is fitted to the data using a non-linear smoothing algorithm. The plot demonstrates that most nodules manifest some ellipticity, confirmed by the cloud of points lying below the 1:1 line, along which any circular nodules would lie. The mean ratio nod_intermediate: nod_major is 0.75 and the ratio nod_intermediate: nod_minor is similar. Note that the data does not discriminate between whole nodules and broken fragments.
| amcconsultants.com | 138 |
| Technical Report Summary of Prefeasibility Study of NORI Area D, Clarion Clipperton Zone | |
| TMC the metals company Inc. | 0225054 |
| Figure 7.43 | Scatter plot of nodule major axis dimension versus nodule intermediate axis dimension for all nodules |
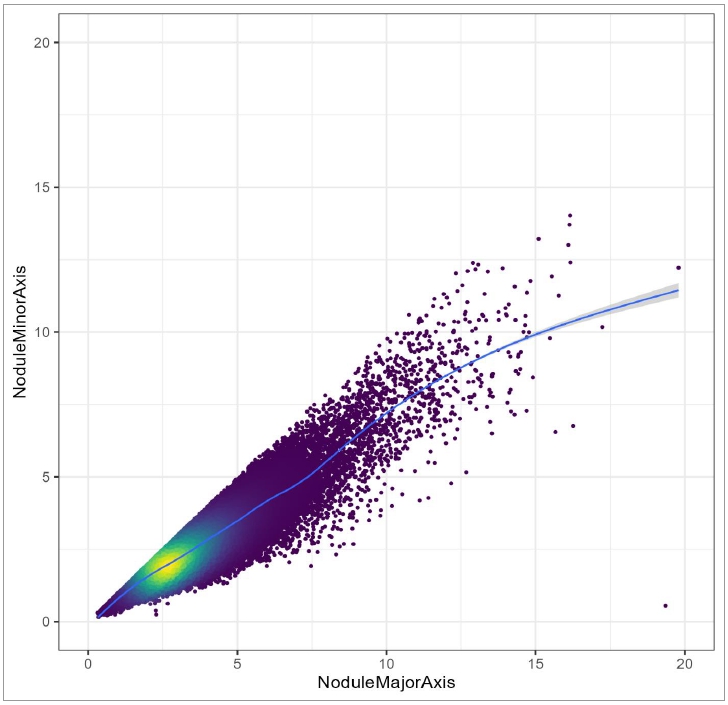
Source: AMC
Figure 7.44 shows boxplots of the major axis lengths of all 287 box cores. It shows that most of the box cores exhibit a median length in the range 2 - 3 cm, and in most cases at least 75% of the nodules (as indicated by the righthand limit of the boxes) are less than 5 cm. This is typical of Type 1 nodule facies (colored black in Figure 7.44). The nodule size distributions are in all cases positively skewed. That is, the distributions show a tail of longer nodule lengths extending to the right of the plots.
| amcconsultants.com | 139 |
| Technical Report Summary of Prefeasibility Study of NORI Area D, Clarion Clipperton Zone | |
| TMC the metals company Inc. | 0225054 |
In most cases, the skewness is weak and the tail is short. However, the box plots and histograms show that 48 box cores are dominated by larger nodules or have more strongly skewed distributions or even bimodal distributions, with a large population of small values and a small population of higher values. These are:
| · | 28 box cores dominated by larger nodules (Type 2/3 nodule facies, colored green in Figure 7.44): |
| ― | BC_005, BC_040, BC_048, BC_069, BC_075, BC_076, BC_088, BC_089, BC_093, BC_098, BC_099, BC_126, BC_127, BC_141, BC_146, BC_178, BC_207, BC_211, BC_213, BC_223, BC_224, BC_230, BC_232, BC_234, BC_236, BC_240, BC_241, BC_242. |
| · | 20 box cores with more strongly skewed distributions and tails of larger nodules (mixed Type 1 and Type 2/3 nodule facies, coloured red in Figure 7.44): |
| ― | BC_001, BC_002, BC_014, BC_018, BC_031, BC_047, BC_055, BC_061, BC_067, BC_107, BC_122, BC_128, BC_129, BC_183, BC_198, BC_219, BC_227, BC_243, BC_431, BC_447. |
| Figure 7.44 | Box plots of nodule major axis dimension for all box cores |
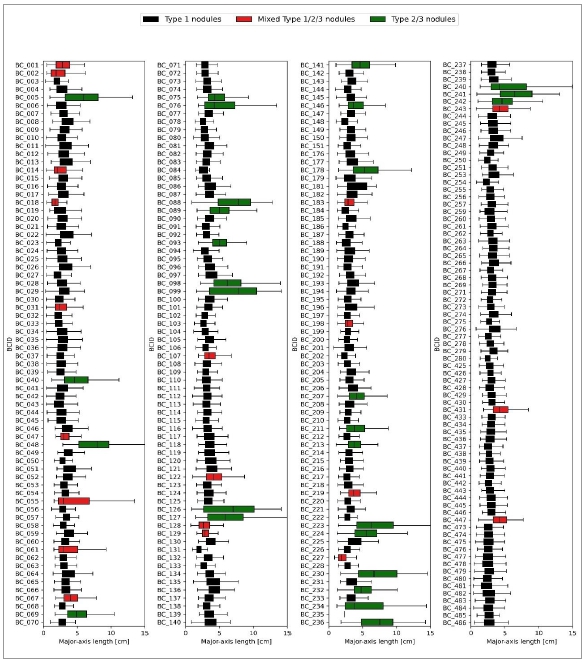
Source: AMC
| amcconsultants.com | 140 |
| Technical Report Summary of Prefeasibility Study of NORI Area D, Clarion Clipperton Zone | |
| TMC the metals company Inc. | 0225054 |
AMC compared the location of these 48 box cores with larger nodules against the extent of Type 2/3 nodules interpreted from the EM120 backscatter data, noting that the interpretation is limited by the 60 m resolution of the backscatter data. Small nodules generally dominate in the centre of NORI Area D, in an ENE trending belt located mainly in the abyssal plain domain. The box cores with the largest mean nodule size generally occur in the north in, or near, areas interpreted to contain Type 2/3 nodules. Approximately 70% of box cores flagged as having a bimodal or skewed population occur in, or very close to, areas interpreted to contain Type 2/3 nodules. The remaining 30% of unusually skewed distributions occur in Type 1 nodule areas. Kuhn and Rühlemann (2021) made similar statistical observations in the BGR contract area, to the north of NORI Area D.
Figure 7.45 shows a plot of the cumulative distributions of nodule major axis lengths for all the 287 box cores for which the ImageJ major axis length data were available. The data was divided into Type 1, Type 2/3, and mixed Type 1 and Type 2/3 groups. The plot shows that there are significant differences between the statistical distributions of major axis length in the three nodule types. The Type 1 box cores have the smallest median major axis length. The Type 2/3 box cores have the largest median major axis length. The mixed facies box cores have an intermediate size distribution. These statistical features illustrate the complexity of nodule size distributions at the local scale and the need for further work to improve the spatial definition of Type 2/3 nodule facies.
| Figure 7.45 | Log probability plot of nodule major axis dimensions, subdivided by interpreted nodule type domain |
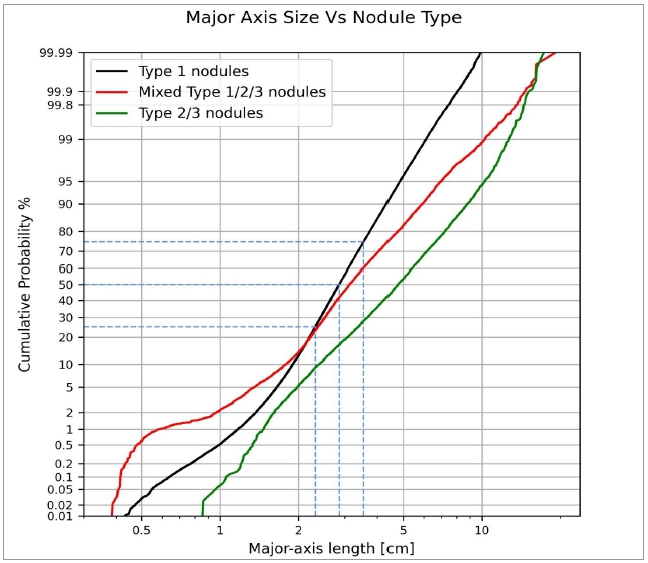
Source: AMC
| amcconsultants.com | 141 |
| Technical Report Summary of Prefeasibility Study of NORI Area D, Clarion Clipperton Zone | |
| TMC the metals company Inc. | 0225054 |
| 7.9 | Analysis of nodule shape, texture and fragmentation |
A classification system for nodules was developed by NORI prior to the NORI 2018 campaign (C3). This was largely based on classifications identified by the ISA (ISA, 2010b) and work presented by TOML in their NI 43-101 resource report (AMC 2016). In each off-shore campaign, descriptors of nodule form, such as shape, texture, and fragmentation were recorded as dominant types for each box core layer (Table 7.10). The logs were captured in a digital excel database on-board the vessel.
In Campaign C3, a first pass statistical analysis of the logging data was carried out. For the first six box cores (BC_001 – BC_006), each nodule was measured and described separately. This was feasible for larger Type 3 facies nodules, but it presented a significant processing bottleneck for the majority of subsequent box core samples, which were typified by smaller diameter Type 1 and Type 2 facies nodules. Over 49,000 nodules were collected in the 45 box cores in Campaign C3. Examples are shown in Figure 7.46
| Table 7.10 | Shape, texture and fragmentation descriptors |
| Shape | Texture | Fragmentation | Botryoidal (grape-like texture) |
| Discoidal
Ellipsoidal, Spherical Tabular, Poly-nucleic, Irregular shaped, Fragment |
Rough, smooth, rough + smooth | Rare, moderate, common | Well developed, poorly developed, absent |
Pie graphs showing dominant shape, texture and fragmentation of the nodules collected during the NORI 2018 C3 campaign are shown in Figure 7.47. Fragmented nodules were the most common. The dominant texture was SR; smooth upper surface and rough lower surface. Well-developed botryoidal texture was relatively uncommon.
Of the 45 box cores, four (4) were Type 3 facies, three (3) were Type 2 facies, and 35 were Type 1 facies. It was noted that:
| · | Type 1: 13% of the nodule sub-samples were dominantly smooth (S) texture, 76% were dominantly smooth-rough (SR) texture and <1% were dominantly rough (R) texture. | |
| · | Type 2: All were dominantly SR texture. | |
| · | Type 3: 50% of the nodule sub-samples of the nodule sub-samples were dominantly R texture, 50% were dominantly SR texture. |
It would be possible to extend the analysis to all campaigns, as the logs were recorded for each nodule batch. However, logging of textural parameters was likely less accurate during Campaign 6A and 6B as there were less geologists per shift and the tempo of sample processing was significantly higher. Textural classification is made difficult by the high proportions of fragmented nodules and likely overprinting of textures during growth and disturbance of the nodules.
| amcconsultants.com | 142 |
| Technical Report Summary of Prefeasibility Study of NORI Area D, Clarion Clipperton Zone | |
| TMC the metals company Inc. | 0225054 |
| Figure 7.46 | Examples of nodules recovered during the NORI 2018 campaign |
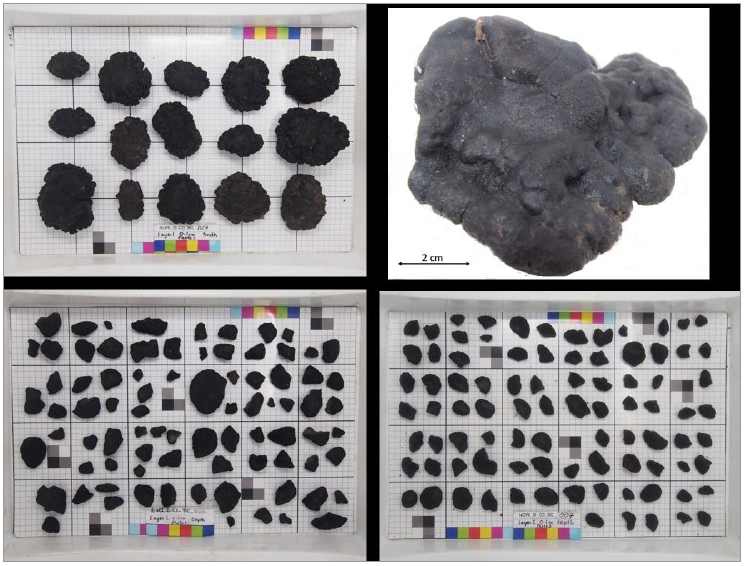
Notes: Upper left – example of large nodules with rough texture. Top right – close-up of large nodule. These nodules were the least-dominant size class. More common were nodules in the 2-5 cm range, as shown by examples in lower left and right. Source: TMC
| amcconsultants.com | 143 |
| Technical Report Summary of Prefeasibility Study of NORI Area D, Clarion Clipperton Zone | |
| TMC the metals company Inc. | 0225054 |
| Figure 7.47 | Pie graphs showing morphology of nodules collected during the 2018 campaign |
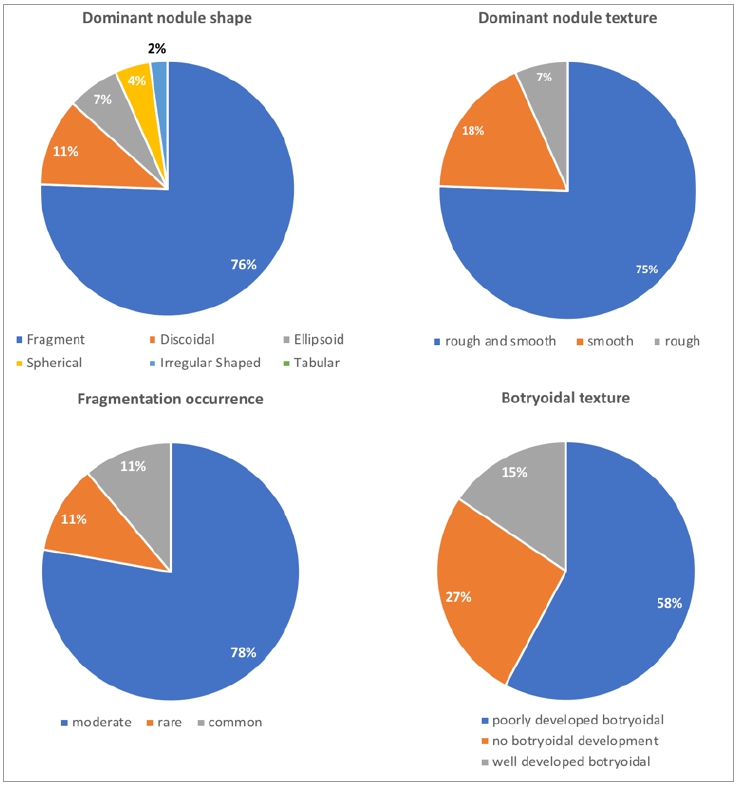
Source: MARGIN
| 7.10 | Analysis of moisture content of nodules |
The moisture content of the nodules in NORI Area D has been measured at various times throughout the exploration and related scientific programs. The conditions under which the samples were dried and the results reported by different laboratories varied. AMC reviewed the moisture content data in order to reconcile inconsistencies and assess whether moisture content shows any relationship to nodule type, size or location. The aim of the review was to clarify which moisture content data should be used when converting wet abundance estimates to dry abundance estimates, and when estimating contained metal.
| amcconsultants.com | 144 |
| Technical Report Summary of Prefeasibility Study of NORI Area D, Clarion Clipperton Zone | |
| TMC the metals company Inc. | 0225054 |
In addition to moisture content data from NORI Area D, relevant data from the Tonga Offshore Mining Limited (TOML), the Federal Institute for Geosciences and Natural Resources (BGR) contract areas, and Interoceanmetal Joint Organization (IOM) contract area were considered.
The moisture content of nodules determined by laboratory analysis is the free (chemically unbound) water occurring within the pore spaces of the individual nodules which is released by drying of the samples prior to chemical analysis. The drying temperature for this is typically 105°C.
The nodules also contain chemically-bound water and hydroxide ions, mainly within manganese and iron minerals. Manganese minerals with various types of crystalline lattice have different levels of thermal stability. Layered manganese minerals (buserite I, asbolane-buserite, and birnessite) are stable up to 120°C –150°C; asbolane up to 180°C, vernadite, up to ∼500°C; todorokite up to 600°C, and pyrolusite up to 670°C (Novikov and Bogdanova 2007). The chemically-bound water and any other volatiles, such as carbon dioxide, are measured by measuring the loss of mass on ignition (LOI) that occurs when the samples are heated from 105°C to 1000°C.
The nodules collected from the seafloor by the seafloor mining system are expected to be delivered to the production vessel as a slurried, coarse aggregate. Any water in the slurry is expected to drain quickly from the stockpile. Sampling of the stockpiled nodules from the test mining indicates that almost all of the moisture within the stockpile occurs within the nodules themselves and not in the space between the nodules.
Moisture contents of the nodules in the NORI Area D database are reported on a wet basis (wet weight-dry weight) / wet weight. The following moisture content information was obtained from nodule samples collected in the NORI Areas:
| · | A drying test undertaken on a nodule sample collected during the NORI 2012 campaign indicated moisture loss of 24% at 120°C (Golder, 2015). | |
| · | Average moisture content of four Campaign 2 samples dried for 12 hours at 120°C was 28.7% (Golder, 2015). | |
| · | Average moisture content of the Campaign 3 (2018) box core samples dried for three days at 60°C (at ALS) was 19.6% (wet basis, using a divisor of mass of water + mass of solids) and LOI at 1,000°C was 16.8%. | |
| · | Average moisture content of the Campaign 3 (2018) box core samples dried at 105°C (at Bureau Veritas) was 16.9% (wet basis) and LOI at 1,000°C was 16.6%. | |
| · | Average moisture content of the Campaign 6A and 6B (2019) box core samples dried at 105°C (at ALS) was 28.1% (wet basis) and LOI at 1,000°C was 15.6%. The method stated for this analysis is OA-GRA05g. OA-GRA05g comprises weighing wet as received using method WEI-23g (reporting wet weight), then drying at 105°C, then weighed again using method WEI-22g (reporting dry weight). | |
| · | Average moisture content of the Campaign 7A and 7B (2022) box core samples dried at 105°C (at ALS) was 27.5% (wet basis) and LOI at 1,000°C was 17.1%. The method stated for this analysis is OA-GRA05g. |
Figure 7.48 shows a histogram of the combined C3, C6, and C7 nodule moisture content data. The moisture contents show a multimodal distribution. The lowest modal peak at 17.5% is the Campaign 3 Bureau Veritas data and the second peak is the Campaign 3 ALS data. Significantly higher moisture contents were reported from the C6 and C7 box cores, with a modal peak at about 27 – 29%. There are a few anomalously high values in the C6 data and another low modal peak within the C6 data. The C7 data aligns with the C6 data.
| amcconsultants.com | 145 |
| Technical Report Summary of Prefeasibility Study of NORI Area D, Clarion Clipperton Zone | |
| TMC the metals company Inc. | 0225054 |
Comparison of the paired moisture content data from C3 showed that it is likely that the drying time at BV was shorter than was necessary to drive off all the free water in the samples. Therefore, AMC considers the moisture content measurements of the C3 box core nodules by ALS to be more accurate than the measurements by BV, so the ALS data is recommended to be used for calculation of dry abundance.
| Figure 7.48 | Histograms of nodule moisture content, NORI Area D |
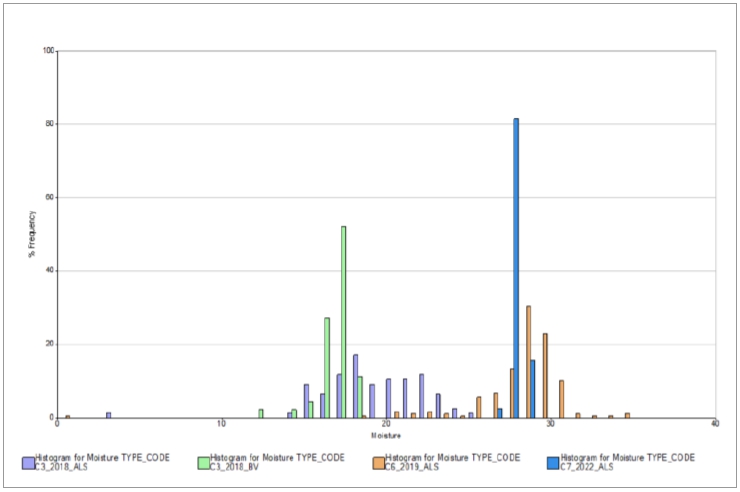
Source: AMC
The differences in the measured nodule moisture contents between C3 and C6, C7 box cores probably relate to different levels of dryness when the nodules were received at the laboratories. The variations in as-received dryness are likely to be related to differences in the conditions in which the samples were handled (air temperature, humidity, wind speed, evaporation rate, and exposure time) before they were sealed in plastic sample bags. The nodules were exposed to air for longer in C3 than in C6 and C7 because counting of nodules was attempted and the samples were coned and quartered on the vessel to produce duplicate samples. The C6 moisture contents (average of 28.1%) are probably a better guide to the moisture content of the nodules that will be delivered by the seafloor mining system to the production vessel.
Water of crystallization is also present in the nodules. This forms part of the mineral structure of many of the iron and manganese minerals in the nodules and other loosely bound moisture held in meta-stable mineral phases. Manganese minerals with various types of crystalline lattice have different levels of thermal stability. Water of crystallization is generally not released by natural drying of the nodules at ambient temperatures. LOI between 105°C and 1000°C was measured in laboratory tests, using a small aliquot of the sample. There is a high level of consistency between the LOI results from the C3, C6, C7 and BGR data sets.
Studies of the impact of drying nodules for different lengths of time indicate that nodules should be dried for at least 24 hours. In the studies reviewed, moisture contents of about 28% were reported for the nodules dried at 105°C or 110°C for 24 hours and moisture contents of 32% were reported for those dried for 48 – 72 hours. This suggests gradual breakdown of very loosely-bound water of crystallization during extended drying periods.
| amcconsultants.com | 146 |
| Technical Report Summary of Prefeasibility Study of NORI Area D, Clarion Clipperton Zone | |
| TMC the metals company Inc. | 0225054 |
Based on the AMC review, no correlations were identified between the moisture contents of the C6 nodules and assays, nor has AMC discerned any clear spatial correlations with nodule size fraction, nodule type, abundance, bathymetry, or geological domain.
So far as estimation of metal production units is concerned, the wet abundances must be converted to dry abundances at 105°C, the temperature at which the samples were dried prior to assaying. The analysis of the data by campaign shows that application of an average factor to convert wet abundance to dry abundance is not appropriate. The conversion should be done using the measured moisture contents, on a sample by sample basis. In this way the biases between C3 and C6 results will not compromise the estimation of dry abundance and metal content.
The conversion equation is:
Dry abundance = Wet abundance * (1 - moisture content expressed on a wet basis)
Dry abundances should be directly estimated in the resource block model. The dry abundance measurements for the box core samples provide a better datum for abundance because the errors and uncertainties in the moisture values have been removed, or at least reduced, by drying at 105°C.
The wet abundance and tonnage estimates in the resource block model should be calculated from the kriged dry abundances by adding 28% moisture (mass of water)/(mass of solids + water). Moisture content of 28% is the current best estimate, based on Campaign 6, 7, and 8 box cores and sampling of 3000 t of nodules recovered during the test mining in 2022.
| 7.11 | Analysis of density of nodules |
AMC identified relevant sources of data for the estimation of density of the nodules in NORI Area D. In 2018, during campaign C3, NORI measured the density of 45 samples of individual nodules or batches of nodules. Non-breakable beakers ranging from 200 ml to 2 L were used for taking nodule weights and for volume displacements. These measurements were used to calculate wet density values. The average of the results was 2.0 wmt/m3.
TOML measured the density of 76 individual nodules or batches of nodules from TOML Area B, C, D, and F (AMC 2016). The batches of nodules included fragments and sand resulting from attrition during transport and handing. The mean density of 34 individual nodules was 1.95 wmt/m3 and that of 27 batches of nodules was 2.0 wmt/m3. TOML postulated that the difference might be due to air or water filled expansion cracks in the single nodules that were collected ~7 months before the density measurements were made. TOML preferred the batch nodule measurements over the single nodule measurements due to their larger sample size. The bulk nodule measurements also had a lower standard deviation than the individual nodule measurements.
Only 15 measurements were made on samples (9 individual and 6 batches) from TOML Area F, the closest area to NORI Area D. The mean density values were 1.90 wmt/m3 and 1.97 wmt/m3, respectively. AMC considers that these results are not significantly different from the others in the TOML areas.
TOML confirmed historical results from the north
Pacific by Hessler and Jumars (1974).
Figure 7.49 shows the data from TOML and Hessler and Jumars. The data points are consistent with a mean density of 2.0 wmt/m3.
Baláž 2022 reported the results of investigation of nodules in the IOM contract area from 2016 to 2021. The IOM contract area is in the eastern part of the CCZ but not immediately adjacent to NORI Area D. A total of 1005 individual and batch sample measurements were reported, with a mean of 1.96 wmt/m3.
| amcconsultants.com | 147 |
| Technical Report Summary of Prefeasibility Study of NORI Area D, Clarion Clipperton Zone | |
| TMC the metals company Inc. | 0225054 |
The studies reviewed by AMC report very similar values. AMC considers that a wet density of 2.0 t/m3 is supported by the data and is appropriate for use on the NORI Area D project.
| Figure 7.49 | Density data from TOML Areas B, C, D and F and data from Hessler and Jumars (1974) |
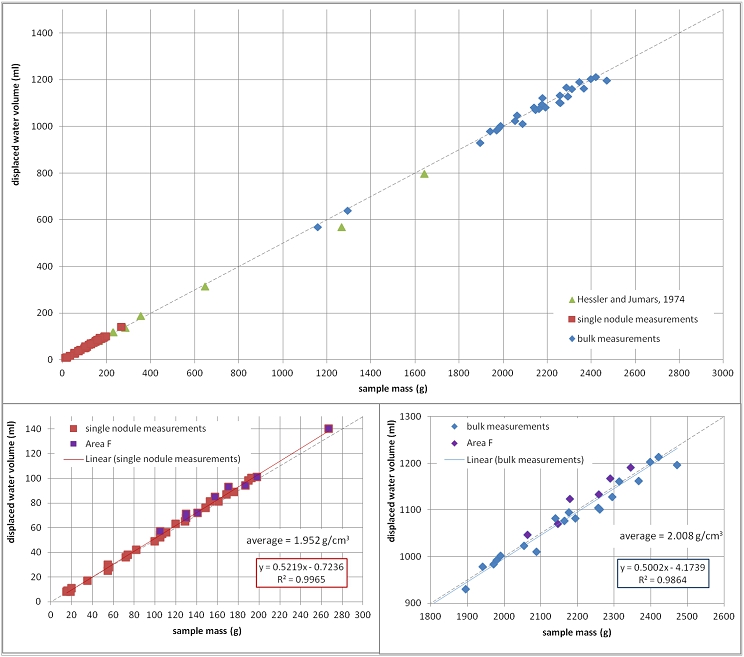
Source: TOML
| amcconsultants.com | 148 |
| Technical Report Summary of Prefeasibility Study of NORI Area D, Clarion Clipperton Zone | |
| TMC the metals company Inc. | 0225054 |
| 7.12 | Multielement chemistry |
| 7.12.1 | Nodules |
TMC analyzed nodule samples for up to 62 elements, using the methods described in Section 8.2. The minimum, average (mean), and maximum grades from 457 nodule samples taken from box cores from NORI Area D are shown in Table 7.11. The major and minor elements are expressed as oxides and the total of the oxides is very close to 100%. Trace elements are present in very low concentrations. The coefficient of variation (CoV) provides a statistical measure of the spread or variability of the data and shows that variability is very low.
| Table 7.11 | Summary statistics of multielement chemistry of nodule samples from box cores |
| Count | Minimum | Mean | Maximum | CoV | |
| Al2O3_% | 457 | 3.17 | 4.02 | 8.82 | 0.128 |
| BaO_% | 457 | 0.25 | 0.44 | 1.24 | 0.330 |
| CaO_% | 457 | 1.52 | 2.46 | 5.89 | 0.124 |
| CoO_% | 457 | 0.09 | 0.18 | 0.58 | 0.243 |
| CuO_% | 457 | 0.75 | 1.45 | 1.90 | 0.086 |
| Fe2O3_% | 457 | 5.42 | 9.41 | 15.96 | 0.136 |
| K2O_% | 457 | 0.92 | 1.08 | 1.97 | 0.103 |
| MgO_% | 457 | 2.59 | 3.17 | 3.81 | 0.042 |
| MnO_% | 457 | 22.4 | 40.0 | 44.5 | 0.056 |
| Na2O_% | 457 | 2.23 | 2.87 | 4.50 | 0.072 |
| NiO_% | 457 | 0.97 | 1.73 | 1.90 | 0.069 |
| P2O5_% | 457 | 0.24 | 0.38 | 2.79 | 0.453 |
| PbO_% | 457 | <0.01 | 0.03 | 0.07 | 0.437 |
| SO3_% | 457 | 0.05 | 0.29 | 0.72 | 0.294 |
| SiO2_% | 457 | 10.06 | 12.20 | 29.09 | 0.155 |
| TiO2_% | 457 | 0.18 | 0.42 | 1.44 | 0.190 |
| ZnO_% | 457 | 0.11 | 0.21 | 0.33 | 0.112 |
| Total_% | 360 | 98.0 | 99.5 | 102.6 | 0.008 |
| LOI_% | 457 | 10.7 | 15.9 | 18.3 | 0.061 |
| Ce_ppm | 454 | 85.2 | 217 | 388 | 0.167 |
| Cr_ppm | 454 | 8 | 11 | 70 | 0.449 |
| Cs_ppm | 454 | 0.75 | 1.07 | 2.04 | 0.168 |
| Dy_ppm | 454 | 13.35 | 26.26 | 38.5 | 0.104 |
| Er_ppm | 454 | 6.98 | 13.55 | 19.9 | 0.105 |
| Eu_ppm | 454 | 3.59 | 7.47 | 10.9 | 0.115 |
| Gd_ppm | 454 | 15.85 | 30.15 | 44.6 | 0.107 |
| Hf_ppm | 454 | 1.8 | 4.77 | 8.2 | 0.173 |
| Ho_ppm | 454 | 2.55 | 4.91 | 7.25 | 0.106 |
| La_ppm | 454 | 59 | 109.12 | 171 | 0.130 |
| Lu_ppm | 454 | 0.96 | 1.94 | 2.67 | 0.103 |
| Nb_ppm | 454 | 7.5 | 18.76 | 35.6 | 0.173 |
| Nd_ppm | 454 | 70.8 | 128.62 | 190.5 | 0.116 |
| Pr_ppm | 454 | 16.2 | 30.31 | 47.1 | 0.119 |
| Rb_ppm | 454 | 13.8 | 17.97 | 31.4 | 0.143 |
| Sc_ppm | 38 | 9 | 9.82 | 11 | 0.073 |
| Sm_ppm | 454 | 16.5 | 30.62 | 42.8 | 0.106 |
| amcconsultants.com | 149 |
| Technical Report Summary of Prefeasibility Study of NORI Area D, Clarion Clipperton Zone | |
| TMC the metals company Inc. | 0225054 |
| Count | Minimum | Mean | Maximum | CoV | |
| Sn_ppm | 454 | 1 | 1.52 | 5 | 0.440 |
| Sr_ppm | 454 | 519 | 704.45 | 882 | 0.064 |
| Ta_ppm | 454 | 0.1 | 0.29 | 1.7 | 0.382 |
| Tb_ppm | 454 | 2.41 | 4.60 | 6.73 | 0.106 |
| Th_ppm | 454 | 4.53 | 9.68 | 22.4 | 0.211 |
| Tm_ppm | 454 | 1.02 | 1.98 | 2.81 | 0.101 |
| U_ppm | 454 | 2.34 | 3.97 | 5.59 | 0.083 |
| V_ppm | 454 | 331 | 486.32 | 648 | 0.091 |
| W_ppm | 454 | 33 | 64.96 | 187 | 0.178 |
| Y_ppm | 454 | 50.9 | 85.79 | 156 | 0.104 |
| Yb_ppm | 454 | 6.41 | 12.78 | 17.25 | 0.104 |
| Zr_ppm | 454 | 146 | 321.01 | 555 | 0.155 |
| Bi_ppm | 411 | 0.85 | 3.18 | 5.76 | 0.200 |
| Ge_ppm | 411 | 0.26 | 0.48 | 0.76 | 0.257 |
| Se_ppm | 411 | <0.01 | 0.73 | 5 | 1.791 |
| Te_ppm | 411 | 1.13 | 2.79 | 5.35 | 0.200 |
| Tl_ppm | 411 | 17.3 | 153.11 | 232 | 0.235 |
| As_ppm | 411 | 10 | 74.13 | 120 | 0.332 |
| Cd_ppm | 411 | 5.4 | 18.74 | 26.3 | 0.165 |
| Mo_ppm | 411 | 284 | 525.18 | 792 | 0.101 |
| Sb_ppm | 411 | 19 | 43.89 | 60 | 0.127 |
| Li_ppm | 411 | 60 | 147.37 | 340 | 0.199 |
| Ga_ppm | 416 | 25 | 36.89 | 46.1 | 0.082 |
| Hg_ppm | 51 | 0.034 | 0.05 | 0.103 | 0.238 |
| B_ppm | 51 | 80 | 106.47 | 130 | 0.088 |
| F_ppm | 11 | 230 | 299.09 | 420 | 0.209 |
| 7.12.2 | Sediments |
Samples of sediment from 230 box cores were collected for assaying during campaigns C3 and C6. The samples were assayed at either ALS Environmental (in Kelso, Washington, USA) or Western Environmental Testing Laboratory (WETLAB, in Nevada, USA). The results were provided to AMC in a file named “dgr_sediment_chem.xls”. The sample types are described as REG, LAB_DUP_FIELD_DUP and SPIKE. No details of assay methods were provided.
AMC briefly examined the REG samples. There are between 1 and 246 assays, depending on the analyte. Many of the elements analyzed for the nodule samples were not analyzed for the sediment samples. There are also 267 moisture content measurements.
Table 7.12 presents the grades of the sediment samples and the ratio of the grades to the mean grade of the nodule samples, as listed in Table 7.11. The ratios are expressed as percentages. The sediments are enriched in Ba and Ca to approximately 2.5 times the grades in the nodules. Many elements are 10 to 50 times lower in the sediments than in the nodules.
The mean statistics also indicate enrichment in Se but this is due to a single value of 2410 ppm Se recorded in the sample from BC_199. This value is likely to be an analytical or recording error. There is also an extreme value of 70 ppm U from the BC_182 sample which also seems likely to be incorrect.
| amcconsultants.com | 150 |
| Technical Report Summary of Prefeasibility Study of NORI Area D, Clarion Clipperton Zone | |
| TMC the metals company Inc. | 0225054 |
| Table 7.12 | Summary statistics of multielement chemistry of sediment samples from box cores |
| Count | Minimum | Mean | Maximum | CoV | Ratio
of sediment grade to mean nodule grade (%) | |
| Al_ppm | 210 | 15100 | 21574 | 29400 | 0.10 | 101 |
| Ba_ppm | 246 | 7480 | 9804 | 13000 | 0.08 | 247 |
| Ca_ppm | 244 | 5610 | 48348 | 120000 | 0.22 | 275 |
| Co_ppm | 246 | 44 | 68 | 283 | 0.10 | 5 |
| Cr_ppm | 246 | 15 | 22 | 30 | 0.10 | 52 |
| Cu_ppm | 246 | 284 | 469 | 1390 | 0.11 | 4 |
| Fe_ppm | 246 | 22500 | 30552 | 42800 | 0.08 | 46 |
| Mn_ppm | 246 | 3340 | 9561 | 34300 | 0.12 | 3 |
| Ni_ppm | 246 | 132 | 271 | 1450 | 0.13 | 2 |
| P_ppm | 246 | 674 | 1209 | 5350 | 0.10 | 73 |
| Pb_ppm | 246 | 15 | 23 | 61 | 0.08 | 9 |
| Si_ppm | 150 | 830 | 1800 | 4590 | 0.19 | 3 |
| Zn_ppm | 247 | 97 | 141 | 287 | 0.09 | 9 |
| Sr_ppm | 92 | 275 | 480 | 715 | 0.15 | 68 |
| U_ppm | 93 | 0.4 | 1.3 | 70.0 | 0.10 | 33 |
| V_ppm | 245 | 43.7 | 62.1 | 110.0 | 0.08 | 13 |
| Bi_ppm | 91 | 0.4 | 0.6 | 0.9 | 0.10 | 18 |
| Se_ppm | 92 | 0.3 | 26.7 | 2410 | 0.10 | 3650 |
| Te_ppm | 31 | 0.1 | 0.2 | 0.5 | 0.19 | 9 |
| Tl_ppm | 92 | 0.6 | 1.7 | 13.6 | 0.15 | 1 |
| As_ppm | 92 | 6.3 | 9.8 | 19.0 | 0.11 | 13 |
| Cd_ppm | 246 | 0.1 | 0.4 | 1.8 | 0.13 | 2 |
| Mo_ppm | 92 | 4.1 | 10.4 | 52.1 | 0.17 | 2 |
| Sb_ppm | 92 | 0.4 | 0.7 | 2.2 | 0.14 | 2 |
| Hg_ppm | 92 | 0.0 | 0.1 | 0.1 | 0.16 | 115 |
The average moisture content (mass of water/mass of solids+water) of the sediment samples is 76%, compared to 28% for the nodules.
| 7.13 | Analysis of bathymetric data |
Following the initial acquisition of vessel-based MBES data in 2012, the data was reprocessed and reinterpreted several times as new data became available. The new data included high resolution geosurvey acquisition (Campaign 3, 2018), and resource sampling (campaigns 3, 2018; campaigns 6A and 6B, 2019). In 2020, all of the available data was synthesized into a geological framework, from which the footwall and sediment domains which are used in the Mineral Resource estimation were interpreted. These domain interpretations form the foundation for the seafloor slope analysis and geo-obstacle analysis presented in Sections 7.14.2 and 7.14.3 respectively.
Table 7.13 provides a chronological summary of MBES acquisition, processing and analysis throughout the project pipeline to date, with reference to sections within this report where this data has been used or referenced.
| amcconsultants.com | 151 |
| Technical Report Summary of Prefeasibility Study of NORI Area D, Clarion Clipperton Zone | |
| TMC the metals company Inc. | 0225054 |
| Table 7.13 | Chronological summary of MBES acquisition, processing and analysis for NORI Area D. |
| Year | MBES acquisition & processing | MBES Data Analysis | Section & Figure references |
| 2012 | RV Mt. Mitchell – EM120 hull-based MBES acquisition over NORI Area D. Bathymetric and backscatter (beam-averaged) data processed @ 50 m resolution X, Y. | - | Section 7.1. Figure 7.1 |
| 2017 | Reprocessed EM120 Backscatter data as time-series data @ 30 m resolution X, Y. | Data reprocessed and used in target-selection and survey planning for Campaign 3 AUV survey. | Section 7.2.1 Figure 7.2 |
| 2018 | Campaign 3 – AUV survey (combined Side Scan Sonar (SSS), Sub-Bottom Profiler (SBP), EM2040 MBES and camera payloads) and indicated-resource box coring program. | - | Section 7.2.2 Figure 7.4. Table 7.1 |
| 2019 | DSAO survey - 299 line km, MBES @ approximately 285 m swathe, 1 m resolution X, Y. | AUV MBES and Backscatter data was used in conjunction with AUV camera and box core data to develop nodule classification for NORI Area D.
Preliminary detailed-scale geomorphological observations, including hummocky terrain associated with Type 2 & 3 nodule facies. |
Section 7.2.2 Figure 7.4
Section 7.13.2 Figure 7.13 Figure 7.14 Section 7.13.2 Section 7.13.3 |
| 2019 | Collector test survey site – 150 km2 @ 27 cm resolution X, Y, tiled-survey and composite mosaic binned @ 1 m resolution X, Y. | - | Section 7.13.3 |
| 2019 | - | Preliminary analysis of EM120, EM2040 MBES, and AUV SBP and camera data undertaken between box coring campaigns C6A and C6B. This was used to provide tighter control on sample site location following 15 non-recoveries due to hardground substrate encountered during C6A, often associated with steeper terrain. | Section 7.13 |
| 2019 | EM120 MBES data reprocessed to 60 m resolution X, Y. | EM120 bathymetry data reprocessed to provide a cleaner dataset for bathymetric derivatives (e.g. slope, aspect - which are more susceptible to noise artefacts) used in the development of footwall domains for the NORI Area D geological model, and Mineral Resource estimates. | Section 7.13 |
| 2020 | - | NORI Area D geological model - Development of footwall and sediment domain maps. | Section 7.13.1 |
| 2022 | - | Geo-obstacle analysis prior to the test mining, using AUV EM2040 MBES and SBP data | Section 7.13.3 |
| 2023 | - | Seafloor slope analysis | Section 7.13.2 |
| 2023 | - | Geo-obstacle analysis | Section 7.13.3 |
| amcconsultants.com | 152 |
| Technical Report Summary of Prefeasibility Study of NORI Area D, Clarion Clipperton Zone | |
| TMC the metals company Inc. | 0225054 |
| 7.13.1 | Geological domains |
Following completion of Campaign 6A and 6B, a geological model was developed using the geophysical and sampling data:
| · | Sampling data from Campaigns 3, 6A and 6B, including box core land-out GoPro footage. | |
| · | EM120 bathymetry and backscatter data. | |
| · | Bathymetry data was reprocessed as part of this model development to provide a cleaner dataset for bathymetric derivatives (e.g. slope, aspect - which are more susceptible to noise artefacts) used in the modelling and interpretation (see Figure 7.52). | |
| · | Preliminary interpretations of AUV SBP, MBES and camera data undertaken between the end of the Campaign 6A sampling program, and the start of the follow-up 6B sampling program. This was used to provide tighter control on sample site location. | |
| · | During Campaign 6A box coring operations, 15 box core land out sites were characterised by either no recovery by the box core, or very low nodule abundance. Further analysis of EM120 Backscatter, AUV SBP, MBES and camera data from Campaign 3 suggested these sites were characterised by hardgrounds, which appear to show good correlation with slopes of ³ 6° (Figure 7.50 and Figure 7.51). Volcanic outcrop is associated with a slightly boarder range of slope values, upwards of 3°. Figure 7.51 (top insert) shows a Chirp SBP profile located W-E (left to right) across an abyssal hill, with outcropping hardground, characterised by high-amplitude acoustic reflection (centre insert), and large, blocky outcrop material at seafloor (bottom insert). Based on these observations, box core sites for Campaign 6B were selected to avoid areas within 150 m of slopes ³ 6°. This resulted in the number of box core failures being reduced to 7 during C6B. | |
| · | This highlighted the resolution limitations of the EM120 MBES data. Subsequent data integration and analysis during development of the geological model, including box core GoPro land-out footage from campaigns 6A and 6B corroborated the evidence for hardgrounds and was used to develop the footwall domain map (see Figure 7.53). A more detailed description of these domains is provided in Sections 6.4 and 11.5 | |
| · | Box core data from campaigns 6A and 6B was used to refine the nodule facies domain interpretations that were initially developed during Campaign 3. A nodule type domain map for the whole of NORI Area D was developed by integration with a K-means unsupervised classification of EM120 backscatter data (see Figure 7.54). | |
| · | The geological model and associated domain maps provided a framework for the current Mineral Resource estimate. The following two sections provide detail on further development of this model that was undertaken during 2023, with respect to seafloor slope analysis and geo-obstacle identification. |
| amcconsultants.com | 153 |
| Technical Report Summary of Prefeasibility Study of NORI Area D, Clarion Clipperton Zone | |
| TMC the metals company Inc. | 0225054 |
| Figure 7.50 | EM120 bathymetric slope plotted against occurrence of outcropping footwall (hardground), based on SBP, camera and backscatter interpretations (top), and volcanic outcrop occurrence (bottom) |
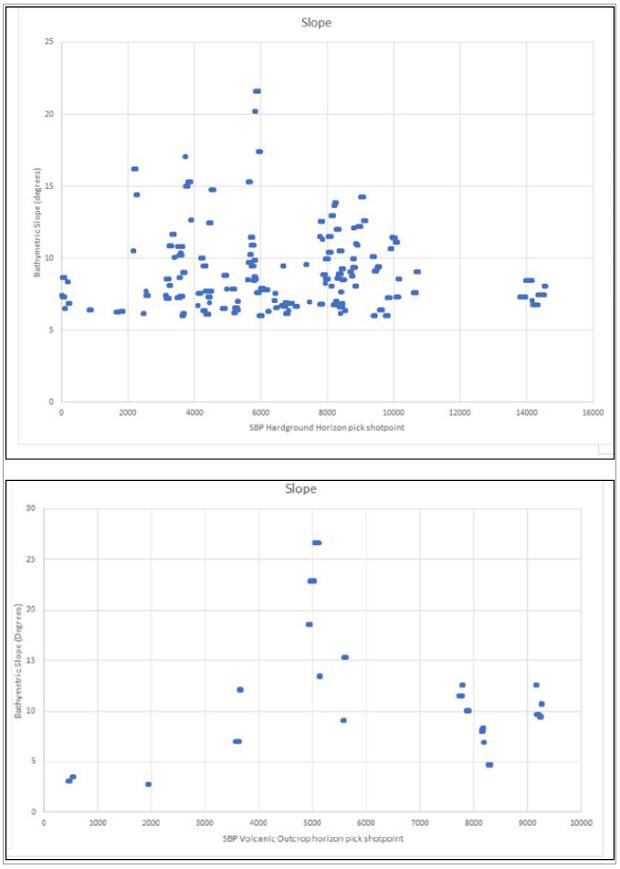
Source: MARGIN
| amcconsultants.com | 154 |
| Technical Report Summary of Prefeasibility Study of NORI Area D, Clarion Clipperton Zone | |
| TMC the metals company Inc. | 0225054 |
| Figure 7.51 | SBP profile and AUV camera transect across outcropping hardground associated with an abyssal hill. |
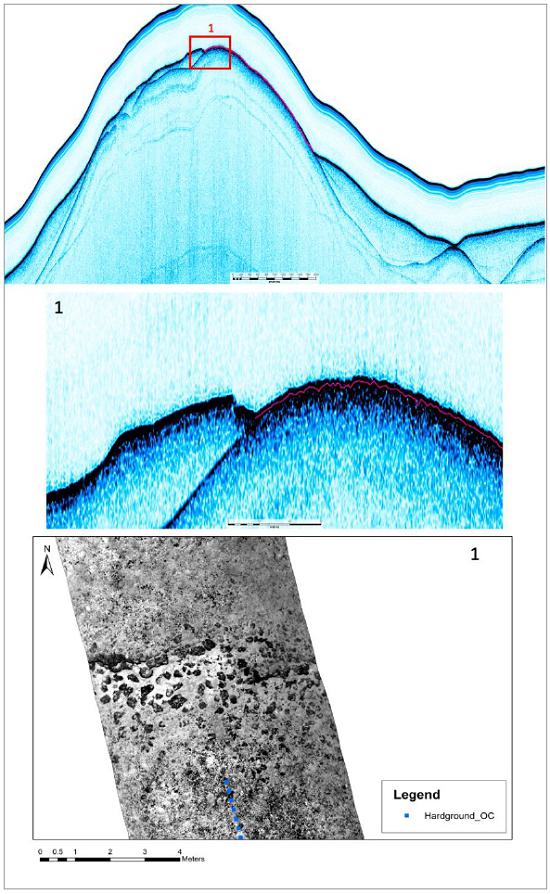
Source: MARGIN
| amcconsultants.com | 155 |
| Technical Report Summary of Prefeasibility Study of NORI Area D, Clarion Clipperton Zone | |
| TMC the metals company Inc. | 0225054 |
| Figure 7.52 | Map of Reprocessed EM120 MBES Slope derivative data |
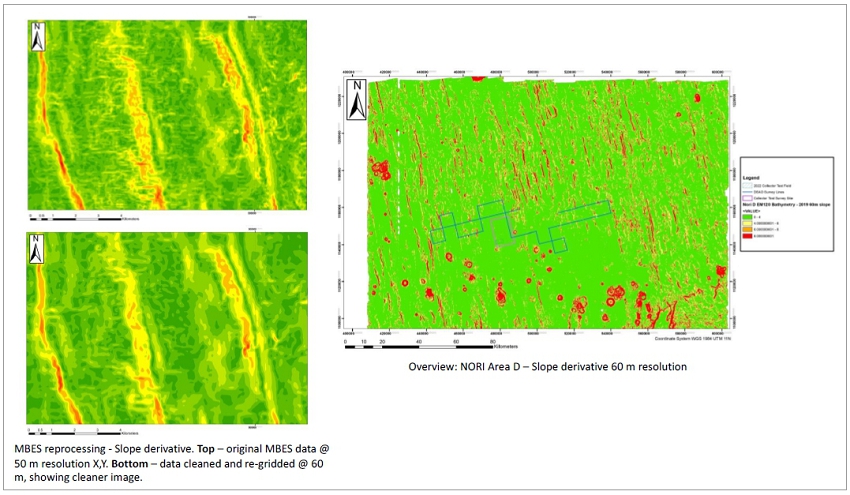
Source: MARGIN
| amcconsultants.com | 156 |
| Technical Report Summary of Prefeasibility Study of NORI Area D, Clarion Clipperton Zone | |
| TMC the metals company Inc. | 0225054 |
| Figure 7.53 | Map of Footwall domains |
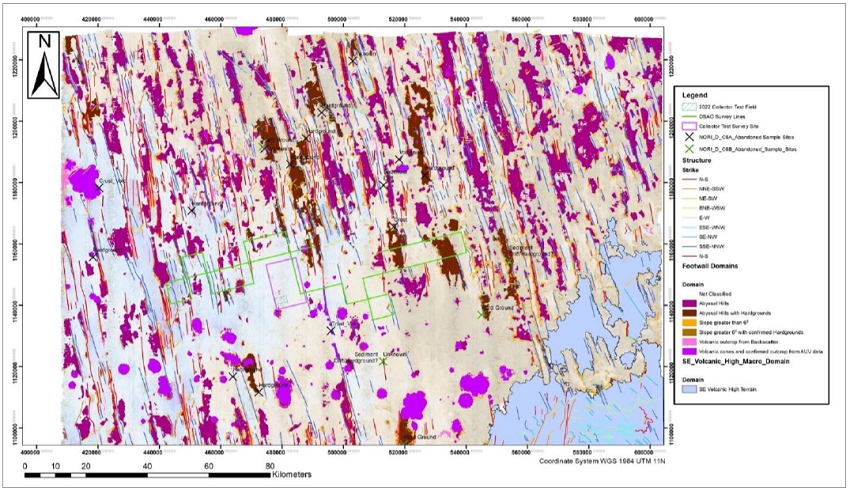
Source: MARGIN
| amcconsultants.com | 157 |
| Technical Report Summary of Prefeasibility Study of NORI Area D, Clarion Clipperton Zone | |
| TMC the metals company Inc. | 0225054 |
| Figure 7.54 | Map of Nodule facies domains produced from backscatter interpretations, plotted with nodule type from box core logging |
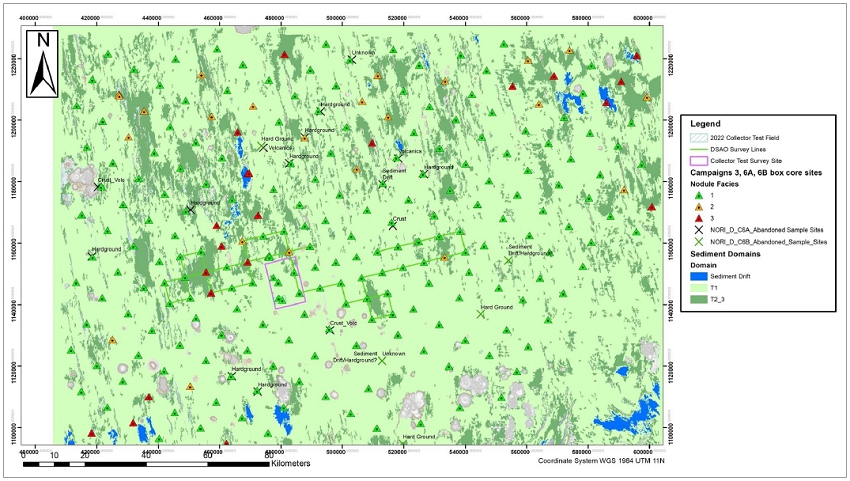
Source: MARGIN
| amcconsultants.com | 158 |
| Technical Report Summary of Prefeasibility Study of NORI Area D, Clarion Clipperton Zone | |
| TMC the metals company Inc. | 0225054 |
| 7.13.2 | Seafloor slopes |
| 7.13.2.1 | Background |
It is anticipated that the seafloor mining system will use collectors with track widths of up to 15 m. This is significantly less than the 60 m resolution (X,Y) of the bathymetric model and slope domain models provided by current EM120 data. Collection of nodules for the initial mining will be focused on a subset of the NORI Area D lease in the south west of the lease and referred to as Project Zero by TMC. Project Zero will focus on mining terrain with 0° to 4° slopes. To identify areas suitable for mining in Project Zero, better definition of areas with slopes > 4°is required.
The existing, higher resolution, AUV MBES datasets do not cover enough of NORI Area D to satisfy all the requirements of planning for the initial mining area. Therefore, a comparison was undertaken between existing AUV EM2040 MBES data and EM120 data to determine whether any significant relationships could be derived so that existing EM120 MBES can be used to predict smaller-scale terrain variability.
A probability model, using a random forest classifier, and associated probability heat-map were developed to differentiate areas more likely to have slopes of 0 to 4° from areas more likely to have slopes > 4°.
| 7.13.2.2 | Observations at different mapping scales (Data resolutions) |
Visual comparison of AUV EM2040 MBES slope derivative data from the DSAO and PRZ survey datasets (1 m resolution in X, Y, and swath width of approximately 285 m versus corresponding EM120 slope derivative data (60 m resolution in X, Y) is illustrated for two common terrain domains encountered within NORI Area D in Figure 7.55 and Figure 7.56. In Figure 7.55, the 60 m resolution EM120 MBES Slope data forms the background of the image. The slope is classified into a 0 to 4° slope class in green and > 4° class in red, with slight transparency. This is overlain by
corresponding AUV EM2040 data with 1 m resolution. This example is located over an abyssal hill, depicted by the steeper slopes shown in red. The higher resolution AUV data shows that steep slopes associated with the abyssal hill flanks at this location extend at least 100 m beyond the extent shown by the EM120 data.
| amcconsultants.com | 159 |
| Technical Report Summary of Prefeasibility Study of NORI Area D, Clarion Clipperton Zone | |
| TMC the metals company Inc. | 0225054 |
| Figure 7.55 | Comparison of EM120 vessel-based MBES and AUV EM2040 MBES over an abyssal hill |
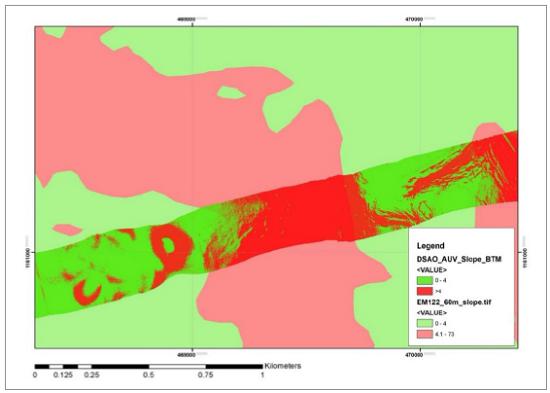
Source: MARGIN
In Figure 7.56 the vessel-based EM120 data shows an almost featureless seafloor topography, associated with an abyssal plain (a valley between two abyssal hills), with slopes of 0 to 4° (in green). However, the higher-resolution EM2040 MBES data shows well-developed hummocky terrain, with slopes locally > 4° (shown in red). This terrain appears to be typically associated with Type 2 and 3 nodule occurrence (see also Figure 7.52, and Figure 7.54).
| Figure 7.56 | Comparison of EM120 vessel-based MBES and AUV EM2040 MBES over hummocky terrain. |
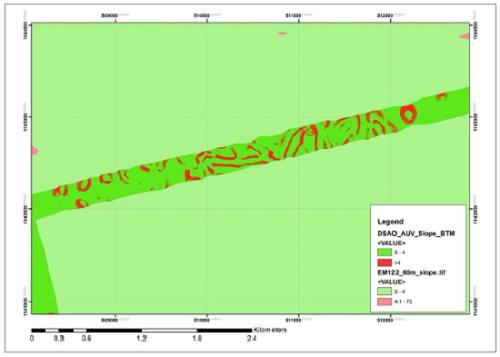
Source: MARGIN
| amcconsultants.com | 160 |
| Technical Report Summary of Prefeasibility Study of NORI Area D, Clarion Clipperton Zone | |
| TMC the metals company Inc. | 0225054 |
| 7.13.2.3 | Slope prediction using EM120 dataset |
A 60 m-spaced grid point dataset (containing EM120 bathymetry, slope, aspect, low-pass filtered (smoothed) backscatter response, footwall and sediment domains) was extracted across the whole of NORI Area D. This resulted in a dataset of 6,681,090 datapoints. The Random Forest Classifier was applied to this dataset, classifying the datapoints into either 1 (= True - predicted 0 to 4° slope), or 0 (= False - predicted > 4° slope). The classified points were imported into ArcGiS. Figure 7.57 shows the slope probability heat-map. Areas in red denote a high probability (0.8 to 1) of encountering slopes of 0 to 4°. The lowest probability (blue) is over abyssal hills and slopes, which are expected to be associated with slopes much greater than 4°. Intermediate probability values (shown in orange and green) are observed between abyssal hills, along the abyssal plain valley floors.
| amcconsultants.com | 161 |
| Technical Report Summary of Prefeasibility Study of NORI Area D, Clarion Clipperton Zone | |
| TMC the metals company Inc. | 0225054 |
| Figure 7.57 | Map of Slope Probability for NORI Area D |
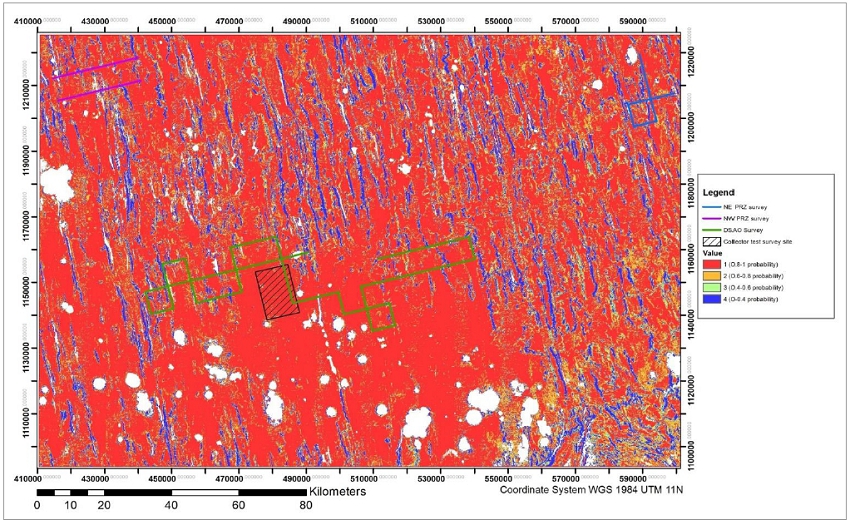
Source: MARGIN
| amcconsultants.com | 162 |
| Technical Report Summary of Prefeasibility Study of NORI Area D, Clarion Clipperton Zone | |
| TMC the metals company Inc. | 0225054 |
Figure 7.58 shows enlarged detail from within Figure 7.57. The upper image shows strong correlation between the slopes greater than 4 mapped by the EM2040, 1 m resolution, AUV data along the DSAO survey lines and the slope prediction probabilities of 0.4 to 0.8. Hummocky ground is observed along the northern DSAO survey line. The lower image shows the same data with the Type 2 and 3 nodule facies, interpreted from the EM120 backscatter data, overlain. A correlation between the hummocky ground and Type 2 and 3 nodule facies is observed.
| Figure 7.58 | Detail of probability map, showing relationship of intermediate slope probability values with Type 2 and 3 nodule distribution and associated hummocky terrain. |
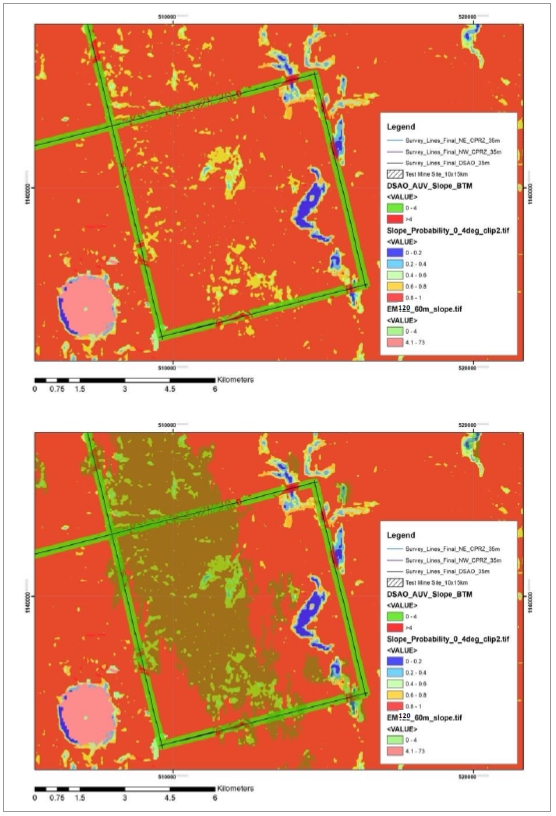
Source: MARGIN
| amcconsultants.com | 163 |
| Technical Report Summary of Prefeasibility Study of NORI Area D, Clarion Clipperton Zone | |
| TMC the metals company Inc. | 0225054 |
| 7.13.2.4 | Summary |
A good regression-based model for predicting slope angle could not be developed with the available data, so a binary classification model was generated using a Random Forest binary classifier. The model was used to predict areas of 0 to 4° slope and >4° slope from EM120 MBES feature sets. The 0 to 4° cut-off and associated model shows that there is potentially a greater area that has > 4° slopes along the flanks of abyssal hills than can be mapped with EM120 alone. Also, within the abyssal plains, there is hummocky topography, which appears to be correlated with Type 2 and 3 nodule facies. The hummocky topography is not readily observable in the EM120 slope data alone and is only seen clearly in the higher-resolution AUV data. The 0 to 4° slope classification clearly shows that in the closely-spaced abyssal hills and valleys in the northern half of NORI Area D, the areas of continuous mineable ground with the 0-4° slope range are likely to be much smaller than in the test mining area.
The distribution of probability values in the heat map (Figure 7.57) indicate that the model appears to perform better near more pronounced, continuous topographic features (e.g. abyssal hills). The model assigns lower probability to features that are less laterally continuous and smaller-scale (e.g. hummocky terrain). Comparison of class-distribution of AUV slope data with EM120 slope for the whole of NORI Area D, split into the same classes, shows that the AUV data appears to be representative of the slope distribution across the whole of NORI Area D. In addition, it is important to note that the model predicts slope, not geomorphic features that may be potential geo-obstacles. Geo-obstacle modelling is presented in the following section.
| 7.13.3 | Geo-obstacles |
| 7.13.3.1 | Background |
A preliminary integrated ground model for the collector test area, NORI Area D, was compiled in August 2022, ahead of the test mining, and was based on analysis of MBES, SBP, and camera data. The model showed seafloor features that could potentially be hazardous for the operation of the seafloor mining system. Five potential geo-obstacle classes were defined. These were all located outside the limits of the 2022 test mining. Most of these features are beyond the resolution-limits of the EM120 regional bathymetry data and are therefore only noticeable in the higher-resolution AUV MBES datasets. These include:
| · | Large-diameter circular depressions | |
| · | Moats | |
| · | Furrows | |
| · | Isolated outcrop | |
| · | Evidence of slope failure processes |
Figure 7.59 shows a map of the test mining site, with the location of the example features (labelled from 1 to 5B) placed around the map. This shows:
| · | Moats (1.) – The example is situated NE of the test mining. These are elongated depressions, often curved or sinuous in nature, and often following the break-of-slope of a higher elevation geomorphic feature. This example is > 100 m in width, approximately 5 m in depth, with > 6° slope, and several km in length. An AUV camera transect over moat-feature shows Type 2 nodules accumulated in base of this feature. | |
| · | Large-diameter circular depressions (2.) - This example is up to 190 m wide, and up to 8 m depth, with > 6° slope. These are often found parallel to abyssal hill flanks, and strike NW-SE, forming the second dominant trend seen in the rose diagram. | |
| · | Furrows (3.) - Furrows are elongate depressions and the majority of those mapped appear to trend ENE-WSW (see associated rose diagram). This example is > 500 m in length, 240 m wide, 4 m deep with > 5° slope encountered along one side. |
| amcconsultants.com | 164 |
| Technical Report Summary of Prefeasibility Study of NORI Area D, Clarion Clipperton Zone | |
| TMC the metals company Inc. | 0225054 |
| · | Isolated outcrop (4.) – This example was mapped from SBP data in the SW corner of the test mining site. It is proximal to volcanic outcrop, and could represent either volcanic outcrop, or lithified sediments. | |
| · | Evidence of slope failure processes (5A. and 5B.) – this was observed in SBP data. Insert 5A in Figure 7.59 shows top break of slope along an abyssal hill with associated outcropping volcanics, showing absence of section near seafloor. Insert 5B shows possible sediment re-deposition at the base-of-slope, with associated out-of-plane reflectors, disruption of seafloor and chaotic internal reflection geometries. |
| amcconsultants.com | 165 |
| Technical Report Summary of Prefeasibility Study of NORI Area D, Clarion Clipperton Zone | |
| TMC the metals company Inc. | 0225054 |
| Figure 7.59 | Map of collector test survey site and test mining site, showing location of type-examples of geo-obstacles |
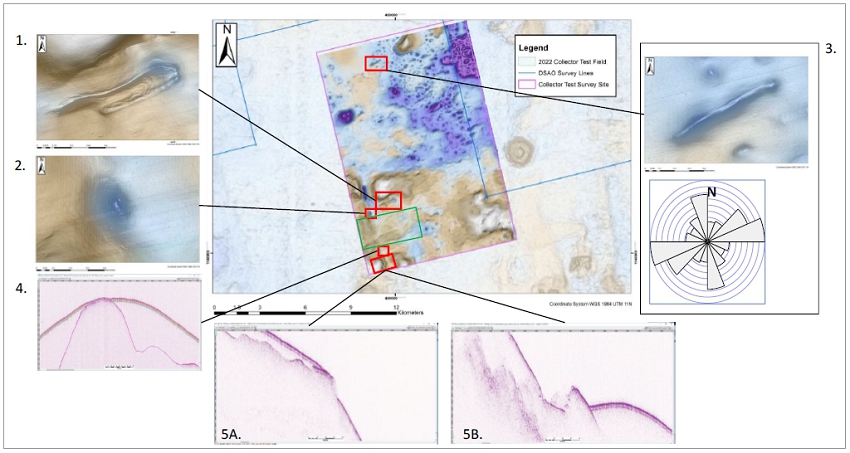
| amcconsultants.com | 166 |
| Technical Report Summary of Prefeasibility Study of NORI Area D, Clarion Clipperton Zone | |
| TMC the metals company Inc. | 0225054 |
| 7.13.3.2 | Geo obstacle mapping |
Of the five geo-obstacle classes identified during development of the preliminary integrated ground model, only three (large-diameter circular depressions, moats, and furrows) have significant occurrence within the 10 km x 15 km Test Mining site. The focus of the analysis presented in this section was to extend the mapping of these three geo-obstacle classes across the remainder of the initial mining area outside of the Test Mining site and classify morphology, and quantify their distribution and dimensions7. Most of these features are beyond the resolution-limits of the EM120 regional bathymetry data and are therefore only noticeable in the higher-resolution AUV MBES and backscatter datasets. A predictive model was therefore developed to map the probability of these features occurring. This was based on testing for spatial relationships with larger-scale geological features, which may potentially exhibit some control on the geo-obstacle formation and distribution. The model relies on EM120 MBES data derivatives and interpretations, as this is currently the only dataset with regional distribution across NORI Area D.
The method draws on previous studies conducted as part of the geological model development, including:
| · | Footwall domaining. | |
| · | Sediment (nodule type domaining). | |
| · | Structural mapping (based on EM120 MBES data). |
The first step in the adopted methodology was to automatically detect the geo-obstacles in the AUV bathymetry data, rather than adopt the manual interpretation approach used for the preliminary integrated ground model mapping. A number of derivatives were produced from the 1 m-resolution EM2040 AUV data for the test mining survey area, to see which combinations best characterize all of the topographic depressions noted. These included:
| · | Slope - is the angle of inclination to the horizontal. | |
| · | Aspect - is the compass direction that a slope faces. Pixels will have a value from 0 to 360° measured in degrees from north indicating the azimuth of the direction of maximum slope. | |
| · | Terrain Ruggedness Index - is defined as the mean difference between a central pixel and its surrounding cell. | |
| · | Curvature - expresses the amount by which the surface deviates from being a plane. | |
| · | Bi-directional hillshading – is where a lighting effect is added to a map based on elevation variations within the landscape and provides a clearer picture of topography by mimicking the sun's effects (illumination, shading and shadows) on topography. Bi-directional hillshading combines two illumination angles, the second from a perpendicular direction. | |
| · | Bathymetric Position Index (BPI) is a measure of where a referenced location is relative to the locations surrounding it. It is created through a neighborhood analysis function. Positive cell values within a BPI data set denote features and regions that are higher than the surrounding area and negative cell values within a BPI data set denote features and regions that are lower than the surrounding area. |
Slope, bi-directional hillshading and BPI were found to be the most useful derivatives and were used further in the analysis (Figure 7.60).
Utilizing slope, BPI, and two bi-directional hillshade derivatives, two non-supervised, dimension-reduction, image processing methods were applied – K-Means and Principal Component Analysis (PCA). The K-means algorithm divides the observations into K groups by minimizing the variances between data points and the K group centroids. Data points with similar multivariate characteristics are labelled as a group. PCA takes a large data set with many variables and reduces it to a smaller set of new uncorrelated indices that retain most of the information from the original variables. These methods make it easier to visualize and analyze the data.
| 7 | Isolated outcrops and slope failure processes are currently considered to be limited to the flanks of volcanic cones or abyssal hills, both typically with >6° slopes, and currently excluded as potential mineable ground. |
| amcconsultants.com | 167 |
| Technical Report Summary of Prefeasibility Study of NORI Area D, Clarion Clipperton Zone | |
| TMC the metals company Inc. | 0225054 |
| Figure 7.60 | Bathymetric derivatives |
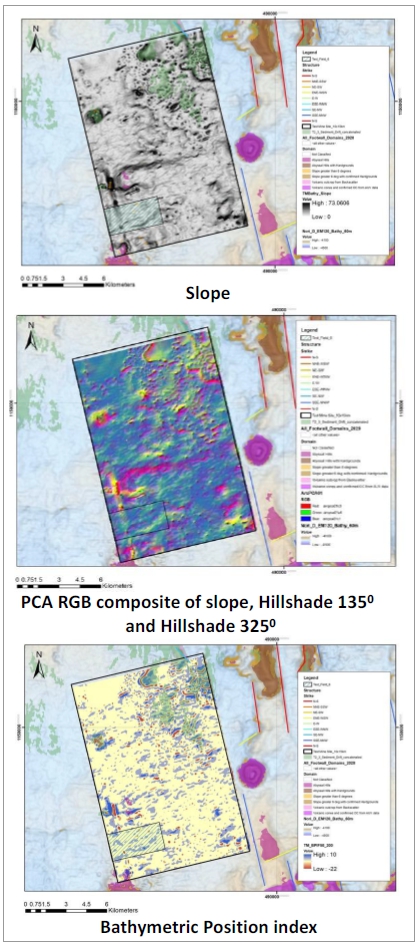
Source: MARGIN
| amcconsultants.com | 168 |
| Technical Report Summary of Prefeasibility Study of NORI Area D, Clarion Clipperton Zone | |
| TMC the metals company Inc. | 0225054 |
The PCA produced the most useful imagery of the two methods. The center image in Figure 7.60 shows the PCA RGB false-color composite of Slope, Hillshade 135°, and Hillshade 325°. Topographic depressions are visually well-highlighted. In addition, three broader-scale topographic (structural) trends are shown, related to regional trends mapped in the 2020 NORI Area D geological model:
| · | Along the abyssal hill trend - NNW-SSE. | |
| · | Along an ENE-WSW trend. | |
| · | Along a trend which appears to be associated with the volcanic cone trend (NW-SE). |
Visual comparison of all the attributes showed good agreement with topographic lows detected in the finest-scale BPI derivative, and so this was ultimately used to produce bounding-polygons for the depression features8.
A total of 525 depression features were identified within the test mining survey area (Figure 7.62). Very small features were trimmed from the data set using an areal extent threshold of ≧ 14 m2. Most of the features smaller than this can be considered as noise. The filtered dataset is considered likely to be more meaningful in the context of assessing mining-scale geo-obstacles and significantly reduced the visualization and computation time in the following analysis.
Area, depth, slope, aspect ratio, and trend (in cardinal degrees) were extracted for each depression feature. The slope-derivative filtering process can accentuate noise in the MBES data. This can lead to individual, or smaller clusters of high-slope pixel values being preserved within a detected depression-feature, which can lead to false-anomalies when selecting depression-features based on their slope values. The focal statistics method was used to overcome this issue. The mean slope value of a 15 x 15 m kernel was used to extract the associated mean-slope focal statistic, based on an 11 x 15 m vehicle footprint. This This significantly reduced the isolated > 4° pixels, and preserves areas of interconnected, more spatially continuous slopes of > 4°, shown in red (compare Figure 7.61 (left insert) which shows an example of a detected depression (circled in yellow) with no continuous high-slope values, and the focal statistics data (right insert).
| Figure 7.61 | Comparison of 1 m resolution slope attribute (left) with focal statistic slope, based on a 15 x 15 m focal statistic kernel |
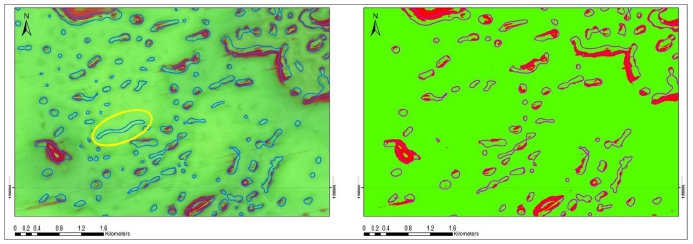
Source: MARGIN
| 8 | Although this approach was satisfactory for the small dataset used, future implementation with larger datasets will likely benefit from adoption of a deep learning (textural image texture segmentation) approach. |
| amcconsultants.com | 169 |
| Technical Report Summary of Prefeasibility Study of NORI Area D, Clarion Clipperton Zone | |
| TMC the metals company Inc. | 0225054 |
| Figure 7.62 | Geo-obstacle depression features detected within the collector test survey area |
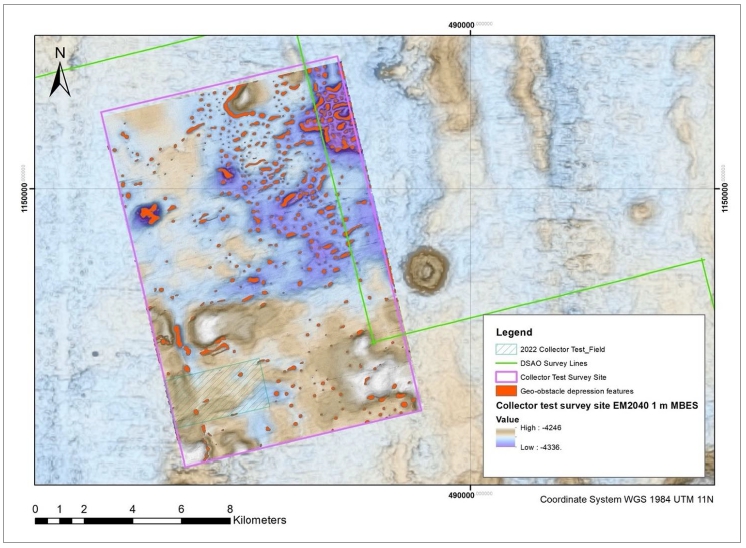
Source: MARGIN
In addition to the 525 geo-obstacle datapoints from the test mining survey area, an additional 503 geo-obstacle datapoints were added from the adjacent DSAO survey data (increasing the dataset to a total of 1,028) - see Figure 7.63.
| amcconsultants.com | 170 |
| Technical Report Summary of Prefeasibility Study of NORI Area D, Clarion Clipperton Zone | |
| TMC the metals company Inc. | 0225054 |
| Figure 7.63 | Geo-obstacle data points – including data from collector test survey site and DSAO survey |
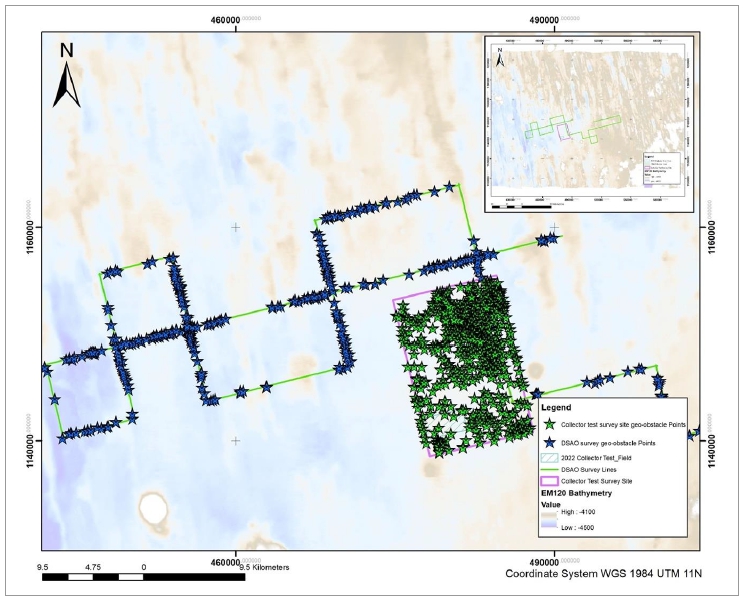
| 7.13.3.3 | Geo-obstacle probability model mapping |
A predictive model was developed to examine possible spatial relationships between geo-obstacle occurrence and associated larger-scale geological features (potential controls on geo-obstacle occurrence). Only the geological domains which have been mapped to date, using the EM120, were used in this analysis. The approach does not enable identification of geological controls which have not been identified or mapped. The following geological domains were considered as the feature sets for this analysis:
| · | Abyssal Hills |
| · | Abyssal Hill hardgrounds |
| · | Volcanic cones |
| · | Type 2 and 3 nodule facies |
| · | Structural lineations (mapped from bathymetry) |
| · | Slopes > 4˚ |
| amcconsultants.com | 171 |
| Technical Report Summary of Prefeasibility Study of NORI Area D, Clarion Clipperton Zone | |
| TMC the metals company Inc. | 0225054 |
The influence of the feature sets were modelled through creation of proximity rasters for each geological domain, based on Euclidean distance9.
It is postulated that geo-obstacles on the seafloor may have the potential to impact on collector performance and are therefore an important consideration when developing mine-planning models. The current collector operational constraints were used to set a geo-obstacle cut-off threshold of features > 2 m in diameter, with maximum slopes > 4°, and height range of > 0.3 m. An initial Random Forest binary classification model was developed in 2023, using the 1,028 geo-obstacle data points for the training, test and validation datasets, where Class 1 = geo-obstacles fitting the cut-off criteria (i.e. may have an impact on collector performance), and Class 0 = geo-obstacles smaller than cut-off criteria (i.e. unlikely to influence collector performance). The closer the proximity of a geo-obstacle datapoint to the domain, and whether it encodes the information needed to discriminate between Class 0 and Class 1 - the greater the influence of that feature set (domain).
| 7.13.3.4 | Model calibration and improvement |
During Campaign 8B, 2024, TMC undertook additional detailed-scale AUV mapping along two proposed production runs (runs 19 & 20) within the proposed Initial Mining Area. Geo-obstacle mapping from this dataset was used to evaluate the performance of the geo-obstacle probability model against new data. This showed there was overall good visual correlation between actual depressions mapped and the probability model. Further analysis of the data shows that the percentage distribution breakdown of mapped depressions is:
| · | Class 1 (red) – Geo-obstacle probability > 0.75: 10% | |
| · | Class 2 (yellow) – Geo-obstacle probability > 0.5 - ≤ 0.75: 64% | |
| · | Class 3 (turquoise) – Geo-obstacle probability > 0.25 - ≤ 0.5: 24% | |
| · | Class 4 (purple) – Geo-obstacle probability ≤ 0.25: 2% |
74% of depressions mapped with Allseas cut-off limits applied fall within > 0.5 probability range (above random probability).
Additionally, mapped slopes > 4° outside geo-obstacle depression features identified were then also compared to the geo-obstacle probability model. The percentage distribution breakdown of slopes > 4° vs. the geo-obstacle probability model is:
| · | Class 1 (red) – Geo-obstacle probability > 0.75: 11% | |
| · | Class 2 (yellow) – Geo-obstacle probability > 0.5 - ≤ 0.75: 64% | |
| · | Class 3 (turquoise) – Geo-obstacle probability > 0.25 - ≤ 0.5: 24% | |
| · | Class 4 (purple) – Geo-obstacle probability ≤ 0.25: 1% |
75% of slopes > 4° mapped fall within > 0.5 probability range (above random probability). The geo-obstacle probability model is therefore additionally able to predict the probability of slopes > 4° outside geo-obstacle depression features occurring (i.e. slopes associated with hummocky terrain in the abyssal valleys). Based on the outcomes of the probability model comparisons, the geo-obstacle probability model was adopted for predicting both geo-obstacles and slopes > 4°.
| 9 | The proximity rasters were generated using the ArcGIS spatial analyst toolbox. The distance values of each to each domain was extracted for each geo-obstacle data point using the ‘extract multi values to point’ ArcGIS spatial analyst toolbox. |
| amcconsultants.com | 172 |
| Technical Report Summary of Prefeasibility Study of NORI Area D, Clarion Clipperton Zone | |
| TMC the metals company Inc. | 0225054 |
One of the aims of the Campaign 8B mapping study was to compare the mapping outcomes against the 2023 geo-obstacle and slope prediction models, in order to assess the performance of these predictions, and assess what confidence levels they can provide for future mine-planning scenarios and mine-scale geosurvey planning.
The northernmost extent of the Campaign 8B survey provides a detailed mine-scale window into the terrain expected within the well-developed ridge-and-valley topography formed by the abyssal hills and abyssal valleys that are more typical of the northern half of NORI Area D (Figure 7.57). Geological interpretation and geo-obstacle mapping of this dataset identified an additional 843 geo-obstacle data points. These were subsequently added to the initial 1,028 geo-obstacle data set, and the probability model was further refined. The resultant geo-obstacle probability heat map (see Figure 7.64 and Figure 7.65) and associated geospatial database were used as input to the Modifying Factors described in Section 12.2.4.
| amcconsultants.com | 173 |
| Technical Report Summary of Prefeasibility Study of NORI Area D, Clarion Clipperton Zone | |
| TMC the metals company Inc. | 0225054 |
| Figure 7.64 | Geo-obstacle probability heat map |
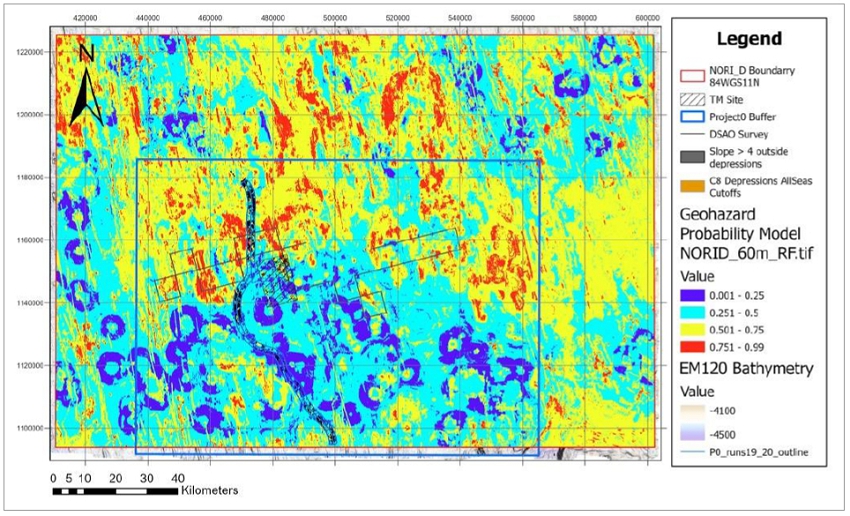
Source: MARGIN
| amcconsultants.com | 174 |
| Technical Report Summary of Prefeasibility Study of NORI Area D, Clarion Clipperton Zone | |
| TMC the metals company Inc. | 0225054 |
| Figure 7.65 | Detail of the northern end of the Campaign 8B survey, showing geo-obstacle mapping |
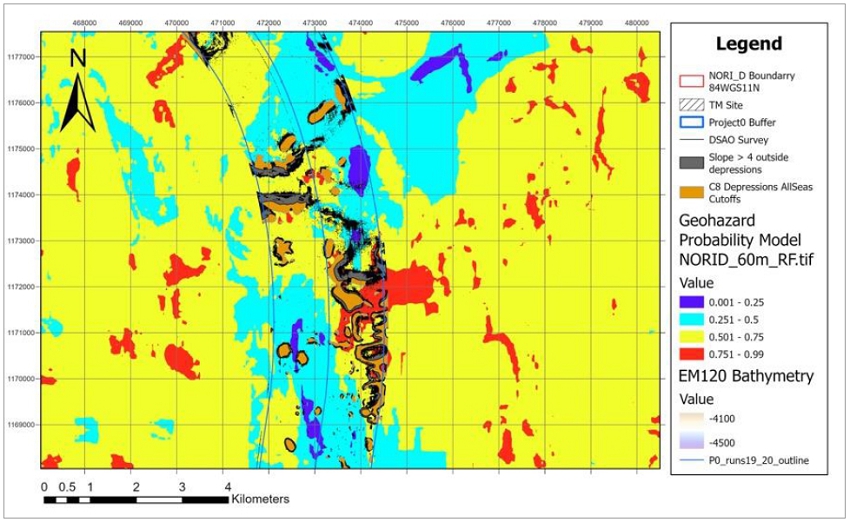
Source: MARGIN. Note: Map shows geo-obstacle mapping (slopes > 40 and geo-obstacle features > 2 m in diameter, with maximum slopes > 4°, and height range of > 0.3 m). This is overlain over the geo-obstacle probability heat map. Warm colours show where high-probability of geo-obstacles are predicted to occur, and cold colours show where low-probability of geo-obstacles are predicted to occur.
| amcconsultants.com | 175 |
| Technical Report Summary of Prefeasibility Study of NORI Area D, Clarion Clipperton Zone | |
| TMC the metals company Inc. | 0225054 |
| 7.14 | Analysis of geotechnical data |
| 7.14.1 | Data collection campaigns |
Geotechnical soils data was systematically collected across the NORI Area D site during campaigns C3, C6 and C7. Geotechnical data was collected from box core tests and samples, and in situ testing. Details of the fieldwork are provided in preceding sections of this report.
The Campaign 3 (C3) data was collected by Fugro USA Marine Inc. (Fugro) onboard the vessel AHT Maersk Launcher between April and June 2018. In total 43 box cores were collected and geotechnically investigated using sub-sample cores taken from the box core seabed sample. The cores provided a cross section through the box core for offshore and onshore laboratory testing.
The Campaign 6 (C6) data was collected by Bluefield Geoservices Ltd (Bluefield) onboard the vessel AHT Maersk Launcher between August and October 2019 (C6A) and November and December 2019 (C6B). In total 211 box cores recovered samples and were geotechnically investigated using on deck in situ testing techniques directly into the box core sample, and three (3) sub-sample cores taken from each box core. One sub-sample was photographed, logged and tested offshore and two (2) sub-samples were retained for onshore laboratory testing and storage. The geotechnical testing and sub-sample coring were conducted after the removal of the nodules from the box core surface. Soil disturbance from the nodule removal is evident in the Campaign 6 data in the upper layer. Additionally, nine (9) gravity cores with successful recoveries between 1.00 m and 2.95 m were geotechnically logged and stored for onshore testing.
The Campaign 7 (C7) data was collected by Bluefield onboard the vessel Island Pride between July and September 2022 (C7A) and November to December 2022 (C7B). In total 47 box cores were collected with recoveries up to 0.52 m below seafloor. These samples were geotechnically investigated using testing techniques applied directly to the box core samples and sub-sample cores taken from the box core sample and tested offshore. These tests and sampling were conducted before the nodules were removed from the box cores. No samples were retained for onshore laboratory testing and storage. In conjunction with the box core samples, seabed in situ CPT testing was conducted using an ROV. A total of 57 in situ CPTs (27 C7A and 30 C7B) were completed to 2 m below seafloor. Samples and tests conducted during Campaign 7A were pre collector test, and during Campaign 7B post collector test.
All box core samples were recovered for multi-disciplinary work, including geological assessment of the nodule type and abundance, and environmental monitoring. In some cases, this had an impact on the geotechnical testing and has been noted where relevant.
Figure 7.64 gives an overview of NORI Area D and the positions of geotechnical samples. Figure 7.65 shows the detail covering the collector Test Area. Further details of the sample and in situ test locations are provided in Sections 7.2.8, 7.3.4 and 7.5.4.
| amcconsultants.com | 176 |
| Technical Report Summary of Prefeasibility Study of NORI Area D, Clarion Clipperton Zone | |
| TMC the metals company Inc. | 0225054 |
| Figure 7.66 | Overview of NORI Area D with geotechnical sample locations |
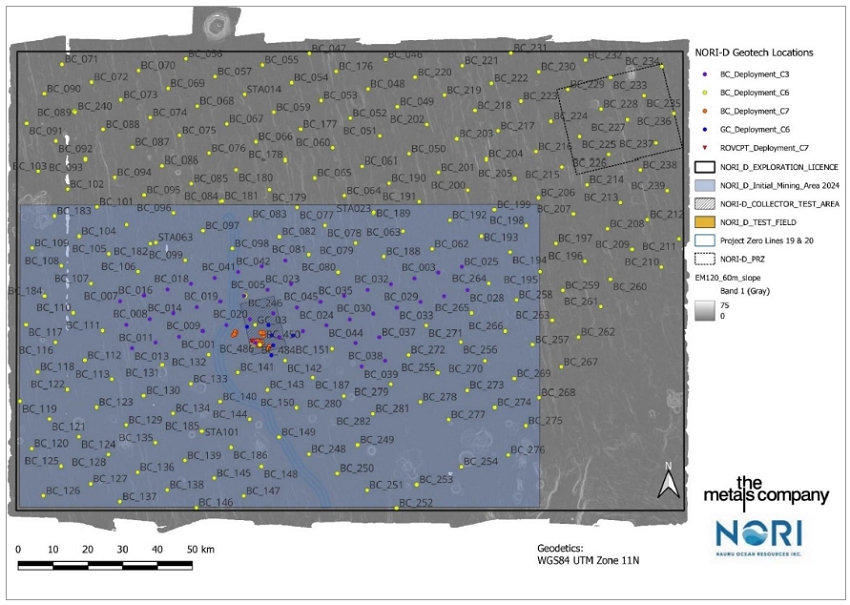
Source: APYS
| amcconsultants.com | 177 |
| Technical Report Summary of Prefeasibility Study of NORI Area D, Clarion Clipperton Zone | |
| TMC the metals company Inc. | 0225054 |
| Figure 7.67 | NORI Area D collector Test Area with geotechnical locations |
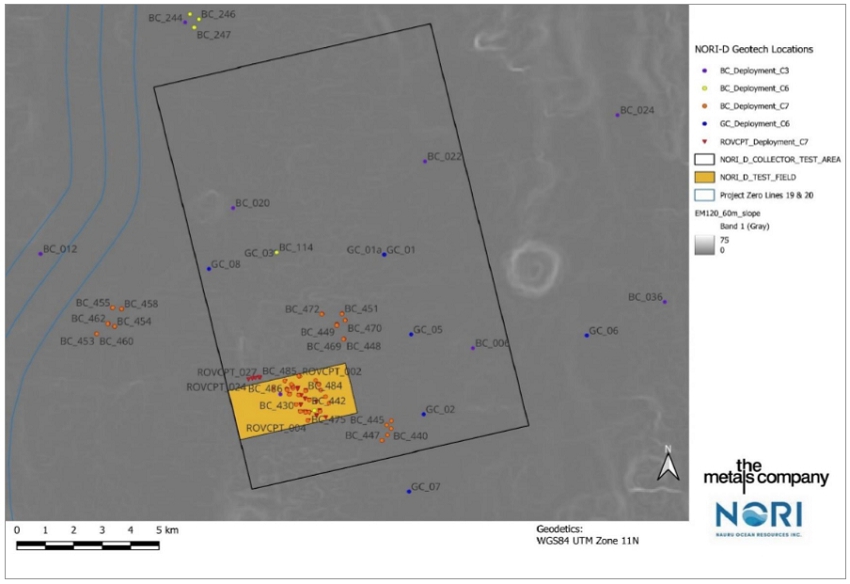
Source: APYS
| amcconsultants.com | 178 |
| Technical Report Summary of Prefeasibility Study of NORI Area D, Clarion Clipperton Zone | |
| TMC the metals company Inc. | 0225054 |
| 7.14.2 | Geotechnical soils summary |
An assessment of the soils across the NORI Area D area has been made based on observations from the fieldwork and onshore laboratory testing reports. All available seafloor data from Campaign 3, Campaign 6 and Campaign 7 were incorporated. A generalized geotechnical classification with summary strength ranges is provided in Table 7.14.
This is based on the site-wide box core and gravity core results from Campaign 6 and cross referenced to the results from Campaign 3 and Campaign 7.
The Campaign 3 and Campaign 6 geotechnical testing across the general site were conducted in box cores primarily allocated for nodule collection and environmental testing, no seabed feature was targeted and therefore the general soil conditions may have variations at features not yet investigated.
In general terms the seafloor across NORI Area D can be classified as a silty clay, that in parts is very silty and sometimes more like a silt. There are exceptions to this classification associated with depressions or high areas of seafloor such as ridge lines, abyssal hills and volcanic features.
| Table 7.14 | NORI Area D summary geotechnical soil classification |
| Unit | Soil Description | Top
Depth (mbsf) |
Thickness (m) |
Typical
Su (kPa) |
Frequency | Comments |
| Unit 1 | Very soft dark brown silty clay / clayey silt (Semi-liquid) |
0.00 | 0.05 - 0.16 | 0.5 – 4.0 | Across the site | C3 reports describe the immediate surface as ‘Semi-liquid’, whilst the C6A/B reports describe the same material as (Hemi)pelagic drape |
| Unit 2 | Very soft yellowish brown silty clay, often mottled dark brown* | 0.05 – 0.16 | 0.45 – 1.10+ | 3.0 – 10.0 | Across most of the site | Mottling indicative of bioturbation and incorporation of Unit 1 material |
| Unit 2a | Very soft to soft brownish grey very silty clay | 0.05 – 0.10 | Undefined | 4.0 – 14.0 | Rare | Found in place of Unit 2. Generally associated with reduced BC recovery, ridges, and higher ground. |
| Unit 3 | Very soft dark yellowish brown silty clay, mottled dark brown | 0.60 – 1.20 | >1.40 m | 1.5 – 5.0 | Recorded at all locations samples obtained at depth | Possibly trending towards normally consolidated based on the seabed CPT and gravity core results |
* Variations recorded in the color descriptions which appear from the data to have no effect on the soil material properties.
Further seafloor investigation during Campaign 7 was conducted in the Test Mining area. This focused on high-definition characterization of the upper 0.50 m of the seafloor using box core data and deeper classification using seabed CPT investigation. The results did not contradict the previous site investigations. The Test Mining area is consistently similar in composition and less complex than the NORI Area D overall area, due to the smaller area and the dominance of the flat geoform domain.
Seafloor CPT is a direct in situ test of the seabed soils and can be considered an undisturbed form of testing. An ROV-deployed CPT system (Bluefield ROVcone) equipped with a full-scale CPT cone was used to conduct the tests. The CPT system was used to characterize the seabed soils from seabed down to 2.00 m penetration depth. Tests were conducted prior to collector testing to provide a comparison with geotechnical data collected from the box core samples.
| amcconsultants.com | 179 |
| Technical Report Summary of Prefeasibility Study of NORI Area D, Clarion Clipperton Zone | |
| TMC the metals company Inc. | 0225054 |
| 7.14.3 | Shear strength |
Shear strength measurements have been recorded directly from the box core samples recovered to deck during Campaign 3, Campaign 6 and Campaign 7. This testing recorded a range of seabed strength across the NORI Area D site. The method of shear strength measurement included Torvane in the split cores in the vertical plane, and Laboratory (mini) Vane directly into the box core in the horizontal plane. Figure 7.68 to Figure 7.70 illustrate the range of maximum shear strength measured by the laboratory vane test across the NORI Area D site, grouped by layer.
The data has been split with Campaign 3 and Campaign 7 grouped as data recorded with the nodules in place during testing and Campaign 6 shown separately as nodules removed prior to testing. The removal of the nodules prior to testing caused disturbance in the upper layer of the samples.
| amcconsultants.com | 180 |
| Technical Report Summary of Prefeasibility Study of NORI Area D, Clarion Clipperton Zone | |
| TMC the metals company Inc. | 0225054 |
| Figure 7.68 | NORI Area D maximum measured shear strength (Su kPa by Laboratory Vane) 0.00 to 0.10 m depth |
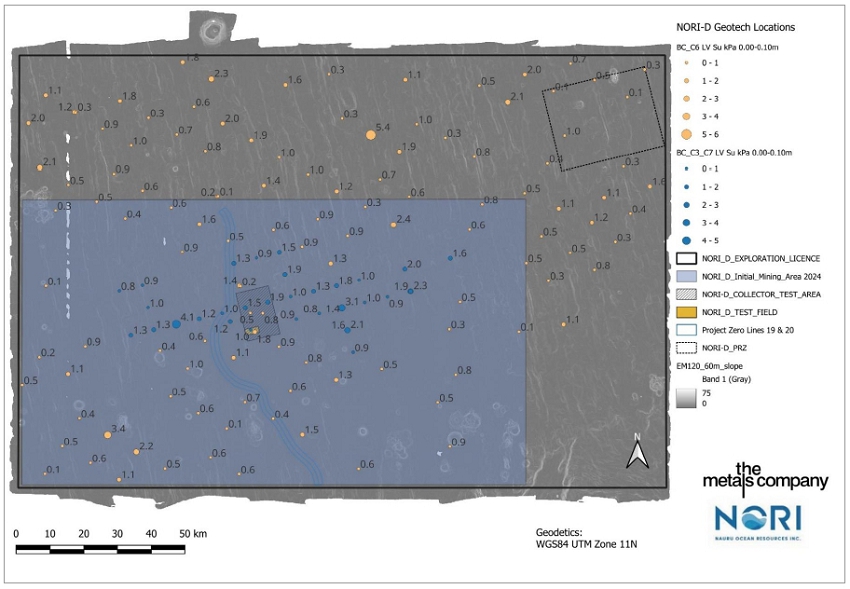
Source: APYS
| amcconsultants.com | 181 |
| Technical Report Summary of Prefeasibility Study of NORI Area D, Clarion Clipperton Zone | |
| TMC the metals company Inc. | 0225054 |
| Figure 7.69 | NORI Area D maximum measured shear strength (Su kPa Laboratory Vane) 0.11 to 0.15 m depth |
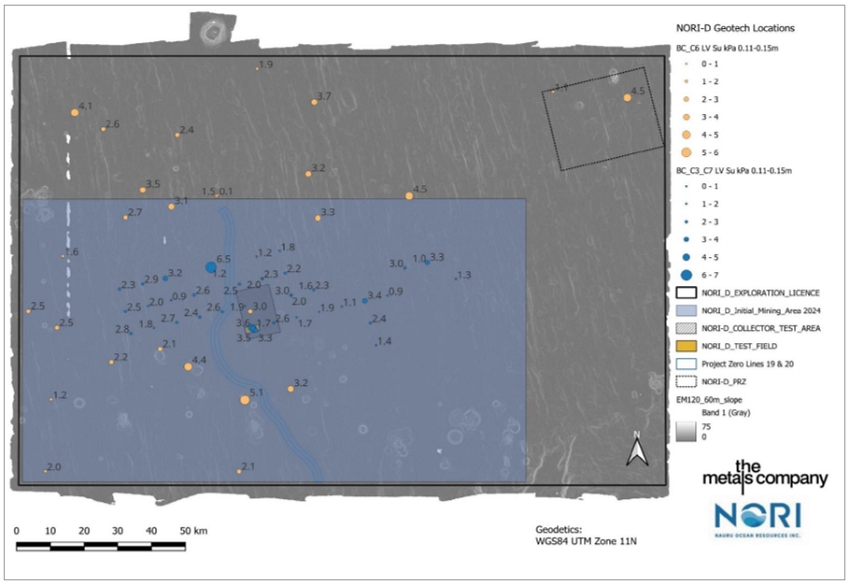
Source: APYS
| amcconsultants.com | 182 |
| Technical Report Summary of Prefeasibility Study of NORI Area D, Clarion Clipperton Zone | |
| TMC the metals company Inc. | 0225054 |
| Figure 7.70 | NORI Area D maximum measured shear strength (Su kPa Laboratory Vane) 0.15 to 0.45 m depth |
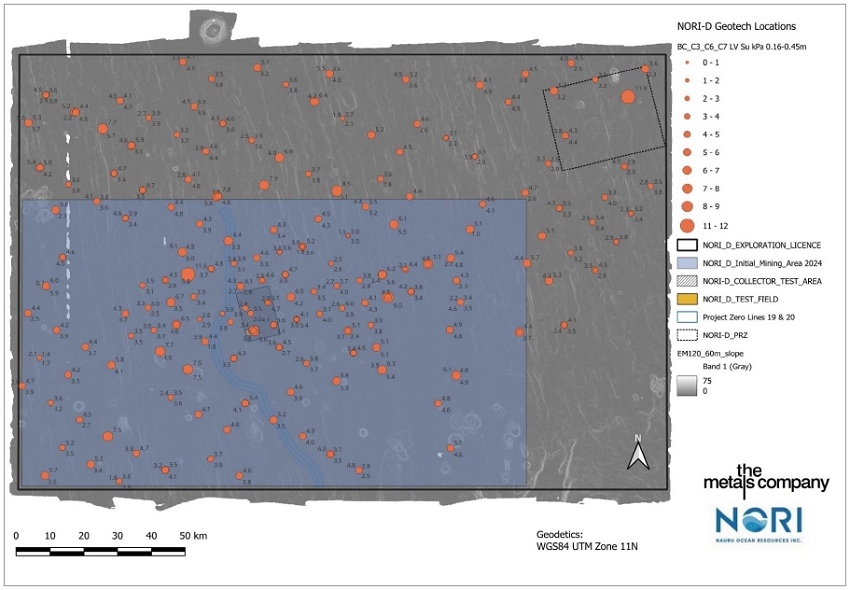
Source: APYS
| amcconsultants.com | 183 |
| Technical Report Summary of Prefeasibility Study of NORI Area D, Clarion Clipperton Zone | |
| TMC the metals company Inc. | 0225054 |
Figure 7.71 shows the variation by depth of the measured values undisturbed undrained shear strength from sediment samples taken within the proposed Initial Mining Area.
| Figure 7.71 | Initial Mining Area measured undrained shear strength by depth |
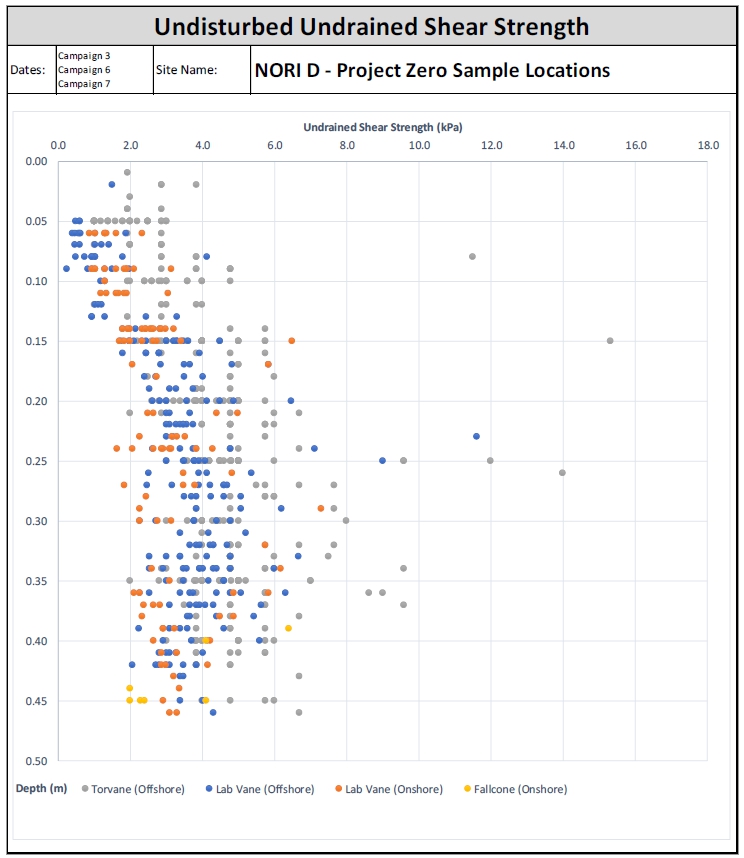
Source: APYS P0 Geotech Report
| amcconsultants.com | 184 |
| Technical Report Summary of Prefeasibility Study of NORI Area D, Clarion Clipperton Zone | |
| TMC the metals company Inc. | 0225054 |
| 7.14.4 | Soil classification |
Soil classification using particle size distribution data alone indicates the presence of greater than 20% clay sized minerals for all soil units, which would generally indicate that the primary soil type is classified as clay. The magnitude of the silt-sized fraction indicates a description ranging from silty to very silty clay.
However, using plasticity data from Campaign 3 and Campaign 6 the results indicate that the soil classifies as very high plasticity clay and silt respectively. The Campaign 3 investigation used the Casagrande method10 for determining Plastic Limit, whereas for Campaign 6 the 4-point Fall Cone method11 was used.
Results from a prior geotechnical investigation at the site (C3) classified the soils as primary soil type clay. Onshore lab testing for the C3 samples indicated Plastic Limit index results significantly higher than C6. Liquid Limit index was very similar for both campaigns.
To further investigate the matter, a limited set of X-ray diffraction testing was completed to determine the soil mineralogy. These results confirm the presence of around 20% clay mineral content, primarily illite, with some smectite and lesser quantity of kaolinite. In terms of classification this does not conclusively indicate whether the soils will behave as a clay or a silt.
| 7.14.5 | Variation in seafloor soil measurements |
The seafloor soils are extremely sensitive, any sampling process will have disturbed the soils to some extent. The box core is a shallow penetration seabed sampling system designed to recover a cube of relatively undisturbed seabed sediment in soft soil conditions12, as found on the NORI Area D site.
A comparison between the shear strength profiles generated from the Campaign 6 box core CPT and the profiles generated from the Campaign 7 seafloor in situ CPT indicates a difference in the upper 0.20 m of data. The Campaign 6 box cores are between 0.5 and 2 kPa lower than the in situ CPT seafloor profiles. The box core CPT profiles collected during Campaign 7 do not show the same degree of strength reduction. During Campaign 6 geotechnical data was collected after nodule removal from the surface of the box core, whilst Campaign 7 geotechnical data was collected with the nodules in place. This difference suggests that the primary mechanism for the reduction in strength is the nodule removal process. The effect of the recovery of the sample through the water column to deck, and dissolved gas coming out of solution in the pore water with the change in hydrostatic pressure has also to be considered for box core samples from all campaigns.
Figure 7.72 presents an overlay of the C7 in situ seafloor CPT with the selected Campaign 6 and Campaign 7 box core CPT profiles within proximity and the same seafloor domain. This plot illustrates the apparent lower readings from the C6 box cores in the upper layer (unit 1).
Seafloor conditions derived from seabed CPT readings indicate that the seafloor conditions are firmer than anticipated from the box core measurements obtained during Campaign 6. This was also observed in the behavior of the seafloor collector, which performed locomotive tasks at the top end of expectations.
| 10 | ASTM D4318-17 |
| 11 | BS EN ISO 17892-12:2018 |
| 12 | ISO 19901-8:2015: Box core system recommended for very soft to soft clay |
| amcconsultants.com | 185 |
| Technical Report Summary of Prefeasibility Study of NORI Area D, Clarion Clipperton Zone | |
| TMC the metals company Inc. | 0225054 |
| Figure 7.72 | Overlay of in situ seafloor CPT and in Box Core CPT Profiles13 |
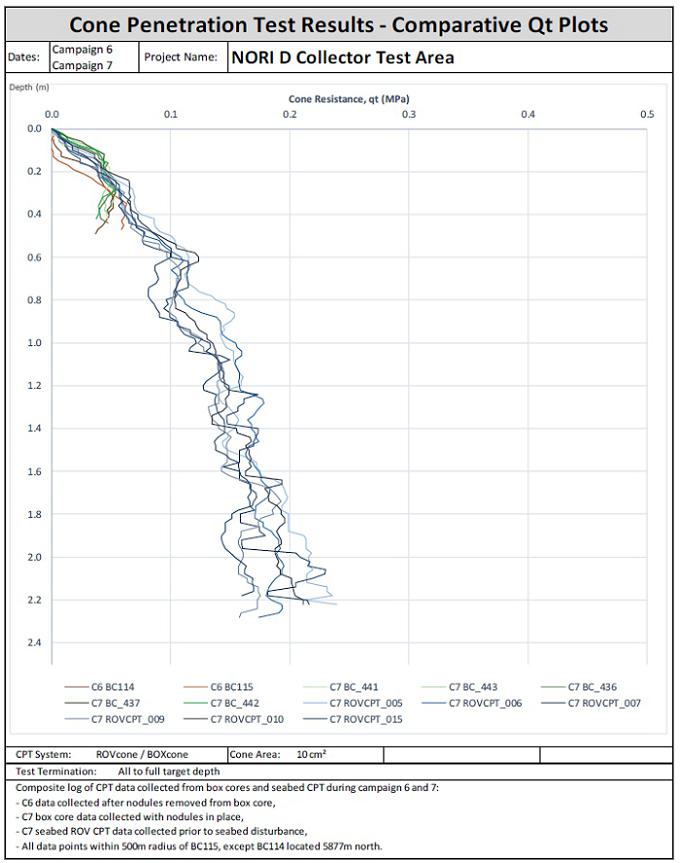
Source: APYS Nkt Evaluation
| 13 | BC_114 and BC_115 are located within the collector Test Area. All locations (except BC_114) are within 500 m of BC_115. |
| amcconsultants.com | 186 |
| Technical Report Summary of Prefeasibility Study of NORI Area D, Clarion Clipperton Zone | |
| TMC the metals company Inc. | 0225054 |
| 8 | Sample preparation, analyses, and security |
This section describes the methods used for preparing and assaying the box core samples from the 2018, 2019, 2022 and 2023 exploration campaigns. The methods used in each campaign were not materially different. AMC considers that the sample preparation, security, and analytical procedures were adequate for estimating Mineral Resources.
| 8.1 | Sample security |
The geoscience laboratory was manned by a team of qualified geoscience staff rotating on 12-hour shifts during box coring operations. All samples were weighed at the weighing stations. Reference weights were used to periodically check the accuracy of the electronic scales. All weights and associated nodule descriptions were recorded in
logbooks (also digitally scanned) and captured in a digital (Excel) database. A digital photographic archive of all samples was also compiled. Data was stored on a computer and backups to external disks were regularly made.
On completion of processing, samples were stored in polythene bags placed in gasket-sealed plastic pails. All nodule pails were assembled in the geoscience laboratory and temporarily stored there until they were transported to a refrigerated container (reefer). The reefer was secured with a tag-in, tag-out system.
Sample bags were prepared with triple redundancy—numbered zip tie, printed bar code, and hand-written in permanent ink. Tracking of samples was maintained with a bar-code scanner and digital database.
Following checking of the nodule count in each box core against the photographic record and reweighing of the nodules, the samples from the depth layers were recombined. These samples were assembled into respective storage pails depending on sample type and destination. Each sample was scanned and recorded on the sample master spreadsheet, and sample pails sealed with tamper-proof tape, and carried to the secured storage reefer (see Figure 8.1).
| Figure 8.1 | Sample storage |
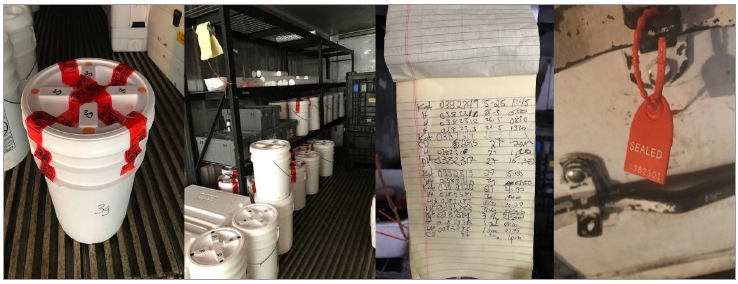
All samples were taken out of the reefer and reweighed on land upon arrival in San Diego. The sealed pails were reopened by geoscientists, weighed, scanned, replaced in pails, sealed with tamper-proof tape and returned to the secured storage reefer. Regular email communications were conducted with the Qualified Person for the Mineral Resource estimate during the sample acquisition operations.
| amcconsultants.com | 187 |
| Technical Report Summary of Prefeasibility Study of NORI Area D, Clarion Clipperton Zone | |
| TMC the metals company Inc. | 0225054 |
| 8.2 | Sample preparation and assaying |
All samples were freighted to ALS Laboratory Group (ALS) in Brisbane, Australia. ALS has a biosecurity quarantine facility approved by the Australian Quarantine and Inspection Service (AQIS). All samples were irradiated before clearing quarantine. The samples were not heat-treated as this would have resulted in breakdown of some of the hydroxide minerals.
For the 2018 and 2019 sampling campaigns the samples were inspected by AMC staff to confirm that there had been no tampering since dispatch from San Diego. The data from these campaigns provides a baseline against which any tampering with samples in future campaigns from NORI Area D would be easily recognized.
NORI obtained a certified reference material (CRM) called NOD-P-1, manufactured by the U.S. Geological Survey (USGS), and stored in small glass vials. The material used in the preparation of the CRM was collected from the Pacific Ocean (14°50’ N, 124°28’ W) at a depth of 4,300 m.
ALS in Brisbane was selected as the primary laboratory as it has extensive experience in the analysis of high manganese samples and nodules. ALS operates quality systems based on international standards ISO/IEC17025:1999 "General requirements for competence of calibration and testing laboratories" and ISO9001:2000 "Quality Management Systems Requirements".
The sample preparation and assaying procedure at ALS was as follows:
| · | Samples were transferred to barcode-labelled aluminium trays and dried in an oven. For the 2018 campaign the samples were dried at 60°C for three (3) days. For the 2019 campaign the samples were dried at 105°C for three (3) days. There appears to be no significant differences between the assays as a consequence. Moisture loss was measured. |
| · | After drying, samples were jaw crushed in a Jacques jaw crusher to reduce particle size to less than 10 mm. |
| · | The crushed samples were then pulverized in an LM5 mill to a powder with typical particle size >85% passing 75 µm. Very small samples were pulverized in a smaller bowl using an LM2 mill. A sieve test was conducted for every 20th sample to check the particle sizes. |
| · | Pulps were analyzed by a fusion/XRF method (ME-XRF26s) using a small aliquot (0.33 g) to avoid fusion problems. The following oxides were reported: |
| ― | LOI, Al2O3, BaO, CaO, Cr2O3, CoO, Fe2O3, K2O, CuO, MgO, MnO, Na2O, P2O5, SO3, SiO2, NiO, TiO2, PbO, and ZnO. |
| · | Pulps were fused with lithium borate to create a bead that was dissolved with acid and analyzed by inductively-coupled plasma emission mass spectroscopy (ICP-MS) (method ME-MS81) for: |
| ― | Ba, Ce, Cr, Cs, Dy, Er, Eu, Ga, Gd, Hf, Ho, La, Lu, Nb, Nd, Pr, Rb, Sm, Sn, Sr, Ta, Tb, Th, Tm, U, V, W, Y, Yb, and Zr. |
| · | Pulps were analyzed for: |
| ― | As, Cd, Li, Mo, Sb by four acid ICP-AES method (ME-ICP61). |
| ― | Bi, Ge, Se, Te, Tl by four acid digest ICP-MS (method ME-MS62s). |
| ― | Hg by low temperature digestion in aqua regia and ICP-MS (method Hg-MS42). |
| ― | B by ICP-MS (method B-ICP69. |
| ― | F by KOH fusion and ion selective electrode (method F-ELE81a). |
| ― | Loss on ignition (LOI) at 1000°C. |
| amcconsultants.com | 188 |
| Technical Report Summary of Prefeasibility Study of NORI Area D, Clarion Clipperton Zone | |
| TMC the metals company Inc. | 0225054 |
ALS also reported a calculated total, being the sum of the reportable analytes plus LOI. Manganese was included in this calculation as Mn3O4 but was reported on the certificate of analysis as MnO. The ALS calculation using Mn3O4 is aimed at covering the middle ground of MnO and MnO2 which are likely both present in the nodules. The assay totals reported by ALS were very close to 100%.
BV was used as a secondary laboratory in some campaigns, to provide an independent check on the accuracy of the sample preparation and assaying by ALS. BV operates quality systems based on international standards ISO/IEC17025:1999 and ISO9001:2000. Each sample batch included internal quality control samples (certified reference materials).
The sample preparation and assaying procedure at BV was as follows:
| · | Samples were dried in an oven at 105°C. Moisture loss was measured. |
| · | Samples crushed and split, if required, then pulverized in a vibrating pulverizer. |
| · | Pulps were cast using a 12:22 flux with added sodium nitrate to form a glass bead. The beads were analyzed by XRF for: TiO2, Fe, Al2O3, SiO2, Mn, CaO, MgO, S XRF, P XRF, BaO, and K2O. |
| · | Pulps were analyzed by Laser Ablation Inductively Coupled Plasma Mass Spectrometry for: |
Ag, As, Ba, Be, Bi, Cd, Ce, Co, Cr, Cs, Cu, Dy, Er, Eu, Ga, Gd, Ge, Hf, Ho, In, La, Lu, Mn, Mo, Nb, Nd, Ni, Pb, Pr, Rb, Re, Sb, Sc, Se, Sm, Sn, Sr, Ta, Tb, Te, Th, Ti, Tl, Tm, U, V, W, Y, Yb, Zn, and Zr.
| · | Pulps were analyzed for LOI at 1000°C. |
| 8.3 | Quality Assurance and Quality Control procedures |
Certified reference materials (CRMs), blank samples (crushed rock samples with very low manganese, nickel, cobalt, and copper) and duplicate samples were used for quality control and quality assurance during the 2018 - 2023 offshore campaigns (C3, C6, C7, C8).
| 8.3.1 | Certified Reference Materials |
The CRM called NOD-P-1, manufactured by the U.S. Geological Survey (USGS), was used for the 2018 campaign. Material used in the preparation of the CRM was collected from the Pacific Ocean (14°50’ N, 124°28’ W) at a depth of 4,300 m. A total of 29 CRMs were inserted into sample submissions during box core sample assaying programs in 2018, 2019, and 2023. Table shows the assayed values for manganese, cobalt, nickel and copper and the certified values for NOD-1-P.
Three (3) of the samples were assayed at Bureau Veritas Minerals Pty Ltd (BV) in Adelaide, Australia. The remainder (26) were assayed at ALS Global (ALS) in Stafford, Australia. There was a slight positive bias in the BV assays relative to those from ALS. These differences are interpreted to be due to small calibration errors in the BV data.
The mean and standard deviation of the ALS assays are presented in Table 8.1. These provide a measure of the analytical error at ALS plus any errors related to inhomogeneity of sample NOD-P-1. The ALS assays are satisfactory.
| amcconsultants.com | 189 |
| Technical Report Summary of Prefeasibility Study of NORI Area D, Clarion Clipperton Zone | |
| TMC the metals company Inc. | 0225054 |
| Table 8.1 | Assay results for NOD-P-1 from off-shore campaigns in 2018, 2019, and 2023 |
| Sample | NiO (%) | CuO (%) | MnO (%) | CoO (%) | Laboratory |
| Certified value | 1.71 | 1.44 | 37.6 | 0.28 | USGS |
| Mean of all assays from ALS | 1.72 | 1.43 | 37.70 | 0.28 | ALS |
| Std Dev of all samples | 0.03 | 0.02 | 0.45 | 0.01 | ALS |
| 0367075A | 1.72 | 1.43 | 38.04 | 0.28 | ALS |
| 0367108A | 1.73 | 1.45 | 38.24 | 0.28 | ALS |
| 0367175A | 1.72 | 1.42 | 38 | 0.28 | ALS |
| 0367177A | 1.72 | 1.41 | 37.92 | 0.28 | ALS |
| STD11 | 1.73 | 1.43 | 37.86 | 0.28 | ALS |
| STD12 | 1.72 | 1.43 | 37.79 | 0.28 | ALS |
| STD1 | 1.73 | 1.45 | 37.3 | 0.29 | ALS |
| STD2 | 1.72 | 1.42 | 37.29 | 0.28 | ALS |
| STD3 | 1.71 | 1.42 | 37.14 | 0.28 | ALS |
| STD4 | 1.71 | 1.41 | 37.13 | 0.28 | ALS |
| STD5 | 1.72 | 1.44 | 37.43 | 0.28 | ALS |
| STD6 | 1.73 | 1.44 | 37.54 | 0.28 | ALS |
| STD7 | 1.73 | 1.47 | 37.73 | 0.29 | ALS |
| STD8 | 1.71 | 1.44 | 37.39 | 0.28 | ALS |
| STD9 | 1.72 | 1.45 | 37.59 | 0.28 | ALS |
| STD10 | 1.71 | 1.42 | 37.7 | 0.28 | ALS |
| STD13 | 1.73 | 1.43 | 38.07 | 0.29 | ALS |
| STD14 | 1.73 | 1.43 | 37.94 | 0.29 | ALS |
| STD15 | 1.73 | 1.44 | 37.93 | 0.29 | ALS |
| STD16 | 1.71 | 1.42 | 37.49 | 0.28 | ALS |
| STD17 | 1.72 | 1.43 | 37.74 | 0.28 | ALS |
| STD18 | 1.72 | 1.42 | 37.67 | 0.28 | ALS |
| STD19 | 1.72 | 1.43 | 37.85 | 0.28 | ALS |
| STD20 | 1.72 | 1.43 | 37.82 | 0.29 | ALS |
| STD21 | 1.71 | 1.43 | 37.72 | 0.28 | ALS |
| XX55000 | 1.76 | 1.45 | 37.9 | 0.29 | ALS |
| 0367109A | 1.781 | 1.44 | 38.865 | 0.294 | BV |
| 0367183A | 1.794 | 1.452 | 38.865 | 0.296 | BV |
| STD4 | 1.82 | 1.54 | 38.87 | 0.3 | BV |
| 8.3.2 | Blanks |
The blank samples were composed of dolomite, granite, recycled glass or quartz, which were expected to have very low content of manganese, cobalt, nickel and copper. The blank material was not assayed prior to insertion in the NORI sample batches. A total of 31 blank samples were inserted into the sample assay batches at a rate of approximately 1 in 8. Table 8.2 shows the assayed oxide values for the blanks.
The assays for the blank samples from campaign C3 indicate slightly elevated manganese (deliberate as some of the blanks had manganese mixed in with the blank) and negligible nickel, copper and cobalt.
The MnO assay in XX55001, from campaign C8, might be considered anomalous but the loss on ignition for this sample was only 0.03%. Given that the ratio of MnO:LOI in the nodules is approximately 2.5 and for the blank sample the ratio is 22, AMC concludes that the source of the manganese in the blank sample is not contamination from nodules but may be from the sample preparation equipment. The blank sample is much harder than the nodules and abrasion by the nodules is not expected to lead to contamination of nodule assays. These conclusions are supported by the CRM results which do not indicate contamination.
| amcconsultants.com | 190 |
| Technical Report Summary of Prefeasibility Study of NORI Area D, Clarion Clipperton Zone | |
| TMC the metals company Inc. | 0225054 |
| Table 8.2 | Assay results for NOD-P-1 from off-shore campaigns in 2018, 2019, and 2023 |
| Campaign | Sample | Material | NiO (%) | CuO (%) | MnO (%) | CoO (%) | Laboratory |
| C3 | 0367116A | Dolomite or granite | 0.01 | 0.01 | 0.38 | 0.01 | ALS |
| C3 | 0367089A | Dolomite or granite | 0.03 | 0.03 | 0.63 | 0.01 | ALS |
| C3 | 0367091A | Dolomite or granite | 0.01 | 0.01 | 0.23 | 0.01 | ALS |
| C3 | 0367118A | Dolomite or granite | 0.01 | 0.01 | 0.38 | 0.01 | ALS |
| C3 | 0367200A | Dolomite or granite | 0.01 | 0.01 | 0.06 | 0.01 | ALS |
| C3 | 0367202A | Dolomite or granite | 0.02 | 0.01 | 0.42 | 0.01 | ALS |
| C3 | 0367241A | Dolomite or granite | 0.01 | 0.01 | 0.46 | 0.01 | ALS |
| C3 | 0367052A | Dolomite or granite | 0.01 | 0.00 | 0.18 | 0.00 | BV |
| C3 | 0367088A | Dolomite or granite | 0.01 | 0.01 | 0.23 | 0.00 | BV |
| C3 | 0367149A | Dolomite or granite | 0.01 | 0.01 | 0.28 | 0.00 | BV |
| C3 | 0367239A | Dolomite or granite | 0.00 | 0.00 | 0.14 | 0.00 | BV |
| C6 | Blank1 | Recycled glass | <0.01 | <0.01 | <0.01 | <0.01 | ALS |
| C6 | Blank2 | Recycled glass | 0.01 | <0.01 | 0.13 | <0.01 | ALS |
| C6 | Blank3 | Recycled glass | 0.01 | 0.01 | 0.13 | <0.01 | ALS |
| C6 | Blank4 | Recycled glass | 0.01 | 0.01 | 0.12 | <0.01 | ALS |
| C6 | Blank5 | Recycled glass | 0.02 | 0.01 | 0.57 | <0.01 | ALS |
| C6 | Blank6 | Recycled glass | <0.01 | 0.02 | <0.01 | <0.01 | ALS |
| C6 | Blank7 | Recycled glass | <0.01 | 0.03 | <0.01 | <0.01 | ALS |
| C6 | Blank8 | Recycled glass | 0.02 | 0.02 | 0.20 | <0.01 | ALS |
| C6 | Blank9 | Recycled glass | 0.01 | 0.03 | 0.22 | <0.01 | ALS |
| C6 | Blank10 | Recycled glass | 0.01 | 0.02 | 0.16 | <0.01 | ALS |
| C6 | Blank11 | Recycled glass | 0.02 | 0.04 | 0.42 | <0.01 | ALS |
| C7 | Blank 1 | Granite | 0.02 | <0.01 | 0.45 | <0.01 | ALS |
| C7 | Blank 2 | Granite | 0.03 | 0.01 | 0.76 | 0.01 | ALS |
| C7 | Blank 3 | Granite | <0.01 | 0.01 | 0.40 | <0.01 | ALS |
| C7 | Blank 4 | Granite | 0.01 | 0.01 | 0.33 | <0.01 | ALS |
| C7 | Blank 5 | Granite | 0.02 | 0.02 | 0.40 | <0.01 | ALS |
| C7 | Blank 6 | Granite | 0.01 | 0.01 | 0.32 | <0.01 | ALS |
| C7 | Blank 7 | Granite | 0.01 | <0.01 | 0.36 | <0.01 | ALS |
| C7 | Blank 8 | Granite | 0.01 | <0.01 | 0.34 | <0.01 | ALS |
| C8 | XX55001 | Quartz | 0.04 | 0.02 | 0.66 | <0.01 | ALS |
| amcconsultants.com | 191 |
| Technical Report Summary of Prefeasibility Study of NORI Area D, Clarion Clipperton Zone | |
| TMC the metals company Inc. | 0225054 |
| 8.3.3 | Duplicates |
| 8.3.3.1 | Campaign 3, 2018 |
Duplicate samples were generated by cone and quartering the nodules (Section 7.2.5). A total of 44 samples were assayed at ALS paired with duplicate samples also assayed at ALS. Figure 8.2 presents the results. The precision of the results is very good and there is no evidence of significant biases or errors.
For the 2018 sampling campaign, the duplicates (secondary laboratory) were submitted to Bureau Veritas laboratory in Perth, Australia. A total of 43 samples were assayed at ALS paired with duplicate samples assayed at BV. Figure 8.3 presents the results. The precision of the results is good. There are very small high bias for nickel and manganese compared with the ALS assays (see Table 8.3) but this is not significant. These results are consistent with the observation for the assays of the NOD-P-1 standard.
The maximum half absolute relative difference for the ALS paired data is NiO = 1.95%, CuO = 4.76%, MnO = 1.99%, CoO = 4.35% and for the BV assays paired with the ALS primary samples is NiO = 3.22%, CuO = 2.49%, MnO = 2.31%, CoO = 6.35%. The precision in the nodule sample assays is acceptable.
| Figure 8.2 | Comparison of primary samples assayed at ALS and duplicate samples assayed at ALS |
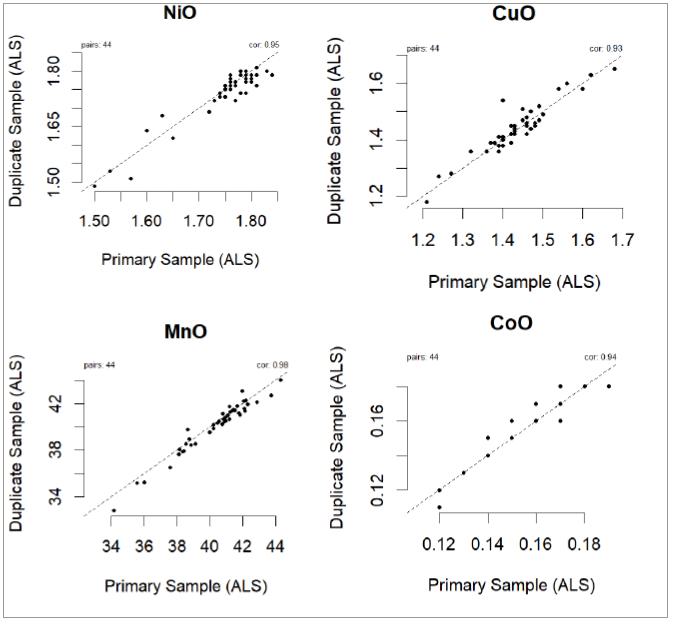
| amcconsultants.com | 192 |
| Technical Report Summary of Prefeasibility Study of NORI Area D, Clarion Clipperton Zone | |
| TMC the metals company Inc. | 0225054 |
| Figure 8.3 | Comparison of primary samples assayed at ALS and duplicate samples assayed at BV |
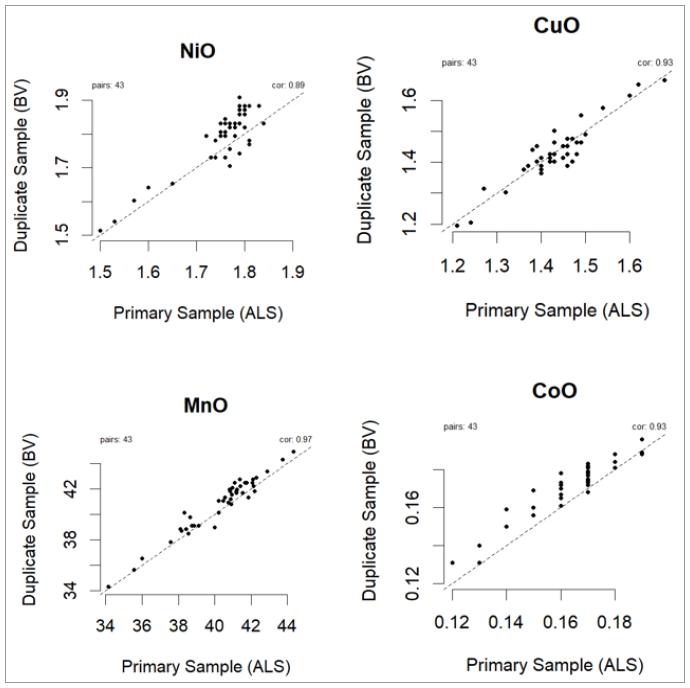
| Table 8.3 | Duplicate average sample grades by laboratory |
| Variable | ALS primary | ALS duplicate | BV duplicate |
| NiO (%) | 1.75 | 1.74 | 1.79 |
| CuO (%) | 1.44 | 1.44 | 1.43 |
| MnO (%) | 40.39 | 40.11 | 40.82 |
| CoO (%) | 0.16 | 0.16 | 0.17 |
| 8.3.3.2 | Campaign 6, 2018 |
ALS prepared field duplicate samples by cone and quartering the box core samples. A total of 19 samples were assayed at ALS paired with duplicate samples also assayed at ALS. Figure 8.4 and Table 8.4 present the results. The precision of the results is very good and there is no evidence of significant biases or errors.
| amcconsultants.com | 193 |
| Technical Report Summary of Prefeasibility Study of NORI Area D, Clarion Clipperton Zone | |
| TMC the metals company Inc. | 0225054 |
| Figure 8.4 | Comparison of primary samples assayed at ALS and duplicate samples assayed at ALS14 |
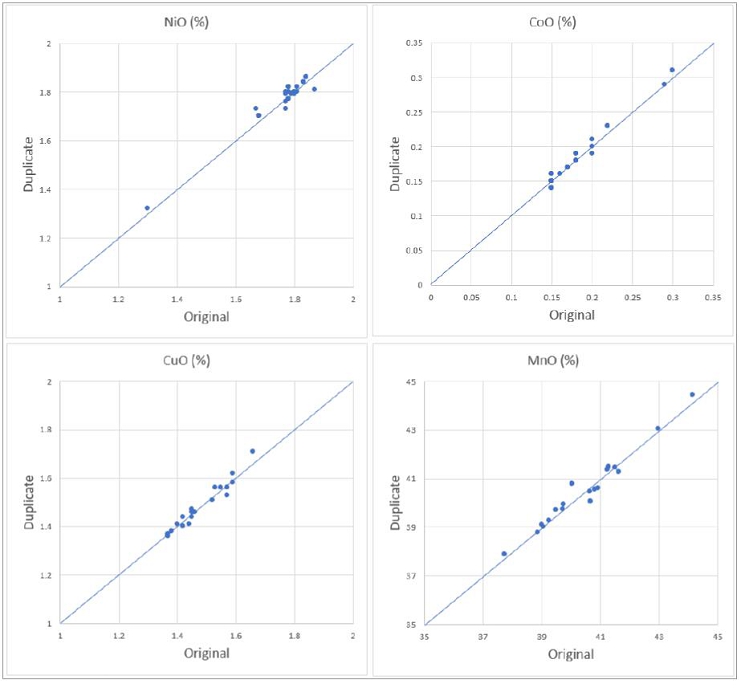
| Table 8.4 | Duplicate average sample grades from ALS |
| Variable | Number | ALS primary | ALS duplicate |
| NiO (%) | 19 | 1.76 | 1.77 |
| CuO (%) | 19 | 1.48 | 1.49 |
| MnO (%) | 19 | 40.47 | 40.47 |
| CoO (%) | 19 | 0.19 | 0.19 |
The pulps of 27 pulp samples assayed at ALS were resubmitted for assay at BV. Figure 8.5 presents the results. The results for nickel, copper, cobalt and manganese are all biased high by approximately 3% to 5%, compared with the ALS assays (see Table 8.5).
14 Diagonal blue line at 1:1 ratio
| amcconsultants.com | 194 |
| Technical Report Summary of Prefeasibility Study of NORI Area D, Clarion Clipperton Zone | |
| TMC the metals company Inc. | 0225054 |
These results are consistent with the observation for the assays of the NOD-P-1 standard which indicated that the BV results were biased slightly high.
| Figure 8.5 | Comparison of primary samples assayed at ALS and duplicate samples assayed at BV15 |
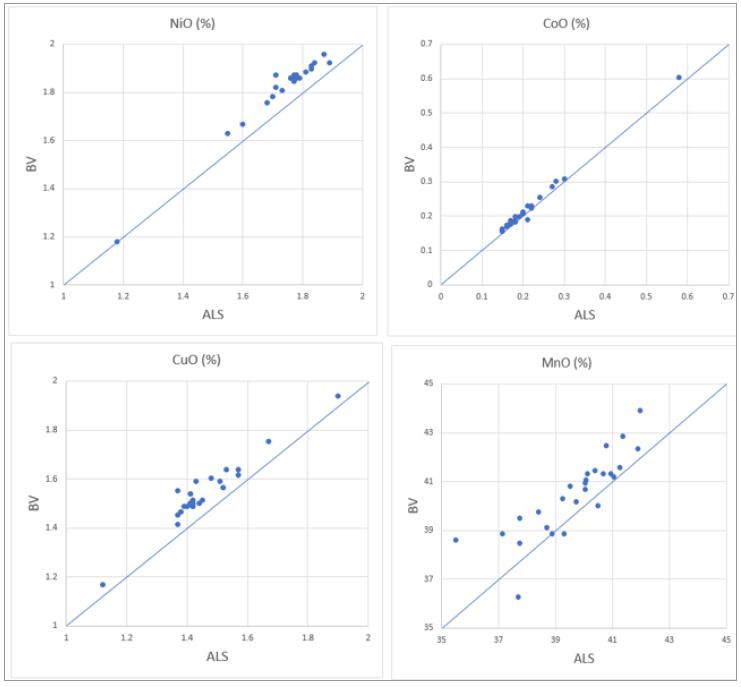
| Table 8.5 | Duplicate average sample grades from ALS and BV |
| Variable | Number | ALS Primary | BV pulp duplicate |
| NiO (%) | 27 | 1.74 | 1.82 |
| CuO (%) | 27 | 1.47 | 1.56 |
| MnO (%) | 27 | 39.4 | 40.5 |
| CoO (%) | 27 | 0.21 | 0.22 |
| SiO2 (%) | 27 | 12.6 | 12.9 |
15 Diagonal blue line at 1:1 ratio
| amcconsultants.com | 195 |
| Technical Report Summary of Prefeasibility Study of NORI Area D, Clarion Clipperton Zone | |
| TMC the metals company Inc. | 0225054 |
| 8.3.3.3 | Campaign 7A, 2022 |
The sample bags for each box core were not combined and resplit as they had been in earlier campaigns. A sealed bag of nodules was selected by NORI from the pails of sample bags for each box core as the primary sample for the box core. Additional sample bags were selected in the same random way from some of the box cores as field duplicates. NORI assumed, based on previous duplicate sampling, that the variance of grades within any box core is sufficiently low that statistical splitting of samples to create primary and duplicate samples is unnecessary.
A total of four primary and duplicate samples were assayed at ALS. Figure 8.6 and Table 8.6 present the results. The precision of the results is very good and there is no evidence of significant biases or errors. The results support the assumption that statistical splitting has no significant impact on sample variability.
| amcconsultants.com | 196 |
| Technical Report Summary of Prefeasibility Study of NORI Area D, Clarion Clipperton Zone | |
| TMC the metals company Inc. | 0225054 |
| Figure 8.6 | Comparison of primary and duplicate samples assayed at ALS16 |
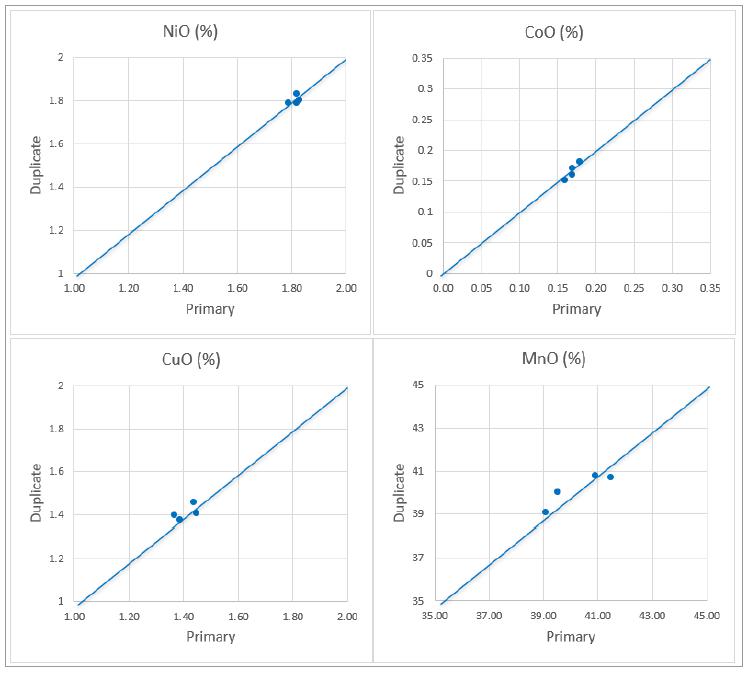
| Table 8.6 | Primary and duplicate average sample grades from ALS |
| Variable | Number | ALS Primary | ALS Duplicate |
| NiO (%) | 4 | 1.82 | 1.80 |
| CuO (%) | 4 | 1.41 | 1.41 |
| MnO (%) | 4 | 40.27 | 40.12 |
| CoO (%) | 4 | 0.17 | 0.17 |
| SiO2 (%) | 4 | 11.03 | 11.04 |
16 Diagonal blue line at 1:1 ratio
| amcconsultants.com | 197 |
| Technical Report Summary of Prefeasibility Study of NORI Area D, Clarion Clipperton Zone | |
| TMC the metals company Inc. | 0225054 |
| 8.3.3.4 | Campaign 8A, 2023 |
A total of five (5) samples were assayed at ALS paired with duplicate samples (Section 7.6.2) also assayed at ALS. Figure 8.7 presents the results. Table 8.7 presents the average grades of the primary and duplicate samples. The primary sample from BC_501 returned an anomalously high manganese assay and an anomalously high assay total (101.9%). AMC recommends the duplicate sample assay results for BC_501 should be used in preference to this primary sample. The precision of the results is generally good and there is no evidence of other significant biases or errors.
| Figure 8.7 | Comparison of primary samples assayed at ALS and duplicate samples assayed at ALS17 |
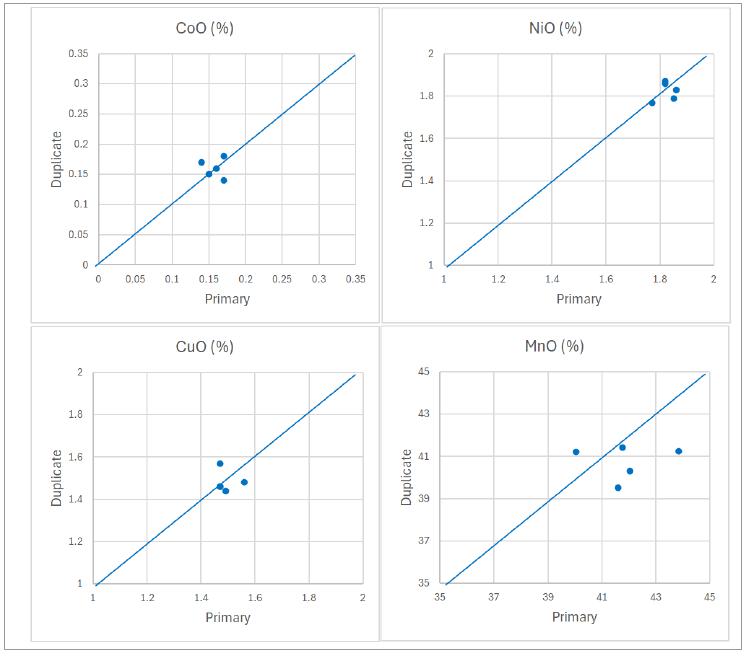
17 Diagonal blue line at 1:1 ratio
| amcconsultants.com | 198 |
| Technical Report Summary of Prefeasibility Study of NORI Area D, Clarion Clipperton Zone | |
| TMC the metals company Inc. | 0225054 |
| Table 8.7 | Duplicate average sample grades from ALS |
| Variable | Number | ALS primary | ALS duplicate |
| NiO (%) | 5 | 1.82 | 1.82 |
| CuO (%) | 5 | 1.50 | 1.47 |
| MnO (%) | 5 | 41.42 | 39.98 |
| CoO (%) | 5 | 0.16 | 0.16 |
| amcconsultants.com | 199 |
| Technical Report Summary of Prefeasibility Study of NORI Area D, Clarion Clipperton Zone | |
| TMC the metals company Inc. | 0225054 |
| 9 | Data verification |
Data collected by NORI is well-documented and was subject to satisfactory QA/QC processes. Documentation verified by the Qualified Person includes photographs, daily exploration reports, digital logging sheets and original assay reports. In the opinion of the Qualified Person the NORI Area Data is of high quality and suitable for estimating Mineral Resources. The 2025 Mineral Resource estimate for NORI Area D, reported herein, was based on box core samples and other data collected by NORI and does not include any data collected by the early explorers (Pioneer Investors) described in Section 5.3 and 5.4.
The nodules are located in the north-east Pacific Ocean and lie at a depth of approximately 4,500 m below sea level. Nodules are only accessible to autonomous or remotely operated specialist underwater vehicles. Given the nature and location of the mineralization, no site visit has been conducted by the Qualified Person. However, the Qualified Person was involved in the development of sampling strategies and procedures and was in daily contact with the offshore sampling campaigns as they were implemented, providing input as required to ensure data quality and veracity.
| amcconsultants.com | 200 |
| Technical Report Summary of Prefeasibility Study of NORI Area D, Clarion Clipperton Zone | |
| TMC the metals company Inc. | 0225054 |
| 10 | Mineral processing and metallurgical testing |
Work commenced with review of the extensive literature regarding nodule mineralogy and historical metallurgical processing outlining that:
| · | Nodules are fine-grained intergrowths of a complex suite of ferromanganese oxide and hydroxide minerals with nickel-copper-cobalt ingrained into the structure of the ferromanganese minerals. |
| · | As a result, mineral dressing methods are not possible to upgrade to mineral concentrates, and flow sheet development focused on whole nodule treatment, initially by pyrometallurgical methods followed by hydrometallurgical refining. |
TMC has completed an extensive metallurgical flowsheet selection, development and proof of concept program over the last fourteen years. The selected flowsheet involves a front-end pyrometallurgical process, where the nodules are first put through a rotary kiln and then further processed in an electric arc furnace. The furnace generates two materials – a manganese silicate slag representing TMC USA’s final manganese product, and a nickel-copper-cobalt alloy that is rich in iron. The alloy is further processed pyrometallurgically in Peirce-Smith Converters, where sulfur is added and iron removed to generate a higher-valued matte product. The matte product can then be fed into a downstream hydrometallurgical refinery which separates the nickel, copper and cobalt into their individual components to generate final products.
Testwork has been conducted on the entire flowsheet to date, with larger-scale demonstrations completed for the rotary kiln and electric furnace aspects of the flowsheet, consistent with TMC’s strategy to begin operations through using existing RKEF facilities. Product development testing has also been conducted along with the flowsheet development and testing program.
Preliminary bench-scale testing was completed by Kingston Process Metallurgy (KPM), a specialized research and development metallurgical facility based in Kingston, Ontario, Canada. TMC selected the FLSmidth Inc. (FLS) facility in Whitehall, Pennsylvania, USA for pilot-scale rotary kiln calcining trials. Prior to the trials, some bench scale testing was completed at FLS in parallel with KPM testwork. The rotary kiln calcining piloting was executed successfully in November of 2020, generating approximately 35 t of calcined material from 75 t of nodules collected from NORI Area D.
The electric furnace smelting, sulfidation and converting pilot scale trials were conducted by the XPS (A Glencore subsidiary) testing facility in Sudbury, Ontario, Canada. Bench-scale testing was conducted at XPS prior to the piloting on both synthetic and pilot generated materials. The smelting trials were also successful, generating approximately 1,700 kg of alloy and 25 t of manganese silicate. The furnace was then used for the sulfidation and converting piloting, as pilot-scale Peirce-Smith converters do not exist. Approximately 332 kg of final nickel-copper-cobalt matte was generated.
Two programs were conducted for product development. The first, a full bench-scale testing program which generated nickel and cobalt sulfates from the matte generated at XPS was commissioned at SGS Canada in Lakefield, Ontario using a combined atmospheric and pressure sulfuric acid leach flowsheet. The second program, on the manganese silicate product, was conducted at Norwegian laboratory SINTEF Industri, who specialize in the processing of manganese ores. The SINTEF program was also successful in generating silico-manganese alloy using TMC’s manganese silicate as the sole manganese source, first at bench scale and later at the kilogram scale. Silico-manganese alloy is a key additive in steel manufacturing, and the success of this program represents the demonstrated value in use to potential customers in using silico-manganese alloy derived from TMC’s manganese silicate product compared with their existing feedstocks. The success of this program also confirms that the company’s near zero solid waste processing objective was met, as a usable material has been generated from a TMC final product.
| amcconsultants.com | 201 |
| Technical Report Summary of Prefeasibility Study of NORI Area D, Clarion Clipperton Zone | |
| TMC the metals company Inc. | 0225054 |
| 10.1 | Bulk sample collection testwork |
Key findings of the exploration work documented in Section 7 of this report are that:
| · | The chemical composition and mineralogy of NORI Area D nodules is remarkably consistent. |
| · | Nodules can be classified into three different categories (types 1 to 3), based primarily on size and morphology. The majority of the Mineral Resource is comprised of type 1 nodules. |
Utilising this work, an area to the north and west of the identified Test Mining Trial area was selected to collect a nodule bulk sample to undertake metallurgical pilot testing. This bulk sample was collected from 6 separate areas using a bespoke designed 6 m wide ploughing system (Figure 10.1), which was deployed to the seafloor using the main anchor winches of the MV Maersk Launcher, an anchor handler tug supply vessel that was used to deploy the system.
The system was designed to recover nodules from the top 5 cm of the seafloor and reject the surface sediment through a metal mesh which retained the nodules. The system successfully collected 77.3 t of nodules from 62 runs covering an area of 48,157 m2 along a total run length of 5.8 km. A scallop-dredge mesh was used with mesh size varied from 10 mm to 19 mm. The fines rejection was not fully successful, with the nodules needing to be washed ahead of being processed. This will not be an issue for the commercial-scale collection system as demonstrated by the mining test completed in 2022 outlined in Section 13, where little seafloor sediment was lifted to the surface.
A total of 62 samples were taken of the bulk sample and assayed to confirm sample grade and moisture. Grab samples were taken primarily of the middle (number 4 of 6) chain bags during unloading. Samples were shipped to ALS in Brisbane and analysed using the same analysis method for samples used for resource evaluation; moisture by OA-GRA05 and analysis by X-ray fluorescence using ALS code ME-XRF26s. Table 10.1 shows a comparison of the nodule analysis for the bulk sample compared to the measured resource for the test mining area. The nodule grades compare well with slightly elevated moisture for the bulk sample which can be attributed to high moisture in the entrained sediment.
| Table 10.1 | Comparison of bulk sample analyses with NORI Area D measured resource for the test mining area |
| Comparison of Bulk Sample Grade to NORI Area D Resource | |||||
| Category | Moisture
% |
Ni
% |
Cu
% |
Co
% |
Mn
% |
| Bulk Sample | |||||
| Mean | 29.7 | 1.40 | 1.18 | 0.12 | 32.9 |
| Max | 30.9 | 1.45 | 1.29 | 0.14 | 34.5 |
| Min | 28.2 | 1.35 | 1.12 | 0.09 | 31.4 |
| Standard Deviation | 0.60 | 0.0002 | 0.0005 | 0.0001 | 0.0053 |
| Measured Resource (Test Mining Area) | 28 | 1.41 | 1.15 | 0.13 | 31.9 |
| Difference in mean | 1.7 | -0.01 | 0.03 | -0.01 | 1.05 |
Source: TMC
Runs were planned to collect type 1, 2 and 3 nodules, nominally in the proportions of the NORI Area D Mineral Resource.
Samples were bagged into one tonne bulka bags and were brought by the MV Maersk Launcher to San Diego and then trucked directly to FLS’s facility in Pennsylvania where calcining was undertaken.
A 5 t reference sample has been retained in storage in San Diego.
| amcconsultants.com | 202 |
| Technical Report Summary of Prefeasibility Study of NORI Area D, Clarion Clipperton Zone | |
| TMC the metals company Inc. | 0225054 |
| Figure 10.1 | Bulk sampling dredge used to collect the bulk sample for metallurgical pilot tests |
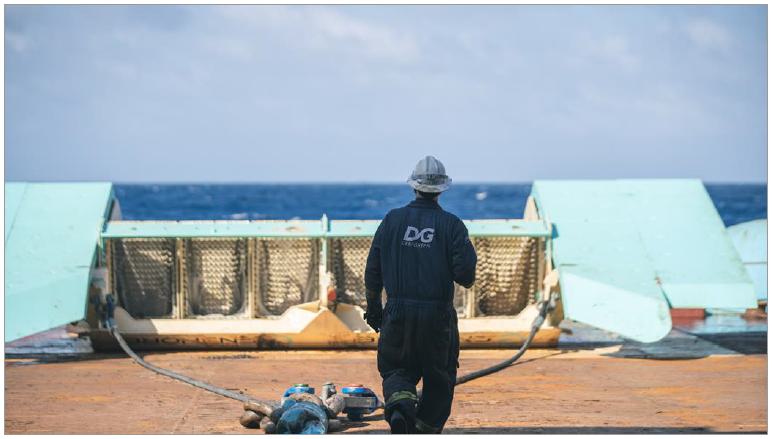
It is the QP’s opinion that the bulk nodule sample collected for pilot testing is representative of the NORI Area D field, particularly for the Initial Mining Area from which some of the sample was extracted.
| 10.2 | Bulk sampling testing laboratories |
Feed samples, products and intermediate control samples were analysed by the various testing laboratories using the methods outlined in Table 10.2.
| Table 10.2 | Location and testing methods of laboratories used |
| Name | Location | Testing/Assaying Methods |
| Kingston Process Metallurgy | Kingston, Ontario, Canada | ICP-OES, ICP-MS, various microscopy methods |
| FL Smidth | Whitehall, PA, USA | XRF, XRD |
| eXpert Process Solutions (XPS) | Sudbury, Ontario, Canada | XRF, ICP-OES |
| SGS Canada Inc. | Lakefield, Ontario, Canada | ICP-OES, ICP-MS |
| SINTEF Industri | Trondheim, Norway | ICP |
| 10.3 | Summary of test work results |
| 10.3.1 | Round robin assaying program |
As part of TMC’s commercial partnership with PAMCO, NORI delivered 22 t of nodules collected during the Test Mining in Q4 of 2022. The nodule sample was delivered to PAMCO in March of 2023. PAMCO commissioned a Round Robin Assaying program – where 10 standard samples were created by PAMCO and sent for assay by several participating labs (including PAMCO internally).
| amcconsultants.com | 203 |
| Technical Report Summary of Prefeasibility Study of NORI Area D, Clarion Clipperton Zone | |
| TMC the metals company Inc. | 0225054 |
The following procedure was undertaken at PAMCO to generate each of the 10 standard samples for assay:
| 1. | Take 60 kg of nodules from flexible container bag. | |
| 2. | Dry using a dryer at 105℃ until weight is constant. Dry weight of the nodules was 45 kg. | |
| 3. | Pulverize the entire mass to -150 µm using a disc mill. | |
| 4. | Divide the mass into 3 bags containing 15 kg per bag (Bags A, B and C). | |
| 5. | Using a rifle divider, separate each of the 3 bags into 2 separate subsamples, each containing 7.5 kg (A1, A2, B1, B2, C1, C2). | |
| 6. | Create 2 composites using one subsample from each bag (A1 + B1 + C1, A2 + B2 + C2). | |
| 7. | Mix the new composites in a plastic bag. | |
| 8. | Divide the composites into 2 samples (Composite 1a, 1b, 2a, 2b). | |
| 9. | Mix to make 2 new composites (1a + 2a, 1b + 2b). | |
| 10. | Repeat Steps 8 and 9 three times. This still results in 2 composites (X and Y). | |
| 11. | Divide the 2 composites into 10 samples per composite (X1 - X10, Y1 - Y10). | |
| 12. | Mix subsamples based on their corresponding numbers (X1 + Y1 = standard sample 1). | |
| 13. | Place each of the samples into individual bottles. |
The following laboratories were contracted to conduct analysis as part of this program:
| · | PAMCO, Hachinohe, Aomori, Japan. | |
| · | ALS, Brisbane, QLD, Australia. | |
| · | SGS Canada, Lakefield, ON, Canada. | |
| · | Kingston Process Metallurgy, Kingston, ON, Canada. |
The program required each laboratory to conduct analysis on nickel, copper, cobalt and manganese only. Table 10.3 summarizes the analytical methods undertaken by each of the laboratories to complete this task:
| Table 10.3 | Analytical methods undertaken by each laboratory |
| Element | PAMCO Method | KPM Method |
ALS Method | SGS Method |
| Nickel (Ni) | JIS M 8126: Dimethylglyoxime Precipitation Separation EDTA Titration Method | ICP-OES | XRF – Chromite / Manganese Ore – Disc / XRF | XRF |
| Copper (Cu) | JIS M 8242: Inductively Coupled Plasma Emission Spectrometry (ICP-OES) | |||
| Cobalt (Co) | JIS M 8129: Inductively Coupled Plasma Emission Spectrometry (ICP-OES) | |||
| Manganese (Mn) | JIS M 8232: Potassium Permanganate Titration |
Table 10.4 to Table 10.7 shows the outcomes from each of the laboratories for each of the elements specified. All values are in weight %. Average, standard deviation (SD) and coefficient of variation (CoV) are shown.
| amcconsultants.com | 204 |
| Technical Report Summary of Prefeasibility Study of NORI Area D, Clarion Clipperton Zone | |
| TMC the metals company Inc. | 0225054 |
| Table 10.4 | Nickel laboratory results |
| Bottle No | PAMCO | ALS | KPM | SGS |
| 1 | 1.4317 | 1.460 | 1.410 | 1.390 |
| 2 | 1.4362 | 1.462 | 1.470 | 1.410 |
| 3 | 1.4381 | 1.438 | 1.370 | 1.390 |
| 4 | 1.4330 | 1.457 | 1.410 | 1.390 |
| 5 | 1.4334 | 1.445 | 1.460 | 1.400 |
| 6 | 1.4304 | 1.424 | 1.400 | 1.390 |
| 7 | 1.4351 | 1.456 | 1.440 | 1.390 |
| 8 | 1.4347 | 1.435 | 1.400 | 1.380 |
| 9 | 1.4343 | 1.427 | 1.350 | 1.380 |
| 10 | 1.4364 | 1.434 | 1.440 | 1.380 |
| Average | 1.4343 | 1.4438 | 1.4150 | 1.3900 |
| SD | 0.0023 | 0.0141 | 0.0381 | 0.0094 |
| CoV(%) | 0.16 | 0.98 | 2.69 | 0.68 |
| Table 10.5 | Copper laboratory results |
| Bottle No | PAMCO | ALS | KPM | SGS |
| 1 | 1.1382 | 1.162 | 1.170 | 1.130 |
| 2 | 1.1528 | 1.162 | 1.220 | 1.140 |
| 3 | 1.1462 | 1.157 | 1.150 | 1.150 |
| 4 | 1.1433 | 1.160 | 1.170 | 1.130 |
| 5 | 1.1334 | 1.132 | 1.190 | 1.150 |
| 6 | 1.1396 | 1.146 | 1.160 | 1.140 |
| 7 | 1.1272 | 1.150 | 1.160 | 1.130 |
| 8 | 1.1231 | 1.144 | 1.150 | 1.160 |
| 9 | 1.1342 | 1.146 | 1.130 | 1.160 |
| 10 | 1.1339 | 1.158 | 1.180 | 1.140 |
| Average | 1.1372 | 1.1517 | 1.1680 | 1.1430 |
| SD | 0.0088 | 0.0098 | 0.0249 | 0.0116 |
| CoV(%) | 0.78 | 0.85 | 2.13 | 1.01 |
| amcconsultants.com | 205 |
| Technical Report Summary of Prefeasibility Study of NORI Area D, Clarion Clipperton Zone | |
| TMC the metals company Inc. | 0225054 |
| Table 10.6 | Cobalt laboratory results |
| Bottle No | PAMCO | ALS | KPM | SGS |
| 1 | 0.1430 | 0.1440 | 0.1400 | 0.1400 |
| 2 | 0.1462 | 0.1450 | 0.1400 | 0.1400 |
| 3 | 0.1436 | 0.1410 | 0.1400 | 0.1300 |
| 4 | 0.1438 | 0.1430 | 0.1400 | 0.1400 |
| 5 | 0.1415 | 0.1400 | 0.1400 | 0.1400 |
| 6 | 0.1414 | 0.1400 | 0.1300 | 0.1400 |
| 7 | 0.1431 | 0.1430 | 0.1400 | 0.1400 |
| 8 | 0.1444 | 0.1400 | 0.1400 | 0.1400 |
| 9 | 0.1445 | 0.1400 | 0.1300 | 0.1400 |
| 10 | 0.1423 | 0.1410 | 0.1400 | 0.1400 |
| Average | 0.1434 | 0.1417 | 0.1380 | 0.1390 |
| SD | 0.0015 | 0.0019 | 0.0042 | 0.0032 |
| CoV(%) | 1.02 | 1.33 | 3.06 | 2.28 |
| Table 10.7 | Manganese laboratory results |
| Bottle No | PAMCO | ALS | KPM | SGS |
| 1 | 31.600 | 32.063 | 31.5000 | 31.700 |
| 2 | 31.770 | 31.978 | 31.3000 | 31.800 |
| 3 | 31.620 | 31.823 | 32.6000 | 31.700 |
| 4 | 31.665 | 32.039 | 31.5000 | 31.700 |
| 5 | 31.680 | 31.714 | 31.5000 | 31.700 |
| 6 | 31.785 | 31.404 | 31.9000 | 31.600 |
| 7 | 31.745 | 31.962 | 32.6000 | 31.600 |
| 8 | 31.665 | 31.474 | 32.7000 | 31.700 |
| 9 | 31.815 | 31.428 | 32.0000 | 31.700 |
| 10 | 31.785 | 31.575 | 31.5000 | 31.600 |
| Average | 31.713 | 31.746 | 31.910 | 31.6800 |
| SD | 0.076 | 0.261 | 0.540 | 0.0632 |
| CoV(%) | 0.24 | 0.82 | 1.69 | 0.20 |
QA/QC was completed with a sample of CRM manufactured by the USGS, known as NOD-P-1, at all laboratories except for ALS, who used alternative CRMs. Previous analysis of the USGS-NOD-P-1 was completed at ALS for a separate analytical program, and these results are included in Table 10.8 showing CRM results for each of the laboratories. All values are in weight%.
| Table 10.8 | CRM results for each laboratory |
| Lab | Nickel (Ni) | Copper (Cu) | Cobalt (Co) | Manganese (Mn) |
| PAMCO | 1.372 | 1.171 | 0.233 | 29.92 |
| ALS | 1.34 | 1.15 | 0.22 | 29.12 |
| KPM | 1.28 | 1.14 | 0.21 | 28.3 |
| SGS | 1.31 | 1.15 | 0.22 | 29.4 |
The results showed good alignment between the laboratories using varying analytical methodologies providing confidence in the results. It is the QP’s opinion that analytical methods used for the metallurgical samples were suitable and provided reliable results.
| amcconsultants.com | 206 |
| Technical Report Summary of Prefeasibility Study of NORI Area D, Clarion Clipperton Zone | |
| TMC the metals company Inc. | 0225054 |
| 10.3.2 | Key findings of calcination at FLS |
The nodules were successfully calcined by FLS in a 15 m long, 0.9 m diameter kiln under conditions consistent with the intended commercial operation. Table 10.9 summarizes the updates to the process design criteria arising from the calcining test work at FLS.
| Table 10.9 | Updates to process design criteria after pilot kiln test work |
| Parameter | Units | PEA Basis |
FLS
Pilot Kiln/Update |
Comment |
| Nodule Angle of Repose | Deg. | N/A | 42.5 | Email from R. Penso, 24-Feb-21 10:24 AM |
| Degree of Nickel Reduction | % | 20 | 20 | FLS did not detect any Ni reduction, but given the degree of Fe reduction, it is expected. Therefore, keep PEA value |
| Degree of Cobalt Reduction | % | 30 | 30 | Not measured, keep PEA value |
| Degree of Copper Reduction | % | 50 | 50 | Not measured, leave at PEA value |
| Degree of Iron Reduction to Wüstite | % | 85 | 100 | None to metallic |
| Degree of Iron Reduction to Magnetite | % | 15 | N/A | |
| Degree of MnO2 to MnO by Thermal Decomposition | % | 80 | Based on MnO2 from 48.74% to avg 9.7% during oxidizing run | |
| Degree of MnO2 to MnO by Reduction | % | 20 | By difference. No detectable MnO2 after reduction runs | |
| LOI in Calcine | % | 0.5 | 0.4 | Average during oxidizing at 950°C |
| Dusting Rate of Nodules | % | 5 | 5 | Pilot was 2.1% dry basis, but this may be optimistic given the scale vs. commercial. FLS tumble test gave similar results to laterites, but fines screened out in both cases. FLS conclusion: “Given the lack of fines present in the nodule sample the overall dusting potential is lower than typical nickel laterite kiln operations”. So, leave at 5% |
| Dust Nickel Enrichment Factor (Dust/Feed) | wt/wt | 1.3x | 1.0x | If anything, Ni in dust is depleted |
| Dust Iron Enrichment (Dust/Feed) | wt/wt | 1.3x | 1.0x | Fe in feed, sediment and baghouse dust all about the same. Also, Co, Cu about the same as in feed |
| Dust Potassium Enrichment (Dust/Feed) | wt/wt | 5x | Na also said to be higher* | |
| LOI in Dust | dry wt% | 5 | 16 | Same as feed** |
| Moisture in Dust | wt% | 5 | 3 | 2.91% measured |
| Notes: | *Na in feed = 1.77%, Na in dust = 2.6, i.e., possibly within assaying error. | |
| **Unexpected since TGA tests show low temperature weight loss. |
| 10.3.3 | Piloting – Electric furnace smelting at XPS – Metallurgical summary |
Table 10.10, Table 10.11, Table 10.12, and Table 10.13 compare the principal elements for the main stages of pyrometallurgical processing (calcination, smelting, sulfidation, and converting) between the piloting campaigns and the latest version of a process model developed for the project (PEA update, 2020). The process model was originally derived from a nickel laterite model, which was modified as understanding of the differences for the nodule system has developed over the course of the project. The results obtained in the piloting campaigns allowed for further refinement of process modelling for nodule processing.
| Table 10.10 | Pilot calcine blend assay vs. PEA update mass balance |
| Smelting | % Ni | % Co | % Cu | % Mn | % Fe | % S |
| Mass Balance Calcine | 1.58 | 0.16 | 1.29 | 35.2 | 7.55 | 0.12 |
| Pilot Calcine Blend | 1.66 | 0.15 | 1.32 | 37.2 | 7.76 | 0.27 |
| amcconsultants.com | 207 |
| Technical Report Summary of Prefeasibility Study of NORI Area D, Clarion Clipperton Zone | |
| TMC the metals company Inc. | 0225054 |
Table 10.11 compares smelting campaign metal tap major element assays to the values in the project process model. There is significant assay variation. On average, nickel and cobalt grades are high compared to the mass balance values—nickel, was high in calcine. Manganese was lower in the alloy than expected given the relatively high iron, which may provide some insight into the relationship between degree of reduction and the relative concentration of these elements reporting to the alloy. Sulfur is a deleterious element for ferronickel producers and has received considerable attention in process modelling. Clearly, the nodule process, with its different slag chemistry, does not appear to have this issue. By inspection of the %S columns in Table 10.11 and Table 10.12, it can be seen that sulfur deports much more to slag and much less to metal than is normally assumed for nickel laterite slags.
| Table 10.11 | Pilot metal assays vs. PEA update mass balance |
| Smelting | % Ni | % Co | % Cu | % Mn | % Fe | % S |
| Mass Balance Furnace Alloy | 15.8 | 1.5 | 12.5 | 3.6 | 61.9 | 0.54 |
| Pilot Average* | 18.1 | 1.9 | 11.9 | 1.1 | 65.0 | 0.03 |
| Campaign 1 (Tap 11) | 15.6 | 1.5 | 10.3 | 1.4 | 67.5 | 0.03 |
| Campaign 2 (Tap 8) | 17.7 | 1.5 | 10.1 | 1.2 | 65.1 | 0.00 |
| Campaign 2 (Tap 15) | 18.6 | 2.4 | 12.3 | 0.8 | 63.3 | 0.05 |
| Campaign 2 (left in furnace) | 20.4 | 2.1 | 14.8 | 1.0 | 64.1 | 0.03 |
Note: *Simple average, not weighted
Table 10.12 compares the ranges for slag chemistry from the main slag taps for the two campaigns to the mass balance values. The mass balance values lie within the range achieved. Phosphorus can be controlled to the levels in the mass balance.
| Table 10.12 | Pilot smelting slag assays vs. PEA update mass balance |
| Smelting | % Mn | % Fe | % Si | % P | % S |
| Mass Balance Furnace Slag | 40.7 | 1.8 | 10.9 | 0.06 | 0.05 |
| Campaign 1 | 39.1 – 43.0 | 1.0 – 7.9 | 10.2 – 11.3 | 0.01 – 0.17 | 0.41 – 1.07 |
| Campaign 2 | 40.1 – 44.1 | 0.8 – 4.8 | 9.9 – 11.2 | 0.02 – 0.23 | 0.34 – 0.49 |
In Table 10.13, the matte sample that was closest to the target intermediate matte (i.e. the nearly steady-state operating point of the sulfidation vessel in the commercial process) is compared to the mass balance composition. The target sulfidation operating point is 30% Fe and the closest sample to that was at 35.6% Fe. The table also compares the final matte obtained in the pilot campaign to the mass balance final matte. Pilot nickel levels seem significantly higher than projected whereas cobalt is lower. It should be borne in mind that the mass balance is based on the recycle of slag from the finishing vessel back to the sulfidation vessel to improve pay-metal recoveries, which was not possible for the pilot work. This explains the low value for cobalt, which has a much lower partition coefficient than nickel and copper at low levels of iron in matte. This highlights why it is important not to rely on the recoveries achieved in the once-thru test work, but instead to apply measured partition coefficients to the process model to estimate recoveries in the commercial plant. The recirculating loads will have little impact on these coefficients.
| amcconsultants.com | 208 |
| Technical Report Summary of Prefeasibility Study of NORI Area D, Clarion Clipperton Zone | |
| TMC the metals company Inc. | 0225054 |
| Table 10.13 | Pilot matte assays vs. PEA update mass balance |
| Sulfidation, Converting | % Ni | % Co | % Cu | % Mn | % Fe | % S |
| Mass Balance Intermediate Matte | 27.3 | 3.0 | 20.6 | 0.01 | 30.0 | 13.0 |
| Pilot Closest (Matte 4) | 28.5 | 2.4 | 18.4 | 0.04 | 35.6 | 13.6 |
| Mass Balance Final Matte | 40.9 | 3.4 | 30.5 | 0.01 | 5.0 | 20.0 |
| Pilot Final Matte | 45.8 | 2.8 | 30.5 | 0.00 | 9.9 | 16.4 |
Overall, it can be concluded that the pilot campaigns to process the calcine to matte for subsequent hydrometallurgical treatment largely achieved the expected metal and matte targets, albeit falling somewhat short on iron concentration target, while providing additional insights into the metallurgy of nodule processing.
| 10.3.4 | Smelting: metallurgical results |
Metallurgical control was generally good and covered a range of compositions and degrees of reduction. This is best illustrated by the amount of residual iron in slag, which ranged from just under 1% to nearly 5%, whereas the current mass balance for the project is targeted at 1.8% Fe. While the proposed operating point is within the band of the test work, the range experienced provides an opportunity to understand metallurgical trends as a function of iron grade in the slag.
| 10.3.4.1 | Partition coefficients (PC) in smelting |
Overall recoveries of elements to alloy as reported in the mass balances for the pilot work are not useful for predicting commercial recoveries due to:
| · | Poor accountability in some cases. | |
| · | As already noted, the pilot results encompass a range of conditions with respect to degree of reduction, and not just the target conditions for the commercial operation. | |
| · | The pilot trials did not include recycle streams which are used commercially to maximize pay metal recovery. |
Instead, predictions of recovery can be made using partition coefficient information from the test work at the target degree of reduction. This is represented by the amount of iron reduced to the alloy or the iron content of the resultant slag, which is currently 1.8% Fe in the process model, but may be adjusted to 1.5% (see Section 10.3.4.2).
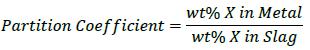
Copper partition coefficients
Figure 10.2 shows
the Cu partition coefficients (PCCu) reported for the two smelting campaigns as a function of iron grade in the slag. There are reasonably
clear trends—particularly for Campaign 2— showing higher coefficients at lower iron, i.e., more reducing conditions. Also
shown is the target point in the process model (PCCu = 130 at 1.8% Fe displayed as a  ).
It lies near the middle of the pilot data at that given amount of iron in slag. There is a case to be made for the Campaign 2 data being
better than for Campaign 1 due to better temperature control, which would yield PCCu = ~190 at 1.5% Fe, however it is recommended that
it is left at the current more-conservative value.
).
It lies near the middle of the pilot data at that given amount of iron in slag. There is a case to be made for the Campaign 2 data being
better than for Campaign 1 due to better temperature control, which would yield PCCu = ~190 at 1.5% Fe, however it is recommended that
it is left at the current more-conservative value.
| amcconsultants.com | 209 |
| Technical Report Summary of Prefeasibility Study of NORI Area D, Clarion Clipperton Zone | |
| TMC the metals company Inc. | 0225054 |
| Figure 10.2 | Copper partition coefficients during smelting |
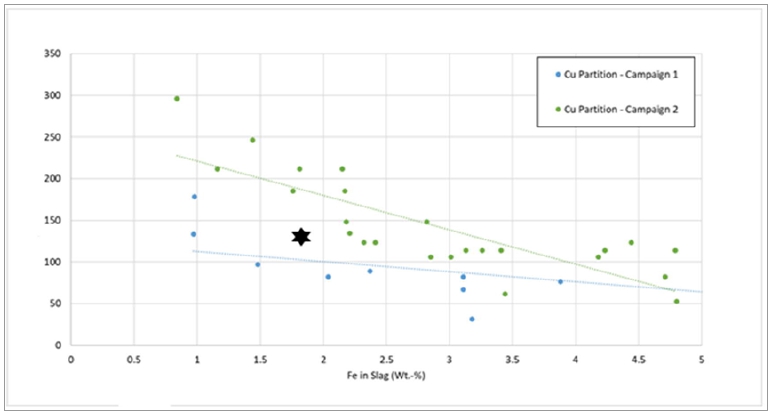
Nickel and cobalt partition coefficients
Figure 10.3 shows the partition coefficients for nickel and cobalt obtained during the smelting campaigns. There is a great deal of scatter and no clear trend with iron (degree of reduction). One major reason for the scatter is that the concentrations reported in slag are very low. As reported in the pilot mass balances (excluding outliers):
| · | Nickel ranges between 0.010 to 0.060. | |
| · | Cobalt between 0.001 to 0.007. |
Thus, the partition coefficients are highly sensitive to slight variations due to assay uncertainties.
Current process model (1.8% Fe) values for nickel and cobalt partition coefficients during smelting are 285 and 120 respectively and these are shown as X (nickel partition coefficient = 285) and Δ (cobalt partition coefficient = 120) in Figure 10.3. They are clearly at the lower end of the range calculated for the pilot plant operation. However, given the wide scatter and assay uncertainty of the pilot data, it is not proposed to change the process model values. It can be said, however, that the pilot values certainly don’t indicate that the commercial values will be any lower than the current model values.
| amcconsultants.com | 210 |
| Technical Report Summary of Prefeasibility Study of NORI Area D, Clarion Clipperton Zone | |
| TMC the metals company Inc. | 0225054 |
| Figure 10.3 | Nickel and cobalt partition coefficients during smelting |
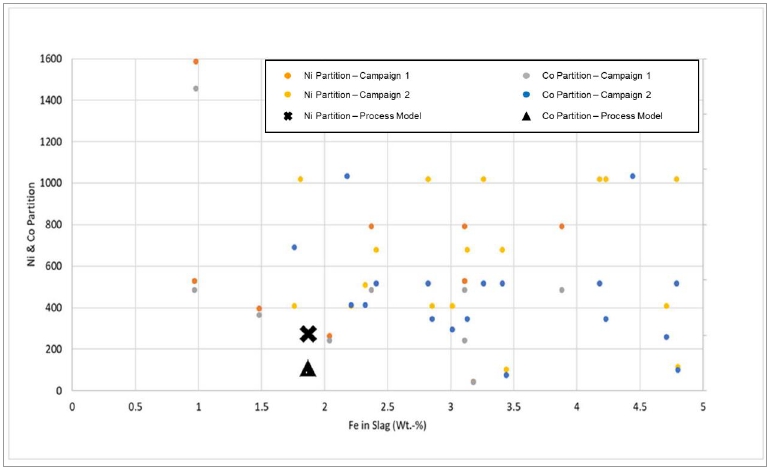
Manganese deportment
Figure 10.4 shows
manganese in metal versus iron in slag. There is considerable scatter but there are no high levels of manganese in metal. The values
are generally lower than what was achieved during Smelt Test 8 at KPM during the bench-scale testing (considered to be a benchmark),
which is favourable considering any of the over-reduced smelt tests at KPM yielded manganese in metal levels of up to 50%. While Campaign
2 appears to show a trend to lower manganese at higher iron in slag, which would be expected, the same cannot be said of Campaign 1.
The data support that, for an operating range of
1-2% Fe in slag, a value for manganese in metal of 2.5% manganese can be adopted in process modelling.
| amcconsultants.com | 211 |
| Technical Report Summary of Prefeasibility Study of NORI Area D, Clarion Clipperton Zone | |
| TMC the metals company Inc. | 0225054 |
| Figure 10.4 | Manganese in metal vs. iron in slag |
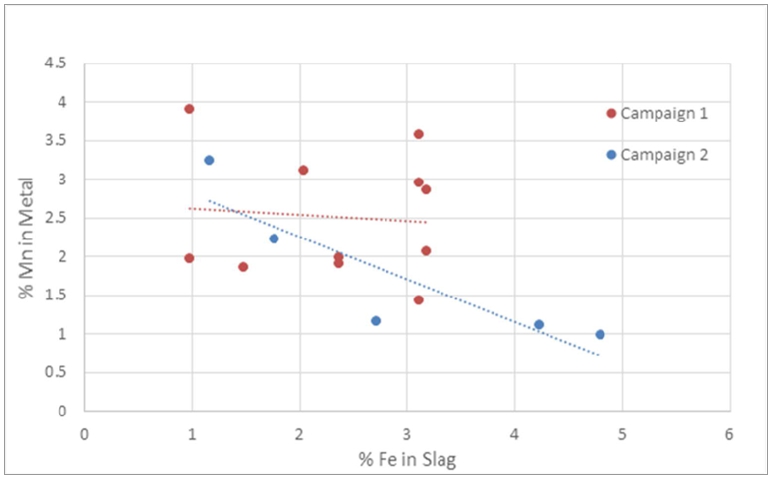
Phosphorus partition coefficient
Figure 10.5 shows phosphorus partition coefficients for both campaigns combined. The PEA model used a value of 25, with iron at 1.8%, which is broadly in keeping with the data from the pilot operation. Using the regression curve will give a phosphorus partition coefficient of approximately 30 at 1.5% Fe in slag.
| amcconsultants.com | 212 |
| Technical Report Summary of Prefeasibility Study of NORI Area D, Clarion Clipperton Zone | |
| TMC the metals company Inc. | 0225054 |
| Figure 10.5 | Phosphorus partition coefficients |
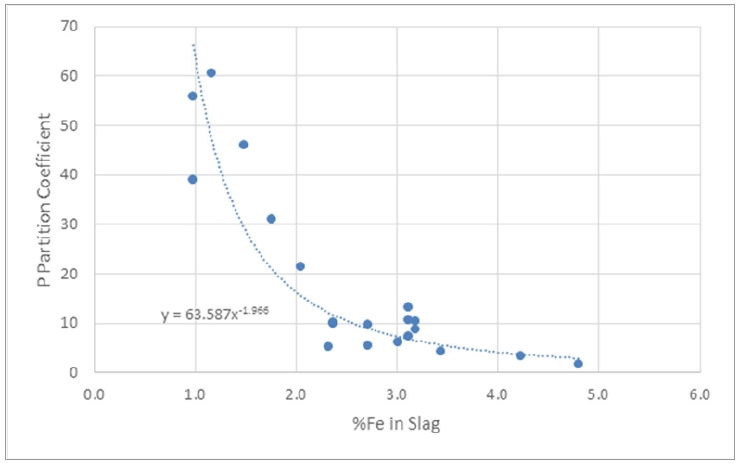
| 10.3.4.2 | Slag chemistry |
The slag produced during smelting is proposed to be sold as a feed to the silico-manganese industry. Desirable feeds are high in manganese and low in iron and phosphorus. A simplified guidance is:
| · | Mn >40% or MnO >50%, | |
| · | Mn/Fe ~25 or FeO ~2%,and | |
| · | Mn/P >670. |
In Figure 10.6, it can be seen that for iron at or below 2% Fe, manganese in slag is about 43% Mn (59% MnO). At 1.5% Fe, both the Mn/Fe ratio and %FeO requirements are met. There is a clear trend for low phosphorus at low iron, and at 1.5% Fe, phosphorus in slag appears likely to be below 0.05% P, yielding Mn/P > 860. Iron at 1.5% Fe is quite close to the current process model value of 1.8% Fe, which was based on reducing 80% of the iron from the slag.
| amcconsultants.com | 213 |
| Technical Report Summary of Prefeasibility Study of NORI Area D, Clarion Clipperton Zone | |
| TMC the metals company Inc. | 0225054 |
| Figure 10.6 | Manganese and phosphorus in slag versus iron in slag |
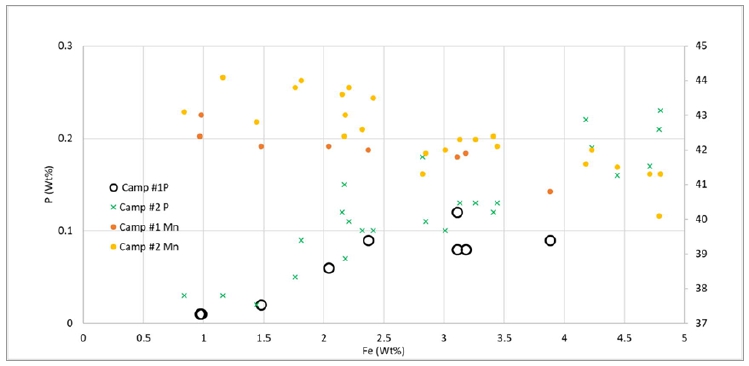
| 10.3.4.3 | Elemental distribution – partition coefficients in converting |
In the commercial operation, the sulfidation vessel operates within a narrow range of chemistry near the target intermediate matte composition (currently 30% Fe). This matte composition is selected so as to produce a slag that has acceptable pay-metal losses and can be sold as aggregate or similar useful product. The matte is then taken to a finishing vessel where the iron is blown down to the target grade (currently 5% Fe). This produces a slag that has higher levels of pay-metals and needs to be recycled back to the sulfidation vessel to achieve acceptable overall recoveries. It was not possible to perform slag recycle in the piloting process and thus the overall recoveries achieved in pilot sulfidation and converting are not representative of the proposed commercial operation. Instead, the partition coefficients obtained during piloting can be considered for use in the process model—which does include slag recycle—to calculate commercial recoveries.
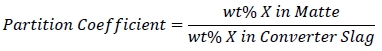
The following sub-sections show the partition coefficients reported for the pilot work together with small scale work performed with artificial mattes at XPS (XPS, 2020). Also shown, where available, are partition coefficients from two commercial smelters (Benchmark A and B) processing Ni-Cu-Co sulfide concentrates. (Benchmark A’ information is the same operation as Benchmark A but is from a different source).
The availability of benchmark information for commercial converting operations means that there needs to be less reliance placed on the pilot results for nickel, copper and cobalt (unlike smelting, where there are no commercial benchmarks for this system). The pilot converting was perhaps the most challenging part of the piloting. Nevertheless, the partition coefficients obtained were reasonably in line with the benchmark values (perhaps to the low side). In general, it can be said that the proposed commercial converting operation should be able to obtain partition coefficients within the range of pilot, small-scale and benchmark values.
Given the importance of these coefficients to overall recoveries, the relevant samples were sent to another laboratory for re-assay. There were no significant differences.
| amcconsultants.com | 214 |
| Technical Report Summary of Prefeasibility Study of NORI Area D, Clarion Clipperton Zone | |
| TMC the metals company Inc. | 0225054 |
Nickel partition coefficients
Figure 10.7 shows nickel partitions from test work and benchmark. The results from piloting are disappointingly low compared to the small-scale (artificial matte) results and two sets of benchmark numbers. They are, however, in agreement with the ‘Benchmark A’ information (no trendline was plotted for those data).
| Figure 10.7 | Nickel partition coefficients in converting |
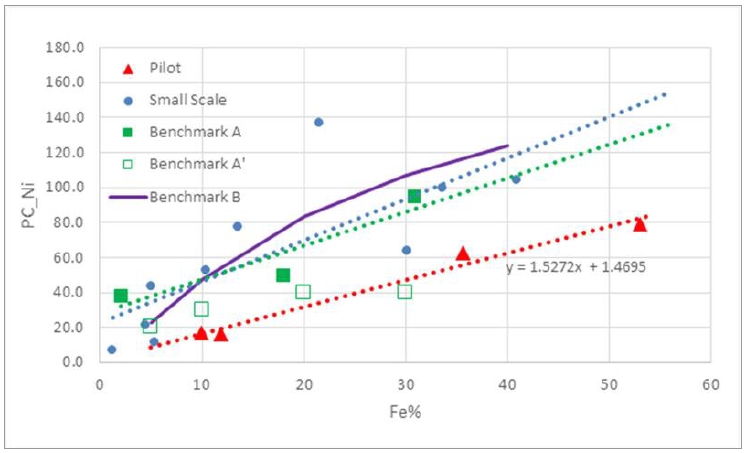
Copper partition coefficients
Results and benchmarks for copper are shown in Figure 10.8. In the range of interest, there are no obvious trends with %iron in matte. There is little to differentiate the different sets of data.
| amcconsultants.com | 215 |
| Technical Report Summary of Prefeasibility Study of NORI Area D, Clarion Clipperton Zone | |
| TMC the metals company Inc. | 0225054 |
| Figure 10.8 | Copper partition coefficients in converting |
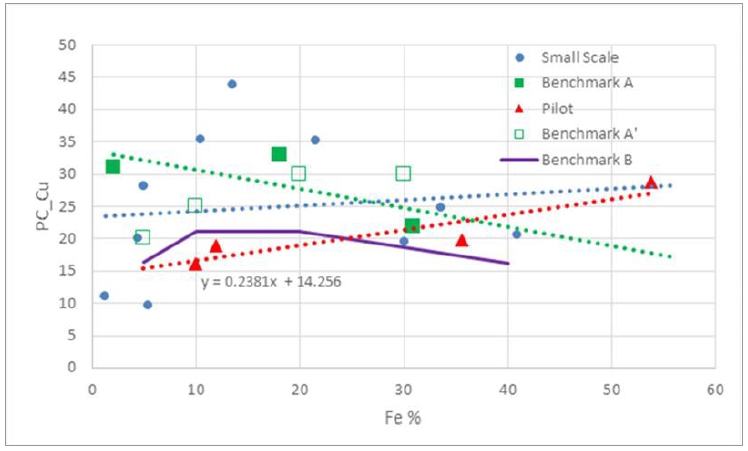
Cobalt partition coefficients
Figure 10.9 shows partition information for cobalt. The pilot trend at the slag discard point (30% Fe) is within the range of benchmark and small-scale test work results.
| amcconsultants.com | 216 |
| Technical Report Summary of Prefeasibility Study of NORI Area D, Clarion Clipperton Zone | |
| TMC the metals company Inc. | 0225054 |
| Figure 10.9 | Cobalt partition coefficients in converting |
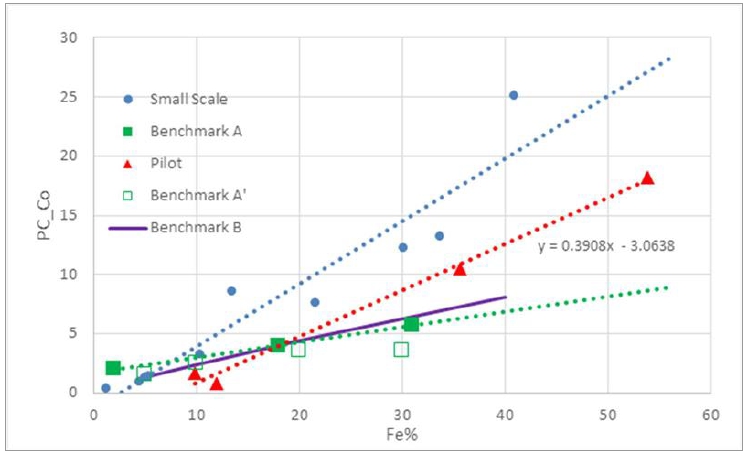
Manganese partition coefficients
Manganese partition coefficients are shown in Figure 10.10. The pilot data are few and widely scattered. They do not provide any conclusive information. The current process model has simply adopted a fixed value for manganese in product matte, namely 0.01wt%. It is proposed that manganese deportment be changed to a partition coefficient basis using the small-scale correlation shown in Figure 10.10.
| amcconsultants.com | 217 |
| Technical Report Summary of Prefeasibility Study of NORI Area D, Clarion Clipperton Zone | |
| TMC the metals company Inc. | 0225054 |
| Figure 10.10 | Manganese partition coefficients in converting |
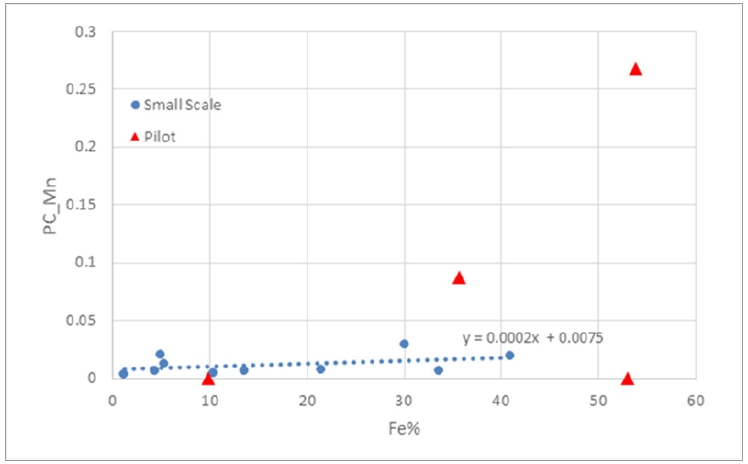
| 10.3.5 | Demonstration scale trials at PAMCO |
TMC and PAMCO recently completed a demonstration scale trial at PAMCO’s existing RKEF facility in Hachinohe, Japan, using the 2000 t of nodules collected from NORI Area D. The nodules were calcined over six campaigns using Rotary Kiln #6, which has been designated by PAMCO for TMC use when commercial operations commence. The calcine was collected in storage bins and smelted over four campaigns in PAMCO’s 4,000 kVA furnace. The furnace is located in PAMCO’s recycling operation and has previously been used to process fly ash, though at the time of the trials it was not in operation.
Several calcining campaigns were required as the calcine had to be cooled prior to transfer to the smelting facility and the hot calcine storage capacity was limited. The time between campaigns was four to six weeks which allowed for the cooling and transfer of the calcine.
During the smelting campaigns, it was determined that better manganese silicate properties could be obtained by changing the iron in slag target down from 1.8 to 1.1. The reduction in iron drives the manganese to phosphorus ratio to be greater than 1000, which is very desirable for the market. The resultant manganese silicate that was produced under these conditions represents an even more attractive product composition relative to the original target. TMC and PAMCO are presently evaluating these results to finalize/revise the product specifications, with a goal of having a better manganese product available for sale when production begins. These results will inform the specification targets required to be met by PAMCO as outlined in the definitive agreement. The improvement to the target manganese silicate specification will also feed into a revision of TMC’s marketing material and conversations with external parties around the sale of the product.
| amcconsultants.com | 218 |
| Technical Report Summary of Prefeasibility Study of NORI Area D, Clarion Clipperton Zone | |
| TMC the metals company Inc. | 0225054 |
The smelting campaign also assessed refractory wear, and the results show that greater lining erosion was experienced in comparison to baseline laterite operations. Furnace upgrade modifications will be required for long term vessel integrity, workplace safety and equipment reliability. These furnace upgrades will represent the main capital scope required in the tolling arrangement within the definitive agreement, amongst other relatively minor modifications and associated capital that will be required.
The campaigns were able to produce demonstration quantities of on target alloy and manganese silicate. These materials are planned for use in potential downstream product development, as well as for product samples for marketing and demonstration purposes.
The campaigns also proved that the offgas cleaning equipment works for nodule feed as is, and all emissions were compliant with relevant regulations. Overall, it was demonstrated that all major process parameters were all in line with expectations, and the operator has confirmed that stable operations producing target products is achievable commercially.
| 10.3.6 | Hydrometallurgical refinery bench scale testing |
Following the generation of matte at XPS, a bench-scale hydrometallurgical refining program was conducted by TMC at the SGS Canada testing facility in Lakefield, Ontario. The program culminated in generation of nickel and cobalt sulfate crystals, which represent final products that TMC USA intends to produce out of the US-based refinery from Year 6 onward.
| 10.3.6.1 | Two-stage leaching |
Bench-scale leach
tests demonstrated that high levels of nickel and cobalt leaching
(75% Ni, 63% Co) from the matte were possible in the atmospheric leach stage provided the matte was exposed to sufficient oxidizing conditions.
While initial testing achieved desired nickel and cobalt performance, the resulting leach liquors contained excessively high amounts
of copper for the two-stage leach approach. Through a process development program, various test parameters were evaluated to assess their
impact on reducing copper levels in the leach liquors. Variations in oxidization time, overall reaction time, and acid addition were
all considered, and it was determined that an atmospheric leach with an acid addition of 498 kg/t and 48-h overall retention time was
able to achieve 75% nickel extraction while limiting copper levels in the PLS to just 0.6 g/L. The optimized atmospheric leach was operated
under oxidizing conditions for the initial 6 h with the reactor operated under slight pressure to improve the oxygen contact time in
the lab scale reactor and then without atmosphere control for the remainder of the test.
The second stage of leaching is a pressure oxidation (POX) performed on the Atmospheric Leach (AL) residue, and the results from this program indicated that at 180 °C and 600 kPa oxygen overpressure, 98% of the nickel was leached from the AL residue. This resulted in overall nickel leaching of 99.5% while also leaching 97% of the copper. Key parameters and results of the optimized AL and POX conditions are listed in Table 10.14. Assays of notable components for both liquors and residues from the atmospheric leach and POX are shown in Table 10.14.
| Table 10.14 | Optimum leach parameters and extractions |
| Leach | Temp (°C) |
Time (hr) |
Oxygen
over-pressure (kPa) |
Stage
Extractions (%) | |||
| Ni | Cu | Co | Fe | ||||
| AL | 95 | 48 | 70 | 75 | -15 | 56 | -17 |
| POX | 180 | 2 | 600 | 98 | 97 | 98 | -1 |
| amcconsultants.com | 219 |
| Technical Report Summary of Prefeasibility Study of NORI Area D, Clarion Clipperton Zone | |
| TMC the metals company Inc. | 0225054 |
| Table 10.15 | Optimum leach assays |
| Leach | Liquor
Assays (g/L) |
Residue (%) | |||||||
| Ni | Cu | Co | Fe | H2SO4 | Ni | Cu | Co | Fe | |
| AL | 84.1 | 0.59 | 4.72 | 0.003 | 0 | 15.5 | 52.7 | 1.64 | 3.60 |
| POX | 16.6 | 50.3 | 1.62 | 0.19 | 14 | 0.51 | 5.28 | 0.11 | 37.9 |
| 10.3.6.2 | Cobalt refining |
The first stage of the processing for the PLS was a pH adjustment stage, where the pH of the PLS was increased to 4.9 to remove additional copper and any trace iron remaining. Lab-scale cobalt solvent extraction (CoSX) testing was conducted using a solvent mixture of 10% Cyanex 272 in Exxsol D80 at an organic to aqueous phase ratio (O/A) of 1/1, a contact temperature of 40 °C, and an equilibrium contact pH of 5.0 via the addition of ammonium hydroxide solution. Process development resulted in selection of a 10 g/L cobalt as cobalt sulfate solution as the aqueous feed to the CoSX scrubbing tests in which magnesium and trace levels of co-loaded nickel were fully removed from the loaded organic phase. Sulfuric acid was used to strip the organic phase. Assays for the feed (pH adjusted AL PLS) and the resultant strip liquor are summarized in Table 10.16.
| Table 10.16 | Assays of input and output streams from the CoSX |
| Stream | Ni (g/L) |
Cu (g/L) |
Co (g/L) |
Mn (g/L) |
Mg (g/L) |
| CoSX Feed Liquor | 84.3 | 0.55 | 5.10 | 0.10 | 0.605 |
| CoSX Strip Liquor | < 0.1 | 4.80 | 79.4 | 2.00 | 0.044 |
Process development testing has demonstrated that copper ion exchange (CuIX) using Lewatit® MDS TP 208 is able to fully extract the copper from the CoSX strip liquor. Multiple resins were tested for the removal of manganese from the cobalt strip liquor without success, but oxidation of manganese from the soluble Mn2+ state to the nonsoluble Mn4+ has been demonstrated to be successful. In initial laboratory tests, this is achieved using Caro’s acid (H2SO5, made by combing sulfuric acid and hydrogen peroxide). The cobalt refining work culminated in the generation of cobalt sulfate crystals. TMC sourced an external third-party specification for cobalt sulfate, and compared them with analysis of the lab-generated cobalt sulfate crystals produced as SGS, presented in Table 10.17.
| Table 10.17 | Comparison between TMC's lab-generated cobalt sulfate crystals with an external third-party specification |
| TMC Result | Comparative Specification | |
| Co (wt%) |
22.1 | > 20.5 |
| Cu (ppm) |
< 5 | < 5 |
| Ca (ppm) |
< 100 | < 50 |
| Fe (ppm) |
< 100 | < 10 |
| Mg (ppm) |
82 | < 100 |
| Na (ppm) |
< 100 | < 300 |
| amcconsultants.com | 220 |
| Technical Report Summary of Prefeasibility Study of NORI Area D, Clarion Clipperton Zone | |
| TMC the metals company Inc. | 0225054 |
| 10.3.6.3 | Nickel refining |
Nickel solvent extraction (NiSX) testing was conducted on samples of CoSX raffinate produced during CoSX testing, identifying 40% Versatic 10 in Exxsol D80 as the desired solvent mixture for the loading of nickel. Optimum contact pH was 6.35, and contact temperature was 50°C. Trace levels of cobalt, magnesium, and manganese were scrubbed using a 15 g/L nickel as nickel sulfate solution. The scrubbed organic was stripped with sulfuric acid to produce a strip liquor that assayed at 117 g/L nickel. The strip liquor was further concentrated via evaporation to directly produce nickel sulfate crystals with a calculated purity of 99.996% (total impurity content of 40 g/t). As with cobalt sulfate, TMC sourced some external third-party specifications and compared them with the analyses of the crystals generated at SGS, presented in Table 10.18.
| Table 10.18 | Comparison between TMC's lab-generated nickel sulfate crystals with two external third-party specifications |
| TMC Result | Comparitive Specification 1 | Comparative Specification 2 | |
| Ni (wt%) |
>= 22.0 | >= 22.0 | >= 22.0 |
| Cu (ppm) |
< 1 | <= 5 | <= 5 |
| Ca (ppm) |
< 20 | <= 20 | <= 50 |
| Fe (ppm) |
< 5 | <= 10 | <= 10 |
| Mg (ppm) |
2.3 | <= 20 | <= 50 |
| Na (ppm) |
< 20 | <= 500 | <= 200 |
| 10.4 | Processing factors or deleterious elements that may impact extraction |
Iron in final matte
The current process model has a final matte iron composition of 5% iron. The target iron in matte is based on limiting the amount of iron going into the downstream hydrometallurgical refinery (the lower the iron the better) while maintaining reasonable recoveries of pay metals.
Potential economic exploitation of the matte could be affected if the iron content is too high. The eventual customer looking to further refine the matte into individual pay metals components will have issues processing with high iron contents.
Manganese silicate
The manganese silicate product is a key contributor to the overall economic case for the project. With nodules containing almost 30% manganese, the silicate will represent approximately 90% of the product generated from the flowsheet by volume. The intended market for the silicate is as a feed for silico-manganese production, which is a key additive in steel manufacturing. Market analyses have shown that key indicators for a high value product in this area are based on achieving the following targets for manganese silicate as identified in Table 10.19.
| amcconsultants.com | 221 |
| Technical Report Summary of Prefeasibility Study of NORI Area D, Clarion Clipperton Zone | |
| TMC the metals company Inc. | 0225054 |
| Table 10.19 | Target specifications for manganese silicate |
| Component | Target
Specification (wt%) |
| Mn | > 40 |
| Fe | 1 – 2 |
| Mn / P | > 670 |
These targets are based on a combination of high grade of manganese relative to other sources, as well as limiting impurities like iron and phosphorus. During the piloting of TMC’s flowsheet, 25 t of manganese silicate was generated, most of which met the target parameters. The material from the most representative tap (Campaign 2, Tap 4) was then used to perform silico-manganese generation testing at a laboratory in Trondheim, Norway. Results from this program identified at both lab and kilogram scale that silico-manganese can be generated using TMC’s manganese silicate as the sole source of manganese. Producing manganese silicate that meets the targets as outlined in the table above and the success of the program in Norway provided confidence in TMC’s strategy to sell the manganese silicate for use silico-manganese alloy production.
| 10.5 | Summary and QP’s opinion |
TMC has undertaken a metallurgical development process that has included extensive review of relevant technical information in the literature, appropriately scoped and detailed bench-scale and pilot-scale testwork that demonstrated the fundamentals of the process and executed appropriate process engineering to support the project economic analysis. In addition, the scope of the project is to employ existing assets presently operated to produce ferronickel from nickel laterite ore. The nodule feed process is analogous to nickel laterite operations in terms of equipment, consumables, estimated flowrates, temperatures, and other conditions. The estimated data employed compare reasonably with commercial benchmarks.
It is the QP’s opinion that the data are adequate to demonstrate that existing RKEF assets are suitable for smelting polymetallic nodules into saleable products with proven markets that meet potential customer quality requirements. The QP also endorses the fact that preliminary bench scale testing has shown that generation of final nickel and cobalt products suitable for use in battery applications is possible using intermediates derived exclusively from the pyrometallurgical processing of nodules.
| amcconsultants.com | 222 |
| Technical Report Summary of Prefeasibility Study of NORI Area D, Clarion Clipperton Zone | |
| TMC the metals company Inc. | 0225054 |
| 11 | Mineral Resource estimates for NORI Area D |
The Mineral Resource estimate for NORI Area D was updated using sample data collected in 2022 and 2023.
| 11.1 | Software |
The R software for statistical computing (R Core Team 2018), R version 4.3.2 (2023-10-31) – “Eye Holes”), was used for preparing the sample data, statistical plots, generating the experimental variograms and performing spatial estimation.
| 11.2 | Sample data |
| 11.2.1 | TOML sample data |
TOML Area F is adjacent to the western border of NORI Area D. In 2020, NORI acquired the data from this area, including 26 nodule samples (1 historic sample and 25 samples collected by Nautilus Minerals Inc.). The TOML data includes measurements for abundance (wet kg/m2) and assays for manganese (%), nickel (%), copper (%) and cobalt (%). All assays were converted from oxides to elemental values. The TOML data did not include moisture content, so AMC assumed an average moisture content of 26.63%, based on the average moisture content from the campaign C3 and campaign C6 box core samples. AMC included the TOML data for estimating the NORI Area D Mineral Resource because it provides more control of abundance and grade estimates along the western margin of NORI Area D. Summary statistics for the TOML Area F samples are presented in Table 11.1.
| Table 11.1 | Summary statistics of TOML Area F nodule assays |
| Variable | Samples | Missing | Min | Max | Range | Mean | Median | Var | CoV |
| Abundance
(wet kg/m2) |
26 | 0 | 1.19 | 29.13 | 27.94 | 17.97 | 18.07 | 45.36 | 0.38 |
| Moisture (%) | 0 | 0 | 26.63 | 26.63 | 0 | 26.63 | 26.63 | 0 | 0 |
| Abundance (dry kg/m2) |
26 | 0 | 0.87 | 21.37 | 13.18 | 13.18 | 13.26 | 24.42 | 0.38 |
| Nickel (%) | 26 | 0 | 1.05 | 1.51 | 0.46 | 1.41 | 1.42 | 0.01 | 0.06 |
| Copper (%) | 26 | 0 | 1.10 | 1.35 | 0.25 | 1.24 | 1.23 | 0.01 | 0.06 |
| Cobalt (%) | 26 | 0 | 0.09 | 0.17 | 0.08 | 0.13 | 0.13 | 0.00 | 0.14 |
| Manganese (%) | 26 | 0 | 30.11 | 33.62 | 3.51 | 32.18 | 32.35 | 0.81 | 0.03 |
| Silicon (%) | 26 | 0 | 4.56 | 6.57 | 2.01 | 5.23 | 5.09 | 0.22 | 0.09 |
| Iron (%) | 26 | 0 | 4.11 | 7.27 | 3.16 | 6.12 | 6.10 | 0.37 | 0.10 |
| Phosphorus (%) | 26 | 0 | 0.12 | 0.17 | 0.05 | 0.05 | 0.15 | 0.00 | 0.07 |
| 11.2.1.1 | NORI 2018 sample data |
NORI campaign C3, in 2018, focused on collecting close spaced (7 km by 7 km spacing) box core samples supplemented by seafloor photography in an area selected for the Test Mining.
Forty-five sites were sampled with a box core. The assay data set includes 45 primary box core samples (see Table 11.2) and a further 87 duplicates, standards, blanks and other samples. The data includes a suite of assays which include manganese, copper, nickel, cobalt, silicon, iron and phosphorus. The primary sample assays were used for resource estimation. The duplicate sample data were included in the variography because they provide information about the nugget variance.
| amcconsultants.com | 223 |
| Technical Report Summary of Prefeasibility Study of NORI Area D, Clarion Clipperton Zone | |
| TMC the metals company Inc. | 0225054 |
During the NORI 2018 campaign, seafloor photographs were captured along with the box core sampling. The photographs were used to estimate nodule abundance from the relationships between nodule long-axis length, the percentage of the photo covered by identified nodules, and nodule weight. Fourteen (14) seafloor photographs in the Measured Mineral Resource boundary were used to estimate nodule abundance.
| Table 11.2 | Summary statistics of the 2018 NORI Area D primary assay data |
| Number | Missing | Min | Max | Range | Mean | Median | Var | CoV | |
| Abundance (wet kg/m2) | 45 | 1 | 6.50 | 29.90 | 23.40 | 18.00 | 18.10 | 23.694 | 0.27 |
| Moisture (%) | 45 | 0 | 14.71 | 26.63 | 11.92 | 20.94 | 19.90 | 15.229 | 0.19 |
| Abundance (dry kg/m2) | 45 | 0 | 0.01 | 24.38 | 24.38 | 14.00 | 14.15 | 18.342 | 0.31 |
| Nickel (%) | 45 | 0 | 1.18 | 1.45 | 0.27 | 1.37 | 1.39 | 0.004 | 0.05 |
| Copper (%) | 45 | 0 | 0.97 | 1.34 | 0.38 | 1.15 | 1.14 | 0.005 | 0.06 |
| Cobalt (%) | 45 | 0 | 0.09 | 0.15 | 0.05 | 0.13 | 0.13 | 0.000 | 0.10 |
| Manganese (%) | 45 | 0 | 26.44 | 34.33 | 7.88 | 31.28 | 31.69 | 2.557 | 0.05 |
| Silicon (%) | 45 | 0 | 4.81 | 8.06 | 3.25 | 5.53 | 5.34 | 0.420 | 0.12 |
| Iron (%) | 45 | 0 | 4.27 | 8.21 | 3.94 | 6.66 | 6.86 | 0.696 | 0.13 |
| Phosphorus (%) | 45 | 0 | 0.12 | 0.25 | 0.13 | 0.16 | 0.15 | 0.001 | 0.15 |
| 11.2.1.2 | NORI 2019 sample data |
NORI Campaigns 6A and 6B, in 2019, focused on upgrading the NORI Area D Inferred Mineral Resource to Indicated Mineral Resource by collecting close spaced (10 km by 10 km spacing) box core samples.
Box core sampling was attempted at a total of 106 sites in the NORI Area D contract area during Campaign 6A and 101 sites during Campaign 6B. Disturbed samples, considered to be unreliable, were omitted from the sample sequence. Summary statistics for the remaining 207 primary box core samples are presented in Table 11.3.
The data includes a suite of assays which include manganese, copper, nickel, cobalt, silicon, iron, and phosphorus.
| Table 11.3 | Summary statistics of the 2019 NORI Area D primary assay data |
| Number | Missing | Min | Max | Range | Mean | Median | Var | CoV | |
| Abundance (wet kg/m2) | 207 | 0 | 0.08 | 32.99 | 32.92 | 17.55 | 17.13 | 28.98 | 0.31 |
| Moisture (%) | 207 | 0 | 18.40 | 34.50 | 16.10 | 28.10 | 28.50 | 5.445 | 0.08 |
| Abundance (dry kg/m2) | 207 | 4 | 2.00 | 23.13 | 21.13 | 12.88 | 12.39 | 12.621 | 0.28 |
| Nickel (%) | 207 | 4 | 0.91 | 1.49 | 0.57 | 1.38 | 1.40 | 0.006 | 0.06 |
| Copper (%) | 207 | 4 | 0.77 | 1.41 | 0.65 | 1.15 | 1.14 | 0.007 | 0.07 |
| Cobalt (%) | 207 | 4 | 0.09 | 0.45 | 0.36 | 0.14 | 0.13 | 0.001 | 0.21 |
| Manganese (%) | 207 | 4 | 24.23 | 34.46 | 10.24 | 30.95 | 31.19 | 2.543 | 0.05 |
| Silicon (%) | 207 | 4 | 4.74 | 8.97 | 4.23 | 5.61 | 5.39 | 0.472 | 0.12 |
| Iron (%) | 207 | 4 | 3.81 | 11.16 | 7.35 | 6.73 | 6.81 | 0.704 | 0.13 |
| Phosphorus (%) | 207 | 4 | 0.11 | 0.51 | 0.40 | 0.16 | 0.15 | 0.002 | 0.26 |
| amcconsultants.com | 224 |
| Technical Report Summary of Prefeasibility Study of NORI Area D, Clarion Clipperton Zone | |
| TMC the metals company Inc. | 0225054 |
| 11.2.1.3 | NORI 2022 sample data |
NORI Campaign 7A, in 2022, was designed to investigate the test mining area before disturbance by the test activities. The box cores were not sited on a regular grid.
| Table 11.4 | Summary statistics of the 2022 NORI Area D primary assay data |
| Number | Missing | Min | Max | Range | Mean | Median | Var | CoV | |
| Abundance (wet kg/m2) | 20 | 0 | 12.57 | 27.86 | 15.29 | 17.60 | 17.37 | 12.92 | 0.20 |
| Moisture (%) | 20 | 0 | 27.00 | 28.80 | 1.80 | 27.70 | 27.70 | 0.21 | 0.02 |
| Abundance (dry kg/m2) | 20 | 0 | 9.14 | 19.84 | 10.70 | 12.72 | 12.58 | 6.48 | 0.20 |
| Nickel (%) | 20 | 0 | 1.26 | 1.46 | 0.20 | 1.42 | 1.43 | 0.00 | 0.03 |
| Copper (%) | 20 | 0 | 1.09 | 1.17 | 0.09 | 1.13 | 1.13 | 0.00 | 0.02 |
| Cobalt (%) | 20 | 0 | 0.11 | 0.15 | 0.04 | 0.14 | 0.13 | 0.00 | 0.07 |
| Manganese (%) | 20 | 0 | 29.65 | 32.34 | 2.70 | 30.60 | 30.60 | 0.33 | 0.02 |
| Silicon (%) | 20 | 0 | 4.99 | 5.46 | 0.47 | 5.21 | 5.19 | 0.02 | 0.03 |
| Iron (%) | 20 | 0 | 5.69 | 7.39 | 1.70 | 6.92 | 7.08 | 0.22 | 0.07 |
| Phosphorus (%) | 20 | 0 | 0.11 | 0.16 | 0.04 | 0.15 | 0.15 | 0.00 | 0.07 |
| 11.2.1.4 | NORI 2023 sample data |
NORI Campaign 8a was focused on collecting benthic biological data. During this campaign the opportunity was taken to collect box cores to provide additional resource information in areas which had not been directly impacted by the collector test. The box cores were not sited on a regular grid.
| Table 11.5 | Summary statistics of the 2023 NORI Area D primary assay data |
| Number | Missing | Min | Max | Range | Mean | Median | Var | CoV | |
| Abundance (wet kg/m2) |
6 | 0 | 9.19 | 21.45 | 12.26 | 17.23 | 17.93 | 18.75 | 0.25 |
| Moisture (%) | 6 | 0 | 27.80 | 28.70 | 0.90 | 28.30 | 28.20 | 0.11 | 0.01 |
| Abundance
(dry kg/m2) |
6 | 0 | 6.64 | 15.38 | 8.75 | 12.35 | 12.85 | 9.58 | 0.25 |
| Nickel (%) | 6 | 0 | 1.39 | 1.47 | 0.08 | 1.44 | 1.45 | 0.00 | 0.02 |
| Copper (%) | 6 | 0 | 1.13 | 1.25 | 0.12 | 1.18 | 1.17 | 0.00 | 0.04 |
| Cobalt (%) | 6 | 0 | 0.11 | 0.14 | 0.03 | 0.13 | 0.13 | 0.00 | 0.10 |
| Manganese (%) | 6 | 0 | 30.1 | 32.09 | 1.98 | 31.31 | 31.57 | 0.67 | 0.03 |
| Silicon (%) | 6 | 0 | 4.83 | 5.29 | 0.46 | 5.13 | 5.19 | 0.03 | 0.03 |
| Iron (%) | 6 | 0 | 5.75 | 7.19 | 1.44 | 6.53 | 6.51 | 0.36 | 0.09 |
| Phosphorus (%) | 6 | 0 | 0.14 | 0.31 | 0.17 | 0.21 | 0.18 | 0.01 | 0.35 |
| 11.2.1.5 | Representativeness of sampling |
Comparison of the seafloor photographs at the box core sites and the observed distribution of nodules in the box cores indicated that the box core samples were largely undisturbed and representative of the sampled locations.
| amcconsultants.com | 225 |
| Technical Report Summary of Prefeasibility Study of NORI Area D, Clarion Clipperton Zone | |
| TMC the metals company Inc. | 0225054 |
Continuity of grades and abundance between sample points can be reasonably assumed for the following reasons:
| · | Each sampling campaign has confirmed the preceding assessments of continuity of grade and nodule abundance. | |
| · | Statistics of the nodule samples within the blocks of the CCZ show a very low coefficient of variation, which indicates a low risk in estimating and interpolating grades. | |
| · | Variography of the samples within the NORI Area D shows reasonable spatial continuity (Section 11.7.6), with ranges greater than the average sample spacing. Abundance has a more erratic variogram with shorter ranges. | |
| · | The continental scale of the deposit and mode of formation leads to the expectation of low variability. |
The sample density and spacing within the NORI Area D are sufficient to demonstrate continuity of nickel, copper, cobalt, and manganese grades. The reprocessed backscatter data and the low-level seafloor photography from the 2018 campaign indicate strong continuity of nodule abundance across NORI Area D.
| 11.3 | Backscatter |
Backscatter data was collected during 2012 and reprocessed in 2017. The data was reprocessed at a 30 m by 30 m resolution.
| 11.4 | Bathymetry |
Bathymetry data was collected during 2012 and reprocessed in 2020. The data was reprocessed at a 60 m by 60 m resolution. Additional layers representing slope angle and aspect, in degrees, were calculated from the bathymetry.
| 11.5 | Geological domains |
Geological interpretation and definition of geological and geomorphological domains were completed using the bathymetry and backscatter data sets. Figure 11.1 shows the location of the interpreted domains. Figure 11.2 graphically shows the proportions of the various domains.
NORI Area D is dominated by the abyssal plains domain which covers 68.6% of the area. The remainder of the area is generally elevated relative to the plains and is subdivided into seven domains, based on slope angle, and the nature of the seafloor, indicated by analysis of box core land-out images, AUV camera data and AUV sub-bottom profiler.
Analysis showed a good correlation between slopes >6° and the presence of hardground where there were failed box core recoveries (21 sites). Areas with slopes >6°, which cover 6% of NORI Area D, were assumed to be too steep for nodule collection and were excluded from the Mineral Resource estimate.
Volcanic outcrop occurs commonly along and parallel to the abyssal hills, and along the margins between the abyssal hill and abyssal plain domains.
There is also a large area of interpreted volcanic rocks in the southeast part of NORI Area D which is interpreted as a relic volcanic intersection high, which also includes a relic transform parallel trough. Both are volcanic related features related to the Clipperton transform zone. The volcanic high is interpreted to have formed when the Clipperton transform fault was active, at a time when the seafloor was situated at the East Pacific Rise mid-ocean ridge. This is supported by comparison of backscatter texture, outcropping structural fabric within this domain and the associated bathymetric geomorphology.
| amcconsultants.com | 226 |
| Technical Report Summary of Prefeasibility Study of NORI Area D, Clarion Clipperton Zone | |
| TMC the metals company Inc. | 0225054 |
Volcanic cones are found mostly along the southern margin of NORI Area D, in a line running roughly east-west. The volcanic domains are interpreted to be rugged and to carry few nodules. They were excluded from the Mineral Resource estimate.
| Figure 11.1 | Map of geological domains in NORI Area D |
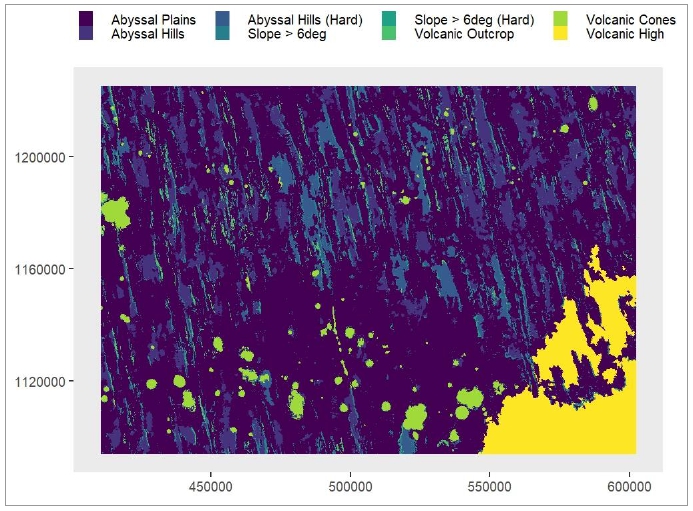
Source: AMC
| amcconsultants.com | 227 |
| Technical Report Summary of Prefeasibility Study of NORI Area D, Clarion Clipperton Zone | |
| TMC the metals company Inc. | 0225054 |
| Figure 11.2 | Proportions of geological domains in NORI Area D |
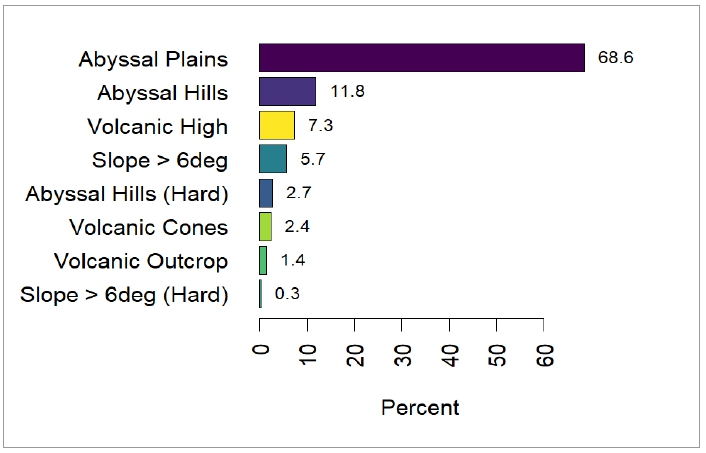
Source: AMC
| 11.6 | Nodule type and sediment drift |
Nodule type (Type 1 and Type 2/3) areas and areas covered by sediment drift were interpreted from the backscatter data and the box core land out videos and box core logging. The distribution of nodule types is shown in Figure 11.3. The areas marked as “NA” are volcanic areas where the presence of nodules is not confirmed.
| amcconsultants.com | 228 |
| Technical Report Summary of Prefeasibility Study of NORI Area D, Clarion Clipperton Zone | |
| TMC the metals company Inc. | 0225054 |
| Figure 11.3 | Map of nodule type domains in NORI Area D |
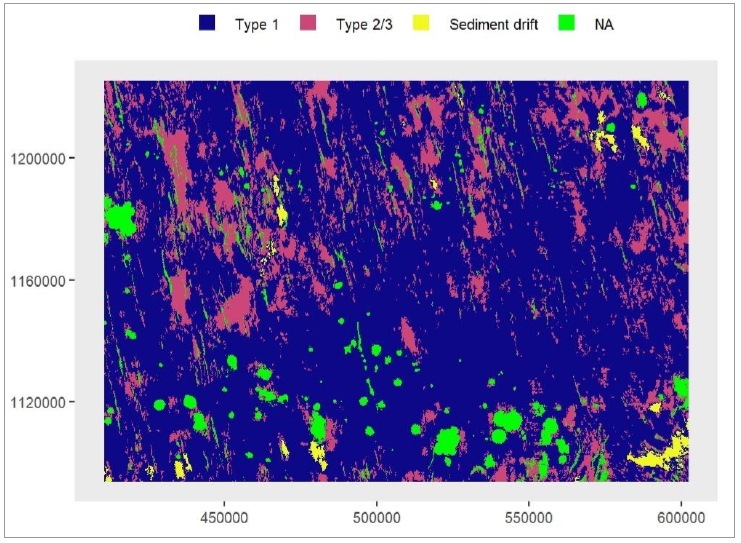
Source: AMC
The larger Type 2 and 3 nodules cover approximately 18% of NORI Area D. The smaller Type 1 nodules are the most common nodule type, covering approximately 81% of the NORI Area D Mineral Resource. The sediment drift domain, a soft sediment ooze with low backscatter, is rare within NORI Area D (1% coverage). A large proportion of the sediment drift occurs in the volcanic high domain and therefore the impact of the sediment drift domain on the Mineral Resource estimate is considered to be negligible. The areas marked as “NA” in Figure 11.3 are volcanic areas (mainly volcanic cones) where the presence of nodules is not confirmed.
| amcconsultants.com | 229 |
| Technical Report Summary of Prefeasibility Study of NORI Area D, Clarion Clipperton Zone | |
| TMC the metals company Inc. | 0225054 |
| 11.7 | Data processing |
For estimation of Mineral Resources in the NORI Area D, the integrated NORI Area Data was filtered to only include NORI Area D and TOML Area F samples (see Figure 11.4).
| Figure 11.4 | Map of Location of Data Points and the NORI Area D Boundary |
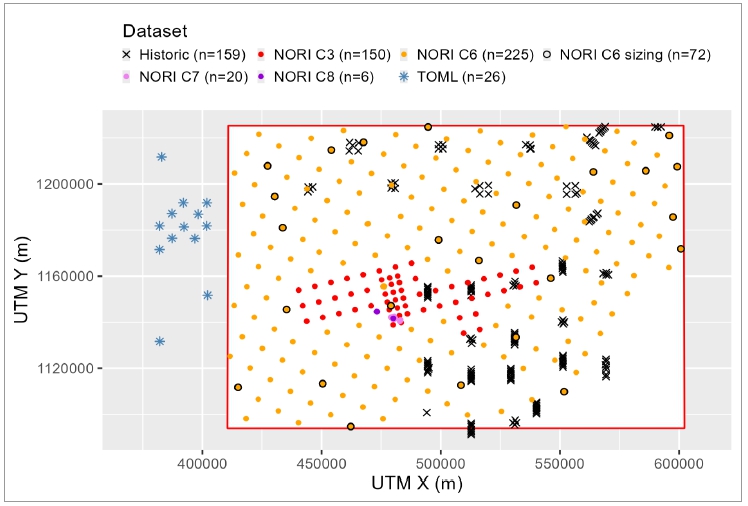
Source: AMC
Further data preparation of the nodule sample data included:
| · | Exclusion of historic data lacking information about moisture content. | |
| · | Calculation of average values for duplicate pairs of box core samples. | |
| · | Imputation any missing values for silicon, iron and phosphorus using standard linear regression calculated using the remaining non-missing variables. | |
| · | Assignation of geological and nodule type domains. | |
| · | Application of projection pursuit multivariate transform to the assays of manganese, copper, nickel, cobalt, silicon, iron and phosphorus. | |
| · | Application of normal scores transform to abundance and moisture. |
These preparation steps are discussed below. The backscatter, slope angle, slope aspect (slope dip direction), and geological domain features were extracted from the GIS grid data at the nodule sample locations. This data was combined with the nodule sample data for analysis.
| 11.7.1 | Exploratory data analysis |
Figure 11.5 presents a matrix of scatter plots of combinations of elements. Outliers (extreme values) detected using the Local Outlier Factor algorithm are highlighted (black crosses). All identified outliers are historic nodule samples and were not used in the 2025 estimate.
Figure 11.5 also reveals that nickel is moderately positively correlated with abundance and cobalt, while manganese is moderately positively correlated with copper and moderately negatively correlated with cobalt. Abundance also shows a weak correlation with copper and cobalt. Copper shows a weak correlation with nickel. Silicon shows a strong negative correlation with manganese.
| amcconsultants.com | 230 |
| Technical Report Summary of Prefeasibility Study of NORI Area D, Clarion Clipperton Zone | |
| TMC the metals company Inc. | 0225054 |
The sample with an anomalously high assay of 0.58% Co is the +50 mm fraction of NORI box core BC_227. The assay was confirmed by reanalysis of the sample pulp. The mass weighted cobalt assay for sample BC 227 is 0.29%.
| Figure 11.5 | Pairs plot showing correlations between NORI Area D sample values18 |
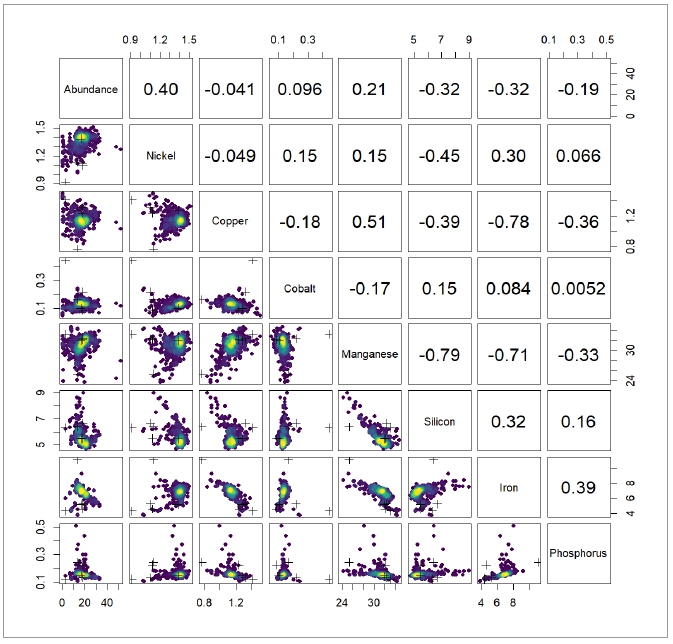
Source: AMC
18 Axes labelled in percentage. Potential outliers (all are historic samples) are shown as crosses. The upper panels show the Pearson correlation coefficient. Averaged co-located data point values.
| amcconsultants.com | 231 |
| Technical Report Summary of Prefeasibility Study of NORI Area D, Clarion Clipperton Zone | |
| TMC the metals company Inc. | 0225054 |
| 11.7.2 | Top-cuts |
Histograms and cumulative frequency plots shown in Figure 11.6 and Figure 11.7 show that the element distributions are generally not strongly-skewed. The exceptions are silica, which has a tail of high values that are associated with ridges, and phosphorus, which has a tail of high values that are probably due to the presence of sharks’ teeth. The red lines in Figure 11.6 and Figure 11.7 represent top-cuts that were used in the 2020 Mineral Resource estimate to limit the influence of outliers. The use of top-cuts made no significant difference to the estimated grades and was discontinued in the 2025 Mineral Resource estimate.
| Figure 11.6 | Histogram, cumulative probability and mean-variance plots of abundance and grades for NORI Area D nodule samples |
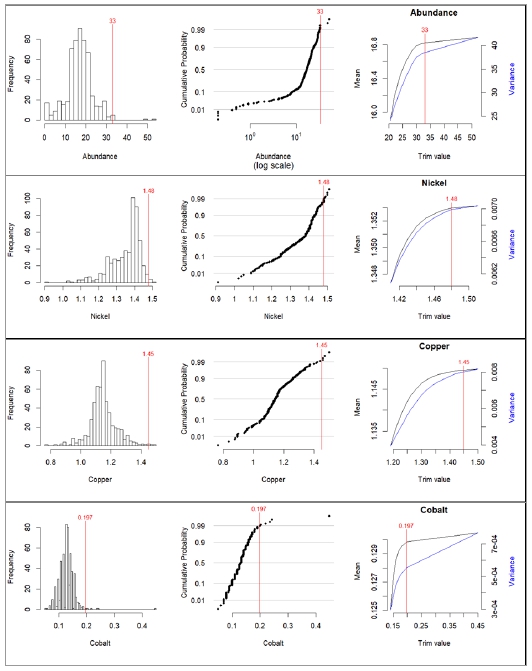
Source: AMC
| amcconsultants.com | 232 |
| Technical Report Summary of Prefeasibility Study of NORI Area D, Clarion Clipperton Zone | |
| TMC the metals company Inc. | 0225054 |
| Figure 11.7 | Histogram, cumulative probability and mean-variance plots of abundance and grades for NORI Area D nodule samples |
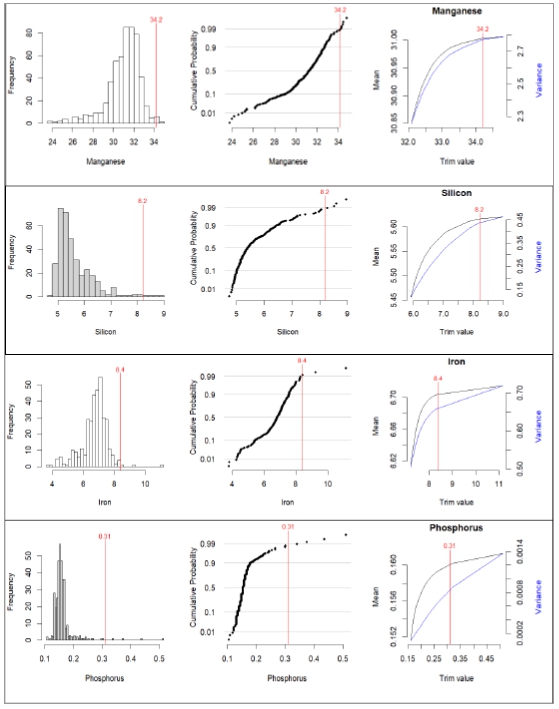
Source: AMC
| amcconsultants.com | 233 |
| Technical Report Summary of Prefeasibility Study of NORI Area D, Clarion Clipperton Zone | |
| TMC the metals company Inc. | 0225054 |
| 11.7.3 | Relationships between nodules and domains |
Geological domains were assigned to the NORI Area D samples by extracting the values based on the sample UTM locations and the geological domain map (gridded image). The TOML Area F samples were all assigned to the abyssal plains domain. The majority of the samples (86.7%) fall within the abyssal hills and abyssal plains domains. The proportions of nodule samples by geological domain are shown graphically in Figure 11.8.
| Figure 11.8 | Frequency of NORI Area D nodule samples by geological domains |
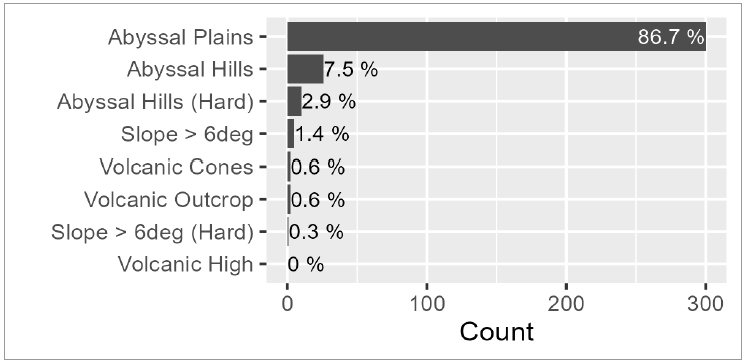
Source: AMC
Nodule facies domains were assigned to the NORI Area D samples based on the sample UTM locations and the nodule type domain map. The TOML Area F samples were all assigned to Type 1 domain. The majority of the samples (86.4%) fall within the Type 1 nodule facies domain. The proportions of nodule samples by nodule domain are shown graphically in Figure 11.9.
| Figure 11.9 | Frequency of NORI Area D nodule samples by nodule type domains |
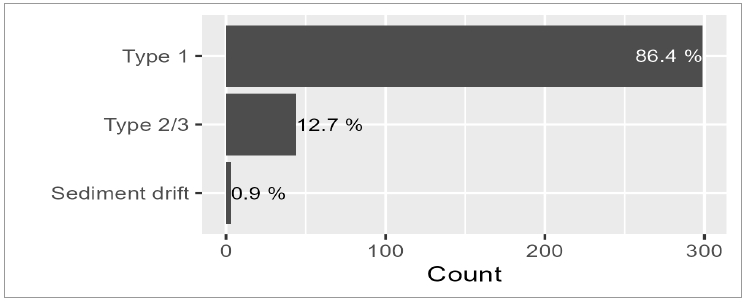
Source: AMC
| amcconsultants.com | 234 |
| Technical Report Summary of Prefeasibility Study of NORI Area D, Clarion Clipperton Zone | |
| TMC the metals company Inc. | 0225054 |
Boxplots of abundance and grades by domain are presented in Figure 11.10. The plots suggest that abundance tends to be higher in the abyssal plains than in the abyssal hills and steeper areas. Also, as the slope increases the silicon content in the nodules increases, iron slightly increases and the manganese decreases. Nickel and copper grades appear to decrease with increasing slope. These trends are confirmed in Figure 11.11 which shows box plots of assay grades subdivided by slope angle. The trends suggest that the nodules forming on the hills may be influenced by hydrothermal fluids from fissures/fractures associated with the hills or by the chemistry or diagenetic influence of the footwall rocks and sediment.
The >6° slope domains have very different distributions for all assays compared with the abyssal hills and abyssal plains domains which comprise the bulk of the NORI Area D area. Because of this difference it is necessary to exclude the samples from the >6° slope domains when estimating grades for the abyssal hills and abyssal plains domains. Because of the low number of samples in the >6° slope domains and the volcanic domains it is necessary to assign average grades to the resource model for these domains.
| Figure 11.10 | Boxplots of NORI Area D nodule abundance and assays by geological domain |
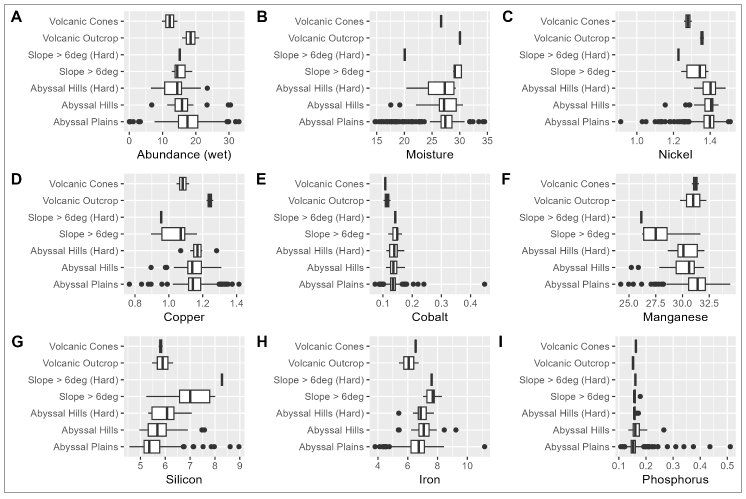
Source: AMC
| amcconsultants.com | 235 |
| Technical Report Summary of Prefeasibility Study of NORI Area D, Clarion Clipperton Zone | |
| TMC the metals company Inc. | 0225054 |
| Figure 11.11 | Boxplots of NORI Area D nodule grades by slope angle |
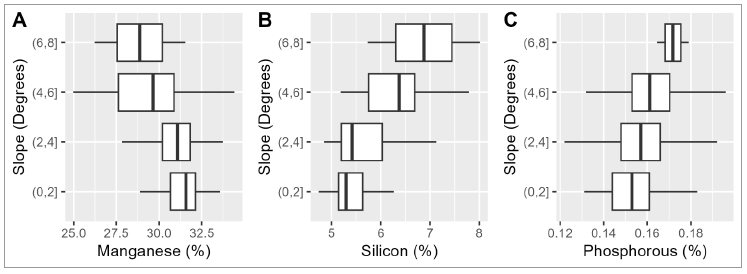
Source: AMC
Boxplots of abundance
and grades by nodule type (see Figure 11.12) suggest that the sediment drift domain is significantly different from the Type 1 and Type
2/3 nodules. This domain contains an outlier cobalt value. Nodules within the sediment drift domain are low in nickel, high in copper,
high in manganese and silicon and low in iron and phosphorus, compared with the other nodule domains. Comparison of Type 1 and Type 2/3
nodule grades indicates small differences. Type 1 nodules show higher nickel, iron, phosphorus and lower copper and silicon than the
Type 2/3 nodules.
Due to the anomalous grade and abundance values for the sediment drift domain, this domain was excluded from the Mineral Resource estimate. The box core samples within the abyssal hills and abyssal plains domains which have low nodule abundance and are classified as either Type 1 or Type 2/3 nodules, might actually be occurring within unidentified sediment drift areas or on volcanic outcrops.
| amcconsultants.com | 236 |
| Technical Report Summary of Prefeasibility Study of NORI Area D, Clarion Clipperton Zone | |
| TMC the metals company Inc. | 0225054 |
| Figure 11.12 | Boxplots of NORI Area D nodule abundance and assays by nodule facies domain |
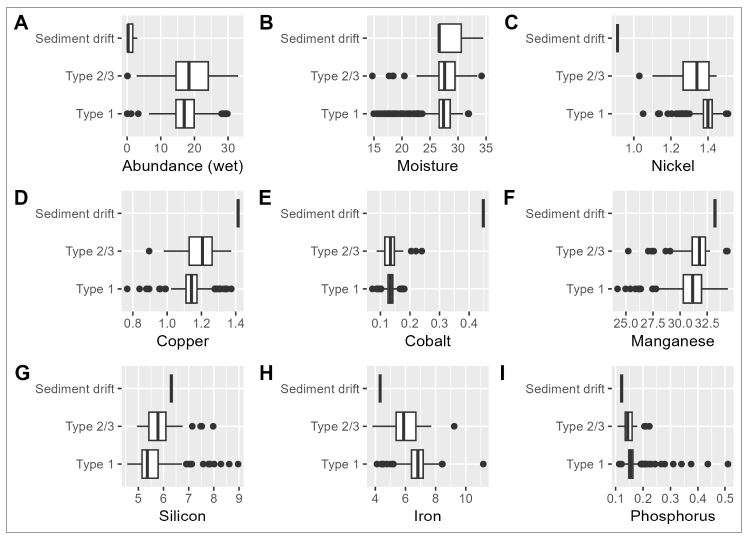
Source: AMC
| 11.7.4 | Relationships between nodule abundance and backscatter |
Acoustic backscatter is influenced by the hardness of the seafloor. Adsorption of the acoustic signal is expected to be strongest in areas covered by soft sediment and lowest in areas of hard outcropping volcanics. The abundance of nodules on the seafloor and their coverage or packing density are also expected to influence local absorption. A scatter plot of nodule abundance versus backscatter is shown in Figure 11.13. There is a weak positive linear correlation, with a Pearson correlation coefficient of 0.29.
It might also be expected that continuity of abundance and nodule coverage on the seafloor will be reflected by continuity in the backscatter data. Spatial continuity can be measured and modelled using variograms (see Section 11.7.6). A variogram is a graphical representation of the variance between pairs of points at different separation distances. Omni-directional and directional variograms (065° and 155°) were calculated from the backscatter data and fitted with spherical variogram models (Figure 11.14). The variograms of backscatter show strong continuity over greater than 10 km, which supports the interpretation of continuity of the nodules. Variograms of nodule abundance, calculated from the box core data, are presented in Section 11.7.6.
| amcconsultants.com | 237 |
| Technical Report Summary of Prefeasibility Study of NORI Area D, Clarion Clipperton Zone | |
| TMC the metals company Inc. | 0225054 |
| Figure 11.13 | Scatter plot of NORI Area D nodule abundance versus backscatter |
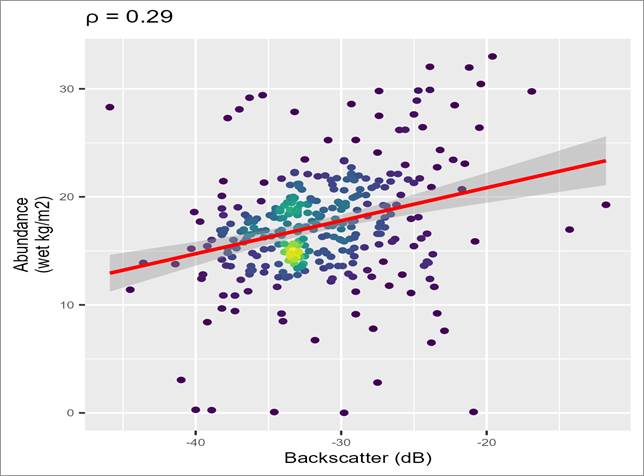
Source: AMC
| Figure 11.14 | Omni-directional, 065° and 155° directional variograms of acoustic backscatter |
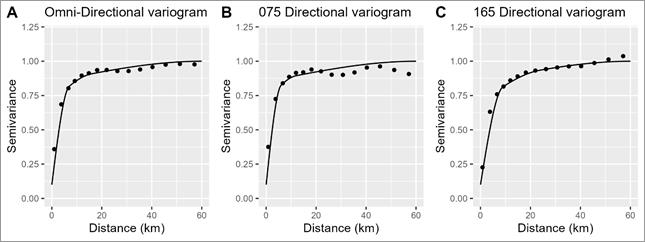
Source: AMC
| amcconsultants.com | 238 |
| Technical Report Summary of Prefeasibility Study of NORI Area D, Clarion Clipperton Zone | |
| TMC the metals company Inc. | 0225054 |
| 11.7.5 | Data transformations |
The elemental grades that comprise the nodules have a unit sum constraint. That is, the sum of the elements (including oxygen and hydrogen) is 100%. Consequently, the elements of interest in the Mineral Resource are not independent. Conventional estimation methods are based on the assumption of independence. For the 2020 Mineral Resources estimate, AMC used a mathematical transformation to generate a set of independent variables that could be estimated into a block model and then back-transformed to the final grade estimates.
A Projection Pursuit Multivariate Transformation (PPMT) was performed on the data. PPMT is a method to transform multivariate numeric data into multivariate Gaussian data. The transform aims to remove all bivariate correlations between the variables making them independent and to transform each variable to a normal distribution. The transform allows for independent estimation or simulation of Gaussian variables using simple kriging. The kriged estimates are then back-transformed into the original multivariate space, where all bivariate correlations and trends are restored. The transform is useful for simple kriging and sequential Gaussian conditional simulations, where the variables are required to be independent and Gaussian. The transform ensures that, even when using different variograms for each transformed variable, the bivariate relationships are maintained. To prepare the data it was necessary to:
| · | Impute (replace) missing values for silicon, iron, and phosphorus. |
| · | Apply projection pursuit multivariate transform (PPMT) to manganese, copper, nickel, cobalt, silicon, iron, and phosphorus values. |
| · | Apply normal scores transform to abundance values. |
| 11.7.6 | Spatial continuity |
Modelling of spatial continuity and estimation of nodule Mineral Resources is essentially a two-dimensional process. Vertical distribution of nodules was not modelled. Spatial continuity of abundance and the grades of manganese, nickel, copper, cobalt, silicon, iron, and phosphorus were assessed using semi-variograms. For convenience, semi-variogram is abbreviated to variogram in the following discussion.
A variogram is a graphical representation of the variance between pairs of points at different separation distances. For data that is spatially correlated, it is expected that the variance between closely-spaced pairs of data will be lower than the variance between widely-spaced pairs. At a particular distance, known as the range, the pairs become uncorrelated and the variance no longer increases. Experimental variograms are generated from the data in different orientations to see if there is greater continuity in a particular direction (anisotropy). If there is no strong evidence of anisotropy, the directional variograms can be combined into an omnidirectional variogram for ease of interpretation. The experimental variogram can be fitted with a mathematical model (the variogram model) from which spatial weights can be determined during the kriging estimation process. AMC used variograms to assess the spatial continuity of nodule abundance, nodule grades, and also the acoustic back scatter.
| 11.7.6.1 | Nodule abundance and nodule grades |
All NORI box core samples and nodule abundances derived from photos within NORI Area D were used for analysis of spatial continuity. The PPMT transformed data was used for calculating the experimental variograms.
The direction of greatest continuity suggested by the variogram maps over very long ranges is approximately 075° or 165° (see Figure 11.15). This direction might be, at least in part, an artefact of the sparseness of the sampling and the orientation of the sampling grid which is oriented 075°, roughly parallel to the broad regional trend of the CCZ. At shorter ranges, the experimental variograms are not strongly anisotropic.
| amcconsultants.com | 239 |
| Technical Report Summary of Prefeasibility Study of NORI Area D, Clarion Clipperton Zone | |
| TMC the metals company Inc. | 0225054 |
| Figure 11.15 | Variogram maps of NORI Area D nodule sample assays |
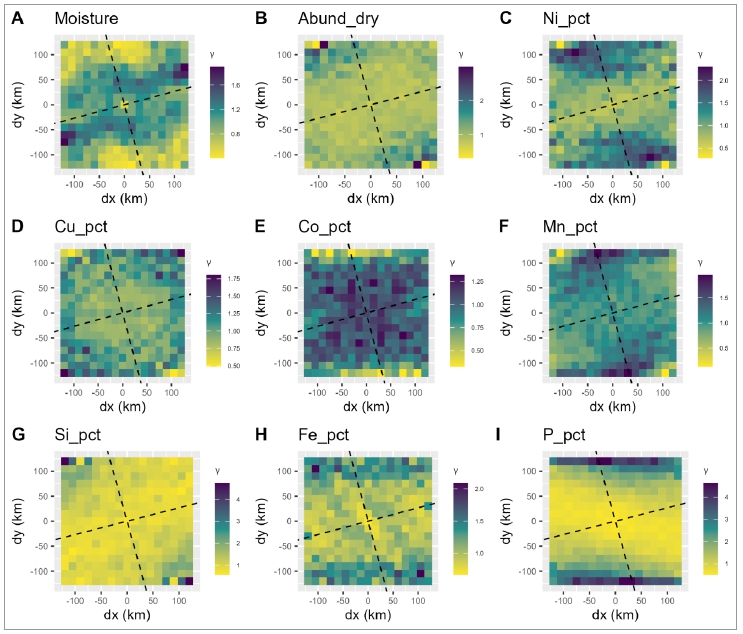
Source: AMC
Two-structure, spherical models were fitted to the experimental variograms of abundance and grades. The variogram models used for estimating block nodule abundance and grades are listed in Table 11.6 and illustrated in Figure 11.16 to Figure 11.23. In these figures the open circles represent semivariance estimates that were informed with less than 20 points, and the crosses represent semivariance values that exceed 1.1 but have been clipped to 1.1 for visualization purposes.
| amcconsultants.com | 240 |
| Technical Report Summary of Prefeasibility Study of NORI Area D, Clarion Clipperton Zone | |
| TMC the metals company Inc. | 0225054 |
| Table 11.6 | Variogram models |
| Abundance (dry) | Moisture | Ni | Cu | Co | Mn | Si | Fe | P | |
| Nugget | 0.1 | 0.1 | 0.1 | 0.1 | 0.1 | 0.1 | 0.1 | 0.1 | 0.1 |
| Sill 1 | 0.6 | 0.6 | 0.6 | 0.6 | 0.6 | 0.6 | 0.6 | 0.6 | 0.4 |
| Range 1 Omni (km) | 6 | 6 | 9 | 3 | 3 | 3 | 6 | 6 | 6 |
| Range 1 Major (km) | 6 | 6 | 9 | 3 | 3 | 3 | 6 | 6 | 6 |
| Range 1 Minor (km) | 3 | 3 | 3 | 3 | 3 | 3 | 3 | 3 | 3 |
| Sill 2 | 0.3 | 0.3 | 0.3 | 0.3 | 0.3 | 0.3 | 0.3 | 0.3 | 0.5 |
| Range 2 Omni (km) | 120 | 120 | 80 | 60 | 20 | 20 | 80 | 40 | 80 |
| Range 2 Major (km) | 140 | 30 | 180 | 60 | 20 | 20 | 100 | 60 | 120 |
| Range 2 Minor (km) | 70 | 30 | 60 | 60 | 20 | 20 | 50 | 30 | 80 |
| Major Direction (°) | 75 | 75 | 75 | 75 | 345 | 165 | 165 | 165 | 165 |
| Anisotropy | 0.5 | 0.5 | 0.33 | 1 | 1 | 1 | 0.38 | 0.67 | 0.71 |
| Figure 11.16 | Abundance omni-directional, 075° and 165° directional variograms |
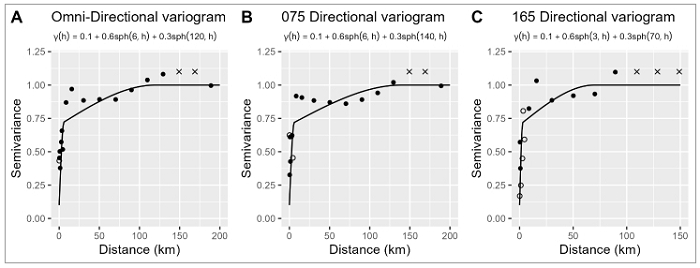
Source: AMC
| Figure 11.17 | Nickel omni-directional, 075° and 165° directional variograms |
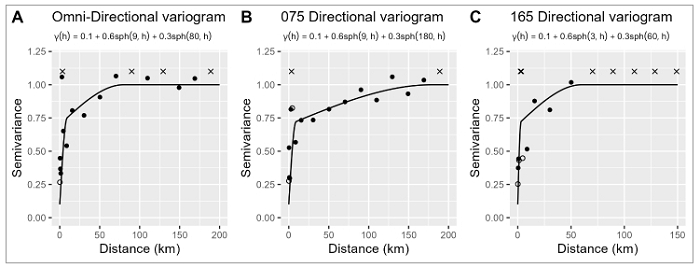
Source: AMC
| amcconsultants.com | 241 |
| Technical Report Summary of Prefeasibility Study of NORI Area D, Clarion Clipperton Zone | |
| TMC the metals company Inc. | 0225054 |
| Figure 11.18 | Copper omni-directional, 075°, and 165° directional variograms |
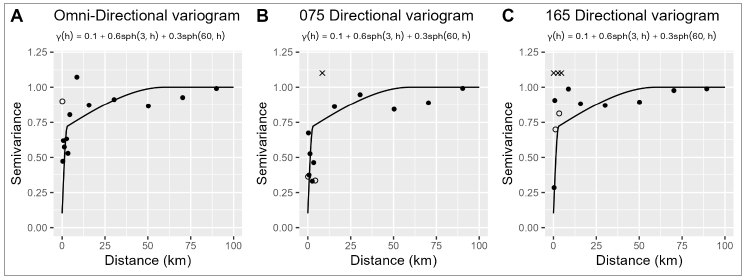
Source: AMC
| Figure 11.19 | Cobalt omni-directional, 075°, and 165° directional variograms |
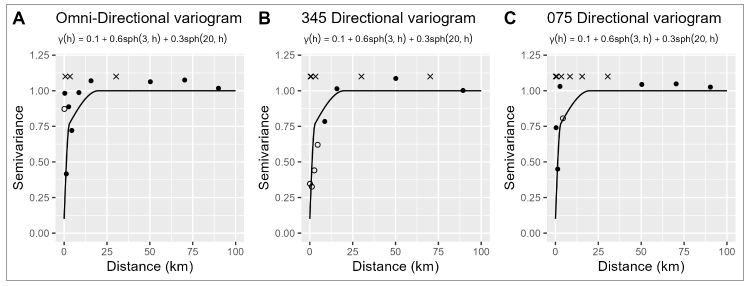
Source: AMC
| Figure 11.20 | Manganese omni-directional, 075°, and 165° directional variograms |
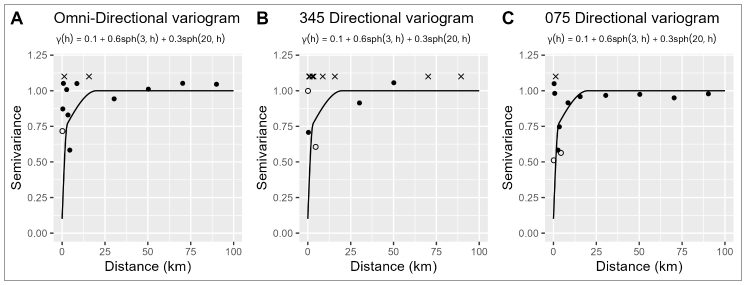
Source: AMC
| amcconsultants.com | 242 |
| Technical Report Summary of Prefeasibility Study of NORI Area D, Clarion Clipperton Zone | |
| TMC the metals company Inc. | 0225054 |
| Figure 11.21. | Silicon omni-directional, 075°, and 165° directional variograms |
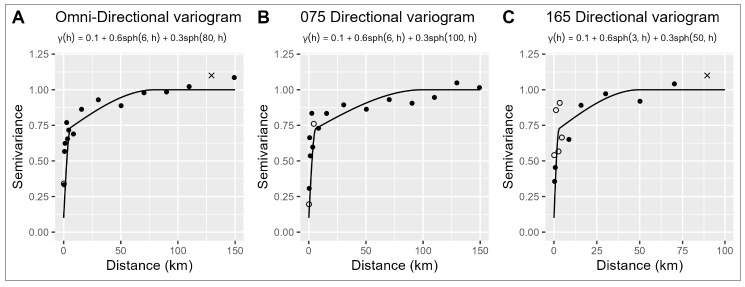
Source: AMC
| Figure 11.22 | Iron omni-directional, 075°, and 165° directional variograms |
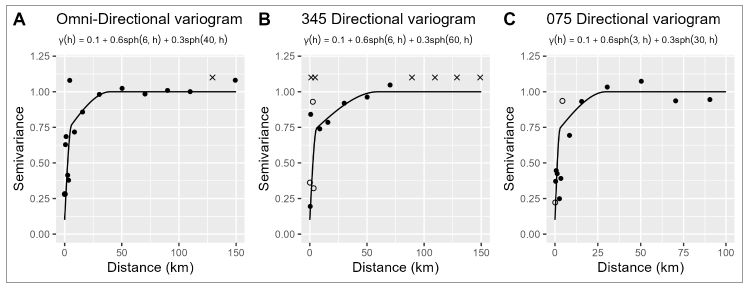
Source: AMC
| Figure 11.23 | Phosphorus omni-directional, 075°, and 165° directional variograms |
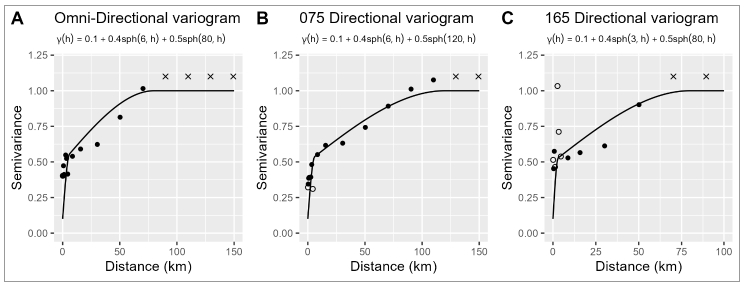
Source: AMC
| amcconsultants.com | 243 |
| Technical Report Summary of Prefeasibility Study of NORI Area D, Clarion Clipperton Zone | |
| TMC the metals company Inc. | 0225054 |
| 11.7.7 | Estimation of nodule abundance and grades |
A geological grid model of NORI Area D was constructed from the geological domain gridded map by aggregating the grid by a factor of 10. This expanded the grid cell size from 50 m to 500 m. The origin, extent and grid cell size are outlined in Table 11.7. The origin was chosen to match the bathymetry and backscatter raster models to ensure consistency between data sets.
| Table 11.7 | NORI Area D Grid Model Extents |
| Easting | Northing | |
| Model origin | 410444.2 | 1093899.2 |
| Model limit | 602444.2 | 1225399.2 |
| Cell size | 500 | 500 |
| Number of cells | 263 | 263 |
The geological grid model contains a layer (NOD) that identifies the percentage coverage of nodules within the 500 m by 500 m panel. This layer was constructed by aggregating the 50 m by 50 m reclassified geological domain gridded data. The geological domain grid model was reclassified by assigning a value of 1 for the abyssal plains, abyssal hills and abyssal hills (hard) domains. All other domains were assigned a value of 0. Figure 11.24 shows the 500 m by 500 m geological grid model.
| Figure 11.24. | NORI Area D 500 m by 500 m grid model showing percentage coverage of nodules |
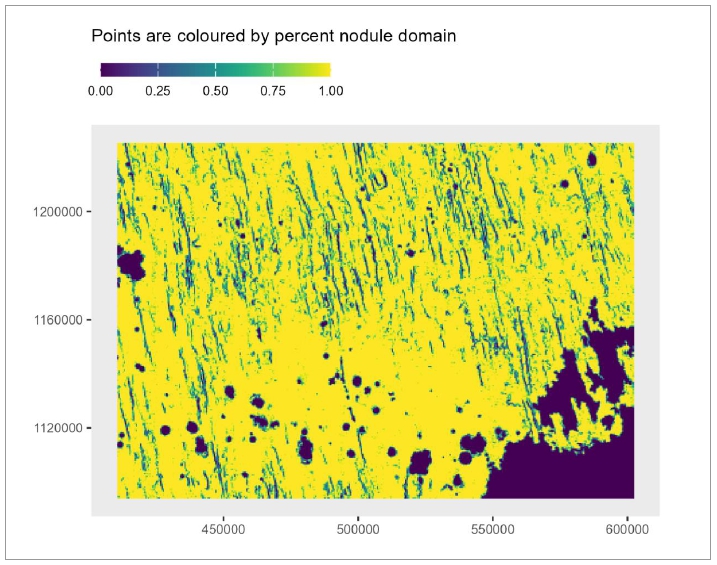
Source: AMC
| amcconsultants.com | 244 |
| Technical Report Summary of Prefeasibility Study of NORI Area D, Clarion Clipperton Zone | |
| TMC the metals company Inc. | 0225054 |
The Mineral Resource was estimated in 3.5 km by 3.5 km sized panels or blocks. The geological grid model (500 m by 500 m grid spacing) was used as the discretization points for the 3.5 km by 3.5 km sized panels. That is, the values at the points on the 500 m by 500 m grid were estimated and then the point estimates were aggregated to panels or blocks with dimensions of 3.5 km by 3.5 km. The panel size is appropriate for the average sample spacing.
The prepared and transformed data was used for estimating nodule abundance (dry) and nodule grades. Samples falling within the slope > 6° domains were excluded from the estimation. A minimum of 1 and a maximum of 10 samples were used to inform the estimates at each point.
Simple kriging was used to estimate nodule abundance (dry) and nodule grades into the geological grid model using the PPMT-transformed variables. After kriging, the PPMT-variable estimates were back-transformed to the elemental grades. Two other methods, ordinary kriging (OK), and inverse distance weighting to the power of two (IDW), were used to validate the outcomes from the simple kriging. The dry abundance estimates were converted to wet abundance by the addition of 28% moisture.
Comparisons of the simple kriging, OK and IDW estimates with nodule sample data are illustrated in Figure 11.25. The cumulative probability plots show, as expected, that the simple kriging panel estimates are smoother (lower variance) than IDW panel estimates which are smoother than the distribution of the samples. The smoothing (spatial averaging) is expected because 70% of the total variance in the nodule abundances (the sill in the spatial variogram) occurs within 3 km. Smoothing is mathematically necessary to ensure that estimates of the Mineral Resources are unbiased. As expected, the medians (50th percentiles) produced by the three estimation methods are very similar for nodule abundance and nodule grades. Simple kriging was selected as the preferred method because it is better suited to the transformed grade variables than OK or IDW.
| amcconsultants.com | 245 |
| Technical Report Summary of Prefeasibility Study of NORI Area D, Clarion Clipperton Zone | |
| TMC the metals company Inc. | 0225054 |
| Figure 11.25 | Cumulative probability plots comparing nodule samples with IDW and SK estimates |
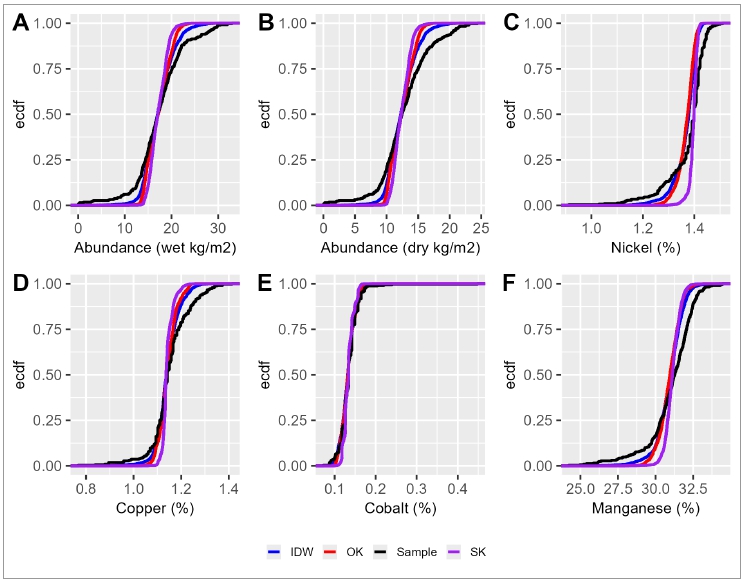
Source: AMC
| 11.8 | Cut-off grade |
Mining operations typically use an economic value to differentiate between material that is mined to generate revenue (ore) and material that is either left behind or considered as waste. The cut-off value is derived from an economic assessment to determine the minimum grade of material that generates an acceptable profit or the minimum grade of material that allows a marketable product to be produced.
Nodules are remarkably consistent in grade and the characteristic that will contribute most to determine profitability is abundance, which is more variable. Furthermore, assessment by Allseas identified that a minimum abundance value is required to achieve the production rate required to meet annual production targets for a given collector speed. Therefore, the variable chosen to define the cut-off for definition of Mineral Resources was abundance.
The method of calculation of the cut-off determines the minimum average nodule abundance needed during steady state operations such that the revenue minus costs (excluding capital) is greater than zero. Revenue includes metal pricing and metallurgical processing recoveries, and the costs include the collection, transport, processing, corporate costs, and royalties.
The price estimates were long term (2034 – 2046) forecasts provided in a report by CRU International Limited (CRU, 2025). The QP considers that this timeframe is reasonable, in view of the likely time required to bring the majority of the NORI and TOML Mineral Resources into production.
| amcconsultants.com | 246 |
| Technical Report Summary of Prefeasibility Study of NORI Area D, Clarion Clipperton Zone | |
| TMC the metals company Inc. | 0225054 |
Operating costs and production estimates for the calculation of an abundance cut-off were based on estimates developed for the second generation of collection systems described and assessed in the Initial Assessment of NORI and TOML areas (AMC, 2025) rather than the collection system evaluated for the Mineral Reserves in the PFS for NORI Area D. This approach was chosen because the development scenario assessed in the Initial Assessment is a more likely timeframe in which the majority of the Mineral Resource in NORI Area D, not already converted to Mineral Reserve, would be developed. The QP considers that the abundance cut-off calculated this way for the Mineral Resources is consistent with reasonable prospects of economic extraction.
An assessment of the abundance cut-off is shown in Table 11.8.
| Table 11.8 | NORI-TOML breakeven cut-off abundance estimate |
Variable Opex ($/wmt) |
Production (m2/hr) |
Nodule
Revenue ($/wmt) |
Opex
per hour ($/hr) |
Breakeven
Abundance (kg/m2) |
Revenue per hour ($/hr) | |
| Alloy | 188 | 33,660 | 421 | 50,584 | 3.6 | 50,584 |
| Matte | 188 | 33,660 | 479 | 50,584 | 3.1 | 50,584 |
| Sulphate | 188 | 33,660 | 612 | 50,584 | 2.5 | 50,584 |
The calculations indicate that a cut-off of 4 kg/m2 abundance, as has previously been used for Mineral Resource estimates in NORI Area D, remains appropriate for definition of the Mineral Resources in NORI Area D.
| 11.9 | Mineral Resource classification |
The limiting factor for Mineral Resource classification for NORI Area D is confidence in the estimates for abundance. Confidence in the resource estimate was assessed using the probability of abundance being greater than ±15% of mean abundance over a nominal one quarter of production (for Measured classification) and a nominal one year’s production (for Indicated classification) at 90% confidence. The nominal production rate is a parameter chosen to classify the uncertainty of the Mineral Resource estimates at an expected order of magnitude of production rather than for an economic assessment of a specific production scenario.
The uncertainty in quarterly production estimates was assessed by simulating abundance using conditional sequential Gaussian simulation. Each simulation is a unique, equiprobable representation of the abundance on the seafloor, modelled from the sample data, on a finer grid than the Mineral Resource block model. The simulations lack the high degree of smoothing (spatial averaging) used to estimate the Mineral Resource. One hundred (100) simulations were generated using the same data, estimation parameters, and variogram model as were used for the simple kriging of the Mineral Resource block model. The probability of exceeding a given value at any point on the simulated grid model can then be calculated by considering the outcomes of all 100 simulations at that point.
Assuming a nominal annual production rate of 8 Mwmt of nodules per year, the panel size for a quarter of a year’s production is 10,846 m by 10,846 m assuming an average abundance of 17 wet kg/m2. To simplify the simulation, the area covered by a quarter of a year’s production was set at 10 km by 10 km while one year’s production was set at 20 km by 20 km. This equates to a yearly production rate of 6.4 Mwmt and one quarter of a year’s production of 1.6 Mwmt with an average abundance of 16 wet kg/m2.
| amcconsultants.com | 247 |
| Technical Report Summary of Prefeasibility Study of NORI Area D, Clarion Clipperton Zone | |
| TMC the metals company Inc. | 0225054 |
The conditional simulations of 500 m by 500 m panels were aggregated up to 10 km by 10 km and 20 km by 20 km panels. The probability of abundance being greater than +/-15% of mean abundance over one quarter of production (Measured) and one year’s production (Indicated) is shown in Figure 11.26.
The conditional simulation of abundance suggests that in the small area near the center of NORI Area D where sample spacing is 3.5 km by 3.5 km the estimates are of high confidence and could be classified as a Measured Mineral Resource. In the rest of NORI Area D, where there are samples at a spacing of 7 km by 7 km and 10 km by 10 km, the estimates are of sufficient confidence to be classified as Indicated Mineral Resources. The south-east corner of NORI Area D where there are generally no samples, and which is mostly covered by the volcanic high domain is considered to be estimated with low confidence. Note that there are some areas covered by 10 km by 10 km spacing that have high confidence.
| Figure 11.26 | Abundance: probability of exceeding 15% of mean at 90% confidence for quarterly and yearly production19 |
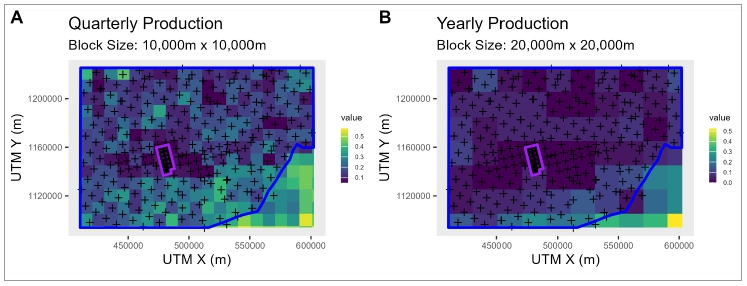
Source: AMC
The Mineral Resource was classified on the basis of the quality and uncertainty of the sample data and sample spacing, in accordance with S-K 1300.
The Measured Mineral Resource was assigned to the area within NORI Area D where box core sampling was conducted on a nominal 7 km by 7 km spacing and infilled with estimates of nodule abundance from seafloor photography to a spacing of 3.5 km by 3.5 km.
The Indicated Mineral Resource was assigned to the area within NORI Area D where box core sampling was conducted on a nominal spacing of 7 km by 7 km but without additional photo-estimates of nodule abundance, or 10 km by 10 km.
The Inferred Mineral Resource was assigned to the abyssal plain areas in the southeast corner of NORI Area D that are largely unsampled. Figure 11.27 shows Mineral Resource classification boundaries.
19 Perimeters: area of high confidence = Measured Mineral Resource (purple); area of moderate confidence = Indicated Mineral Resource (blue)
| amcconsultants.com | 248 |
| Technical Report Summary of Prefeasibility Study of NORI Area D, Clarion Clipperton Zone | |
| TMC the metals company Inc. | 0225054 |
| Figure 11.27 | Mineral Resource classification boundaries |
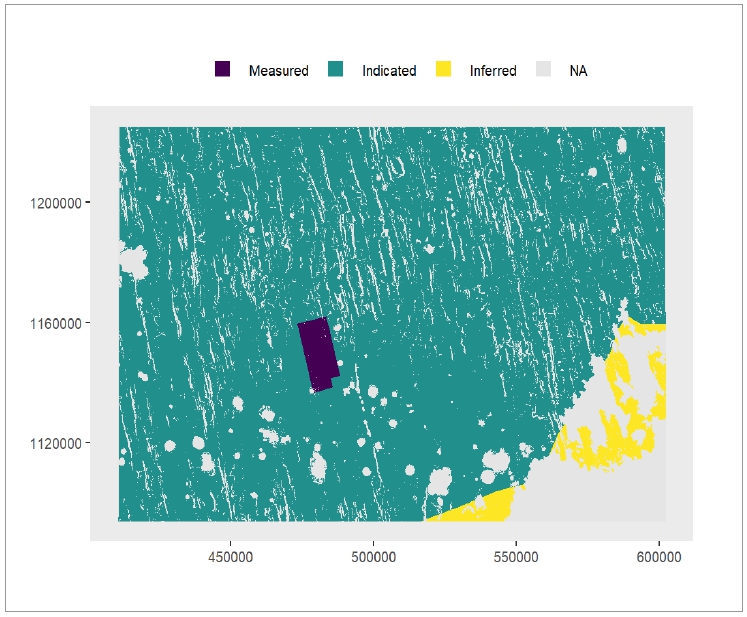
Source: AMC
The volcanic high domain in the southeast corner of NORI Area D was excluded from the Mineral Resource estimate for the following reasons:
| · | Uncertainty in distinguishing between volcanic outcrop and high abundance nodules using the backscatter data. |
| · | No nodule samples have yet been collected within the volcanic high domain and therefore it is unknown whether there are any nodules occurring within the domain. |
| · | The terrain across the volcanic high is extremely rugged and is at a much shallower depth than the rest of NORI Area D. The volcanic high is less than 50 km from a significant calcium carbonate anomaly seen in the compilation of basin-scale surficial sediment lithology data. This strongly suggests that the volcanic high sits above the carbonate compensation depth and is therefore not favorable for nodule formation. |
| · | The evidence that nodule chemistry is affected by substrate means that it is not reasonable to infer the grades of nodules that might occur in the volcanic high domain from grades of nodules in other domains. |
In the Qualified Person’s opinion, the Mineral Resources have reasonable prospects for economic extraction. No fatal flaws have been identified. It is reasonable to expect that, with further engineering design and test work, the technical and economic factors relevant to the collection of nodules and the extraction of nickel, cobalt, copper, and manganese products from the nodules can be resolved.
| amcconsultants.com | 249 |
| Technical Report Summary of Prefeasibility Study of NORI Area D, Clarion Clipperton Zone | |
| TMC the metals company Inc. | 0225054 |
| 11.10 | Estimation results |
The 3.5 km by 3.5 km panel estimates were added back onto the 50 m by 50 m geological domain grid model. Nodule abundance and nodule grades for cells identified as either > 6° slope or volcanic outcrop domains were set to the
mean values from the nodule samples. Cells identified as volcanic cone or volcanic high or sediment drift were set to null.
Resource categories were added to the 50 m by 50 m raster grid model using the perimeters defined by conditional simulation.
Results of the simple kriging estimates are shown in plan view in Figure 11.28. Cobalt is relatively high in the north of NORI Area D and relatively low in the south while manganese, nickel, copper and iron are relatively uniformly distributed across NORI Area D. Abundance and cobalt grade appears to be higher in the north. Note the two very small spots of high silicon estimated in the abyssal domains. These two spots are interpreted to be the result of mislabeling of high slope domains that have high silicon. Also note the high phosphorus in the south-east near the volcanic high domain.
| Figure 11.28 | Nodule abundance and nodule grades 3.5 km by 3.5 km SK panel estimates for NORI Area D |
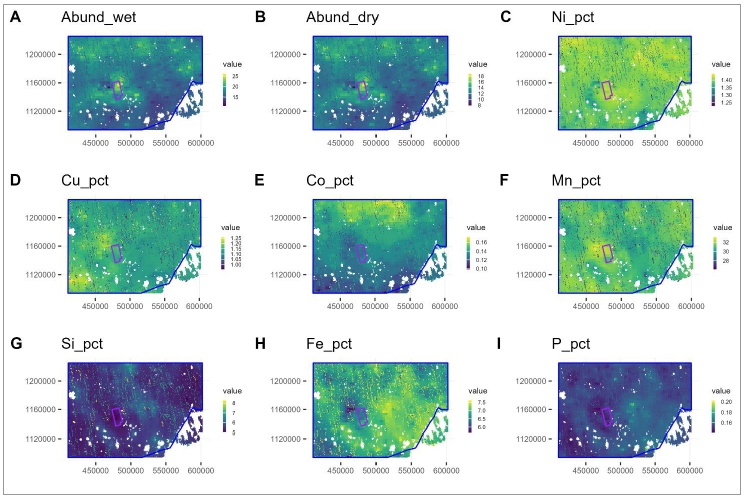
Source: AMC
The nodule abundance and tonnage curves for NORI Area D at various nodule abundance cut-offs are shown in Figure 11.29. The curves indicate that there are no 3.5 km by 3.5 km panels with abundance of less than 12 wet kg/m2. The volcanic outcrop, volcanic high, volcanic cones and high-slope (>6°) domains were excluded from the estimate.
| amcconsultants.com | 250 |
| Technical Report Summary of Prefeasibility Study of NORI Area D, Clarion Clipperton Zone | |
| TMC the metals company Inc. | 0225054 |
| Figure 11.29 | NORI Area D abundance-tonnage curve |
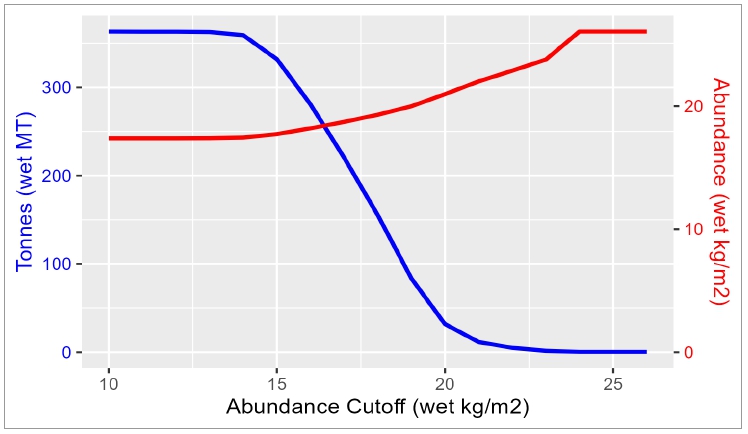
Source: AMC
The Mineral Resource at 30 June 2025, at an abundance cut-off of 4 wet kg/m2, and in accordance with SEC Regulation S-K (subpart 1300) (S-K 1300) is stated inclusive of those Mineral Resources converted to Mineral Reserves in Table 11.9. Estimates are reported on a wet nodule abundance basis, assuming 28% moisture content (mass of water)/(mass of solids + water).
| Table 11.9 | Mineral Resource for NORI Area D, at 30 June 2025, at 4 wet kg/m2 abundance cut-off inclusive of Mineral Reserve |
| Category | Tonnes (Mwmt) |
Abundance
(wet kg/m2) |
Ni (%) | Cu (%) | Co (%) | Mn (%) | Si (%) | Fe (%) |
P (%) | MnO: SiO2 |
| Inferred | 11 | 15.4 | 1.38 | 1.14 | 0.12 | 30.96 | 5.46 | 6.92 | 0.16 | 3.42 |
| Indicated | 347 | 17.4 | 1.40 | 1.14 | 0.14 | 31.15 | 5.45 | 6.84 | 0.16 | 3.46 |
| Measured | 5 | 20.6 | 1.41 | 1.15 | 0.13 | 31.91 | 5.16 | 6.59 | 0.15 | 3.73 |
| All | 363 | 17.4 | 1.40 | 1.14 | 0.14 | 31.15 | 5.44 | 6.83 | 0.16 | 3.46 |
Notes:
| · | Effective date of the Mineral Resource is 30 June 2025. | |
| · | Moisture content assumed to be 28% (mass of solid/(mass of solid + mass of water). | |
| · | The volcanic outcrop, volcanic high, volcanic cones, sediment drift, and high-slope (>6°) domains were excluded from the estimate. | |
| · | Samples collected by the Pioneer Contractors were excluded due to the lower level of confidence associated with this data and their replacement by box core data collected by TMC. | |
| · | Abundance cut-off and assumption of reasonable prospects for economic extraction are based on the engineering, metallurgical, environmental, scientific and other studies presented in this report. | |
| · | Rounding estimates to two significant figures may result in computational discrepancies. |
| amcconsultants.com | 251 |
| Technical Report Summary of Prefeasibility Study of NORI Area D, Clarion Clipperton Zone | |
| TMC the metals company Inc. | 0225054 |
The Mineral Resource at 30 June 2025, at an abundance cut-off of 4 wet kg/m2, and in accordance with SEC Regulation S-K (subpart 1300) (S-K 1300) exclusive of those Mineral Resources converted to Mineral Reserves is stated in Table 11.10.Table 11.10. Estimates are reported on a wet nodule abundance basis, assuming 28% moisture content (mass of water)/(mass of solids + water).
| Table 11.10 | Mineral Resource for NORI Area D, at 30 June 2025, at 4 wet kg/m2 abundance cut-off exclusive of Mineral Reserve |
| Category | Tonnes (Mwmt) |
Abundance (wet kg/m2) |
Ni
(%) |
Cu (%) |
Co (%) |
Mn (%) |
Si
(%) |
Fe (%) |
P (%) |
MnO: SiO2 |
| Inferred | 10 | 15.4 | 1.4 | 1.1 | 0.12 | 31 | 5.46 | 6.92 | 0.16 | 3.42 |
| Indicated | 261 | 17.4 | 1.4 | 1.1 | 0.14 | 31 | 5.45 | 6.84 | 0.16 | 3.46 |
| Measured | 4 | 20.6 | 1.4 | 1.2 | 0.13 | 32 | 5.16 | 6.59 | 0.15 | 3.73 |
| All | 274 | 17.4 | 1.4 | 1.1 | 0.14 | 31 | 5.44 | 6.83 | 0.16 | 3.46 |
Notes: 1. Effective date of the Mineral Resource is 30 June 2025.
2. Moisture content assumed to be 28% (mass of solid/(mass of solid + mass of water).
3. The volcanic outcrop, volcanic high, volcanic cones, sediment drift, and high-slope (>6°) domains were excluded from the estimate.
4. Samples collected by the Pioneer Contractors were excluded due to the lower level of confidence associated with this data and their replacement by box core data collected by TMC.
5. Abundance cut-off and assumption of reasonable prospects for economic extraction are based on the engineering, metallurgical, environmental, scientific and other studies presented in this report.
6. Si, Fe, P, and MnO:SiO2 are not tracked in Mineral Reserve estimation and Mineral Resource averages are used.
7. Rounding estimates to two significant figures may result in computational discrepancies.
QPs for the Mineral Resource and their specific areas of responsibility are shown in Table 2.1.
| 11.11 | Comparison with previous resource estimates |
The first resource estimate for NORI Area D, completed in 2012, was 399 Mwmt of nodules and was based solely on historic samples.
In 2018 NORI completed a box core sampling campaign that focused on a small area near the centre of NORI Area D which was selected as a potential site for the Test Mining. Where box core sampling was conducted on a nominal 7 km by 7 km spacing and infilled with estimates of nodule abundance from seafloor photography on a 3.5 km by 3.5 km grid the Mineral Resource was classified as Measured. Where sampling was at a nominal spacing of 7 km by 7 km but did not have any additional photo-estimates of nodule abundance, the Mineral Resource was classified as Indicated. The additional samples resulted in an updated estimate of 383 Mwmt, consisting of 4 Mwmt Measured, 34 Mwmt Indicated and 345 Mwmt Inferred Mineral Resources.
The 2019 exploration campaigns added box core sampling at a spacing of 10 km by 10 km across most of the remainder of NORI Area D. The 2020 Mineral Resource estimate (AMC, 2021) was 356 Mwmt, consisting of 4 Mwmt Measured, 341 Mwmt Indicated and 11 Mwmt Inferred Mineral Resources. Taking into account the conversion of the majority of Inferred to Indicated Mineral Resources, the remaining Inferred Mineral Resource decreased by 26 Mt as a result of excluding the volcanic high domain in the south-eastern corner of NORI Area D, due to uncertainty about the occurrence of nodules in this area. The 2020 resource estimate was also slightly higher in abundance (5.4% higher), and nickel (6.1% higher), cobalt (5.4% higher) and manganese (2.2% higher) grades than the 2018 estimate.
| amcconsultants.com | 252 |
| Technical Report Summary of Prefeasibility Study of NORI Area D, Clarion Clipperton Zone | |
| TMC the metals company Inc. | 0225054 |
The differences in how the 2025 Mineral Resource was estimated, compared with the previous (2020) Mineral Resource estimate are:
| · | Addition of Campaign 7A and Campaign 8 nodule sampling. | |
| · | Exclusion of historic nodule samples. | |
| · | No top-cuts applied to nodule abundance or nodule grades. | |
| · | Modified experimental spatial variograms. | |
| · | Estimation of dry nodule abundance. | |
| · | Reporting of wet tonnage using dry nodule abundance and assuming average moisture content of 28%. |
The 2020 Mineral Resource was estimated from wet nodule abundance, as measured in the box core samples. It was assumed that the moisture content was 24%. On a wet basis, the 2024 Mineral Resource tonnage estimate is 2% higher than the 2020 Mineral Resource tonnage estimate. On a dry basis, the 2025 Mineral Resource tonnage estimate is 3% lower than the 2020 Mineral Resource tonnage estimate.
| amcconsultants.com | 253 |
| Technical Report Summary of Prefeasibility Study of NORI Area D, Clarion Clipperton Zone | |
| TMC the metals company Inc. | 0225054 |
| 12 | Mineral Reserve estimates |
| 12.1 | Introduction |
| 12.1.1 | Basis of the mine plan |
Allseas, an experienced marine contractor, is collaborating with TMC to develop and operate a nodule collection system at NORI Area D, which is currently in the design phase. The proposed methodology for this system is novel. While a full-scale operating model has not yet been built, a 40% scale prototype designed for production of up to 420 ktpa has been successfully field-tested. The mine plan for the NORI Area D Mineral Reserve is based on the projected capabilities and characteristics of this nodule collection system.
A graphic depicting the main components of the nodule collection system (not to scale) proposed for NORI Area D is shown in Figure 12.1. The main system components are summarized below at a high level and described in more detail in Section 13.
| Figure 12.1 | Graphic depicting nodule collection system |
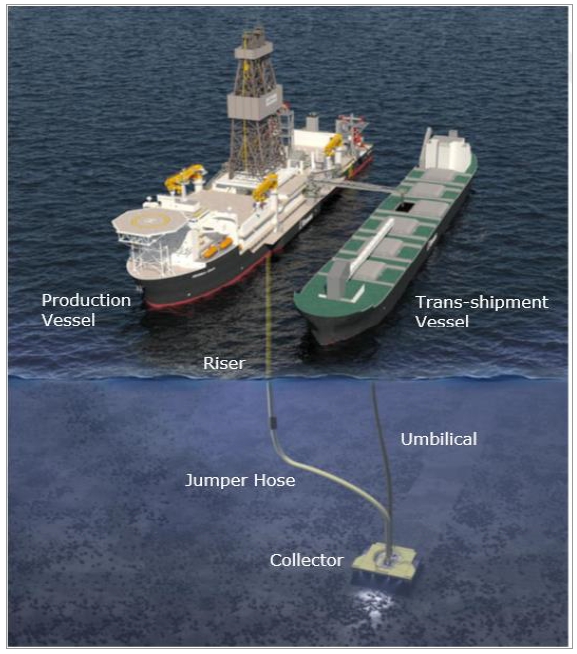
Source: Allseas 2024.Note in this illustration the vessel referred to as the ‘Trans-shipment vessel’ is to be considered the same as the Transfer Vessel (TV) as described in section 13.2.8.
| amcconsultants.com | 254 |
| Technical Report Summary of Prefeasibility Study of NORI Area D, Clarion Clipperton Zone | |
| TMC the metals company Inc. | 0225054 |
The design of the nodule collection system involves the use of a remotely operated, 15 m wide, self-propelled, tracked collector (collector, see Figure 12.2) tethered to a production vessel (PV) by a flexible jumper hose, riser-and-air-lift vertical transport system (VTS) and communication and power cables (umbilical). The collector will track preferentially across the seafloor in a north-northwest (NNW) to south-southeast (SSE) direction (and SSE to NNW) to align with the seafloor geological strike and the direction of seafloor ridges.
| Figure 12.2 | Graphic depicting the collector |
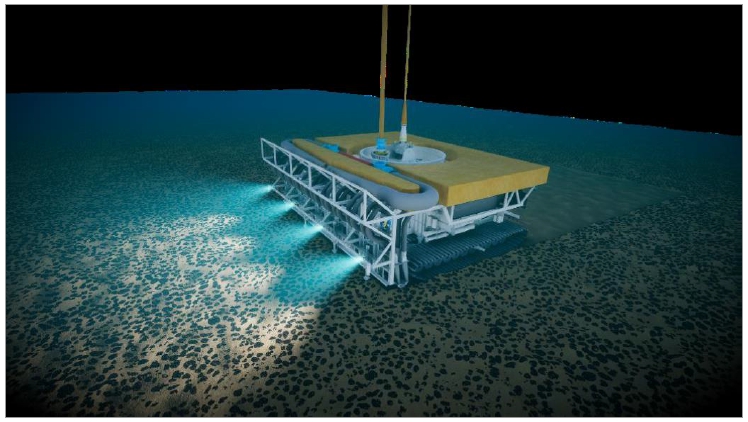
Source: Allseas 2024
The collector will use specially designed coandă nozzles at the front of the collector that uses water flow to create a low pressure zone to mobilize and collect nodules that are in the top 3-5 cm of the seafloor. Nodules will be drawn into the collector and pass through a counter-current decantation separator (hopper) to separate the lighter fractions for return to the seafloor. The remaining material is then pumped via the flexible jumper hose and the riser to the PV, where dewatering and final separation occurs by screening and hydrocyclones. Screened and dewatered nodules are transferred via conveyor to storage holds within the PV. collector speed will be varied according to nodule abundance to maintain steady state nodule production.
When the holds of the PV are full, a trans-shipment vessel will pull alongside, an off-loading conveyor deployed, and nodules transferred via conveyor to the hold of the trans-shipment vessel for later transfer to a bulk carrier for transport to a processing facility. Dynamic position on the PV and trans-shipment vessel will be used to maintain relative positioning for the two vessels to facilitate nodule transfer. Nodule collection activities will continue during nodule offload to the trans-shipment vessel.
TMC and Allseas have undertaken a proof-of-concept Test Mining in the proposed NORI Area D Exploitation Contract Area using a 6 m wide pilot collector (Test Mining), 40% of the width of the proposed 15 m production-scale collector. Details of the proposed collection and support equipment and collection method are discussed in Section 13.
Launch and recovery of the seafloor collector and VTS will be managed by a launch and recovery system (LARS) that includes umbilical management, derrick, riser hang-off, and riser line management and storage system aboard the PV. This will allow for maintenance and repair or relocation activities, which have been factored into operating hour calculations for mine planning.
| amcconsultants.com | 255 |
| Technical Report Summary of Prefeasibility Study of NORI Area D, Clarion Clipperton Zone | |
| TMC the metals company Inc. | 0225054 |
Mine planning was undertaken using the geological model prepared by MARGIN and AMC and discussed in Section 11, seafloor geotechnical assessment undertaken by Allseas from information provided by APYS (see section 7.14), and seafloor topographical constraints and analysis provided by MARGIN (see section 7.13). Updated mine planning parameters and assumptions were developed to reflect the requirements of the nodule collection system in agreement with TMC and Allseas.
The mine plan underlying the Mineral Reserve (Mine Plan) was developed using standard terrestrial mining industry resource planning software, Datamine, Deswik, and Minemax. However, a standard terrestrial industry approach to mine planning is not appropriate due to the two-dimensional distribution of nodules on the seafloor and equidimensional geometry of a typical mining block not being suitable for the requirements of the nodule collection system proposed, which is better represented by a long thin block. A mine planning approach of using very long thin collection blocks was adopted to better reflect the mining strategy of the nodule collection system proposed by Allseas and TMC was adopted.
AMC developed the previous conceptual mine plan for exploiting NORI Area D in 2021 for the Initial Assessment (AMC, 2021). The Mine Plan in this technical report has built off the Initial Assessment mine plan and has refined the collection strategy to focus initial collection activities on the Initial Mining Area.
| 12.1.2 | Qualified Person responsibility |
Because of the unique nature of nodules and lack of operating examples of a nodule collection, transport and processing operation, multiple QPs are required to provide expertise for various specialized aspects of the Modifying Factors used to convert a Mineral Resource to a Mineral Reserve to meet the S-K 1300 definition for a Qualified Person to have at least five years of experience in the activity being undertaken to estimate Mineral Reserves.
In preparing inputs to the Mine Plan and in estimating the Mineral Reserve, QPs have relied on information provided by the registrant, TMC, which is discussed in Section 25.
The following appropriately qualified and experienced QPs have signed off on the Modifying Factors for the following areas:
| · | Mine planning and the Mineral Reserve estimation process (AMC) | |
| · | Design and operation of the collector, VTS, PV, surface support vessels, and impact of the geotechnical analysis on collector design (TMC) | |
| · | Seafloor geotechnical analysis (APYS) | |
| · | Seafloor slope and short-scale geological feature modelling (MARGIN) | |
| · | Nodule processing (Canadian Engineering Associates Ltd) | |
| · | Nodule marketing, environmental and social assessment, operating expenditure (OPEX) and capital expenditure (CAPEX) estimation (TMC), and | |
| · | Economic Analysis (Lanasera) |
| amcconsultants.com | 256 |
| Technical Report Summary of Prefeasibility Study of NORI Area D, Clarion Clipperton Zone | |
| TMC the metals company Inc. | 0225054 |
| 12.2 | Key assumptions and methods used |
| 12.2.1 | Environmental Modifying Factors |
Nodules will only be collected from areas that are approved after environmental assessment. Restricted environmental areas, including sensitive environmental habitat areas and buffers surrounding them, such as seamounts, the area of the Test Mining, and a Preservation Reference Zone are not considered for nodule collection.
Environmental Modifying Factors were provided by the registrant, derived from the following sources:
| · | Assessment
by TMC of sedimentation modelling results (see section 17.3) and observed instances of mobilized
seafloor sediment on sloped seafloor was undertaken to determine the stand-off distance required
to protect restricted environmental areas, and the proposed NORI Area D Commercial Recovery
Permit Area boundary from encroachment by sediment generated by collection operations. A
1,000 m exclusion zone was applied to sensitive environmental zones and the boundary of the
proposed NORI Area D Commercial Recovery Permit Area (see Section 17). |
| · | Seafloor current assessment undertaken by DHI (see Section 17) and TMC determined that seafloor currents were highly variable but there was no overall trend in direction, so that seasonal changes in seafloor currents are not expected to materially impact sedimentation patterns, and therefore no account of seasonality was required for collector path selection. |
Material Modifying Factors resulting from environmental restrictions to identify the areas available for collection are discussed in detail in Section 17 and shown in Table 12.1. Once collection operations commence, operations experience will be used to review, and where necessary, revise buffer zone distances.
| Table 12.1 | Environmental Modifying Factors |
| Parameter | Unit | Value | Source |
| Buffer zone – lease boundary | m | 1,000 | Section 17 |
| Buffer zone – Test Mining area | m | 1,000 | |
| Buffer zone – Preservation reference zone | m | 1,000 | |
| Buffer zone – environmental zones | m | 1,000 |
| 12.2.2 | Geotechnical analysis Modifying Factors |
Geotechnical analysis was undertaken by APYS on the seafloor geotechnical data collected during the box-core sample collection and test work program to determine the geotechnical character of the seafloor (see Section 7.14) to enable Allseas to determine, amongst other things, the ability of the seafloor in NORI Area D to support the production-scale collector during traversing slopes of up to 4°, turning, and traversing over ground on which it has already travelled.
Geotechnical Modifying Factors were derived from the following sources:
| · | Geotechnical soils data was systematically collected across the NORI Area D site from box core tests and samples, and in situ testing. |
| · | An assessment of the soils across NORI Area D, including the Project Zero area, was made based on observations from the fieldwork and onshore laboratory testing reports and a generalized geotechnical classification from which summary strength ranges were determined. In general terms, the seafloor across NORI Area D can be classified as a silty clay, that in parts is very silty and sometimes more like a silt. There are exceptions to this classification associated with depressions or high areas of seafloor such as ridge lines, abyssal hills and volcanic features. |
| · | Further seafloor investigation was conducted in the Test Mining Area, which focused on high-definition characterization of the upper 0.50 m of the seafloor using box core data and deeper classification using seabed CPT investigation. The results confirmed the results from the wider NORI Area D, although they were more consistent and less complex than the Project Zero Area and NORI Area D overall, due to the smaller area and the dominance of the flat geoform domain. |
| amcconsultants.com | 257 |
| Technical Report Summary of Prefeasibility Study of NORI Area D, Clarion Clipperton Zone | |
| TMC the metals company Inc. | 0225054 |
| 12.2.3 | Geotechnical design Modifying Factors |
APYS provided seafloor geotechnical analysis to TMC and Allseas for use in collector design.
Geotechnical design Modifying Factors were derived from the following sources:
| · | APYS’s geotechnical analysis was used by Allseas, which, along with feedback from the Pilot Test Mining (which identified no trafficability issues for the Pilot collector), was used as a basis to estimate the bearing pressures for the design of the collector tracks that will be supported by the seafloor. The analysis by Allseas demonstrated that the shear strength of the seafloor will be sufficient, with the bearing pressures used for collector track design, to support the collector weight across the initial area planned for mining (Initial Mining Area) (Allseas, 2024a). |
| · | Assessment by Allseas on the impact of seafloor substrate strength, collector speed, height of the Coandă nozzles and pressure of water through the Coandă nozzles on the depth of the collection layer and nodule recovery, and how it varies by seafloor domain, slope and collector speed. Visual control of the depth of collection is unlikely due to redeposition of sediments from previously mined collection paths and therefore collection depth and recovery may be variable. As nodule distribution analysis determined that 96% of nodules are in the top 5 cm, the depth of collection layer is designed to be 3 cm - 5 cm (Allseas, 2024b). |
Geotechnical analysis for collector design
The design specifications provided by TMC for the maximum seafloor slope on which the collector can safely traverse and collect nodules is 4°. The collector’s ability to operate on 4° slopes is supported by geotechnical analysis. There were no slopes encountered in the Test Mining above this angle, although once nodule collection commences, operating experience may show that this slope can be increased.
Collector bearing capacity, sinkage, stability analyses for various load cases, seabed release forces, track slip and traction analysis were assessed by Allseas (Allseas, 2024a) to determine slope limitations and to assess turning capabilities. No restrictions, other than the maximum 4° slope limit, were identified in this analysis to limit collector trafficability in NORI Area D, based on the geotechnical parameters provided to Allseas by APYS.
The design of the collector tracks is based on nodule production up to a speed of 0.5 m/s at slopes of up to 4°. The collector can drive at slopes from 4° - 10°, at a linearly reduced speed down to 0.2 m/s (10° slope), which is for driving only, not nodule collection.
Assessment of collection depth
The design objective for the collector height adjustment system to control nodule pickup efficiency is to be able to control nozzle height to within 20 mm of the required level, with a target bandwidth of 40 mm from the nodule reference level. Evaluation of the Test Mining height adjustment system performance confirmed the 20 mm accuracy bandwidth.
Trials at Deltares also confirmed an erosion depth consistent with design objectives. No additional allowance was made for nodule loss from not achieving the design collection depth.
Geotechnical Modifying Factors are shown in Table 12.2.
| amcconsultants.com | 258 |
| Technical Report Summary of Prefeasibility Study of NORI Area D, Clarion Clipperton Zone | |
| TMC the metals company Inc. | 0225054 |
| Table 12.2 | Geotechnical Modifying Factors |
| Parameter | Units | Value | Source |
| Maximum slope for nodule collection | Degrees | 4 | Allseas 2024a and Allseas 2024b |
| Percent of area lost to trafficability | % | 0 | Allseas 2024b |
| Percent of area where nodule collection depth fails to reach 3-5 cm collection layer | % | 0 | Assumption |
| 12.2.4 | Seafloor topography model Modifying Factors |
Analysis of the seafloor topography data from AUV and vessel-based multi-beam data was undertaken by MARGIN to characterise the NORI Area D seafloor according to seafloor slope and the presence of geological features (see Section 7.14) that will be large enough or deep enough to disrupt Collector operations (geo-obstacles). Short-scale geological features were characterised by Allseas depending on the production impact to the Collector (loss of nodules by having to avoid geo-obstacles and productive time lost). The physical dimensions of what constitutes a geo-obstacle will be refined with increased definition of the Collector design specifications.
Seafloor topography Modifying Factors were derived from the following sources:
| · | A geo-obstacle probability model was developed for the NORI D lease. This was based on modelling the proximity of geo-obstacle features mapped from (limited) high-resolution AUV geosurvey data to larger-scale geological domains mapped primarily from vessel-based bathymetry data. The model predicts the probability of depression-features above 0.3 m depth, 2 m diameter and > 4° slope angle cut-off criteria. The model was used to derive a probability heat-map of depression-feature occurrence in areas without detailed AUV geosurvey data. In addition, this model predicts the probability of slopes > 4° that are associated with broader-scale seafloor geomorphology (abyssal hill slopes and hummocky terrain within the abyssal valleys). The model was subsequently calibrated with detailed AUV geosurvey data acquired in the Initial Mining Area. The probability model was used to assess nodule losses, excising areas with slopes greater than 4° and with geological features that will disrupt collection activities, such as depressions, hardground or volcanic outcrop areas. |
| · | Analysis of the distribution of nodule type with seafloor topography data was undertaken by MARGIN to confirm that there was an association between nodule type and seafloor domain (see Section 11). Type 1 nodules can be associated with both flat terrain and hummocky terrain. Type 2 and 3 nodules can be located within individual geo-obstacle depression features, and also within well-developed hummocky terrain. Type 2 and 3 nodules have not been observed to date in flat, smooth terrain. This analysis identified that separate allowances do not need to be made by nodule type, as the different nodule types generally occur in distinct areas. |
Expected nodule losses are different for Type 1 nodules and Type 2/Type 3 nodules. Type 1 nodules typically occur in seafloor with a higher probability of slope <4° and low nodule loss resulting from geo-obstacles. Type 2/Type 3 nodule distribution is more typically in seafloor with a lower probability of slope up to 4° and higher nodule loss from geo-obstacles.
Detailed mapping results of the area proposed for the initial Collector runs (Runs 19 and 20) were used by MARGIN to derive probabilistic estimates of the area affected by short-scale geological features. Estimates were divided into four probability classes (see MARGIN 2024 and MARGIN 2025). Figure 12.3 shows a plan of the different types of geo-obstacles identified by detailed AUV mapping of the seafloor in the central area of Runs 19 and 20.
| amcconsultants.com | 259 |
| Technical Report Summary of Prefeasibility Study of NORI Area D, Clarion Clipperton Zone | |
| TMC the metals company Inc. | 0225054 |
| Figure 12.3 | Graphic depicting seafloor Geo-obstacles in the central section of Runs 19 and 20 |
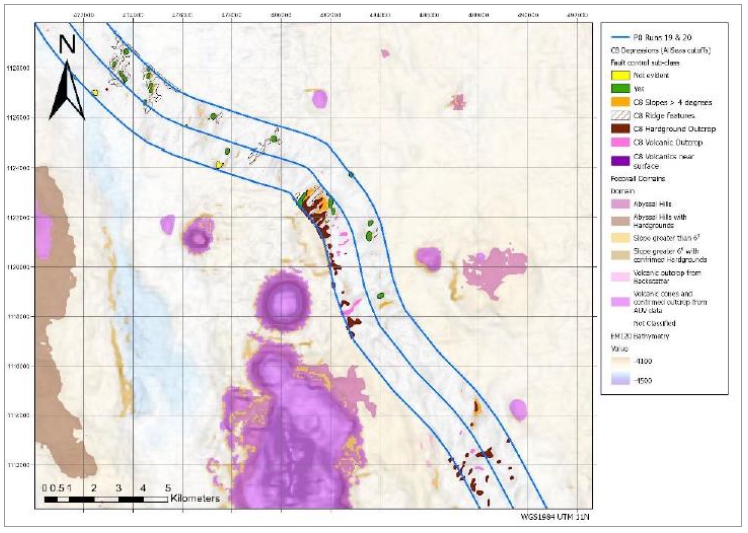
Source: MARGIN
This assessment identified that of the 235 km2 mapped, approximately 24 km2 (10.4%) consisted of areas that will be inaccessible to the Collector, such as depressions, slope areas above 4° or hardground or volcanic outcrop areas (collectively, Geo-obstacles) from which nodules could not be collected).
Geo-obstacles covered 3.8% of the area modelled as Class 4 (low probability), 7.5% of Class 3 (low-moderate probability), 19% of Class 2 (moderate-high probability), and 37% of Class 1 (high probability). Type 1 nodules were typically found in Class 3 and 4 areas and Type 2 and Type 3 nodules in Class 1 and 2 areas.
| 12.2.5 | Nodule loss from Geo-obstacle Modifying Factors |
Analysis of the MARGIN short-scale geological features probability models was used by AMC as the relevant QP to estimate nodule losses during collection. Visual assessment of these areas showed that, in addition to the area covered by the Geo-obstacles themselves, the Collector may not be able to access the areas between adjacent Geo-obstacles, isolating the nodules in these areas from collection. As a result, an allowance for additional nodule loss was included by AMC to account for the areas that will be sterilized for nodule collection in and around geo-obstacles.
Table 12.3 shows the area covered by Geo-obstacles by probability class in Run 19 identified by MARGIN (column A). AMC assumed the loss of nodule tonnage will be approximated by loss of area available for collection. AMC also assumed that nodules loss due to inaccessibility will be the same for all types of nodules as the nodule loss will be a combination of the nodules lost from the area covered by the Geo-obstacles and additional nodule loss from areas between geo-obstacles. The more frequent the Geo-obstacles, the higher the losses between Geo-obstacles will be, so that an additional 100% nodule loss was assumed for Class 1 areas, 50% for Class 2, 25% for Class 3 and no additional loss for Class 4 (column B). For example, in probability Class 2, 17.2% of the area is estimated to be Geo-obstacles and the allowance for adjacent area losses is estimated as 8.6% (17.2 x 50%). The combined nodule loss from Geo-obstacles by probability class is shown in column C.
| amcconsultants.com | 260 |
| Technical Report Summary of Prefeasibility Study of NORI Area D, Clarion Clipperton Zone | |
| TMC the metals company Inc. | 0225054 |
| Table 12.3 | Geo-obstacle probability in Run 19 by probability class |
| Probability Class | (A) Geo-obstacle (% of Area) |
(B) Allowance for adjacent Area Loss |
(C) Type 1/2/3 Nodule Loss (% t) |
| 1 (>75% Geo-obstacle) | 35.3 | 100% | 71 |
| 2 (50-75% Geo-obstacle) | 17.2 | 50% | 26 |
| 3 (25-50% Geo-obstacle) | 7.0 | 25% | 8.7 |
| 4 (<25% Geo-obstacle) | 5.5 | 0% | 5.5 |
| Average across Run 19 | 10.4 | - |
Note: Adapted from MARGIN 2025
| 12.2.6 | Resource model Modifying Factors |
The resource model nodule contains grades for each of the metals of interest (manganese, nickel, cobalt and copper), nodule abundance (kg/m2), nodule type, nodule density, nodule moisture, and nodule size distribution (see Section 11). This model was the basis on which production and revenue estimates were developed.
Resource model Modifying Factors were derived by from the following sources:
| · | Assessment of the distribution of nodules within the box-cores to determine the proportion of nodules in the near-seafloor collection layer (5 cm) and how this varies by geological domain, nodule type, and seafloor slope. Analysis identified that 96% of nodules are in the 5 cm layer immediately below the seafloor (see Section 11). |
| · | Assessment of the distribution of nodules by size within the box-cores to determine the proportion of Type 1, Type 2, and Type 3 nodules (characterised by size) in each box core to determine the distribution of nodules by Type across the resource model. |
Modifying Factors affecting the resource model are shown in Table 12.4.
| Table 12.4 | Resource model Modifying Factors |
| Parameter | Units | Type
1 Nodule Area |
Type
2/3 Nodule Area |
Source |
| Nodules
in collection layer (top 5 cm) |
% | 96 | 96 | From AMC box core analysis (Section 11) |
| 12.2.7 | Nodule collection Modifying Factors |
Nodules will be collected from the seafloor by a remotely operated Collector, with sediment removed by the Collector hopper (counter current flow decantation), and then pumped to the VTS and onto the PV, where nodules fines are separated during dewatering (screens and hydro cyclones) before nodules are stored in the hold.
| amcconsultants.com | 261 |
| Technical Report Summary of Prefeasibility Study of NORI Area D, Clarion Clipperton Zone | |
| TMC the metals company Inc. | 0225054 |
Nodule collection Modifying Factors were derived from the following sources:
| · | Collector engineering and design specifications were used by Allseas to confirm the physical dimensions and capabilities of the Collector (Allseas, 2024), including Collector width, weight, length, turning circle, maximum speed on different seafloor slopes, and availability. |
| · | Sedimentation analysis from Collector and VTS operations was undertaken by DHI for the Test Mining and the proposed operation (see Section 17). Analysis undertaken by DHI identified that sediment from previous collection paths will form an unconsolidated suspended layer above the seafloor that will obscure nodules and previous Collector paths but will not necessarily impact nodule recovery on adjacent collection paths. No adjustment to collection efficiency factors was applied. During the Test Mining, sedimentation of 2-5 cm was observed with no impact on recovery efficiency. |
| · | Collector control analysis was undertaken by Allseas to determine the offset distance between Collector paths that will allow the Collector to maximize production by avoiding tracking over already mined seafloor, despite optical visibility being obscured by sedimentation from previous Collector paths. Forward looking sonar imaged the previoustrack edge very well during the Test Mining and other technologies, including radar and Lidar are being tested to determine their applicability. An offset distance of 1.0 m was recommended by Allseas (Allseas, 2024). |
| · | A field efficiency factor was used by Allseas to recognize lost production from turning the Collector around at the end of a collection path, operating in and around Geo-obstacles. Allseas estimated a field efficiency of 85% when the Mine Plan included long (+80 km) collection paths, potentially decreasing with the adoption of shorter collection paths where Collector turning activities are occurring more frequently. |
| · | Umbilical and VTS movement simulation modelling and PV capabilities were used by Allseas to evaluate single Collector operations. Two Collectors tethered to a PV increases operational complexity, and more detailed analysis is ongoing to assess how two Collectors can be safely and effectively connected to the appropriately sized VTS without the VTS limiting production or Collector umbilical entanglement impacting production. For the mine plan and Mineral Reserve, it has been assumed that two Collectors can be safely and productively tethered to a PV. Additional tethered Collectors were not considered viable for the PV Hidden Gem and this assumption has been applied conservatively to the additional vessels in the NORI Area D mine plan. |
| · | Operating experience in the Test Mining, experience in marine operations, and simulation modelling of umbilical and VTS movements were used by Allseas to estimate the impacts of turning the Collector, including a 180° turn to retrace its movements along a parallel trace to the previous collection path. |
| · | Similarly, operating experience in the Test Mining, experience in marine operations, and simulation modelling of umbilical and VTS movements were used by Allseas to estimate the impacts of having to relocate the nodule collection system (Collector and VTS) to the next mining location . The method of relocation will depend on the distance of relocation and seafloor conditions. |
| · | VTS test work and Test Mining experience were used by Allseas to confirm the range of physical capabilities of the VTS in transporting nodules to the PV. Prototype validation tests are ongoing as part of the commercial scale equipment development. For example, airlift prototype noduleslip velocity tests are ongoing and jumper wear/abrasion, corrosion riser coating wear and resistance tests are planned, with results to inform the engineering and design specifications for the various VTS components (Allseas, 2024). |
| · | Requirements for the physical and mechanical capabilities of the Collector, VTS, and PV were derived from a weather downtime analysis and the preliminary operating and maintenance model (Allseas, 2024). |
| amcconsultants.com | 262 |
| Technical Report Summary of Prefeasibility Study of NORI Area D, Clarion Clipperton Zone | |
| TMC the metals company Inc. | 0225054 |
Collector width
A 15 m wide collector was selected by Allseas based on back-calculating production requirements of 1.5 Mwmtpa of nodules per collector using an average nodule abundance of 17 kg/m2 with a nominal collector speed of 0.4 m/s operating for 75% of annual hours at a field efficiency of 85% and Nodule Recovery of 77% with a buffer of 5%.
Time spent in lower abundance areas will impact overall production if it can’t be compensated elsewhere in the Mine Plan with either higher speeds, operating hours, field efficiency or nodule recovery. For example, collection speed can be increased up to 0.5 m/s to compensate for lower abundances. In practice this means an abundance of 0.4/0.5 x 17 = 13.6 kg/m2 is the minimum average abundance on which production targets can be maintained. A component of the path simulator tool and Monte Carlo tool development will be to confirm that production from lower abundance areas does not impact achievement of yearly production targets.
Collector speed
The design of the collector is based around a nominal speed when collecting nodules of 0.4 m/s, based on experience with the Test Mining, although variable speeds are contemplated for functions ranging from 0.35 m/s in high nodule abundance areas to 0.75 m/s when nodule production is not occurring.
The impact of hummocky (including rounded mounds) grounds on collector speed was also assessed. These areas are associated with the occurrence of Type 2 and Type 3 nodules. However, looking at the processed detailed bathymetry data and the collector propulsion and maneuverability analysis, the QP considers that a reduced collector speed in these areas is not necessary. The collector should be able operate in these areas at the same speed as the abyssal plain as the wavelength of the hummocks at 100 m – 200 m is significantly longer than the vehicle and thus unlikely to impact it. However, there may be a reduced field efficiency due to the more complex collection path and inefficiencies required to avoid the relatively higher number of Geo-obstacles.
Allseas is developing a collection path simulation tool that uses artificial intelligence techniques to optimize production operations by mapping the most efficient collection paths to take in avoiding Geo-obstacles (see Section 13). Field efficiency will be further refined with the collection path simulation tool results.
Impact of sedimentation
No assessment has been undertaken on the impact of sedimentation on collector speed or recovery. During the Test Mining, sedimentation of 2-5 cm was observed and no impact on recovery efficiency was observed.
Gap between collector runs
To maximize production by minimizing the time that the collector runs over ground from which nodules have already been collected, Allseas plan to leave a 1.0 m gap between collector runs. Once collection commences, the previous collector path is expected to be obscured by deposited sediment, and collector positioning technology (forward-looking sonar) and operational experience in being able to closely control the collector path alongside the previous path will be used to review and revise this gap distance.
The position reference system for the collector consists of a vessel-mounted ultra-short baseline acoustic positioning system (Kongsberg HiPAP 602 which is an industry standard) providing an absolute reference with an accuracy at 4,500 m depth of 2 m - 5 m, combined with a relative reference system consisting of a collector-mounted sonar scanning the seafloor to identify the previous track.
The ability of sonar to detect the previous track was tested during the Test Mining. Further improvements are expected in the collector position control to +/- 0.5 m with reference to the previous track. The track detection algorithm is under development and further prototype testing is planned by Allseas. Based on the 0.5 m accuracy, a 1.0 m buffer was selected to avoid the risk of overlapping runs that reduce the effective width of nodule collection.
| amcconsultants.com | 263 |
| Technical Report Summary of Prefeasibility Study of NORI Area D, Clarion Clipperton Zone | |
| TMC the metals company Inc. | 0225054 |
Field efficiency
Field efficiency is a factor included in production estimation to account for sub-optimal seafloor routing due to turns, Geo-obstacles, and miscellaneous operational inefficiencies that the collector will face. This will result in a loss of efficiency and production time from performing turns at the end of each collection path at lower than nominal speed and traverses over previously mined areas, either due to turning or avoiding Geo-obstacles.
Allseas assume an average field efficiency of 85%, comprising the following production losses:
| · | Losses due to the collector and PV needing to P-turn at the end of each run. | |
| · | Losses due to navigating slopes, Geo-obstacles or unexpected ground conditions. | |
| · | Losses for other unexpected events. |
Use of the collection path simulator tool and detailed seafloor mapping prior to deploying the collector to an area will assist in identifying an appropriate field efficiency factor to use for each area. If field efficiency falls too low due to increases in the seafloor complexity that the collector needs to navigate, production will be impacted or the area may be excised from the mine plan.
Number of tethered collectors per PV
The commercial scale Collector will be designed to achieve 1.5 Mwmtpa. To increase production above this level and maximize the productivity of each production vessel, multiple Collectors will be required. The work undertaken to date by Allseas in developing the equipment, infrastructure and procedures to successfully operate multiple Collectors in the field is limited to operation of two Collectors in parallel from the PV Hidden Gem.
As a result, the Mine Plan is based on a second collector operating in parallel with the first collector tethered to the same PV to achieve 3.0 Mwmtpa of nodule production (see section 12.2.3 for timing). Increases in production beyond that level requires the introduction of additional PVs, which will incorporate design improvements based on operating experience with the initial PV (see section 12.2.3 for timing).
The NORI Area D Mine Plan assumes that no more than two collectors can be tethered to each PV, regardless of the design improvements implemented. This assumption will be reviewed with increased operating experience in nodule collection.
Collector relocation time
If the Collector needs to be relocated to a new mining run, relocation can be achieved by three methods – driving, lifting and sailing, or recovery and redeployment.
For relatively short to moderate distances, relocation will be by driving the Collector. A maximum speed during production operations is 0.5 m/s and the maximum speed without production is 0.75 m/s (at 0° slope), so a trade-off calculation will be used in decision making.
To access areas for which access is obstructed by Geo-obstacles, such as steep cliffs or ridges, relocation will be by lifting the Collector from seafloor and sailing the PV at a slow speed of 0.15 m/s with the riser and Collector free-hanging beneath the PV. An allowance of 4 hours shutdown and 6 hours for restart will be required. This will be limited to areas with less than 50 m variation in seafloor height to avoid the risk of dragging the jumper over the seafloor causing damage.
For longer distances, relocation by recovery of the Collector and riser and redeploying them in a suitable location. This will require 10 days to recover and redeploy along with time to transit the PV at a speed of 8 knots.
| amcconsultants.com | 264 |
| Technical Report Summary of Prefeasibility Study of NORI Area D, Clarion Clipperton Zone | |
| TMC the metals company Inc. | 0225054 |
VTS and umbilical design
Design of the VTS, comprising the jumper hose, air riser, return water line and air injection point was developed by Allseas from experience with the Test Mining, testwork, and simulation modelling. Design specifications were developed for the diameter, depth ranges and construction materials for the various VTS sections (jumper hose, two-phase flow and three-phase flow sections), the depth and pressure of air injection, and the speed of nodules through the VTS.
Figure 12.4 shows the basic working principle of the airlift and Figure 12.5 main VTS components when deployed.
| Figure 12.4 | Basic working principle of airlift |
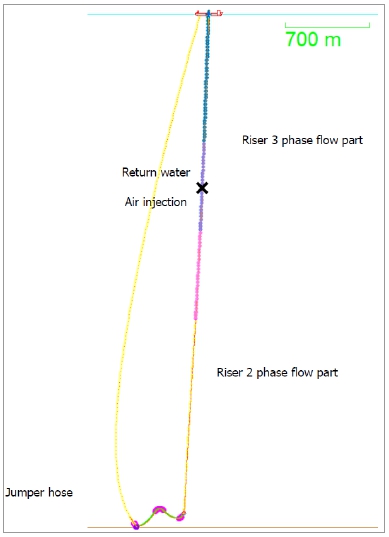
Source: Allseas
| amcconsultants.com | 265 |
| Technical Report Summary of Prefeasibility Study of NORI Area D, Clarion Clipperton Zone | |
| TMC the metals company Inc. | 0225054 |
| Figure 12.5 | Main components of the VTS |
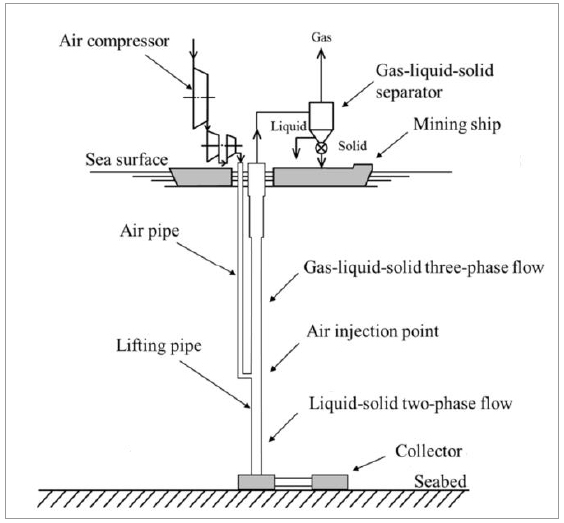
Source: Allseas
Collector turnaround time
The collector turning radius in the Test Mining was designed for 30 m, with the minimum turning radius achieved of 17 m. Current engineering for the collector shows a 12 m turning radius can be achieved.
If a turn of 180° is required at the end of a collection path, both the collector and the PV make a “P-turn” together to manage the umbilical tension, turn the collector 180°, revolve the PV around the collector, reconfigure umbilical tension, and commence the new collection path. There is a risk that umbilical and riser entanglement will occur during this process and a controlled turning pattern is required. During the Test Mining, P-turns took 1.5-2.0 hours, however, simulation using multibody dynamic time domain simulations to optimize the turning procedure in Orcaflex software is able to reduce this to 1.0 -1.5 hours.
System operating hours
Availability of system components were individually estimated by Allseas based on experience with marine operations (see Allseas 2024b), the Test Mining, allowances for weather conditions in the relevant area of the CCZ, and the maintenance program for the components of the collections system, including dry-docking requirements for vessels. Every five years during the vessel class survey, a more extensive maintenance program will be executed. These factors were used to determine collection operating hours per year.
| amcconsultants.com | 266 |
| Technical Report Summary of Prefeasibility Study of NORI Area D, Clarion Clipperton Zone | |
| TMC the metals company Inc. | 0225054 |
Nodule collection
Nodule collection Modifying Factors are shown in Table 12.5.
| Table 12.5 | Collector system Modifying Factors |
| Parameter | Units | Value | Source |
| Collector collection width | m | 15 | Allseas 2024b |
| Collector speed - nominal operating | m/s | 0.4 | Allseas 2024b |
| Collector speed - nominal driving | m/s | 0.75 | Allseas 2024b |
| Losses due to re-sedimentation | % | 0 | Assumption |
| Gap between collection paths | m | 1.0 | Allseas 2024b |
| Field efficiency | % | 85 | Allseas 2024b |
| Maximum collectors per PV | no. | 2 | Analysis |
| Collector/PV turnaround time (P-turn) | hours | 1.5 | Test Mining Report |
| Collector relocation time - driving | hours | formula | Drive at 0.75 m/s |
| Collector relocation time -free-hang | hours | formula | 10 hours + 0.15 m/s |
| Collector relocation time - recover/redeploy | days | 10 | Test Mining Report |
| 12.2.8 | Nodule recovery Modifying Factors |
The collector will not be able to collect all of the nodules from the part of the seafloor that it traverses. The percentage of nodule tonnes that are transported to the storage hold of the PV as a proportion of the tonnes of nodules on the seafloor is called the Recovery. A proportion of nodules are picked up, with sediment, from the seafloor and enter the collector hopper, which separates the majority of sediment by counter current flow decantation, with sediment exiting the collector via the diffuser at the back of the collector. Nodules are then pumped to the VTS and onto the PV, where fine nodule and lighter materials are removed in the dewatering system (screens and hydrocyclones) before nodules are stored in the hold.
Recovery is a function of losses from all collection system components, including losses from:
| · | Nodules that are not in the top 3 cm to 5 cm of the seafloor. |
| · | Nodules not entrained by the Coandă nozzles to enter the collector. |
| · | Losses in the collector hopper during sediment removal. |
| · | Losses in the VTS through breakdown of nodules colliding with other nodules and the VTS walls, resulting in fine particles that will be separated during dewatering. |
| · | Losses in the dewatering system on the PV. |
Nodule collection Modifying Factors were derived from the following sources:
| · | Analysis by AMC that found 96% of the nodules were within the collection layer of the top 3 cm – 5 cm of the seafloor (see Section 11). |
| · | Average Type 1 Nodule Recovery design specification for the collector to achieve during operations. Tests at the Deltares facility showed the design specification was reasonable. |
| · | Analysis by Allseas of losses by system components using simulation models, trials, and the results of the Test Mining. |
| · | The Test Mining area had flat, smooth seafloor and predominantly Type 1 nodules. Additional simulated nodule recovery tests were undertaken at Deltares with simulated seafloor and nodules. Analysis of the results of Deltares seafloor model simulation trials in tanks (see Allseas Hydraulic nozzle - test results Deltares 4, collector oversize and undersize analysis was undertaken by Allseas to estimate Type 1 nodule recovery. |
| · | Recovery of Type 2/3 nodules was tested at Deltares and data was analyzed by Allseas. Based on their particle size distribution (see Figure 7.45) compared with the grizzly bar spacing at the inlet on the collector, a reduction of 20% (relative) was assumed. This is considered to be conservative by the QP. |
| amcconsultants.com | 267 |
| Technical Report Summary of Prefeasibility Study of NORI Area D, Clarion Clipperton Zone | |
| TMC the metals company Inc. | 0225054 |
Table 12.6 shows the Nodule Recovery by collection system component (Allseas 2025c) for Type 1 nodules.
| Table 12.6 | Nodule Recovery by collection system component (Type 1 nodules) |
| Source of loss | Units | Type 1 |
| Nodules in the collection layer | % | 96.0 |
| Collector nodule recovery efficiency | % | 84.3 |
| Collector hopper loss | % | 0.5 |
| Hopper jets loss | % | 1.5 |
| Dewatering loss | % | 2.0 |
| Offshore transfer, transport and offloading | % | 1.0 |
| Nodule Recovery | % | 77.0 |
Nodule Recovery was a key design input to the collector design for both the Test Mining and for the commercial scale collector. Estimates were derived for Type 1 nodules in flat ground from the Test Mining Report. Test Mining results (Table 12.7) show that five boxcore locations have both pre-collection and post-collection results. Based on an average of 16.8 kg/m2 pre-collection abundance values, all residual post-collection abundance values are below 3.6 kg/m2, indicating recoveries of >80%. Based on these results, the design Nodule Recovery was reasonable.
| Table 12.7 | Estimated Nodule Recovery by boxcore location (Type 1 nodules) |
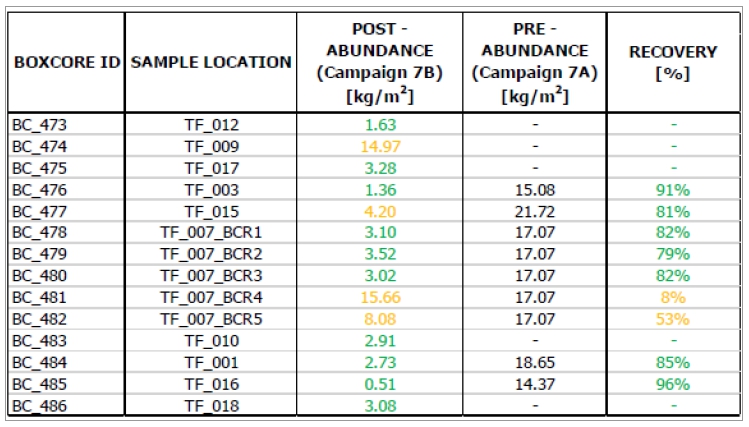
| amcconsultants.com | 268 |
| Technical Report Summary of Prefeasibility Study of NORI Area D, Clarion Clipperton Zone | |
| TMC the metals company Inc. | 0225054 |
Nodule recovery is expected to vary as a function of nodule size. No allowance has been made to vary recovery with collector speed. While increased collector speed in the Pilot collector Test resulted in reduced nodule recovery, Allseas identified that the recovery impact was from the Pilot collector control issues in the trial caused by uncontrolled umbilical loads that will be rectified in the final design of the collector and umbilical. Allseas determined from Deltares trials that collector speed had minimal impact on recovery.
Deltares test results (Allseas, 2025c) showed that with the intended combination of Coandă nozzle parameters for jet thickness and flow velocity, the design Nodule Recovery could be achieved. Table 12.8 shows the results of test run 6, which formed the base case for subsequent test runs.
Figure 12.6 shows photographs of the Deltares test bed before and after Test run 6, showing that the majority of the simulated nodules lying on the test bed in the top part of the photo had been picked up by the simulated collector and are no longer on the test bed in the bottom part of the photo. This shows a high pick-up efficiency using the Test 6 combination of parameters for the simulated collector, even for the larger simulated nodules shown in the top of the photo.
| Table 12.8 | Deltares test run 6 base case Type 1 Nodule Recovery results |
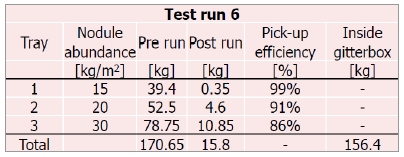
| amcconsultants.com | 269 |
| Technical Report Summary of Prefeasibility Study of NORI Area D, Clarion Clipperton Zone | |
| TMC the metals company Inc. | 0225054 |
| Figure 12.6 | Deltares base case Type 1 Nodule Recovery photos |
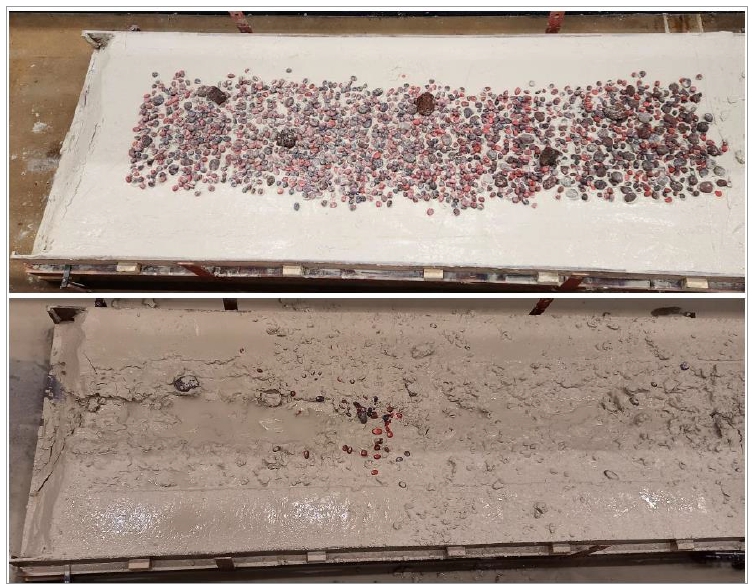
The collector’s Coandă nozzle pick up performance is primarily impacted by the stand-off distance and the rejection of oversize nodules by the grizzly-bars mounted in front of the nozzles to protect the system against clogging. The grizzly-bar spacing is set to 75 mm and screening is expected along the width dimension (intermediate axis).
The main differences between Type 1 and Type 2/3 nodules (other than the terrain they are associated with) are the size, shape and their distribution on/embedding in the seafloor (see Section 11). Analysis on the available size distribution of Type 1, Type 2 and Type 3 nodules show that screening at 75 mm on the secondary axis provides a rejection of oversize of 0.7 -1.9% (Type 1), 16 - 30% (Type 2/3). This is based on similar length, width and height ratios of Type 2/3 and Type 1 nodules.
Prototype testing at Deltares and computational fluid dynamics analysis confirm there is no impact on pick up efficiency for nodules up to 120 mm in length. The reported higher embedment of Type 2/3 nodules will not affect recovery, as the Coandă nozzles will erode the top 3 cm of the seafloor and release those nodules.
However, results from Deltares test run 10 on Type 2/3 nodules (see Table 12.9), showed a reduced pickup efficiency in line with the size distribution analysis above, so a 20% relative reduction in Nodule Recovery was assumed for Type 2/3 nodules.
| amcconsultants.com | 270 |
| Technical Report Summary of Prefeasibility Study of NORI Area D, Clarion Clipperton Zone | |
| TMC the metals company Inc. | 0225054 |
| Table 12.9 | Deltares test run 10 Type 2/3 Nodule Recovery results |
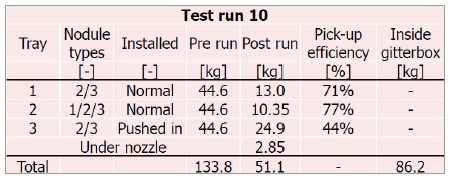
Nodule Recovery Modifying Factors by Geo-obstacle probability class are shown in Table 12.10.
| Table 12.10 | Collection recovery by type and probability class Modifying Factors |
| Geo-obstacle Probability Class | Units | Type 1 | Type 2/3 |
| 1 (>75% Geo-obstacle) | % | 77 | 62 |
| 2 (50-75% Geo-obstacle) | % | 77 | 62 |
| 3 (25-50% Geo-obstacle) | % | 77 | 62 |
| 4 (<25% Geo-obstacle) | % | 77 | 62 |
| 12.2.9 | Marine operations Modifying Factors |
Nodule collection operations will be controlled from the operating room on board the PV. Control operations will be supported by Allseas using its marine operating experience in personnel rostering/transfer and logistics. Once the storage hold of the PV is full, nodules will be transferred from the storage hold to the hold of a 50,000 t transfer vessel via a high-speed (2,500 t per hour) ship-to-ship conveyor mounted on a luffing and slewing boom. Collector operations are expected to continue during transfer operations to minimize loading impact on production.
Marine operations Modifying Factors were derived from the following sources:
| · | Marine operations experience, prevailing weather conditions and the system operating model were used by Allseas to develop an operating hours model to determine, in conjunction with collector production rates, forecast ship-loading times for use in OPEX estimates and to ensure that ship-loading was not being undertaken during collector turning operations at the end of a collection path. |
| · | Collector and PV interaction simulations were used by Allseas to model movements to determine effective maneuvering patterns to prevent entanglement of the umbilical causing damage or impacting production. |
| · | Marine operations experience, prevailing weather conditions and the potential operating hours discussed above were used by Allseas to develop an operating hours model to determine, in conjunction with collector production rates, annual production forecasts (Allseas, 2024b). |
| 12.2.10 | Mine planning Modifying Factors |
Mine planning was undertaken by AMC, using experience from layered bulk commodity and base metal terrestrial mining operations. Mine planning has evolved over the course of developing the Mine Plan, from the use of regularly shaped mining blocks and a conventional schedule optimization approach used in the Initial Assessment, to the elongated collector path blocks oriented in a NNE-SSW direction in alignment with surface weather conditions and seafloor geology and ridge directions.
| amcconsultants.com | 271 |
| Technical Report Summary of Prefeasibility Study of NORI Area D, Clarion Clipperton Zone | |
| TMC the metals company Inc. | 0225054 |
Mine planning Modifying Factors were derived from the following sources:
| · | The mine plan is designed to minimize traversing over already mined seafloor, and where this occurs during operations, some proportion of the remnant nodules may be collected. However, the mine plan assumes no further recovery of nodules in these areas. |
| · | Assessment of the resource model, the proposed collection method and the proposed collection equipment (the collector and VTS) was undertaken to assess an appropriate allowance for losses that may occur during the nodule collection process. In addition to environmental buffer zone losses discussed above, losses impacting nodule recovery are expected to result from gaps between collection paths, areas sterilized by Geo-obstacles, areas sterilized around restricted environmental zones, and collection, subsea separation and screening losses. |
The estimation of the Mineral Reserve is derived from the following process:
| · | Mineral Resource estimation of nodules by nodule type and classification in the proposed NORI Area D Commercial Recovery area. |
| · | Exclude the nodules within the NORI Area D Mine Plan Area that are in environmental, seamount, or lease buffers. |
| · | Develop NNW-SSE trending mining blocks across NORI Area D. The Initial Mining Area was subdivided by 1,200 m wide blocks to provide better definition in the early years of the schedule and the remaining area outside the Initial Mining Area by wider 4,800 m blocks. |
| · | Small areas below the 4 kg/m2 minimum abundance cut-off used to define Mineral Resources and Inferred Mineral Resources are included in mining blocks to create viable mining blocks and are considered as the equivalent of dilution by the QP. Approximately 3% of Mineral Resources within NORI Area D are classified as Inferred. |
| · | Exclude the nodules within the NORI Area D Mine Plan Area that can’t be included in mining blocks in the Mine Plan because of short collector paths caused by unfavourable geometry due to isolation of areas between seamounts, environmental areas and the lease boundary. |
| · | Exclude the nodules within the mining blocks that can’t be picked up by the Collector (slopes >4°, gaps between collection paths, areas sterilized by Geo-obstacles, areas sterilized around restricted environmental zones, and collection, subsea separation and screening losses). |
| · | Schedule nodule production by mining block within the Initial Mining Area followed by the remainder of NORI Area D. |
| · | Confirm economics of nodule extraction via a financial model using mining blocks derived from Measured and Indicated Mineral Resources. For NORI Area D, all mining blocks are derived from Measured and Indicated Mineral Resources but may contain non-material amounts of Inferred Mineral Resource and unclassified material below the 4 kg/m2 abundance cut-off included as dilution. |
| · | On confirmation of positive economics, define the Mineral Reserve as those mining blocks derived from Measured and Indicated Mineral Resources for which the modifying factors are underpinned by a PFS level of assessment. For NORI Area D, only mining blocks within the Initial Mining Area are converted to Mineral Reserve. |
| amcconsultants.com | 272 |
| Technical Report Summary of Prefeasibility Study of NORI Area D, Clarion Clipperton Zone | |
| TMC the metals company Inc. | 0225054 |
Collector path length
The preferred strategy for collector path length is to maximize the collector path length to maximize efficiency by minimizing production losses from turning the collector around at the end of the path and to facilitate trans-shipment activities, with an initial target of 80 km. In developing the Mine Plan, it was realized that this was unsustainable due to the need for the collector path to constantly change from the preferred NNE-SSW direction to avoid the large number of seamounts (plus buffer zones) and Geo-obstacles within the Initial Mining Area. Allseas recognized the need at this point for a collector path simulation tool using artificial intelligence to help select the most efficient collector paths for a given area. This collector path simulation tool is still in development.
This strategy was used to inform the Initial Mining Area, with the initial collector paths, dubbed Runs 19 and 20, approximately 98 km long and 2 km wide, which will be sufficient for the first 2 years of production. The Mine Plan will be updated once operations commence, and operational experience will be used to update collection practices and preferred collector path lengths and orientations.
Mine planning beyond Runs 19 and 20 used a more systematic approach to assign areas to be mined to a series of mining blocks oriented in a NNW-SSE direction (mining blocks) to increase the utilization of the Mineral Resource. The intent in operation is still to maximize collector path length, and it will be the role of short-term mine planning to develop coherent collector paths by amalgamating the systematically developed mining blocks into the long collector paths required to maximize collection efficiency.
In defining the Mineral Reserve, mining blocks less than 10 km were omitted from the Mine Plan. It is not intended that collection paths of 10 km will be used in operation, with the shorter mining blocks to be appended to adjacent mining blocks to form reasonable collection paths. The QP expects that there will be few collection paths at an effective path length less than 20 - 25 km.
Production will initially be focused on the longest collection paths, with shorter paths left until later in the Mine Plan when nodule collection learnings have been used to develop and embed more efficient collection procedures and systems.
| 12.2.11 | Nodule processing Modifying Factors |
Nodules will be processed to generate manganese silicate and nickel/cobalt/copper alloy initially, followed by nickel/cobalt/copper matte from Year 3. Nodules are proposed to be toll-treated initially in a modified rotary kiln electric furnace plant. Commercial scale trials processing 2000t of nodules have been completed at the modified 1.3 Mwmtpa PAMCO Hachinohe smelting facility located in northern Japan. Once nodule production increases above 1.3 Mwmtpa, the additional nodules could be processed using the same processing flowsheet through processing facilities, anticipated to be located in Indonesia, to produce the same products at the same product qualities.
The study identified that a 6.4 million wet tonnes per annum (nodule equivalent) refinery could be operational within 5 to 6 years in support of TMC’s timing requirements. In Year 6, this volume of matte generated in Indonesia will be sent to the new refinery while the remainder is sold to the market. By Year 10, 100% of generated matte will be processed in the United States. Products would include, nickel sulfate, cobalt sulfate, copper cathode and ammonium sulfate.
Nodule processing Modifying Factors were derived from the following sources:
| · | Metallurgical analysis of nodules was used to determine the appropriate metallurgical flowsheet for processing the nodules and identify appropriate toll-treatment facilities that could be converted to the required metallurgical flowsheet. |
| · | TMC undertook pilot testing at 70 t scale to demonstrate operating conditions and confirm metallurgical conditions and recoveries. |
| · | The metallurgical flowsheet and the results of the metallurgical pilot test work was used by TMC, PAMCO and others to determine, for each toll-treatment facility, the processing throughput rate, products recovered, product quality, and metallurgical recovery to be delivered from that processing flowsheet. |
| · | Overall product recoveries were used by TMC to determine overall processing plant OPEX. |
| amcconsultants.com | 273 |
| Technical Report Summary of Prefeasibility Study of NORI Area D, Clarion Clipperton Zone | |
| TMC the metals company Inc. | 0225054 |
Processing Modifying Factors developed by TMC and reviewed by CEA a as QP during the PAMCO pre-feasibility study20 are shown in in Table 12.11.
| Table 12.11 | Nodule processing Modifying Factors |
| Process Step | Manganese
Recovery (%) |
Nickel
Recovery (%) |
Cobalt
Recovery (%) |
Copper Recovery (%) |
| Metal recovery to alloy | - | 96.9 | 93.1 | 93.6 |
| Metal recovery to matte | - | 94.8 | 77.5 | 86.4 |
| Metal recovery to sulfate | - | 94.6 | 77.2 | 86.2 |
| Manganese recovery as manganese silicate | 98.9 | - | - | - |
| 12.2.12 | Nodule marketing Modifying Factors |
Nodules collected from NORI Area D will be marketed by TMC, who have undertaken analysis of a detailed assessment by base metals marketing specialists, Benchmark Mineral Intelligence (BMI) and CRU International Limited (CRU), of the product quality specifications required to market the proposed products, the price that could be achieved from the product and the realization costs for marketing the products.
Mineral Reserve Modifying Factors were derived from the following sources:
| · | Market assessments were undertaken by BMI and CRU to identify, in conjunction with metallurgical analysis, appropriate products to produce from nodules (see Section 16). |
| · | Product assessments were undertaken by CRU to identify product qualities, and product prices, payabilities, and selling costs appropriate for those product qualities (see Section 16). |
| · | Assessments were undertaken by TMC of government and third-party requirements to identify other costs associated with producing nodules and selling nodule products in the jurisdictions in which they are operating (see Section 16). |
Forecast commodity price and marketing Modifying Factors were provided by TMC as QP and are summarized in Table 12.12.
20 TMC 2024, Processing deep sea polymetallic nodules at PAMCO processing facility, June 2024
| amcconsultants.com | 274 |
| Technical Report Summary of Prefeasibility Study of NORI Area D, Clarion Clipperton Zone | |
| TMC the metals company Inc. | 0225054 |
| Table 12.12 | Commodity price Modifying Factors |
| Parameter | Unit | Price | Payability
– Alloy (%) |
Payability
– Matte (%) |
| Nickel metal | US$/t | $20,295 | 65% | 80% |
| Nickel sulfate | US$/t | $21,633 | - | - |
| Copper metal | US$/t | $11,440 | 60% | 70% |
| Cobalt metal | US$/t | $56,117 | 44% | 60% |
| Cobalt sulfate | US$/t | $55,198 | - | - |
| Manganese contained in manganese silcate product | US$/dmtu | $5.46 | - | - |
| 12.2.13 | Production target Modifying Factors summary |
The NORI Area D
project development strategy and forecast production ramp-up for the
Mineral Reserve was provided by TMC and reflects the following production timeline and production strategy:
| · | Year 0 – initial deployment, commissioning and ramp-up of a single collector and PV (Hidden Gem). |
| · | Year 1 – operation of a single collector and confirmation of single collector operating parameters and procedures. |
| · | Year 2 – upgrading of the riser and additional compressor spread to allow a second collector operating in parallel with the initial collector and tethered to the same PV. |
| · | Year 3 – full production from two Collectors operating in parallel and the addition of PV2. |
| · | Year 4 – full production from two collectors operating in parallel for Hidden Gem and PV2 and the addition of PV3 and PV4. |
| · | Years 5-8 - half year production because of drydocking the PVs for the 5-yearly vessel class survey and sustaining capital works. |
| · | Years 9 – full production from two Collectors operating in parallel on four PVs |
| · | Years 10 - 13 – same activities as Year 5-8. |
| · | Year 14 – same activities as year 9. |
| · | Year 15 - 16 – same activities as years 10-13 |
| · | Year 17 – Demobilize PV3 and full production from two collectors operating in parallel on HG, PV2 and PV4. |
| · | Year 18 – Demobilization of HG full production from two collectors operating in parallel on PV2 and PV4. |
| · | Year 19 – demobilization of PV2 and PV4. |
The production ramp-up Modifying Factors provided by TMC are shown in Table 12.13.
| amcconsultants.com | 275 |
| Technical Report Summary of Prefeasibility Study of NORI Area D, Clarion Clipperton Zone | |
| TMC the metals company Inc. | 0225054 |
| Table 12.13 | Production targets |
| Parameter | Units | Value |
| Production – Year 0 | Mwt | 0.2 |
| Production – Year 1 | Mwt | 1.0 |
| Production – Year 2 | Mwt | 2.0 |
| Production – Year 3 | Mwt | 5.0 |
| Production – Year 4 | Mwt | 11.0 |
| Production – Year 5-8 | Mwt | 10.5 |
| Production – Year 9 | Mwt | 12.0 |
| Production – Year 10-13 | Mwt | 10.5 |
| Production – Year 14 | Mwt | 12.0 |
| Production – Year 15-17 | Mwt | 10.5 |
| Production – Years 18 | Mwt | 5.4 |
| Production – Year 19 | Mwt | 0.0 |
| Total production | Mwt | 164.1 |
| 12.2.14 | Economic Modifying Factors |
OPEX and CAPEX were developed by TMC from a number of sources and are detailed in Section 18. Costs were used in a financial model with revenue forecasts developed by TMC from the Marketing Modifying Factors in an economic evaluation detailed in Section 19, to determine that extraction of the Mineral Reserve can be justified using reasonable financial assumptions.
Economic Modifying Factors were derived by TMC from the following sources:
| · | OPEX for the collector, VTS, and PV were derived by Allseas using its marine experience, experience during the Test Mining, and engineering first principles (see Section 18). |
| · | CAPEX for the collector, VTS, and PV were derived by Allseas using its marine experience, Test Mining results, engineering first principles and vendor quotes (see Section 18). |
| · | OPEX for the processing plant were derived by TMC using the toll-treatment agreement, experience of the processing plant operator (PAMCO in the first instance) engineering first principles and the results of processing test work which in the case of PAMCO involved two programs treating 22 t and 2,000 t respectively (see Section 18). |
| · | CAPEX for the processing plant (capital recovery costs) is included in the tolling fee under the toll-treatment agreement between PAMCO and TMC. A similar arrangement will be arranged by TMC for processing additional nodules through other processing facilities (see Section 18). |
| · | The location of the nodule processing plant, the transport vessel loading time and demurrage cost, and the processing plant off-loading facilities were used by TMC to estimate nodule transport costs (see Section 18). |
| · | Corporate overheads associated with operating a nodule collection program in the CCZ were estimated by TMC from its experience with exploring in NORI Area D (see Section 18). |
| · | General and administration (G&A) OPEX associated with operating a nodule collection program in the CCZ, including personnel and logistics costs to support an operation in the CCZ, were estimated by TMC from its experience with exploring in NORI area D, the Test Mining, and first principles (see Section 18). |
| · | Environmental monitoring OPEX associated with operating a nodule collection program in the CCZ were estimated by TMC from its experience with exploring in NORI Area D, the Test Mining, commitments made in the Test Mining EIS and EMMP, regulatory requirements, and first principles (see Section 17). |
| · | CAPEX for G&A, environmental monitoring, social impact programs and miscellaneous items, including the exploration, sampling, testwork and analysis, and studies programs associated with setting up and operating a nodule collection program in the CCZ, were estimated by TMC from its experience with exploring in NORI Area D and first principles (see Section 17). |
| amcconsultants.com | 276 |
| Technical Report Summary of Prefeasibility Study of NORI Area D, Clarion Clipperton Zone | |
| TMC the metals company Inc. | 0225054 |
OPEX was developed by TMC from a variety of sources, in conjunction with Allseas (off-shore) and PAMCO (nodule processing). OPEX unit costs are forecast to decline due to the economies of scale of that increased nodule production. The forecast annual OPEX to initiate production at NORI Area D with one collector (1.5 Mwmtpa capacity) and to expand production to two collectors and four production vessel to achieve 12 Mwmtpa are summarized at a high level in Section 18.6.
CAPEX was developed by TMC, in conjunction with Allseas (offshore). CAPEX estimates are based on the following requirements to reach 3.0 Mwmtpa to extract the Mineral Reserve:
| · | Offshore CAPEX: |
| ― | 1 x PV and VTS |
| ― | 2 x collectors |
| ― | 1 x TV |
| ― | Bulk carriers not included as a capital recovery charge will be included in contracts |
| ― | 3 x support vessels |
| · | Onshore CAPEX: |
| ― | 2 x 6 Mwmt nodule equivalent US Refining Facility |
| · | Onshore CAPEX: |
| ― | Processing not included as a capital recovery charge will be included in contracts |
| ― | Operations support facilities in Brisbane (Australia) and Delft (Netherlands) |
| ― | Professional services |
| · | Contingency |
Initial CAPEX estimates provided by TMC to initiate production at NORI Area D and sustaining CAPEX are summarized in Section 18.5.
| 12.3 | Mine planning method |
The specific point of reference selected by the QP for the Mineral Reserve estimation process for stating Mineral Reserves is as delivered (wet) to the onshore processing plant, considered equivalent by the QP to a run-of-mine ore pad in front of the primary crusher for a typical terrestrial mine.
| 12.3.1 | Resource model used for conversion to Mineral Reserves |
The resource model described in Section 11 was used as the basis for converting the Mineral Resource to a Mineral Reserve. Mineral Resources are reported inclusive of Mineral Reserves.
Excised from the Mineral Resource for the Mine Plan were approximately 37 Mwmt (10%) from the following areas considered at this stage of the project to be environmentally sensitive:
| · | A preservation reference zone of 20 km x 20 km (plus 1,000 m buffer zones) in the north-east of the NORI Area D licence area. | |
| · | The Test Mining area (plus 1,000 m buffer zones) in the central west of NORI Area D. | |
| · | A buffer zone around the proposed NORI Area D Exploitation Contract Area boundary of 1,000 m, equating to approximately 758 km2. | |
| · | Seafloor moorings without additional buffers. | |
| · | Volcanic seamounts plus 1,000 m buffer zones. |
In addition, approximately 34 Mwmt (9%) of areas with seafloor slopes between 4° and 6° are not being considered for the Mine Plan and Mineral Reserve and were excised. The Mineral Resource already excluded areas of slope >6°.
| amcconsultants.com | 277 |
| Technical Report Summary of Prefeasibility Study of NORI Area D, Clarion Clipperton Zone | |
| TMC the metals company Inc. | 0225054 |
| 12.3.2 | Consideration of losses during mining |
There are small areas within NORI Area D that are below the 4 kg/m2 nodule minimum abundance cut-off used to define Mineral Resources. In addition, there are minor areas of Inferred Mineral Resources (approximately 3% of Mineral Resources). Both these areas were included in mining blocks to create viable mining blocks and are considered as the equivalent of dilution by the QP.
The consideration of losses that may occur when the material is mined (equivalent to ore loss and waste dilution for a typical terrestrial mine) was limited to assessment of the nodules that will not be able to be collected from the seafloor as described under Modifying Factors.
Anticipated material losses are outlined below:
| · | Nodules within the Initial Mining Area contained in seamounts and environmental zones and their buffers, and the buffer around the mining lease. | |
| · | Nodules on slopes above 4°. | |
| · | Nodules in the gaps between collection paths. | |
| · | Nodules lost in and around Geo-obstacles. | |
| · | Nodules not picked up by the Coandă nozzles of the Collector. | |
| · | Nodule losses within the Collector, VTS, dewatering system, and offshore transfer, transport and offloading. |
| 12.3.3 | Defining economic limits of extraction |
The two-dimensional nature of nodule distribution without any requirement to move waste material and the consistency of grades across the deposit means that all areas of nodule abundance above 4 wet kg/m2 were considered to be within the economic limits of extraction.
Three areas within the NORI Area D were considered within which to estimate Mineral Reserves:
| · | The full area of NORI Area D, for which TMC proposes to apply for a Commercial Recovery Permit or Exploitation Contract. | |
| · | A subset of the proposed NORI Area D defined as the Initial Mining Area (Project Zero), in which operations over the initial years will be conducted. The Project Zero Mining Area is shown in Figure 12.7 | |
| · | A subset of the Project Zero Mining Area defined as the runs 19 and 20 in which detailed bathymetry surveys and monitoring have been undertaken and where collection activities will commence and be conducted over the first 18 months. |
The starting area of runs 19 and 20 within the Initial Mining Area are shown in Figure 12.7 as a red outline stretching from north to south across the Initial Mining Area. This is the area with the most detailed bathymetric data and detailed assessments, and upon which the Modifying Factors were developed.
| amcconsultants.com | 278 |
| Technical Report Summary of Prefeasibility Study of NORI Area D, Clarion Clipperton Zone | |
| TMC the metals company Inc. | 0225054 |
The QP for the Mineral Reserve estimation process considers that there are reasonable grounds to extend the Modifying Factors informed from run 19 to the full extent of the Initial Mining Area due to the commonality of geoforms and geo-habitats.
| amcconsultants.com | 279 |
| Technical Report Summary of Prefeasibility Study of NORI Area D, Clarion Clipperton Zone | |
| TMC the metals company Inc. | 0225054 |
| Figure 12.7 | Initial Mining Area within the proposed NORI Area D |
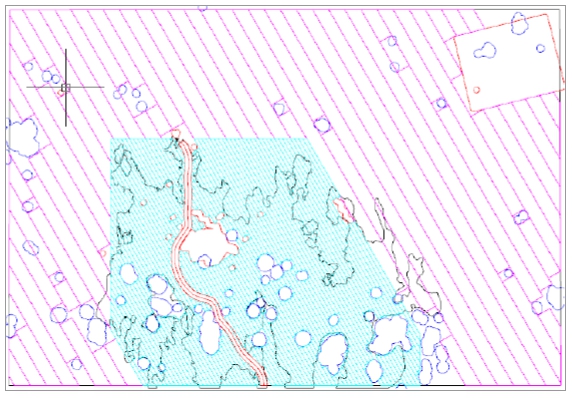
Source: AMC.
Notes: Cyan = mining runs in Initial Mining Area; black = primary characterized geohabitat; red = runs 19 and 20; magenta = mining runs in remainder of NORI Area D; red rectangle in northeast corner = preservation reference zone; blue = volcanic cones.
| amcconsultants.com | 280 |
| Technical Report Summary of Prefeasibility Study of NORI Area D, Clarion Clipperton Zone | |
| TMC the metals company Inc. | 0225054 |
| 12.3.4 | Initial Mining Area (Project Zero) development strategy |
The Initial Mining Area for the initial years of collection operations, shown in Figure 12.7, was selected by TMC because it is:
| · | Representative of the primary geoform and habitat types studied during the environmental baseline and Test Mining offshore campaigns. |
| · | In reasonable proximity to the Test Mining area so that the learnings in environmental monitoring and assessment from the Test Mining were transferrable directly to the first area to be mined. |
| · | In an area with consistent nodule abundance and lower probability of Geo-obstacles. |
| · | In an area with high probability that seafloor slopes are generally less than 4°. |
TMC expects that continued collection of environmental data in areas adjacent to the Initial Mining Area operations, and environmental monitoring experience in the first 18 months of operation will demonstrate that operations can extend outside the primary geoform and habitat types on which the selection of the Initial Mining Area was based. This will allow more efficient operations by including other geoform and habitat types to be included in mine plans in future years.
The requirement for practical collection operations to have as long a collector path as possible for the Initial Mining Area meant that collector paths extended a significant way across the Initial Mining Area and resulted in collector paths of varying lengths being developed. AMC developed a series of long collector paths across the Initial Mining Area, as shown in Figure 12.8, to show that long collection paths could be developed throughout the Initial Mining area.
| Figure 12.8 | Proposed Initial Mining area long collector paths |
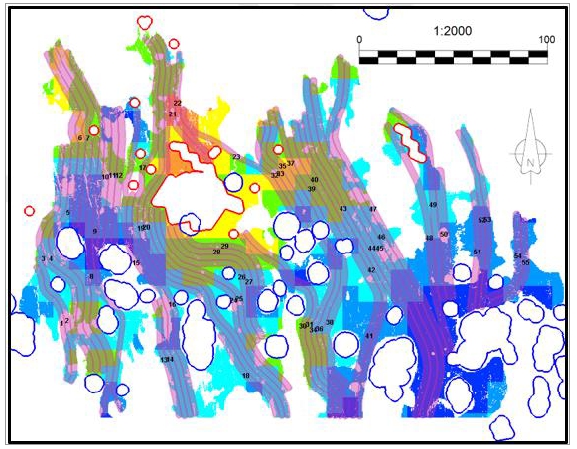
Source: AMC
| amcconsultants.com | 281 |
| Technical Report Summary of Prefeasibility Study of NORI Area D, Clarion Clipperton Zone | |
| TMC the metals company Inc. | 0225054 |
The long Collector paths resulted in significant areas of the Initial Mining Area not being covered by Collector paths, reducing the proportion of nodules in the area that could be recovered by collection. TMC and Allseas reviewed the Collector paths shown above for length, direction and seafloor conditions and selected the approximately 85 km long Collector paths numbered 19 and 20 as the Initial Mine runs (shown in Figure 12.8), representing approximately 18 months of production for initial operations. Detailed bathymetric surveys were then run over this area to provide the detailed information required for production planning. This survey resulted in identification of additional Geo-obstacles that were not detected in the initial broad scale bathymetric surveys and helped to inform Modifying Factors related to Geo-obstacles.
An assessment of numerous development sequences showed that the long length of paths resulted in an averaging effect on grades and abundance, so that no material economic advantage was gained from attempting to bring higher abundance or higher-grade areas forward. The mine development strategy was, therefore, based on the most practical and lowest cost mining sequence.
TMC expects that
operations experience from the longer Collector paths such as Runs 19 and 20 will demonstrate that shorter Collector paths are possible
and allow a more systematic collection approach over the Initial Mining Area to optimize nodule recovery. Following completion of Collector
paths 19 and 20, collection operations are scheduled to follow a more systematic development.
A systematic approach of defining mining blocks along a 330° orientation to maximize resource utilization was adopted, with the paths
shown in Figure 12.9 demonstrating that long collection paths are possible.
The full set of mining blocks selected for the mine plan for the Initial Mining Area is shown in Figure 12.9, colour coded by length. It is anticipated that some mining blocks will be amalgamated with adjacent blocks during short term planning to maintain the Collector field efficiency and enable production targets to be achieved.
The full NORI Area D annual production schedule is shown in Table 12.14 and graphed in Figure 12.10. Nodule grades are graphed in Figure 12.11.
The first seven years of the schedule reflect operations within the Initial Mining Area and hence the Mineral Reserve, although 1.2 Mt of the 10.5 Mt in Year 8 is also mined from the Initial Mining Area and was converted to Mineral Reserve.
| amcconsultants.com | 282 |
| Technical Report Summary of Prefeasibility Study of NORI Area D, Clarion Clipperton Zone | |
| TMC the metals company Inc. | 0225054 |
| Figure 12.9 | Proposed Initial Mining Area systematic collector paths |
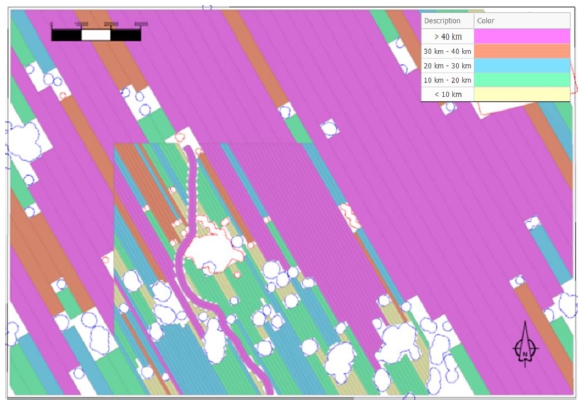
Source: AMC
| amcconsultants.com | 283 |
| Technical Report Summary of Prefeasibility Study of NORI Area D, Clarion Clipperton Zone | |
| TMC the metals company Inc. | 0225054 |
| Table 12.14 | NORI Area D production schedule |
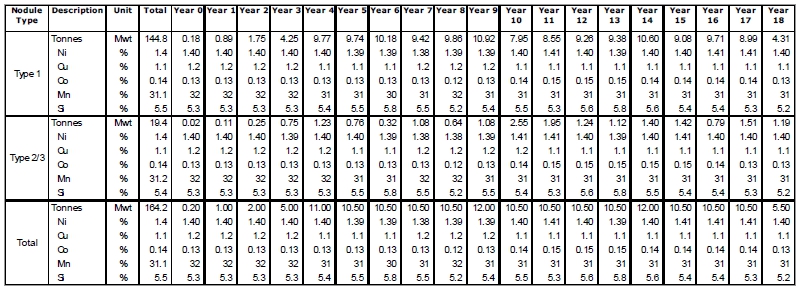
| amcconsultants.com | 284 |
| Technical Report Summary of Prefeasibility Study of NORI Area D, Clarion Clipperton Zone | |
| TMC the metals company Inc. | 0225054 |
The initial collection paths are quite long and the production plan allows ramp up in the initial years to develop operational efficiencies and familiarization compared to the nominal production capacities, so the result is that the
initial two years of production show only one to two collection paths used to achieve production levels. This will allow time for operational procedures and strategies to be refined by operations experience.
As the production level ramps up and collection paths become smaller, the number of collection paths required to achieve annual production targets increases significantly. With two collectors running from Year 3 onwards, this is considered manageable, although detailed short-term planning will need to be undertaken to ensure congestion and umbilical management does not become an issue.
Collector paths mined by year are shown in Figure 12.12.
| Figure 12.10 | NORI Area D nodule tonnage (wet) production graph |
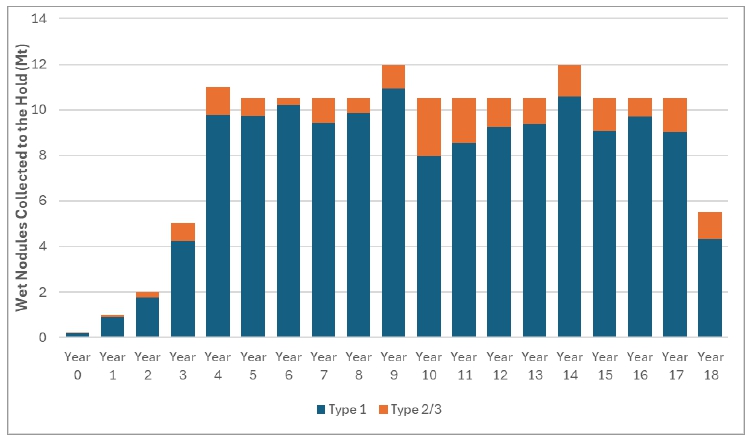
Source: AMC
| amcconsultants.com | 285 |
| Technical Report Summary of Prefeasibility Study of NORI Area D, Clarion Clipperton Zone | |
| TMC the metals company Inc. | 0225054 |
| Figure 12.11 | NORI Area D nodule grade |
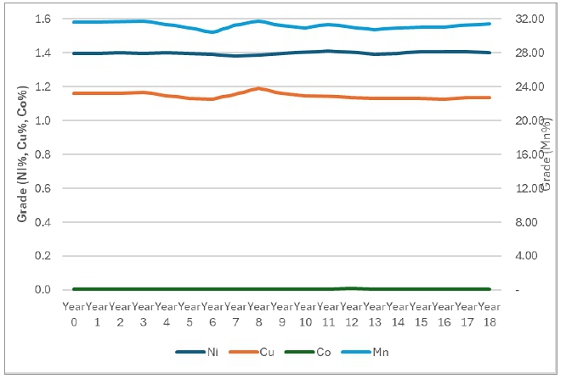
Source: AMC
| Figure 12.12 | Collector paths mined by year |
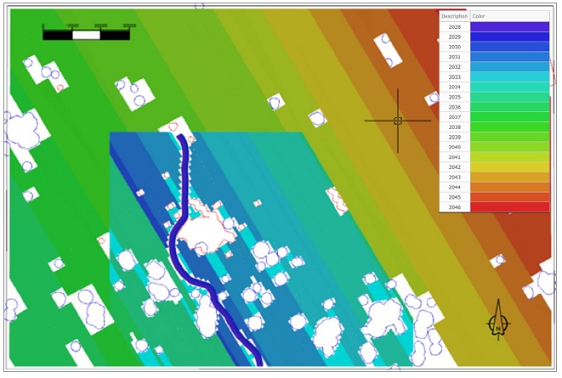
Source: AMC
| amcconsultants.com | 286 |
| Technical Report Summary of Prefeasibility Study of NORI Area D, Clarion Clipperton Zone | |
| TMC the metals company Inc. | 0225054 |
| 12.4 | Mineral Reserve estimate |
The NORI Area D Mineral Reserve is defined in the selected Initial Mining Area (Project Zero), which has similar geo-forms as that encountered in Test Mining. Unmined buffers of 1,000 m were left around the lease boundary and environmentally sensitive zones. The underlying Mine Plan was developed in conjunction with an experienced marine contractor, Allseas, and TMC to reflect the characteristics of the proposed nodule collection system.
The NORI Area D Mineral Reserve at 30 June 2025, under the guidelines of SEC Regulation S-K (subpart 1300) (S-K 1300), is stated in Table 12.15.
| Table 12.15 | NORI Area D Mineral Reserve at 30 June 2025 |
| Classification | Tonnes (Mwmt) |
Co (%) |
Cu (%) |
Mn (%) |
Ni (%) |
| Proven | - | - | - | - | - |
| Probable | 51 | 0.13 | 1.1 | 31 | 1.4 |
| Total | 51 | 0.13 | 1.1 | 31 | 1.4 |
Notes:
| · | Mineral Reserve estimated in Initial Mining Area only with 1,000 m buffers for the lease and seamounts. | |
| · | Measured and Indicated Mineral Resources are converted to probable Mineral Reserves. | |
| · | Grades are quoted on a dry basis. | |
| · | Zero abundance cut-off used, with nodules <4 kg/m2 used to define the Mineral Resource included as dilution to generate viable mining blocks. | |
| · | Moisture content assumed to be 28% (mass of solid/(mass of solid + mass of water). | |
| · | Metal prices US$20,295/t Ni, US$21,633/t Ni sulfate, US$11,440/t Cu, US$56,117/t Co, US$55,198/t Co sulfate, US$5.46/dmtu Mn in manganese-silicate. | |
| · | Nodule recovery by the Collector is estimated as 77% for Type 1 and 62% for Type 2 and 3 nodules. | |
| · | Metallurgical recovery to sulfate is estimated as 94.6% Ni, 77.2% Co and 86.2% Cu, and to matte is 94.8% Ni, 77.5% Co, 86.4% Cu and for 98.9% for Mn. | |
| · | Rounding estimates to two significant figures may result in computational discrepancies. |
The Initial Mining Area contains approximately 25% of the NORI Area D Mineral Resource and conversion of Mineral Resources to Mineral Reserves is approximately 57%.
The QPs responsible for the Mineral Reserve are set out in Table 2.1. The Mineral Reserves are classified by the QPs as Probable Mineral Reserve, due to:
| · | There is a lack of operating experience with the nodule collection system proposed for NORI Area D to confirm production rates, nodule recovery assumptions, field efficiencies, and operating and capital cost parameters to support Proved Mineral Reserves. |
| · | There is a lack of other commercial nodule operations to confirm the reasonableness of mine planning parameters, Modifying Factors and Mine Plan outcomes to support Proved Mineral Reserves. |
| · | Commercial recovery permit terms and conditions have not been issued by NOAA on how management of nodule collection operations will be regulated and with which the Mine Plan needs to comply to support Proved Mineral Reserves. |
| 12.4.1 | Mineral Reserve classification |
The QP for the Mineral Reserve estimation process does not consider that the material Modifying Factors are known to the same level of certainty as the underlying Mineral Resource. Therefore, all Measured Mineral Resources in the Initial Mining Area were converted to Probable Mineral Reserves (approximately 0.8 Mwmt). No Proven Mineral Reserves are reported for NORI Area D.
| amcconsultants.com | 287 |
| Technical Report Summary of Prefeasibility Study of NORI Area D, Clarion Clipperton Zone | |
| TMC the metals company Inc. | 0225054 |
| 12.5 | Cut-off values to define ore |
Calculations to determine the minimum grade of material that generates an acceptable profit for NORI Area D indicate that a cut-off of 4 kg/m2 abundance is appropriate for definition of the Mineral Resources (Section 11.8).
In determining the cut-off grade for mining and Mineral Reserves, AMC also considered the practical operation of the collector system. AMC considers it likely that the quickest (and lowest cost) way of moving between areas of higher abundance is to traverse lower abundance areas with the collector, rather than withdrawing the Collector from the seafloor and travelling to a higher abundance area. AMC considers that it will be more profitable to continue collecting nodules during the traverse of the low abundance area. Therefore, AMC used a zero cut-off (0 kg/m2 abundance) in the mine plan, so that all nodules classified as Measured or Indicated Mineral Resource are considered for the potential to contribute to the Mine Plan and Mineral Reserve.
| 12.6 | Economic assessment |
TMC has undertaken economic evaluation of the Mineral Reserve, detailed in Section 19, to demonstrate that extraction of the Mineral Reserve using reasonable financial parameters is economic (payback within seven years and Mineral Reserve life of just over seven years).
TMC proposes to mine nodules from the whole of NORI Area D and economic assessment of the mine plan shows that extraction of the nodules in the mine plan is economic.
| 12.7 | Qualified Persons conclusion on risk factors |
The QP for Mineral Reserves considers that the material risks to the Mineral Reserve arise from the following key risk factors.
There are no deep-sea nodule mining and processing projects currently approved for Commercial Recovery, so that the requirements for regulatory approval are uncertain and approval conditions under which operations may proceed are unknown.
As there are no deep-sea nodule mining and processing projects currently in operation, the technology required for nodule collection is still in development and the design of the collector proposed for NORI Area D has not been finalized. As a result, the production-scale collector proposed for NORI Area D has not been subjected to actual operating conditions in a production environment. Therefore, its effectiveness, robustness, and reliability in operating in the range of seafloor domains (which vary in substrate conditions and seafloor slope) that are expected in NORI Area D has not been determined and physical records for productivity, nodule recovery, collector speed, and availability are not available. However, the system has been field tested using a 40% width (6 m) prototype.
There are no deep-sea nodule mining and processing projects currently in operation from which mine planning and operating assumptions can be drawn or comparisons made to validate key assumptions on production rates, collector productivity, nodule modifying factors, nodule recovery, off-shore CAPEX to set up the operation, or off-shore OPEX to mine and to support the operation.
There is little to no publicly available information on other deep sea nodule mining and processing projects currently in evaluation to compare key assumptions on production rates, collector productivity, nodule modifying factors, nodule recovery, off-shore CAPEX to set up the operation, or off-shore OPEX to mine and to support the operation.
The mine plan is based on the interpretation of seafloor topography and domains predominantly identified from widely spaced readings from hull-based multibeam surveys. These surveys are of insufficient resolution to accurately identify all of the seafloor domains and fine-scale Geo-obstacles in an area. More closely spaced seafloor topography data will be required before detailed planning for collector operations can commence outside the Initial Mining Area. More detailed seafloor data is likely to refine the identification of areas of higher slope and Geo-obstacles, resulting in changes to the Mine Plan and Mineral Reserve.
| amcconsultants.com | 288 |
| Technical Report Summary of Prefeasibility Study of NORI Area D, Clarion Clipperton Zone | |
| TMC the metals company Inc. | 0225054 |
As there are no deep sea nodule mining and processing projects currently in operation, the ability of QP’s to meet the requirements of a QP, as defined in Regulation S-K 1300, of “A mineral industry professional with at least five years of relevant experience in the type of mineralization and type of deposit under consideration and in the specific type of activity that person is undertaking on behalf of the registrant” is limited. Whilst this sector is in its infancy and therefore 5 years of experience of deep-sea nodule mining is not possible, the QP for the Mineral Reserve estimation process has extensive expertise in terrestrial mine planning which supports the QPs ability to undertake this work.
The price of the products proposed from processing NORI Area D nodules has varied significantly over the last five years, and there is significant uncertainty with respect to forecast metal supply and demand forecasts and therefore associated product prices, which has the potential to significantly affect project economics.
The proportion of nodules within the Mineral Resource that are picked up by the collector (such as from nodule recovery, Geo-obstacle loss, gap between collector runs, and seafloor slope domains) may be different from what has been assumed (see Modifying Factors), resulting in a direct change in Mineral Reserve tonnage and life of the project. For example, the collector may be able to operate on steeper slopes (up to 6°) and increase the area that it can operate in and therefore nodules it can collect.
Sedimentation and seafloor current characteristics may result in a change in buffer zones around the mining area, seamounts, and sensitive environmental zones, resulting in a change in Mineral Reserve tonnage and life of the project.
Production from the operation may be different to what has been assumed, resulting in a change in nodules available for processing (affecting revenue) and OPEX (due to the large proportion of fixed costs) and may result in changing project economics, because:
| · | Collector may be more or less productive than assumed. Lower nodule production may result in reduced revenue and uneconomic operations. Higher production may not be transported through the VTS and PV collection systems. | |
| · | Production through the VTS, nodule separator on the PV or in transferring nodules to the TV may not keep up with the collector. | |
| · | Operating hours may be more or less than assumed because of diverse reasons, such as weather or sea conditions, protest actions, mechanical availability, or lease conditions. | |
| · | OPEX may be different to what has been assumed. Higher OPEX may result in higher breakeven cut-off abundance or uneconomic operations. Lower OPEX will not increase the Mineral Reserve but will increase operating margin. | |
| · | CAPEX or sustaining CAPEX may be different to what has been assumed and may result in the project being uneconomic if higher and increased margins if lower. | |
| · | A furnace rebuild is required ahead of commencement of production at PAMCO. Current schedule for completion of the this rebuild is for Q3 2028. PAMCO are currently evaluating opportunities to accelerate the completion of this rebuild which involves the installation of copper coolers into the furnac e. |
| amcconsultants.com | 289 |
| Technical Report Summary of Prefeasibility Study of NORI Area D, Clarion Clipperton Zone | |
| TMC the metals company Inc. | 0225054 |
The key opportunities to be able to increase the Mineral Reserve identified by the QP for the Mineral Reserve estimation process are:
| · | Nodule recovery from collector recovery, geo-obstacle loss, gap between collector runs, and seafloor slope domains may be lower than estimated resulting in more nodules being collected from the same area. | |
| · | Successful operations and further assessment of the seafloor outside the Initial Mining Area may confirm that modifying factors can be extended outside the Initial Mining Area to the remainder of the NORI Area D lease, leading to a significant increase in Mineral Reserves. | |
| · | Development of the adjoining lease (TOML-F) may open up additional area for nodule collection within the 1,000 m lease buffer. |
| amcconsultants.com | 290 |
| Technical Report Summary of Prefeasibility Study of NORI Area D, Clarion Clipperton Zone | |
| TMC the metals company Inc. | 0225054 |
| 13 | Mining methods |
| 13.1 | Overview |
The mining method
proposed for NORI Area D is to use a remotely controlled collector on the seabed to collect nodules, which are then transported to the
surface using the Vertical transport system (VTS) and stored in the hold of the Production Vessel (PV) before offloading to a Transfer
vessel (TV)
(Figure 13.1).
| Figure 13.1 | Illustration of proposed PV (Hidden Gem) with a collector and TV alongside |
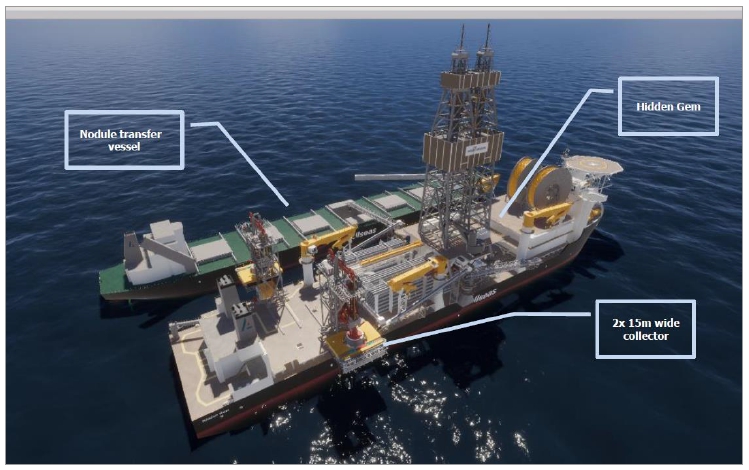
Source: Allseas
| 13.2 | Production Vessel (PV) |
The vessel Hidden Gem (Figure 13.2) will serve as the operational base for the deployment, recovery and operations of the collector(s) and nodule collection by means of:
| · | LARS, (detailed description available in section 13.2.2). | |
| · | VTS (detailed description available in section 13.2.4). | |
| · | Dewatering plant to separate the nodules from seawater. | |
| · | Temporary storage and offloading of the collected nodules to a nodule transfer vessel (detailed description available in section 13.2.7). |
Equipped with dynamic positioning (DP-3), the Hidden Gem will be able to hold position and follow the collector(s) as it moves along the seabed.
| amcconsultants.com | 291 |
| Technical Report Summary of Prefeasibility Study of NORI Area D, Clarion Clipperton Zone | |
| TMC the metals company Inc. | 0225054 |
| Figure 13.2 | Drone picture of Hidden Gem, September 2022 |
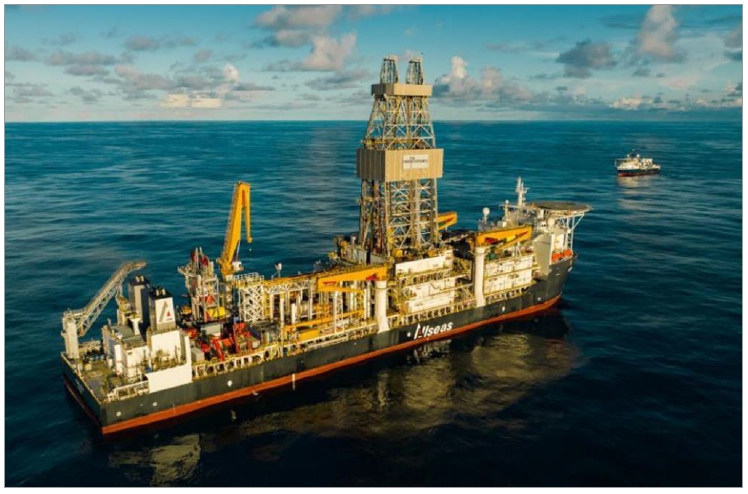
Source: Allseas
The Hidden Gem will be capable of supporting deep sea nodule collection activities including launch and recovery of all subsea production equipment (i.e., the collectors, riser system, ROVs) in wave heights up to 3.5 m Hs (significant wave height).
Vessel specifications:
| · | Ship Identification Number: IMO 944515021 | |
| · | Length = 228 m | |
| · | Beam = 42 m | |
| · | Moonpool dimensions = 25 m x 12 m | |
| · | Operating draft = 12 m | |
| · | Transit draft = 8.5 m | |
| · | Gross tonnage = 60.331 t | |
| · | Max personnel on board = 140 | |
| · | Installed electric power = 42,000 kW | |
| · | Power distribution = 11 kV / 440 V | |
| · | Propulsion (diesel electric) = 6x Azimuth thruster 4500 kW | |
| · | DP system = DP-3 | |
| · | Maximum speed = 12.3 knots. | |
| · | Cranes = 4x 85 t Knuckle boom |
21 The unique seven-digit vessel number, preceded by the letters IMO (International Maritime Organization) stays with the vessel until it is scrapped. The number never changes, regardless of the ship’s owner, country of registration or name.
| amcconsultants.com | 292 |
| Technical Report Summary of Prefeasibility Study of NORI Area D, Clarion Clipperton Zone | |
| TMC the metals company Inc. | 0225054 |
| 13.2.1 | Collector System |
The collector (Figure 13.3) will be designed to collect nodules from the seafloor, separate the nodules from seabed sediment and transfer a water / nodule slurry mixture to the VTS.
The collector has six core functions:
| · | Nodule pick-up. | |
| · | Nodule-seabed sediment separation (separation of nodules from sediment at seafloor). | |
| · | Nodule transfer to VTS. | |
| · | Propulsion and navigation of vehicle along the seabed. | |
| · | Heading and position control of vehicle during descent/ascent through the water column. | |
| · | Environmental monitoring. |
| Figure 13.3 | Illustration of the proposed 15 m wide collector on seabed |
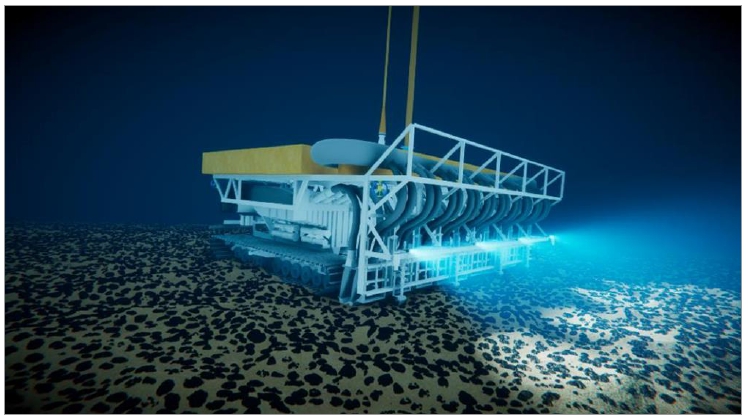
Source: Allseas
The collector system will have the following approximate dimensions and weight:
| · | 15.5 m overall width (15.0 m collection width) | |
| · | 13.5 m length | |
| · | 6 m height | |
| · | 200 – 240 mt (in air) | |
| · | 36-46 mt (submerged) |
It will be outfitted with systems for propulsion, nodule pickup, nodule-water-sediment separation, and sensor/sonar technologies to monitor system performance, telemetry, positioning, and environmental impact. These components are described in the sections below. The collector system is launched from the PV via a dedicated LARS. This part of the system is described in 13.2.2.
| amcconsultants.com | 293 |
| Technical Report Summary of Prefeasibility Study of NORI Area D, Clarion Clipperton Zone | |
| TMC the metals company Inc. | 0225054 |
| 13.2.1.1 | Collector propulsion system |
The collector will be equipped with two propulsion systems: a track drive system (Figure 13.4) for movement across the seabed and a thruster system for positioning and heading control during descent/ascent through the water column.
| Figure 13.4 | Illustration of collector track system |
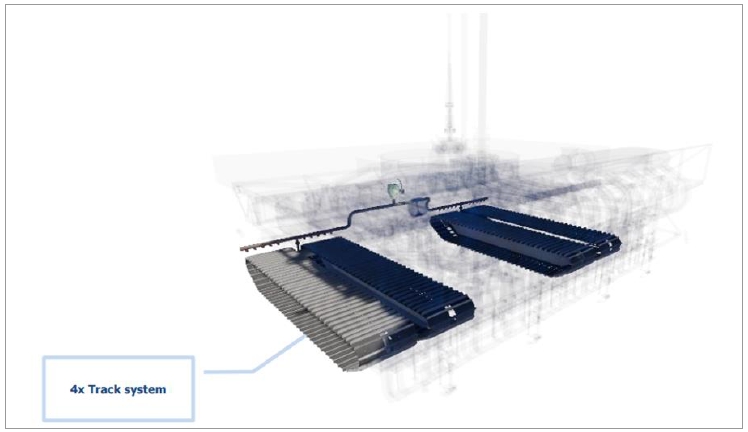
Source: Allseas
The track drive system will consist of two double-tracked assemblies, each with a total track width of approximately 4.5 meters and a length of around 11 meters. The tracks will be made of rubber bands, fitted with metal grousers that penetrate roughly 10 centimeters into the seabed surface to provide traction. Each track assembly will be mounted to the collector frame by a hinged support mechanism, allowing it to articulate and conform to variations in seabed topography. Steering will be controlled by adjusting the relative speed setpoints of the individual track units. The track drive will be propelled via an electromotor that will be powered via the umbilical. Additionally, a track cleaning system will be implemented to prevent clogging of the grousers.
To facilitate positioning and heading control during deployment and recovery, four thrusters will be installed on the collector (Figure 13.5).
| amcconsultants.com | 294 |
| Technical Report Summary of Prefeasibility Study of NORI Area D, Clarion Clipperton Zone | |
| TMC the metals company Inc. | 0225054 |
| Figure 13.5 | Illustration of collector thrust system |
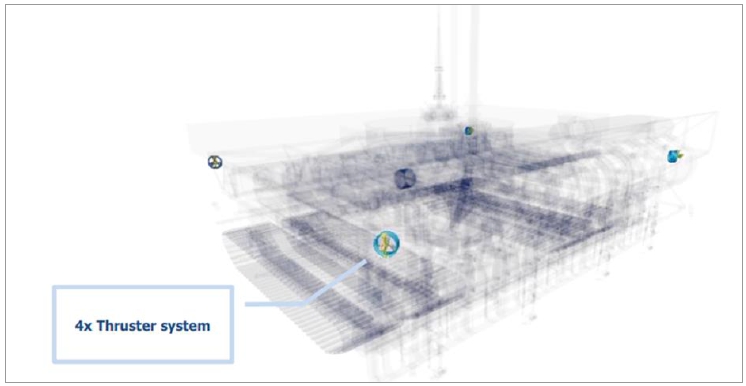
Source: Allseas
These thrusters will be strategically mounted to enable both rotational and linear movements of the collector. Additionally, when the collector is driving over the seabed, the thrusters can assist the track system by providing vector thrust. The thrusters are the same make/size as used on the collector used during the Test Mining.
| 13.2.1.2 | Nodule pick-up and internal separation system |
The nodule pick-up system (Figure 13.6) uses water jets to collect nodules from the seabed. These jets flow over a curved plate, creating a low-pressure zone beneath the nozzles—an effect known as the Coandă principle. This mechanism enables the gentle lifting of nodules with minimal erosion and limited disturbance to the surrounding seabed sediment. As such minimizing the intake of sediment.
The resulting nodule-laden slurry is drawn upward through a duct into a hopper, where the flow velocity decreases due to a sudden expansion in cross-sectional area. As the flow slows, the heavier particles (nodules) settle at the bottom of the hopper, while lighter particles (sediment) remain suspended and follow the main flow path toward the diffuser. Washing off the sediment during decanting is further enhanced by introducing clean water from the bottom of the hopper acting as a counter current.
In the diffuser, the slurry flow velocity is further reduced by expanding the flow area. The diffuser is specifically shaped to minimize turbulence and prevent flow separation from the walls during expansion. The objective is to discharge a laminar, density-driven flow that settles gently onto the seabed under the influence of gravity, immediately downstream of the diffuser. These diffuser design principles are consistent with those implemented and validated during the Test Mining.
Nodules that settle at the bottom of the hopper are remobilized through fluidization, using a vortex system located at the inlet of the pipe leading to the jumper hose, which forms part of the VTS. This vortex fluidizer and buffer, with a capacity of approximately 15 m³, serves to maintain a steady and consistent supply of nodules at a controlled slurry density to the VTS. It compensates for fluctuations in nodule pickup caused by local variations in nodule abundance on the seabed.
| amcconsultants.com | 295 |
| Technical Report Summary of Prefeasibility Study of NORI Area D, Clarion Clipperton Zone | |
| TMC the metals company Inc. | 0225054 |
| Figure 13.6 | Illustration of General Arrangement – nodule pick-up and internal separation system |
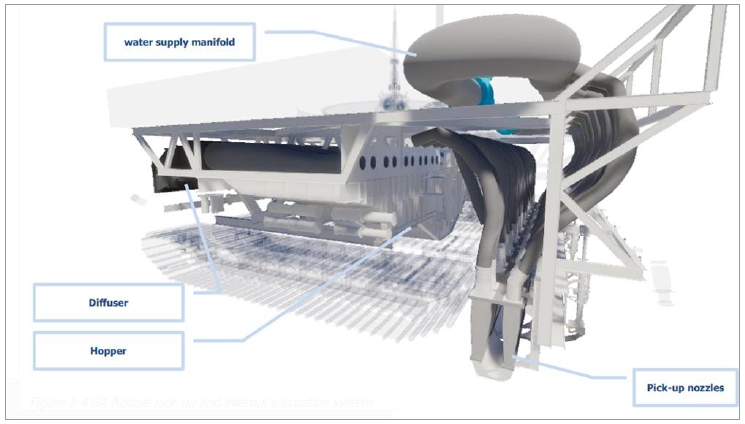
Source: Allseas
The Coandă nozzle standoff distance and flow velocities can be adjusted to optimize the nodule pickup and minimize the sediment collection/transportation to the PV. Altimeters and mechanical sleds will be used as inputs for the height adjustment system of the nozzles. These sensors will assess the seabed profile in front of the collector and the control system of the collector will process this data and reposition the individual nozzles as such that the nominal stand-of distance is reached. The nominal stand of distance is determined by analysis of the Test Mining results and multiple experimental tests carried out in a laboratory. The nozzle height adjustment sensor lay out is shown in Figure 13.7.
| amcconsultants.com | 296 |
| Technical Report Summary of Prefeasibility Study of NORI Area D, Clarion Clipperton Zone | |
| TMC the metals company Inc. | 0225054 |
| Figure 13.7 | Illustration of General Arrangement – nozzle height adjustment sensor layout |
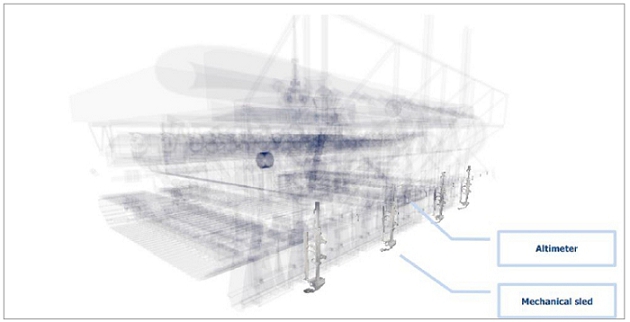
Source: Allseas
It is expected that when operating the pick-up nozzle at the nominal stand-off distance, an average of 3 cm seabed erosion will occur. This is a similar result as encountered during Test Mining.
A schematic overview of this system is provided in Figure 13.8.
| Figure 13.8 | Flow mixture overview – nodule pick-up system |
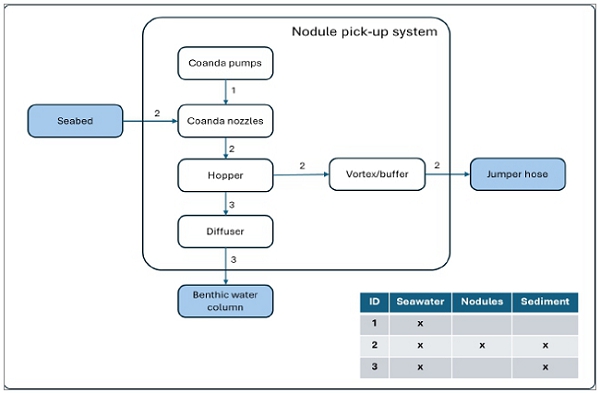
Source: Allseas
| amcconsultants.com | 297 |
| Technical Report Summary of Prefeasibility Study of NORI Area D, Clarion Clipperton Zone | |
| TMC the metals company Inc. | 0225054 |
| 13.2.1.3 | Power, control and monitoring system |
Power and communication interface between the collector and PV is provided via an umbilical cable. This umbilical contains high voltage conductors to provide power to electromotors of the tracks, Hydraulic Power Unit (HPU) and coandă water pumps motor. Additionally, low voltage power is available for the control system, sonars and secondary power consumers. Multiple fiber optic strings are included to enable a redundant communication string between the PV and the collector.
The collector will be remotely operated from the operations room of the PV. The heading, speed and pick-up system settings can be controlled manually or via an overall control system.
This overall control system (as a minimum) will be able to:
| · | Enable the collector system(s) to follow a predetermined path. | |
| · | Enable the collector system(s) to follow previous track lines at 1.0 m (+/- 0.5 m). | |
| · | Detect obstacles in the path of the collector(s). | |
| · | Monitor the production of the collector(s). |
The collector will be equipped with sensors to monitor:
| · | Telemetry. | |
| · | Water pressure. | |
| · | Internal water volume flow. | |
| · | Internal nodule concentration. | |
| · | External turbidity of the seawater. | |
| · | Buffer filling levels. | |
| · | Pump output and performance. | |
| · | Track and thruster speed. | |
| · | Linear actuation positioning. | |
| · | HPU performance. | |
| · | Coandă nozzle standoff distance. |
Additionally, an acoustic positioning system will be used to determine the relative position between the PV and the collector. Furthermore, optical aids (cameras) will be installed.
| 13.2.2 | Launch and Recovery System |
Deployment of the collector will be carried out via a dedicated LARS (Figure 13.9) installed on the aft deck of the PV. This system will be capable to deploy and recover the collector in wave heights up to 3.5 m.
The LARS system has four main functions:
| · | Deployment/recovery of the collector trough splash zone & towards seabed. | |
| · | Controlled landing/lift to/from seabed. | |
| · | Housing and management of the (lift)umbilical. | |
| · | Decoupling PV motions from the collector during lifting and lowering. |
| amcconsultants.com | 298 |
| Technical Report Summary of Prefeasibility Study of NORI Area D, Clarion Clipperton Zone | |
| TMC the metals company Inc. | 0225054 |
| Figure 13.9 | Illustration of General Arrangement – LARS |
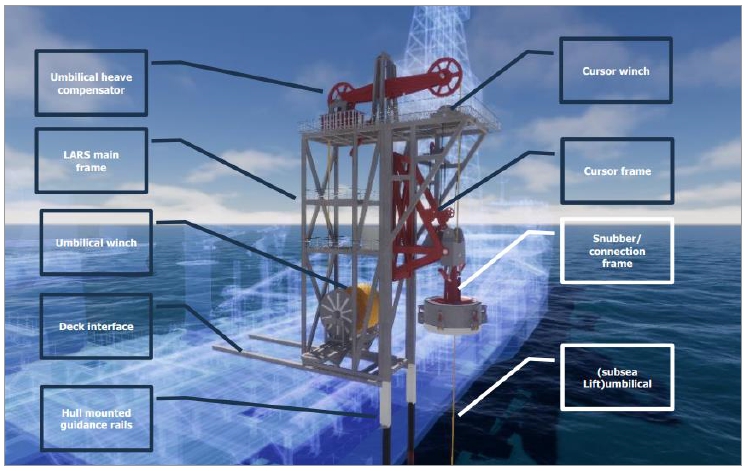
Source: Allseas
The LARS includes a tower structure that houses several key components: a snubber and cursor frame, an umbilical heave compensation system, a tower skidding mechanism, and both the umbilical and cursor winches.
The umbilical is designed to support only the submerged weight of the collector. To lift the collector above the water surface, the cursor winch system is used. The entire tower can be skidded between inboard and outboard positions.
When positioned outboard—aligned with the hull-mounted guidance rails—the cursor frame can be lowered along the side of the PV. This enables the collector to be safely deployed through the splash zone, minimizing dynamic loads during launch and recovery. The collector can be (dis)connected from/to the snubber when the cursor frame is at the level of the keel of the PV. When positioned at the inboard position the collector can be lowered onto a dedicated support frame onboard the PV.
| 13.2.3 | Vertical Transport System (VTS) – Overview |
The VTS will have the function of transporting a nodule/water slurry mixture from the collector on the seabed, to the PV. The riser consists of four major parts:
| · | The jumper hose, a flexible hose that is connected to the collector. | |
| · | The riser base, a structural unit that connects the jumper hose to the riser bundle. | |
| · | The riser bundle consisting of 2/3 lines (depending on position of riser section). | |
| · | The riser head, the interface between the riser and the dewatering system onboard the PV. |
| amcconsultants.com | 299 |
| Technical Report Summary of Prefeasibility Study of NORI Area D, Clarion Clipperton Zone | |
| TMC the metals company Inc. | 0225054 |
The main propulsion system of the Vertical Transport System (VTS) is based on the airlift principle. In this method, compressed air is injected into the main riser pipe. This reduces the density of the slurry within the pipe by introducing air bubbles, creating a pressure differential between the ambient hydrostatic pressure of the surrounding seawater and the internal pressure of the slurry-air mixture.
As a result, the lighter, aerated slurry experiences buoyant lift, causing it to move upward through the riser. This passive lifting mechanism is well-suited for transporting nodules from deep-sea environments to the surface.
The compressed air is injected into the main flowline at +/- 1,500 m water depth, therefore the content of the slurry that is flowing through the riser can be divided into two different mixtures:
| · | 2-phase mixture – containing nodules/seabed sediment and seawater. | |
| · | 3-phase mixture – containing nodules/seabed sediment, seawater and (compressed) air above the air injection point. |
The density of the 2-phase mixture is mainly determined by the nodule pick-up rate of the collector and the volume flow in the riser. The density of the 3-phase mixture is also impacted by the volume of injected air.
As the hydrostatic pressure decreases when the slurry mixture is being lifted, air inside the mixture will expand and therefore reduce the density of the slurry. This will result in an increased volume flow. To maintain a manageable flow velocity, the main flowline of the riser will increase in diameter from the air injection point at 1,500 m towards the surface. Figure 13.10 provides a schematic overview of the main components included in the airlift configuration.
| Figure 13.10 | Basic airlift configuration |

Source: (Shimizu Y, 2024)
| amcconsultants.com | 300 |
| Technical Report Summary of Prefeasibility Study of NORI Area D, Clarion Clipperton Zone | |
| TMC the metals company Inc. | 0225054 |
The VTS does not only contain the components required for airlift, but also components to create a slurry flow interface between the collector(s) and the PV. A return waterline is included. Figure 13.11 provides a basic flow diagram of an airlift system. Arrows between components are marked with numbers. These numbers correspondent with different flow mixtures.
| Figure 13.11 | Block diagram – VTS |
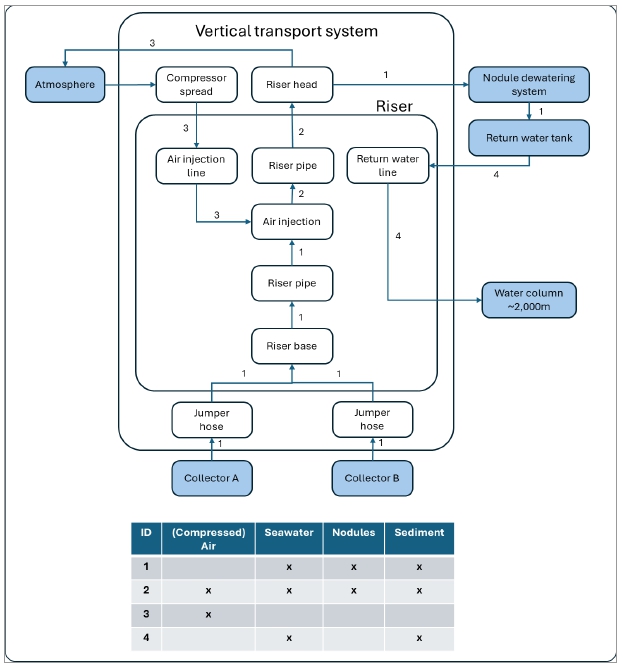
Source: Allseas
| 13.2.4 | Vertical transport system – functional description |
| 13.2.4.1 | Riser |
The riser is defined as the connection between the PV and the collector. This interface includes a transport line for nodules and seawater from the seabed to the PV, a transport line for compressed air to generate flow in the main line and a return water line.
Main riser pipe: The main riser pipe is the flowline that transports the slurry from the riser base to the riser head. The flow velocity is created by airlift. This riser will be designed for a maximum efficiency at a nodule flow of 100 kg/s and can be used for a production rate in a range of approximately 0 to 147 kg/s of wet nodules. The 2-phase section of the riser will consist of a 18” pipeline, the 3-phase section will be configured using multiple diameters between 18” and 32”, the configuration will be dependent on the required volume flow of the mixture.
| amcconsultants.com | 301 |
| Technical Report Summary of Prefeasibility Study of NORI Area D, Clarion Clipperton Zone | |
| TMC the metals company Inc. | 0225054 |
Air injection point: The air injection point will inject compressed air into the main riser pipe. This injection point will be located at 1,500 m water depth.
Air injection line: Compressed air will be transported from the compressor spread to the air injection point in the main flowline of the riser. The diameter of this airline is determined based on a wet nodule production of approximately 100 kg/s. An air injection diameter of 4” has been selected as the inner diameter of the air injection line.
Return water line: Return water will be returned at a water depth of approximately 2,000 m.
Riser base: The riser base is the interface between the riser pipe sections and the jumper hose(s). In later phases of the project, multiple collectors will be operating simultaneously. Therefore, the riser base shall be capable of connecting 2 jumper hoses. The riser base will also be equipped with a dump valve to ensure that a stop of volume flow in the riser will not create a clog in the riser/jumper hose.
Jumper hose(s): Both jumper hoses will have an inner diameter of approximately 280 mm and a length of approximately 700 m. The jumper hoses will be connected/disconnected to the riser base during deployment / recovery of the riser system. The other end of the jumper hose will have a subsea connection interface that will make it possible to connect/disconnect the collector(s) from the jumper hose without the need for recovery of the entire riser system.
The jumper hose(s) will be deployed with buoyancy/weight modules to accommodate a lazy S-shape when connected to the vehicle(s) which disconnects PV/riser base movements from the collector, reducing the reaction forces of the jumper hose on the collector(s).
| 13.2.4.2 | Riser head |
The riser head is the interface between the riser system and the PV for the nodule/water/air mixture. In the riser head air is separated from the slurry flow. The air is returned to the atmosphere, and the nodule/water mixture is transported to the nodule dewatering system. During start-up of the riser, a large volume of water is being lifted. This start-up water flow is directed towards the return water system. A by-pass to the contingency overflow tank is in place to divert nodule/water/sediment in case the capacity of the main processing system is exceeded to prevent spills.
| 13.2.4.3 | Contingency overflow tank |
The contingency overflow tank is designed to receive potential overflow of nodules, sediment, and water from the riser head the dewatering system becomes temporarily unable to accept feed. Once normal operation resumes, the collected slurry is introduced to the dewatering system inlet for routine separation. Sediment-laden return water is routed to the designated return water tank, while nodules are conveyed to the dedicated storage holds The contingency overflow tank will have a capacity of approximately 2,500 m3.
| 13.2.4.4 | Compressor spread |
The compressed air supply for the vertical transport system will be generated using a dedicated compressor spread onboard the PV. This spread will consist of multi-stage compressors with a maximum capacity of approximately 9.5 kg /s of air with a maximum working pressure in excess of 100 bar (at surface).
| amcconsultants.com | 302 |
| Technical Report Summary of Prefeasibility Study of NORI Area D, Clarion Clipperton Zone | |
| TMC the metals company Inc. | 0225054 |
| 13.2.5 | Riser/jumper handling equipment |
The riser system and jumper hose will be stored onboard and deployed/recovered from the PV. To facilitate these operations, a typical riser handling system similar to offshore drilling shall be in place. The riser is constructed from 90 ft (27.4 m) sections that are stored horizontally on the aft deck when not in use. In the field the sections are rotated vertically, connected to the riser string and subsequently lowered to the operational depth.
The riser handling system (Figure 13.12) can be divided in the following sub-systems:
| · | Riser storage area | |
| · | Riser handling cranes | |
| · | Riser catwalk | |
| · | Derrick | |
| · | Riser hang-off system | |
| · | Jumper reel |
| Figure 13.12 | General Arrangement – riser handling equipment |
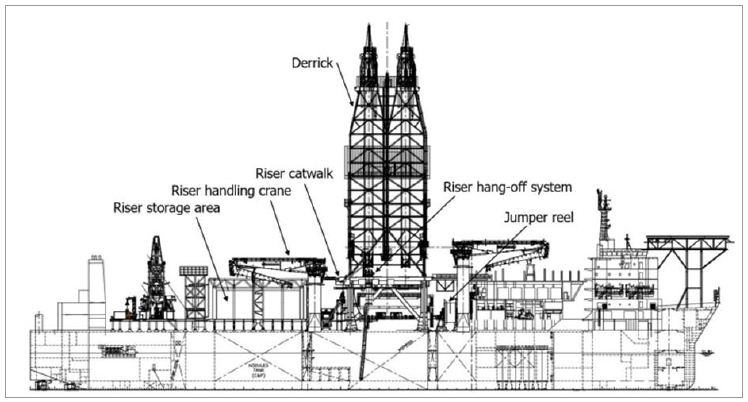
Source: Allseas
The riser handing system will be able to deploy and recover the riser/jumper hose system with a maximum significant wave height of approximately 3.5 meters.
| 13.2.6 | Nodule dewatering and storage system |
The PV will be equipped with a nodule dewatering system. This system will be able to separate the nodules from the seawater and direct the nodules to dedicated storage holds inside the hull of the PV. Water will be stored inside a buffer tank and returned to the water column via the VTS. The system will be capable of unloading the storage holds and transfer the nodules to a TV via conveyor on an unloading boom.
This system is designed for:
| · | Nodule loading capacity of approximately 650 t per hour (peak loading capacity). | |
| · | Nodule unloading capacity of approximately 2,500 t per hour. | |
| · | Nodule storage capacity of approximately 25,000 t. |
| amcconsultants.com | 303 |
| Technical Report Summary of Prefeasibility Study of NORI Area D, Clarion Clipperton Zone | |
| TMC the metals company Inc. | 0225054 |
Expected unloading duration of a fully loaded PV is approximately 10 to 12 hours.
Figure 13.13 provides a general arrangement of the conceptual layout onboard the PV and Figure 13.14 provides a high-level overview of this system. It should be noted that, for clarity, not all systems are identified in Figure 13.13. Section 13.2.7 provides detailed descriptions of the components including illustrations.
| Figure 13.13 | Illustration of General Arrangement – nodule handling and storage system |
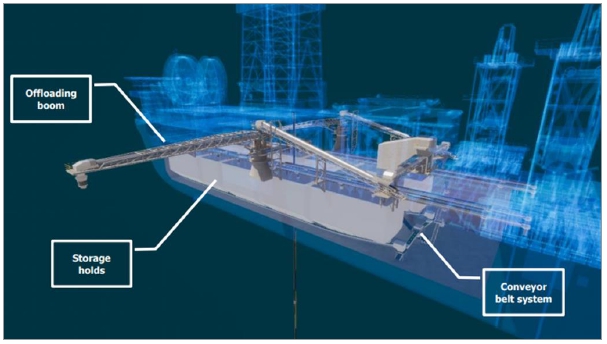
Source: Allseas
| amcconsultants.com | 304 |
| Technical Report Summary of Prefeasibility Study of NORI Area D, Clarion Clipperton Zone | |
| TMC the metals company Inc. | 0225054 |
| Figure 13.14 | Block diagram – nodule dewatering, handling and storage system |
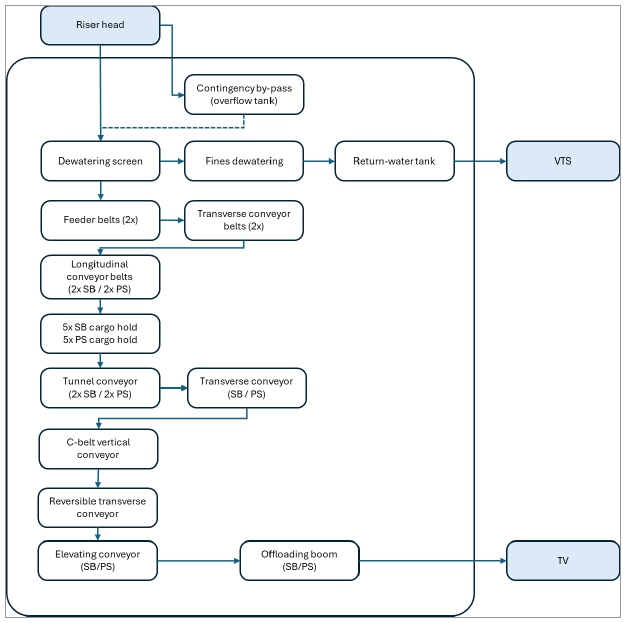
Source: TMC
| 13.2.7 | Nodule handling system – functional description |
| 13.2.7.1 | Nodule dewatering system |
Upon arrival of the de-aerated slurry from the riser head, a multistage process is conducted to separate the nodules from the seawater and sediment. A general arrangement is shown in Figure 13.15 and an overview of these steps is provided below.
Dewatering screen: The first stage is dewatering the nodules on screens, at this point the nodule particles larger than 1 mm are separated from the nodule fines/seawater/sediment. After the dewatering screens the nodules (overflow) are diverted to the conveying system, detailed description provided in 13.2.7.4. The underflow is delivered to a second step.
Fines dewatering: The smaller nodule particles are separated from the seawater and sediment at cut point 150 micron. This is carried out by a system of booster pumps, hydro cyclones and secondary dewatering screens. The nodule particles are delivered to the feeder belt and the residual seawater and seabed sediment will be transported to the return water buffer as described in section 13.2.7.3.
| amcconsultants.com | 305 |
| Technical Report Summary of Prefeasibility Study of NORI Area D, Clarion Clipperton Zone | |
| TMC the metals company Inc. | 0225054 |
| 13.2.7.2 | Bulk cargo classification |
Test Mining offered valuable insights into the particle size distribution (PSD) and other physical properties of nodules following collection from the seabed, vertical transport, and dewatering. The nodule product from these trials underwent thorough physical property testing and cargo classification evaluations to assess potential risks related to vessel stability and other hazards during bulk handling and transport.
Cyclic triaxial testing confirmed that the nodule cargo expected in operations maintains stability even under worst-case vessel motion scenarios, and when under saturated conditions. Because of this, the determination of moisture of the cargo and comparison to a transport moisture limit prior to transport in bulk is not envisioned to be a requirement. Comprehensive physical property analyses including IMO specified testing such as materials only hazardous in bulk (MHB) and hazard classification under IMDG—indicated that the dewatered nodules would qualify for IMSBC Group C classification. Furthermore, the properties of the nodule ore fall within the Group C thresholds established for existing cargos on the IMSBC schedule, such as manganese ore and iron ore. The preparation of an application to the IMO for the addition of polymetallic nodule ore to the IMSBC schedule is being compiled.
During operations, the dewatered nodule cargo will be sampled and PSD analyzed, in addition to any other necessary physical property testing, prior to loading to a transport vessel to ensure the cargo remains within PSD tolerances and complies with cargo classification requirements.
| Figure 13.15 | Illustration of General Arrangement – nodule dewatering |
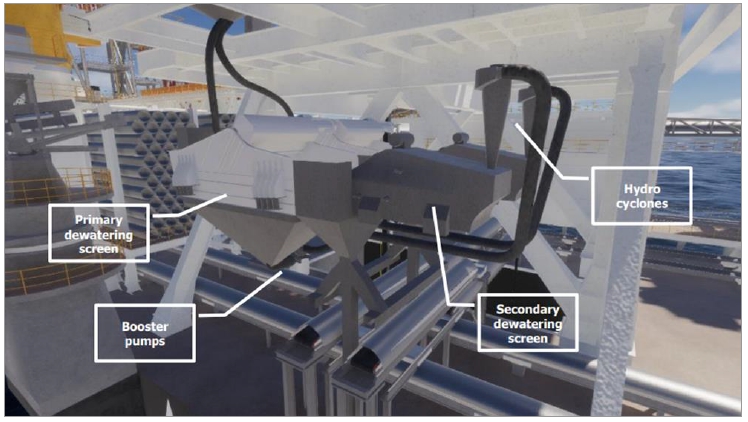
Source: Allseas
| 13.2.7.3 | Return water system |
The return water system handles the seawater from:
| · | Nodule dewatering system. | |
| · | Riser head start-up bypass. |
This return water tank has a capacity of approximately 1,000 m3 and is used for a steady return water supply to the riser system.
| amcconsultants.com | 306 |
| Technical Report Summary of Prefeasibility Study of NORI Area D, Clarion Clipperton Zone | |
| TMC the metals company Inc. | 0225054 |
| 13.2.7.4 | Nodule storage system |
A series of (shuttle) conveyor belts conveyor belts are in place to divert the nodules to the dedicated storage holds. In the following images, the green arrows indicate the movement direction of the nodule flow, the beige arrows indicate the movement direction of shuttle conveyor belts. The first conveyor belts that make the nodule loading system are the feeder belts (Figure 13.16). There will be two conveyor belts that transport the nodules from the dewatering system to the transverse shuttle conveyor belts.
| Figure 13.16 | Illustration of feeder belt and transverse shuttle conveyor belt, conveyor cover is transparent blue |
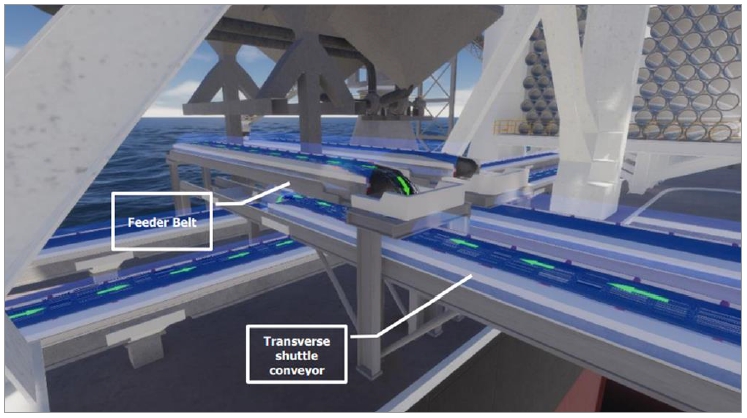
Source: Allseas
The transverse shuttle conveyor belts (Figure 13.17) comprise two conveyor belts capable to distribute the nodules to portside and starboard longitudinal shuttle conveyor belts.
| amcconsultants.com | 307 |
| Technical Report Summary of Prefeasibility Study of NORI Area D, Clarion Clipperton Zone | |
| TMC the metals company Inc. | 0225054 |
| Figure 13.17 | Illustration of Transverse shuttle conveyor belts, conveyor cover is transparent blue |
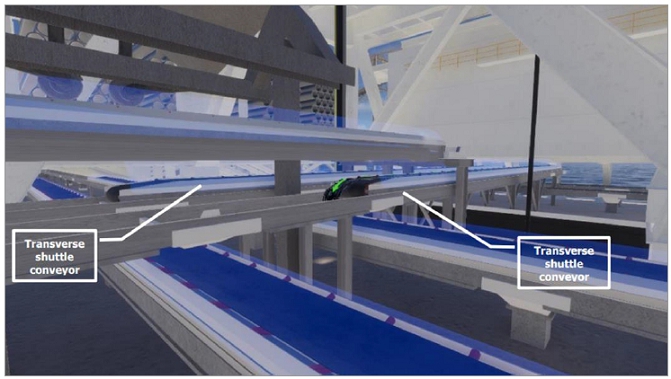
Source: Allseas
The four longitudinal shuttle conveyor belts (Figure 13.18) are reversible and have multiple outlet locations servicing the multiple nodule storage holds. Multiple inlets per storage hold are required to maximize the stacking efficiency inside each storage hold.
| Figure 13.18 | Illustration of Longitudinal shuttle conveyor belt, conveyor cover in blue |
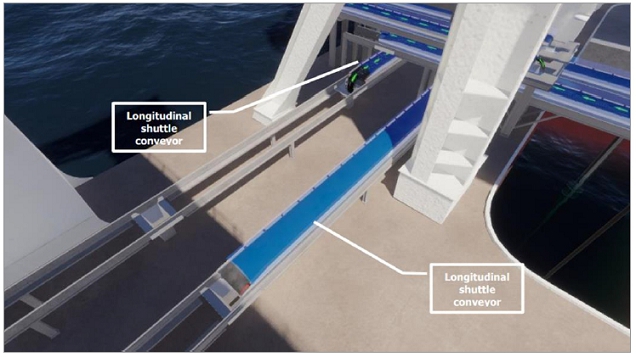
Source: Allseas
| amcconsultants.com | 308 |
| Technical Report Summary of Prefeasibility Study of NORI Area D, Clarion Clipperton Zone | |
| TMC the metals company Inc. | 0225054 |
The design objectives for the conveyors and storage handling focus on minimizing material loss and environmental impact through an optimized conveyor layout to reduce spillage, maximizing belt fill to prevent breakage and dust generation, and using chutes and skirtboards to guide material flow. Enclosed conveyors and effective belt cleaners minimize windage and carry-back, while spill troughs aid in cleanup. Additional features include misalignment switches for tracking, a superchute loading spout to shield free-falling material from wind, and a freshwater spray system to reduce dust emissions.
| 13.2.7.5 | Nodule storage holds |
The nodule storage holds (Figure 13.19) are the main buffer for the nodule production. There will be a total of ten storage holds evenly distributed over portside and starboard and will have a total storage capacity of approximately 25,000 t of nodules. The storage holds are filled using the nodule loading system. For unloading, the conveyors of the nodule unloading system are used. Each storage hold will be hopper shaped equipped with several gate valves at the base of the hold, which when opened will evenly deliver nodules to the tunnel conveyors of the nodule offloading system.
| Figure 13.19 | Illustration of General Arrangement – storage holds |
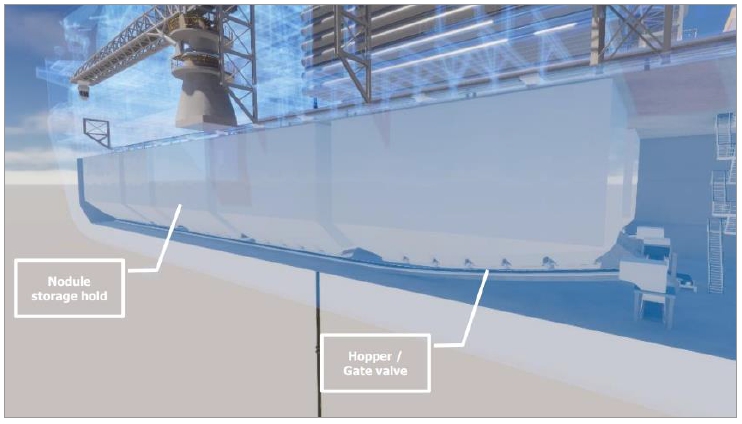
Source: Allseas
| 13.2.7.6 | Nodule offloading system |
The nodule offloading system (Figure 13.20) is designed to transport nodules from the storage holds to the main deck and subsequently onto the transfer vessel. The following sections provide a detailed description of each subsystem involved.
| amcconsultants.com | 309 |
| Technical Report Summary of Prefeasibility Study of NORI Area D, Clarion Clipperton Zone | |
| TMC the metals company Inc. | 0225054 |
| Figure 13.20 | Illustration of General Arrangement – nodule offloading system |
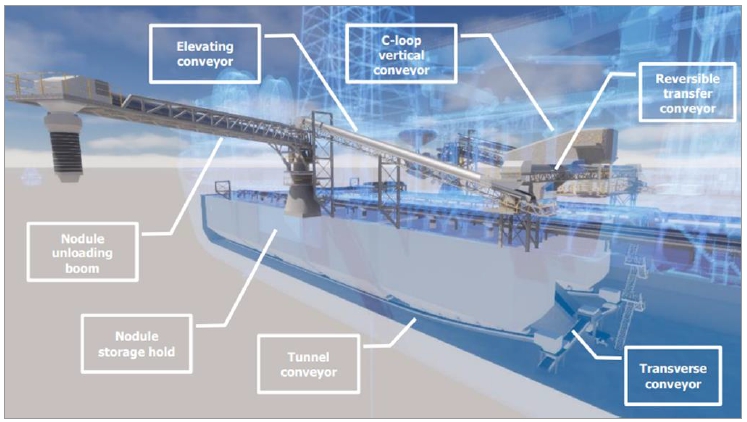
Source: Allseas
Tunnel and transverse conveyors
Conveyors located in tunnels beneath the hopper gates of the storage holds, transport the nodules aft to a set of transverse conveyors. These transverse conveyors (Figure 13.21) then move the nodules to the vessel’s centerline, where they are transferred to the C-loop vertical transport conveyor.
Patented watertight bulkhead door assemblies integrated into the tunnel conveyors provide flood protection in emergency situations.
| amcconsultants.com | 310 |
| Technical Report Summary of Prefeasibility Study of NORI Area D, Clarion Clipperton Zone | |
| TMC the metals company Inc. | 0225054 |
| Figure 13.21 | Illustration of transverse conveyor |
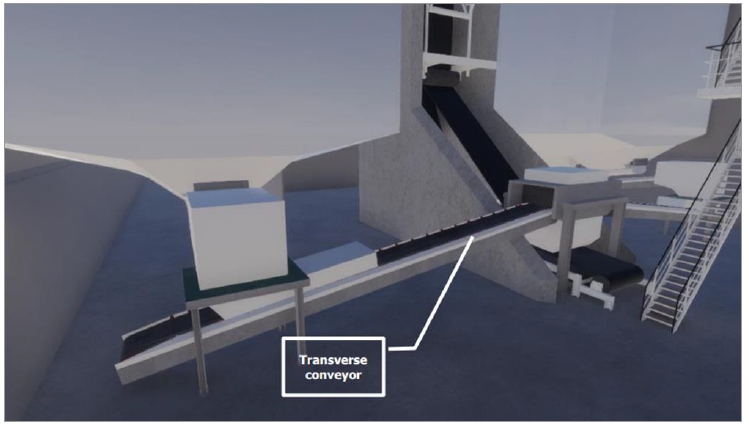
Source: Allseas
C-Loop vertical transport conveyor
The C-loop conveyors transport nodules from below deck up to the main deck level, where they are transferred to conveyor belts that feed the offloading booms. Commonly used in transshipment operations, C-loop conveyors are designed to efficiently elevate and transfer bulk materials between different levels on a vessel.
The system consists of two parallel, C-shaped belts that sandwich the nodules, providing the necessary grip and force to transport them vertically to the main deck (Figure 13.22).
| amcconsultants.com | 311 |
| Technical Report Summary of Prefeasibility Study of NORI Area D, Clarion Clipperton Zone | |
| TMC the metals company Inc. | 0225054 |
| Figure 13.22 | Illustration of C-Loop vertical transport conveyor |
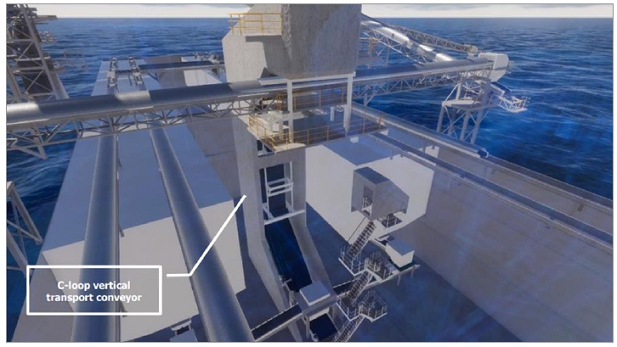
Source: Allseas
Reversible transfer conveyor
Once the nodules have been transported above the main deck, they are directed to either the portside or starboard unloading boom via a reversible transfer conveyor Figure 13.23). This conveyor allows flexible routing of the product depending on operational needs. A sampling point is integrated into the system to assess product quality and verify compliance with transportable moisture limits (TML).
| Figure 13.23 | Illustration of reversible transfer conveyor |
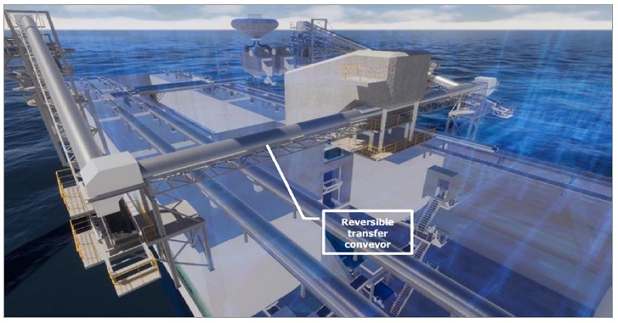
Source: Allseas
| amcconsultants.com | 312 |
| Technical Report Summary of Prefeasibility Study of NORI Area D, Clarion Clipperton Zone | |
| TMC the metals company Inc. | 0225054 |
Elevating conveyors
After the nodules are transported to the port or starboard side, they are raised to the inlet of the unloading boom using an inclined conveyor belt (Figure 13.24).
| Figure 13.24 | Illustration of portside elevating conveyor |
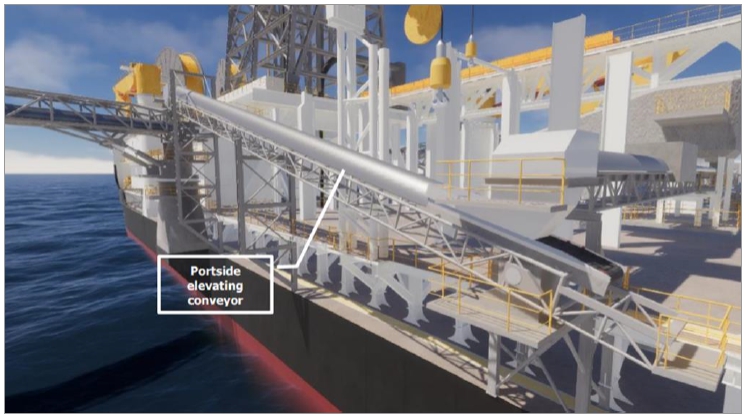
Source: Allseas
Unloading boom conveyors
Offloading of nodules to the transfer vessel is performed via unloading boom conveyors. To ensure high system availability and operational flexibility, one boom is installed on both the port and starboard sides of the Production Vessel. Each conveyor boom has a reach of approximately 45 meters. For safety reasons, offloading is primarily conducted on the leeward side of the vessel.
| amcconsultants.com | 313 |
| Technical Report Summary of Prefeasibility Study of NORI Area D, Clarion Clipperton Zone | |
| TMC the metals company Inc. | 0225054 |
| Figure 13.25 | Illustration of portside unloading conveyor boom |
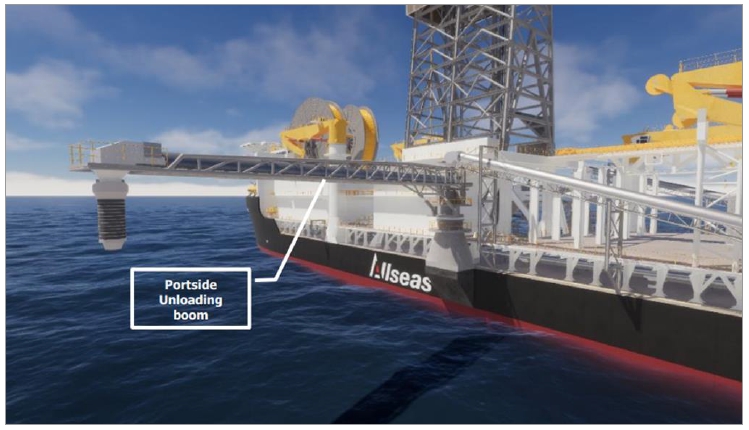
Source: Allseas
| 13.2.8 | Nodule Transfer Vessel (TV) |
Nodules recovered by the PV are transferred from onboard buffers to a TV (Figure 13.26). This setup allows collection operations to continue uninterrupted during the transfer, minimizing downtime.
The TV is a retrofitted Panamax-size bulk carrier, equipped with a self-unloading system similar to that installed on the PV. It is capable of offloading nodules either to a quayside facility or directly to a bulk carrier in the field for long-distance transport to shore. In field offloading is performed while the TV and the receiving bulk carrier are slow steaming side-by-side at approximately 5 knots.
| Figure 13.26 | Illustration of typical Allseas designed nodule transfer vessel |
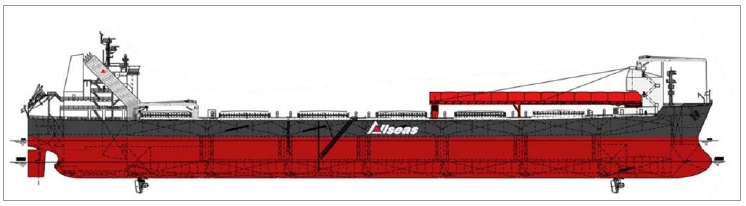
Source: Allseas
| amcconsultants.com | 314 |
| Technical Report Summary of Prefeasibility Study of NORI Area D, Clarion Clipperton Zone | |
| TMC the metals company Inc. | 0225054 |
Expected transfer vessel specifications:
| · | Length = 225 m | |
| · | Beam = 32 m | |
| · | Loaded draft = 17.6 m | |
| · | DP system = DP-2 | |
| · | Maximum speed = 12 kts. | |
| · | Propulsion (diesel electric) = 4x azimuth thruster 5000 kW |
The TV will be outfitted with approximately five cargo holds for receiving nodule ore from the Hidden Gem. These holds are covered with hatches and fitted with bottom gate valves. A materials handling system, similar to that of the PV, will be installed. Conveyors positioned beneath the holds will transfer nodules to a C-loop conveyor, which elevates the material to an unloading boom for discharge.
The vessel will have a payload capacity of 50,000 wmt and an offloading rate of up to 2,500 wmt per hour. A DP-2 system ensures accurate positioning during transfer operations, with the design accommodating offloading in sea states up to 3.5 m significant wave height (Figure 13.27).
| Figure 13.27 | Illustration of TV |
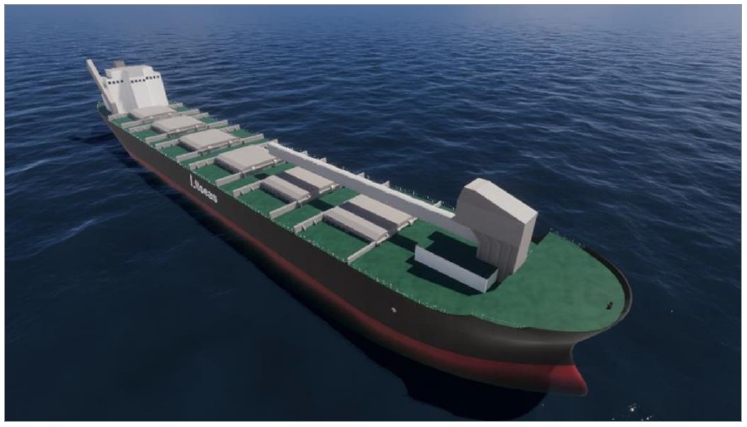
Source: Allseas
| amcconsultants.com | 315 |
| Technical Report Summary of Prefeasibility Study of NORI Area D, Clarion Clipperton Zone | |
| TMC the metals company Inc. | 0225054 |
| 14 | Processing and recovery methods |
| 14.1 | Overview |
Processing of nodules collected from NORI Area D is required to recover the metals contained and realize the economic viability of the project. This section outlines the flowsheet selection process that was undertaken and will explain in detail how the selected process works to recover these metals for sale. The flowsheet development process for the selected flowsheet will also be discussed, though some specific outcomes and learnings from test work can be found in Section 10.
The flowsheet selection process involved ideation of plausible flowsheet configurations and creation of a shortlist. The shortlist of flowsheet options then underwent a screening process, where each was assessed against a range of criteria and objectives as developed by TMC. Eventually, the flowsheet selected for further development was RKEF/Refining, which combines pyrometallurgical unit operations on the front end and hydrometallurgical refining to generate final products. The pyrometallurgical section of the flowsheet combines three existing processes: Rotary Kiln/Electric Furnace (RKEF) technology, sulfidation and converting to generate a matte material. The matte is then fed downstream into conventional hydrometallurgical refinery unit operations to generate final products.
TMC USA’s development scenario involves processing the nodules initially through an existing RKEF facility in Japan, with DGE having signed a binding memorandum of understanding (MOU) with the Pacific Metals Company of Hachinohe, Japan (PAMCO). The intended commercial agreement is to process the nodules through a tolling arrangement, where TMC USA retains ownership of the nodules, any intermediates and final products from the process. Since the arrangement involves only the use of existing major equipment at PAMCO, the products from this process at first production will be a manganese silicate and an iron-nickel-copper-cobalt alloy. Sulfidation and converting unit operations to further refine the alloy are planned for installation after initial operations commence, with a view to produce a nickel-copper-cobalt matte product about 18-24 months into commercial operations. The matte is a marketable product at these volumes and thus, the preliminary phases of operation do not involve hydrometallurgical processing.
From Year 6 onward, TMC USA intends to bring the matte to a newly built, US-based refinery to create nickel and cobalt sulfate products, as well as copper cathode. In Years 6-10, approximately half of the matte will be brought to this facility, with the other half being sold as a product as planned for the earlier years of operation. From Year 10 onward, 100% of matte generated will be brought to the United States for refining, and TMC will become a full-time producer of nickel and cobalt sulfates and copper cathode. This section provides an overview of flowsheet development to date, with particular focus on the front-end pyrometallurgical process based on this section of the flowsheet being employed immediately upon commencement of commercial operations. Progress completed to date on downstream refinery testing is also included. Specific outcomes and learnings from all test work can be found in Section 10.
The front-end of this process involves first drying, dehydrating, initiating the reduction and pre-heating the nodules through a rotary kiln, with the resulting calcine discharged at high temperature. The resultant calcined nodules are then transferred from the kiln to feed bins above an electric smelting furnace, where electric power is employed to smelt the material into two immiscible (distinct) layers that are removed from the furnace through tapping at separate height levels. The nickel, copper and cobalt deport to the higher density, and thus bottom alloy phase, while the manganese deports to the lower density, top layer oxide phase, called manganese silicate. The manganese silicate represents a final product from this process and is crushed, screened and sold as feedstock for production of manganese alloys for use in steel production.
| amcconsultants.com | 316 |
| Technical Report Summary of Prefeasibility Study of NORI Area D, Clarion Clipperton Zone | |
| TMC the metals company Inc. | 0225054 |
The alloy phase is transferred into a two-step process employing Peirce-Smith converters. In this configuration, sulfur, silica flux and air/oxygen as a carrier gas are added in the first (sulfidation) vessel to “convert” the metal to a sulfide phase called “matte” while simultaneously deporting some of the iron to an oxide “slag" phase that floats on the surface of the matte. In the second (finishing) vessel, more air/oxygen and silica flux are added to deport even more iron to the slag phase, which is recycled back into the sulfidation vessel to maximize metal recovery. The matte from the second vessel, containing 5% iron, represents the final product from the RKEF flowsheet, intended first for sale into existing nickel and copper refinery operations and in the future will be further refined by TMC USA in dedicated facilities.
| 14.2 | Flowsheet options screening and selection |
The foundational objective of the flowsheet development was to create a configuration that will maximize recoveries of battery grade metals and steel-making feedstocks while minimizing solid waste. To achieve the near zero solid waste objective, every product or major resultant stream from the eventual process will need to be a useful material with an identifiable, existing market or an identified destination to recycle the stream.
Project objectives were developed for the screening of the plausible flowsheet options. Multiple process types and flowsheet configurations were identified and assessed against these objectives. Technical, financial market, and strategic considerations were all assessed as part of the screening process. Table 14.1 below, shows a simplified description of the screening of the different process options that were assessed, and the project objectives against which they were judged. A green cell indicates that the flowsheet meets requirements for that objective. Orange means the flowsheet partially meets objectives or there is significant uncertainty, while red means the flowsheet does not or is unlikely to meet the objective.
| Table 14.1 | Simple screening process for various nodule processing flowsheet options |
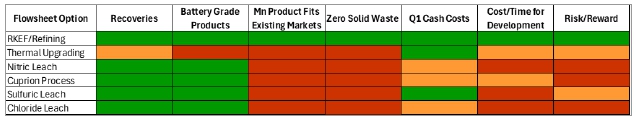
The primary differentiating factors for selecting the flowsheet were generation of a manganese product that fits within an existing market and a flowsheet that yields near zero solid waste. It is also extremely similar to existing operations extensively used across the global, thus minimizing technical risk.
| 14.2.1 | Manganese product and associated market |
The development of nodule projects will have a significant impact on the global manganese markets. Figure 14.1 presents the world’s existing manganese mines, with the manganese production 60,000 ktpa nickel equivalent nodule project overlaid in green. This operation will represent a 6% increase in the current supply of manganese on a 2023 basis (CRU 2024)
| amcconsultants.com | 317 |
| Technical Report Summary of Prefeasibility Study of NORI Area D, Clarion Clipperton Zone | |
| TMC the metals company Inc. | 0225054 |
| Figure 14.1 | 2018 production of manganese ore (blue) compared to TMC’s equivalent project (green) |
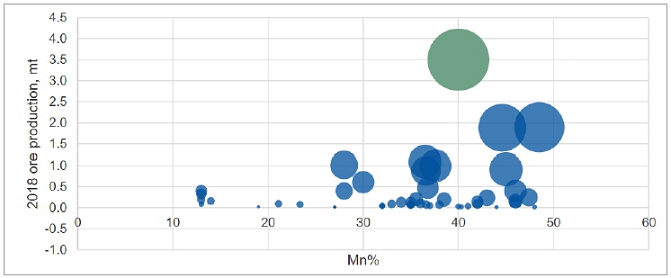
Source: CRU 2019. The bubble size indicates the total contained manganese in ore production
The primary uses of manganese are in the steel industry, which consumes upwards of 90% of all production. The manganese reacts with dissolved oxygen in the liquid steel melt and creates an oxide layer that can be removed. Dissolved oxygen in the steel melt creates a porous structure when the melt eventually solidifies. The removal of this dissolved oxygen with manganese creates a stronger and more durable final solid steel product (Kim 2018). Portable batteries and aluminum beverage cans are primary non-steel uses. In each case, manganese plays a vital role in improving the properties of the alloys and compounds. The chart in Figure 14.2 shows an estimate of how much manganese is consumed in each of its end-use applications.
| Figure 14.2 | 2017 Manganese ore consumption by end-use project |
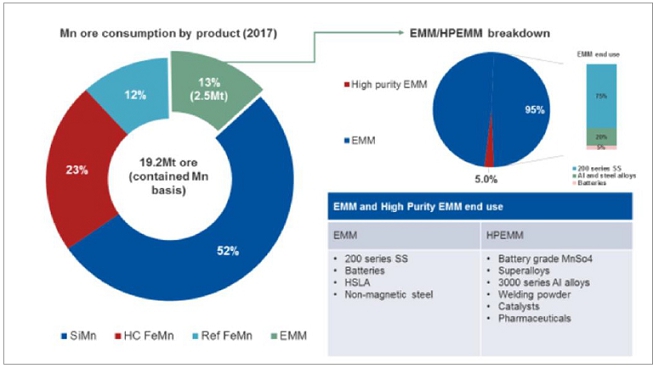
Source: CRU 2019
| amcconsultants.com | 318 |
| Technical Report Summary of Prefeasibility Study of NORI Area D, Clarion Clipperton Zone | |
| TMC the metals company Inc. | 0225054 |
Although there is significant growth in manganese sulfate for battery uses and a sizeable market for Electrolytic Manganese Metal (EMM) and other specialized manganese products, the production volumes from nodules would overwhelm the manganese demand in these markets. On the other hand, processing of the nodules by pyrometallurgy (RKEF) produces a manganese silicate product that can be further processed to manganese alloys (Kim 2018, Sridhar et al 1976, Sridhar et al 1975). The high grade of manganese in this product rivals conventional high-grade manganese ores. Additionally, the product has a dry, pre-reduced nature, a favorable impurity profile, and the physical attributes of a slag material (strong, dense). The manganese silicate also contains the stable oxides from the nodules, notably silica and a portion of the iron, that are required in the downstream manganese alloying process. All of these characteristics make this a potentially disruptive product in the production of manganese alloys, as it conceptually compares favorably in relation to both manganese ore and manganese-rich slags as feed in the production of silico-manganese. Hence, the RKEF flowsheet was the only one from Table 14.1 that was able to fulfill TMC USA’s near zero solid waste objective.
| 14.2.2 | Near zero solid waste generation |
The RKEF and refining flowsheet also produces a converter (iron silicate) slag that is a saleable product, instead of residues that will require disposal to residue storage facilities. Slags are commonly employed as construction aggregate, rail ballast, and in sand blasting. In contrast, there is very little commercial precedence for large scale uses of residues produced in other hydrometallurgical processes used to generate alternative products, such as EMM and manganese sulfate.
Combined with good performance across other selection criteria and a comparatively straight-forward development pathway, given RKEF’s extensive global operating experience, this flowsheet was selected for further development.
| 14.3 | Process description |
The selected processing route for the nodules originally envisaged a greenfield plant comprising both pyrometallurgical and hydrometallurgical plants, producing nickel and cobalt sulfates (battery grade) as well as copper cathode and a manganese silicate slag product. The first phases of commercial operations do not include the hydrometallurgical plant, as the project is based on tolling through existing RKEF plants. The first facility planned for tolling is the Pacific Metals Company (PAMCO) of Hachinohe, Japan. PAMCO does not presently have alloy to matte facilities installed, so initially only existing major equipment will be used, and the process will terminate with the production and sale of an iron-nickel-copper-cobalt alloy plus the manganese silicate slag. Subsequently, a Peirce-Smith converter operation will be added to the PAMCO plant to process the alloy to a higher value matte product. The converting process also produces a slag by-product, which is intended for sale as a construction aggregate, and therefore should not require disposal as waste. Figure 14.3 shows a schematic diagram of the major equipment and associated streams from the pyrometallurgical complex.
| Figure 14.3 | Major equipment and associated stream from the pyrometallurgical complex |
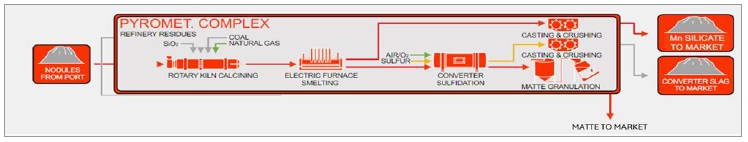
Source: Hatch
| amcconsultants.com | 319 |
| Technical Report Summary of Prefeasibility Study of NORI Area D, Clarion Clipperton Zone | |
| TMC the metals company Inc. | 0225054 |
| 14.3.1 | Alloy production |
Nodules are reclaimed from stockpiles and fed directly to rotary calcining kilns, together with coal to act as a reductant and silica flux to regulate slag chemistry. In the rotary kilns, the nodules are heated to high temperatures. Free moisture in the nodules is removed, as is the crystalline moisture (de-hydrated). Higher oxides of manganese first decompose thermally and then are further partially reduced carbothermically together with selected other oxides.
The calcined nodules are transferred hot in refractory-lined containers to the electric furnaces. Here, residual carbon left after calcining completes the desired degree of reduction. It is important to control reduction such that most of the manganese remains in the slag phase, while ensuring nickel, copper and cobalt reports to alloy.
The alloy and manganese silicate are tapped periodically and separately through tapholes located at different elevations on the furnace. The alloy is transferred to the sulfidation and converting steps (matte production) by ladle and overhead cranes, while the manganese silicate is cast into a pit, allowed to freeze, and then recovered and crushed to a suitable size distribution (based on customer requirements) for sale to the silico-manganese alloy industry.
The alloy and manganese silicate are tapped periodically at different heights from the furnace. The alloy is transferred to the sulfidation and converting steps (matte production), while the manganese silicate is cast into a pit, allowed to freeze, and then recovered and crushed to a suitable size distribution (based on customer requirements) for sale to the silico-manganese alloy industry.
| 14.3.2 | Matte production |
Most ferronickel RKEF plants, including PAMCO, have refined ferronickel as their final product. Two plants (Société le Niquel (SLN)’s Doniambo smelter in New Caledonia and PT Vale Indonesia) have produced or currently produce matte by adding sulfur to the process. The Doniambo process is far more efficient in terms of sulfur utilization and has lower SO2 emissions to the environment, so has been chosen for the matte process.
The production of matte is achieved using a two-step process in a Peirce-Smith converter aisle. The first step is in dedicated sulfidation vessels (SV). Alloy is added to the partially filled vessel and air is blown through most of the vessel tuyères to partially and selectively oxidize some of the iron which deports to slag and combines with silica flux to achieve a manageable fluidity. At the same time, liquid sulfur at 140°C (maintained by steam heated lines) is pumped intermittently through a limited number of dedicated tuyères to transform the alloy to matte. When sulfur is not being injected, steam is used to keep the tuyères open. The SV operates with a large matte heel in a semi-continuous mode (i.e., relatively small amounts of product matte are removed at a time). Slag from the SVs represents the converter slag and is sold.
The intermediate matte from the SV is taken to a finishing vessel (FV), where blowing commences and more silica flux is added to form slag with the iron that is being oxidized. Blowing continues until the iron in the matte decreases to 5%. The 5% iron matte will first be sold but in later years of operation will be sent to a TMC-operated dedicated facility in the United States for refining into final products. Slag from the FV is rich in pay-metals so it is therefore recycled back to the SVs to improve recovery.
| amcconsultants.com | 320 |
| Technical Report Summary of Prefeasibility Study of NORI Area D, Clarion Clipperton Zone | |
| TMC the metals company Inc. | 0225054 |
| 14.3.3 | Matte refining |
Beginning in Year 6, matte produced at PAMCO and other RKEF plants will be shipped to a dedicated hydrometallurgical refinery in the USA to generate refined products. As with the pyrometallurgical section of the flowsheet, the matte refining process uses existing technologies that are already in use commercially.
The downstream refining program begins by putting the granulated matte through a mill before subjecting it to a two-stage leach process – an initial agitated atmospheric leach (AL) and subsequent pressure oxidation (POX) leach. The leaching process is designed to separate the copper from the nickel and cobalt. Small amounts of nickel and cobalt that remain in the AL residue are removed during the POX and recycled back to the smelter to maximize recoveries. The copper stream from the POX undergoes electrowinning, resulting in copper cathode which represents a final product from the process.
The nickel and cobalt that is separated during the leaching process is then fed into a cobalt solvent extraction, which separates the nickel and cobalt into their individual components. Copper that was not removed during the leaching phase is extracted after the cobalt solvent extraction and recycled to the POX. The cobalt phase also undergoes a manganese removal step, with the residual manganese recycled back into the smelter to maximize its recovery to the manganese silicate. The nickel phase resulting from the cobalt solvent extraction then proceeds to a nickel solvent extraction where it is separated from the ammonium that has been added throughout the process. All three phases – cobalt, nickel and ammonium – proceed to individual crystallization processes to create sulfates, all of which represent final productions from the refinery. Nickel and cobalt sulfate can be sold as feedstocks for battery production and energy storage, while the ammonium sulfate is sold for use as a fertilizer. The process to generate final products from the matte is depicted below in Figure 14.4.
| Figure 14.4 | Major equipment and associated stream from the hydrometallurgical refinery |
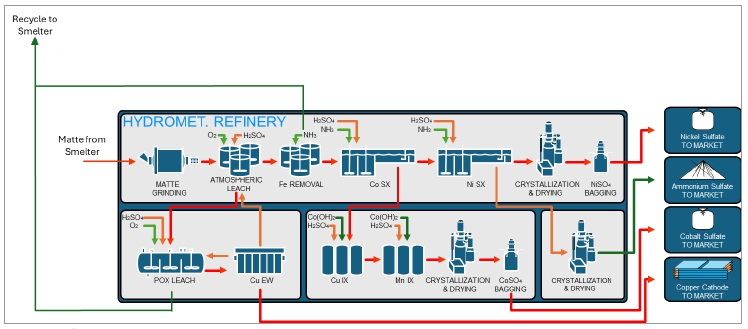
Source: Hatch
| 14.4 | Flowsheet development |
| 14.4.1 | Literature review |
Pyrometallurgical processing of nodules has been extensively studied from the early 1970s until the present day and appears to be the preferred process for most of the other currently active nodule processing research groups. Many groups including Kennecott Utah Copper LLC22 (KUC); Inco Limited23; Cuban / Bulgarian; German; Indian; Japanese; and Korean entities have studied pyrometallurgical processing of nodules at a laboratory scale. The nodule samples for these tests were collected from their respective license areas in the CCZ.
| 22 | Kennecott Utah Copper LLC (KUC) is a division of Rio Tinto Group. It is a mining, smelting and refining company. KUC has its corporate headquarters in South Jordan Utah. |
| 23 | Inco Limited (Inco) was a Canadian mining company and the world’s leading producer of nickel for much of the 20th century. In October 2006, Inco was purchased by the Brazilian mining company Vale. |
| amcconsultants.com | 321 |
| Technical Report Summary of Prefeasibility Study of NORI Area D, Clarion Clipperton Zone | |
| TMC the metals company Inc. | 0225054 |
A detailed review of specific process, modelling and available bench-scale testing data from the following parties was reviewed to inform the design process for TMC’s preliminary flowsheet:
| · | Inco (Canada). | |
| · | Sumitomo (Japan). | |
| · | German Federal Institute for Geosciences and Natural Resources (Germany). | |
| · | United States Bureau of Mines (USA). | |
| · | Indian National Metallurgical Laboratory (India). |
The literature review focused on specific content provided by each of the above groups. Testwork at both bench and pilot scale (if available) involving calcining, smelting and matte production were all assessed. Key results that were analyzed included composition of intermediate materials (calcine, alloy, manganese silicate and matte) as well as energy usage, consumables used and quantity requirements, and operating conditions that were tested by each of the groups. References from the literature review are provided at the end of the chapter. Based on review of the data, it was concluded that the best data for designing a preliminary pyrometallurgical flowsheet for treating nodules was provided by Inco, Japanese and German references.
| 14.4.2 | Bench-scale test work |
NORI has commissioned numerous small-scale investigations in support of the project, prior to, during and after the larger scale pilot work described in Section 10.3.
The work was carried out at:
| · | Kingston Process Metallurgy, Ontario (KPM). | |
| · | FLS, Pennsylvania. | |
| · | Expert Process Solutions (Glencore), Ontario (XPS). | |
| · | SINTEF, Norway. | |
| · | SGS Lakefield, Ontario (SGS). |
The test work is summarized in Table 14.2.
| Table 14.2 | Summary of bench-scale test work |
| Final Report Date | Facility | Description | Reason |
| 29-May-2019 | KPM | Evaluation of alternate manganese products | Exploring potential opportunities for added value for project |
| 19-Nov-2019 | FLS | Calcination and carbothermic reduction of nodules in a lab tube furnace and direct-fired batch kiln | Investigation of reduction process prior to pilot-scale work. Preliminary assessment of sintering and dusting behavior. |
| 22-Apr-2020 | XPS | Oxidation of artificial matte to final product matte | Investigation of converting prior to pilot-scale work. Measuring elemental partition coefficients as a function of %Fe in matte. |
| 28-Aug-2020 | XPS | Chemical analyses of calcine, slag and metal samples as part of a 'Round Robin' campaign | To help establish reliable assaying methods |
| 9-Oct-2020 | XPS | Oxidation of Mn in alloy and sulfidation using pyrite and pyrrhotite | Investigation of pre-converting steps ahead of pilot-scale work |
| 11-Dec-2020 | KPM | Smelting of calcine produced at FLS part way through piloting | To resolve issues with determining correct reductant coal addition at FLS |
| amcconsultants.com | 322 |
| Technical Report Summary of Prefeasibility Study of NORI Area D, Clarion Clipperton Zone | |
| TMC the metals company Inc. | 0225054 |
| Final Report Date | Facility | Description | Reason |
| 7-May-2021 | KPM | Small scale calcination of nodules in batch rotary-kilns followed by induction furnace smelting | Inputs to process modelling and for planning pilot-scale work |
| 14-Sep-2021 | KPM | Determination of residual moisture in nodules after draining excess water | Provide basis for moisture content of nodules entering process plant |
| 24-Jan-2022 | SINTEF | Production of silico-manganese alloy from smelting slag samples | Preliminary investigation of suitability of smelting slag product as feed to silico-manganese industry |
| 16-Mar-2022 | KPM | Quantitative SEM investigation of slag samples from smelting and converting tests | Determination of elemental distribution amongst different phases |
| 23-Jun-2022 | KPM | Assaying material from FLS and XPS pilot campaigns | Assay cross-checks |
| 10-Oct-2024 | SGS | Refining of TMC’s pilot matte into nickel and cobalt sulfates | Proof of concept and preliminary data collection for the hydrometallurgical refinery aspect of the flowsheet |
| 14.4.3 | Concept engineering |
A PEA for the overall project was undertaken in 2019 and updated in an Initial Assessment for NORI Area D in 2021 (AMC, 2021). The study assessed the entire flowsheet as it was then envisaged, with large scale processing of nodules from recovery from the seafloor through pyrometallurgical and hydrometallurgical processing plants to final products. The outcome of the PEA was a favorable net present value for the project.
| 14.4.4 | Piloting |
| 14.4.4.1 | Piloting overview |
A set of pilot-scale pyrometallurgical processing campaigns using a large sample (75 t) of nodules harvested from NORI Area D of the CCZ. The work comprised calcining, smelting, sulfidation and converting steps in accordance with the chosen process for the project.
The main objectives of the pilot scale work were to:
| · | Demonstrate the chosen pyrometallurgical process. |
| · | Produce on-spec matte for subsequent hydrometallurgical test work and on-spec manganese silicate slag for product development activities. |
| · | Update process design criteria in support of project development and engineering design. The work was carried out in two separate locations: |
| ― | FLSmidth’s testing facility in Bethlehem, Pennsylvania calcined the nodules, and |
| ― | The XPS (Expert Process Solutions, a Glencore company) technology centre in Falconbridge, Ontario smelted the calcine from FLS, sulfidized the resultant alloy, which was then converted to product matte. |
The nodules were calcined at the FLS pilot kiln facility in Pennsylvania and the calcine was shipped to Falconbridge, Ontario, where the remainder of the pyrometallurgical work was performed in the XPS pilot-scale DC arc furnace. The pilot-scale testwork conducted is summarized in Table 14.3. Select results from the piloting is available in Section 10.3.
| Table 14.3 | Summary of pilot scale test work |
| Final Report Date | Facility | Description |
| December 2020 | FLS | Polymetallic nodule calcining using a pilot rotary kiln system |
| 10-Feb-2022 | XPS | Pilot smelting of calcined sea nodules |
| 23-Dec-2021 | XPS | Sulfidation and converting of alloy |
| amcconsultants.com | 323 |
| Technical Report Summary of Prefeasibility Study of NORI Area D, Clarion Clipperton Zone | |
| TMC the metals company Inc. | 0225054 |
The pyrometallurgical pilot phase of work is considered complete and was able to demonstrate that:
| · | The nodules can be smelted to an alloy with excellent recoveries of nickel, copper and cobalt. | |
| · | A manganese silicate slag product can be made that conforms to TMC’s preliminary specification under suitably reducing conditions consistent with the current plan for the process. | |
| · | A final matte can be made that is suitable for hydrometallurgical processing (albeit with an iron level that is a little higher than planned for the project). |
| 14.4.4.2 | Calcining at FLSmidth |
Nodules retrieved during the 2020 campaign were shipped to FLSmidth for calcining, which took place between 12 October and 14 November 2020.
Calcining was performed in the facility’s large pilot kiln, which is 15 m long and 0.9 m in diameter. This kiln has been in use for several years, including for test work with which TMC’s technical consultant had been involved in and has witnessed in the past. The equipment is depicted in Figure 14.5 and Figure 14.6. Note that feeding and cooling underwent some changes during the work (FLSmidth, 2020). No pre-processing had been planned since the currently proposed commercial plant will feed as-received nodules directly to the kilns.
| amcconsultants.com | 324 |
| Technical Report Summary of Prefeasibility Study of NORI Area D, Clarion Clipperton Zone | |
| TMC the metals company Inc. | 0225054 |
| Figure 14.5 | Schematic of kiln and ancillary equipment as originally configured |
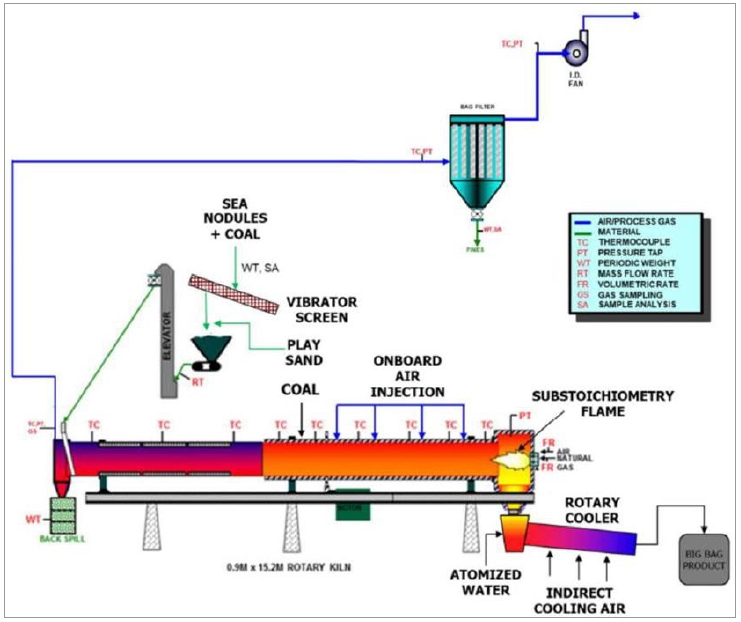
Source: FLSmidth
| amcconsultants.com | 325 |
| Technical Report Summary of Prefeasibility Study of NORI Area D, Clarion Clipperton Zone | |
| TMC the metals company Inc. | 0225054 |
| Figure 14.6 | Pilot plant rotary kiln, feed-end to right. |
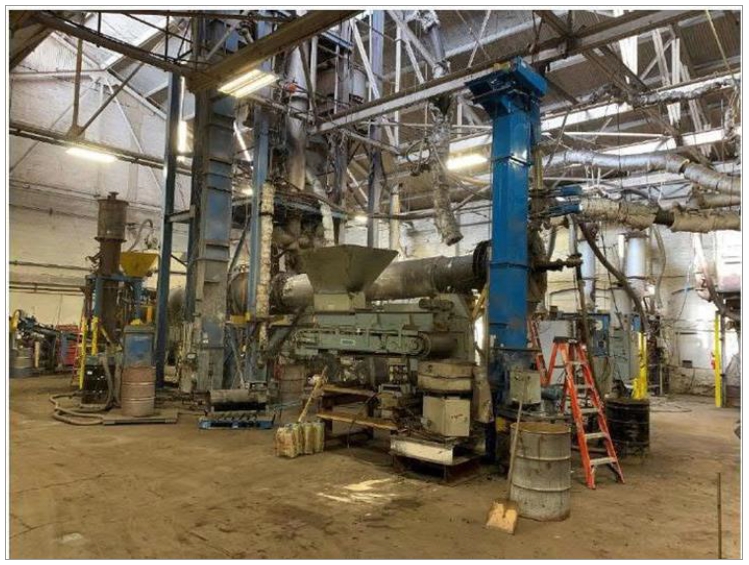
Source: Canadian Engineering Associates Ltd.
| 14.4.4.3 | Smelting, sulfidizing and converting at XPS |
Pilot operations vs commercial
The proposed commercial operation for the project closely follows matte production as practiced by SLN at their Doniambo nickel laterite processing facility in New Caledonia until 2016, where calcine is smelted conventionally in an alternating current (AC) furnace to produce a ferronickel alloy, similar to many plants worldwide. Uniquely at SLN, some of this ferronickel was taken to a Peirce-Smith converter aisle where liquid sulfur was added through one of the tuyères, while air was used simultaneously in the other tuyères to oxidize out some of the iron. This first vessel operated under more or less steady chemistry conditions (at the point of an intermediate matte containing around 30% iron). Once the vessel was full of matte, roughly half of the matte was then transferred to a second converter to remove most of the remaining iron to produce a Bessemer matte for downstream hydrometallurgical refining.
There are only a limited number of facilities worldwide that offer pilot-scale electric furnace smelting facilities at a scale suitable for the project needs. Pilot-scale Peirce-Smith converters are not available, and liquid sulfur injection that is representative of industrial operation would be challenging in other pilot equipment (or even a pilot scale PS Converter in fact, due to the specific gas/fluid dynamics present in the full scale). Under these circumstances, it is not possible to closely replicate the proposed commercial operation. Some degree of compromise is necessary to devise test work that adequately reproduces the key process steps from a metallurgical perspective. Thus, it was decided to proceed with both the smelting and sulfidation/converting work using the same furnace, namely the direct current (DC) furnace at Glencore’s XPS facility in Falconbridge, Ontario, as it is at least partially analogous of the anticipated industrial process.
| amcconsultants.com | 326 |
| Technical Report Summary of Prefeasibility Study of NORI Area D, Clarion Clipperton Zone | |
| TMC the metals company Inc. | 0225054 |
Equipment description
The XPS DC furnace is a 250-kW cylindrical furnace with a diameter inside the refractory lining of 762 mm and a total height of nearly 3 m above the floor. It is equipped with metal and slag tapholes for intermittent removal of molten material. It has an off-gas system for particulate capture. See Figure 14.7 and Figure 14.8 for layout and for dimensions.
A heel of material is needed upon which to strike an arc for the furnace to power up. Feed can then be added semi-continuously through a vibratory feed system connected to a feed pipe through the furnace roof, or to a pneumatic conveying system and injection lances. Lumps can also be added by hand through the roof port. A viewing port can be used to measure melt temperature via optical pyrometer, although that is dependent on not having any solids/partially melted material on top of the slag layer.
An operator control station has a computer and screen interface that can totalize power input and calculate bath temperature from known heat losses and smelting energy requirements. This is cross-checked against temperatures taken from molten streams when the furnace is tapped for slag and matte.
| Figure 14.7 | Pilot plant dc furnace and ancillary equipment |
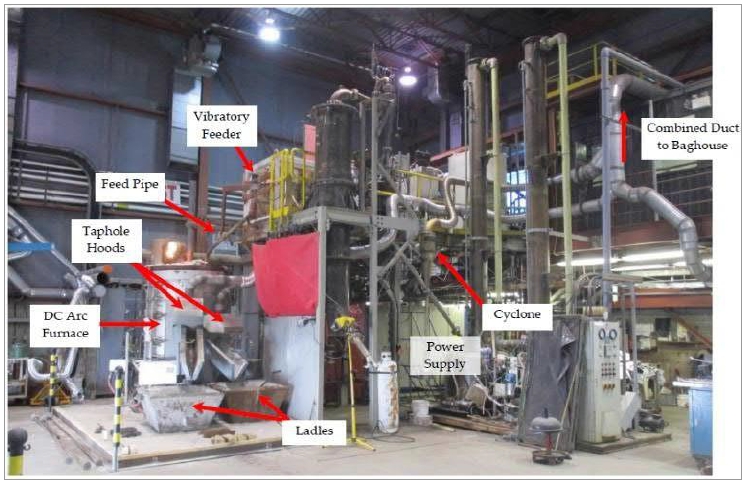
Source: XPS
| amcconsultants.com | 327 |
| Technical Report Summary of Prefeasibility Study of NORI Area D, Clarion Clipperton Zone | |
| TMC the metals company Inc. | 0225054 |
| Figure 14.8 | DC Furnace Dimensions |
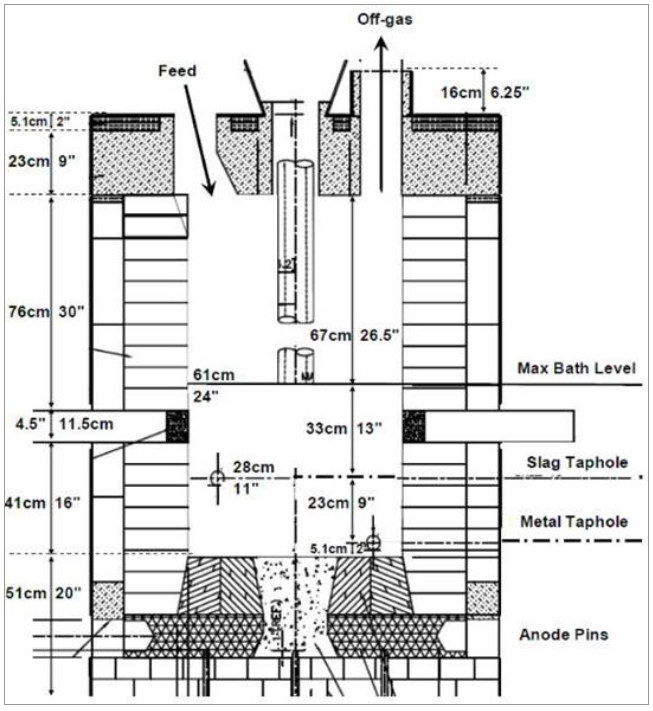
Source: XPS
| 14.4.5 | Demonstration scale calcining and smelting trial |
Following the successful pilot mining trial completed in Q4 of 2022, TMC and PAMCO identified an opportunity to use 2,000 tonnes of collected nodules for demonstration-scale metallurgical testing at their existing RKEF facility in Hachinohe, Japan. The nodules were delivered to PAMCO in April of 2024, and testing was completed in April of 2025.
The trial involved first processing the nodules in one of PAMCO’s commercial kilns over six campaigns. Multiple campaigns were required as the nodules could not be calcined all at once due to limited hot calcine storage, and the calcine had to be cooled prior to transfer to the smelting facility. The calcine generated was stored and cooled over several weeks before transfer to an adjacent smelting facility containing a 4,000 kVA furnace that was used for smelting. The smelting took place over four campaigns.
| amcconsultants.com | 328 |
| Technical Report Summary of Prefeasibility Study of NORI Area D, Clarion Clipperton Zone | |
| TMC the metals company Inc. | 0225054 |
The overall goals of the trial were to confirm the metallurgy (confirm operating parameters, process control approaches and gather data), gain operator experience with nodules and their derived intermediates, generate samples for product marketing and downstream metallurgical testing and to assess the slag behavior during smelting and associated refractory wear.
The tests were able to achieve all objectives and confirm that stable operations can be achieved at commercial scale. Commentary on technical outcomes from the trials can be found in Section 10.3.
| 14.4.6 | Manganese silicate slag quality |
The slag from the electric furnace smelting process is intended to be sold as a feed to the silico-manganese industry and constitutes a significant portion of the project’s revenue stream. The potential customers have certain parameters in mind that may make the slag more or less desirable. This imposes some additional constraints on running the smelting operation for optimal products.
A slag high in manganese and low in phosphorus is desirable. Low phosphorus is achieved by using high degrees of reduction to bring the phosphorus into the alloy. On the other hand, this also tends to bring more manganese into the alloy, depleting the slag to some extent. The mass ratio of slag to metal is quite high however, which helps to mitigate this. High degrees of reduction are, of course, beneficial to pay-metal recovery, but they also lead to more blowing requirements to remove iron, manganese, silicon, carbon, and phosphorus in the downstream converting/sulfidation process.
The XPS pilot campaigns indicate that a preliminary specification for slag can be met by reducing to the point where iron in slag is below 2% without raising manganese in alloy to high levels or significantly depleting manganese in slag.
| amcconsultants.com | 329 |
| Technical Report Summary of Prefeasibility Study of NORI Area D, Clarion Clipperton Zone | |
| TMC the metals company Inc. | 0225054 |
| 15 | Metallurgical plant (onshore) |
TMC intends to begin operations onshore by using existing facilities that are already operating RKEF equipment, presently processing nickel laterite ores. The Indonesian ore export ban of 2014 left several operations (primarily in Asia but there is some availability elsewhere) without reliable feed for their process plants, and as such, these facilities have been operating under their available capacity. This predicament for existing facilities provided a unique opportunity for TMC to process nodules through these plants, eliminating almost all of the onshore capital expenditure and aligning the timelines of the offshore and onshore teams by having a commissioned plant ready to accept nodules on commencement of commercial-scale offshore nodule collection.
In November of 2022, DGE signed a non-binding MOU with PAMCO to process the first 1.3 Mwmt of nodules through their existing operation located in Hachinohe, Japan. The PAMCO site contains three complete RKEF ferronickel lines, though the facility is operating at a very low production capacity factor. The existing feed into their ferronickel operation is laterite ore sourced from New Caledonia and the Philippines. A commercial partnership advanced in November 2023 through the signing of a binding MOU between the two parties. The nodules will be processed under a tolling arrangement, under which TMC retains sole ownership of the nodules and any intermediate or final products from the process. PAMCO is responsible for any capital scope that is required to prepare their facility to accept the nodules.
The PAMCO site sits adjacent to a port, allowing for easy delivery of nodules from the collection site. The port is equipped with material handling capabilities that will allow for a seamless offload. The port also contains conveyors that can transfer the material directly into the plant, maximizing efficiency. Once conveyed into the plant, the nodules will be directly fed to PAMCO’s Rotary Kiln #6. The kiln is designed to remove moisture, de-hydrate and to begin the reduction process, using coal as a reductant and silica is added to control the slag chemistries downstream. From the kiln, the hot calcined material is transferred via the calcine transfer system to bins above the furnace where the material is discharged in a controlled manner into the smelting electric furnace. The manganese-oxide rich slag is separated from the iron, nickel, copper and cobalt metallics, thus producing two products: an iron-rich Ni-Cu-Co alloy and manganese silicate. These represent the final saleable products from the PAMCO process when commercial operations begin.
TMC and PAMCO together conducted the first commercial scale calcining operations on nodules. NORI supplied 2,000 wmt of nodules from their Test Mining, with roughly 500 t of calcined material generated. A subsequent commercial scale smelting operation using PAMCO’s 4,000 kVA furnace, previously used for fly ash processing, was conducted in H1 2025, with associated quantities of manganese silicate and alloy produced. TMC intends to use the products generated from this commercial scale trial for marketing and further metallurgical testing purposes.
NORI Area D allows for ramp up to 12 Mtpa in terms of offshore capability, and therefore additional processing opportunities are required to process this amount when the offshore production increases. While TMC USA is actively pursuing the strategy of reshoring nodule processing and refining to the United States, it should be noted that additional opportunities for further processing capacity exist mainly in Indonesia due to the sheer volume of acceptable facilities and their ability to build plants and install equipment in quick timeframes. TMC therefore intends to conduct additional tolling in Indonesia.
The present equipment at PAMCO does not include a converter aisle, which will process the alloy into a higher value matte product. A capital project exists at PAMCO to install this equipment, and the tolling arrangement between DGE and PAMCO will be renegotiated at that time. Market insights denote that the matte holds significantly more value in terms of price and optionality for customer placement compared to the alloy. The present assumption is that any Indonesian site used for additional processing as described above would include converting technology, and therefore matte will be immediately produced as the Ni-Cu-Co product at these sites.
| amcconsultants.com | 330 |
| Technical Report Summary of Prefeasibility Study of NORI Area D, Clarion Clipperton Zone | |
| TMC the metals company Inc. | 0225054 |
TMC will also produce a manganese silicate product at PAMCO and Indonesia, which will be sold to silico-manganese producers supplying the steel industry with this important consumable. The close proximity of Japan and Indonesia to the Asian target market countries for manganese silicate, considering this product is 90% of NORI Area D production by volume, is yet another advantage to processing the nodules through these locations.
| 15.1 | Strategy of employing existing assets |
| 15.1.1 | Overview and context |
The front-end pyrometallurgical section of the selected flowsheet uses conventional RKEF technology that is employed in many existing processing facilities worldwide.
TMC’s present strategy is to employ, the use of existing RKEF processing facilities in Japan and Indonesia to align the onshore and offshore schedules. This strategy allows TMC to retain sole ownership of the nodules, and all intermediate and final products generated at all stages of the processing operations. The operator of the existing plant will be responsible for any capital modifications to prepare the plant to operate and will be compensated under an appropriate commercial arrangement.
Several factors contributed to the pursuit of this strategy for onshore operations, of which two are highlighted below:
| · | The cost of a new processing plant is extremely capital intensive. | |
| · | Site selection and permitting for a new plant is very time consuming and does not align with commercial recovery permitting and feasible start of offshore production |
This strategy is low risk, eliminates almost all capital expenses required to get into operation, and allows for the onshore timeline to align with anticipated commercial recovery permitting and offshore commercial recovery capabilities.
| 15.1.2 | Ramp up of commercial operations |
The onshore processing capabilities must align with offshore production when commercial operations commence. Initial offshore production for NORI Area D is 1.3 Mwmt, which is destined for tolling in Japan (see Section 15.2). Works are in progress, if operations are satisfactory and further approvals are gained, to line up additional existing operations that will allow for processing of up to 12 million tonnes per annum – first being processed outside the United States with a view to sequentially reshore the downstream processing (see Section15.3).
NORI has completed substantial metallurgical testing over the past five years to prove that the flowsheet is fit for purpose and is scalable. Pilot-scale trials were successful in producing calcine, later smelted into alloy and manganese silicate, and also produced some matte, used as a feed for bench-scale hydrometallurgical refining tests. DGE and PAMCO have also completed a commercial scale trial, where 2,000 t of nodules collected from NORI Area D were processed through the RKEF line at PAMCO that TMC proposes to use. PAMCO’s currently unused capacity, as described further in Section 15.2, provided the opportunity for the parties to run plant-scale tests to collect critical data and to understand and address any operational issues ahead of full-scale production. The employment of existing assets is also an inherent benefit when it comes to ramping up to commercial operations. When compared to a new project, the following points describe clear advantages that would enable TMC USA to get into production and begin selling products as soon as possible:
| · | Permitting of a new plant site is unnecessary, thus accelerates timelines to plant readiness. | |
| · | No construction or long lead item procurement issues arise. | |
| · | There is no requirement to hire and train operators or plant staff as experienced personal are already on-site. | |
| · | Recently and/or currently operating equipment does not require (re)commissioning. |
| amcconsultants.com | 331 |
| Technical Report Summary of Prefeasibility Study of NORI Area D, Clarion Clipperton Zone | |
| TMC the metals company Inc. | 0225054 |
Overall, TMC USA’s strategy to utilize existing facilities:
| · | Heavily de-risks the onshore portion of the project. | |
| · | Will allow for the onshore capacity ramp-up to precede and/or match the offshore capabilities to deliver a higher volume of nodules. | |
| · | Will ensure that when the offshore capacity increases, there is a permitted, commissioned site available with experienced staff to process the nodules. |
| 15.2 | PAMCO |
| 15.2.1 | Overview and context |
PAMCO has been operating an RKEF plant at Hachinohe since the 1950s. As with other operations outside Indonesia, PAMCO was heavily affected by the ore export ban of 2014 and has sourced the majority of their ore from New Caledonia and Philippines. The company expressed interest in processing nodules through the signing of a non-binding MOU with DGE in Q1 2023. By Q4 2023, a binding MOU was signed with PAMCO allocating one full RKEF line for TMC’s exclusive use under a tolling arrangement to process 1.3 Mwmt of nodules.
| 15.2.2 | Plant |
The PAMCO site adjacent to a port where the nodules can be offloaded and then transported by conveyor belt directly into the processing facility. The maximum size of vessel that can access this port is Handymax (approximately 50,000 t deadweight). Figure 15.1 shows the overhead view of the proximity between the port and plant.
| amcconsultants.com | 332 |
| Technical Report Summary of Prefeasibility Study of NORI Area D, Clarion Clipperton Zone | |
| TMC the metals company Inc. | 0225054 |
| Figure 15.1 | Google satellite view of the PAMCO facility and adjacent port and stockyard |
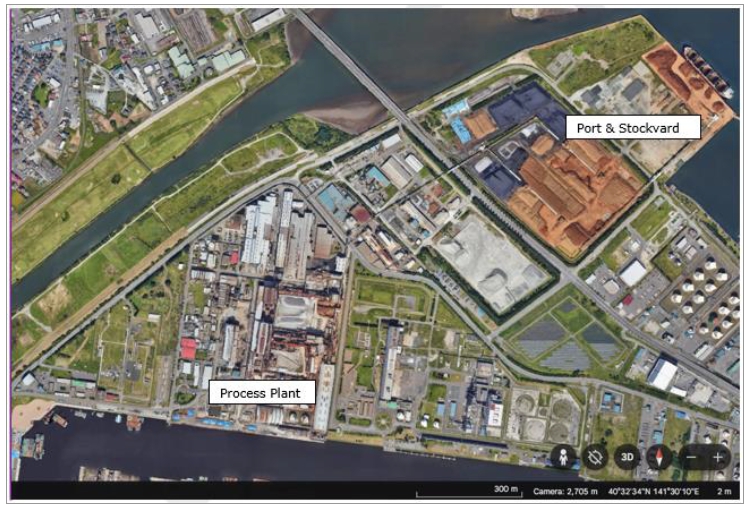
The nodules will first be offloaded from the bulk carrier and stockpiled on the port. Front-end loaders will be used to transport the nodules from the stockpile in the port to the conveying system. Figure 15.2 shows a close-up overhead view of the port and location of the conveying system. Scale and direction are as per the above figure.
| amcconsultants.com | 333 |
| Technical Report Summary of Prefeasibility Study of NORI Area D, Clarion Clipperton Zone | |
| TMC the metals company Inc. | 0225054 |
| Figure 15.2 | Google satellite view of the port unloading area and identification of conveying system used to transport nodules into process plant |
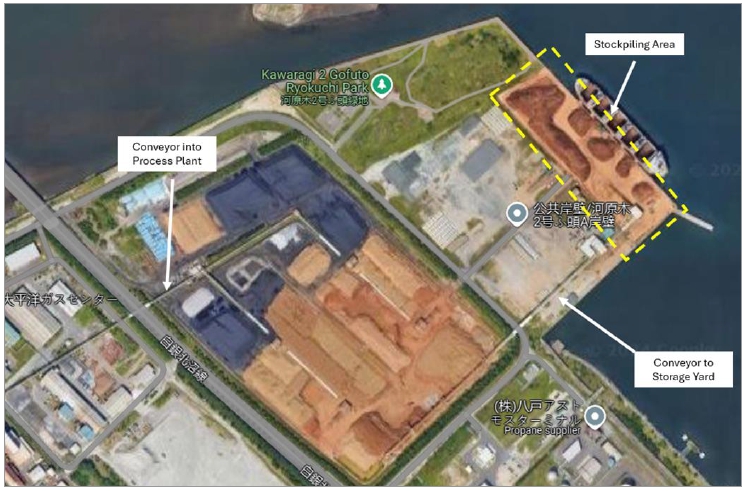
Once conveyed into the plant, the nodules will be stockpiled in a designated storage area before being conveyed into PAMCO’s Rotary Kiln #6.
| 15.2.2.1 | PAMCO RKEF Plant |
PAMCO’s primary facility in Hachinohe is a ferronickel processing operation that employs three rotary kilns and three electric furnaces. Table 15.1 below summarizes key data for each unit operation.
| Table 15.1 | Key Data for PAMCO’s core unit operations at the hachinohe site |
| PAMCO Nomenclature | Key Sizing Data | Notes |
| No. 2 Rotary Kiln | Diameter – 5.25 m Length – 110 m |
|
| No. 3 Rotary Kiln | Diameter – 5.5 m Length – 118 m |
|
| No. 6 Rotary Kiln | Diameter – 5.5 m Length – 131 m |
Designated for TMC use |
| No. 6 Smelting Furnace | 60,000 kVA | |
| No. 7 Smelting Furnace | 70,000 kVA | |
| No. 8 Smelting Furnace | 80,000 kVA | Designated for TMC use |
| amcconsultants.com | 334 |
| Technical Report Summary of Prefeasibility Study of NORI Area D, Clarion Clipperton Zone | |
| TMC the metals company Inc. | 0225054 |
PAMCO plans to treat TMC’s nodules as follows. Once conveyed into the plant, the nodules will be stockpiled in a closed storage facility. The nodules will be conveyed into PAMCO’s Rotary Kiln #6. Figure 15.3 below shows nodules being conveyed into the kiln during TMC’s commercial scale testing of the process in 2024.
| Figure 15.3 | Nodules are fed into the PAMCO kiln through a conveying system |
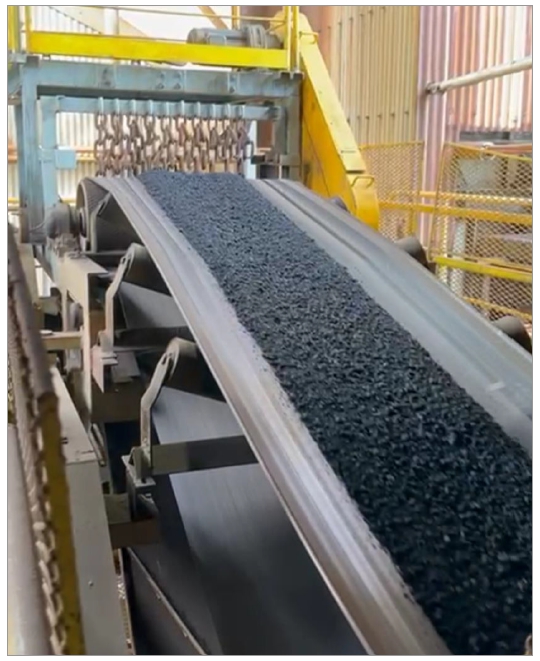
Source: NORI
| amcconsultants.com | 335 |
| Technical Report Summary of Prefeasibility Study of NORI Area D, Clarion Clipperton Zone | |
| TMC the metals company Inc. | 0225054 |
The purpose of the kiln in this process is primarily to remove any inherent free moisture and eliminate the loss-on-ignition (LOI) component in the nodules by decomposing hydroxide minerals. Some degree of reduction also occurs. The nodules discharge at high temperature, transferring the latent heat to the furnace for energy efficiency. Coal is used as a heat source for the kiln and silica is also added as a means to control the slag chemistry later in the process. The kiln operates under counter-current flow, meaning the nodules move in the opposite direction to the gas emanating from the heat source, thereby slowly increasing the temperature of the nodules while lowering the temperature of the gases as they move through the unit in an energy efficient manner. Figure 15.4 shows PAMCO’s #6 rotary kiln that will be used in TMC’s preliminary commercial operations.
| Figure 15.4 | PAMCO’s #6 kiln |
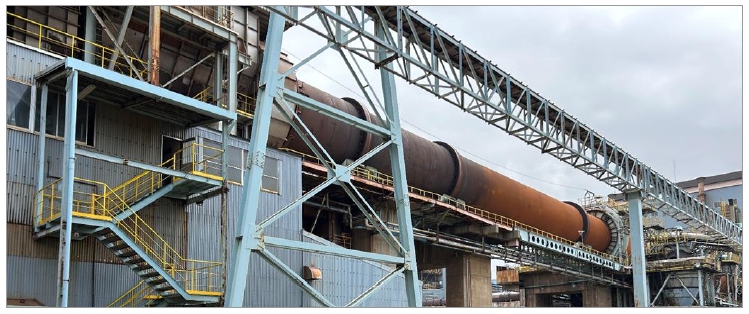
Source: TMC, flow of nodules is left to right in the image
At the kiln exit, the now partially reduced (calcined) nodules are transferred into refractory lined calcine transfer bins as a means of transport into the electric furnace while retaining heat and avoiding oxidation. Calcine is fed into the furnace including the residual carbon in the calcine coming from the kiln, present to complete the reduction process.
The process inside the furnace creates two distinct layers. The bottom, more-dense phase is a metallic alloy containing the nickel, copper, cobalt and iron. The top manganese silicate phase is intended to be sold to silico-manganese producers for use in steel production. Coke and flux are added in the furnace to control the deportment of these minerals to their respective phases, maximizing recoveries.
The furnace is tapped through separate tapholes at different elevations to remove the two layers. The manganese silicate layer is tapped frequently as it represents about 90% of the volume being produced from the process. It is tapped into pits for solidification and cooling, reclaimed, then is crushed and screened to the desired customer size before being sold. Figure 15.5 shows the slag casting area at PAMCO, where it is placed after tapping to cool and solidify before sizing, packaging and shipment to the customer.
| amcconsultants.com | 336 |
| Technical Report Summary of Prefeasibility Study of NORI Area D, Clarion Clipperton Zone | |
| TMC the metals company Inc. | 0225054 |
| Figure 15.5 | PAMCO’s slag storage area: slag is left to cool and organized before shipment |
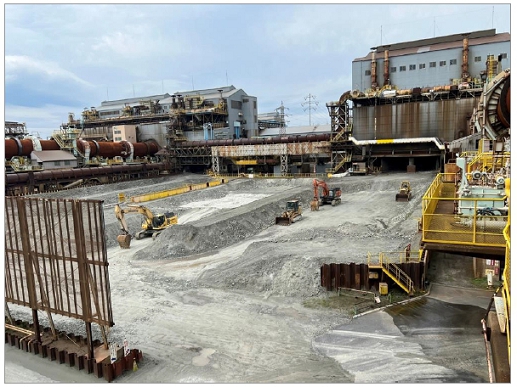
Source: NORI.
The alloy phase is tapped periodically into moulds. Preparation of alloy for sale is dependent on the customer, but preliminary discussions include shotting or creating ingots before distribution. Figure 15.6 shows tapped alloy during the commissioning smelting trial in January 2024.
| Figure 15.6 | Molten alloy tapped into moulds at PAMCO |
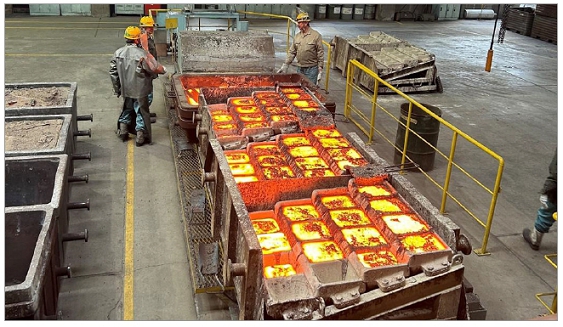
Source: NORI
| amcconsultants.com | 337 |
| Technical Report Summary of Prefeasibility Study of NORI Area D, Clarion Clipperton Zone | |
| TMC the metals company Inc. | 0225054 |
| 15.2.3 | PAMCO MOU |
DGE and PAMCO signed a binding MOU in November 2023. The agreement requires PAMCO, with the assistance and cooperation of TMC, to complete a Definitive Study to understand modifications required to their Hachinohe plant to process TMC’s nodules. This binding MOU explicitly states that while the contained clauses are legally binding, there is no legal requirement by the parties to execute a Definitive Tolling Agreement.
The study required by PAMCO under this agreement pertains mainly to the alloy production option. The scope of work to be completed as part of this agreement is as follows:
| · | Tests and studies: Includes further testing on areas of particular interest as identified in the non-binding MOU, such as refractory wear. | |
| · | Consideration of equipment additions and modifications. | |
| · | Design of facilities to be added or modified. | |
| · | Cooperation with and approval from Japanese government to pursue additions and modifications. | |
| · | Feasibility study to process 1.3 Mwmtpa of nodules through the facility. | |
| · | PAMCO decision on whether to enter into negotiations on a Definitive Agreement. | |
| · | If the investment is endorsed, subsequent construction, ramp-up and stable operations. |
The schedule also accounts for a pre-feasibility study around the matte generation option, involving the installation of a converter aisle and subsequent new tolling arrangement negotiations.
| 15.2.4 | Basis for tolling fee |
The tolling fee
encompasses several components that consider all costs that apply in processing of a raw material. Some examples of these costs include
consumables, labour, capital costs (plant modification costs), depreciation of plant assets and equipment, and product
market fluctuations.
The Binding MOU between DGE and PAMCO has a base equation that is used to define the tolling charge, as outlined in the below equation:

Where:
| · | A is the Standard Absolute Value. | |
| · | B is the Tolling Fee Modification Factor. | |
| · | C is the Fixed Capital Plant Fee. | |
| · | D is the agreed PAMCO Profit Margin. |
The Standard Absolute Value considers different costs to the Tolling Fee Modification Factor. Per the MOU, the Standard Absolute Value has the following cost variables as inputs:
| · | Unloading of raw materials. | |
| · | Water usage in dechlorination (before the nodules are fed into the RKEF). | |
| · | Secondary raw materials that may be added during processing at any stage. | |
| · | Liquid natural gas required for calcining. | |
| · | Consumables for smelting. | |
| · | Contractors. | |
| · | Fixed equipment costs. |
| amcconsultants.com | 338 |
| Technical Report Summary of Prefeasibility Study of NORI Area D, Clarion Clipperton Zone | |
| TMC the metals company Inc. | 0225054 |
The Tolling Fee Modification Factor considers fuel (specifically fuel oil, coal, kerosene) and electricity usage throughout processing.
While the capital expenditure required for PAMCO to incur before operations begin is still under development, a rough estimate was used for the MOU. The calculation involves a 5-year depreciation period. The fee is calculated simply as:

The first year of operation (and therefore payments by TMC to PAMCO) will use an agreed upon annual tonnage for this calculation. The Fixed Plant Capital Fee will be reviewed on an annual basis to reconcile on any under or over payment based on actual nodule volume processed against that which is due against the 5-year amortization schedule.
The profit margin for PAMCO has not been agreed upon between TMC and PAMCO. For the purposes of the MOU, the 15% of the sum of the costs in the above prior sections was used. This margin is not legally binding and was simply used as a factor for tolling fee estimates as outlined in the Binding MOU.
A payment program has been put in place between the two parties to ensure that product volumes and quality specifications are being met. In TMC’s financial modelling, estimates of product generated per annum and product quality (to feed into sale price of the products) are key inputs in realizing the economic value of the project. It is important that PAMCO is producing at a rate and quality that meets TMC’s standards. Thus, a bonus incentive can be provided should expectations be exceeded, and a malus payment (for delivery below expectations) made by PAMCO to TMC.
The factors that influence this program and feed into calculations to determine whether targets are being exceeded or met are:
| · | The receiving grade of nodules (sampled at an agreed upon frequency). | |
| · | Nodule quantity before smelting. | |
| · | Moisture content of material before smelting. | |
| · | Alloy production volumes. | |
| · | Grade of nickel, copper and cobalt within the alloy. |
The addition of this factor into financial considerations between the parties is important as it allows for PAMCO to share additional profits should expectations be exceeded, but it also mitigates some risk and protects TMC should adequate quality feed be provided but product volume and quantity be insufficient relative to previously agreed upon targets.
| 15.2.5 | Alloy to matte |
PAMCO’s existing operation in Hachinohe presently does not include any converting equipment or associated systems. Therefore, the initial nickel containing product being generated at PAMCO will be an iron-rich nickel-copper-cobalt alloy. The converting equipment will conceptually remove the iron through oxygen addition while also adding sulfur, creating a nickel-copper-cobalt matte containing about 5% iron.
A market study commissioned by NORI performed by CRU Consulting identified that the alloy is a less attractive product than the matte. Therefore, PAMCO has agreed to execute a study into the design and installation of a converter aisle containing multiple Peirce-Smith converters. Figure 15.7 shows a schematic layout of PAMCO’s facility and equipment and denotes the proposed location of the converter aisle within the facility.
| amcconsultants.com | 339 |
| Technical Report Summary of Prefeasibility Study of NORI Area D, Clarion Clipperton Zone | |
| TMC the metals company Inc. | 0225054 |
| Figure 15.7 | PAMCO facility layout with potential location of converter aisle |
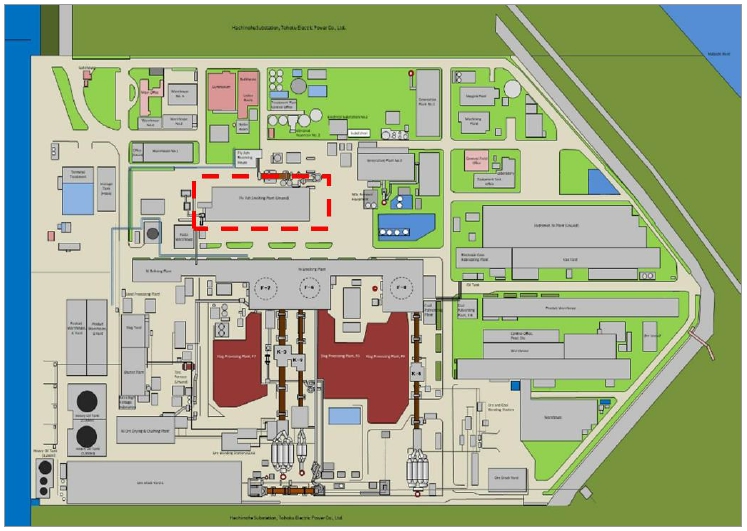
Source: NORI, not to scale. Note: red box shows potential location of converter aisle
Per the binding MOU between DGE and PAMCO, there will be two different tolling agreements that will be negotiated between the DGE and PAMCO at different stages of operations. An initial tolling arrangement for alloy generation will be in place until PAMCO makes an investment decision on installing a converter aisle at their facility (expected to be within 18 months of first alloy production). Should they decide to proceed, a second tolling arrangement (assumed to be structurally the same as the agreement for alloy production) will be negotiated that will have the capital scope execution by PAMCO as a consideration for a newly agreed-upon arrangement. The higher value of product being generated will also contribute to the new tolling arrangement.
| amcconsultants.com | 340 |
| Technical Report Summary of Prefeasibility Study of NORI Area D, Clarion Clipperton Zone | |
| TMC the metals company Inc. | 0225054 |
| 15.2.6 | Product quality specifications |
DGE and PAMCO have agreed within the Binding MOU for specific pay metal targets for alloy to be met to achieve product quality specifications. Table 15.2 below shows these grades.
| Table 15.2 | Agreed upon grades of key pay metals for the alloy as set in the Binding MOU between TMC and PAMCO. |
| Component | Grade (wt %) |
| Nickel (Ni) | 15 to 16 |
| Copper (Cu) | 12.5 |
| Cobalt (Co) | 1.50 |
| Iron (Fe) | 60 to 65 |
| Manganese (Mn) | 2 to 4 |
| Zinc (Zn) | 0.2 |
| Molybdenum (Mo) | 0.8 |
DGE and PAMCO have also agreed on target parameters for the manganese silicate product in the Binding MOU, which are shown below in Table 15.3.
| Table 15.3 | Specification for the manganese silicate product generated at PAMCO per the Binding MOU between TMC and PAMCO |
| Parameter | Units | Specification |
| Mn Composition | wt % | > 40 |
| Fe Composition | wt % | 1 to 2 |
| Cr Composition | wt % | < 0.1 |
| S Composition | wt % | < 0.3 |
| MnO:SiO2 Ratio | – | 2.25 to 2.6 |
| Mn:P Ratio | – | > 670 |
The Definitive Tolling Agreement is anticipated to include a more extensive product quality specification for both the intermediate alloy and the manganese silicate. In addition to pay metal grades, the Definitive Agreement will reference other elements that will be of material interest by TMC’s potential customers.
There is a target of 5% iron in the final matte. This value was determined as it allowed for manageable levels of iron being introduced into the refinery while not sacrificing recoveries of key pay metals. The iron in matte is subject to change dependent on customer negotiations.
The process to determine product quality as defined in the MOU is as follows:
| · | Definitive sampling will be supervised by a third party and samples are to be delivered to both parties. |
| · | Subject to finalization of agreed upon sampling protocol, final weights, moisture determination and assays will be completed at PAMCO location. |
| · | Both parties will develop an effective metallurgical accounting sampling protocol for each monthly throughput for the final determination of nickel, copper, cobalt and manganese recoveries to determine the Recovery Incentive Bonus Payment and Recovery Non-Performance Penalty Payment. |
| · | Multiple assays of a single sample will be conducted by both PAMCO and TMC, with the mean of the respective assays being used to govern activities. |
| · | The difference between the TMC and PAMCO assays (mean assays per above) cannot exceed: |
| ― | ± 0.05% for Ni |
| ― | ± 0.05% for Cu |
| ― | ± 0.01% for Co |
| ― | TBD for Mn |
| amcconsultants.com | 341 |
| Technical Report Summary of Prefeasibility Study of NORI Area D, Clarion Clipperton Zone | |
| TMC the metals company Inc. | 0225054 |
| · | Should the difference be outside of these splitting limits, a third party that is mutually agreed upon by the parties will perform umpire analysis using a sample taken by PAMCO. | |
| · | If the analysis done by the umpire is between the results of the TMC and PAMCO analyses, or is consistent with the result of either party, that result shall be the conclusive result. | |
| · | If the umpire’s analysis is not between the results of the TMC and PAMCO analyses, or is not consistent with either, then the exact mean of the umpire result and the nearest assay result that is conducted by either TMC or PAMCO will be deemed to be the conclusive result. |
| 15.2.7 | PAMCO Sustainability |
PAMCO emphasizes sustainability through its Environmental, Social, and Governance (ESG) initiatives, aiming to reduce greenhouse gas emissions by 46% by 2030 and achieve carbon neutrality by 2050, in alignment with the UN Sustainable Development Goals (SDGs). The company actively recycles waste from its operations, promotes health and safety among employees in accordance with ISO 45001 standards, and engages in community programming, reflecting a commitment to social responsibility and environmental stewardship.
| 15.3 | Long-Term Processing Strategy |
| 15.3.1 | Nodule Processing Beyond 1.3 Mwmtpa |
The capacity at PAMCO will not be sufficient to toll the 12 million tonne per annum full scale collection capacity. TMC actively investigated options for processing of nodules beyond the initial 1.3 Mwmtpa. Primary processing infrastructure (RKEF facilities) exists globally. Figure 15.8 shows a map of RKEF facility distribution worldwide, compiled by Hatch with data supplied by Wood Mackenzie.
| Figure 15.8 | Total 2023 production capacity for ferronickel and nickel pig iron smelting, and number of existing smelting facilities by country |
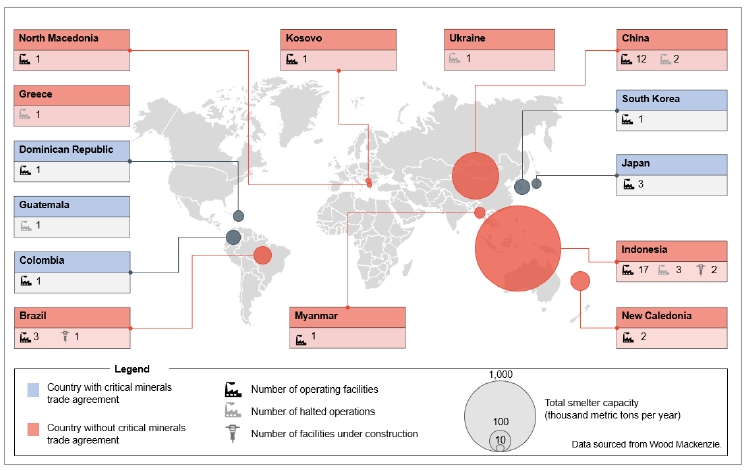
| amcconsultants.com | 342 |
| Technical Report Summary of Prefeasibility Study of NORI Area D, Clarion Clipperton Zone | |
| TMC the metals company Inc. | 0225054 |
As shown in Figure 15.8, the biggest opportunity for expansion of onshore capacity beyond PAMCO is in Indonesia.
In the past seven years, Indonesia has experienced a dramatic expansion in rotary kiln-electric furnace (RKEF) processing capacity, emerging as the world’s leading nickel producer and processor. Following the 2014 ban on raw ore exports which was finalised in 2020, the nation initiated an aggressive downstream policy, prompting a surge in investments—primarily from Chinese firms—in onshore smelters and associated infrastructure. The number of operational nickel smelters rose from 13 in 2019 to over 100 lines by 2025, with total installed RKEF capacity exceeding 260 million tonnes of wet ore per annum with additional projects under construction (Figure 15..9). This rapid growth has made Indonesia responsible for over 60% of global nickel production, solidifying its strategic importance within the steel, electric vehicle battery, and stainless steel industries.
The proliferation of RKEF smelters has considerably increased demand for high-grade saprolite ore (typically >1.5% Ni). However, ore supply growth has not matched the pace of smelter build-out. High rainfall—particularly on Sulawesi and Halmahera—has hampered mine operations, and new Indonesian Government RKAB regulatory quota requirements have further constrained availability, encouraging increasing ore imports from the Philippines (Figure 15..9). Premiums for high-grade saprolite have persisted amid supply tightness, with market participants reporting record tender prices for 1.6% Ni ore in 2025 (SMM Weekly Review of Nickel Ore Market June 06, 2025).
| Figure 15..9 | Rapid increase in Indonesian laterite ore demand, decreasing saprolite ore grades and increased ore imports from the Philippines. |
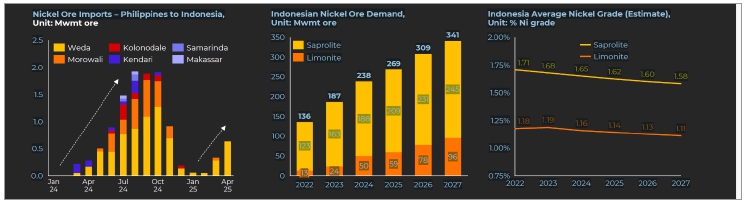
Source: Benchmark Minerals Intelligence.
The push to maximize throughput has led to declining average nickel grades in the ore feed for many RKEF facilities (). Ore blending and longer haulages from more remote or lower-quality deposits are increasingly necessary to maintain plant utilization, further deteriorating grade profiles. These lower grades directly impact smelter economics via increased energy consumption and reduced nickel output per tonne processed, exacerbating operational cost pressures. The Indonesian Mining Ministry estimates that laterite reserves total around 5.3 billion tonnes and the Indonesia Nickel Miners Association projected that the country’s high-grade ore reserves may be depleted in the next six years (Reuters, 2024) (Subarna, 2024).
The supply-demand imbalance, combined with global oversupply and weak stainless steel and EV demand, has resulted in a sustained decline in nickel prices since 2023 (see section 16.3.1.4). As prices have approached multi-year lows, a significant portion of Indonesia’s RKEF operations—especially those with outdated technology or high reliance on market-bought high-grade saprolite—have become loss-making (The Star, 2025). Industry insiders report delayed payments to suppliers and plant curtailments, with risks of further closures unless prices or input costs recover. The margin squeeze is compounded by persistent operational challenges, such as rising fuel costs and environmental compliance expenses.
| amcconsultants.com | 343 |
| Technical Report Summary of Prefeasibility Study of NORI Area D, Clarion Clipperton Zone | |
| TMC the metals company Inc. | 0225054 |
Looking ahead, Indonesia’s established RKEF infrastructure is well-suited for adapting to alternative feedstocks, notably polymetallic nodules from deep-sea sources. Recent developments, such as the TMC-PAMCO arrangement in Japan, have demonstrated the technical viability of processing nodules containing nickel, copper, cobalt, and manganese in RKEF lines with minimal plant modifications. The partnership’s success in pilot and feasibility phases—producing battery-grade nickel-copper-cobalt alloy and manganese silicate—offers a model Indonesia could readily emulate, leveraging its processing capacity to diversify beyond terrestrial ores and access new revenue streams from the growing battery metals market.
TMC has engaged in discussions with key Indonesian processing counter-parties and entered into a non-binding MOU with a major processor who has indicated the potential to process in excess of the capacity considered in this pre-feasibility study.
PT Gunbuster Nickel Industries provides an example of potential assets that could become available for toll treatment. The plant was established in 2021, with a nameplate capacity of 1.8 million tons of NPI per year with the capacity to process 21 Mwmtpa of laterite ore and representing about 9% of Indonesian refined nickel capacity. The facility owner Jiangsu Delong Nickel Industry has entered bankruptcy, caused by weak nickel prices and ore supply constraints and is currently only operating at 30% of capacity (Bloomberg News, 2025). Experts suggest that a government-backed or national consortium acquisition could ensure operational continuity, advance environmental and labor standards, and further Indonesia’s ambitions in nickel value addition and battery manufacturing, especially if aligned with domestic partners such as MIND ID or Indonesia Battery Corporation (Celios, 2025).
| 15.3.2 | Indonesian processing cost benchmarking |
To establish a cost basis for the future cost of processing through existing capacity in Indonesia, TMC USA engaged Shanghai Metal Markets (SMM) to benchmark costs of these operations and opine on tolling rates required to
incentivize nodules processing on this basis. The benchmarking exercise was done on a laterite ore basis with the inherent assumption that the processing costs of nodules are the same on a dry basis (nodules have lower water content). PAMCO work to date has concluded that nodule processing consumes less power than laterite ores and has similar or potentially less cost in comparison to laterite ore processing.
Shanghai Metals Market (SMM) is a credible and well-established source for benchmarking RKEF processing costs in Indonesia. They provide detailed cost analysis comparing Indonesian and Chinese RKEF operations, publish an Indonesia NPI FOB price index, and offer real-time tracking of nickel ore quotas (RKAB) that affect feedstock availability and smelter economics. SMM also delivers in-depth consulting and strategic procurement reports, backed by direct project-level intelligence and extensive market data, making them a reliable authority on cost structures and operational dynamics in the Indonesian nickel smelting sector. SMM teams are based in Indonesia and frequently visit the relevant operations.
The benchmarking of the NPI processing costs was conducted through direct interviews, data and information processing, analysis as well as employing information already in SMM’s extensive in-house database.
| amcconsultants.com | 344 |
| Technical Report Summary of Prefeasibility Study of NORI Area D, Clarion Clipperton Zone | |
| TMC the metals company Inc. | 0225054 |
A summary of the benchmarked costs derived from SMM source data is included in Table 15.4.
| Table 15.4 | Total Indonesian processing cost |
| Large RKEF 1 | Large RKEF 2 | Large RKEF 3 | Average | Ore Equivalent | |
| $/t Ni | $/t Ni | $/t Ni | $/t Ni | $/wt ore | |
| Power | 1,700 | 1,722 | 1,946 | 1,789 | 16.85 |
| Coke | 689 | 668 | 1,021 | 793 | 7.47 |
| Coal | 931 | 917 | 1,135 | 995 | 9.37 |
| Other Materials | 372 | 367 | 443 | 394 | 3.71 |
| Labor & Management | 1,203 | 1,203 | 1,253 | 1,220 | 11.49 |
| Environmental | 100 | 119 | 104 | 108 | 1.01 |
| Depreciation | 671 | 602 | 817 | 697 | 6.56 |
| Others | 300 | 269 | 323 | 297 | 2.80 |
| Alloy to Matte | 685 | 6.45 | |||
| Capital Modification Recovery | 3.85 | ||||
| Toll Profit (10%) | 6.57 | ||||
| Contingency (5%) | 3.81 | ||||
| Total | 5,966 | 5,866 | 7,043 | 6,977 | 79.95 |
The key cost components are the cost of power at $0.06 per kWh and coal at $176 per tonne. The capital modification recovery cost assumed $50 M, depreciated over 10 years at a production rate of 1.3 Mtpa.
On this basis, a tolling rate of $80/wet tonne has been used as a cost basis for nodule processing in Indonesia.
| 15.3.3 | Further processing of nodules in the United States |
Existing capacity to process and refine nodules does not currently exist in the United States, and this has informed TMC’s strategy to use PAMCO and Indonesia to generate matte. In early years of operation, the matte will be sold to customers who will then process in their existing refineries. Beginning in Year 6 of operations, TMC USA intends to begin processing matte at a newly built US-based refinery. The refining facility will produce nickel sulfate, cobalt sulfate, copper cathode, and ammonium sulfate.
TMC recently completed a study evaluating possible refinery site locations in the U.S. The study also included a preliminary refinery design, plant layout, permitting and construction execution schedule schedules and 2025 basis capital and operating costs. The site options focussed on the Gulf region with a final recommendation for locations in Texas near existing ports.
The study identified that a refinery to process the matte from 6.4 Mwmtpa of nodules could be operational within 5 to 6 years in support of TMC’s timing requirements. In Year 6, this volume of matte generated in Indonesia will be sent to the new refinery while the remainder is sold to the market. By Year 10, 100% of generated matte will be processed in the United States.
| 15.4 | Production Plan |
Disclaimer: References to metallurgical processing in Japan, the United States or elsewhere are forward-looking in nature. No final processing agreement has been executed, and no permits have been obtained in any jurisdiction. Processing plans are contingent on future commercial arrangements and regulatory approvals, including any permit under the U.S. Deep Seabed Hard Mineral Resources Act (DSHMRA), which has not been issued.
The production plan is structured to align and balance the offshore collection capabilities, the installation of converting equipment at PAMCO, expansion into Indonesia and the eventual construction of the refinery in the United States. There will be an overlap period of approximately one year where both alloy and matte are being generated at PAMCO. At this time, PAMCO will already have stable alloy production while commissioning of the newly installed converter aisle takes place. The intention of TMC USA is to cease alloy production when stable matte production is achieved. Table 15.5 below shows the updated production plan through 2049, and this also serves as a basis for the Marketing and Economics sections of this PFS.
| amcconsultants.com | 345 |
| Technical Report Summary of Prefeasibility Study of NORI Area D, Clarion Clipperton Zone | |
| TMC the metals company Inc. | 0225054 |
| Table 15.5 | TMC USA PFS production plan, updated July 2025 |
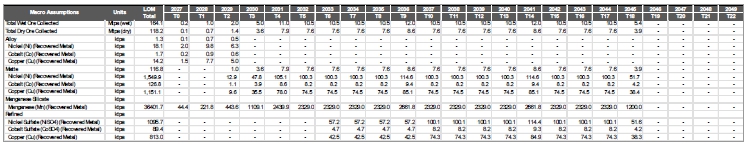
As explained in Section 15.3, not all of this production will happen at PAMCO as additional tolling opportunities are actively being explored by TMC USA in Indonesia. These future tolling scenarios involve prospective plants that have converting technology, and therefore would begin producing matte immediately upon receipt of nodules and commencement of the tolling arrangement between TMC USA and the party. Thus, the production plan considers 100% matte production following the converter aisle installation at PAMCO. Scheduled maintenance and shutdowns of both offshore technology and onshore facilities are considered in the production plan, as nodule delivery volumes will be affected by these periods.
| amcconsultants.com | 346 |
| Technical Report Summary of Prefeasibility Study of NORI Area D, Clarion Clipperton Zone | |
| TMC the metals company Inc. | 0225054 |
| 16 | Market studies |
| 16.1 | TMC offtake agreement |
On 25 May 2012, DeepGreen Engineering Pte. Ltd. (DGE) (a wholly owned subsidiary of TMC) and Glencore International AG (Glencore) entered into a copper off-take agreement and a nickel off-take agreement whereby DGE agreed to deliver to Glencore 50% of the annual quantity of copper material and 50% of the annual quantity of nickel material produced by DGE owned and operated facilities fed by ore from the NORI project area.
The pricing mechanism was agreed as follows:
| · | For London Metals Exchange (LME) Registered Grade "A" Copper Cathodes, the delivered price is the official LME Copper Grade "A" Cash Settlement quotation as published in the Metal Bulletin averaged over the month of shipping for the following month at Glencore's choice, plus the official long-term contract premium as announced annually by Codelco, basis cost, insurance and freight (CIF) Main European Ports. |
| · | For LME Registered Primary Nickel, the delivered price is the official LME Primary Nickel Cash Settlement averaged over the month of shipping or the following month at Glencore's choice. For other copper-bearing material and other nickel-bearing material, the parties shall agree a price annually for the forthcoming calendar year on the basis of prevailing market prices for such copper products and such nickel products. |
Both the nickel and copper off-take agreements are for the life of the NORI Area, and either party may terminate the agreement upon a material breach or insolvency of the other party. Glencore may also terminate the agreement by giving 12 months' notice.
| 16.2 | Marketing analysis |
Benchmark Mineral Intelligence (BMI) was contracted by TMC to provide market overviews for three commodities from NORI and TOML areas: nickel, cobalt, and copper (BMI, 2025) and to provide forecasts for the premia/discounts that nickel and cobalt sulfate over nickel metal price forecasts (BMI, 2025).
CRU International Limited (CRU) was commissioned by NORI to examine the marketability and pricing for the three intermediate products that will be produced by TMC USA for the NORI and TOML areas (CRU, 2024):
| · | Nickel-cobalt-copper alloy. | |
| · | Nickel-cobalt-copper matte. | |
| · | Manganese silicate. |
Additionally, CRU was retained to provide manganese ore market forecasts.
Over a five-year horizon, BMI and CRU’s price forecasts are based primarily on supply and demand fundamentals. These are established from detailed bottom-up analysis of supply by individual mine and intermediate product or refined metal producer, and in-depth analysis of demand from individual applications. Both BMI and CRU also consider operating costs and inventories in its forecasts, as well as various other factors where relevant.
For the forecast beyond a five-year horizon, cyclical supply-demand balances become hard to predict. Therefore, the longer term price forecasts are based on the Long Run Marginal Cost (LRMC) concept. That is, that prices in the long term will trend towards, and fluctuate around, the full economic costs (i.e., operating costs including an allowance for a return on capital) of the marginal tonne required to meet long term demand. For example, when prices are above the LRMC, it would be assumed that supply will be added, and prices will subside. Assets selected for the LRMC analysis are a representative sample that are likely to be in production to satisfy future demand. They use the Project Gateway classification system to select projects. It is important to consider where these new assets will be located, how large they will be and what processing technology they will adapt. The composition of future capacity and accompanying demand levels will have a significant impact not just on the LRMC assessment, but also the upside and downside risk associated with that assessment.
| amcconsultants.com | 347 |
| Technical Report Summary of Prefeasibility Study of NORI Area D, Clarion Clipperton Zone | |
| TMC the metals company Inc. | 0225054 |
Two exception to this long-term price forecasting methodology are the cobalt market and copper forecast. Since the majority of cobalt is produced as a by-product of copper or nickel mining, supply is inelastic to the cobalt price, with supply decisions instead more likely to be driven by the market environment for the operations’ main copper or nickel product. This means that the Long Run Marginal Cost concept cannot readily be applied. Instead, estimates refers to historic pricing trends to establish a long-term equilibrium price, taking into account longer term factors, such as the increasing importance of batteries as a cobalt end use, that might result in cobalt prices and product premia differing with historical trends. BMI have completed price forecast out to 2030 based on fundamental supply demand balance. The 2030 price has been projected forward long-term. Copper represents about 17% of total revenue.
| 16.3 | Market outlook |
| 16.3.1 | Nickel |
Nickel is a high-melting-point, silvery-white metal valued for its hardness and resistance to oxidation. Traditionally found with copper, iron, and cobalt, nickel is extracted from two main ore types: sulphide and laterite. Historically, sulphide ores dominated production, but laterite ores, particularly saprolite and limonite types, now predominate due to scarce new sulphide deposits. Laterite ores are commonly processed via rotary kiln electric arc furnaces (RKEF) to produce ferronickel or nickel pig iron (NPI) or high-pressure acid leaching (HPAL) to produce intermediates like mixed hydroxide precipitate (MHP) and mixed sulfide precipitate (MSP). Nickel products are typically classified as Class 1 (high-purity, such as nickel sulfate) and Class 2 (nickel alloy products, such as ferronickel). Nickel is primarily used in stainless steel (65% market share) and increasingly in batteries for electric vehicles (EVs). BMI predict total nickel market demand CAGR of 5.4% and 11.3% growth in nickel demand in lithium ion batteries to 2040.
Global refined nickel production is forecast to grow from 3.6 Mt nickel in 2025 to 4.9 Mt by 2035 (CAGR of 2.95%). Indonesia is projected to drive this growth, increasing from 2.3 Mt nickel in 2025 to 3.3 Mt nickel by 2035 representing about 70% of global production. However, production in other parts of Asia, such as the Philippines, is expected to decline as reserves dwindle. The majority of Indonesian refined nickel output is expected to be in NPI, while China is adding capacity for nickel sulfate production, led by major companies like Huayou Cobalt and CNGR. Indonesian MHP production is expected to more than double from 493 Kt in 2025 to 989 Kt 2029 in with the rapid construction HPAL plants largely by Chinese interests.
Global nickel consumption is projected to grow significantly at a CAGR of 5.4% from 2025-2035, largely due to rising demand for 300-series stainless steel and high-nickel NMC (nickel-manganese-cobalt) cathodes in lithium-ion batteries (LIBs) for the EV sector. Currently, stainless steel represents 65% of total nickel demand, while batteries are expected to constitute 28% of demand by 2035, driven by a 2.4 Mt nickel increase. China, already accounting for over half of global nickel consumption, is anticipated to remain the primary demand driver with a forecasted CAGR of 5.5% from 2022-2035. Indonesia is also emerging as a major consumer, developing domestic industries due to its export ban on laterite ore, leading to significant growth in NPI and stainless-steel production.
| amcconsultants.com | 348 |
| Technical Report Summary of Prefeasibility Study of NORI Area D, Clarion Clipperton Zone | |
| TMC the metals company Inc. | 0225054 |
Nickel supply is expected to slightly exceed demand until 2030, after which production must increase by 0.8 Mt to meet projected 2035 demand. Tight supply pushed prices up in 2020-2022, with the Russia-Ukraine conflict further spiking prices to $100,000/t, prompting market intervention. Rapid expansion of nickel supply from Indonesia has depressed prices to around the current value of $US15,000-15,500 tonne. BMI estimates that 20% of the nickel industry is currently loss making including non-integrated Indonesian and Chinese NPI and FeNi producers. Increasingly challenged access to, lower quality of and increased price of Indonesian laterite ores are expected to apply increased cost pressure on Indonesian RK-EF operations and provide upward nickel price pressure. BMI predict that long-term demand will likely drive prices above $21,000 (2025 US$) by 2032 to provide the inducement price to bring on required additional production to expected supply shortfall at this time.
| 16.3.2 | Cobalt |
Global cobalt reserves, currently at 7.65 Mt, are concentrated in the African copper belt, particularly in the Democratic Republic of Congo (DRC), which provides cobalt as a by-product of copper-cobalt mining. Secondary reserves are found in nickel laterites in countries like Australia, Indonesia, Cuba, and the Philippines, as well as in nickel sulphide deposits in Canada, Russia, and Western Australia. The cobalt value chain involves diverse ore types, processing methods, intermediates, and final products, mainly split between hydrometallurgical and pyrometallurgical routes, ultimately yielding cobalt in forms like metal, chemicals, and other compounds.
The DRC dominates global cobalt production, supplying nearly 75% of mined cobalt, of which 50% is processed in China. Chinese ownership of DRC mines and significant imports make China the main producer of refined cobalt, accounting for 80% of total supply and nearly 90% in cobalt chemicals. Indonesia is an emerging supplier, producing cobalt as a by-product from its growing laterite ore mining sector. By 2030, Indonesia’s share of global cobalt supply is projected to reach 24%. However, the DRC and Indonesia alone are expected to drive 93% of supply growth from 2025 to 2030. BMI forecast that primary cobalt supply will reach 324 kt in 2030, up by 32% compared with projected 2025 levels of 245 kt. But as mines begin to run through reserves and the visibility for new assets into the 2030s is limited, BMI expectation for mine supply is a slight decline into the 2030s, although secondary supply will continue to increase: by 2040, recycled material will account for 36% of total supply, up from 8% in 2024.
Battery production has become the primary end use of cobalt, driven by the rapid expansion of the electric vehicle (EV) market. In 2035, battery demand is expected to account for 84% of overall cobalt demand, up from less than half in 2017. Cobalt demand from the battery sector is anticipated to grow more than 100% between 2024 to 2034, despite decreasing cobalt intensities in batteries. China and Europe currently lead demand growth due to transportation electrification, but North America’s demand is expected to increase substantially, from 17 kt in 2020 to 50 kt in 2035.
BMI expects the cobalt market to remain oversupplied throughout the 2020s, with the market rebalancing in 2032 and shifting to deficit from 2033 onwards. Refined cobalt supply will see strong growth in the short term, driven largely by output from China. However, by 2033, supply is forecast to struggle to keep pace with demand, leading to a projected 46 kt supply gap by 2035. Additional production beyond current forecasts will be required to meet future demand.
Cobalt prices are historically volatile, given that much of the production is a by-product of copper and nickel mining, making supply less responsive to demand. Long-term price estimates from BMI suggest that European cobalt prices will average around $62,500/tonne in $2025 real terms. Cobalt's price inelasticity is due to its low proportion of costs in most applications, where alternatives are limited or costs are passed downstream (such as batteries and pharmaceuticals).
| amcconsultants.com | 349 |
| Technical Report Summary of Prefeasibility Study of NORI Area D, Clarion Clipperton Zone | |
| TMC the metals company Inc. | 0225054 |
| 16.3.3 | Manganese |
Manganese is a critical metal with high chemical reactivity and melting point, essential in steelmaking for its deoxidizing and alloying properties. About 85-90% of current manganese demand is for steel production, including in high-strength low alloy, stainless, and engineered steels. Additionally, manganese is used in aluminium alloys and in chemicals, particularly manganese sulfate for agriculture and battery applications.
Manganese ore production is concentrated in Africa, especially South Africa, Gabon, and Ghana, along with Australia, representing over 75% of global supply. Africa's production is forecast to grow by 722 kt of contained manganese from 2023 to 2028, with significant expansions in Gabon and Ghana. In contrast, China’s production is declining at a 1.7% CAGR due to high costs and declining ore quality. While China leads in global manganese ferroalloy production, declining domestic steel demand is expected to reduce production by 3% CAGR from 2024 to 2028. Other regions, including Asia, CIS, and Europe, will compensate partially, keeping global ferroalloy supply stable.
China, consuming 60% of global manganese ore, is set to reduce its demand by 600 kt through 2028, driven by lower ferroalloy demand. However, demand from other regions is expected to offset this, with a global increase of over 4 Mt of contained Mn forecast by CRU by 2035. Silicomanganese will maintain the largest share of demand (52%), but growth will be highest for Electrolytic Manganese Metal24 (EMM) and battery applications, with projected CAGRs of 10% and 22%, respectively. These segments will constitute 21% of demand by 2035, up from 9% today.
A supply deficit of 3.3 Mt over and above existing mines and committed projects is anticipated by 2035 due to rising demand, particularly for EMM and battery uses. Prices are expected to grow in real terms by 2035, with 44% Mn lump prices reaching $5.50/dmtu25 and 36-39% Mn lump at $4.90/dmtu (both real 2025 US$).
| 16.3.3.1 | EMM and MnSO4 |
While it is expected that most of the Mn silicate product will be sold as feedstock for SiMn alloy production, it is also suitable as a feedstock for EMM and MnSO4 production. Approximately 10% of manganese is processed into Electrolytic Manganese Metal (EMM) and manganese sulfate (MnSO₄), the latter being vital for fertilizers and lithium-ion battery production. Demand for high-purity MnSO₄ monohydrate (HPMSM) is surging due to EV demand, with prices expected to grow alongside EMM costs. By 2035, EMM prices are forecast at $2,110/t and HPMSM at over $2,200/t (both real 2023 US$).
| 16.3.4 | Copper |
Copper is primarily mined as sulfide or oxide ore, with sulfide ores containing 0.3-1.5% copper and oxide ores reaching 4% or higher. Around 80% of copper mining is done via open-pit operations. Oxide ores are processed through solvent extraction-electrowinning (SXEW) to produce high-purity copper cathodes. Sulfide ores undergo flotation, yielding copper concentrate (20-40% copper) for smelting and refining.
24 Electrolytic Manganese Metal (EMM) is a significant alloy component in the production of stainless steel, high-strength low-alloy steel, aluminium-manganese alloy, and copper-manganese alloy. It is also used as a primary ingredient for producing Manganese tetraoxide (Mn3O4) and sulfate (MnSO4).
25 dtmu means dry metric tonne unit. A ‘unit’ is 10 kg, or 1 tonne divided into 100 units. For example, $8/dmtu is equal to $800/tonne of pure manganese metal. This pricing structure is commonly used for manganese ore sales (as opposed to pure manganese metal). A typical manganese ore will grade 45% Manganese so a price per tonne of this ‘impure’ ore will be 45% of $800/tonne = $360/tonne.
| amcconsultants.com | 350 |
| Technical Report Summary of Prefeasibility Study of NORI Area D, Clarion Clipperton Zone | |
| TMC the metals company Inc. | 0225054 |
BMI forecast global copper mine production is forecast to grow from 22.9 Mt in 2025 to 25.6 Mt by 2028, driven by African output, particularly in the DRC (+436 kt) and Zambia (+306 kt). Chile is expected to remain the largest producer with modest 0.4% CAGR from 2025 to 2030 producing around 5.8 Mt in 2030. The DRC, world second largest producer is expected to increase 436 kt to 3.5 Mt, with Peru third increasing 330 kt at a CAGR of 2.4% to 2.9 Mt over the same period. US domestic policy favouring reshoring of industrial production is expected to drive copper production growth by a CAGR of 4.4% to 1.4 Mt for an increase of 275 kt from 2025 to 2030.
Copper demand is projected to rise from 34 Mt in 2025 to 42 Mt by 2035, driven by the transportation, electrical infrastructure and consumer goods sectors. By 2035, green-energy applications like electric vehicles, renewable energy, and storage will account for ~20% of copper demand, up from 4% in 2020. Significant consumption growth is expected in North America, Europe, India, and Southeast Asia, with each region adding 1.1-1.7 Mt of demand.
A 7.9 Mt supply gap is anticipated by 2035, as demand for primary copper surpasses production from current and committed projects. To bridge this gap, the industry will need to advance a significant portion of "Probable" and "Possible" projects over the next decade.
The copper price averaged $9,147/t in 2024 and is currently above $9,800/t this year. With the expected supply gap widening towards the late 2020s, prices are expected to reach $11,126/t by 2029. The long-term price is estimated at $11,456/t (real 2025 US$)
| 16.4 | TMC manganese silicate |
The manganese silicate sourced from NORI Area D presents a unique profile as a feedstock for silico-manganese alloy production, offering high manganese content (42-43%), comparable to high-grade manganese ore or slag, with controlled SiO₂, Al₂O₃, CaO, and MgO levels and Mn in a reduced 2+ valence state. This offers value in use advantages to customers using the Mn silicate product to produce Si-Mn alloy – the largest sector of the Mn market. These attributes position TMC silicate as a competitive material against traditional high-grade slags and ores. However, phosphorus levels from pilot testwork showed variability which is likely to be well controlled in the industrial process at PAMCO. The optimized Mn/Fe ratio of 22:1 and Mn/P ratio above 500:1 are positive market indicators. Additional testing just completed by PAMCO demonstrated the ability to produce Mn silicate with Mn/P ratio greater than 1,000:1 confirming, effective phosphorus control which is critical for broader market acceptance.
Nodule-sourced Mn silicate could also serve as feedstock for EMM, Electrolytic Manganese Dioxide (EMD)26, and HPMSM production due to its MnO form, which simplifies acid solubility without needing roasting. Although current consumption of manganese ore in these chemical sectors is lower than silico-manganese alloy, forecasts suggest growth from 2 Mt in 2023 to 4.8 Mt by 2035, potentially increasing demand for nodule-sourced Mn silicate over time. TMC currently has test work ongoing with Kingston Process Metallurgy in Canada to demonstrate production of battery grade HPMSM from the Mn silicate.
From a value perspective, nodule-sourced Mn silicate is expected to be competitive, aligning closely with the 44% Mn ore benchmark price, provided it is integrated into optimized ore blends. Depending on blend composition, its implied value ranges from $5.18 to $5.406 per dmtu (2023 basis). Key blends with high grade South African ore (Wessels ore) and iron ore are expected to perform comparably to the benchmark, although the value could vary depending on market conditions and processing costs for other feedstocks.
The marketing strategy for nodule-sourced Mn silicate must carefully manage blending practices to ensure its characteristics maximize value. In silico-manganese production, the large volume TMC aims to produce (2.8 Mt Mn content at peak in 2036) could be challenging to place without impacting pricing, especially in a well-supplied manganese market with limited forecasted growth in silico-manganese imports between 2026-2030 with 1.2 Mt of Mn in silicate expected to be produced in 2030.
26 Electrolytic Manganese Dioxide (EMD) is a critical component of the cathode material in modern alkaline, lithium and sodium batteries.
| amcconsultants.com | 351 |
| Technical Report Summary of Prefeasibility Study of NORI Area D, Clarion Clipperton Zone | |
| TMC the metals company Inc. | 0225054 |
| 16.5 | TMC matte |
TMC matte, with composition and characteristics resembling Anglo Converter Matte and Jinchuan Converter Matte, is projected to have high compatibility in refining processes. Key refineries, including Vale Canada, Glencore Nikkelverk, and Jinchuan, collectively account for approximately 85% of spare global refining capacity and are primary candidates for TMC matte processing. CRU expects TMC matte's net value to reach 75% of its gross metal value, contingent on forming long-term partnerships with these facilities.
However, the matte market could become buyer-dominant with growing feedstock supply, possibly pushing payables down to 80% for nickel, 70% for copper, and 60% for cobalt. Establishing stable refinery relationships will enhance payables over time, securing a consistent outlet for NORI matte’s substantial volumes.
CRU estimates a total available refining capacity for TMC matte of about 200 Kt contained Ni per annum. Commencement of TMC Ni refining in the US in 2033 mitigates the risk of increasing matte production exceeding the global matte refining capability.
| 16.6 | TMC alloy |
The TMC alloy, containing nickel, copper, and cobalt, has limited immediate demand in existing supply chains. It may require discounts to establish a market presence, especially in the early years of operation. Potential markets include polymetallic smelter-refinery complexes, laterite converters, and battery recyclers, though each presents logistical and operational challenges. CRU's assessment suggests that small volumes of TMC alloy could be blended with existing feedstocks to mitigate its complex composition, but a delay in PAMCO converter installation would necessitate alternative, large-scale partnerships.
The alloy’s LOM estimated payables are at 65% for nickel, 60% for copper, and 45% for cobalt, which may improve as the market adjusts. However, alloy processing limitations could reduce copper payables if laterite converters lacking copper recovery facilities become primary buyers. Over the forecast period, CRU anticipates TMC alloy’s net value could reach 61% of its gross metal content value as processing familiarity improves.
| 16.7 | Refinery Products |
It is intended TMC US subsidiary TMC USA will construct refining facilities in Texas to produce battery-grade Ni and Co sulfate crystal, copper cathode and fertilizer grade ammonium sulfate. Forecasts for cathode and sulfate prices are included in Table 6.1 based on the forecasts from BMI.
| 16.8 | Revenue forecasts |
Revenue assumptions are outlined in this section
using the forecast data provided by
CRU and BMI.
Table 16.1 outlines the metal price forecast for 2026 onward in 2025 real $US dollars based on the CRU and BMI forecasts outlined above.
| Table 16.1 | Metal and metal sulfate price forecasts 2026 onwards (real US$ 2025) |
| Commodity Pricing – Real | LOM Average | 2028-2032 | 2033-2037 | 2038-2043+ |
| Price - Nickel Class 1 LME (US$/t) | 20,295 | 18,833 | 20,706 | 20,360 |
| Price - Cobalt LME (US$/t) | 56,117 | 34,172 | 53,124 | 62,530 |
| Price - Copper Class 1 LME(US$/t) | 11,440 | 11,317 | 11,456 | 11,456 |
| Price - Manganese (US$/DMTU) | 5.45 | 5.29 | 5.44 | 5.50 |
| Price – Ni Sulphate (Contained Ni basis) | 21,633 | 19,623 | 22,007 | 21,835 |
| Price – Co Sulphate (Contained Co basis) | 55,198 | 31,347 | 51,336 | 62,530 |
Source: CRU,BMI
| amcconsultants.com | 352 |
| Technical Report Summary of Prefeasibility Study of NORI Area D, Clarion Clipperton Zone | |
| TMC the metals company Inc. | 0225054 |
Table 16.2 shows the metallurgical recoveries
used in the revenue estimate as outlined in Section 14.4.3. Table 16.3 outlines the payable factors provided by CRU and outlined
above for nickel-copper-cobalt matte and alloy. Table 16.4 to Table 16.7 provide a forecast of payable metal production in alloy, matte,
sulfates and cathode and Mn silicate respectively, and
Table 16.8 provides the revenue forecast by metal.
| Table 16.2 | Metallurgical recoveries |
| Product | Recovery (%) |
| Alloy – nickel recovery – nodule to alloy | 96.91 |
| Alloy – cobalt recovery – nodule to alloy | 93.06 |
| Alloy – copper recovery – nodule to alloy | 93.55 |
| Matte – nickel recovery – nodule to matte | 94.76 |
| Matte – cobalt recovery – nodule to matte | 77.54 |
| Matte – copper recovery – nodule to matte | 86.43 |
| Sulphate – nickel recovery – nodule to sulfate | 94.60 |
| Sulphate – cobalt recovery – nodule to sulfate | 77.20 |
| Cathode – copper recovery – nodule to cathode | 86.20 |
| Manganese recovery – nodule to Mn Silicate | 98.9 |
Source: TMC, CEA
| Table 16.3 | NiCoCu Alloy/Matte Payable terms percentage of LME benchmark prices |
| Payable Terms | LOM Average | 2027-2031 | 2032-2036 | 2037-2045 |
| Alloy - Payable Terms – Ni | 65% | 65% | 65% | 65% |
| Alloy - Payable Terms – Co | 44% | 42% | 43% | 45% |
| Alloy - Payable Terms – Cu | 60% | 60% | 60% | 60% |
| Matte - Payable Terms – Ni | 80% | 80% | 80% | 80% |
| Matte - Payable Terms – Co | 60% | 60% | 60% | 60% |
| Matte - Payable Terms – Cu | 70% | 70% | 70% | 70% |
Source: CRU
| Table 16.4 | Forecast payable metal production - metal in alloy |
| Metal | LOM Total Kt |
Year 0 2027 | Year 1 2028 | Year 2 2029 | Year 3 2030 | Year 4 2031 |
| Payable Nickel | 11.7 | 1.2 | 6.3 | 4.1 | 0 | 0 |
| Payable Cobalt | 0.8 | 0.1 | 0.4 | 0.3 | 0 | 0 |
| Payable Copper | 8.3 | 0.8 | 4.5 | 3.0 | 0 | 0 |
Source: TMC
| Table 16.5 | Forecast payable metal production - metal in matte |
| Metal | LOM
Total Kt |
Year
0 2027 |
Year
1 2028 |
Year
2 2029 |
Year
3 2030 |
Year
4 2031 |
| Payable Nickel | 361.8 | -- | -- | 10.3 | 38.2 | 84.1 |
| Payable Cobalt | 22.2 | -- | -- | 0.6 | 2.3 | 5.2 |
| Payable Copper | 235.1 | -- | -- | 6.7 | 24.8 | 54.6 |
| Metal | Year
5 2032 |
Year
6 2033 |
Year
7 2034 |
Year
8 2035 |
Year
9 2036 |
Year 10+ 2037+ |
| Payable Nickel | 80.2 | 34.4 | 34.4 | 34.4 | 45.8 | -- |
| Payable Cobalt | 4.9 | 2.1 | 2.1 | 2.1 | 2.8 | -- |
| Payable Copper | 52.1 | 22.3 | 22.3 | 22.3 | 29.8 | -- |
Source: TMC
| amcconsultants.com | 353 |
| Technical Report Summary of Prefeasibility Study of NORI Area D, Clarion Clipperton Zone | |
| TMC the metals company Inc. | 0225054 |
| Table 16.6 | Forecast payable refined metal production - metal in sulfate and cathode |
| Metal | LOM
Total Kt |
Year 0 2027 | Year 1 2028 | Year 2 2029 | Year 3 2030 | Year 4 2031 |
| Payable Nickel in Sulphate | 1,095.7 | -- | -- | -- | -- | -- |
| Payable Cobalt in Sulphate | 89.4 | -- | -- | -- | -- | -- |
| Payable Copper in Cathode | 813.0 | -- | -- | -- | -- | -- |
| Metal | Year
5 2032 |
Year 6 2033 | Year 7 2034 | Year 8 2035 | Year 9 2036 | Year 10+ 2037+ |
| Payable Nickel in Sulphate | -- | 57.2 | 57.2 | 57.2 | 57.2 | 866.9 |
| Payable Cobalt in Sulphate | -- | 4.7 | 4.7 | 4.7 | 4.7 | 70.7 |
| Payable Copper in Cathode | -- | 42.5 | 42.5 | 42.5 | 42.5 | 643.2 |
Source: TMC
| Table 16.7 | Forecast production – Mn in Mn silicate |
| Product | LOM
Total Kt |
Year
0 2027 |
Year
1 2028 |
Year
2 2029 |
Year
3 2030 |
Year
4 2031 |
| Mn in Mn Silicate | 36,401.7 | 44.4 | 221.8 | 443.6 | 1,109.1 | 2,439.9 |
| Product | Year
5 2032 |
Year
6 2033 |
Year
7 2034 |
Year
8 2035 |
Year
9 2036 |
Year 10+ 2037+ |
| Mn in Mn Silicate | 2,329.0 | 2,329.0 | 2,329.0 | 2,329.0 | 2,661.8 | 20,165.0 |
Source: TMC
| Table 16.8 | Revenue Forecast US$ 2025 Real |
| Metal | LOM Total | Year 0 2027 | Year 1 2028 | Year 2 2029 | Year 3 2030 | Year 4 2031 |
| Nickel Revenue | 31,449.5 | 19.4 | 102.2 | 247.0 | 706.8 | 1,647.5 |
| Cobalt Revenue | 6,465.7 | 3.1 | 15.3 | 30.9 | 78.3 | 176.7 |
| Copper Revenue | 12,090.9 | 7.9 | 43.7 | 107.9 | 284.5 | 625.8 |
| Manganese Revenue | 19,856.1 | 23.0 | 115.0 | 231.9 | 584.7 | 1,297.3 |
| Metal | Year
5 2032 |
Year 6 2033 | Year 7 2034 | Year 8 2035 | Year 9 2036 | Year 10+ 2037+ |
| Nickel Revenue | 1,684.9 | 2,031.8 | 1,949.4 | 1,949.4 | 2,182.7 | 18,928.5 |
| Cobalt Revenue | 186.3 | 282.8 | 376.9 | 423.9 | 467.9 | 4,423.6 |
| Copper Revenue | 597.4 | 742.4 | 742.4 | 742.4 | 827.7 | 7,368.9 |
| Manganese Revenue | 1,248.8 | 1,259.2 | 1,269.7 | 1,280.1 | 1,463.0 | 11,083.4 |
Source: TMC
| amcconsultants.com | 354 |
| Technical Report Summary of Prefeasibility Study of NORI Area D, Clarion Clipperton Zone | |
| TMC the metals company Inc. | 0225054 |
| 17 | Environmental studies, permitting, and plans, negotiations, or agreements with local individuals or groups |
This chapter describes the framework for environmental and social approvals for the Project, including current status and forward work plan.
| 17.1 | Permitting process |
| 17.1.1 | Overview of Environmental Regulatory Frameworks under international law and the law of the United States of America |
Exploration and commercial recovery of polymetallic nodules from the seafloor in international waters is administered by the following governing bodies:
| · | International Seabed Authority (ISA) mandated under the United Nations Convention on the Law of the Sea (UNCLOS); and |
| · | National Oceanic and Atmospheric Administration (NOAA) mandated under the laws of the United States of America (U.S.), namely, the Deep Seabed Hard Mineral Resources Act (DSHMRA). |
Disclaimer: As of the effective date of this Report, neither the ISA nor the U.S. National Oceanic and Atmospheric Administration (NOAA) has granted any final approval or exploitation permit for the NORI Area D project. The environmental and permitting pathways described herein remain subject to material uncertainty, and no assurance can be given that required approvals will be obtained on acceptable terms or at all.
| 17.1.1.1 | International Seabed Authority (ISA) |
The ISA is mandated under UNCLOS to organize, regulate, and control all seabed mineral-related activities in areas beyond national jurisdiction (ABNJ) whilst preserving and protecting the marine environment. The area the subject of Nauru Ocean Resources Inc.’s (NORI) exploration contract with the ISA (NORI Contract Area) is located in the ABNJ. Therefore, the ISA is responsible for assessing any Environmental and Social Impact Statements prepared by NORI and for granting the relevant permits in the NORI Contract Area. TMC, through NORI, is currently one of 16 contractors with a license to explore for polymetallic nodules in the Clarion-Clipperton Zone (CCZ) (ref: ISBA/23/C/7, 5 June 2017).
Between 1998 and 2014, the ISA conducted workshops to inform the development of documents to guide contractors on responsible environmental management during the exploration and exploitation phases of mineral development. The ISA held a workshop “Towards an ISA environmental management strategy for the Area” on 20-24 March 2017 in Berlin Germany. The results of the workshop were published as ISA Technical Study 17 (ISA 2017).
The ISA has issued Regulations on Prospecting and Exploration for Polymetallic Nodules (adopted on 13 July 2000, updated on 25 July 2013). The regulations were complemented by the Legal and Technical Commission (LTC) recommendations for the guidance of contractors on assessing the environmental impacts of exploration on marine minerals in the Area (ISBA/25/LTC/6/Rev.1) which were updated on 30 March 2020. The draft exploitation regulations on deep-seabed mining were discussed at the 25th Session of the ISA on 25 February to 1 March 2019 in Kingston, Jamaica. The ISA had declared a target date of 2020 to complete and adopt the exploitation regulations. The ISA missed this target date and was then required to complete and adopt the exploitation regulations by 2023. The ISA again missed this deadline and has set a new target date of 2025 to adopt the exploitation regulations.
| amcconsultants.com | 355 |
| Technical Report Summary of Prefeasibility Study of NORI Area D, Clarion Clipperton Zone | |
| TMC the metals company Inc. | 0225054 |
Although the environmental impact review process has not yet been finalized, the draft exploitation regulations outline the application process and requirements that contractors would need to implement during exploitation activities. All contractors have been made aware that the ISA requires the completion of the Environmental and Social Impact Assessment (ESIA) studies, culminating in an Environmental Impact Statement (EIS), in support of their applications for an exploitation license. Guidance for contractors in terms of what is expected in the EIS has been provided in ISA Technical Study No. 10 (ISA 2012). Further guidance is expected to be provided upon the completion of the draft Standards and Guidelines for exploitation activities. The EIS, along with an Environmental Management System with subordinate Environmental Management and Monitoring Plans (EMMP), are required as part of the application for an exploitation license.
The environmental permitting process has been developed through a consultation program initiated by the ISA in 2013 and includes feedback obtained from multiple stakeholder groups. It includes a series of checks and balances, with reviews being conducted by the LTC and input from independent experts, as required. The recommendations of the LTC will then go before the ISA Council, which will review the information provided and decide whether to approve the license application and, if so, what conditions will be applied.
NORI conducted ESIA studies in accordance with the draft document “International Seabed Authority. (2013). Recommendations for the Guidance of Contractors for the Assessment of the Possible Environmental Impacts Arising from Exploration for Marine Minerals in the Area.”
| 17.1.1.2 | Role of Sponsoring States |
As a sponsoring state, the Republic of Nauru (Nauru) has a responsibility to ensure that NORI’s activities in the Area conform with Part XI of UNCLOS. NORI is regulated by the Nauru Seabed Minerals Authority Act 2024 (Nauru Act), which requires NORI to, amongst other things, “apply the precautionary approach, and employ best environmental practices and best available techniques in accordance with the relevant Rules of the ISA to avoid, mitigate or remedy harmful effects of the Seabed Mineral Activities on the Marine Environment and prevent, reduce and control pollution and other hazards”.
The Nauru Seabed Minerals Authority, established under the Nauru Act, has a number of functions including to, inter alia:
| · | Develop policies and institutional arrangements for the purpose of regulating and monitoring the development of seabed minerals in the NORI Contract Area. |
| · | Develop standards and guidelines for seabed mineral extraction related activities. |
| · | Conduct due diligence enquiries into sponsorship applicants or sponsored parties. |
| · | Assist the ISA in its work to establish, monitor, implement and secure compliance with the rules of the ISA. |
| · | Undertake any advisory, supervisory or enforcement activities in relation to seabed mineral activities or the protection of the marine environment, insofar as this is required in addition to the ISA’s work in order for Nauru to meet its obligations under the UNCLOS as a Sponsoring State. |
| 17.1.1.3 | ISA Regulatory Framework |
The environmental regulatory framework under the ISA primarily comprises relevant provisions of the following documents:
| · | UNCLOS. |
| · | The ISA Exploration Regulations. |
| · | The Draft ISA Exploitation Regulations. |
| · | The Draft ISA Standards and Guidelines. |
| amcconsultants.com | 356 |
| Technical Report Summary of Prefeasibility Study of NORI Area D, Clarion Clipperton Zone | |
| TMC the metals company Inc. | 0225054 |
| · | The Draft ISA EMMP Guidelines. |
| · | The Draft ISA EIS Guideline. |
| 17.1.1.4 | ISA Exploration Regulations |
The ISA has three sets of resource-specific exploration regulations in place, covering the prospecting and exploration for Mineral Resources in the Area:
| · | Polymetallic nodules (ISBA/19/C/17). |
| · | Polymetallic sulphides (ISBA/16/A/12/Rev.1). |
| · | Cobalt-rich ferromanganese crusts (ISBA/18/A/11). |
These regulations are supplemented by a series of recommendations to guide contractors and sponsoring states. The recommendations are issued by the LTC and are periodically updated.
| 17.1.1.5 | Draft ISA Exploitation Regulations |
The ISA has developed draft Exploitation Regulations (ISBA/30/C/CRP.1) which remain under negotiation among ISA Council members.
The purpose, objectives, and requirements of the ISA’s rules, regulations and procedures, including the Exploration Regulations and the draft Exploitation Regulations, outline what NORI is required to submit to the ISA, including on environmental aspects, to obtain approval for the Project.
The primary document that must be prepared and submitted to obtain approval is a Plan of Work. The form of applications and information to accompany a Plan of Work is outlined in Regulation 7 and Annex I of ISBA/30/C/CRP.1.
The Plan of Work components include:
| · | Annex I: |
| ― | Section I – Information concerning the applicant. | |
| ― | Section II – Information relating to the area under application. | |
| ― | Section III – Technical information. | |
| ― | Section IV – Financial information. | |
| ― | Section IV – Undertakings. | |
| ― | Section VI – Previous contracts with the Authority. | |
| ― | Section VII – Attachments. |
| · | Annex II – Mining Workplan. | |
| · | Annex III – Financing Plan. | |
| · | Annex III bis – Scoping Report. | |
| · | Annex IV – Environmental Impact Statement. | |
| · | Annex V – Emergency Response and Contingency Plan. | |
| · | Annex VI – Health and Safety Plan and Maritime Security Plan. | |
| · | Annex VII – Environmental Management and Monitoring Plan. | |
| · | Annex VIII – Closure Plan. |
As the ISA is still formulating standards and guidelines, there is no visibility on any potential secondary or tertiary approvals.
| amcconsultants.com | 357 |
| Technical Report Summary of Prefeasibility Study of NORI Area D, Clarion Clipperton Zone | |
| TMC the metals company Inc. | 0225054 |
If the LTC recommends approval, the Council must approve the proposed application for a Plan of Work unless two-thirds of Council members present and voting, and a majority of the members present and voting in each of the Council’s five chambers, vote to disapprove. Further, if the Council fails to make a decision within 60 days, the Plan of Work is deemed to be approved, unless the Council decides to extend this time period. Figure 17.1 illustrates the approval process commencing with a Plan of Work application.
| Figure 17.1 | Plan of Work approval process |
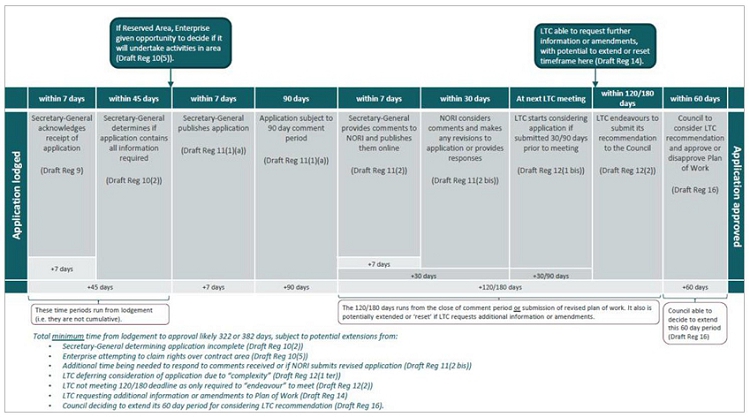
Source: NORI
| 17.1.1.6 | Relevance to the Project |
NORI is a company incorporated in and sponsored by Nauru, which is a signatory to UNCLOS. Consequently, the Project falls within the jurisdiction of the ISA, UNCLOS, and the 1994 Agreement relating to the Implementation of Part XI of UNCLOS (1994 Agreement).
Article 153 of UNCLOS stipulates that a potential contractor seeking to extract minerals from the Area under the ISA regulatory framework may only do so once a Plan of Work is approved and a contract based upon that Plan of Work is signed between the ISA and the applicant. Activities in the Area must then be carried out in accordance with the Plan of Work.
The ISA granted NORI an Exploration Contract for an area of 74,830 km2 in the CCZ on 22 July 2011. The Exploration Contract grants NORI exclusive rights to explore for nodules in NORI Area D (NORI Area D) for an initial term of 15 years (renewable for successive five-year periods), subject to complying with the Exploration Contract terms. This Contract provides NORI with a priority right to apply for an exploitation contract to collect nodules in the same area.
| amcconsultants.com | 358 |
| Technical Report Summary of Prefeasibility Study of NORI Area D, Clarion Clipperton Zone | |
| TMC the metals company Inc. | 0225054 |
| 17.1.1.7 | ISA Compliance Status |
NORI has fulfilled all contractual obligations to date with respect to the Exploration Contract, with zero non-conformances issued by the ISA. Under this contract, NORI is required to submit 5-year work plans which it reports on annually to the ISA through the submission of an annual report. Every 5 years, the ISA reviews the work completed in the past 5 years and then NORI develops and submits a new 5-year work plan. The current work plan is valid until July 2026.
| 17.1.2 | National Oceanic and Atmospheric Administration (NOAA) |
The U.S. is not a State party to UNCLOS and therefore does not accept the ISA’s competence over the Area. The U.S. through its own laws facilitates the issuance of exploration licences and commercial recovery permits for seabed mining activities in ABNJ.
NOAA is the U.S. federal agency responsible for administering DSHMRA, which establishes a U.S. regulatory regime for the exploration and commercial recovery of hard Mineral Resources from the deep seabed in ABNJ. All rules, regulations, and procedures issued by NOAA to regulate the prospecting, exploration, and recovery of seabed minerals under DSHMRA are issued within the legal framework established by the Act and its implementing regulations.
NOAA is currently responsible for reviewing and processing applications for both exploration licenses and commercial recovery permits submitted by U.S. entities. In April 2025, the U.S. President signed an Executive Order establishing a national policy to advance U.S. leadership in seabed mineral exploration and responsible commercial recovery, emphasizing environmental stewardship, supply chain resilience, and interagency coordination. NOAA has issued regulations and guidance under the National Environmental Policy Act (NEPA) and other relevant laws to ensure that environmental impacts are thoroughly assessed prior to the commencement of any marine mineral exploration or extraction activities. These include the NOAA NEPA Procedures Manual (updated in 2020) and the Ocean Exploration Advisory Working Group recommendations, which provide detailed expectations for environmental review and public engagement. Draft regulations concerning deep-sea mining activities within the U.S. Exclusive Economic Zone (EEZ) have been discussed in interagency forums and public consultations, with NOAA emphasizing the need for precautionary approaches and robust scientific data to inform decision-making.
In May 2025, NOAA published draft updates to the provisions of DSHMRA, including proposed revisions to streamline the application process for commercial recovery permits and enhance environmental safeguards. The draft incorporated feedback from interagency consultations, industry stakeholders, and environmental groups, and was published for public comment in the Federal Register. NOAA has indicated its intent to finalize the proposed revisions to DSHMRA by early 2026, in alignment with the Executive Order’s directive to modernize the permitting process and ensure timely access to critical minerals.
Pursuant to DSHMRA and 15 CFR §§971.102 and 971.103, a licensee who submits a timely and complete application for a commercial recovery permit for the same area covered by their exploration license is granted a priority of right over other applicants, provided regulatory requirements are met.
| 17.1.2.1 | NOAA Regulatory Framework |
The environmental regulatory framework and guidance documentation under the U.S. regulatory framework primarily comprises relevant provisions from the following documents:
| · | DSHMRA | |
| · | NEPA | |
| · | United States Clean Water Act (CWA) | |
| · | United States Endangered Species Act of 1973 (ESA) | |
| · | Marine Mammal Protection Act of 1972 (MMPA) | |
| · | Fish and Wildlife Coordination Act (FWCA) | |
| · | Magnuson Fishery Conservation and Management Act of 1976 (MSA) (also referred to as Fishery Conservation and Management Act of 1976) | |
| · | Coastal Zone Management Act of 1972 |
| amcconsultants.com | 359 |
| Technical Report Summary of Prefeasibility Study of NORI Area D, Clarion Clipperton Zone | |
| TMC the metals company Inc. | 0225054 |
| · | Regulation 15 CFR Part 970: Deep Seabed Mining Regulations for Exploration Licenses |
| · | Regulation 15 CFR Part 971: Deep Seabed Mining Regulations for Commercial Recovery Permits |
| · | Deep Seabed Mining Final Technical Guidance Document |
| · | Deep Seabed Mining Final Programmatic Environmental Impact Statement Volume I (PEIS) |
| 17.1.2.1.1. | DSHMRA Regulations for Exploration Licenses |
Regulation 15 CFR Part 970 establishes the requirements for exploration licenses for deep-seabed hard minerals. It is supported by technical guidance documents:
| · | Deep Seabed Mining Final Technical Guidance Document. |
| · | Deep Seabed Mining Final Programmatic Environmental Impact Statement Volume I (PEIS). |
Pursuant to the Regulations, once an application for an exploration license is filed with NOAA, NOAA must first assess whether the application is in full or substantial compliance. NOAA will then undertake consultations with various Federal agencies and publish the application together with a draft EIS (prepared by NOAA) in the Federal Register for public comment.
Once the application is certified by NOAA, NOAA will consider and propose terms, conditions and any necessary restrictions for the exploration license. The proposed terms, conditions and restrictions are notified to the applicant and also published in the Federal Register, together with the draft EIS, for public comment. NOAA will continue consultations with Federal agencies prior to making a final determination on the issuance of an exploration license.
If NOAA decides to grant the exploration license, notice of the issuance of the license will be given to the applicant, together with applicable terms, conditions and any necessary restrictions (including environmental compliance and reporting requirements). NOAA will also publish the issuance of the license, together with the final EIS, in the Federal Register.
| 17.1.2.1.2. | DSHMRA Regulations for Commercial Recovery Permit |
Regulation 15 CFR Part 971 establishes the regulatory requirements for Commercial Recovery Permits.
An Exploration License approval must precede the approval of a Commercial Recovery Permit. When the Commercial Recovery application is considered complete by NOAA, NOAA will undertake consultations with other Federal agencies with statutory responsibilities for activities proposed under the application (e.g., U.S. Environmental Protection Agency). NOAA will also publish the application together with a draft EIS (prepared by NOAA) in the Federal Register for public comment.
Once the application is certified by NOAA, NOAA will consider and propose terms, conditions and any necessary restrictions for the commercial recovery permit. The proposed terms, conditions and restrictions are notified to the applicant and also published in the Federal Register, together with the draft EIS, for public comment. NOAA will continue consultations with Federal agencies prior to making a final determination on the issuance of a commercial recovery permit.
If NOAA decides to grant the commercial recovery permit, notice of the issuance of the permit will be given to the applicant, together with applicable terms, conditions and restrictions (including environmental compliance and reporting requirements). NOAA will also publish the issuance of the permit, together with the final EIS, in the Federal Register.
Figure 17.2 illustrates the approval process commencing with the submission of the Commercial Recovery Permit application.
| amcconsultants.com | 360 |
| Technical Report Summary of Prefeasibility Study of NORI Area D, Clarion Clipperton Zone | |
| TMC the metals company Inc. | 0225054 |
The statute anticipates that NOAA will issue a license or permit within 460 days after receipt of an application, although NOAA can extend the timelines “for good cause shown in writing.” Nothing requires NOAA to take the full time allotted for each of these steps (certification, draft EIS and draft terms, conditions, and restrictions, and publication of final EIS). The statute does, however, require NOAA to provide a minimum 60-day notice and comment period for applications, draft terms, conditions and restrictions, draft EIS, and proposals to issue licenses or permits. This means that the shortest amount of time by which NOAA can provide authorization under the Statute 180 days (Wiley, 2025).
| Figure 17.2 | Commercial Recovery Permit Approval Process |
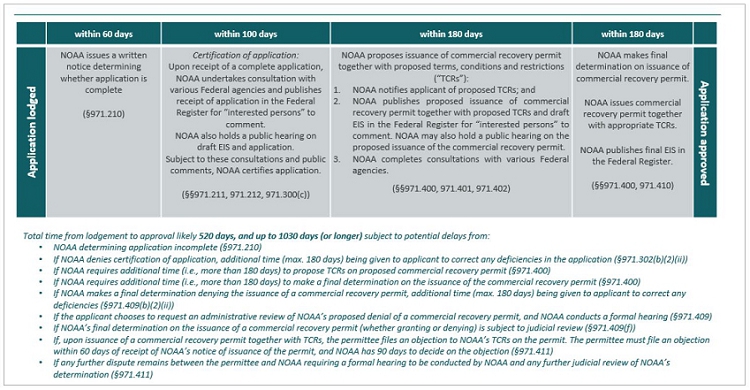
Source: TMC USA
TMC USA has retained Wiley Rein LLP (Wiley), a legal counsel experienced in permitting in the U.S who have been involved in discussions with the U.S. Department of Commerce and more specifically NOAA, regarding the TMC USA applications. Wiley has opined:
“Based on the application date of April 29, 2025, should TMC USA receive an exploration license from NOAA prior to receiving a recovery permit, TMC USA could obtain a recovery permit by October 2027. The governing statute sets forth an expectation that NOAA will reach determinations on applications within 460 days of receipt. Thus, under the existing framework, TMC USA could expect to receive an exploration license in 460 days, i.e., by August 3, 2026, and a recovery permit 460 days later by November 8, 2027. However, given the Executive Order requiring NOAA to expedite the licensing and permitting process, it is unlikely that the agency will take the entire 460 days to reach its decisions on either the license or permit application even under the existing framework. Moreover, the proposed changes to the existing regulations, coupled with the Executive Order, make it possible for TMC USA to receive a recovery permit well before October 2027—possibly by late 2026—given that TMC USA will be able to consolidate its license and permit applications (achieving significant time savings), and given that the Executive Order instructs NOAA to expedite its review of commercial recovery permit applications.” (Wiley, 2025).
| amcconsultants.com | 361 |
| Technical Report Summary of Prefeasibility Study of NORI Area D, Clarion Clipperton Zone | |
| TMC the metals company Inc. | 0225054 |
| 17.1.2.2 | Relevance to the Project |
The Metals Company USA LLC (TMC USA) is a company incorporated in the U.S. The U.S. is not a State party to UNCLOS, and therefore DSHMRA applies to U.S. entities like TMC USA for seabed mineral activities in ABNJ. The Project therefore falls within the scope of the DSHMRA regime. NOAA is the U.S. federal agency tasked with issuing exploration licenses and commercial recovery permits for polymetallic nodules to U.S. entities in ABNJ.
TMC USA has submitted applications for exploration licenses and commercial recovery permits to NOAA under DSHMRA. These applications are summarized below:
| · | Exploration License for the TMC USA-A Area which covers 65,186 km2 in the CCZ. |
| · | Commercial Recovery Permit for TMC USA-A which covers 25,160 km2 in the CCZ. |
A part of TMC USA-A overlaps with the NORI Area D area the subject of NORI’s exploration contract with the ISA.
TMC USA’s applications to NOAA are still under review, and the commencement of commercial recovery activities by TMC USA is subject to NOAA’s approval of the exploration license and commercial recovery permit under DSHMRA.
| 17.1.2.3 | Compliance status |
Executive Order (EO). 14258 directed NOAA, in consultation with the Department of State and the Bureau of Ocean Energy Management (BOEM), to expedite the process for reviewing and issuing exploration licenses and commercial recovery permits under DSHMRA, among other actions. On 29 April 2025, TMC USA submitted applications to NOAA for two exploration licenses and one commercial recovery permit under DSHMRA for areas in the CCZ.
According to the implementing regulations of DSHMRA, NOAA is to make an initial determination as to the compliance and completeness of applications: (i) within 30 days of receipt for exploration license applications (15 C.F.R. §970.209); and (ii) within 60 days of receipt for commercial recovery permit applications (15 C.F.R. §971.210).
If NOAA determines that the applications are incomplete or not compliant, additional time may be given to the applicant to complete the application or bring the application into full compliance: 15 C.F.R. §970.209; 15 C.F.R. §971.210.
| 17.2 | Project approval pathway |
TMC, through their wholly owned subsidiary, NORI, holds an exploration contract with the ISA.
NORI holds exploration rights to four areas with a combined area of 74,830 km2 (NORI Areas A, B, C, and D) in the CCZ that was granted by the ISA in July 2011.
This contract formalize the rights of NORI, including security of tenure with respect to NORI Areas A, B, C and D. Pursuant to the ISA’s Exploration Regulations, NORI has a priority right to apply to the ISA for an exploitation contract to exploit polymetallic nodules in the same area (Regulation 24 (2)).
At the time of writing, the ISA is yet to finalize the Mining Code, including the ISA’s Exploitation Regulations, as required under UNCLOS. The ISA has not met its legal obligation to complete the adoption of the Exploitation Regulations in 2020, 2023 and again in 2025.
Consequently, in April 2025, TMC, through its wholly owned subsidiary TMC USA, submitted applications to NOAA under the U.S. regulatory regime governed by DSHMRA. These applications are summarized below:
| · | Exploration License for the TMC USA-A Area which covers 65,186 km2 in the CCZ |
| · | Commercial Recovery Permit for TMC USA-A which covers 25,160 km2 in the CCZ (referred to as NORI Area D under the ISA regime). |
| amcconsultants.com | 362 |
| Technical Report Summary of Prefeasibility Study of NORI Area D, Clarion Clipperton Zone | |
| TMC the metals company Inc. | 0225054 |
At the time of writing, TMC USA does not hold any exploration licenses or commercial recovery permits issued by NOAA under DSHMRA. However, TMC USA has submitted applications for such rights, and subject to regulatory review and approval, expects commercial recovery activities may be possible in the future pursuant to a permit issued by NOAA.
There is presently no confirmation as to whether, and if so when, TMC USA’s applications will be approved by NOAA, or whether any such approvals will be issued on terms and conditions that are commercially viable for TMC USA or within anticipated timeline.
| 17.3 | Environmental Impact Assessment status |
The status of the environmental assessment is:
| · | Environmental baseline studies completed. |
| · | Test mining and environmental monitoring completed. |
| · | Post-test mining environmental monitoring completed. |
| Figure 17.3 | Status of the NORI Area D the environmental assessment process |
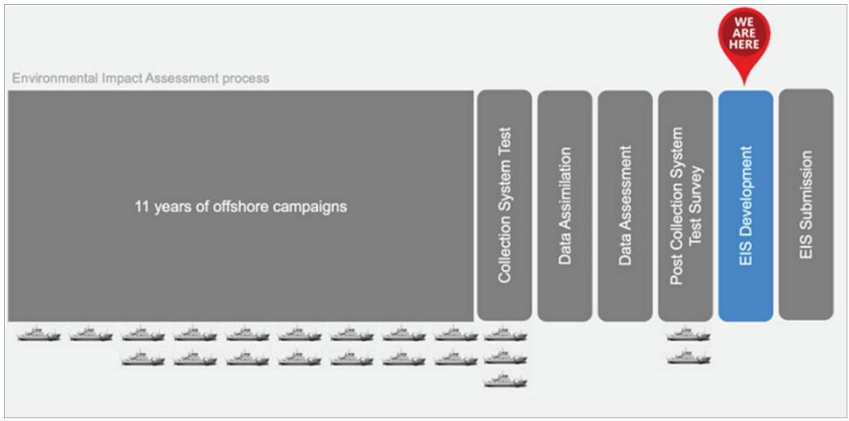
Source: NORI
The completion of these activities, in conjunction with the collection of sufficient bathymetric, geological and geotechnical data, has enabled the project to progress the Environmental Impact Assessment (EIA) and Environmental Impact Statement (EIS). A timeline of activities is provided in Figure 17.4 below.
| amcconsultants.com | 363 |
| Technical Report Summary of Prefeasibility Study of NORI Area D, Clarion Clipperton Zone | |
| TMC the metals company Inc. | 0225054 |
| Figure 17.4 | Data to inform the NORI D Environmental Impact Statement has been collected from 22 offshore campaigns over 12 years |
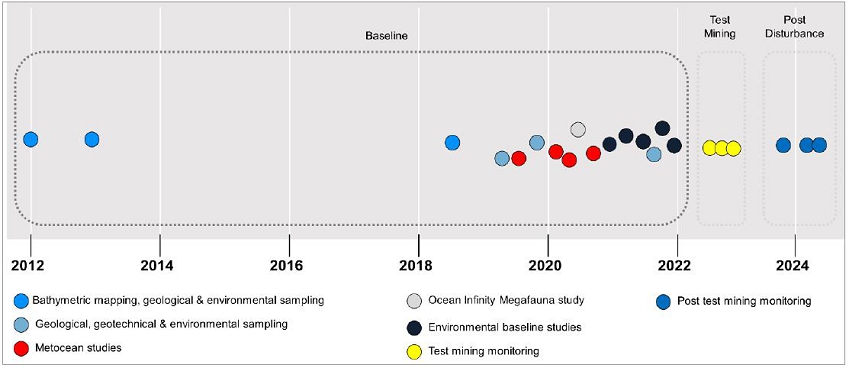
Source: NORI
Using globally recognized research institutions and a highly qualified in-house environmental team, the project has conducted original studies (see Figure 17.5) across the following primary work packages:
| · | Sediment analysis. |
| · | Surface biology. |
| · | Benthic biology. |
| · | Pelagic biology. |
| · | Water quality analysis. |
| · | Collector impact studies. |
| Figure 17.5 | Primary work packages and list of original studies |
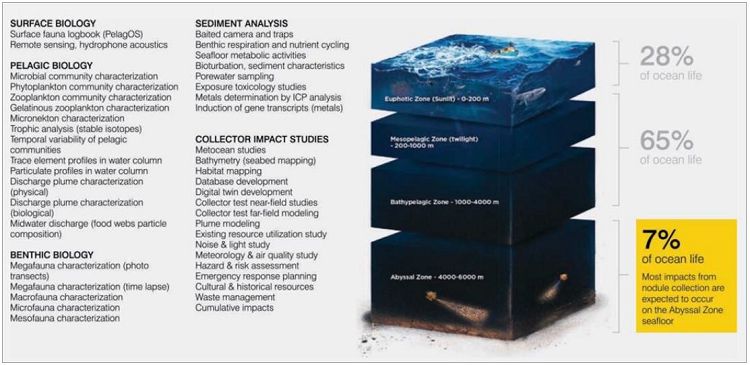
Source: NORI
| amcconsultants.com | 364 |
| Technical Report Summary of Prefeasibility Study of NORI Area D, Clarion Clipperton Zone | |
| TMC the metals company Inc. | 0225054 |
Ongoing support studies that contribute to these work packages include:
| · | Metocean studies. |
| · | Collector test near field data collection. |
| · | Collector test far field data collection. |
| · | Plume modelling. |
| · | Habitat mapping. |
| · | Ecosystem functioning. |
| · | Database development. |
| 17.4 | Environmental Impacts and Mitigation |
The project has identified key potential environmental impact pathways including impacts to: air quality, light, noise, water quality, sediment and pore water composition, nodule removal, biodiversity, habitat quality, ecosystem function disruption and loss of ecosystem services. Through the offshore campaigns, the project has studied the environmental conditions before, during and after the nodule collection process to better understand the environmental impacts of the proposed activities and develop appropriate mitigation measures.
| 17.4.1 | Nodule removal |
Nodules serve as a hard surface habitat to which some sessile invertebrates attach. Nodule collection will permanently remove most nodules and the organisms attached to them.
Mitigation Action: NORI continues to research the long-term distribution of the organisms that live in the seabed sediment and on nodules to understand the overall impact of nodule removal. Some organisms need hard nodule surfaces to sustain their critical life functions, but many others live in the sediment itself. Impact reference zones have been established near the site where Test Mining was conducted in 2022. These zones will not be mined and will be preserved as reference sites for comparing the long-term impacts on biodiversity between mined and unmined areas.
| Figure 17.6 | Qualitative data show individual organisms are present and alive one year following collection test, even right next to the collector tracks |
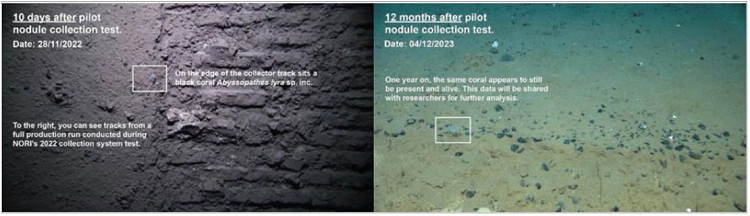
Source: NORI
Mitigations include:
| · | The ISA has set aside 1.97 million km2 of the CCZ as areas of particular environmental interest (APEIs) in which nodule collection will never occur. |
| · | TMC USA will set aside approximately 10% of the contracted areas as additional “no take zones” or preservation reference zones (PRZs). |
| · | TMC USA expects to leave behind approximately 15% of nodules in operational areas. |
| amcconsultants.com | 365 |
| Technical Report Summary of Prefeasibility Study of NORI Area D, Clarion Clipperton Zone | |
| TMC the metals company Inc. | 0225054 |
| 17.4.2 | Benthic plume |
The collector will separate the majority of the sediment that it entrains and discharge it back to the seafloor within meters from its origin, generating a benthic plume behind the vehicle. This plume will spread to other areas, and the fine sediment may clog filter feeding and respiratory structures of some benthic organisms. Sedimentation may also bury nodules and, thus, make it hard or impossible for animal larvae to attach to them.
Several studies have begun to model how the benthic plume behaves, and, to date, initial findings suggest that the plume may not have as widespread impacts as previously thought. Peer-reviewed research based on field studies on seafloor plumes found that 92-98% of the plume from pilot nodule-collector rose only 2 meters above the seafloor (Peacock et al (2023; Haalboom et al. 2023).
Detailed studies by DHI, based on empirical data from test mining, have confirmed that the benthic plume footprint is constrained as it forms a “gravity current”. Further studies using isotopes to determine the areas of influence and areas of impact have provided further confidence on the limits of the sedimentation footprint resulting from the benthic plume.
Mitigation Action: During the 2022 Test Mining Trial, NORI engaged DHI Water and Environment (DHI) – leading experts on sedimentation and plume modelling – to implement a plume monitoring study. The team deployed over 50 assets and marine sensors to the 4 km x 2 km test field to collect data on all aspects of plume dynamics, concentration, and dispersal from which DHI have generated plume models. Initial models predicted that a plume will resettle in days within several kilometer radius from the origin. Preliminary results from monitoring during test mining show that the actual sedimentation footprint was much smaller than expected.
With empirical data on plume behaviour, NORI will continue to explore ways to minimise the spread of the benthic plume by optimising discharge parameters and mining patterns and finding ways to accelerate particle flocculation to speed up sediment resettlement on the seabed. The dredging industry has developed significant knowledge on plume dynamics over the years, which has been used to inform equipment design (e.g. diffusers) to minimise the impacts of the benthic plume.
Engineering improvements include further work on the height adjustment system (HAS) for the Coandă nozzles to minimize penetration depth and the amount of sediment entrained by the collector. The diffusers performed well during test mining and minor refinements have been incorporated into the design of the collector vehicle for commercial production.
| amcconsultants.com | 366 |
| Technical Report Summary of Prefeasibility Study of NORI Area D, Clarion Clipperton Zone | |
| TMC the metals company Inc. | 0225054 |
| Figure 17.7 | Test mining footage showing that the benthic plume stays just above the seafloor |
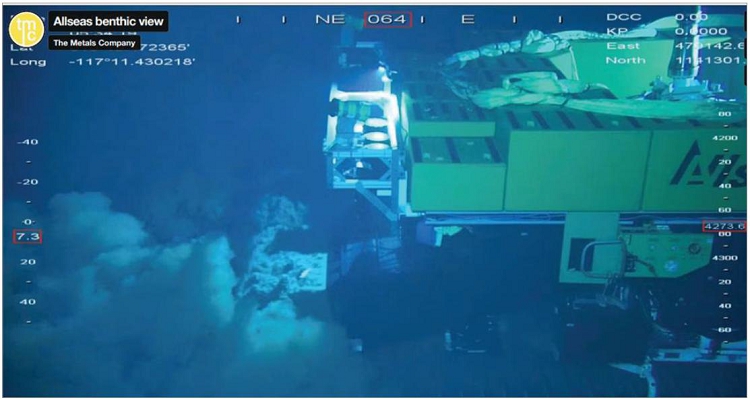
Source: Allseas and NORI
| 17.4.3 | Return water plume |
Nodules, seawater, and any residual sediment that eludes separation inside the collector on the seabed will enter the riser pipe and travel to the Production Vessel at the surface. Once aboard the Production Vessel, a cyclone separator will dewater the nodules and the seawater that the riser system used to transport nodules along with any residual sediment and nodule fines (from nodule breakage in transport up the riser) will return to the water column at depth below the measured oxygen minimum zones where it will form a very dilute plume (the “mid-water plume”). Key risks to the biotic environment from the mid-water plume include clogging pelagic nekton’s respiratory and filter-feeding structures and remobilizing heavy metals and toxins sequestered in the sediment and possibly making them available for bioaccumulation in the food chain.
Mitigation action: NORI continues to research optimal mid-water reinjection depth that will cause minimal disruption to marine biota.
A discharge depth below 2,000 m releases the mid-water plume below the oxygen minimum zone and into a zone of the water column with the least biomass. This minimises exposure of pelagic organisms to any potential toxins or heavy metals and reduces the risk of bioaccumulation in the food chain and the potential exposure of commercially important fish species27.
| 17.4.4 | Carbon |
Observed data from test mining show that 92-98% of mobilized sediment stays several meters above the seafloor and resettles within hours to days. There are no known significant pathways for carbon contained within seafloor sediments to reach the atmosphere within the short window before sediment resettles. The ocean’s thermohaline circulation occurs on centuries timescale and Earth's geological cycle impacts water mass movements over tens or hundreds of millions of years. Further, existing literature has also addressed the potential impacts of nodule collection on microbial carbon sequestration service, finding that “proposed mining of these nodule-bearing sediments and resulting resuspension of particles and organic matter will have a trivial impact on the ecosystem service of carbon sequestration.”28
27 https://www.isa.org.jm/publications/technical-study-33-potential-interactions-between-fishing-and-mineral-resource-related-activities-
in-areas-beyond-national-jurisdiction-a-spatial-analysis/ and https://dsm.gsd.spc.int/public/files/reports/SPCNIWA_Report_FINAL231116.pdf
28 Orcutt, B. N., J. A. Bradley, W. J. Brazelton, and others: 2020. Impacts of deep-sea mining on microbial ecosystem services. Limonology and Oceanography 65: 1489-1510. Doi:10 10002/no. 11403
| amcconsultants.com | 367 |
| Technical Report Summary of Prefeasibility Study of NORI Area D, Clarion Clipperton Zone | |
| TMC the metals company Inc. | 0225054 |
| 17.4.5 | Noise |
NORI engaged HR Wallingford, a recognized international consultant, to conduct acoustic modelling of test mining. The model was then updated with the vessel fleet, movements and frequencies expected during commercial production. The initial findings from this process are that noise levels outside a 3.8 km radius of the production vessel will be below the threshold for root-mean-square broadband sound pressure levels (SPL) of 120 dB known to cause a behavioural response in effect on marine mammals29.
There are no specific engineering mitigation measures recommended for noise attenuation. The design of the riser pipe already incorporated an air injection point outside of the SOFAR channel, and the collector vehicle was not identified as a major source of noise by the model. The design does not use any large underwater pumps. The major source of noise for the integrated nodule transfer system is the dynamic positioning thrusters on the surface production vessel and transfer vessels.
| 17.4.6 | Biodiversity loss |
The study of biodiversity loss in the context of the NORI Area D Project has involved extensive environmental monitoring and assessment programs designed to evaluate the impacts of deep-sea mining activities on marine ecosystems. This includes a comprehensive analysis of various biotic communities through pre-mining and post-mining surveys. Specific methodologies employed include seafloor studies that assess changes in habitat structure and species composition, as well as plume monitoring to characterise the effects of mobilized sediment on water quality and biological communities. The results from these studies are critical for understanding the potential long-term ecological consequences of mining operations and informing future management decisions.
The ISA has set aside 1.97 million km2 of the CCZ as areas of particular environmental interest (APEIs) in which nodule collection will never occur. To minimise biodiversity loss at the site level, the project incorporates several strategies. One key approach is the establishment of PRZs within NORI Area D, which serve as undisturbed areas for comparison against impacted sites, allowing for the assessment of natural variations in environmental conditions. Continuous environmental monitoring will be conducted to ensure compliance with regulations and to adaptively manage any unforeseen ecological consequences. By integrating these measures into the project’s operational framework, NORI aims to uphold a precautionary approach that prioritizes the protection of marine biodiversity while pursuing its exploitation objectives.
| 17.4.7 | Reduction in habitat quality and ecosystem function |
NORI has begun studying the in-field data gathered on ecosystem functioning a year after test mining. Whilst the research is yet to be completed, the Project expects to be able to report on recovery rates at a species level by implementing long-term monitoring programs.
29 NMFS (National Marine Fisheries Service) (2018) 2018 Revisions to: Technical Guidance for Assessing the Effects of Anthropogenic Sound on Marine Mammal Hearing (Version 2.0):Underwater Thresholds for Onset of Permanent and Temporary Threshold Shifts. U.S. Department of Commerce, NOAA. NOAA Technical Memorandum NMFS-OPR-59: 167 pp.
| amcconsultants.com | 368 |
| Technical Report Summary of Prefeasibility Study of NORI Area D, Clarion Clipperton Zone | |
| TMC the metals company Inc. | 0225054 |
Fish and holothurians are expected to return to disturbed areas soon after the cessation on mining activities. These mobile species are likely to be attracted by newly uncovered or deposited organic matter that results from the disturbance.
Data from NORI Area D suggest that sedimentary microbial communities are likely to recover to pre-disturbance levels.
Nodule-obligate macrofauna will be most affected by nodule removal. However, research by Simon- Lledo et al. (2019) suggests that nodule surface area availability is not a limiting factor for nodule-obligate organisms at nodule densities over 5%. As at this density, the availability of organic matter (food) becomes the limiting factor. Up to 15% of nodules will not be removed from mined areas, and 1-meter strips of nodules will be left behind between passes; studies show that buried and sediment-covered nodules begin to become uncovered (and presumably re-available as hard substrate habitat) in as little as 12 months post-mining. These observations suggest that nodule-obligate communities, even within directly mined areas, may exhibit signs of recovery over extended periods. The long-term impacts on the community structure of these groups are unknown and will be the focus of ongoing research in the disturbed areas.
| 17.5 | Commitments to local benefits |
| 17.5.1 | Updated Sponsorship Agreement |
On May 29, 2025, the Government of the Republic of Nauru and NORI signed a revised Sponsorship Agreement, updating the terms originally executed in 2017. As outlined in TMC’s press release on June 4, 2025, the Agreement ensures Nauru will continue to receive all existing financial benefits, training and capacity-building programs, and in-country community and social programs it receives today, and further provides that, in consideration of its ongoing sponsorship, Nauru will receive continuity benefits upon commencement of commercial production by NORI or another TMC subsidiary. Community and social benefit programs are outlined below.
| 17.5.2 | Scholarships |
TMC, through their subsidiary NORI, has developed an undergraduate scholarship program through the University of the South Pacific (USP) and has supported Nauruan students to pursue undergraduate degrees in a wide range of disciplines. At the time of writing, TMC is actively supporting seven undergraduate scholars.
NORI also has an existing scholarship program to fund preliminary and foundation science courses for Year 11 and Year 12 students which equip them with qualifications required to pursue undergraduate science degrees.
| 17.5.3 | Community Investment |
TMC actively supports a range of community and social initiatives through its Community Assistance Program (CAP). This program allocates funds bi-annually to community-based projects. The priority areas for CAP include:
| · | Education. |
| · | Youth and Healthy Living. |
| · | Women's Empowerment. |
| · | Clean Water and Sanitation. |
| · | Ocean and Environmental Health. |
| · | Agriculture and Food Security. |
| · | Cultural Heritage. |
| amcconsultants.com | 369 |
| Technical Report Summary of Prefeasibility Study of NORI Area D, Clarion Clipperton Zone | |
| TMC the metals company Inc. | 0225054 |
| 17.5.4 | Stakeholder engagement |
The Project. through the works completed by NORI, has attracted broad stakeholder and media interest at both project and industry level. As an industry leader, TMC is committed to broad and representative stakeholder and community participation, as well as inclusive and transparent sharing of information.
To date, NORI has conducted various stakeholder engagement activities to develop and maintain partnership with key stakeholders such as Nauru. These activities are summarized in Table 17.1.
| Table 17.1 | Stakeholder analysis and engagement |
| Stakeholder | Engagement Method | Key Topics | Objectives |
| TMC Employees | Townhalls, in-person team meetings, company “AllHandsonDeck” emails, internal committees for topics such as ESIA program, ESG, Pacific Islands engagement | Vision, plan, strategy, company values, projects performance and updates, climate change, ESG performance expectations and progress |
Communicate strategy and progress Gain feedback and insights Maintain an engaged purpose-driven workforce |
| Strategic Partners and Contractors | Meetings, emails, website, reports, contracts, exploration campaigns, technology development and testing | Project updates, opportunities, megatrends, vision, projects timeline and forecast, our policies, sustainability approach and goals, ESG performance expectations and due diligence process, scope of work, sustainability initiatives |
Create shared value Leverage expertise Mitigate risk Deliver science-based solutions Foster innovation to decarbonize value chain |
| Scientific Community | Meetings, emails, reports, webinars | Project updates, environmental impact assessments, management and monitoring, deep sea knowledge, conservation, innovation, climate change carbon offsets, blue economy, transparency |
Promote open and healthy debate and understanding that drive science -based decisions Advance deep-sea research and understanding of impacts Support conservation and advance solutions from the blue economy |
| Value Chain (Suppliers, Potential Customers) | Meetings, emails, reports, conferences | Project updates, critical metals demand trends: availability / security / price / ESG impacts of critical metals supply; climate change and energy transition; our value proposition; ESG performance expectations and due diligence process |
Develop opportunities Foster collaboration Build ESG focus and transparency Leverage expertise Decarbonize value chain Deliver science-based solutions |
| NGOs and Global Community | Meetings, website, social media, press releases, reports, consultation | Project updates, transparency, accountability, climate change and energy transition, real-world data and trade-offs, shared value, best practices, our sustainability approach, goals and impact |
Promote transparency, inclusivity Foster conversation and collaboration Drive science-based understanding of impacts and receive feedback to understand and address concerns |
| amcconsultants.com | 370 |
| Technical Report Summary of Prefeasibility Study of NORI Area D, Clarion Clipperton Zone | |
| TMC the metals company Inc. | 0225054 |
| Stakeholder | Engagement Method | Key Topics | Objectives |
| Communities |
Meetings, townhalls, website, social media, information videos, local newsletter, local events, community programs, consultation, press releases | Project and industry updates, our vision, responsibilities and sustainability approach and goals, deep-sea mining regulations, shared value creation, local capacity building, education, local initiatives, grants climate change |
Be a good partner Engage transparently Support local training and capacity building initiatives Understand community priorities Create shared value |
| Investors and Shareholders | Annual general meeting, meetings, emails, website, reports, webinars, conferences, press releases | Project updates, financial and ESG reporting, our sustainability approach and goals, climate change, energy transition, metals supply and market trends, governance, strategy, risks and opportunities |
Communicate strategy, updates and progress, including risks and opportunities Understand market trends and expectations Build transparency and drive value by sharing financial and ESH performance |
| Industry Groups | Meetings, emails, website, reports, webinars, press releases | Project updates, best practices, standards development, climate change, transparency, ESG, environmental and social impacts | Go beyond compliance and support the development of transparent ESG standards and certification that drive continuous improvement for the industry |
| Governments, Regulators, Sponsoring States | Meetings, emails, reports, industry events, webinars | Project updates, governance, transparency, accountability, compliance, permitting, standardization, ESG strategy, climate change, ESG certification development |
Support and implement best-in-class regulations and standards that build a high level of transparency and accountability Support training and capacity building |
Under DSHMRA, NOAA is responsible for leading all formal stakeholder engagement and consultation activities associated with the permitting process. This includes publishing permit notices in the Federal Register, managing public comment periods, holding public hearings, and, if necessary, conducting adjudicatory proceedings. TMC USA will fully support this process by meeting NOAA’s timelines, submitting all required application materials and documentation, and preparing accessible supporting materials to aid public understanding.
| amcconsultants.com | 371 |
| Technical Report Summary of Prefeasibility Study of NORI Area D, Clarion Clipperton Zone | |
| TMC the metals company Inc. | 0225054 |
| 18 | Capital and operating costs |
| 18.1 | Execution strategy |
The execution strategy has been designed around a capital-light model that leverages existing TMC and third party offshore assets and established third party onshore processing facilities through tolling agreements, reducing upfront capital expenditure and enabling operational efficiencies and risk mitigations.
The offshore collection system comprises Production Vessels (PV) equipped with dual 15-m collectors, vertical transport and riser systems, dewatering, and storage and integrated storage and offloading infrastructure.
Each PV will be supported by one dedicated dynamic position Transfer Vessel (TV). Nodules will be offloaded from the PV to the TV at regular intervals during operations to ensure the PV storage capacity is not exceeded. Nodules will be transferred from the TV to bulk carriers (BCs) for shipment to onshore processing sites. Support vessels (SVs) will provide ancillary services such as bunkering, waste management and personnel transfers.
Commercial production is planned to commence with one PV (Hidden Gem) operating at approximately 1.5 million metric tonnes per annum (Mwmtpa) of wet nodules. This initial phase focuses on validating system performance and environmental compliance while establishing operational rhythms and routines. As part of the phased ramp-up strategy, vessel modifications—including increased compressor capacity and additional dewatering circuits—will enable scaling production to 3 Mwmtpa within two years. The fleet will expand progressively, to four PVs, collectively achieving a full offshore collection rate of up to 12 Mwmtpa over four years.
Onshore processing to produce alloy (first 18 months only), matte and manganese silicate will be via tolling agreements with Pacific Metals Company (PAMCO) in Japan. Production will initially be capped at 1.3 Mwmtpa, with plans to incorporate additional tolling capacity in Indonesia to accommodate higher volumes as offshore production increases. This approach minimizes initial capital expenditure related to new plant construction and aligns processing capabilities with offshore output growth.
The long-term processing strategy involves contracting third party construction of two refining facilities (12 Mwmt Nodule equivalent capacity) in United States which will refine the matte and produce copper cathode, nickel sulfate, and cobalt sulfate. TMC will own the new refineries with the operation and maintenance to be managed by a strategic partner.
Allseas will be the primary delivery partner responsible for engineering, procurement, fabrication, commissioning, and ongoing operations of the mining system and vessels, ensuring technical expertise and operational control. Third-party contractors will provide logistics support and bulk carrier services.
Environmental management will be embedded throughout the ramp-up, guided by comprehensive environmental baseline studies and pilot testing data from the 2022 Test Mining. A robust Environmental Management and Monitoring Plan (EMMP) will support adaptive management practices, allowing staged expansion contingent on meeting environmental thresholds and minimizing ecological impacts.
Capital expenditure will be managed as capital-light, by TMC purchasing the initial PV and TV with subsequent vessels acquired under a capital strategy where the vessels will be purchased by the contractor and capital recovered over 10 years in operating costs. TMC will pay for modifications to the SVs to support operational requirements however, the SVs will be owned and operated by third parties which will be paid for through charter agreements. BCs will be owned and operated by third parties, with TMC paying through standard shipping charges agreed between the parties. All processing facilities will also be owned and operated by third parties, with TMC paying for toll treatment per tonne of nodules. US Refining facilities will be owned by TMC and operated and maintained by strategic partners.
| amcconsultants.com | 372 |
| Technical Report Summary of Prefeasibility Study of NORI Area D, Clarion Clipperton Zone | |
| TMC the metals company Inc. | 0225054 |
| 18.2 | Detailed operations plan |
| Figure 18.1 | illustrates the proposed project operations which underpins the operating philosophy and includes: |
| · | Collection of nodules from seafloor |
| · | Transportation of nodules to the surface |
| · | Dewatering and storage of nodules |
| · | Transhipment of nodules to transport to onshore processing facilities. |
| Figure 18.1 | Illustration depicting proposed execution strategy |
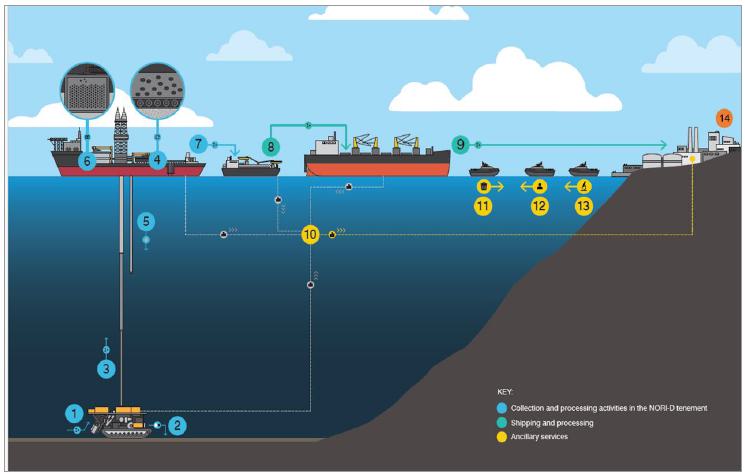
Source: TMC
A detailed description of the activity at each stage of operations is outlined below. The description number correlates to the numbered activity in Figure 18.1.
| 1 | Collecting the nodules – collector vehicle/s collects nodules within dilute sediment/seawater slurry from the top 5 cm of the seafloor. |
| 2 | Initial separation and sizing – a separator on collector vehicles removes excess water and sediment prior to pumping via a flexible jumper to the riser. |
| 3 | Pumping to the surface – nodule slurry
will be pumped to the PV on the surface through a 3-section riser with an airlift injection point between the 1st and 2nd sections to assist lift. |
| 4 | Separating the nodules and sediment – on the deck of the PV, air is released from the slurry in a cyclone separator and the slurry is passed over vibrating screens. Dewatered material >2 mm flows to the nodule product conveyor. Water and material <2 mm are further separated in a cyclone, with fines >100 µm also directed to the nodule product conveyor. |
| amcconsultants.com | 373 |
| Technical Report Summary of Prefeasibility Study of NORI Area D, Clarion Clipperton Zone | |
| TMC the metals company Inc. | 0225054 |
| 5 | Return of separated water – water and fines <100 µm are collected in a holding tank and returned through the riser to a nominal depth of 2,000 m. |
| 6 | Temporary storage – the nodule product conveyor discharges to the storage holds located on the PV. |
| 7 | Transfer to TV–nodules are transferred from the storage holds via a series of conveyors, and onto the dedicated TV via conveyors on slewing and luffing booms located on both the port and starboard sides of the PV. |
| 8 | Transfer to BC –nodules are transferred from the TV from either the port or starboard side of the TV to the BC. |
| 9 | Transport to processing ports – The BC transports the nodules to onshore processing facilities. |
| 10 | Monitor and explore – Ongoing exploration and environmental monitoring activities will continue across the NORI Property and will be carried out by third party. |
| 11 | Removal of waste – a dedicated vessel will transport waste from the PVs and TVs to port to be transferred to an onshore disposal facility. |
| 12 | Refuelling – Refuelling of the PVs, TVs, and SVs for exploration, and environmental monitoring vessels. |
| 13 | Transfer of crew and supplies – A SV will transfer crew and supplies to the field. |
| 18.3 | Baseline operating assumptions |
The following scope and execution assumptions underpin the CAPEX/OPEX estimates detailed in Section 18.5 and 18.6.
Offshore operations vessel numbers
| · | Ramp-up to 4 x PVs, each with 2 x15 m collectors and associated equipment to achieve 3.0 Mtpa mining production each for a total rate of 12 Mwmtpa |
| · | Ramp-up to 4 x TVs with dynamic positioning and self-unloading capability |
| · | Ramp-up to 12 x SVs for personnel, supplies and equipment change out |
Transfer and shipping vessel numbers
| · | BC using market long term charter agreements |
| ― | Ramp-up to 4 x Cape-sized BCs at 200k dead weight tonnes (dwt) to Indonesia per PV. |
| ― | Ramp-up 3-5 one-way trips per year x Handymax-sized BCs at 50k dwt to US (Texas) from 2033. |
| ― | Double-handling costs included for material handling between the Indonesian processing location and nodule supply to PAMCO. |
Production schedule and capital cost
| · | PV 1 (PV1) – Hidden Gem; 50% capital cost recovered in operations over 10 years from PV commencement date. |
| · | PV 2,3,4 (PV2,PV3, and PV4) – Contractor Miner strategy; 100% capital cost recovered in operations through TMC revenue over 10 years from production vessels commencement dates (year 3 PV2, year 4 PV3 and PV4). |
| · | Total extractable resource 164.1 Mwmt (45% of total NORI D Mineral Resource). |
| · | Life-of-mine of 19 years. |
| amcconsultants.com | 374 |
| Technical Report Summary of Prefeasibility Study of NORI Area D, Clarion Clipperton Zone | |
| TMC the metals company Inc. | 0225054 |
Nodule processing
| · | PAMCO |
| ― | Five years of nodule processing capped at 1.3 Mwmtpa. |
| ― | First 18 months only alloy is produced. |
| ― | Remaining 42 months, alloy is produced and converted to matte. |
| · | Indonesia |
| ― | For the first five years, Indonesian RKEF plants process any nodule production that is in excess of the 1.3 Mwmtpa capacity at PAMCO. |
| ― | From Year 6 onwards, Indonesian RKEF plants process 100% of nodule production to produce matte. |
| · | Texas, USA |
| ― | From Year 6 of operations, 6 Mwmtpa nodule equivalent matte product will be shipped to Texas, USA. |
| ― | From Year 10 of operations, all matte product will be shipped to Texas, USA. |
| ― | Matte will be converted to nickel sulfates, cobalt sulfates, and copper cathode. |
| 18.4 | CAPEX and OPEX estimate preparation |
The Project capital expenditure (CAPEX) and operating expenditure (OPEX) estimates were prepared by specialists in the following areas:
| · | Collection CAPEX and OPEX were estimated by Allseas and TMC. |
| · | Transfer & shipping CAPEX and OPEX were estimated by TMC. |
| · | Contractor (offshore) was estimated by Allseas and TMC |
| · | Consumables (offshore fuel) was estimated by Allseas and TMC |
| · | Processing facility CAPEX OPEX was estimated by PAMCO and TMC |
| · | Refining facility CAPEX and OPEX were estimated by a global leading consulting engineering firm. |
| · | Corporate OPEX was estimated by TMC. |
All costs in this section are presented in US dollars millions (US$ M).
Disclaimer: All capital and operating cost estimates contained in this Report are preliminary in nature and assume regulatory approvals and commercial terms that have not yet been secured. These estimates should not be relied upon for investment decision-making without additional feasibility-level validation.
| 18.5 | CAPEX |
The CAPEX estimate is reported in 30 June 2025 US$. CAPEX estimates are at a minimum PFS level of confidence and are prepared using the AACE International Class 4 estimate standards and are at a PFS level of confidence of ± 25% in accordance with S-K 1300 guidelines.
The estimate includes the cost to complete the design, procurement, fabrication, assembly, installation and commissioning associated with mining, transporting and processing nodules as per the Mine Plan. The estimate was based on Allseas, overseeing and delivering the engineering, procurement, fabrication, assembly and installation for the associated offshore infrastructure and equipment, along with the onshore operations support facilities. TMC will oversee, bulk carrier transport, onshore processing, environmental assessment and monitoring.
| amcconsultants.com | 375 |
| Technical Report Summary of Prefeasibility Study of NORI Area D, Clarion Clipperton Zone | |
| TMC the metals company Inc. | 0225054 |
The estimate was derived from a combination of supplier agreements, firm quotations, budgetary pricing, historical data and allowances. The estimates were based on a number of fundamental assumptions, such as process flow diagrams, general arrangements, material take offs (MTOs), scope definition and work breakdown structures.
The Project CAPEX estimate of US$4,971M comprising of US$544.8M for Production Vessel #1 and associated costs (System #1), inclusive of Allseas credit, is summarized in Table 18.1 and US$4,426M for two 6 Mwmt nodule equivalent refining facilities in the U.S., is summarized in .
| Table 18.1 | Project CAPEX system #1 summary |
| Description | US$ M |
| Production Vessel | 468.4 |
| Transfer Vessel/Bulk Carriers | 89.6 |
| Support Vessel | 15.2 |
| Processing | - |
| Operations Facilities initial setup | 2.3 |
| Direct Subtotal | 575.5 |
| Professional Services | 59.4 |
| Owners Cost | 44.6 |
| Indirect Subtotal | 104.0 |
| Contingency | 101.4 |
| Escalation | 53.3 |
| Allseas Credit | (289.3) |
| Total Project CAPEX | 544.8 |
Note: including escalation
| Table 18.2 | Project CAPEX US refining summary |
| Description | US$ M |
| General/Infrastructure | 144.8 |
| Port Facilities | 281.1 |
| Hydrometallurgy | 1,027.7 |
| Direct Subtotal | 1,453.7 |
| Indirect Costs | 477.2 |
| Contingency | 282.2 |
| Refining Facility Capital | 2,213.0 |
| Number of 6 Mwtpa refining facility | 2 |
| Total Project CAPEX | 4,426.0 |
| Item | Total | PP Year 1 | PP Year 2 | Year 0 | Year 1 | Year 2-4 | Year 5-19 | Year 20-29 |
| Project CAPEX | 4,971 | 195 | 229 | 102 | 107 | 676 | 3,662 |
Note: PP = pre-production
Note: including escalation
| 18.5.1 | Production vessel |
The Production Vessel #1 (“Hidden Gem”) CAPEX was estimated in conjunction with Allseas and totals US$468.4M exclusive of Allseas capital contribution. The Production Vessel #1 CAPEX is summarized in Table 18.3, and comprises:
| amcconsultants.com | 376 |
| Technical Report Summary of Prefeasibility Study of NORI Area D, Clarion Clipperton Zone | |
| TMC the metals company Inc. | 0225054 |
| Table 18.3 | Production vessel CAPEX |
| Description | US$ M |
| Vessel | 99.4 |
| Collector 1 | 38.7 |
| Collector 2 | 38.7 |
| Umbilical 1 | 6.0 |
| Umbilical 2 | 6.0 |
| LARS 1 | 25.8 |
| LARS 2 | 24.8 |
| Riser & compressor spread | 156.3 |
| Spares | 24.1 |
| Indirect | 42.0 |
| Commissioning | 6.5 |
| Production Vessel Total | 468.4 |
Vessel costs are based on the Allseas estimates and include the following:
| · | Hidden Gem Reactivation: |
| ― | Derived from vessel punchlist of outstanding maintenance works. |
| · | Hidden Gem Modifications: |
| ― | Fabrication and outfitting storage tanks, riser storage bay adaptation and hopper tanks. |
| · | Offloading System: |
| ― | Two cargo diverters and associated ducting, two receiving feeder, belt conveyors, two reversible thwartship shuttling transfer conveyors, and four reversible longitudinal shuttle conveyors. Supply includes structural, mechanical, hydraulic, and electrical systems. |
| · | Nodule Processing: |
| ― | Two single deck primary screens, primary hydrocyclone, two dewatering screens, and secondary cyclone. |
| · | Ancillary facilities: |
| ― | Installation and commissioning for maintenance, medical and environmental facilities. |
Collector #1 and #2 costs are based on the Allseas estimates and include the following:
| · | Structural: |
| ― | Shop detailing, supply of main structure, secondary steel, coating etc. |
| · | Propulsion: |
| ― | Tracks assemblies including sprockets and thrusters. |
| · | Pick up: |
| ― | Coanda nozzles assembles and associated pipe work. |
| · | Processing: |
| ― | Hopper, buffer tank, diffuser, pumps and cleaning jets. |
| · | Transfer: |
| ― | Jumper hose coupling mechanism. |
| · | Buoyancy: |
| ― | Buoyancy blocks including shaping premium. |
| · | Hydraulic: |
| ― | HPU, piping and fittings. |
| amcconsultants.com | 377 |
| Technical Report Summary of Prefeasibility Study of NORI Area D, Clarion Clipperton Zone | |
| TMC the metals company Inc. | 0225054 |
| · | Electrical and Instrumentation: |
| ― | Sensors, epods, emotors and subsea positioning equipment. |
| · | Control and Automation: |
| ― | Control room equipment and software. |
Umbilical #1 and #2 costs are based on the Allseas estimates and include the following:
| · | Umbilical: |
| ― | Supply duty umbilical, spooling and electrical terminations on Hidden Gem. |
LARS #1 and #2 costs are based on the Allseas estimates and include the following:
| · | LARS: |
| ― | Tower structural steel, coating, hydraulic systems, umbilical winch motor, umbilical winch skidding actuator, cursor winch, arm actuator, skidding system actuator, snubber cardan actuator, snubber vertical actuator, snubber rotation motor, snubber primary lock, snubber secondary lock, electrical and control systems. |
Riser & compressor spread costs are based on the Allseas estimates and include the following:
| · | First production riser: |
| ― | Riser umbilical, riser pipe first 1,500 m, Riser pipe >1,500 m 14-inch carrier pipe, connector forgings, joints, coatings, coating connectors, riser assembly, strakes, running, pulling and protection fins, flanges, spider, hang off joint and connections for air and injection lines. |
| · | Infield upgrades riser: |
| ― | Replacement riser pipe >1,500 m sections 18 or 16-inch carrier pipe, connector forgings, joints, coatings, coating connectors, riser assembly, strakes, running, pulling and protection fins, flanges, spider, hang off joint and connections for air and injection lines. |
| · | First production compressor spread: |
| ― | Modularised container E-drillair, E-booster and compressor rooms up to 2 Mtpa throughput capacity (including redundancy). |
| · | Infield upgrades compressor spread: |
| ― | Additional modularised container E-drillair, E-booster and compressor rooms up to 4 Mtpa throughput capacity(including redundancy). |
Critical spares costs are based on the Allseas estimates and include the following:
| · | Umbilical - complete spare on production vessel. |
| · | Jumper hose - complete spare on production vessel. |
| · | Riser sections – 500 m spare sections and fittings. |
Indirect costs are based on the Allseas estimates and include the following:
| · | Layup costs associated with Hidden Gem in layup from transit to China to First Production. |
Commissioning is based on the Allseas estimates and include the following:
| · | Production Vessel wet commissioning and performance testing. |
| amcconsultants.com | 378 |
| Technical Report Summary of Prefeasibility Study of NORI Area D, Clarion Clipperton Zone | |
| TMC the metals company Inc. | 0225054 |
| 18.5.2 | Transfer vessel/bulk carriers |
The Transfer Vessel/Bulk Carrier CAPEX was estimated in conjunction with Allseas and other third-party vendors and totals US$89.6M. The Transfer Vessel/Bulk Carrier CAPEX is summarized in Table 18.4, and comprises:
| Table 18.4 | Transfer vessel/bulk carrier CAPEX |
| Description | US$ M |
| Transfer Vessel | 76.9 |
| Bulk Carrier | 12.8 |
| Transfer Vessel/Bulk Carrier Total | 89.6 |
Transfer Vessel cost are based on the Allseas estimates/third party quotes and include the following:
| · | Purchase: |
| ― | Second hand Panamax vessel with 50,000 DWT capacity. |
| · | Modifications: |
| ― | Dynamic positioning (4x thrusters, 4x E-motor, 4x VFD, Control room, 3x 5MW genset). |
| ― | Offloading System |
| ― | Hull modifications for dynamic positioning (DP) and offloading system |
Bulk carrier costs are based on third party quotes and include hire costs for infield commissioning and performance testing of PV #1. Bulk Carriers will utilise market bulk carrier agreements and included in OPEX.
| 18.5.3 | Support vessels |
The Support Vessels CAPEX was estimated in conjunction with Allseas totals US$15.2M exclusive of Allseas capital contribution. The Support Vessels CAPEX is summarized in Table 18.5, and comprises:
| Table 18.5 | Support Vessels CAPEX |
| Description | US$ M |
| Support Vessel #1 | 8.2 |
| Support Vessel #2 | 3.5 |
| Support Vessel #3 | 3.5 |
| Support Vessel Total | 15.2 |
Support Vessel #1 costs are based on the Allseas estimates and include the following:
| · | Facilities required for lodging |
| · | General facilities, transit and mobilisation |
Support Vessel #2 and #3 costs are based on the Allseas estimates and include the following:
| · | General facilities, transit and mobilisation |
| 18.5.4 | Processing |
No processing CAPEX is included in the CAPEX estimate. Processing utilises existing RKEF facilities through tolling agreement and included in the OPEX estimate, including capital recovery rates.
| amcconsultants.com | 379 |
| Technical Report Summary of Prefeasibility Study of NORI Area D, Clarion Clipperton Zone | |
| TMC the metals company Inc. | 0225054 |
| 18.5.5 | Operations Facilities initial setup |
Operations facilities initial setup CAPEX of US$2.3M is based on historical information. The operations facilities initial setup CAPEX is summarized in Table 18.6, and comprises:
| Table 18.6 | Operations Facilities CAPEX |
| Description | US$ M |
| San Diego/Long Beach - Offshore Support Facility | 1.2 |
| USA - In Country Operations Facility | 1.2 |
| Operations Facilities Total | 2.3 |
Operations facilities initial setup includes:
| · | General facilities, laydown area setup, warehouse facilities, pre-production initial lease costs during setup period. |
| 18.5.6 | Professional Services |
Professional services CAPEX was estimated by Allseas and totals US$59.4M exclusive of Allseas capital contribution. The professional services CAPEX is summarized in Table 18.7, and comprises:
| Table 18.7 | Professional Services CAPEX |
| Description | US$ M |
| Allseas Engineering | 18.6 |
| Allseas Project Management | 40.9 |
| Professional Services Total | 59.4 |
Professional Services includes:
| · | Project Management – built up from staffing plans |
| · | Engineering – total hours driven by engineering deliverables and brought back to staffing plan to show position requirements |
| 18.5.7 | Project owners cost |
Project owners cost CAPEX was estimated by TMC and totals US$44.6M. The project owners cost CAPEX is summarized in Table 18.8, and comprises:
| Table 18.8 | Project owners cost CAPEX |
| Description | US$ M |
| Onshore | 17.3 |
| Offshore Campaigns | 6.8 |
| Environmental | 5.7 |
| Mine Plan and Project Management | 14.8 |
| Project Owners Cost Total | 44.6 |
Project owners cost includes
| · | Onshore – various test works, process development, technical consultants, R&D. |
| · | Offshore Campaigns – pre-production offshore campaign costs. |
| · | Environmental – various environmental vendors, consultants, deliverables. |
| · | Mine plan and project management – Mine planning, test works, technical consultants, etc. |
| amcconsultants.com | 380 |
| Technical Report Summary of Prefeasibility Study of NORI Area D, Clarion Clipperton Zone | |
| TMC the metals company Inc. | 0225054 |
| 18.5.8 | Contingency |
Contingency was applied to:
| · | Project CAPEX System #1 CAPEX Table 18.1, averaging 14.9% of total base estimate totalling US$101.4M. |
| · | Project CAPEX US Refining CAPEX Table 18.2, averaging 15.0% of total base estimate totalling US$282.2M per 6 Mwtpa nodule equivalent US facility or US$564.3M for 12 Mwtpa nodule equivalent. |
| 18.5.9 | Escalation |
Escalation is stated as a percentage at 3% and applied to costs per annum on the identified centroid totalling US$53.3M
| 18.5.10 | Allseas capital contribution |
At an estimate line-item level, costs under Allseas scope attracts a 50% CAPEX contribution under a strategic agreement. This Allseas capital contribution totals (US$289.3M).
| 18.5.11 | System #2, #3, #4 |
Total estimate for System #2, #3, #4 is utilised to determine the payback costs under contractor miner strategy to be recovered over the first ten years of operating and is included in OPEX Collection Cost.
The components of each system can be summarised as per the below:
| · | Production Vessel - Samsung 10000 with 25,000 DWT capacity. |
| · | 2 x 15 m collectors. |
| · | 1 x Transfer Vessel - DP Panamax with 50,000 DWT capacity: |
| · | 3 x Supply Vessel. |
| · | 4 x Bulk Carriers (at peak) – Capesize with 200,000 DWT capacity. |
The System #2, #3, #4 CAPEX estimate of US$1,454.2M per system, is summarized in Table 18.9.
| Table 18.9 | System #2, #3, #4 recovered summary |
| Description | US$ M |
| Production Vessel | 672.4 |
| Transfer Vessel/Bulk Carriers | 89.6 |
| Supply Vessel | 15.2 |
| Direct Subtotal | 777.2 |
| Indirects | 486.6 |
| Contingency | 190.4 |
| System #2, #3, #4 Recovered Capital per system | 1,454.2 |
Note: Bulk carrier CAPEX for time charter for commissioning/performance testing of each system only
| amcconsultants.com | 381 |
| Technical Report Summary of Prefeasibility Study of NORI Area D, Clarion Clipperton Zone | |
| TMC the metals company Inc. | 0225054 |
| 18.5.12 | Refining facility |
Refining Facility CAPEX was estimated by a global leading consulting engineering firm and totals US$4,426M. The refining facility CAPEX is summarized in Table 18.10.Table 18.10, and comprises:
| Table 18.10 | Refining facility summary |
| Description | US$ M |
| Site Development & Roads | 12.7 |
| Power Supply and Distribution | 12.7 |
| Utilities | 71.9 |
| Process Control and Communications | 17.4 |
| Non-Process Buildings | 19.7 |
| Mobile Equipment | 10.4 |
| Port Facilities | 281.1 |
| Converter Aisle Sulphidation | 25.3 |
| Matte Receiving and Handling | 33.8 |
| Leaching & Purification | 200.5 |
| Copper EW | 156.1 |
| Cobalt SX | 99.0 |
| Cobalt Purification | 98.0 |
| Nickel SX | 144.5 |
| Crystallization & Product Packaging | 153.9 |
| Reagents & Utilities | 116.6 |
| Indirect Costs | 477.2 |
| Contingency | 282.2 |
| Total Cost per 6 Mwmt nodule equivalent | 2,213.0 |
| Number of 6 Mwtpa refining facility | 2 |
| Total Project CAPEX | 4,426.0 |
| 18.5.13 | Sustaining CAPEX |
Sustaining capital cost is based on production vessel class survey intervals, system design life, major overhaul assumptions and CAPEX estimated cost for each system component and totals US$1,550.0M. The sustaining CAPEX is summarized in Table 18.11, and comprises:
| Table 18.11 | Sustaining CAPEX summary |
| Sustaining Capital | UOM | Qty | US$ M |
| Collector Design life | Years | 10 | |
| Collector major overhaul | Years | 5 | |
| Collector x 2 CAPEX | 1 | Lot | 115.8 |
| Umbilical Design life | Years | 5 | |
| Umbilical x 2 CAPEX | 1 | Lot | 17.5 |
| Compressor Design life | Years | 10 | |
| Compressor major overhaul | Years | 5 | |
| Compressor CAPEX | 1 | Lot | 43.5 |
| Riser System Design life (riser considered consumable) | Years | 5 | |
| Riser System CAPEX | 1 | Lot | 131.9 |
| Vessel compounds incl LARs/Derrick Design life | Years | 30 | |
| Vessel compounds incl LARs/Derrick service period | Years | 5 | |
| Vessel compounds incl LARs/Derrick CAPEX | 1 | Lot | 189.1 |
| Class Survey Intervals | Years | 5 | |
| Class Survey Duration | Months | 6 | |
| Estimated Total Sustaining Capital every 5 years per vessel (Class survey) | 1 | Lot | 155.0 |
| Total Class surveys across four PVs LoM | Units | 10 | 1550.0 |
| amcconsultants.com | 382 |
| Technical Report Summary of Prefeasibility Study of NORI Area D, Clarion Clipperton Zone | |
| TMC the metals company Inc. | 0225054 |
| 18.5.14 | Closure CAPEX |
There are no permanent facilities that require
removal or rehabilitation at the cessation of the NORI Area D mining operations. The estimate assumes environmental monitoring will be
required for
a 10-year period post mining operations at the NORI Area D tenement.
Closure CAPEX is based on historical actual cost for environmental monitoring including all vessel hire, equipment hire, environmental personnel, sample and imagery collection and processing of data, totalling US$115.0M. The Closure CAPEX is summarized in Table 18.12, and comprises:
| Table 18.12 | Closure CAPEX summary |
| Closure Capital | US$ M |
| Vessel Supply | 6.8 |
| Mobilisation | 1.2 |
| Other Cost | 0.4 |
| Fuel | 0.9 |
| Onboard personnel/Equipment | 0.9 |
| Other Cost | 0.2 |
| Third Party Cost | 1.1 |
| Total Closure Capital per year | 11.5 |
| Total Closure capital 10-year post mining operations | 115.0 |
| 18.5.15 | CAPEX exclusions |
Exclusions to the CAPEX estimates include:
| · | Project costs incurred pre-July 2025 |
| · | No provision is made for the handling and disposal of pre-existing contaminated or hazardous materials. |
| · | Any cost or schedule impact due to the discovery of archaeological artefacts. |
| · | All taxes (theses are captured in the financial model) |
| · | Foreign currency exchange fluctuations |
| · | Impending or future legislative changes. |
| · | No costs for force majeure events such as fire, lightning, explosion, flood, earthquake, storm, cyclone, action of the elements, acts of God, natural disaster, radioactive contamination, toxic or dangerous chemical contamination, epidemic or force of nature; riots, civil commotion, malicious damage, sabotage, acts of a public enemy, acts of terrorists, war (declared or undeclared) or revolution; action or inaction by a Government Agency (including denial, refusal or failure to grant any Approval following expiry of the period for the granting of such Approval specified in the schedule; strikes, lockouts, industrial and / or labour disputes and/or difficulties, work bans, blockades or picketing by personnel, breakdown or failure of any facilities, machinery or equipment caused by the items above or unavailability of essential equipment, goods, supplies or services. |
| · | TMC subsidiary transfer pricing excluded |
| · | Post FOB at processing plants CIF (cost, insurance, freight) and product sales cost |
| · | Nodule insurance costs |
| amcconsultants.com | 383 |
| Technical Report Summary of Prefeasibility Study of NORI Area D, Clarion Clipperton Zone | |
| TMC the metals company Inc. | 0225054 |
| 18.6 | OPEX |
The OPEX estimate is reported in 30 June 2025 US$. OPEX estimates are at a minimum PFS level of confidence and are prepared using the AACE Class 4 estimate standards and are at a PFS level of confidence of ± 25% in accordance with S-K 1300 guidelines.
OPEX is summarised below for the Life of Mine (LOM) and average unit costs per tonne of wet (wmt) nodules collected over the LOM:
| · | LOM collection costs are estimated at US$12,343.6M and average US$75.2/wmt of nodules. |
| · | LOM transfer and shipping costs are estimated at US$3,070.7M and average US$18.7/wmt of nodules. |
| · | LOM contractor (offshore) costs are estimated at US$1,855.1M and average US$11.3/wmt of nodules. |
| · | LOM consumables (offshore fuel) costs are estimated at US$3,848.3M and average US$23.4/wmt of nodules. |
| · | LOM processing costs are estimated at US$13,621.8M and average US$83/wmt of nodules. |
| · | LOM refining costs are estimated at US$3,253.7M and average US$19.8/wmt of nodules. |
| · | LOM G&A costs are estimated at US$1,984.6M and average US$12.1/wmt of nodules. |
| amcconsultants.com | 384 |
| Technical Report Summary of Prefeasibility Study of NORI Area D, Clarion Clipperton Zone | |
| TMC the metals company Inc. | 0225054 |
| Table 18.13 | OPEX Summary |
| OPEX Component | Total
LOM (US$M) |
LOM (%) |
| Collection Costs | 12,343.6 | 30.9% |
| Transfer & Shipping Costs | 3,070.7 | 7.7% |
| Contractor (offshore) Costs | 1,855.1 | 4.6% |
| Consumables (offshore fuel) Costs | 3,848.3 | 9.6% |
| Processing Cost | 13,621.8 | 34.1% |
| Refining Cost | 3,253.7 | 8.1% |
| Corporate Cost | 1,984.6 | 5.0% |
| Total OPEX | 39,977.8 | 100% |
| Table 18.14 | OPEX Unit Cost US$/wmt Summary |
| OPEX Component | Average
LOM (US$/wmt) |
| Collection Costs | 75.2 |
| Transfer & Shipping Costs | 18.7 |
| Contractor (offshore) Costs | 11.3 |
| Consumables (offshore fuel) Costs | 23.4 |
| Processing Cost | 83.0 |
| Refining Cost | 19.8 |
| Corporate Cost | 12.1 |
| Total OPEX | 243.6 |
| 18.6.1 | Collection Cost |
The Collection Cost OPEX totals US$12,343.6M or US$75.2/wmt. The Collection Cost OPEX is summarized in Table 18.15, and comprises:
| Table 18.15 | Collection Cost OPEX |
| OPEX Component | Total LOM (US$M) |
Average LOM US$/wmt |
| Production Vessel | 5,299.9 | 32.3 |
| Production support | 543.3 | 3.3 |
| Supply vessel | 1,701.5 | 10.4 |
| System 2 Capital Recovery | 1,599.6 | 9.7 |
| System 3 Capital Recovery | 1,599.6 | 9.7 |
| System 4 Capital Recovery | 1,599.6 | 9.7 |
| Collection Costs Total | 12,343.6 | 75.2 |
Key inputs and assumptions used in the cost estimate were:
| · | Contractor operated. |
| · | Production vessel (Hidden Gem) cost was provided by Allseas and includes: |
| ― | Production vessel day rate provided by Allseas. |
| ― | Labour rates for expatriate and nationals including base salaries, benefits, bonuses; and overhead burdens were provided by Allseas. |
| amcconsultants.com | 385 |
| Technical Report Summary of Prefeasibility Study of NORI Area D, Clarion Clipperton Zone | |
| TMC the metals company Inc. | 0225054 |
| ― | Travel costs are estimated as an allowance. |
| ― | Other support costs including, ROVs, maintenance allowances etc. |
| · | Production Support – Allseas onshore salaries for expatriate and nationals including base salaries, benefits, bonuses; and overhead burdens were provided by Allseas. |
| · | Supply vessel cost was provided by Allseas: |
| ― | Labour rates for expatriate and nationals including base salaries, benefits, bonuses; and overhead burdens were provided by Allseas. |
| ― | Travel costs are estimated as an allowance. |
| ― | Other support costs including maintenance allowances etc. |
| · | System #2, #3 and #4 – contractor mining capital recovery as per Table 18.9 and cost of working capital (10%) for first 10 years of production of each production vessel. |
| 18.6.2 | Transfer and Shipping Costs |
The Transfer and Shipping Cost OPEX totals US$3,070.7 M or US$18.7/wmt. The transfer and shipping cost OPEX is summarized in Table 18.16, and comprises:
| Table 18.16 | Transfer and Shipping OPEX |
| OPEX Component | Total LOM (US$M) |
Average LOM (US$/wmt) |
| Transfer vessel CCZ | 1,045.0 | 6.4 |
| Bulk Carrier CCZ to INDO - Capesize | 1,713.1 | 10.4 |
| Bulk Carrier INDO to Texas - Handymax | 161.9 | 1.0 |
| Bulk Carrier INDO to Japan - Handymax | 132.1 | 0.8 |
| INDO inbound Handling | 18.5 | 0.1 |
| Transfer and Shipping Costs Total | 3,070.7 | 18.7 |
Key inputs and assumptions used in the cost estimate were:
| · | Transfer vessel CCZ: |
| ― | Labour rates for expatriate and nationals including base salaries, benefits, bonuses; and overhead burdens were provided by Allseas. |
| ― | Travel costs are estimated as an allowance. |
| ― | Other support costs including maintenance allowances etc. |
| · | Bulk Carrier CCZ to INDO – Capesize: |
| ― | Market pricing used for all in day rate. |
| ― | Fleet sizing based on logistics cycle times calculated by TMC. |
| · | Bulk Carrier INDO to Texas – Handymax: |
| ― | Market pricing used for all in day rate. |
| amcconsultants.com | 386 |
| Technical Report Summary of Prefeasibility Study of NORI Area D, Clarion Clipperton Zone | |
| TMC the metals company Inc. | 0225054 |
| ― | based on logistics cycle times calculated by TMC. |
| ― | Loading/unloading of matte product. |
| ― | Panama Canal fees. |
| ― | MGO fuel price of US$700/t, this is based on end of Q1 2025 data obtained from Ship and bunker spot pricing. |
| ― | Fuel consumption was calculated by industry norms. |
| · | Bulk Carrier INDO to PAMCO – Handymax: |
| ― | Market pricing used for all in day rate. |
| ― | based on logistics cycle times calculated by TMC. |
| ― | Loading/unloading of nodule. |
| ― | MGO fuel price of US$700/t, this is based on end of Q1 2025 data obtained from Ship and bunker spot pricing. |
| ― | Fuel consumption was calculated by industry norms. |
| · | INDO inbound Handling: |
| ― | Loading/unloading of nodules while INDO is not processing nodules (Year 0 - Year 2). |
| 18.6.3 | Contractor (offshore) Costs |
The Contractor (offshore) Costs OPEX totals US$1,855.1 M or US$11.3/wmt. The Contractor (offshore) costs OPEX is summarized in Table 18.17Table 18.17, and comprises:
| Table 18.17 | Contractor (offshore) costs OPEX |
| OPEX Component | Total LOM (US$M) |
Average LOM (US$/wmt) |
| Allseas Performance Incentive Payment | 1,565.8 | 9.5 |
| Allseas PV1 Capital Contribution Recovery | 289.3 | 1.8 |
| Contractor (offshore) Costs Total | 1,855.1 | 11.3 |
Key inputs and assumptions used in the cost estimate were:
| · | Allseas Performance Incentive |
| ― | Performance incentive for all system cost attributed to Allseas scope |
| · | Allseas PV1 capital contribution cost attributed to Allseas scope, as per the contracting strategy. |
| 18.6.4 | Consumables (offshore fuel) Costs |
The consumables (offshore fuel) Costs OPEX totals US$3,848.3 M or US$23.4/wmt. The consumables (offshore fuel) Costs OPEX is summarized in Table 18.18, and comprises:
| Table 18.18 | Consumables (offshore fuel) Costs |
| OPEX Component | Total LOM (US$M) |
Average LOM (US$/wmt) |
| Fuel - Production Vessel | 658.2 | 4.0 |
| Fuel - Collectors | 1,012.7 | 6.2 |
| Fuel - Transfer vessel | 373.0 | 2.3 |
| Fuel - Supply Vessel | 263.3 | 1.6 |
| Fuel - Bulk Carrier CCZ to INDO - Capesize | 1,541.0 | 9.4 |
| Consumables (offshore fuel) Costs Total | 3,848.3 | 23.4 |
Key inputs and assumptions used in the cost estimate were:
| · | Fuel - Production Vessel |
| ― | MGO fuel price of US$700/t, this is based on end of Q1 2025 data obtained from Ship and bunker spot pricing. |
| ― | Fuel consumption was calculated by Allseas. |
| amcconsultants.com | 387 |
| Technical Report Summary of Prefeasibility Study of NORI Area D, Clarion Clipperton Zone | |
| TMC the metals company Inc. | 0225054 |
| · | Fuel - Production Collectors (Compressor Spread) |
| ― | MGO fuel price of US$700/t, this is based on end of Q1 2025 data obtained from Ship and bunker spot pricing. |
| ― | Fuel consumption was calculated by Allseas |
| · | Fuel – Transfer Vessel |
| ― | MGO fuel price of US$700/t, this is based on end of Q1 2025 data obtained from Ship and bunker spot pricing. |
| ― | Fleet sizing based on logistics cycle times calculated by TMC. |
| ― | Fuel consumption was calculated by industry norms. |
| · | Fuel - Supply Vessel |
| ― | MGO fuel price of US$700/t, this is based on end of Q1 2025 data obtained from Ship and bunker spot pricing. |
| ― | Fleet sizing based on logistics cycle times calculated by TMC. |
| ― | Fuel consumption was calculated by industry norms. |
| · | Fuel - Bulk Carrier CCZ to INDO - Capesize |
| ― | MGO fuel price of US$700/t, this is based on end of Q1 2025 data obtained from Ship and bunker spot pricing. |
| ― | Fleet sizing based on logistics cycle times calculated by TMC. |
| ― | Fuel consumption was calculated by industry norms. |
| 18.6.5 | Processing Costs |
The processing costs OPEX totals US$13,622.8 M or US$83.0/wmt. The processing costs OPEX is summarized in Table 18.19, and comprises:
| Table 18.19 | Processing Costs |
| OPEX Component | Total LOM (US$M) |
Average LOM (US$/wmt) |
| PAMCO Alloy Toll Charge | 241.0 | 1.5 |
| PAMCO Matte Toll Charge | 764.0 | 4.7 |
| INDO Matte Toll Charge | 12,616.8 | 80.0 |
| Processing Cost Total | 13,621.8 | 83.0 |
Key inputs and assumptions used in the cost estimate were:
| · | PAMCO Alloy Tolling Charge - All in tolling charge provided by PAMCO including: |
| ― | Fixed processing costs. |
| ― | Contracting and unloading costs. |
| ― | Raw material, smelting and reduction costs. |
| ― | Consumables including electricity, coal and fuel oil. |
| ― | Fixed plant capital recovery fee. |
| ― | Profit. |
| · | PAMCO Matte Tolling Charge – all in tolling charge estimated by TMC from the PAMCO alloy estimates with assumed, factored or known processing increases including electricity consumption, sulphur requirements, and plant capital upgrades for matte production. Benchmarked against CA engineering and provided by a global leading consulting engineering firm’s operating cost estimate. |
| amcconsultants.com | 388 |
| Technical Report Summary of Prefeasibility Study of NORI Area D, Clarion Clipperton Zone | |
| TMC the metals company Inc. | 0225054 |
| · | INDO Matte Tolling Charge – All in tolling charge estimated by SMM Information & Technology Co., Ltd processing cost study as detailed in Table 15.4. Benchmarked against known/published nickel pig iron processing cost in Indonesia. Nickel pig iron processing is closely related to nodule processing for TMC’s product. |
| 18.6.6 | Refining Costs |
The refining costs OPEX totals US$3,253.7M or US$19.8/wmt. The Refining Costs OPEX is summarized in Table 18.20, and comprises:
| Table 18.20 | Refining Costs |
| OPEX Component | Total LOM (US$M) |
Average LOM (US$/wmt) |
| US Refining Fixed Cost | 1,082.5 | 6.6 |
| US Refining Variable Cost | 1,715.9 | 10.5 |
| US Financing Cost | 455.4 | 2.8 |
| Refining Cost Total | 3,253.7 | 19.8 |
Key inputs and assumptions used in the cost estimate were:
| · | US refining fixed cost was provided by a global leading consulting engineering firm and includes: |
| ― | Plant labour including supervisors, engineers, laboratory, site workers and operators |
| ― | Plant equipment, materials, supplies, first fills |
| ― | Maintenance materials |
| ― | Plant management |
| · | US refining variable cost was provided by a global leading consulting engineering firm and includes: |
| ― | Reagents including sulphuric acid, sodium hydroxide, anhydrous liquid ammonia, sulphur dioxide, oxygen, nickel and cobalt extractants, SX diluent, copper IX resin, granular activated carbon and flocculant and coagulant. |
| ― | Energy including electricity, natural gas, diesel. |
| ― | Water including makeup water acquisition, pretreated water, demineralized water |
| ― | Other consumables including effluent treatment, manganese oxidation scrubber consumables, filtration consumables and additives, product packaging |
| · | US capital financing costs includes: |
| ― | First 6 Mwmt nodule equivalent plant capital cost totals US$2,213M |
| ― | 60% of capital cost financed through debt |
| ― | Debt finance with real interest rate of 8% |
| ― | Free Cashflow to debt repayment 20% |
| ― | Total financing cost $455.4M |
| amcconsultants.com | 389 |
| Technical Report Summary of Prefeasibility Study of NORI Area D, Clarion Clipperton Zone | |
| TMC the metals company Inc. | 0225054 |
| 18.6.7 | Corporate Costs |
The corporate costs OPEX totals US$1,984.6 M or US$12.1/wmt. The Corporate Costs OPEX is summarized in Table 18.21, and comprises:
| Table 18.21 | Corporate Costs |
| OPEX Component | Total LOM (US$M) |
Average LOM (US$/wmt) |
| Overhead - Corporate | 475.0 | 2.9 |
| Campaign/EMMP | 569.6 | 3.5 |
| Offshore operations support | 164.3 | 1.0 |
| OPEX Contingency | 775.7 | 4.7 |
| Corporate Cost Total | 1,984.6 | 12.1 |
Key inputs and assumptions used in the cost estimate were:
| · | Overhead – corporate cost estimated by TMC based on actual and projected overhead cost. |
| · | Campaign/EMMP cost estimated by TMC based on actual campaign and EMMP costs including: |
| ― | Research vessel and crew. |
| ― | AUV and ROV’s. |
| ― | Environmental monitoring equipment and personnel. |
| ― | Fuel. |
| · | Offshore operations support facilities cost estimated by TMC based on historical knowledge and actual costs of operations support facilities including: |
| ― | Contractor personal – office and site. |
| ― | TMC personal. |
| ― | Service contracts - waste, security etc. |
| ― | Office/laydown/warehouse lease costs. |
| ― | Office/laydown/warehouse material, equipment, supplies. |
| · | OPEX contingency. |
| amcconsultants.com | 390 |
| Technical Report Summary of Prefeasibility Study of NORI Area D, Clarion Clipperton Zone | |
| TMC the metals company Inc. | 0225054 |
| 19 | Economic analysis |
| 19.1 | Cautionary statement regarding forward-looking information |
The results of the economic analysis discussed in this section includes forward looking information and statements. The project team as the author of this chapter, provides the following cautionary statement regarding forward looking information.
TMC is subject to the reporting requirements of the Exchange Act. The results of the financial and economic analyses discussed in this section represent forward-looking statements within the meaning of applicable securities laws relating to TMC. These statements by their nature involve substantial risks and uncertainties. Statements involving the foregoing results of financial and economic analyses are forward-looking statements. Without limiting the generality of the foregoing, words such as “may”, “anticipate”, “intend”, “could”, “estimate”, or “continue” or the negative or other comparable terminology are intended to identify forward-looking statements. Should one or more of these risks or uncertainties materialize or should the underlying assumptions prove incorrect, actual outcomes and results could differ materially from those indicated in the forward-looking statements.
Information that is forward-looking includes, but is not limited to, the following:
| · | Mineral Reserve that was modified from Mineral Resource. |
| · | Assumed commodity prices and exchange rates. |
| · | Proposed mine production plan. |
| · | Projected mining and process recovery rates. |
| · | Assumptions as to mining dilution. |
| · | Assumptions as to geotechnical requirements for collector on the seabed. |
| · | Proposed sustaining costs and operating costs. |
| · | TMC’s intentions on payback of LCR royalty. |
| · | Assumptions as to closure costs and closure requirements. |
| · | Assumptions as to environmental, permitting, and social risks. |
Additional risks to the forward-looking information include:
| · | Changes to the costs of production from what is assumed. |
| · | Unexpected variations in quantity of mineralized material, grade or recovery rates. |
| · | Geotechnical considerations during mining being different from what was assumed. |
| · | Failure of mining methods to operate as anticipated. |
| · | Failure of plant, equipment or processes to operate as anticipated. |
| · | Changes to assumptions as to the availability of electrical power, and the power rates used in the operating cost estimates and financial analysis. |
| · | Unrecognized environmental risks. |
| · | Unanticipated closure expenses. |
| · | Ability to maintain social license to operate. |
| · | Accidents, labour disputes and other risks of the mining industry. |
| · | Changes to interest rates. |
| · | Changes to tax rates. |
Other key considerations when reviewing the content within this chapter:
| · | Calendar years used in the financial analysis are provided for conceptual purposes only. |
| amcconsultants.com | 391 |
| Technical Report Summary of Prefeasibility Study of NORI Area D, Clarion Clipperton Zone | |
| TMC the metals company Inc. | 0225054 |
| · | Notional model start date of 1 July 2025 and annual discounting combined with the assumption of mid-period cash flows results in effective model years commencing 1 July and ending 30 June. |
| · | Totals may not reflect the sum of table contents due to the effects of rounding. |
| · | Environmental approval must still be obtained in support of operations. |
| 19.2 | Methodology used |
An economic model was developed to estimate annual pre-tax and post-tax cash flows and sensitivities of the Project based on a 8% discount rate. Tax estimates involve complex variables that can only be accurately calculated during operations and, as such, the after-tax results are approximations. The economic analysis was run in real, ungeared, post-tax terms.
| 19.3 | Economic model parameters |
The economic analysis was performed used the following key assumptions:
| · | Production plan as per provided Resource and mining inventories and maximum run lengths. |
| · | Cost estimates with no inflation of escalation attributed. |
| · | Valuation date of 1 July 2025. |
| · | Commercial production starting on October 1, 2027 (Year 0). |
| · | LOM of 19 years. |
| · | All cash flows discounted at an 8% discount rate. |
| · | Products are assumed to be sold in the same year they are produced. |
| 19.4 | Total capital costs |
The Project CAPEX estimate of US$4,918M (excluding escalation) comprising of US$492M for Production Vessel #1 and associated costs (System #1), inclusive of Allseas credit, is summarized in Table 19.1 and US$4,426M for two 6 Mwmt nodule equivalent refining facilities in the US, is summarized in Table 19.2.
| Table 19.1 | Project capital system #1 costs |
| Description | US$ M |
| Production Vessel | 469 |
| Transfer Vessel/Bulk Carriers | 90 |
| Support Vessel | 15 |
| Processing/Refining | - |
| Operations Facilities initial setup | 2 |
| Direct Subtotal | 576 |
| Professional Services | 59 |
| Owners Cost | 45 |
| Indirect Subtotal | 104 |
| Contingency | 101 |
| Allseas Credit | (289) |
| Total Project CAPEX | 492 |
| amcconsultants.com | 392 |
| Technical Report Summary of Prefeasibility Study of NORI Area D, Clarion Clipperton Zone | |
| TMC the metals company Inc. | 0225054 |
| Table 19.2 | Project capital us refining costs |
| Description | US$ M |
| General/Infrastructure | 144.8 |
| Port Facilities | 281.1 |
| Hydrometallurgy | 1,027.7 |
| Direct Subtotal | 1,453.7 |
| Indirect Costs | 477.2 |
| Contingency | 282.2 |
| Refining Facility Capital | 2,213.0 |
| Number of 6 Mwtpa refining facility | 2 |
| Total Project CAPEX | 4,426.0 |
| 19.5 | Total sustaining costs |
The Sustaining Cost estimate of US$1,550M during operations as detailed in Chapter 18 of this document.
| 19.6 | Total closure costs |
The Sustaining Cost estimate of US$115M as detailed in Chapter 18 of this document.
| 19.7 | Total operating costs |
The Project OPEX estimate of US$39,978M, is summarized in Table 19.3.
| Table 19.3 | Total operating costs |
| OPEX component | Total LOM (US$M) |
Average LOM (US$/wmt) |
| Collection Costs | 12,344 | 75.2 |
| Transfer & Shipping Costs | 3,071 | 18.7 |
| Contractor (offshore) Costs | 1,855 | 11.3 |
| Consumables (offshore fuel) Costs | 3,848 | 23.4 |
| Processing Cost | 13,622 | 83.0 |
| Refining Cost | 3,254 | 19.8 |
| Corporate Cost | 1,985 | 12.1 |
| Total OPEX | 39,978 | 243.6 |
| 19.8 | Commodity prices |
Metal and sulfate price assumptions for Nickel, Cobalt and Copper were provided by Benchmark Mineral Intelligence as of 30 June 2025. Manganese metal price assumption was provided by CRU Consulting as of the 2 May 2025. Both sources provided long-term price forecasts based on a market analysis of supply and demand at the time of this report.
The average LOM commodity prices is summarized in Table 19.4.
| amcconsultants.com | 393 |
| Technical Report Summary of Prefeasibility Study of NORI Area D, Clarion Clipperton Zone | |
| TMC the metals company Inc. | 0225054 |
| Table 19.4 | Average LOM commodity prices |
| Commodity | UOM | Price per UOM |
| Nickel Price (C1 LME) | US$/t | 20,295.3 |
| Cobalt Price (C1 LME) | US$/t | 56,116.9 |
| Copper Cathode Price (C1 LME) | US$/t | 11,440.1 |
| Manganese Price | US$/t | 545 |
| Manganese Silicate Price | US$/dmtu | 5.45 |
| Nickel Sulfate Price (100% contained Ni basis) | US$/t | 21,632.9 |
| Cobalt Sulfate Price (100% contained Co basis) | US$/t | 55,198.3 |
| 19.9 | Recovery rates |
Recovery assumptions were provided by Hatch, which performed a series of mass energy balance recoveries calculation. The recovery rates are summarized in Table 19.5.
| Table 19.5 | Recovery rates |
| Recovery | Value (%) |
| Nickel Recovery Nodule to Alloy | 96.9 |
| Cobalt Recovery Nodule to Alloy | 93.1 |
| Copper Recovery Nodule to Alloy | 93.6 |
| Nickel Recovery Nodule to Matte | 94.8 |
| Cobalt Recovery Nodule to Matte | 77.5 |
| Copper Recovery Nodule to Matte | 86.4 |
| Manganese Recovery to Mn Silicate | 98.9 |
| Nickel Recovery - Nodule to Sulfate | 94.6 |
| Cobalt Recovery - Nodule to Sulfate | 77.2 |
| Copper Recovery - Nodule to Cathode | 86.2 |
| 19.10 | Payable terms |
Metal payable term assumptions were provided by CRU Consulting. This provides long-term payable terms forecasts based on the market analysis of supply and demand. The average LOM payable terms are summarized in Table 19.6.
| Table 19.6 | LOM Average Payable Terms |
| Recovery | Value (%) |
| Nickel Payable Factor for Alloy | 65.0 |
| Nickle Payable Factor for Matte | 80.0 |
| Cobalt Payable Factor for Alloy | 44.1 |
| Cobalt Payable Factor for Matte | 60.0 |
| Copper Payable Factor for Alloy | 60.0 |
| Copper Payable Factor for Matte | 70.0 |
| 19.11 | Royalty/continuity payments |
The economic model assumes that the TMC will be subject to two royalty/payment structures, as per below.
| amcconsultants.com | 394 |
| Technical Report Summary of Prefeasibility Study of NORI Area D, Clarion Clipperton Zone | |
| TMC the metals company Inc. | 0225054 |
| 19.11.1 | Nauru Continuity Benefits |
The structure for the Nauru Continuity Benefits payment is based on the NORI Sponsorship Agreement. The Nauru Continuity Benefits is based on the payment schedule in Table 19.7. An annual US$0.5M administrative fee is allowed.
| Table 19.7 | Nauru Continuity Benefits Payment Schedule |
| Item | US$ M |
| Year 1 | 1.0 |
| Year 2 | 2.0 |
| Year 3 | 4.0 |
| Year 4 | 8.0 |
| Year 5+ | 10.0 |
Total undiscounted payments to Nauru are approximately US$194M over the LOM.
| 19.11.2 | Low Carbon Royalty (LCR) |
In February 2023, TMC entered into a strategic partnership with Low Carbon Royalties Inc. (LCR), granting LCR a 2.0% gross overriding royalty on future revenue from TMC’s NORI project in exchange for a 35% equity stake in LCR and $5 million in cash.
The LCR royalty is based on a percentage of total revenue, starting at a rate of 2% with two opportunities for buyback reducing the percentage value. The PFS assumes the first buy back occurs in 2030 with zero cost of buyback reducing the percentage to 1% and the second buyback occurring in 2031 with zero cost of buyback reducing the percentage to 0.5%.
Total undiscounted royalty payments to LCR are approximately US$465M over the LOM.
| 19.12 | Taxes |
It has been assumed that NORI Area D Project will be subject to a single taxation structure. The USA Federal taxation rate and structure assumed in the economic model is as follows:
| · | Federal taxation rate at 21%. |
| · | Depreciation based on straight-line basis, based on the assumed system design life. |
| · | Total undiscounted taxation is approximately US$5,645M over the LOM. |
| 19.13 | Economic analysis |
The economic analysis was performed assuming an 8% discount rate, representing the registrant’s assumption of the Project weighted average cost of capital (WACC). Compared to the 9% discount rate used in the 2021 Initial Assessment for NORI Area D, the discount rate of 8% reflects the registrant’s view that the achievement of de-risking milestones on the project in the last several years has lowered the WACC for the Project. De-risking milestones include:
| · | Successful pilot collection system trial (Test Mining) in 2022 in which over 3,000 wet tonnes of nodules were lifted to the surface. |
| · | Improved confidence in the permitting pathway through the existing U.S. regulatory regime. |
The post-tax net present value (NPV) discounted at 8% is US$5,508M; the internal rate of return (IRR) is 26.8%; and payback period (production) is 7 years.
A summary of forecast Project economics is shown graphically in Figure 19.1 and listed in Table 19.8.
| amcconsultants.com | 395 |
| Technical Report Summary of Prefeasibility Study of NORI Area D, Clarion Clipperton Zone | |
| TMC the metals company Inc. | 0225054 |
| Figure 19.1 | Forecast Project post-tax free cash flow (US$ M) |
Source: TMC
Note: PP = pre-production
| Table 19.8 | Summary of forecast Project economics |
| Area | Item | Units | LOM Total/Avg. |
| General | Nickel Price (C1 LME) | Avg. US$/t | 20,295.3 |
| Cobalt Price (C1 LME) | Avg. US$/t | 56,116.9 | |
| Copper Cathode Price (C1 LME) | Avg. US$/t | 11,440.1 | |
| Manganese Price | Avg. US$/t | 545.5 | |
| Nickel Sulfate Price (100% contained Ni basis) | Avg. US$/t | 21,632.9 | |
| Cobalt Sulfate Price (100% contained Co basis) | Avg. US$/t | 55,198.3 | |
| Mine Life | Years | 19.0 | |
| Total Ore Collected (wet) | Mt | 164.1 | |
Production (Nickel) |
Resource Grade | % | 1.40% |
| Contained Metal in Recovered Nodules | Kt | 1,654.2 | |
| Recovery Nodule to Alloy | % | 96.91% | |
| Recovery Nodule to Matte | % | 94.76% | |
| Recovery Nodule to Sulfate | % | 94.60% | |
| Recovered Metal in Alloy | Kt | 18.1 | |
| Recovered Metal in Matte | Kt | 1,549.9 | |
| Recovered Metal in Sulfate | Kt | 1,095.7 | |
| Payable Factor for Alloy | % | 65.00% | |
| Payable Factor for Matte | % | 80.00% | |
| Payable Factor Sulfate | % | 100.00% | |
| Payable Metal in Alloy | Kt | 11.7 | |
| Payable Metal in Matte | Kt | 361.8 | |
| Payable Metal in Sulfate | Kt | 1,095.7 | |
| Nickel Products Total Revenue | US$ M | 31,449.5 |
| amcconsultants.com | 396 |
| Technical Report Summary of Prefeasibility Study of NORI Area D, Clarion Clipperton Zone | |
| TMC the metals company Inc. | 0225054 |
| Area | Item | Units | LOM Total/Avg. |
| Production (Cobalt) |
Resource Grade | % | 0.14% |
| Contained Metal in Recovered Nodules | Kt | 165.4 | |
| Recovery Nodule to Alloy | % | 93.06% | |
| Recovery Nodule to Matte | % | 77.54% | |
| Recovery Nodule to Sulfate | % | 77.20% | |
| Recovered Metal in Alloy | Kt | 1.7 | |
| Recovered Metal in Matte | Kt | 126.8 | |
| Recovered Metal in Sulfate | Kt | 89.4 | |
| Payable Factor for Alloy | % | 44.15% | |
| Payable Factor for Matte | % | 60.00% | |
| Payable Factor Sulfate | % | 100.00% | |
| Payable Metal in Alloy | Kt | 0.8 | |
| Payable Metal in Matte | Kt | 22.2 | |
| Payable Metal in Sulfate | Kt | 89.4 | |
| Cobalt Products Total Revenue | US$ M | 6,465.7 | |
| Production (Copper) |
Resource Grade | % | 1.14% |
| Contained Metal in Recovered Nodules | Kt | 1,347.0 | |
| Recovery Nodule to Alloy | % | 93.55% | |
| Recovery Nodule to Matte | % | 86.43% | |
| Recovery Nodule to Sulfate | % | 86.20% | |
| Recovered Metal in Alloy | Kt | 14.2 | |
| Recovered Metal in Matte | Kt | 1,151.1 | |
| Recovered Metal in Sulfate | Kt | 813.0 | |
| Payable Factor for Alloy | % | 59.98% | |
| Payable Factor for Matte | % | 70.00% | |
| Payable Factor Sulfate | % | 100.00% | |
| Payable Metal in Alloy | Kt | 8.3 | |
| Payable Metal in Matte | Kt | 235.1 | |
| Payable Metal in Sulfate | Kt | 813.0 | |
| Copper Products Total Revenue | US$ M | 12,090.9 | |
| Production (Manganese) |
Resource Grade | % | 31.15% |
| Contained Metal in Recovered Nodules | Kt | 36,806.5 | |
| Recovery Nodule to Manganese | % | 98.90% | |
| Recovered Metal in Manganese | Kt | 36,401.7 | |
| Payable Factor for Manganese | % | 100.00% | |
| Payable Metal in Manganese | Kt | 36,401.7 | |
| Managese Products Total Revenue | US$ M | 19,856.1 | |
| Operating Cost | Collection Costs | US$/Wet Tonne | 75.2 |
| Transfer & Shipping Costs | US$/Wet Tonne | 18.7 | |
| Contractor (offshore) Costs | US$/Wet Tonne | 11.3 | |
| Consumables (fuel) Costs (offshore) | US$/Wet Tonne | 23.4 | |
| Processing Cost | US$/Wet Tonne | 83.0 | |
| Refining Cost | US$/Wet Tonne | 19.8 | |
| Corporate Cost | US$/Wet Tonne | 12.1 | |
| Royalty Cost | Nauru Continuity Payment | US$/Wet Tonne | 1.2 |
| LCR Royalty | US$/Wet Tonne | 2.8 |
| amcconsultants.com | 397 |
| Technical Report Summary of Prefeasibility Study of NORI Area D, Clarion Clipperton Zone | |
| TMC the metals company Inc. | 0225054 |
| Area | Item | Units | LOM Total/Avg. |
| Capital Cost | Project Capital (excluding escalation) | US$ M | 4,917.6 |
| Sustaining Capital | US$ M | 1,550.0 | |
| Closure Cost | US$ M | 115.3 | |
| Financials | Total Revenue | US$ M | 72,958 |
| Post-Tax NPV8 | US$ M | 5,508 | |
| Post-Tax NPV0 | US$ M | 19,922 | |
| Project IRR (Real Terms) | % | 26.8% | |
| Project Payback – Production | Years | 7 | |
| EBITDA | US$ M | 32,321 | |
| EBITDA per tonne (dry nodules) | US$/Wet Tonne | 274 | |
| Total Project Capital | US$ M | 4,918 |
A cashflow on an annualized basis is provided in Table 19.9.
| amcconsultants.com | 398 |
| Technical Report Summary of Prefeasibility Study of NORI Area D, Clarion Clipperton Zone | |
| TMC the metals company Inc. | 0225054 |
Table 19.9 Project Cash Flow on an Annualized basis
| Macro Assumptions | Units | LOM Total/Avg. | PP1 2025 | PP2 2026 | Year 0 2027 | Year 1 2028 | Year 2 2029 |
| Nickel Price (C1 LME)2 | US$/t | 20,295.3 | -- | -- | 18,833 | 18,833 | 18,833 |
| Cobalt Price (C1 LME)2 | US$/t | 56,116.9 | -- | -- | 34,172 | 34,172 | 34,172 |
| Copper Cathode Price (C1 LME)2 | US$/t | 11,440.1 | -- | -- | 11,317 | 11,317 | 11,317 |
| Manganese Price2 | US$/t | 545.5 | -- | -- | 529 | 529 | 529 |
| Manganese Price2 | US$/DMTU | 5.45 | -- | -- | 5.29 | 5.29 | 5.29 |
| Nickel Sulfate Price (100% contained Ni basis)2 | US$/t | 21,632.9 | -- | -- | 19,623 | 19,623 | 19,623 |
| Cobalt Sulfate Price (100% contained Co basis)2 | US$/t | 55,198.3 | -- | -- | 31,347 | 31,347 | 31,347 |
| Revenue | US$ M | 72,957.8 | -- | -- | 53.4 | 276.2 | 617.7 |
| Total Operating Costs | US$ M | (39,977.8) | -- | -- | (154.8) | (478.7) | (642.8) |
| Total Royalties | US$ M | (659.1) | (0.6) | (0.6) | (2.0) | (7.5) | (17.3) |
| EBITDA (non-GAAP1) | US$ M | 32,321.0 | (0.6) | (0.6) | (103.4) | (210.0) | (42.4) |
| Depreciation | US$ M | (5,592.2) | -- | (11.0) | (23.1) | (30.0) | (35.2) |
| EBIT | US$ M | 26,728.8 | (0.6) | (11.6) | (126.5) | (240.0) | (77.7) |
| Taxation | US$ M | (5,645.3) | -- | -- | -- | -- | -- |
| Net Profit After Tax | US$ M | 21,083.4 | (0.6) | (11.6) | (126.5) | (240.0) | (77.7) |
| Free Cash Flow | US$ M | 19,922.1 | (176.3) | (207.0) | (191.9) | (325.5) | (262.2) |
| Project Capital | US$ M | (4,917.6) | (175.6) | (206.3) | (92.5) | (105.6) | (177.0) |
| Sustaining Capital | US$ M | (1,550.0) | -- | -- | -- | -- | -- |
| Closure Capital | US$ M | (115.3) | -- | -- | -- | -- | -- |
| Total Capital | US$ M | (6,582.8) | (175.6) | (206.3) | (92.5) | (105.6) | (177.0) |
| Production Summary | |||||||
| Total Wet Ore Collected | Mtpa | 164.1 | -- | -- | 0.2 | 1.0 | 2.0 |
| Life of Mine | Years | 19.0 | -- | -- | 1.0 | 1.0 | 1.0 |
| Physicals Nickel Products | |||||||
| Resource Grade | % | 1.4% | -- | -- | 1.40% | 1.40% | 1.40% |
| amcconsultants.com | 399 |
| Technical Report Summary of Prefeasibility Study of NORI Area D, Clarion Clipperton Zone | |
| TMC the metals company Inc. | 0225054 |
| Macro Assumptions | Units | LOM Total/Avg. | PP1 2025 | PP2 2026 | Year 0 2027 | Year 1 2028 | Year 2 2029 |
| Contained Metal in Recovered Nodules | Kt | 1,654.2 | -- | -- | 2.0 | 10.1 | 20.2 |
| Recovery Nodule to Alloy | % | 96.9% | -- | -- | 96.91% | 96.91% | 96.91% |
| Recovery Nodule to Matte | % | 94.8% | -- | -- | 94.76% | 94.76% | 94.76% |
| Recovery Nodule to Sulfate | % | 94.6% | -- | -- | 94.60% | 94.60% | 94.60% |
| Recovered Metal in Alloy | Kt | 18.1 | -- | -- | 2.0 | 9.8 | 6.3 |
| Recovered Metal in Matte | Kt | 1,549.9 | -- | -- | -- | -- | 12.9 |
| Recovered Metal in Sulfate | Kt | 1,095.7 | -- | -- | -- | -- | -- |
| Payable Factor for Alloy | % | 65.0% | -- | -- | 62.00% | 65.00% | 65.00% |
| Payable Factor for Matte | % | 80.0% | -- | -- | 80.00% | 80.00% | 80.00% |
| Payable Factor Sulfate | % | 100.0% | -- | -- | 100.00% | 100.00% | 100.00% |
| Payable Metal in Alloy | Kt | 11.7 | -- | -- | 1.2 | 6.3 | 4.1 |
| Payable Metal in Matte | Kt | 361.8 | -- | -- | -- | -- | 10.3 |
| Payable Metal in Sulfate | Kt | 1,095.7 | -- | -- | -- | -- | -- |
| Nickel Products Total Revenue | US$ M | 31,449.5 | -- | -- | 19.4 | 102.2 | 247.0 |
| Physicals Cobalt | |||||||
| Resource Grade | % | 0.14% | -- | -- | 0.14% | 0.14% | 0.14% |
| Contained Metal in Recovered Nodules | Kt | 165.4 | -- | -- | 0.2 | 1.0 | 2.0 |
| Recovery Nodule to Alloy | % | 93.1% | -- | -- | 93.06% | 93.06% | 93.06% |
| Recovery Nodule to Matte | % | 77.5% | -- | -- | 77.54% | 77.54% | 77.54% |
| Recovery Nodule to Sulfate | % | 77.2% | -- | -- | 77.20% | 77.20% | 77.20% |
| Recovered Metal in Alloy | Kt | 1.7 | -- | -- | 0.2 | 0.9 | 0.6 |
| Recovered Metal in Matte | Kt | 126.8 | -- | -- | -- | -- | 1.1 |
| Recovered Metal in Sulfate | Kt | 89.4 | -- | -- | -- | -- | -- |
| Payable Factor for Alloy | % | 44.1% | -- | -- | 42.00% | 45.00% | 45.00% |
| Payable Factor for Matte | % | 60.0% | -- | -- | 60.00% | 60.00% | 60.00% |
| Payable Factor Sulfate | % | 100.0% | -- | -- | 100.00% | 100.00% | 100.00% |
| Payable Metal in Alloy | Kt | 0.8 | -- | -- | 0.1 | 0.4 | 0.3 |
| amcconsultants.com | 400 |
| Technical Report Summary of Prefeasibility Study of NORI Area D, Clarion Clipperton Zone | |
| TMC the metals company Inc. | 0225054 |
| Macro Assumptions | Units | LOM Total/Avg. | PP1 2025 | PP2 2026 | Year 0 2027 | Year 1 2028 | Year 2 2029 |
| Payable Metal in Matte | Kt | 22.2 | -- | -- | -- | -- | 0.6 |
| Payable Metal in Sulfate | Kt | 89.4 | -- | -- | -- | -- | -- |
| Cobalt Products Total Revenue | US$ M | 6,465.7 | -- | -- | 3.1 | 15.3 | 30.9 |
| Physicals Copper | |||||||
| Resource Grade | % | 1.14% | -- | -- | 1.14% | 1.14% | 1.14% |
| Contained Metal in Recovered Nodules | Kt | 1,347.0 | -- | -- | 1.6 | 8.2 | 16.4 |
| Recovery Nodule to Alloy | % | 93.6% | -- | -- | 93.55% | 93.55% | 93.55% |
| Recovery Nodule to Matte | % | 86.4% | -- | -- | 86.43% | 86.43% | 86.43% |
| Recovery Nodule to Sulfate | % | 86.2% | -- | -- | 86.20% | 86.20% | 86.20% |
| Recovered Metal in Alloy | Kt | 14.2 | -- | -- | 1.5 | 7.7 | 5.0 |
| Recovered Metal in Matte | Kt | 1,151.1 | -- | -- | -- | -- | 9.6 |
| Recovered Metal in Sulfate | Kt | 813.0 | -- | -- | -- | -- | -- |
| Payable Factor for Alloy | % | 60.0% | -- | -- | 54.00% | 58.00% | 60.00% |
| Payable Factor for Matte | % | 70.0% | -- | -- | 70.00% | 70.00% | 70.00% |
| Payable Factor Sulfate | % | 100.0% | -- | -- | 100.00% | 100.00% | 100.00% |
| Payable Metal in Alloy | Kt | 8.3 | -- | -- | 0.8 | 4.5 | 3.0 |
| Payable Metal in Matte | Kt | 235.1 | -- | -- | -- | -- | 6.7 |
| Payable Metal in Sulfate | Kt | 813.0 | -- | -- | -- | -- | -- |
| Copper Products Total Revenue | US$ M | 12,090.9 | -- | -- | 7.9 | 43.7 | 107.9 |
| Physicals Manganese | |||||||
| Resource Grade | % | 31.2% | -- | -- | 31.15% | 31.15% | 31.15% |
| Contained Metal in Recovered Nodules | Kt | 36,806.5 | -- | -- | 44.9 | 224.3 | 448.6 |
| Recovery Nodule to Manganese | % | 98.9% | -- | -- | 98.90% | 98.90% | 98.90% |
| Recovered Metal in Manganese | Kt | 36,401.7 | -- | -- | 44.4 | 221.8 | 443.6 |
| Payable Factor for Manganese | % | 100.0% | -- | -- | 100.00% | 100.00% | 100.00% |
| amcconsultants.com | 401 |
| Technical Report Summary of Prefeasibility Study of NORI Area D, Clarion Clipperton Zone | |
| TMC the metals company Inc. | 0225054 |
| Macro Assumptions | Units | LOM Total/Avg. | PP1 2025 | PP2 2026 | Year 0 2027 | Year 1 2028 | Year 2 2029 |
| Payable Metal in Manganese | Kt | 36,401.7 | -- | -- | 44.4 | 221.8 | 443.6 |
| Manganese Products Total Revenue | US$ M | 19,856.1 | -- | -- | 23.0 | 115.0 | 231.9 |
| Operating Costs | |||||||
| Collection Costs | US$ M | (12,343.6) | -- | -- | (32.9) | (131.8) | (131.8) |
| Transfer & Shipping Costs | US$ M | (3,070.7) | -- | -- | (14.5) | (64.2) | (74.6) |
| Contractor (offshore) Costs | US$ M | (1,855.1) | -- | -- | (14.9) | (45.6) | (59.3) |
| Consumables (offshore fuel) Costs | US$ M | (3,848.3) | -- | -- | (11.3) | (45.3) | (61.2) |
| Processing Cost | US$ M | (13,621.8) | -- | -- | (26.1) | (130.3) | (249.8) |
| Refining Cost | US$ M | (3,253.7) | -- | -- | -- | -- | -- |
| Corporate Cost | US$ M | (1,984.6) | -- | -- | (55.0) | (61.4) | (66.1) |
| Royalty Costs | |||||||
| USA Royalty | US$ M | -- | -- | -- | -- | -- | -- |
| Nauru Payment | US$ M | (194.4) | (0.6) | (0.6) | (0.6) | (0.6) | (1.9) |
| LCR Royalty | US$ M | (464.7) | -- | -- | (1.3) | (6.9) | (15.4) |
Notes: 1. Generally Accepted Accounting Principles
Notes: 2. Commodity prices presented as 5-year weighted averages
| Macro Assumptions | Units | Year 3 2030 |
Year 4 2031 |
Year 5 2032 |
Year 6 2033 |
Year 7 2034 |
Year 8 2035 |
| Nickel Price (C1 LME)2 | US$/t | 18,833 | 18,833 | 20,706 | 20,706 | 20,706 | 20,706 |
| Cobalt Price (C1 LME)2 | US$/t | 34,172 | 34,172 | 53,124 | 53,124 | 53,124 | 53,124 |
| Copper Cathode Price (C1 LME)2 | US$/t | 11,317 | 11,317 | 11,456 | 11,456 | 11,456 | 11,456 |
| Manganese Price2 | US$/t | 529 | 529 | 544 | 544 | 544 | 544 |
| Manganese Price2 | US$/DMTU | 5.29 | 5.29 | 5.44 | 5.44 | 5.44 | 5.44 |
| Nickel Sulfate Price (100% contained Ni basis)2 | US$/t | 19,623 | 19,623 | 22,007 | 22,007 | 22,007 | 22,007 |
| amcconsultants.com | 402 |
| Technical Report Summary of Prefeasibility Study of NORI Area D, Clarion Clipperton Zone | |
| TMC the metals company Inc. | 0225054 |
| Macro Assumptions | Units | Year 3 2030 |
Year 4 2031 |
Year 5 2032 |
Year 6 2033 |
Year 7 2034 |
Year 8 2035 |
| Cobalt Sulfate Price (100% contained Co basis)2 | US$/t | 31,347 | 31,347 | 51,336 | 51,336 | 51,336 | 51,336 |
| Revenue | US$ M | 1,654.3 | 3,747.3 | 3,717.4 | 4,316.1 | 4,338.3 | 4,395.8 |
| Total Operating Costs | US$ M | (1,360.2) | (2,792.2) | (2,667.5) | (2,625.6) | (2,632.3) | (2,634.7) |
| Total Royalties | US$ M | (23.8) | (29.0) | (33.9) | (40.1) | (40.2) | (40.6) |
| EBITDA (non-GAAP1) | US$ M | 270.3 | 926.1 | 1,016.1 | 1,650.4 | 1,665.8 | 1,720.4 |
| Depreciation | US$ M | (41.5) | (45.3) | (52.2) | (100.6) | (153.0) | (205.5) |
| EBIT | US$ M | 228.8 | 880.8 | 963.8 | 1,549.9 | 1,512.8 | 1,514.9 |
| Taxation | US$ M | -- | (43.2) | (209.5) | (333.9) | (326.1) | (326.7) |
| Net Profit After Tax | US$ M | 228.8 | 837.6 | 754.3 | 1,216.0 | 1,186.7 | 1,188.2 |
| Free Cash Flow | US$ M | (48.6) | 361.3 | 81.4 | 409.5 | 529.6 | 561.3 |
| Project Capital | US$ M | (206.6) | (292.1) | (557.3) | (642.5) | (642.3) | (658.5) |
| Sustaining Capital | US$ M | -- | -- | (155.0) | (155.0) | (155.0) | (155.0) |
| Closure Capital | US$ M | -- | -- | -- | -- | -- | -- |
| Total Capital | US$ M | (206.6) | (292.1) | (712.3) | (797.5) | (797.3) | (813.5) |
| Production Summary | |||||||
| Total Wet Ore Collected | Mtpa | 5.0 | 11.0 | 10.5 | 10.5 | 10.5 | 10.5 |
| Life of Mine | Years | 1.0 | 1.0 | 1.0 | 1.0 | 1.0 | 1.0 |
| Physicals Nickel Products | |||||||
| Resource Grade | % | 1.40% | 1.40% | 1.40% | 1.40% | 1.40% | 1.40% |
| Contained Metal in Recovered Nodules | Kt | 50.4 | 110.9 | 105.8 | 105.8 | 105.8 | 105.8 |
| Recovery Nodule to Alloy | % | 96.91% | 96.91% | 96.91% | 96.91% | 96.91% | 96.91% |
| Recovery Nodule to Matte | % | 94.76% | 94.76% | 94.76% | 94.76% | 94.76% | 94.76% |
| Recovery Nodule to Sulfate | % | 94.60% | 94.60% | 94.60% | 94.60% | 94.60% | 94.60% |
| Recovered Metal in Alloy | Kt | -- | -- | -- | -- | -- | -- |
| Recovered Metal in Matte | Kt | 47.8 | 105.1 | 100.3 | 100.3 | 100.3 | 100.3 |
| Recovered Metal in Sulfate | Kt | -- | -- | -- | 57.2 | 57.2 | 57.2 |
| Payable Factor for Alloy | % | 65.00% | 65.00% | 65.00% | 65.00% | 65.00% | 65.00% |
| amcconsultants.com | 403 |
| Technical Report Summary of Prefeasibility Study of NORI Area D, Clarion Clipperton Zone | |
| TMC the metals company Inc. | 0225054 |
| Macro Assumptions | Units | Year 3 2030 |
Year 4 2031 |
Year 5 2032 |
Year 6 2033 |
Year 7 2034 |
Year 8 2035 |
| Payable Factor for Matte | % | 80.00% | 80.00% | 80.00% | 80.00% | 80.00% | 80.00% |
| Payable Factor Sulfate | % | 100.00% | 100.00% | 100.00% | 100.00% | 100.00% | 100.00% |
| Payable Metal in Alloy | Kt | -- | -- | -- | -- | -- | -- |
| Payable Metal in Matte | Kt | 38.2 | 84.1 | 80.2 | 34.4 | 34.4 | 34.4 |
| Payable Metal in Sulfate | Kt | -- | -- | -- | 57.2 | 57.2 | 57.2 |
| Nickel Products Total Revenue | US$ M | 706.8 | 1,647.5 | 1,684.9 | 2,031.8 | 1,949.4 | 1,949.4 |
| Physicals Cobalt | |||||||
| Resource Grade | % | 0.14% | 0.14% | 0.14% | 0.14% | 0.14% | 0.14% |
| Contained Metal in Recovered Nodules | Kt | 5.0 | 11.1 | 10.6 | 10.6 | 10.6 | 10.6 |
| Recovery Nodule to Alloy | % | 93.06% | 93.06% | 93.06% | 93.06% | 93.06% | 93.06% |
| Recovery Nodule to Matte | % | 77.54% | 77.54% | 77.54% | 77.54% | 77.54% | 77.54% |
| Recovery Nodule to Sulfate | % | 77.20% | 77.20% | 77.20% | 77.20% | 77.20% | 77.20% |
| Recovered Metal in Alloy | Kt | -- | -- | -- | -- | -- | -- |
| Recovered Metal in Matte | Kt | 3.9 | 8.6 | 8.2 | 8.2 | 8.2 | 8.2 |
| Recovered Metal in Sulfate | Kt | -- | -- | -- | 4.7 | 4.7 | 4.7 |
| Payable Factor for Alloy | % | 45.00% | 40.00% | 40.00% | 42.00% | 45.00% | 45.00% |
| Payable Factor for Matte | % | 60.00% | 60.00% | 60.00% | 60.00% | 60.00% | 60.00% |
| Payable Factor Sulfate | % | 100.00% | 100.00% | 100.00% | 100.00% | 100.00% | 100.00% |
| Payable Metal in Alloy | Kt | -- | -- | -- | -- | -- | -- |
| Payable Metal in Matte | Kt | 2.3 | 5.2 | 4.9 | 2.1 | 2.1 | 2.1 |
| Payable Metal in Sulfate | Kt | -- | -- | -- | 4.7 | 4.7 | 4.7 |
| Cobalt Products Total Revenue | US$ M | 78.3 | 176.7 | 186.3 | 282.8 | 376.9 | 423.9 |
| Physicals Copper | |||||||
| Resource Grade | % | 1.14% | 1.14% | 1.14% | 1.14% | 1.14% | 1.14% |
| Contained Metal in Recovered Nodules | Kt | 41.0 | 90.3 | 86.2 | 86.2 | 86.2 | 86.2 |
| Recovery Nodule to Alloy | % | 93.55% | 93.55% | 93.55% | 93.55% | 93.55% | 93.55% |
| amcconsultants.com | 404 |
| Technical Report Summary of Prefeasibility Study of NORI Area D, Clarion Clipperton Zone | |
| TMC the metals company Inc. | 0225054 |
| Macro Assumptions | Units | Year 3 2030 |
Year 4 2031 |
Year 5 2032 |
Year 6 2033 |
Year 7 2034 |
Year 8 2035 |
| Recovery Nodule to Matte | % | 86.43% | 86.43% | 86.43% | 86.43% | 86.43% | 86.43% |
| Recovery Nodule to Sulfate | % | 86.20% | 86.20% | 86.20% | 86.20% | 86.20% | 86.20% |
| Recovered Metal in Alloy | Kt | -- | -- | -- | -- | -- | -- |
| Recovered Metal in Matte | Kt | 35.5 | 78.0 | 74.5 | 74.5 | 74.5 | 74.5 |
| Recovered Metal in Sulfate | Kt | -- | -- | -- | 42.5 | 42.5 | 42.5 |
| Payable Factor for Alloy | % | 60.00% | 60.00% | 60.00% | 60.00% | 60.00% | 60.00% |
| Payable Factor for Matte | % | 70.00% | 70.00% | 70.00% | 70.00% | 70.00% | 70.00% |
| Payable Factor Sulfate | % | 100.00% | 100.00% | 100.00% | 100.00% | 100.00% | 100.00% |
| Payable Metal in Alloy | Kt | -- | -- | -- | -- | -- | -- |
| Payable Metal in Matte | Kt | 24.8 | 54.6 | 52.1 | 22.3 | 22.3 | 22.3 |
| Payable Metal in Sulfate | Kt | -- | -- | -- | 42.5 | 42.5 | 42.5 |
| Copper Products Total Revenue | US$ M | 284.5 | 625.8 | 597.4 | 742.4 | 742.4 | 742.4 |
| Physicals Manganese | |||||||
| Resource Grade | % | 31.15% | 31.15% | 31.15% | 31.15% | 31.15% | 31.15% |
| Contained Metal in Recovered Nodules | Kt | 1,121.4 | 2,467.1 | 2,354.9 | 2,354.9 | 2,354.9 | 2,354.9 |
| Recovery Nodule to Manganese | % | 98.90% | 98.90% | 98.90% | 98.90% | 98.90% | 98.90% |
| Recovered Metal in Manganese | Kt | 1,109.1 | 2,439.9 | 2,329.0 | 2,329.0 | 2,329.0 | 2,329.0 |
| Payable Factor for Manganese | % | 100.00% | 100.00% | 100.00% | 100.00% | 100.00% | 100.00% |
| Payable Metal in Manganese | Kt | 1,109.1 | 2,439.9 | 2,329.0 | 2,329.0 | 2,329.0 | 2,329.0 |
| Manganese Products Total Revenue | US$ M | 584.7 | 1,297.3 | 1,248.8 | 1,259.2 | 1,269.7 | 1,280.1 |
| Operating Costs | |||||||
| Collection Costs | US$ M | (414.5) | (1,010.0) | (1,004.5) | (914.0) | (914.0) | (914.0) |
| Transfer & Shipping Costs | US$ M | (117.0) | (214.8) | (198.0) | (179.6) | (179.6) | (179.6) |
| Contractor (offshore) Costs | US$ M | (91.3) | (149.1) | (117.7) | (136.2) | (136.2) | (136.2) |
| amcconsultants.com | 405 |
| Technical Report Summary of Prefeasibility Study of NORI Area D, Clarion Clipperton Zone | |
| TMC the metals company Inc. | 0225054 |
| Macro Assumptions | Units | Year 3 2030 |
Year 4 2031 |
Year 5 2032 |
Year 6 2033 |
Year 7 2034 |
Year 8 2035 |
| Consumables (offshore fuel) Costs | US$ M | (129.3) | (265.4) | (238.3) | (238.3) | (238.3) | (238.3) |
| Processing Cost | US$ M | (514.3) | (994.3) | (954.3) | (840.0) | (840.0) | (840.0) |
| Refining Cost | US$ M | (10.1) | (39.5) | (39.7) | (202.6) | (209.3) | (211.7) |
| Corporate Cost | US$ M | (83.8) | (119.0) | (114.9) | (114.9) | (114.9) | (114.9) |
| Royalty Costs | |||||||
| USA Royalty | US$ M | -- | -- | -- | -- | -- | -- |
| Nauru Payment | US$ M | (3.1) | (5.6) | (10.6) | (13.1) | (13.1) | (13.1) |
| LCR Royalty | US$ M | (20.7) | (23.4) | (23.2) | (27.0) | (27.1) | (27.5) |
Notes: 1. Generally Accepted Accounting Principles
Notes: 2. Commodity prices presented as 5-year weighted averages
| Macro Assumptions | Units | Year 9 2036 |
Year 10 2037 |
Year 11 2038 |
Year 12 2039 |
Year 13 2040 |
Year 14 2041 |
| Nickel Price (C1 LME)2 | US$/t | 20,706 | 20,360 | 20,360 | 20,360 | 20,360 | 20,360 |
| Cobalt Price (C1 LME)2 | US$/t | 53,124 | 62,530 | 62,530 | 62,530 | 62,530 | 62,530 |
| Copper Cathode Price (C1 LME)2 | US$/t | 11,456 | 11,456 | 11,456 | 11,456 | 11,456 | 11,456 |
| Manganese Price2 | US$/t | 544 | 550 | 550 | 550 | 550 | 550 |
| Manganese Price2 | US$/DMTU | 5.44 | 5.50 | 5.50 | 5.50 | 5.50 | 5.50 |
| Nickel Sulfate Price (100% contained Ni basis)2 | US$/t | 22,007 | 21,835 | 21,835 | 21,835 | 21,835 | 21,835 |
| Cobalt Sulfate Price (100% contained Co basis)2 | US$/t | 51,336 | 62,530 | 62,530 | 62,530 | 62,530 | 62,530 |
| Revenue | US$ M | 4,941.3 | 4,828.4 | 4,828.4 | 4,828.4 | 4,828.4 | 5,518.1 |
| Total Operating Costs | US$ M | (3,005.4) | (2,819.8) | (2,638.8) | (2,638.8) | (2,457.7) | (2,476.7) |
| Total Royalties | US$ M | (44.0) | (43.3) | (43.3) | (43.3) | (43.3) | (47.6) |
| EBITDA (non-GAAP1) | US$ M | 1,891.9 | 1,965.2 | 2,146.3 | 2,146.3 | 2,327.3 | 2,993.8 |
| Depreciation | US$ M | (255.9) | (280.1) | (290.1) | (286.5) | (283.7) | (280.1) |
| EBIT | US$ M | 1,636.0 | 1,685.1 | 1,856.2 | 1,859.8 | 2,043.6 | 2,713.7 |
| Taxation | US$ M | (352.8) | (363.0) | (398.9) | (399.7) | (438.3) | (579.9) |
| Net Profit After Tax | US$ M | 1,283.2 | 1,322.1 | 1,457.3 | 1,460.1 | 1,605.4 | 2,133.8 |
| Free Cash Flow | US$ M | 674.8 | 1,073.5 | 1,566.5 | 1,580.3 | 1,707.9 | 2,290.5 |
| amcconsultants.com | 406 |
| Technical Report Summary of Prefeasibility Study of NORI Area D, Clarion Clipperton Zone | |
| TMC the metals company Inc. | 0225054 |
| Macro Assumptions | Units | Year 9 2036 |
Year 10 2037 |
Year 11 2038 |
Year 12 2039 |
Year 13 2040 |
Year 14 2041 |
| Project Capital | US$ M | (795.2) | (366.1) | -- | -- | -- | -- |
| Sustaining Capital | US$ M | -- | (155.0) | (155.0) | (155.0) | (155.0) | -- |
| Closure Capital | US$ M | -- | -- | -- | -- | -- | -- |
| Total Capital | US$ M | (795.2) | (521.0) | (155.0) | (155.0) | (155.0) | -- |
| Production Summary | |||||||
| Total Wet Ore Collected | Mtpa | 12.0 | 10.5 | 10.5 | 10.5 | 10.5 | 12.0 |
| Life of Mine | Years | 1.0 | 1.0 | 1.0 | 1.0 | 1.0 | 1.0 |
| Physicals Nickel Products | |||||||
| Resource Grade | % | 1.40% | 1.40% | 1.40% | 1.40% | 1.40% | 1.40% |
| Contained Metal in Recovered Nodules | Kt | 121.0 | 105.8 | 105.8 | 105.8 | 105.8 | 121.0 |
| Recovery Nodule to Alloy | % | 96.91% | 96.91% | 96.91% | 96.91% | 96.91% | 96.91% |
| Recovery Nodule to Matte | % | 94.76% | 94.76% | 94.76% | 94.76% | 94.76% | 94.76% |
| Recovery Nodule to Sulfate | % | 94.60% | 94.60% | 94.60% | 94.60% | 94.60% | 94.60% |
| Recovered Metal in Alloy | Kt | -- | -- | -- | -- | -- | -- |
| Recovered Metal in Matte | Kt | 114.6 | 100.3 | 100.3 | 100.3 | 100.3 | 114.6 |
| Recovered Metal in Sulfate | Kt | 57.2 | 100.1 | 100.1 | 100.1 | 100.1 | 114.4 |
| Payable Factor for Alloy | % | 65.00% | 65.00% | 65.00% | 65.00% | 65.00% | 65.00% |
| Payable Factor for Matte | % | 80.00% | 80.00% | 80.00% | 80.00% | 80.00% | 80.00% |
| Payable Factor Sulfate | % | 100.00% | 100.00% | 100.00% | 100.00% | 100.00% | 100.00% |
| Payable Metal in Alloy | Kt | -- | -- | -- | -- | -- | -- |
| Payable Metal in Matte | Kt | 45.8 | -- | -- | -- | -- | -- |
| Payable Metal in Sulfate | Kt | 57.2 | 100.1 | 100.1 | 100.1 | 100.1 | 114.4 |
| Nickel Products Total Revenue | US$ M | 2,182.7 | 2,186.2 | 2,186.2 | 2,186.2 | 2,186.2 | 2,498.5 |
| Physicals Cobalt | |||||||
| Resource Grade | % | 0.14% | 0.14% | 0.14% | 0.14% | 0.14% | 0.14% |
| Contained Metal in Recovered Nodules | Kt | 12.1 | 10.6 | 10.6 | 10.6 | 10.6 | 12.1 |
| Recovery Nodule to Alloy | % | 93.06% | 93.06% | 93.06% | 93.06% | 93.06% | 93.06% |
| Recovery Nodule to Matte | % | 77.54% | 77.54% | 77.54% | 77.54% | 77.54% | 77.54% |
| Recovery Nodule to Sulfate | % | 77.20% | 77.20% | 77.20% | 77.20% | 77.20% | 77.20% |
| amcconsultants.com | 407 |
| Technical Report Summary of Prefeasibility Study of NORI Area D, Clarion Clipperton Zone | |
| TMC the metals company Inc. | 0225054 |
| Macro Assumptions | Units | Year 9 2036 |
Year 10 2037 |
Year 11 2038 |
Year 12 2039 |
Year 13 2040 |
Year 14 2041 |
| Recovered Metal in Alloy | Kt | -- | -- | -- | -- | -- | -- |
| Recovered Metal in Matte | Kt | 9.4 | 8.2 | 8.2 | 8.2 | 8.2 | 9.4 |
| Recovered Metal in Sulfate | Kt | 4.7 | 8.2 | 8.2 | 8.2 | 8.2 | 9.3 |
| Payable Factor for Alloy | % | 45.00% | 45.00% | 45.00% | 45.00% | 45.00% | 45.00% |
| Payable Factor for Matte | % | 60.00% | 60.00% | 60.00% | 60.00% | 60.00% | 60.00% |
| Payable Factor Sulfate | % | 100.00% | 100.00% | 100.00% | 100.00% | 100.00% | 100.00% |
| Payable Metal in Alloy | Kt | -- | -- | -- | -- | -- | -- |
| Payable Metal in Matte | Kt | 2.8 | -- | -- | -- | -- | -- |
| Payable Metal in Sulfate | Kt | 4.7 | 8.2 | 8.2 | 8.2 | 8.2 | 9.3 |
| Cobalt Products Total Revenue | US$ M | 467.9 | 510.9 | 510.9 | 510.9 | 510.9 | 583.9 |
| Physicals Copper | |||||||
| Resource Grade | % | 1.14% | 1.14% | 1.14% | 1.14% | 1.14% | 1.14% |
| Contained Metal in Recovered Nodules | Kt | 98.5 | 86.2 | 86.2 | 86.2 | 86.2 | 98.5 |
| Recovery Nodule to Alloy | % | 93.55% | 93.55% | 93.55% | 93.55% | 93.55% | 93.55% |
| Recovery Nodule to Matte | % | 86.43% | 86.43% | 86.43% | 86.43% | 86.43% | 86.43% |
| Recovery Nodule to Sulfate | % | 86.20% | 86.20% | 86.20% | 86.20% | 86.20% | 86.20% |
| Recovered Metal in Alloy | Kt | -- | -- | -- | -- | -- | -- |
| Recovered Metal in Matte | Kt | 85.1 | 74.5 | 74.5 | 74.5 | 74.5 | 85.1 |
| Recovered Metal in Sulfate | Kt | 42.5 | 74.3 | 74.3 | 74.3 | 74.3 | 84.9 |
| Payable Factor for Alloy | % | 60.00% | 60.00% | 60.00% | 60.00% | 60.00% | 60.00% |
| Payable Factor for Matte | % | 70.00% | 70.00% | 70.00% | 70.00% | 70.00% | 70.00% |
| Payable Factor Sulfate | % | 100.00% | 100.00% | 100.00% | 100.00% | 100.00% | 100.00% |
| Payable Metal in Alloy | Kt | -- | -- | -- | -- | -- | -- |
| Payable Metal in Matte | Kt | 29.8 | -- | -- | -- | -- | -- |
| Payable Metal in Sulfate | Kt | 42.5 | 74.3 | 74.3 | 74.3 | 74.3 | 84.9 |
| Copper Products Total Revenue | US$ M | 827.7 | 851.1 | 851.1 | 851.1 | 851.1 | 972.7 |
| Physicals Manganese | |||||||
| Resource Grade | % | 31.15% | 31.15% | 31.15% | 31.15% | 31.15% | 31.15% |
| Contained Metal in Recovered Nodules | Kt | 2,691.4 | 2,354.9 | 2,354.9 | 2,354.9 | 2,354.9 | 2,691.4 |
| amcconsultants.com | 408 |
| Technical Report Summary of Prefeasibility Study of NORI Area D, Clarion Clipperton Zone | |
| TMC the metals company Inc. | 0225054 |
| Macro Assumptions | Units | Year 9 2036 |
Year 10 2037 |
Year 11 2038 |
Year 12 2039 |
Year 13 2040 |
Year 14 2041 |
| Recovery Nodule to Manganese | % | 98.90% | 98.90% | 98.90% | 98.90% | 98.90% | 98.90% |
| Recovered Metal in Manganese | Kt | 2,661.8 | 2,329.0 | 2,329.0 | 2,329.0 | 2,329.0 | 2,661.8 |
| Payable Factor for Manganese | % | 100.00% | 100.00% | 100.00% | 100.00% | 100.00% | 100.00% |
| Payable Metal in Manganese | Kt | 2,661.8 | 2,329.0 | 2,329.0 | 2,329.0 | 2,329.0 | 2,661.8 |
| Manganese Products Total Revenue | US$ M | 1,463.0 | 1,280.1 | 1,280.1 | 1,280.1 | 1,280.1 | 1,463.0 |
| Operating Costs | |||||||
| Collection Costs | US$ M | (1,070.4) | (1,004.5) | (914.0) | (914.0) | (732.9) | (527.1) |
| Transfer & Shipping Costs | US$ M | (204.1) | (186.0) | (186.0) | (186.0) | (186.0) | (212.6) |
| Contractor (offshore) Costs | US$ M | (149.1) | (108.9) | (90.4) | (90.4) | (90.4) | (103.4) |
| Consumables (offshore fuel) Costs | US$ M | (272.3) | (238.3) | (238.3) | (238.3) | (238.3) | (272.3) |
| Processing Cost | US$ M | (960.0) | (840.0) | (840.0) | (840.0) | (840.0) | (960.0) |
| Refining Cost | US$ M | (225.7) | (327.2) | (255.2) | (255.2) | (255.2) | (277.6) |
| Corporate Cost | US$ M | (123.7) | (114.9) | (114.9) | (114.9) | (114.9) | (123.7) |
| Royalty Costs | |||||||
| USA Royalty | US$ M | -- | -- | -- | -- | -- | -- |
| Nauru Payment | US$ M | (13.1) | (13.1) | (13.1) | (13.1) | (13.1) | (13.1) |
| LCR Royalty | US$ M | (30.9) | (30.2) | (30.2) | (30.2) | (30.2) | (34.5) |
Notes: 1. Generally Accepted Accounting Principles
Notes: 2. Commodity prices presented as 5-year weighted averages
| Macro Assumptions | Units | Year 15 2042 |
Year 16 2043 |
Year 17 2044 |
Year 18 2045 |
Year 19 2046 |
Year 20 2047 |
| Nickel Price (C1 LME)2 | US$/t | 20,360 | 20,360 | 20,360 | 20,360 | -- | -- |
| Cobalt Price (C1 LME)2 | US$/t | 62,530 | 62,530 | 62,530 | 62,530 | -- | -- |
| Copper Cathode Price (C1 LME)2 | US$/t | 11,456 | 11,456 | 11,456 | 11,456 | -- | -- |
| Manganese Price2 | US$/t | 550 | 550 | 550 | 550 | -- | -- |
| Manganese Price2 | US$/DMTU | 5.50 | 5.50 | 5.50 | 5.50 | -- | -- |
| Nickel Sulfate Price (100% contained Ni basis)2 | US$/t | 21,835 | 21,835 | 21,835 | 21,835 | -- | -- |
| Cobalt Sulfate Price (100% contained Co basis)2 | US$/t | 62,530 | 62,530 | 62,530 | 62,530 | -- | -- |
| amcconsultants.com | 409 |
| Technical Report Summary of Prefeasibility Study of NORI Area D, Clarion Clipperton Zone | |
| TMC the metals company Inc. | 0225054 |
| Macro Assumptions | Units | Year 15 2042 |
Year 16 2043 |
Year 17 2044 |
Year 18 2045 |
Year 19 2046 |
Year 20 2047 |
| Revenue | US$ M | 4,828.4 | 4,828.4 | 4,828.4 | 2,487.7 | 3,095.6 | -- |
| Total Operating Costs | US$ M | (2,186.1) | (2,186.1) | (2,325.1) | (1,254.5) | -- | -- |
| Total Royalties | US$ M | (43.3) | (43.3) | (43.3) | (28.7) | -- | -- |
| EBITDA (non-GAAP1) | US$ M | 2,599.0 | 2,599.0 | 2,460.0 | 1,204.5 | 3,095.6 | -- |
| Depreciation | US$ M | (273.7) | (270.8) | (268.4) | (2,405.4) | -- | -- |
| EBIT | US$ M | 2,325.3 | 2,328.2 | 2,191.6 | (1,201.0) | 3,095.6 | -- |
| Taxation | US$ M | (497.4) | (498.0) | (469.3) | -- | (408.7) | -- |
| Net Profit After Tax | US$ M | 1,827.9 | 1,830.2 | 1,722.3 | (1,201.0) | 2,686.9 | -- |
| Free Cash Flow | US$ M | 2,022.3 | 1,933.9 | 1,990.0 | 1,489.4 | 2,466.3 | 487.4 |
| Project Capital | US$ M | -- | -- | -- | -- | -- | -- |
| Sustaining Capital | US$ M | (155.0) | (155.0) | -- | -- | -- | -- |
| Closure Capital | US$ M | -- | -- | -- | -- | (11.5) | (11.5) |
| Total Capital | US$ M | (155.0) | (155.0) | -- | -- | (11.5) | (11.5) |
| Production Summary | -- | ||||||
| Total Wet Ore Collected | Mtpa | 10.5 | 10.5 | 10.5 | 5.4 | -- | -- |
| Life of Mine | Years | 1.0 | 1.0 | 1.0 | 1.0 | -- | -- |
| Physicals Nickel Products | -- | ||||||
| Resource Grade | % | 1.40% | 1.40% | 1.40% | 1.40% | -- | -- |
| Contained Metal in Recovered Nodules | Kt | 105.8 | 105.8 | 105.8 | 54.5 | -- | -- |
| Recovery Nodule to Alloy | % | 96.91% | 96.91% | 96.91% | 96.91% | -- | -- |
| Recovery Nodule to Matte | % | 94.76% | 94.76% | 94.76% | 94.76% | -- | -- |
| Recovery Nodule to Sulfate | % | 94.60% | 94.60% | 94.60% | 94.60% | -- | -- |
| Recovered Metal in Alloy | Kt | -- | -- | -- | -- | -- | -- |
| Recovered Metal in Matte | Kt | 100.3 | 100.3 | 100.3 | 51.7 | -- | -- |
| Recovered Metal in Sulfate | Kt | 100.1 | 100.1 | 100.1 | 51.6 | -- | -- |
| Payable Factor for Alloy | % | 65.00% | 65.00% | 65.00% | 65.00% | -- | -- |
| Payable Factor for Matte | % | 80.00% | 80.00% | 80.00% | 80.00% | -- | -- |
| Payable Factor Sulfate | % | 100.00% | 100.00% | 100.00% | 100.00% | -- | -- |
| Payable Metal in Alloy | Kt | -- | -- | -- | -- | -- | -- |
| amcconsultants.com | 410 |
| Technical Report Summary of Prefeasibility Study of NORI Area D, Clarion Clipperton Zone | |
| TMC the metals company Inc. | 0225054 |
| Macro Assumptions | Units | Year 15 2042 |
Year 16 2043 |
Year 17 2044 |
Year 18 2045 |
Year 19 2046 |
Year 20 2047 |
| Payable Metal in Matte | Kt | -- | -- | -- | -- | -- | -- |
| Payable Metal in Sulfate | Kt | 100.1 | 100.1 | 100.1 | 51.6 | -- | -- |
| Nickel Products Total Revenue | US$ M | 2,186.2 | 2,186.2 | 2,186.2 | 1,126.4 | -- | -- |
| Physicals Cobalt | -- | ||||||
| Resource Grade | % | 0.14% | 0.14% | 0.14% | 0.14% | -- | -- |
| Contained Metal in Recovered Nodules | Kt | 10.6 | 10.6 | 10.6 | 5.5 | -- | -- |
| Recovery Nodule to Alloy | % | 93.06% | 93.06% | 93.06% | 93.06% | -- | -- |
| Recovery Nodule to Matte | % | 77.54% | 77.54% | 77.54% | 77.54% | -- | -- |
| Recovery Nodule to Sulfate | % | 77.20% | 77.20% | 77.20% | 77.20% | -- | -- |
| Recovered Metal in Alloy | Kt | -- | -- | -- | -- | -- | -- |
| Recovered Metal in Matte | Kt | 8.2 | 8.2 | 8.2 | 4.2 | -- | -- |
| Recovered Metal in Sulfate | Kt | 8.2 | 8.2 | 8.2 | 4.2 | -- | -- |
| Payable Factor for Alloy | % | 45.00% | 45.00% | 45.00% | 45.00% | -- | -- |
| Payable Factor for Matte | % | 60.00% | 60.00% | 60.00% | 60.00% | -- | -- |
| Payable Factor Sulfate | % | 100.00% | 100.00% | 100.00% | 100.00% | -- | -- |
| Payable Metal in Alloy | Kt | -- | -- | -- | -- | -- | -- |
| Payable Metal in Matte | Kt | -- | -- | -- | -- | -- | -- |
| Payable Metal in Sulfate | Kt | 8.2 | 8.2 | 8.2 | 4.2 | -- | -- |
| Cobalt Products Total Revenue | US$ M | 510.9 | 510.9 | 510.9 | 263.2 | -- | -- |
| Physicals Copper | -- | ||||||
| Resource Grade | % | 1.14% | 1.14% | 1.14% | 1.14% | -- | -- |
| Contained Metal in Recovered Nodules | Kt | 86.2 | 86.2 | 86.2 | 44.4 | -- | -- |
| Recovery Nodule to Alloy | % | 93.55% | 93.55% | 93.55% | 93.55% | -- | -- |
| Recovery Nodule to Matte | % | 86.43% | 86.43% | 86.43% | 86.43% | -- | -- |
| Recovery Nodule to Sulfate | % | 86.20% | 86.20% | 86.20% | 86.20% | -- | -- |
| Recovered Metal in Alloy | Kt | -- | -- | -- | -- | -- | -- |
| Recovered Metal in Matte | Kt | 74.5 | 74.5 | 74.5 | 38.4 | -- | -- |
| Recovered Metal in Sulfate | Kt | 74.3 | 74.3 | 74.3 | 38.3 | -- | -- |
| Payable Factor for Alloy | % | 60.00% | 60.00% | 60.00% | 60.00% | -- | -- |
| amcconsultants.com | 411 |
| Technical Report Summary of Prefeasibility Study of NORI Area D, Clarion Clipperton Zone | |
| TMC the metals company Inc. | 0225054 |
| Macro Assumptions | Units | Year 15 2042 |
Year 16 2043 |
Year 17 2044 |
Year 18 2045 |
Year 19 2046 |
Year 20 2047 |
| Payable Factor for Matte | % | 70.00% | 70.00% | 70.00% | 70.00% | -- | -- |
| Payable Factor Sulfate | % | 100.00% | 100.00% | 100.00% | 100.00% | -- | -- |
| Payable Metal in Alloy | Kt | -- | -- | -- | -- | -- | -- |
| Payable Metal in Matte | Kt | -- | -- | -- | -- | -- | -- |
| Payable Metal in Sulfate | Kt | 74.3 | 74.3 | 74.3 | 38.3 | -- | -- |
| Copper Products Total Revenue | US$ M | 851.1 | 851.1 | 851.1 | 438.5 | -- | -- |
| Physicals Manganese | -- | ||||||
| Resource Grade | % | 31.15% | 31.15% | 31.15% | 31.15% | -- | -- |
| Contained Metal in Recovered Nodules | Kt | 2,354.9 | 2,354.9 | 2,354.9 | 1,213.3 | -- | -- |
| Recovery Nodule to Manganese | % | 98.90% | 98.90% | 98.90% | 98.90% | -- | -- |
| Recovered Metal in Manganese | Kt | 2,329.0 | 2,329.0 | 2,329.0 | 1,200.0 | -- | -- |
| Payable Factor for Manganese | % | 100.00% | 100.00% | 100.00% | 100.00% | -- | -- |
| Payable Metal in Manganese | Kt | 2,329.0 | 2,329.0 | 2,329.0 | 1,200.0 | -- | -- |
| Manganese Products Total Revenue | US$ M | 1,280.1 | 1,280.1 | 1,280.1 | 659.5 | -- | -- |
| Operating Costs | -- | ||||||
| Collection Costs | US$ M | (461.2) | (461.2) | (527.1) | (263.6) | -- | -- |
| Transfer & Shipping Costs | US$ M | (186.0) | (186.0) | (210.4) | (105.4) | -- | -- |
| Contractor (offshore) Costs | US$ M | (90.4) | (90.4) | (103.4) | (51.7) | -- | -- |
| Consumables (offshore fuel) Costs | US$ M | (238.3) | (238.3) | (272.3) | (136.2) | -- | -- |
| Processing Cost | US$ M | (840.0) | (840.0) | (840.0) | (432.8) | -- | -- |
| Refining Cost | US$ M | (255.2) | (255.2) | (255.2) | (179.2) | -- | -- |
| Corporate Cost | US$ M | (114.9) | (114.9) | (116.7) | (85.7) | -- | -- |
| Royalty Costs | |||||||
| USA Royalty | US$ M | -- | -- | -- | -- | -- | -- |
| Nauru Payment | US$ M | (13.1) | (13.1) | (13.1) | (13.1) | -- | -- |
| LCR Royalty | US$ M | (30.2) | (30.2) | (30.2) | (15.5) | -- | -- |
Notes: 1. Generally Accepted Accounting Principles
Notes: 2. Commodity prices presented as 5-year weighted averages
| amcconsultants.com | 412 |
| Technical Report Summary of Prefeasibility Study of NORI Area D, Clarion Clipperton Zone | |
| TMC the metals company Inc. | 0225054 |
| Macro Assumptions | Units | Year 21 2048 |
Year 22 2049 |
Year 23 2050 |
Year 24 2051 |
Year 25 2052 |
Year 26 2053 |
Year 27 2054 |
Year 28 2055 |
| Nickel Price (C1 LME)2 | US$/t | -- | -- | -- | -- | -- | -- | -- | -- |
| Cobalt Price (C1 LME)2 | US$/t | -- | -- | -- | -- | -- | -- | -- | -- |
| Copper Cathode Price (C1 LME)2 | US$/t | -- | -- | -- | -- | -- | -- | -- | -- |
| Manganese Price2 | US$/t | -- | -- | -- | -- | -- | -- | -- | -- |
| Manganese Price2 | US$/DMTU | -- | -- | -- | -- | -- | -- | -- | -- |
| Nickel Sulfate Price (100% contained Ni basis)2 | US$/t | -- | -- | -- | -- | -- | -- | -- | -- |
| Cobalt Sulfate Price (100% contained Co basis)2 | US$/t | -- | -- | -- | -- | -- | -- | -- | -- |
| Revenue | US$ M | -- | -- | -- | -- | -- | -- | -- | -- |
| Total Operating Costs | US$ M | -- | -- | -- | -- | -- | -- | -- | -- |
| Total Royalties | US$ M | -- | -- | -- | -- | -- | -- | -- | -- |
| EBITDA (non-GAAP1) | US$ M | -- | -- | -- | -- | -- | -- | -- | -- |
| Depreciation | US$ M | -- | -- | -- | -- | -- | -- | -- | -- |
| EBIT | US$ M | -- | -- | -- | -- | -- | -- | -- | -- |
| Taxation | US$ M | -- | -- | -- | -- | -- | -- | -- | -- |
| Net Profit After Tax | US$ M | -- | -- | -- | -- | -- | -- | -- | -- |
| Free Cash Flow | US$ M | (11.5) | (11.5) | (11.5) | (11.5) | (11.5) | (11.5) | (11.5) | (11.5) |
| Project Capital | US$ M | -- | -- | -- | -- | -- | -- | -- | -- |
| Sustaining Capital | US$ M | -- | -- | -- | -- | -- | -- | -- | -- |
| Closure Capital | US$ M | (11.5) | (11.5) | (11.5) | (11.5) | (11.5) | (11.5) | (11.5) | (11.5) |
| Total Capital | US$ M | (11.5) | (11.5) | (11.5) | (11.5) | (11.5) | (11.5) | (11.5) | (11.5) |
| Production Summary | -- | -- | -- | -- | -- | -- | -- | -- | |
| Total Wet Ore Collected | Mtpa | -- | -- | -- | -- | -- | -- | -- | -- |
| Life of Mine | Years | -- | -- | -- | -- | -- | -- | -- | -- |
| Physicals Nickel Products | -- | -- | -- | -- | -- | -- | -- | -- | |
| Resource Grade | % | -- | -- | -- | -- | -- | -- | -- | -- |
| Contained Metal in Recovered Nodules | Kt | -- | -- | -- | -- | -- | -- | -- | -- |
| Recovery Nodule to Alloy | % | -- | -- | -- | -- | -- | -- | -- | -- |
| Recovery Nodule to Matte | % | -- | -- | -- | -- | -- | -- | -- | -- |
| Recovery Nodule to Sulfate | % | -- | -- | -- | -- | -- | -- | -- | -- |
| amcconsultants.com | 413 |
| Technical Report Summary of Prefeasibility Study of NORI Area D, Clarion Clipperton Zone | |
| TMC the metals company Inc. | 0225054 |
| Macro Assumptions | Units | Year 21 2048 |
Year 22 2049 |
Year 23 2050 |
Year 24 2051 |
Year 25 2052 |
Year 26 2053 |
Year 27 2054 |
Year 28 2055 |
| Recovered Metal in Alloy | Kt | -- | -- | -- | -- | -- | -- | -- | -- |
| Recovered Metal in Matte | Kt | -- | -- | -- | -- | -- | -- | -- | -- |
| Recovered Metal in Sulfate | Kt | -- | -- | -- | -- | -- | -- | -- | -- |
| Payable Factor for Alloy | % | -- | -- | -- | -- | -- | -- | -- | -- |
| Payable Factor for Matte | % | -- | -- | -- | -- | -- | -- | -- | -- |
| Payable Factor Sulfate | % | -- | -- | -- | -- | -- | -- | -- | -- |
| Payable Metal in Alloy | Kt | -- | -- | -- | -- | -- | -- | -- | -- |
| Payable Metal in Matte | Kt | -- | -- | -- | -- | -- | -- | -- | -- |
| Payable Metal in Sulfate | Kt | -- | -- | -- | -- | -- | -- | -- | -- |
| Nickel Products Total Revenue | US$ M | -- | -- | -- | -- | -- | -- | -- | -- |
| Physicals Cobalt | -- | -- | -- | -- | -- | -- | -- | -- | |
| Resource Grade | % | -- | -- | -- | -- | -- | -- | -- | -- |
| Contained Metal in Recovered Nodules | Kt | -- | -- | -- | -- | -- | -- | -- | -- |
| Recovery Nodule to Alloy | % | -- | -- | -- | -- | -- | -- | -- | -- |
| Recovery Nodule to Matte | % | -- | -- | -- | -- | -- | -- | -- | -- |
| Recovery Nodule to Sulfate | % | -- | -- | -- | -- | -- | -- | -- | -- |
| Recovered Metal in Alloy | Kt | -- | -- | -- | -- | -- | -- | -- | -- |
| Recovered Metal in Matte | Kt | -- | -- | -- | -- | -- | -- | -- | -- |
| Recovered Metal in Sulfate | Kt | -- | -- | -- | -- | -- | -- | -- | -- |
| Payable Factor for Alloy | % | -- | -- | -- | -- | -- | -- | -- | -- |
| Payable Factor for Matte | % | -- | -- | -- | -- | -- | -- | -- | -- |
| Payable Factor Sulfate | % | -- | -- | -- | -- | -- | -- | -- | -- |
| Payable Metal in Alloy | Kt | -- | -- | -- | -- | -- | -- | -- | -- |
| Payable Metal in Matte | Kt | -- | -- | -- | -- | -- | -- | -- | -- |
| Payable Metal in Sulfate | Kt | -- | -- | -- | -- | -- | -- | -- | -- |
| Cobalt Products Total Revenue | US$ M | -- | -- | -- | -- | -- | -- | -- | -- |
| Physicals Copper | -- | -- | -- | -- | -- | -- | -- | -- | |
| Resource Grade | % | -- | -- | -- | -- | -- | -- | -- | -- |
| Contained Metal in Recovered Nodules | Kt | -- | -- | -- | -- | -- | -- | -- | -- |
| amcconsultants.com | 414 |
| Technical Report Summary of Prefeasibility Study of NORI Area D, Clarion Clipperton Zone | |
| TMC the metals company Inc. | 0225054 |
| Macro Assumptions | Units | Year 21 2048 |
Year 22 2049 |
Year 23 2050 |
Year 24 2051 |
Year 25 2052 |
Year 26 2053 |
Year 27 2054 |
Year 28 2055 |
| Recovery Nodule to Alloy | % | -- | -- | -- | -- | -- | -- | -- | -- |
| Recovery Nodule to Matte | % | -- | -- | -- | -- | -- | -- | -- | -- |
| Recovery Nodule to Sulfate | % | -- | -- | -- | -- | -- | -- | -- | -- |
| Recovered Metal in Alloy | Kt | -- | -- | -- | -- | -- | -- | -- | -- |
| Recovered Metal in Matte | Kt | -- | -- | -- | -- | -- | -- | -- | -- |
| Recovered Metal in Sulfate | Kt | -- | -- | -- | -- | -- | -- | -- | -- |
| Payable Factor for Alloy | % | -- | -- | -- | -- | -- | -- | -- | -- |
| Payable Factor for Matte | % | -- | -- | -- | -- | -- | -- | -- | -- |
| Payable Factor Sulfate | % | -- | -- | -- | -- | -- | -- | -- | -- |
| Payable Metal in Alloy | Kt | -- | -- | -- | -- | -- | -- | -- | -- |
| Payable Metal in Matte | Kt | -- | -- | -- | -- | -- | -- | -- | -- |
| Payable Metal in Sulfate | Kt | -- | -- | -- | -- | -- | -- | -- | -- |
| Copper Products Total Revenue | US$ M | -- | -- | -- | -- | -- | -- | -- | -- |
| Physicals Manganese | -- | -- | -- | -- | -- | -- | -- | -- | |
| Resource Grade | % | -- | -- | -- | -- | -- | -- | -- | -- |
| Contained Metal in Recovered Nodules | Kt | -- | -- | -- | -- | -- | -- | -- | -- |
| Recovery Nodule to Manganese | % | -- | -- | -- | -- | -- | -- | -- | -- |
| Recovered Metal in Manganese | Kt | -- | -- | -- | -- | -- | -- | -- | -- |
| Payable Factor for Manganese | % | -- | -- | -- | -- | -- | -- | -- | -- |
| Payable Metal in Manganese | Kt | -- | -- | -- | -- | -- | -- | -- | -- |
| Manganese Products Total Revenue | US$ M | -- | -- | -- | -- | -- | -- | -- | -- |
| Operating Costs | -- | -- | -- | -- | -- | -- | -- | -- | |
| Collection Costs | US$ M | -- | -- | -- | -- | -- | -- | -- | -- |
| Transfer & Shipping Costs | US$ M | -- | -- | -- | -- | -- | -- | -- | -- |
| Contractor (offshore) Costs | US$ M | -- | -- | -- | -- | -- | -- | -- | -- |
| Consumables (offshore fuel) Costs | US$ M | -- | -- | -- | -- | -- | -- | -- | -- |
| Processing Cost | US$ M | -- | -- | -- | -- | -- | -- | -- | -- |
| Refining Cost | US$ M | -- | -- | -- | -- | -- | -- | -- | -- |
| Corporate Cost | US$ M | -- | -- | -- | -- | -- | -- | -- | -- |
| amcconsultants.com | 415 |
| Technical Report Summary of Prefeasibility Study of NORI Area D, Clarion Clipperton Zone | |
| TMC the metals company Inc. | 0225054 |
| Macro Assumptions | Units | Year 21 2048 |
Year 22 2049 |
Year 23 2050 |
Year 24 2051 |
Year 25 2052 |
Year 26 2053 |
Year 27 2054 |
Year 28 2055 |
| Royalty Costs | |||||||||
| USA Royalty | US$ M | -- | -- | -- | -- | -- | -- | -- | -- |
| Nauru Payment | US$ M | -- | -- | -- | -- | -- | -- | -- | -- |
| LCR Royalty | US$ M | -- | -- | -- | -- | -- | -- | -- | -- |
Notes: 1. Generally Accepted Accounting Principles
Notes: 2. Commodity prices presented as 5-year weighted averages
| amcconsultants.com | 416 |
| Technical Report Summary of Prefeasibility Study of NORI Area D, Clarion Clipperton Zone | |
| TMC the metals company Inc. | 0225054 |
| 19.14 | Sensitivity analysis |
To examine the impact of changes in base case assumptions, sensitivity analysis has been performed. The analysis performed allows identification of the critical components of the economic model, to determine which variables have little impact on outcomes and which have significant impact. To graphically display the relative impact and ranking of each variable on the post-tax NPV (base case NPV); the results have been displayed as a Tornado chart.
Figure 19.2 below presents a tornado chart which compares the range of each variable and calculates the NPV at each point. For each line item flexed between -20 percent and +20 percent, the length of the bar indicates the change to the NPV with the colour of the bar indicating the direction of the relationship between the variable and the NPV movement. Upper variables (and longest bar) have the most effect and the lower the least effect to NPV.
| Figure 19.2 | Tornado Graph |
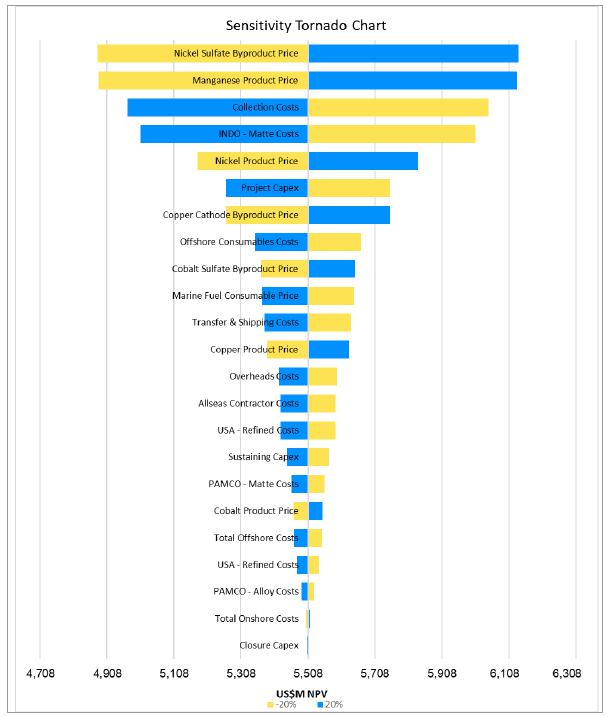
Source: TMC
| amcconsultants.com | 417 |
| Technical Report Summary of Prefeasibility Study of NORI Area D, Clarion Clipperton Zone | |
| TMC the metals company Inc. | 0225054 |
| 19.15 | Cash Cost Analysis |
TMC have selected nickel as the primary commodity for the Project, and so unit costs are presented in terms of C1 Nickel Cash Cost. C1 Cash Costs are calculated as the total direct costs associated with mining, processing, G&A, and marketing costs. C1 Cash Cost is not a measure recognized by GAAP but is a standard measure used in mining as a reference point to denote the basic cash costs of running a mining operation to allow a comparison across the industry which may then be plotted on a global cost curve.
The cost curve is divided into four quartiles, with the lowest operating cost mines falling within the first quartile. In general, achieving a first quartile C1 cash cost means that the operation will be resilient to all stages of the price cycles and remain profitable during these price cycles. The cost is typically expressed as US$/t nickel or US cents/lb nickel and is presented both exclusive and inclusive of byproduct credits for other elements contained within the nodules (copper, cobalt, manganese).
| Table 19.10 | presents the C1 Nickel Cash Cost (US$/t Ni) through the life of mine. |
The NORI Area D C1 Cash Cost including byproduct credits equals US$1,065/t nickel.
| Table 19.10 | C1 Nickel Cash Cost |
| Item | Units | Value |
| Collection Costs | US$'M | 12,344 |
| Transfer & Shipping Costs | US$'M | 3,071 |
| Contractor (offshore) Costs | US$'M | 1,855 |
| Consumables (offshore fuel) Costs | US$'M | 3,848 |
| Processing Cost | US$'M | 13,622 |
| Refining Cost | US$'M | 3,254 |
| Corporate Cost | US$'M | 1,985 |
| Total Operating Costs | US$'M | 39,978 |
| Total Nickel Production | kt | 1,469 |
| C1 Cash Cost excl. Byproducts credits | US$/t Ni | 27,210 |
| Byproduct credits | US$/t Ni | (26,144) |
| Period C1 Cash Cost incl. Byproducts credits | US$/t Ni | 1,065 |
Table 19.11 presents the all-in sustaining cost (AISC) in US$/t Ni through the LOM. The AISC is calculated using the same costs as the C1 Cash Cost, plus royalties and sustaining capital. This figure represents the realistic minimum revenue per unit of production that is required to continue operating the business and as such is a proxy for the operational break-even nickel price, subject to the pricing of byproducts.
The NORI Area D all-in sustaining cost (AISC) including byproduct credits equals US$2,569/t nickel.
| Table 19.11 | All-in Sustaining Cost |
| Item | Units | Value |
| Collection Costs | US$'M | 12,344 |
| Transfer & Shipping Costs | US$'M | 3,071 |
| Contractor (offshore) Costs | US$'M | 1,855 |
| Consumables (offshore fuel) Costs | US$'M | 3,848 |
| Processing Cost | US$'M | 13,622 |
| amcconsultants.com | 418 |
| Technical Report Summary of Prefeasibility Study of NORI Area D, Clarion Clipperton Zone | |
| TMC the metals company Inc. | 0225054 |
| Item | Units | Value |
| Refining Cost | US$'M | 3,254 |
| Corporate Cost | US$'M | 1,985 |
| Total Operating Costs | US$'M | 39,978 |
| Total Royalties | US$'M | 659 |
| Sustaining Capital | US$'M | 1,550 |
| Total All-in Sustaining Cost | US$'M | 42,187 |
| Total Nickel Production | kt | 1,469 |
| AISC excl. Byproducts credits | US$/t Ni | 28,713 |
| Byproduct credits | US$/t Ni | (26,145) |
| AISC incl. Byproducts credits | US$/t Ni | 2,569 |
| 19.16 | Conclusion Economic Analysis |
Based on the assumptions and parameters presented, the economic analysis shows positive economics with a 7-year payback (production) period supported by a post-tax NPV (8%) of US$5,508M and post-tax IRR of 26.8%.
The project capital is US$4,918M (excluding escalation), with undiscounted LOM revenue of US$72,958M, sustaining capital of US$1,550M, all-in operating cost of US$39,998M, all-in royalty cost of US$659 M, and closure costs of US$115M.
| amcconsultants.com | 419 |
| Technical Report Summary of Prefeasibility Study of NORI Area D, Clarion Clipperton Zone | |
| TMC the metals company Inc. | 0225054 |
| 20 | Adjacent properties |
The western boundary of NORI Area-D is adjacent to the eastern boundary of the TOML-F area held under an ISA exploration contract by TOML also a subsidiary of TMC. Polymetallic nodule mineralization is well-developed in TOML-F (AMC, 2021b). Table 20.1 summarizes the Mineral Resources reported in TOML-F. The average abundance and grades in TOML-F are similar to those in NORI Area-D.
| Table 20.1 | TOML Area F Mineral Resource estimate, in situ, at a 4 kg/m2 nodule abundance cut-off |
| TOML Area |
Classification | Tonnes (x106 wet t) |
Abundance (wet kg/m2) |
Ni (%) |
Cu (%) |
Co (%) |
Mn (%) |
| F | Indicated | 12 | 21.6 | 1.5 | 1.2 | 0.1 | 32.5 |
| F | Inferred | 244 | 16.6 | 1.4 | 1.2 | 0.1 | 32.2 |
Source: AMC, 2021b.
Note: Tonnes are quoted on a wet basis and grades are quoted on a dry basis, which is common practice for bulk commodities. Moisture content was estimated to be 28% w/w. These estimates are presented on an undiluted basis without adjustment for resource recovery.
The northern boundary of NORI Area-D is adjacent to the southern boundary of the area held under an ISA exploration contract by the Federal Institute for Geosciences and Natural Resources of Federal Republic of Germany (BGR). BGR completed multibeam bathymetry and backscatter mapping, box core sampling and geochemical analysis of nodules and used this data as a the basis for an estimate of Mineral Resources in the eastern part of their contract area (~60,000 km2) (Kuhn and Rühlemann 2021). The Mineral Resources reported by Kuhn and Rühlemann are summarized in Table 20.2. The qualified person has been unable to verify the information. The average abundance and grades reported in the BGR area are similar to those in NORI Area D.
| Table 20.2 | Summary of Mineral Resources reported for BGR exploration contract area |
| Mineral
Resource Classification |
M dry mt | Abundance (kg/m2) |
Ni (%) | Cu (%) | Co (%) | Mn (%) |
| Measured | 7.14 | 14.6 | 1.43 | 1.19 | 0.17 | 31.5 |
| Indicated | 11.21 | 14.2 | 1.32 | 1.18 | 0.13 | 30.8 |
| Inferred | 35.53 | 13.4 | 1.39 | 1.17 | 0.17 | 31.1 |
| Inferred | 486.2 | 10.1 | 1.39 | 1.17 | 0.17 | 31.1 |
Source: Kuhn and Rühlemann 2021
To the south of NORI Area-D the seafloor is classified by the ISA as a Reserved Area. Under UNCLOS, the Reserved Areas are reserved for access by developing countries or the Enterprise (UNCLOS, Article 170, Annex IV and 1994 Agreement, Annex, Section 2). The area to the east of NORI Area D is open ground.
| amcconsultants.com | 420 |
| Technical Report Summary of Prefeasibility Study of NORI Area D, Clarion Clipperton Zone | |
| TMC the metals company Inc. | 0225054 |
| 21 | Other relevant data and information |
No additional information or explanation is necessary to make this TRS understandable and not misleading.
| amcconsultants.com | 421 |
| Technical Report Summary of Prefeasibility Study of NORI Area D, Clarion Clipperton Zone | |
| TMC the metals company Inc. | 0225054 |
| 22 | Interpretation and conclusions |
| 22.1 | Mineral tenure |
The mineral tenure for the NORI Area D project is backed by an exploration contract granted by the ISA that provides exclusive rights to explore and a priority right to apply for an exploitation contract. NORI has fulfilled all contractual obligations to date with respect to the ISA requirements. To the extent known to the QP, there are no other significant factors and risks that may affect access, title, or the right to perform work on the Project that are not discussed in this Technical Report.
The ISA is currently working on the development of the legal framework to regulate the exploitation of nodules in the Area and at the time of this report the ISA has not finalized the regulations for Nodule Exploitation. TMC has submitted an application to NOAA under DSHMRA for an exploration license and commercial recovery permit, through their subsidiary TMC USA. At the time of this report these applications are still under review and not yet approved. The Mine Plan is contained within an area with geohabitats characterized to be similar as the area of the Test Mining that has been extensively surveyed and monitored by TMC. An allowance for appropriate buffer zones to prevent impact to areas outside the NORI Area D Exploitation Contract Area and sensitive environmental areas within is included. Other than those allowances, the QPs have not included any measures within the Mine Plan to comply with the yet to be approved commercial recovery permit conditions, and the impact of those conditions on the Mineral Reserve is uncertain.
| 22.2 | Exploration and data verification |
NORI completed offshore exploration campaigns in 2012, 2013, 2018, 2019, and acquired additional data as part of a test mining in 2022. The data from these campaigns was compiled and analyzed to provide the geological foundation for engineering design and mine planning. In addition to estimation of the Mineral Resources, assessments of nodule dimensions and shape, variability of assay grades and abundance over short distances, moisture content, seafloor morphology, potential geo-obstacles and the geotechnical characteristics of the seafloor were completed.
The methods used to sample and assay the nodules in each campaign were not materially different. Certified reference materials (CRMs), blank samples (crushed rock samples with very low manganese, nickel, cobalt, and copper) and duplicate samples were used for quality control and quality assurance during the 2018 - 2023 offshore campaigns (C3, C6, C7, C8). AMC considers that the sample preparation, security, and analytical procedures were adequate for estimating Mineral Resources.
The offshore exploration campaigns consistently showed that the nodules sit on, or close to, the surface of the sediment on the seafloor. The data indicates that, for a collector designed to cut the seafloor to a maximum depth of 5 cm, 96% of the measured box core nodule abundance is expected to be available for collection by the seafloor mining system.
Type 1 nodule facies exhibit a median length in the range 2 - 3 cm, and in most cases at least 75% of the nodules are less than 5 cm in length. Small nodules generally dominate in the centre of NORI Area D, in an ENE trending belt located mainly in the abyssal plain domain. The box cores with the largest mean nodule size generally occur in the north in, or near, areas interpreted to contain Type 2/3 nodules. Box cores with a bimodal distribution or greater proportion of large nodules generally occur in, or very close to, areas interpreted to contain Type 2/3 nodules. These statistical features illustrate the complexity of nodule size distributions at the local scale and the need for further work to improve the spatial definition of Type 2/3 nodule facies.
The moisture content of the polymetallic nodules in NORI Area D was measured at various times throughout the exploration and related scientific programs. The conditions under which the samples were handled and dried by different laboratories varied, resulting in some inconsistencies in the moisture content values. So far as estimation of metal production units is concerned, the wet abundances must be converted to dry abundances at 105°C, the temperature at which the samples were dried prior to assaying. The analysis of the data by campaign shows that dry abundance measurements for the box core samples provide a better local datum for abundance because the errors and uncertainties in the moisture values have been removed, or at least reduced, by drying at 105°C.
| amcconsultants.com | 422 |
| Technical Report Summary of Prefeasibility Study of NORI Area D, Clarion Clipperton Zone | |
| TMC the metals company Inc. | 0225054 |
Moisture content of 28% is the current best estimate, based on Campaign 6, 7 and 8 box cores and sampling of 3000 t of nodules recovered during the test mining in 2022. No significant correlations were identified between the moisture contents of the nodules and assays, nodule size, nodule type, abundance, bathymetry, or geological domain.
The morphology of the seafloor is an important control on the proposed mining operation. Following the initial acquisition of vessel-based MBES data in 2012, the data was reprocessed and reinterpreted several times as new data became available. The new data included high resolution data acquisition. In 2020, all of the available data was synthesized into a geological framework, from which the footwall and sediment domains which are used in the Mineral Resource estimation were interpreted.
The existing, higher resolution, AUV MBES datasets do not cover enough of NORI Area D to satisfy the requirements of planning for initial mining beyond Year 2. Detailed seafloor slope and potential geo-obstacle analysis was carried out to more accurately identify areas with slopes >4° that are expected to be suitable for mining in the Initial Mining Area.
The high-resolution AUV-based MBES data was compared to the lower-resolution hull-based MBES data to build a probabilistic model for prediction of smaller-scale terrain variability. The probabilistic model shows that there is potentially a greater area that has > 4° slopes along the flanks of abyssal hills than can be mapped with the hull-based MBES alone. Also, within the abyssal plains, there is hummocky topography, which appears to be correlated with Type 2 and 3 nodule facies. The hummocky topography is only seen clearly in the higher-resolution AUV data but can be mapped probabilistically. The 0 to 4° slope classification clearly shows that in the closely-spaced abyssal hills and valleys in the northern half of NORI Area D, the areas of continuous mineable ground with the 0-4° slope range are likely to be much smaller than in the test mining area.
A preliminary integrated ground model for the collector test area was compiled ahead of the test mining and was based on analysis of geophysical and camera data. The model showed seafloor features, or geo-obstacles, that could potentially impede the efficient operation of the seafloor mining system. Five potential geo-obstacle classes were defined but only three (large-diameter circular depressions, moats, and furrows) have significant occurrence within the 10 x 15 km test mining site.
Most of these features are beyond the resolution-limits of the hull-based MBES data and are therefore only noticeable in the higher-resolution AUV MBES datasets. A predictive model was therefore developed to map the probability of these features occurring. This model was based on testing for spatial relationships with larger-scale geological features, which may exhibit some control on the geo-obstacle formation. The model relies on the low-resolution hull-based MBES data derivatives and interpretations, as this is currently the only dataset with regional distribution across NORI Area D. The probabilistic model results were incorporated in the initial mine planning for the Initial Mining Area.
Geotechnical soils data was systematically collected across the NORI Area D site from box core tests and samples, and in situ testing. In general terms the seafloor across NORI Area D can be classified as a silty clay, that in parts is very silty and sometimes more like a silt. There are exceptions to this classification associated with depressions or high areas of seafloor such as ridge lines, abyssal hills and volcanic features. The test mining area is consistently similar in composition and less complex than the Initial Mining Area and NORI Area D overall, due to the smaller area and the dominance of the flat geoform domain.
| amcconsultants.com | 423 |
| Technical Report Summary of Prefeasibility Study of NORI Area D, Clarion Clipperton Zone | |
| TMC the metals company Inc. | 0225054 |
Seafloor conditions derived from seabed CPT readings indicate that the seafloor conditions are firmer than anticipated from the box core measurements obtained during Campaign 6. It was concluded that the removal of the nodules prior to testing caused disturbance in the upper layer of the box cores. This difference was also observed in the behaviour of the seafloor collector, which performed locomotive tasks at the top end of expectations.
The test mining was conducted within a small test area in NORI Area D, selected after completion of detailed bathymetric and photographic surveys in 2018. The test area is very flat, abyssal plain, and is dominated by Type 1 nodules. The nodule abundances and grades encountered during the test were consistent with expectations. It is expected that mining may be more difficult in the northern part of NORI Area D where the seafloor is more rugged.
Box core samples were collected from the planned collector test runs before (Campaign 7A) and after (Campaign 7B) the test mining. Six of the Campaign 7B box cores were located at sites within 80 m of Campaign 7A box cores, allowing comparison of nodule abundances before and after the test mining. The nodule abundances prior to collection (Campaign 7A) ranged from 12.57 kg/m2 to 21.68 kg/ m2 with an average of 15.8 kg/m2 at the paired sites. The nodule abundances for the same sites after collection (Campaign 7B) ranged from 0.51 kg/m2 to 15.66 kg/m2 with an average of 5.72 kg/m2. Two of the box cores are likely to have sampled seafloor not traversed by the collector, or traversed while the collector was not in pick up mode. Excluding these two results, the average recovery of nodules was 80%.
| 22.3 | Mineral processing testwork |
NORI has completed an extensive program of metallurgical testing involving nodule characterization, process flowsheet selection, bench-scale and pilot-scale confirmation on a 75 t sample of nodules collected from NORI Area D. The selected RKEF flow sheet involves calcining and smelting nodules to produce a nickel-copper-cobalt alloy that will be converted into a nickel-copper-cobalt matte and a silico-manganese product. The selected process will involve near zero solid waste generation. NORI polymetallic nodules have very little variation in chemical and mineralogical composition and accordingly, samples selected for testing were representative of the mineralization and sufficient samples were taken so that tests were performed on sufficient sample mass.
Estimated recovery factors are based on appropriate metallurgical testwork and are appropriate to the mineralization and the selected process route.
The metallurgical recoveries (to alloy) for the NORI Area D Project are estimated at 96.9% for nickel, 93.1% for cobalt, 93.6% for copper, and 98.9% for manganese, with manganese being recovered as manganese silicate and nickel-copper-cobalt recovered as an alloy or matte.
| 22.4 | Mineral Resource |
Data collected by NORI is well-documented and was subject to satisfactory QA/QC processes. Documentation verified by the Qualified Person includes photographs, daily exploration reports, digital logging sheets and original assay reports. In the opinion of the Qualified Person the NORI Area data is of high quality and suitable for estimating Mineral Resources. The 2024 Mineral Resource estimate for NORI Area D, reported herein, was based on box core samples and other data collected by NORI and does not include any of the lower-quality data collected by the early explorers.
All the data indicates that both grades and abundance of polymetallic nodules in NORI Area D have remarkable continuity. Abundance is more variable than grades and is recognized as the primary control on classification of the Mineral Resource. Sufficient data was collected in NORI Area D to estimate Measured and Indicated Resources.
| amcconsultants.com | 424 |
| Technical Report Summary of Prefeasibility Study of NORI Area D, Clarion Clipperton Zone | |
| TMC the metals company Inc. | 0225054 |
The Mineral Resource block model was updated in 2025 with the following changes, compared to the 2020 estimate:
| · | Addition of Campaign 7A and Campaign 8 nodule sampling. |
| · | Exclusion of historic nodule samples. |
| · | No top-cuts applied to nodule abundance or nodule grades. |
| · | Modified experimental spatial variograms. |
| · | Estimation of dry nodule abundance. |
| · | Reporting of wet tonnage using dry nodule abundance and assuming average moisture content of 28%. The 2020 Mineral Resource was estimated from wet nodule abundance, as measured in the box core samples. It was assumed that the moisture content was 24%. |
The latest Mineral Resource tonnage estimate (2025) is 5 Mwmt Measured, 347 Mwmt Indicated and 11 Mwmt Inferred Mineral Resources. On a wet basis, the 2025 Mineral Resource tonnage estimate is 2% higher than the 2020 Mineral Resource tonnage estimate. On a dry basis, the 2025 Mineral Resource tonnage estimate is 3% lower than the 2020 Mineral Resource tonnage estimate. The changes are not material. They demonstrate the robustness of the sampling data and the estimation method, and the exceptional continuity of the abundances and grades.
| 22.5 | Mineral Reserve |
A mine plan for NORI Area D was developed using mining blocks derived from Measured and Indicated Mineral Resources. Mining commences in a subset of the proposed NORI Area D Commercial Recovery Area, known as the Initial Mining Area, which has similar geoform to that encountered in Test Mining, followed by the remainder of the NORI Area D Commercial Recovery Area.
Probable Mineral Reserve of 51 Mt at a grade of 1.4% Ni, 0.13% Co, 1.1% Cu and 31% Mn has been estimated for NORI Area D. The Mineral Reserve was restricted to the Initial Mining Area. Unmined buffers of 1,000 m were left around the lease boundary and environmentally sensitive zones. The underlying mine plan was developed in conjunction with an experienced marine contractor, Allseas, and TMC to reflect the characteristics of the proposed nodule collection system.
Mine planning parameters were developed from results observed during the Test Mining, extensive test work and analysis undertaken by Allseas and TMC. Numerous workshops were conducted with Allseas, TMC and technical specialists to develop the nodule collection strategy on which the mine plan is based. Testwork and analysis by marine specialists engaged by TMC included seafloor geotechnical data collection and analysis, analysis of seafloor surveys, plume modelling of disturbed sediments and geological data to identify and characterize the seafloor areas suitable for nodule collection. Testwork undertaken by Allseas while developing the nodule collection system included nodule collection simulation trials, and testwork specific to identifying the design and operating parameters for each of the various components of the system, and the test mining, using a 40% scale prototype collector.
The mine plan for the Initial Assessment completed by AMC in 2021 followed a strategy of using relatively equidimensional mining blocks aligned N-S, targeting the highest value blocks first. The experience gained in the Test Mining and analysis by Allseas resulted in a revision to the mining strategy to adopt long collector runs to maximize the time collecting nodules and minimize turning times to achieve high field efficiencies. Collector paths were designed along a preferred mining direction of NNW-SSE to align with the strike of seafloor ridges.
| amcconsultants.com | 425 |
| Technical Report Summary of Prefeasibility Study of NORI Area D, Clarion Clipperton Zone | |
| TMC the metals company Inc. | 0225054 |
The collector runs for the initial two years in the Initial Mining Area were generated to be as long as possible to allow for initial operations to be as simple as possible while operating procedures are refined. As a result, the initial collector runs (dubbed Runs 19 & 20) deviated from the preferred NNW-SSE trend to avoid seamounts and the impact reference zone. Mining blocks subsequent to Runs 19-20 were generated in a more systematic fashion along the NNW-SSE direction. While this resulted in shorter mining blocks, it is expected that short term planning will be able to amalgamate adjacent mining blocks to form longer collector runs that enable production and cost targets to be maintained.
Key inputs used to estimate the Mineral Reserve are the Mineral Resource model developed by AMC, the nodule collection system specifications provided by TMC to Allseas (including production capability and ability to collect on slopes up to 4°), collector dimensions and capabilities provided by Allseas, geotechnical data reports and specific location analysis by APYS, analysis and modelling by Allseas to determine seafloor trafficability, geological analysis by MARGIN to determine areas where nodules could be collected (geo-obstacle probability model), and the parameters developed by AMC from the work of all of the above. Key physical parameters used by AMC to estimate the Mineral Reserve included collector recovery, geo-obstacle probability, gap left between collection paths to ensure collector efficiency, and metallurgical recoveries for each of the proposed products. An economic model of production, product prices, payabilities, revenue, royalties, and operating and capital costs developed by TMC was used to assess economic viability.
The key risks to the Mineral Reserve identified by the QPs are:
| · | NOAA has not yet granted an exploration license and commercial recovery permit to TMC USA to extract the nodules contained within the Mineral Reserve. |
| · | NOAA has not yet finalized the terms and conditions of the commercial recovery permit, and the mine plan may need to be revised to comply with provisions. |
| · | Lack of other commercial operations against which comparison and validation of production rates, OPEX, and CAPEX could be made. |
| · | The price forecasts for the proposed products. |
| · | Nodule recovery, which is a function of collector recovery, geo-obstacle loss, gap between collector runs, and seafloor slope domains. |
| · | Impact of sedimentation and seafloor currents. |
| · | The design of the nodule collection system has not yet been finalized, nor has the system been constructed to demonstrate that scale up from the 40% scale prototype used in the Test Mining can be successful. |
To account for these risks, the Mineral Reserve has been classified as Probable.
The QPs consider that sufficient testwork and analysis of collection of nodules within NORI Area D has been undertaken to achieve a PFS level of assessment on the modifying factors used to convert the Mineral Resource to Mineral Reserve. Modifying factors were evaluated and applied in the areas of mining, processing, metallurgy, infrastructure, economic evaluation, marketing, legal, and environmental assessment. Specifically, the QPs have estimated the tonnage and grade of the Indicated and Measured Mineral Resource, that in the opinion of the QPs, can be the basis of an economically viable project. Specifically, the QPs have estimated the tonnage and grade of the Indicated and Measured Mineral Resource, that in the opinion of the QPs, can be the basis of an economically viable project.
| 22.6 | Mining methods |
This mining method is novel in comparison to typical terrestrial mining operations, as the unique characteristics of the location, geometry and style of mineralization of the deposit does not allow conventional terrestrial techniques to be used. Allseas, an experienced marine contractor, is collaborating with TMC to develop and operate a nodule collection system at NORI Area D, which is based on conventional deep-sea technology.
| amcconsultants.com | 426 |
| Technical Report Summary of Prefeasibility Study of NORI Area D, Clarion Clipperton Zone | |
| TMC the metals company Inc. | 0225054 |
The mining method proposed for NORI Area D is to use two remotely operated, 15 m wide, self-propelled, tracked collectors tethered to a PV by a flexible jumper hose, riser-and-air-lift VTS and communication and power cables. The collector will preferentially track across the seafloor in a NNW to SSE direction to align with seafloor ridges. Coandă nozzles on the collector will mobilize and collect nodules in the top 3-5 cm of the seafloor, which will be drawn into the collector and through a hopper to separate entrained sediment for return to the seafloor. Nodules are then pumped as slurry via the flexible jumper hose and the riser to the PV, where dewatering and final separation occurs, and dewatered nodules are transferred via conveyor to storage holds within the PV. When the holds of the PV are full, a transfer vessel will pull alongside, an off-loading conveyor deployed, and nodules transferred via conveyor to the hold of the trans-shipment vessel for later transfer to a bulk carrier for transport to a processing facility.
NORI and Allseas completed a Test Mining using a 40% scale prototype collector in 2022, where 4,500 wmt of nodules were collected and approximately 3,000 wmt of nodules were lifted to the surface using an airlift riser. The Test Mining demonstrated the mining concept and provided information for detailed design of the commercial-scale system. The Test Mining was monitored by AUVs, ROVs, and bottom mounted sensors and samplers to provide environmental data to understand the environmental impacts and inform the environmental monitoring and management plans.
While the design of the collector system has not been finalized, the design is based on the results and findings of the Test Mining, an extensive program of testwork undertaken by Allseas, and detailed geotechnical and seafloor analysis undertaken by NORI and specialist service providers to confirm operating parameters.
The QP notes that as there are no deep-sea nodule mining and processing projects currently in operation, the technology required for nodule collection is still in development and the design of the collector proposed for NORI Area D has not been finalized. As a result, the production-scale collector proposed for NORI Area D has not been subjected to actual operating conditions in a production environment to determine its effectiveness, robustness, and reliability in operating in the range of seafloor domains that are expected in NORI Area D and to provide physical records for productivity, nodule recovery, collector speed, and availability. However, the system has been field tested using a 40% width (6 m) prototype.
| 22.7 | Processing |
PAMCO reviewed TMC testwork and completed a PFS testing a 22 t nodule sample provided by TMC. This work has confirmed that the existing PAMCO RKEF facilities are well suited to processing nodules and the key operating parameters – calcining and smelting temperatures, throughputs and material handing are very similar to those for the nickel laterites that the plant was designed to process.
After successful completion of the PFS, TMC and PAMCO signed a binding MOU with PAMCO to complete a commercial scale trial on the 2000t sample collected during the 2022 Test Mining Trial completed on NORI Area D. The data collected in the commercial- scale trial and resulting feasibility study confirmed with the results of the PFS and will inform the required all plant modifications required, and once completed, to undertake toll smelting for commercial operations.
| 22.8 | Infrastructure |
The majority of the required infrastructure exists at PAMCO with minor modifications required to the RKEF facility to process nodules. Key Project infrastructure as envisaged in the PFS is limited to converter aisle construction at PAMCO. The other relevant infrastructure, such as RKEF lines, port, and materials handling equipment is existing.
| amcconsultants.com | 427 |
| Technical Report Summary of Prefeasibility Study of NORI Area D, Clarion Clipperton Zone | |
| TMC the metals company Inc. | 0225054 |
Additional RKEF capacity beyond the initial 1.3 million wet tonnes destined for PAMCO is still to be identified and secured for additional tolling, though the current assumption is that all infrastructure associated with this expanded pyrometallurgical capacity is existing.
For the first five years of operation, the alloy and matte products generated at PAMCO will be sold, so no refinery infrastructure is required. From Year 6 to Year 10, TMC USA intends to refine some of the generated matte at a dedicated facility in the United States, with plans for all matte to be refined here from Year 10 onwards. Such a facility would need to be constructed. The proposed facility location is in close proximity to a port, though docks would need be built while rail and utilities extended from the existing infrastructure in the area.
| 22.9 | Market studies |
CRU completed a preliminary marketing study which examined the marketability of the manganese silicate, nickel-copper-cobalt alloy and matte products, finding that the manganese silicate product will be attractive to silico-manganese alloy producers, and that the nickel-copper-cobalt alloy is similar to existing mattes in the marketplace and will have strong market acceptance. The nickel-copper-cobalt alloy will be a more novel product that will require significant marketing effort for market placement. Metal pricing forecast for copper, nickel and cobalt and nickel and cobalt sulfate premium/discounts against metal prices forecasts were provided by BMI. Manganese price forecasts used in the economic analysis were derived from the CRU preliminary market studies as were conservative payability factors particularly for the nickel-copper-cobalt alloy to ensure attractiveness in the marketplace.
| 22.10 | Environmental studies |
NORI has completed the environmental baseline data collection required to conform with ISA permitting requirements. In total, more than 100 studies involving world-leading academic and contracting organizations have completed the most extensive seafloor to surface integrated study of the deep ocean.
Environmental impacts were monitored during the Test Mining undertaken in 2022 and further monitoring of the site was undertaken on completion of the test and then 12 months later. Results indicate that the impacts are significantly less than have been proposed by many third parties. Impact assessment has demonstrated that environment impacts for the proposed NORI Area D development will not cause serious harm to the environment.
Socioeconomic benefits are positive providing training and community development to Nauru. In contrast to terrestrial developments, there is no need to relocate existing landowners from the development area and there is little to no competing economic use.
| 22.11 | Capital and operating costs |
The capital cost estimates are reported in 30 June 2025 US$. The capital costs are at a PFS level of confidence of ± 25% in accordance with S-K 1300 guidelines.
Total Capital costs are estimated at US$6,636M comprising of:
| · | Project Capital US$545M for Production Vessel #1 and associated costs (System #1), inclusive of Allseas credit and US$4,426M for two 6 Mwmt nodule equivalent refining facilities in the US. |
| · | Sustaining Capital US$1,550M for the LOM. |
| · | Closure Cost US$115M post operations. |
| amcconsultants.com | 428 |
| Technical Report Summary of Prefeasibility Study of NORI Area D, Clarion Clipperton Zone | |
| TMC the metals company Inc. | 0225054 |
Total Operating costs are estimated at US$39,978M over LOM comprising of:
| · | LOM collection costs are estimated at US$12,344M and average US$75.2/wmt of nodules. |
| · | LOM transfer and shipping costs are estimated at US$3,071M and average US$18.7/wmt of nodules. |
| · | LOM contractor (offshore) costs are estimated at US$1,855M and average US$11.3/wmt of nodules. |
| · | LOM consumables (offshore fuel) costs are estimated at US$3,848M and average US$23.4/wmt of nodules. |
| · | LOM processing costs are estimated at US$13,622M and average US$83/wmt of nodules. |
| · | LOM refining costs are estimated at US$3,254M and average US$19.8/wmt of nodules. |
| · | LOM G&A costs are estimated at US$1,985M and average US$12.1/wmt of nodules. |
| 22.12 | Economic evaluation |
An economic analysis for NORI Area D used to support Mineral Reserves was performed using discounted cashflow analysis with expected real cashflows compiled on a $US 2025 real term basis and the following key assumptions:
| · | Production plan as per provided Resource and mining inventories and minimum run lengths. |
| · | Cost estimates with no inflation of escalation attributed. |
| · | Valuation date of 1 July 2025 based on 2025 real terms. |
| · | Commercial production starting on October 1, 2027 (Year 0). |
| · | LOM of 19 years. |
| · | All cash flows discounted at an 8% discount rate. |
| · | Products are assumed to be sold in the same year they are produced. |
Based on the assumptions and parameters presented, the economic analysis shows positive economics with a 7-year payback (production) period supported by a post-tax NPV (8%) of US$5,508M and post-tax IRR of 26.8%. LOM EBITDA of US32,321M. C1 cash cost of US$1,065/t nickel (incl. byproducts) and All-In Sustaining Cost of US$2,569/t nickel (incl. byproducts).
| amcconsultants.com | 429 |
| Technical Report Summary of Prefeasibility Study of NORI Area D, Clarion Clipperton Zone | |
| TMC the metals company Inc. | 0225054 |
| 23 | Recommendations |
The QPs consider that the evaluation work completed to date on NORI Area D, including exploration and data management, off-shore and on-shore engineering, mineral processing, marine operations, marketing, and environmental assessment and associated studies leading to the current Mineral Resource and Mineral Reserve estimates, has demonstrated the technical and economic viability of the Project.
To further advance the Project, the following recommendations on the various aspects of the Project are made by the QPs of this Technical Report. The costs to undertake these recommendations are included in the capital and operating costs for the Project presented in Section 18 of this Technical Report.
Prior to operations commencement, the QPs recommend that:
| · | The collector path simulation tool being developed by Allseas continues to be developed and used to gain a better understanding of short-term planning requirements, field efficiencies, and operational flexibility. |
| · | Collector, VTS, PV and TV design be finalized by Allseas to ensure timely commencement of operations once approvals are finalized. |
| · | Umbilical and VTS movement simulation modelling continue to evaluate dual Collector operations and develop safe operating procedures. |
| · | The Commercial Recovery Permit conditions, once finalized, be reviewed to confirm that mine plans and production operations comply with requirements. |
| · | Environmental monitoring plans and adaptive management systems be finalized to ensure timely commencement of operations once approvals are finalized. |
| · | Identification of additional processing plants to process nodules not processed by PAMCO's Hachinohe site should be progressed. |
| · | Development of downstream hydrometallurgical processes required by Year 6 should be progressed. |
Once seafloor operations commence, the QPs recommend that:
| · | Detailed information on nodule abundance, nodule type, and seafloor topography should be progressively upgraded in advance of operations for use in detailed short-term planning. |
| · | Reconciliation of nodule production with Mineral Resource and Mineral Reserve estimates be undertaken as a priority to confirm the Mineral Resource and the modifying factors used for conversion to Mineral Reserves. |
| · | Use production operating experience and environmental monitoring results to refine operating practices and mine plans. |
| · | Continue environmental monitoring prior to and during production operations to confirm that impacts associated with nodule extraction are appropriately managed. |
| · | Use environmental monitoring results and evaluation of seafloor operations to confirm that operations can extend into geoforms outside the initial mining area that are not currently in the Mineral Reserve. |
| · | Use detailed production data to progressively upgrade Mineral Reserve estimates in areas as they are confirmed as suitable for mining operations. |
| · | Progressively refine long-term-mine plans to develop the full NORI Area D Commercial Recovery Permit Area. |
| amcconsultants.com | 430 |
| Technical Report Summary of Prefeasibility Study of NORI Area D, Clarion Clipperton Zone | |
| TMC the metals company Inc. | 0225054 |
| 24 | References |
Agarwal et al 1979, Agarwal JC, Barner HEM, Beecher N. 1979. The cuprion process for ocean nodules, Chem. Eng. Prog 75(1):59-63.
Agarwal, S., et al, “Studies on recovery of Ni, Co, Cu from polymetallic nodules by direct reduction smelting”, COM 2009, Sudbury, p. 509-517.
Allseas 2024a, Deep Sea Nodule Collection – Project Zero Work Package 1 – collector. collector Propulsion and Manoeuvrability Analysis (HG-916C1-410-Y-R-001.pdf). (Confidential).
Allseas 2024b, Base Specification (HG-91620-000-G-F-001 Rev C1 - Base specification.xlsx) (Confidential).
Allseas 2024c, Hydraulic nozzle - test results Deltares 4, collector over- and undersize analysis and Impact type II/III nodules on recovery rates (HG-916C1-100-F-R-007.pdf) (Confidential).
Allseas 2024d, Project Zero - Mass flow model 3 mln/a, HG-9162F-000-F-R-003 Rev B2.pdf (Confidential).
Allseas 2024e, PFS – Technical Note – Allseas System Description (NORI-ALL-0200-MUL-RPT-0018). (Confidential).
AMC 2016, AMC Consultants Pty Ltd, 2016. TOML Clarion Clipperton Zone Project, Pacific Ocean. Technical Report compiled under NI-43-101 by AMC Consultants Pty Ltd for Nautilus Minerals, March 2016.
AMC 2019, AMC Consultants Pty Ltd, 2019. NORI Area D, Clarion Clipperton Zone Mineral Resource Estimate, April 2019 Technical Report compiled under NI-43-101 for DeepGreen Metals Inc.
AMC 2021, AMC Consultants Pty Ltd, March 2021. Technical Report Summary, Initial Assessment of the NORI Property, Clarion-Clipperton Zone, for Deep Green Metals Inc., In accordance with the requirements of SEC Regulation S-K (subpart 1300).
BMI, 2025. Benchmark Minerals Intelligence, 2025. Benchmark Mineral Intelligence Forecast Reports June, 2025 for copper, nickel and cobalt. (Confidential).
Baláž 2022, Baláž, P., 2022. Results of the second phase of deep-sea polymetallic nodules geological survey in Interoceanmetal Joint Organization licence area (2016–2021). Mineralia.
Bloomberg News. (2025, February 20). China-backed $3 billion Indonesia nickel smelter risks shutdown. Retrieved from www.mining.com: https://www.mining.com/web/china-backed-3-billion-indonesia-nickel-smelter-risks-shutdown/.
Celios. (2025, March 17). The Fallout of PT Gunbuster Nickel Industry Closure: How Danantara Can Save Indonesia’s Critical Minerals. Retrieved from celios.co.id: https://celios.co.id/the-fallout-of-pt-gunbuster-nickel-industry-closure-how-danantara-can-save-indonesias-critical-minerals/.
CRU 2019, Consulting. Manganese market strategy. Technical report. 2019. (Confidential).
CRU 2020, Updated PEA market input. Report for DeepGreen Metals. Dated 23/10/2020. (Confidential).
| amcconsultants.com | 431 |
| Technical Report Summary of Prefeasibility Study of NORI Area D, Clarion Clipperton Zone | |
| TMC the metals company Inc. | 0225054 |
CRU 2024, CRU International Ltd, September 2024, NORI-D project: Preliminary market research report. Published date: 24/09/2024. (Confidential).
Earney 1990, Earney F.C.F. 1990. Marine Mineral Resources. Routledge, p 387. Cited in: ISA. 2010. A geological model of polymetallic nodule deposits in the Clarion-Clipperton Fracture Zone and prospector's guide for polymetallic nodule deposits in the Clarion-Clipperton Fracture Zone. International Seabed Authority Technical Study: No. 6.
Felix 1980, Felix, D. 1980. Some problems in making nodule abundance estimates from seafloor photographs. Marine Mining, Volume 2 Number 3, 293-302.
Flanagan and Gottfried, 1980. USGS nodule standard.
FLSmidth, 2020. Polymetallic Nodule Roasting utilizing a pilot rotary kiln system. Report number: 9232050259, December 2020, (Confidential).
Fugro 2019. Geotechnical Seafloor Sampling Survey: NORI Area D Area, Campaign 3; Report No. 1803-1344, Volume II Revision 0. Houston Texas: Fugro USA, Marine, Inc.
Golder 2015, Golder Associates, 2015. Preliminary economic assessment, NORI Clarion-Clipperton Zone Area D Project, Pacific Ocean. Report prepared by Golder Associates for Deep Green Resources Inc. (Confidential).
GSR 2018, Global Sea Mineral Resources NV, 2018. Environmental Impact Statement. Small-scale testing of nodule collector components on the seafloor of the Clarion-Clipperton Fracture Zone and its environmental impact (ISA_EIA_2018_GSRNOD2019).
Haalboom, et al. 2023, Haalboom, Sabine, et al. Monitoring of a sediment plume produced by a deep-sea mining test in shallow water, Málaga Bight, Alboran Sea (southwestern Mediterranean Sea). Marine Geology 456 (2023): 106971.
Haynes, B.W., “Laboratory processing and characterization of waste materials from manganese nodules”, USBM RI 8938, 1985. (Note by author: The EPA toxicity test and conclusions referenced above were based on the then current testing procedure and toxicity limits (from 1985).
Hein et al. 2013, Hein, J., Mizell, K., Koschinsky, A., and Conrad, T., 2013. Deep-ocean mineral deposits as a source of critical metals for high- and green-technology applications: Comparison with land-based resources. Ore Geology Reviews, 51, 1-14.
Hennigar, HF, Dick, RE, and Foell EJ, 1986, Derivation of Abundance Estimates for Manganese Nodule Deposits: Grab Samples Recoveries to Ore Reserves, Off-shore Technology Conference, OTC, 5237, May 1986, Houston.
Hessler and Jumars 1974, Hessler R.R., Jumars P.A., 1974. Abyssal community analysis from replicate box cores in the central north pacific. Deep Sea Research, 21, 185 209.
ISA 1999b, International Seabed Authority, 1999. Proposed technologies for mining deep-seabed polymetallic nodules. Proceedings of the International Seabed Authority's Workshop held in Kingston, Jamaica, 3-6 August 1999.
ISA, 2001. International Seabed Authority. (2001). Proposed technologies for mining deep-seabed polymetallic nodules. International Seabed Authority. https://www.isa.org.jm/ publications/proposed-technologies-for-mining-deep-seabed-polymetallic-nodules/.
| amcconsultants.com | 432 |
| Technical Report Summary of Prefeasibility Study of NORI Area D, Clarion Clipperton Zone | |
| TMC the metals company Inc. | 0225054 |
ISA, 2009. Workshop on the results of a project to develop a geological model of polymetallic nodule deposits in the Clarion-Clipperton Zone Kingston, Jamaica 14-17 December, 2009.
ISA, 2012, International Seabed Authority, 2012. Environmental Management Needs for Exploration and Exploitation of Deep Sea Minerals. Kingston Jamacia: International Seabed Authority (ISA Technical Study No. 10).
ISA 2010a, International Seabed Authority, 2010. A Geological Model of Polymetallic Nodule Deposits in the Clarion-Clipperton Fracture Zone and Prospector’s Guide for Polymetallic Nodule Deposits in the Clarion- Clipperton Fracture Zone. International Seabed Authority Technical Study: No. 6 ISBN: 978-976-95268-2-2.
ISA 2010b, International Seabed Authority, 2010. Recommendations for the guidance of contractors for the assessment of the possible environmental impacts arising from exploration for polymetallic nodules in the Area. ISBA/16/LTC/7. Issued by the Legal and Technical Commission.
ISA, 2017, International Seabed Authority, 2017. Towards an ISA environmental management strategy for the area. Report of an international workshop convened by the German Environment Agency (UBA), the German federal Institute for Geoscience and Natural Resources (BGR) and the Secretariat of the International Seabed Authority (ISA) in Berlin, Germany, 20-24 March 2017. ISA Technical Study: No. 17.
Kaluza et al. 2010, Kaluza P., Kolzsch A., Gastner M.T. and Blasius B., 19 January 2010. The complex network of global cargo ship movements”, Institute for Chemistry and Biology of the Marine Environment, Carl von Ossietzky Universitat, published online in Journal of the Royal Society Interface.
Kim 2018, Kim P.P. 2018. Reduction rates of silico-manganese slags from various raw materials. Paper, Norwegian University of Science and Technology. 2018. p. 1.
Kotlinski and Stoyanova 2006, Kotlinski, R. and Stoyanova, V., 2006 Buried and surface polymetallic nodule distribution in the eastern Clarion–Clipperton Zone: main distinctions and similarities. Advances in Geosciences Vol. 9: Solid Earth, Ocean Science & Atmospheric Science (2006) Eds. Yun-Tai Chen et al. World Scientific Publishing Company, pp 67-74.
Kuhn and Rühlemann 2021, Kuhn, T.; Rühlemann, C., 2021. Exploration of Polymetallic Nodules and Resource Assessment: A Case Study from the German Contract Area in the Clarion-Clipperton Zone of the Tropical Northeast Pacific. Minerals 2021, 11, 618. https:// doi.org/10.3390/min11060618.
Lee et al. 2008, Lee, G.C, Kim, J., Chi, S.B., Ko, Y.T and Ham, D.J., 2008. Examination for correction factor for manganese nodule abundance using the free fall grab and box corer. The Sea: Journal of the Korean Society of Oceanography, Vol 13, No. 3 pp 280-285.
Manheim 1978, Manheim F.T., 1978. Book review of G. P. Glasby, Marine manganese deposits. Geochemica et Cosmochimica Acta 42(5):541. Cited in: ISA. 2010. A geological model of polymetallic nodule deposits in the Clarion-Clipperton Fracture Zone and prospector's guide for polymetallic nodule deposits in the Clarion-Clipperton Fracture Zone. International Seabed Authority Technical Study.
MARGIN 2024, Breakdown of geo-obstacle distribution per geo-obstacle probability model class (Breakdown of geo-obstacle distribution per geo-obstacle probability model class.pdf).
| amcconsultants.com | 433 |
| Technical Report Summary of Prefeasibility Study of NORI Area D, Clarion Clipperton Zone | |
| TMC the metals company Inc. | 0225054 |
Mero 1965, Mero J., 1965. The Mineral Resources of the sea. Volume 1 (Elsevier Oceanography Series).
Novikov and Bogdanova 2007, Novikov G.V. and Bogdanova O. Y., 2007, Transformations of Ore Minerals in Genetically Different Oceanic Ferromanganese Rocks, ISSN 0024-4902, Lithology and Mineral Resources, 2007, Vol. 42, No. 4, pp. 303–317.
Parianos 2021, Parianos, J., & Madureira, P., 2021. Geomorphology of the Clarion Clipperton Zone, tropical North Pacific Ocean. Journal of Maps, 17(2), 760–768. https://doi.org/10.1080/17445647.2021.2001387.
Parianos et al. 2021. Parianos, J., Lipton, I., Nimmo, M., 2021. Aspects of Estimation and Reporting of Mineral Resources of Seabed Polymetallic Nodules: A Contemporaneous Case Study. Minerals 2021, 11, 200. https://doi.org/10.3390/min11020200.
PEA update 2020.
Peakcock, 2023, Peacock, T. The GSR Patania II Expedition: Technical Achievements & Scientific Learnings. Global Sea Mineral Resources. Internal Report. March 2023.
Reuters. (2024, May 8). Indonesia says nickel reserves enough for expansion, despite moratorium call. Retrieved from www.mining.com: https://www.mining.com/web/indonesia-nickel-reserves-enough-for-further-expansions-official-says/
Shimizu Y, Sugihara M, Fujinaga K, Nakamura K, Kato Y. Air-Lift Pumping System for Hybrid Mining of Rare-Earth Elements-Rich Mud and Polymetallic Nodules around Minamitorishima Island. Journal of Marine Science and Engineering. 2024; 12(9):1470.
Simon-Lledo E, Brett BJ, Huvenne VAI, Schoening T, Benoist NMA, Jeffrey RM, Durden JM, Jones DOB 2019. Megafaunal Variation in the abyssal landscape of the Clarion Clipperton zone. Progress in Oceanography 170:119-133.
Skowronek et al. 2021. Skowronek, A., Macia˛g, Ł., Zawadzki, D., Strzelecka, A., Baláž, P., Mianowicz, K., Abramowski, T., Koneˇcný, P., Krawcewicz, A., 2021. Chemostratigraphic and Textural Indicators of Nucleation and Growth of Polymetallic Nodules from the Clarion-Clipperton Fracture Zone (IOM Claim Area). Minerals 2021, 11, 868. https://doi.org/10.3390/ min11080868.
Spickermann 2012, Spickermann R., 2012. Rare earth content of manganese nodules in the Lockheed Martin Clarion-Clipperton Zone exploration areas. Proceedings Off-shore Technology Conference, Houston Texas.
Sridhar et al. 1976. Sridhar R, Jones W.E., and Warner J.S. Extraction of copper, nickel and cobalt from sea nodules. JOM, April 1976;28:32–7.
Sridhar R, et al. United States Patent #4,049,438, Filed February 14, 1975.
Subarna, R. A. (2024, September 14). Smelters squeeze Indonesia’s nickel ore supply. Retrieved from eastasiaforum.org: https://eastasiaforum.org/2024/09/14/smelters-squeeze-indonesias-nickel-ore-supply/
Terayama and Ikeda 1983, Transactions of the Japan Institute of Metals, Vol. 24, No. 11 (1983), pp. 754 – 758
| amcconsultants.com | 434 |
| Technical Report Summary of Prefeasibility Study of NORI Area D, Clarion Clipperton Zone | |
| TMC the metals company Inc. | 0225054 |
The Star. (2025, March 4). Indonesia nickel boom is forcing its own smelters to shut down. Retrieved from www.thestar.com: https://www.thestar.com.my/aseanplus/aseanplus-news/2025/03/04/indonesia-nickel-boom-is-forcing-its-own-smelters-to-shut-down#goog_rewarded
Tilot 2006, Tilot V, 2006. Biodiversity and distribution of megafauna. Vol. 1: The polymetallic nodule ecosystem of the Eastern Equatorial Pacific Ocean; Vol. 2: Annotated photographic atlas of the echinoderms of the Clarion-Clipperton fracture zone. Paris, UNESCO/IOC, 2006 (IOC Technical Series, 69).
TMC 2024, TMC the metals company Inc., October 2024. NORI Area D Prefeasibility Study, NORID-THEMC-0610-00-RPT-00025 – NORI-D PROJECT ZERO – PRE-FEASIBILITY STUDY. (Confidential).
Wiley, 2025. Wiley Rein LLP, July 2025. Reliance Memorandum: United States Regulatory Framework for Deep Seabed Mineral Recovery under the Deep Seabed Hard Mineral Resources Act (DSHMRA). (Confidential).
United Nations Division for Ocean Affairs and the Law of the Sea and the ISA. (2004). Marine Mineral Resources: Scientific advances and economic perspectives.
XPS, 2020. ‘Sea Nodules Converting Testwork’ XPS project 3019815.00, 22-Apr-2020. (Confidential).
| amcconsultants.com | 435 |
| Technical Report Summary of Prefeasibility Study of NORI Area D, Clarion Clipperton Zone | |
| TMC the metals company Inc. | 0225054 |
| 25 | Reliance on information provided by registrant |
In preparing inputs to the Mine Plan and in estimating the Mineral Reserve, QPs have relied on information provided by the registrant, TMC, regarding the following aspects of Modifying Factors:
| · | Macroeconomic trends, data, and assumptions, and interest rates (see Section 19 and subsection 12.2.14 Economic Modifying Factors) |
| · | Marketing information and plans within the control of the registrant (see Section 16 and subsection 12.2.12 Marketing Modifying Factors). |
| · | Legal matters outside the expertise of the QPs, such as statutory and regulatory interpretations affecting the mine plan (see parts of Section 3). |
| · | Environmental matters outside the expertise of the QPs (see Section 17 and sub-section 12.2.1) |
| · | Accommodations the registrant commits or plans to provide to local individuals or groups in connection with its mine plans (see parts of Section 17). |
| · | Governmental factors outside the expertise of the QPs (see parts of Section 3 and Section 19). |
The QPs consider it is reasonable to reply upon the information provided by the registrant in respect of the above factors as the registrant employs specialist personnel in these areas who have access to information to which the QPs do not.
| amcconsultants.com | 436 |
| Technical Report Summary of Prefeasibility Study of NORI Area D, Clarion Clipperton Zone | |
| TMC the metals company Inc. | 0225054 |
Our offices
| Australia | ||
|
Adelaide Level 1, 12 Pirie Street Adelaide SA 5000 Australia T +61 8 8201 1800 E adelaide@amcconsultants.com |
Brisbane Level 15, 100 Creek Street Brisbane Qld 4000 Australia T +61 7 3230 9000 E brisbane@amcconsultants.com | |
|
Melbourne Level 12, 477 Collins Street Melbourne Vic 3000 Australia T +61 3 8601 3300 E melbourne@amcconsultants.com |
Perth Level 3, 1100 Hay Street West Perth WA 6005 Australia T +61 8 6330 1100 E perth@amcconsultants.com | |
| Canada | ||
|
Toronto 140 Yonge Street, Suite 200 Toronto ON M5C 1X6 Canada T +1 647 953 9730 E toronto@amcconsultants.com |
Vancouver 200 Granville Street, Suite 202 Vancouver BC V6C 1S4 Canada T +1 604 669 0044 E vancouver@amcconsultants.com | |
| South Africa | ||
|
Cape Town First Floor, Willowbridge Centre Carl Cronje Drive Cape Town 7530 South Africa T +27 720 833 231 E capetown@amcconsultants.com |
Centurion Ground Floor (G05), Building 14, Block B Byls Bridge Office Park Corner of Olievenhoutbosch and Jean Ave Centurion 0157 South Africa T +27 720 833 231 E capetown@amcconsultants.com | |
| United Kingdom | ||
|
Reading Registered in England and Wales Company No. 3688365 Office 336a, Davidson House Forbury Square Reading, Berkshire RG1 3EU United Kingdom T +44 1628 778 256 E unitedkingdom@amcconsultants.com Registered Office: Kinetic Centre Theobald Street Elstree Hertfordshire WD6 4PG United Kingdom |
| amcconsultants.com |