
Q3 Investor Presentation November 3, 2025
2 NON-GAAP FINANCIAL MEASURES This presentation contains references to non-GAAP measures. Adjusted EBITDA (Adjusted Earnings Before Interest, Taxes, Depreciation and Amortization) is defined as operating income excluding: (1) stock-based compensation expense; (2) depreciation; and (3) acquisition-related items consisting of (i) amortization of intangible assets and impairments of goodwill and intangible assets, if applicable, and (ii) gains and losses recognized on changes in the fair value of contingent consideration arrangements, if applicable. Adjusted EBITDA excluding Certain Items is defined as Adjusted EBITDA excluding certain: (1) severance-related costs; (2) lease termination gains; (3) lease impairments; and (4) legal fees and settlement expenses for litigation that concluded in Q3 related to a legacy business. We believe this measure is useful for analysts and investors because it can enhance the comparability of Adjusted EBITDA trends between periods and we use it for that purpose internally. Adjusted EBITDA excluding Certain Items has certain limitations because it excludes the impact of the expenses referenced above.The reconciliations between GAAP measures and non-GAAP measures are included in the Appendix to this presentation, including reconciliations for Adjusted EBITDA excl. Certain Items for People Inc. and IAC. FORWARD-LOOKING STATEMENTS This presentation may contain "forward-looking statements" within the meaning of the Private Securities Litigation Reform Act of 1995. The use of words such as "anticipates," "estimates," "expects," "plans," “guidance” and "believes," among others, generally identify forward-looking statements. These forward-looking statements include, among others, statements relating to: the future financial performance of IAC and its businesses, business prospects and strategy, anticipated trends and prospects in the industries in which IAC’s businesses operate and other similar matters. Actual results could differ materially from those contained in these forward-looking statements for a variety of reasons, including, among others: (i) our ability to compete with generative artificial intelligence (“AI”) technology and the disruption across marketing and publishing driven by AI-enabled search features, including Google’s AI Overviews, (ii) unstable market and economic conditions (particularly those that adversely impact advertising spending levels and consumer confidence and spending behavior), either generally and/or in any of the markets in which our businesses operate, as well as geopolitical conflicts, (iii) our ability to market our products and services in a successful and cost-effective manner, (iv) the display prominence of links to websites offering our products and services in search results, (v) changes in our relationship with (or policies implemented by) Google, (vi) the failure or delay of the markets and industries in which our businesses operate to migrate online and the continued growth and acceptance of online products and services as effective alternatives to traditional products and services, (vii) our continued ability to develop and monetize versions of our products and services for mobile and other digital devices, (viii) the ability of our Digital business to successfully expand the digital reach of our portfolio of publishing brands, (ix) our continued ability to market, distribute and monetize our products and services through search engines, digital app stores, advertising networks and social media platforms, (x) risks related to our Print business including declining revenue, increases in paper and postage costs, reliance on a single supplier to print our magazines and potential increases in pension plan obligations, (xi) our ability to establish and maintain relationships with quality and trustworthy caregivers, (xii) our ability to access, collect, use and protect the personal data of our users and subscribers, (xiii) our ability to engage directly with users, subscribers, consumers and caregivers on a timely basis, (xiv) the ability of our Chairman and Senior Executive and certain members of his family to exercise significant influence over the composition of our board of directors, matters subject to stockholder approval and our operations, (xv) risks related to our liquidity and indebtedness (the impact of our indebtedness on our ability to operate our business, our ability to generate sufficient cash to service our indebtedness and interest rate risk), (xvi) our inability to freely access the cash of People Inc. and its subsidiaries, (xvii) dilution with respect to investments in IAC, (xviii) our ability to compete, (xix) our ability to build, maintain and/or enhance our various brands, (xx) our ability to protect our systems, technology and infrastructure from cyberattacks (including cyberattacks experienced by third parties with whom we do business), (xxi) the occurrence of data security breaches and/or fraud, (xxii) increased liabilities and costs related to the processing, storage, use and disclosure of personal and confidential user information, (xxiii) the integrity, quality, efficiency and scalability of our systems, technology and infrastructure (and those of third parties with whom we do business), (xxiv) changes in key personnel and risks related to leadership transitions and (xxv) changes to our capital deployment strategy. Certain of these and other risks and uncertainties are described in IAC’s filings with the Securities and Exchange Commission (the “SEC”), including the most recent Annual Report on Form 10-K filed with the SEC on February 28, 2025, and subsequent reports that IAC files with the SEC. Other unknown or unpredictable factors that could also adversely affect IAC's business, financial condition and results of operations may arise from time to time. It is not possible for our management to predict all risks, nor can we assess the impact of all factors on our business or the extent to which any factor, or combination of factors, may cause actual results to differ materially from those expressed in any forward-looking statements we may make. Except as required by law, we undertake no obligation to update any forward- looking statements to reflect events or circumstances after the date of such statements. You should, therefore, not rely on these forward-looking statements as representing our views as of any date subsequent to the date of this presentation. MARKET AND INDUSTRY DATA This presentation includes market and industry data and other information derived from our own research as well as from publicly available sources, including filings by other companies, third-party reports, and industry publications. Such data and information are included for informational purposes only. We have not independently verified this data, and we do not make any representation or warranty as to its accuracy or completeness. We do not claim ownership of, or responsibility for, any data obtained from public filings or third-party sources. NO OFFER OR SOLICITATION This presentation does not constitute a solicitation of a proxy, consent or authorization with respect to any securities of IAC. This presentation also does not constitute an offer to sell or the solicitation of an offer to buy securities, nor will there be any sale of securities in any state or jurisdiction in which such offer, solicitation or sale would be unlawful prior to registration or qualification under the securities laws of any such jurisdiction. No offering of securities will be made except by means of a prospectus meeting the requirements of the Securities Act of 1933, as amended, or an exemption therefrom. TRADEMARKS This presentation may contain trademarks, service marks, trade names and copyrights of other companies, which are the property of their respective owners. Solely for convenience, some of the trademarks, service marks, trade names and copyrights referred to in this presentation may be listed without the TM, SM © or ® symbols, but we will assert, to the fullest extent under applicable law, the rights of the applicable owners, if any, to these trademarks, service marks, trade names and copyrights.
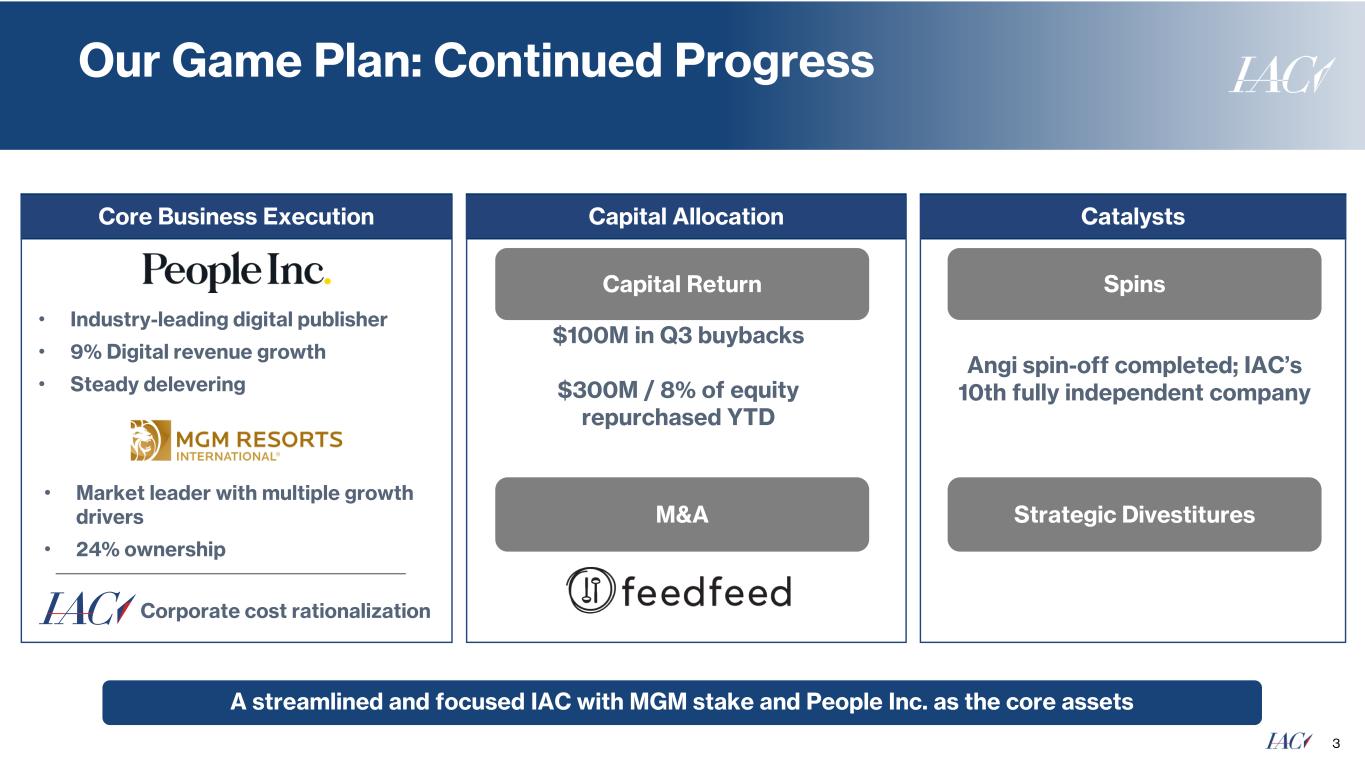
Our Game Plan: Continued Progress 3 • Market leader with multiple growth drivers • 24% ownership Capital Return $100M in Q3 buybacks $300M / 8% of equity repurchased YTD A streamlined and focused IAC with MGM stake and People Inc. as the core assets M&A Core Business Execution CatalystsCapital Allocation • Industry-leading digital publisher • 9% Digital revenue growth • Steady delevering Corporate cost rationalization Angi spin-off completed; IAC’s 10th fully independent company Strategic Divestitures Spins
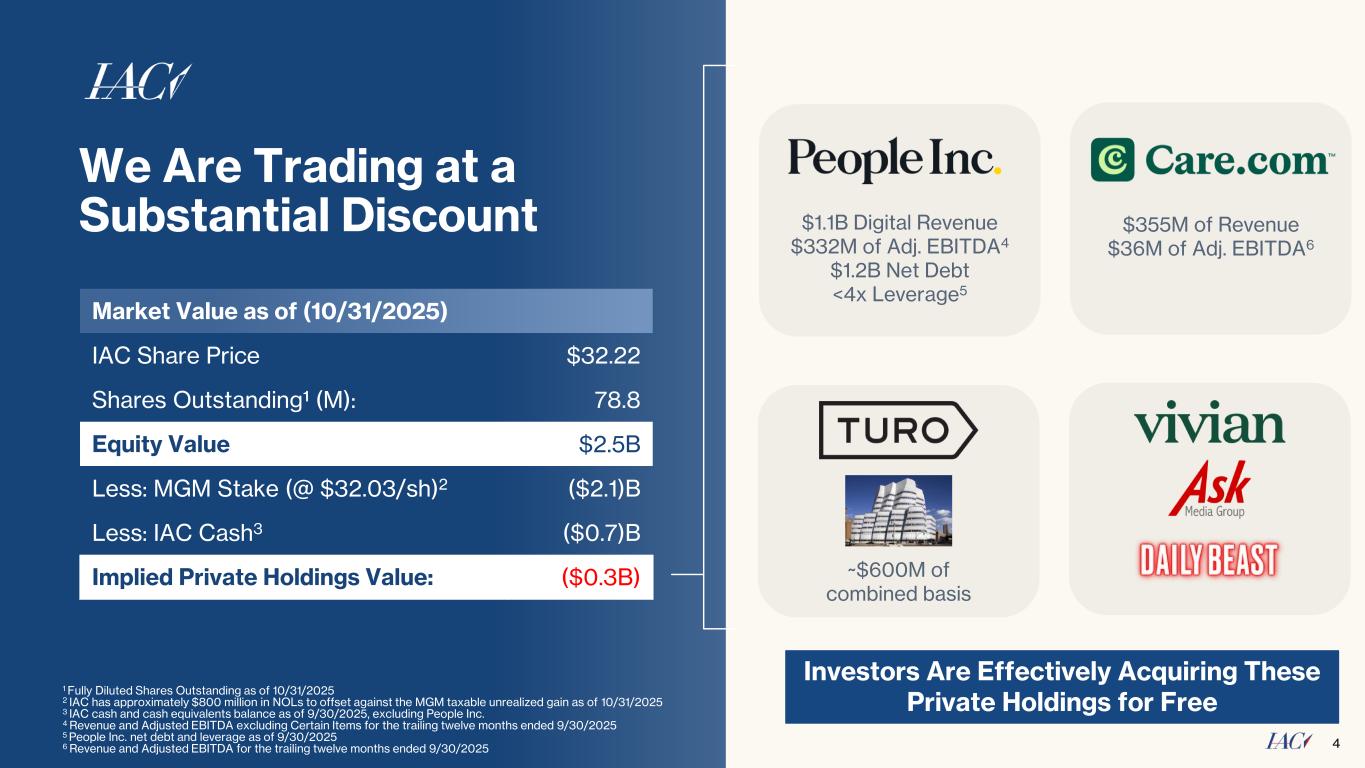
4 We Are Trading at a Substantial Discount Market Value as of (10/31/2025) IAC Share Price $32.22 Shares Outstanding¹ (M): 78.8 Equity Value $2.5B Less: MGM Stake (@ $32.03/sh)2 ($2.1)B Less: IAC Cash3 ($0.7)B Implied Private Holdings Value: ($0.3B) 1 Fully Diluted Shares Outstanding as of 10/31/2025 2 IAC has approximately $800 million in NOLs to offset against the MGM taxable unrealized gain as of 10/31/2025 3 IAC cash and cash equivalents balance as of 9/30/2025, excluding People Inc. 4 Revenue and Adjusted EBITDA excluding Certain Items for the trailing twelve months ended 9/30/2025 5 People Inc. net debt and leverage as of 9/30/2025 6 Revenue and Adjusted EBITDA for the trailing twelve months ended 9/30/2025 $1.1B Digital Revenue $332M of Adj. EBITDA4 $1.2B Net Debt <4x Leverage5 $355M of Revenue $36M of Adj. EBITDA6 ~$600M of combined basis Investors Are Effectively Acquiring These Private Holdings for Free
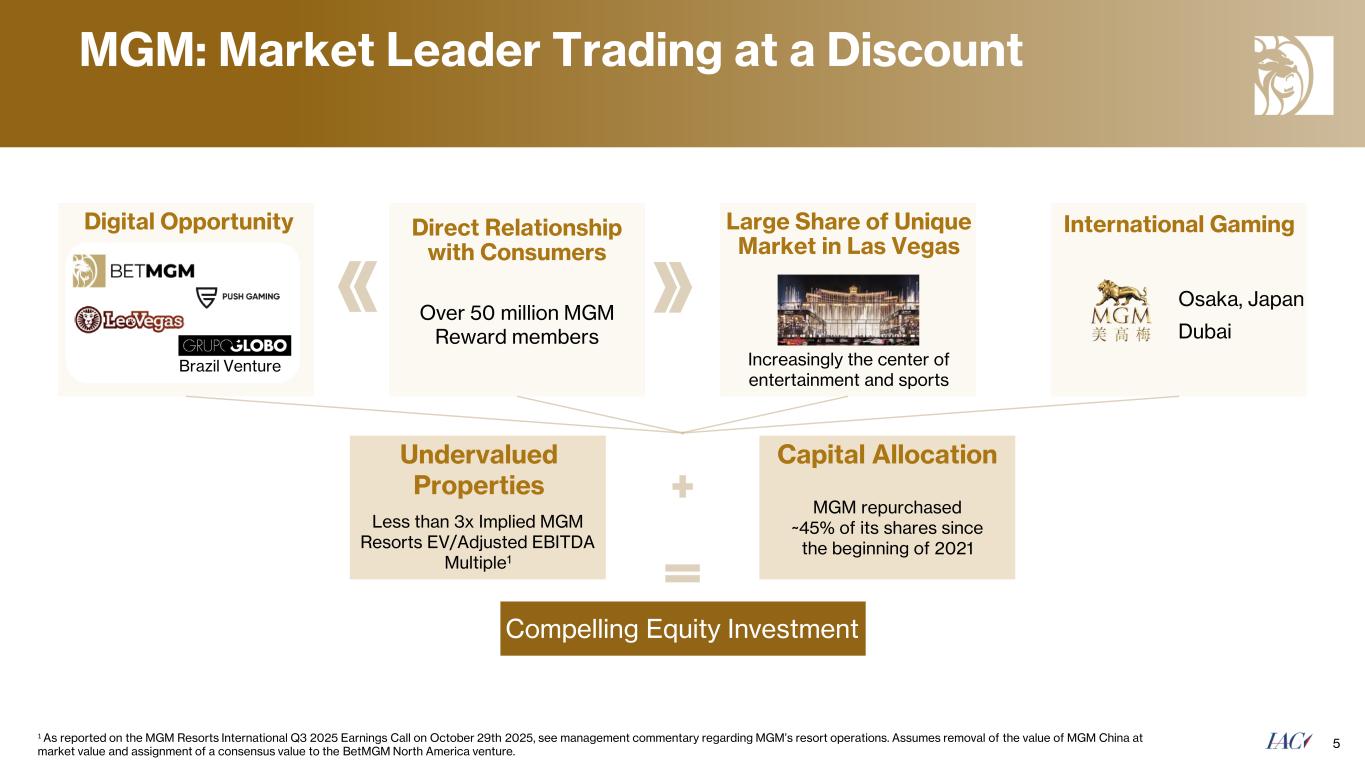
MGM: Market Leader Trading at a Discount 5 Compelling Equity Investment Increasingly the center of entertainment and sports Digital Opportunity Large Share of Unique Market in Las Vegas Less than 3x Implied MGM Resorts EV/Adjusted EBITDA Multiple1 Undervalued Properties Over 50 million MGM Reward members Direct Relationship with Consumers Brazil Venture Capital Allocation MGM repurchased ~45% of its shares since the beginning of 2021 International Gaming Osaka, Japan Dubai 1 As reported on the MGM Resorts International Q3 2025 Earnings Call on October 29th 2025, see management commentary regarding MGM’s resort operations. Assumes removal of the value of MGM China at market value and assignment of a consensus value to the BetMGM North America venture.
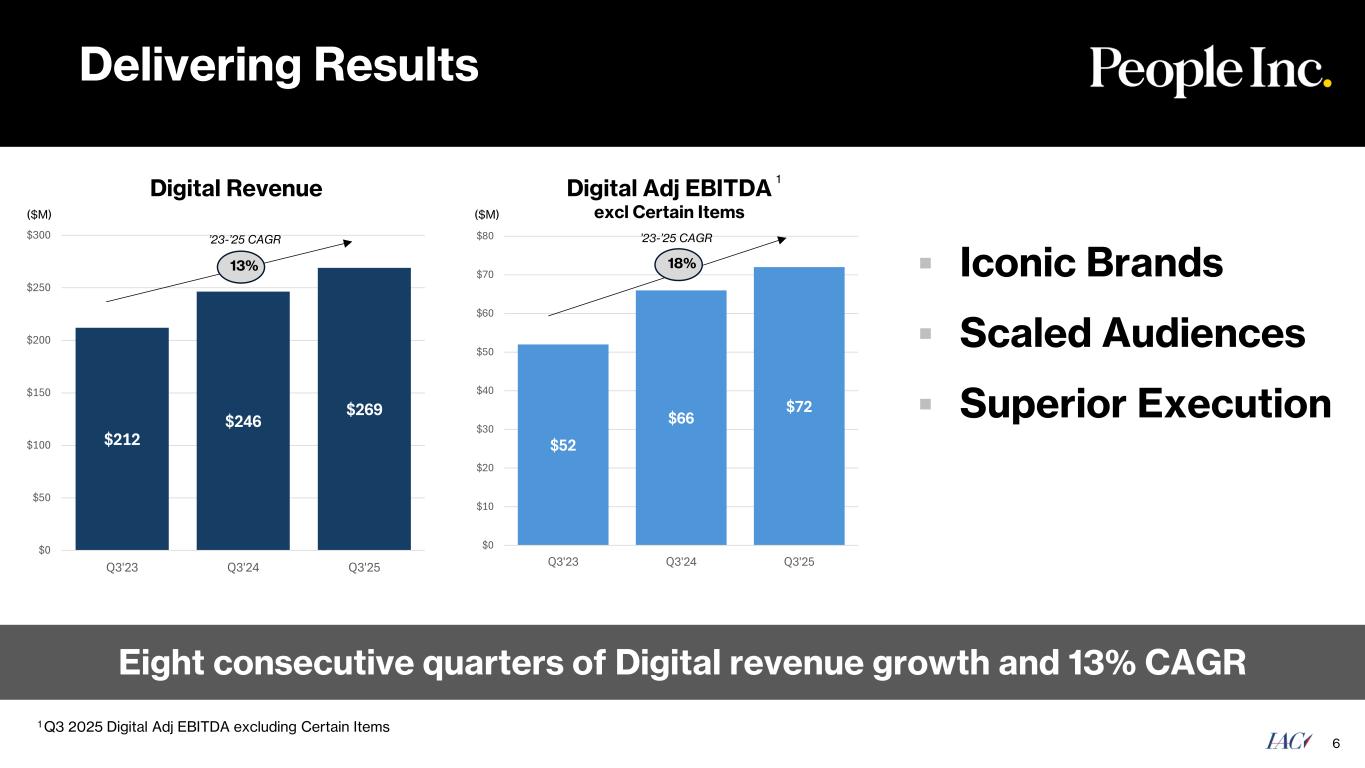
Delivering Results 6 Digital Adj EBITDA excl Certain Items ▪ Iconic Brands ▪ Scaled Audiences ▪ Superior Execution Eight consecutive quarters of Digital revenue growth and 13% CAGR Digital Revenue $212 $246 $269 $0 $50 $100 $150 $200 $250 $300 Q3'23 Q3'24 Q3'25 $52 $66 $72 $0 $10 $20 $30 $40 $50 $60 $70 $80 Q3'23 Q3'24 Q3'25 18%13% ’23-’25 CAGR’23-’25 CAGR 1 Q3 2025 Digital Adj EBITDA excluding Certain Items 1 ($M) ($M)
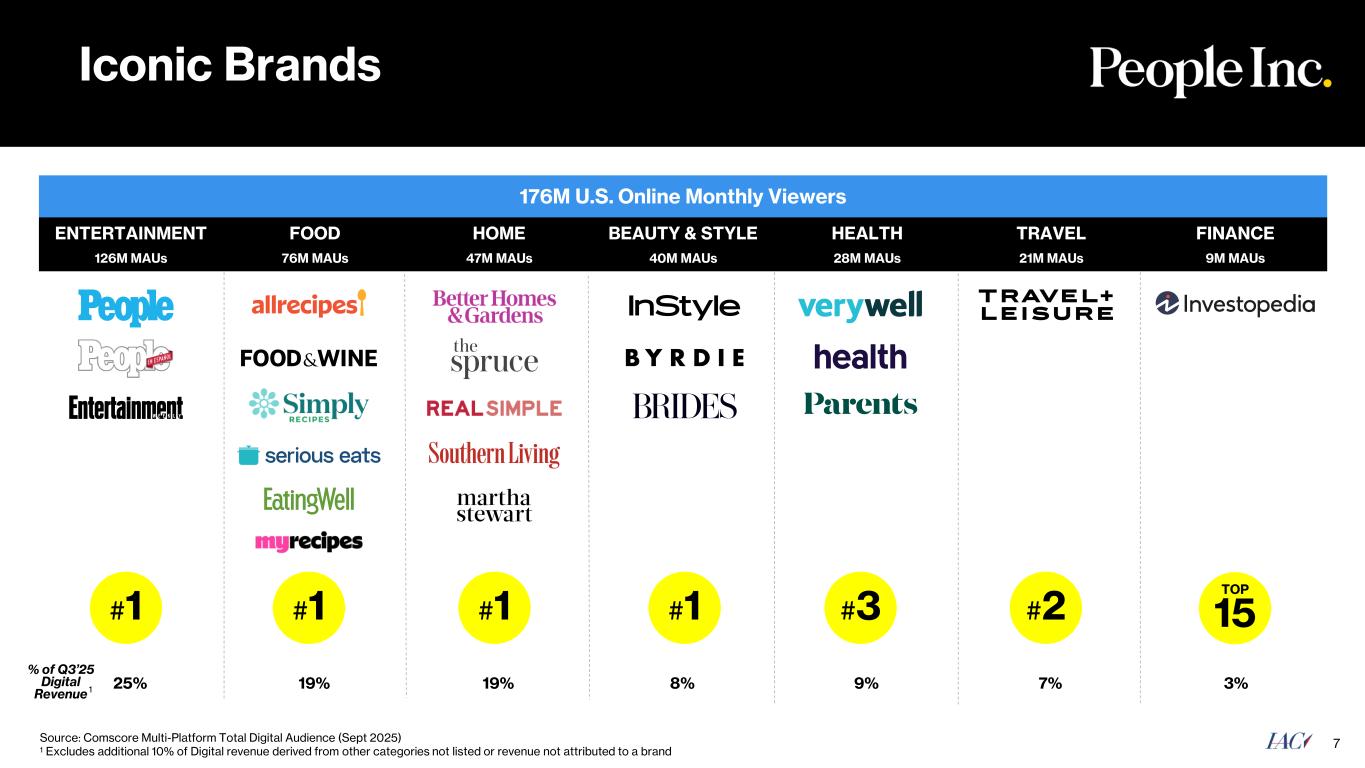
Iconic Brands 7Source: Comscore Multi-Platform Total Digital Audience (Sept 2025) 1 Excludes additional 10% of Digital revenue derived from other categories not listed or revenue not attributed to a brand 25% 19% 19% 8% 9% 7% 3% % of Q3’25 Digital Revenue 176M U.S. Online Monthly Viewers ENTERTAINMENT FOOD HOME BEAUTY & STYLE HEALTH TRAVEL FINANCE 126M MAUs 76M MAUs 47M MAUs 40M MAUs 28M MAUs 21M MAUs 9M MAUs #1 #1 #1 #1 #3 #2 1 15 TOP
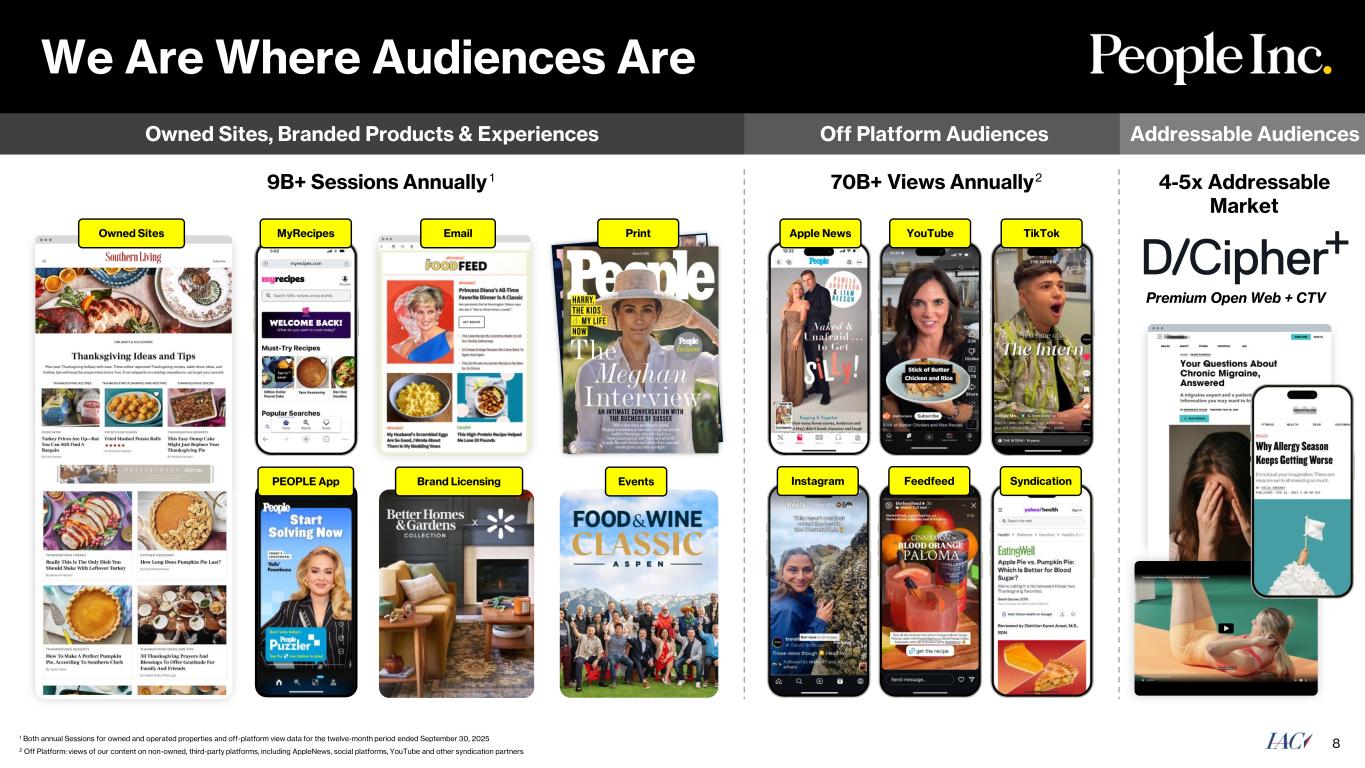
We Are Where Audiences Are 8 Owned Sites, Branded Products & Experiences Off Platform Audiences Addressable Audiences Brand Licensing Events Print Premium Open Web + CTV Owned Sites MyRecipes 4-5x Addressable Market 70B+ Views Annually29B+ Sessions Annually 1 PEOPLE App Apple News YouTube TikTok Instagram Feedfeed Syndication Email 1 Both annual Sessions for owned and operated properties and off-platform view data for the twelve-month period ended September 30, 2025 2 Off Platform: views of our content on non-owned, third-party platforms, including AppleNews, social platforms, YouTube and other syndication partners
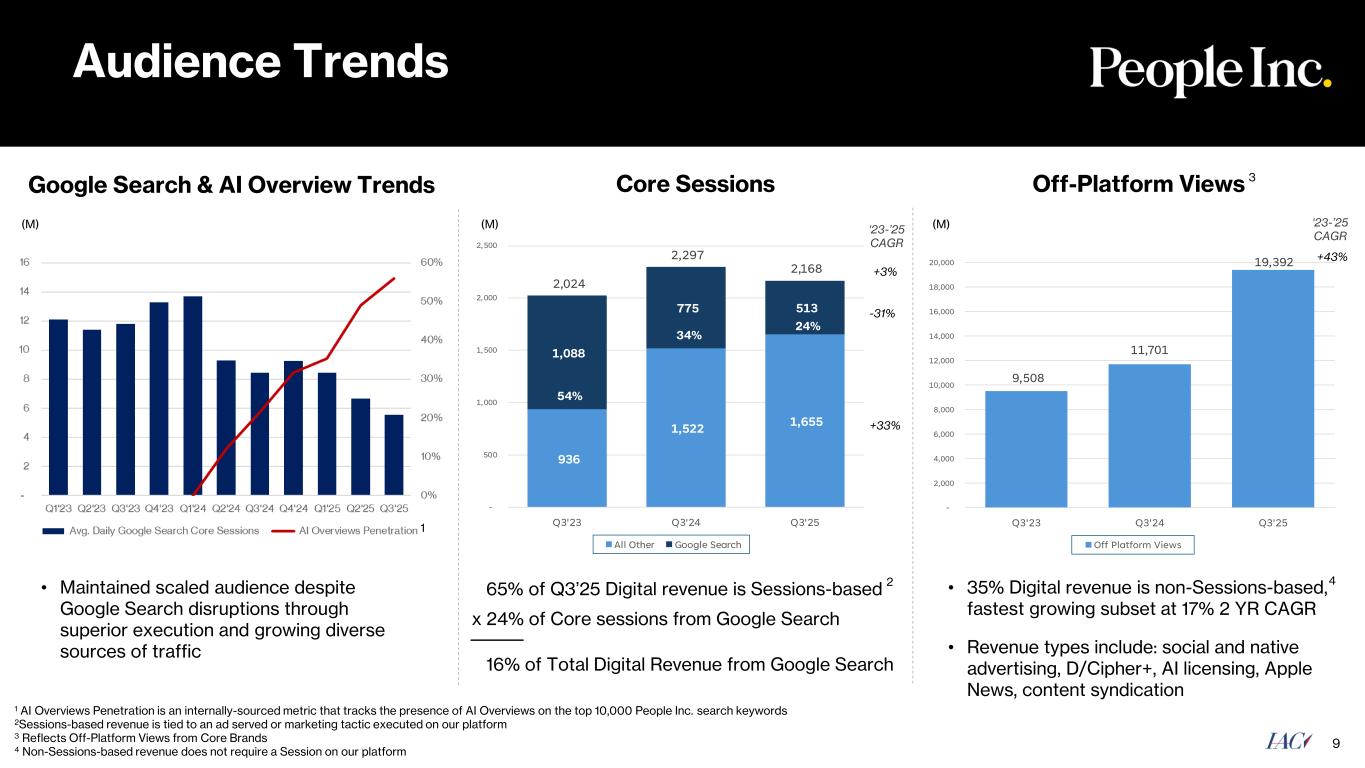
1,088 775 513 936 1,522 1,655 2,024 2,297 2,168 - 500 1,000 1,500 2,000 2,500 Q3'23 Q3'24 Q3'25 All Other Google Search +33% (M) -31% +3% ‘23-’25 CAGR 9,508 11,701 19,392 - 2,000 4,000 6,000 8,000 10,000 12,000 14,000 16,000 18,000 20,000 Q3'23 Q3'24 Q3'25 Off Platform Views Audience Trends 9 Core Sessions 65% of Q3’25 Digital revenue is Sessions-based x 24% of Core sessions from Google Search 16% of Total Digital Revenue from Google Search 42 34% Off-Platform Views +43% ‘23-’25 CAGR 3 (M) • Maintained scaled audience despite Google Search disruptions through superior execution and growing diverse sources of traffic Google Search & AI Overview Trends (M) 1 • 35% Digital revenue is non-Sessions-based, fastest growing subset at 17% 2 YR CAGR • Revenue types include: social and native advertising, D/Cipher+, AI licensing, Apple News, content syndication 54% 34% 24% 1 AI Overviews Penetration is an internally-sourced metric that tracks the presence of AI Overviews on the top 10,000 People Inc. search keywords 2Sessions-based revenue is tied to an ad served or marketing tactic executed on our platform 3 Reflects Off-Platform Views from Core Brands 4 Non-Sessions-based revenue does not require a Session on our platform
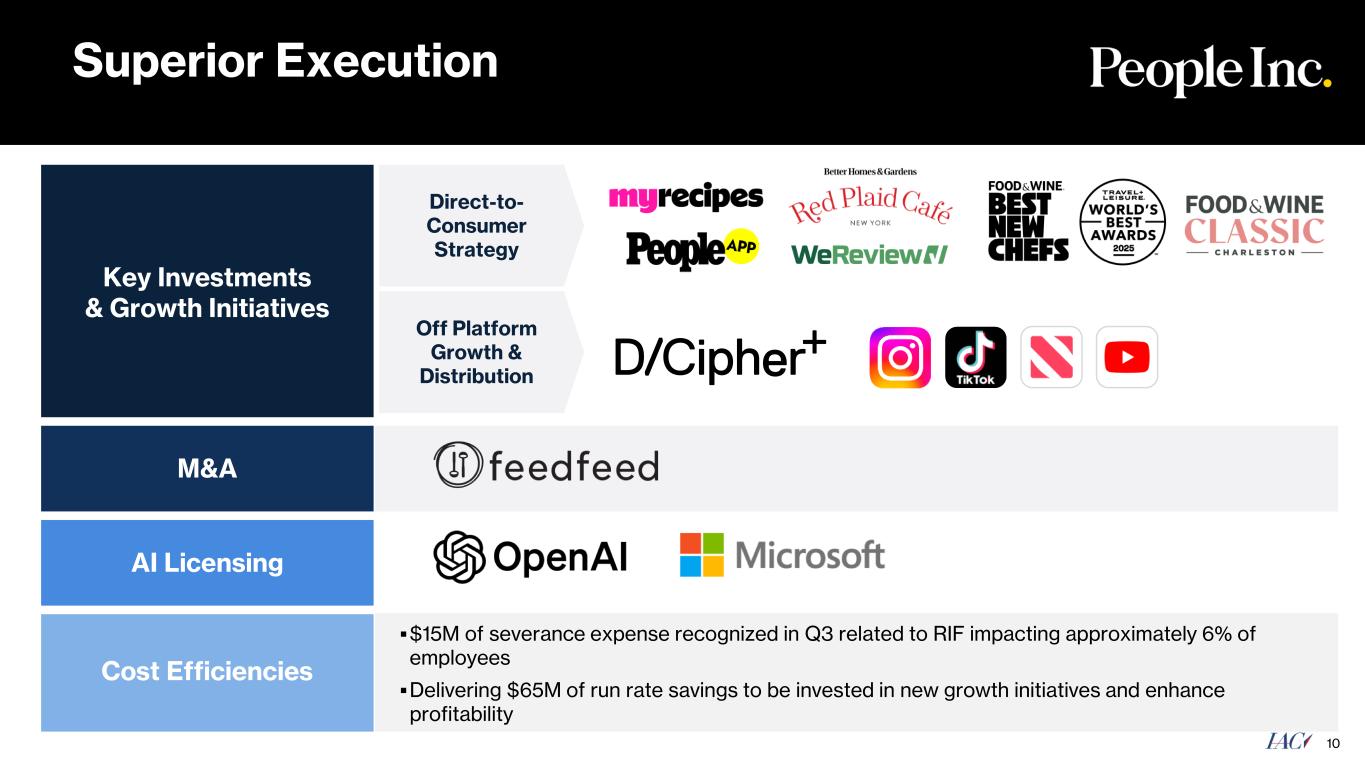
Key Investments & Growth Initiatives M&A AI Licensing Cost Efficiencies 10 Superior Execution Off Platform Growth & Distribution Direct-to- Consumer Strategy ▪$15M of severance expense recognized in Q3 related to RIF impacting approximately 6% of employees ▪Delivering $65M of run rate savings to be invested in new growth initiatives and enhance profitability
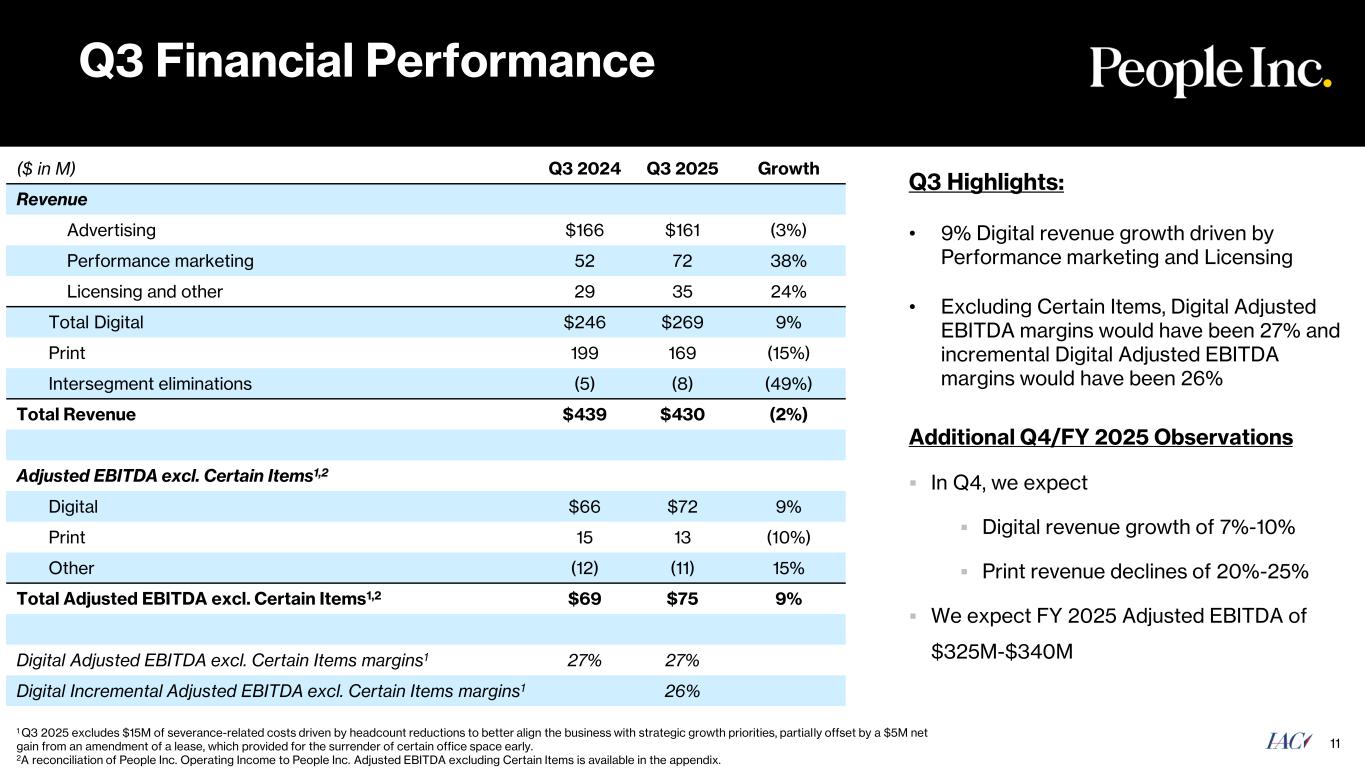
Q3 Financial Performance 11 ($ in M) Q3 2024 Q3 2025 Growth Revenue Advertising $166 $161 (3%) Performance marketing 52 72 38% Licensing and other 29 35 24% Total Digital $246 $269 9% Print 199 169 (15%) Intersegment eliminations (5) (8) (49%) Total Revenue $439 $430 (2%) Adjusted EBITDA excl. Certain Items1,2 Digital $66 $72 9% Print 15 13 (10%) Other (12) (11) 15% Total Adjusted EBITDA excl. Certain Items1,2 $69 $75 9% Digital Adjusted EBITDA excl. Certain Items margins1 27% 27% Digital Incremental Adjusted EBITDA excl. Certain Items margins1 26% 1 Q3 2025 excludes $15M of severance-related costs driven by headcount reductions to better align the business with strategic growth priorities, partially offset by a $5M net gain from an amendment of a lease, which provided for the surrender of certain office space early. 2A reconciliation of People Inc. Operating Income to People Inc. Adjusted EBITDA excluding Certain Items is available in the appendix. Q3 Highlights: • 9% Digital revenue growth driven by Performance marketing and Licensing • Excluding Certain Items, Digital Adjusted EBITDA margins would have been 27% and incremental Digital Adjusted EBITDA margins would have been 26% Additional Q4/FY 2025 Observations ▪ In Q4, we expect ▪ Digital revenue growth of 7%-10% ▪ Print revenue declines of 20%-25% ▪ We expect FY 2025 Adjusted EBITDA of $325M-$340M
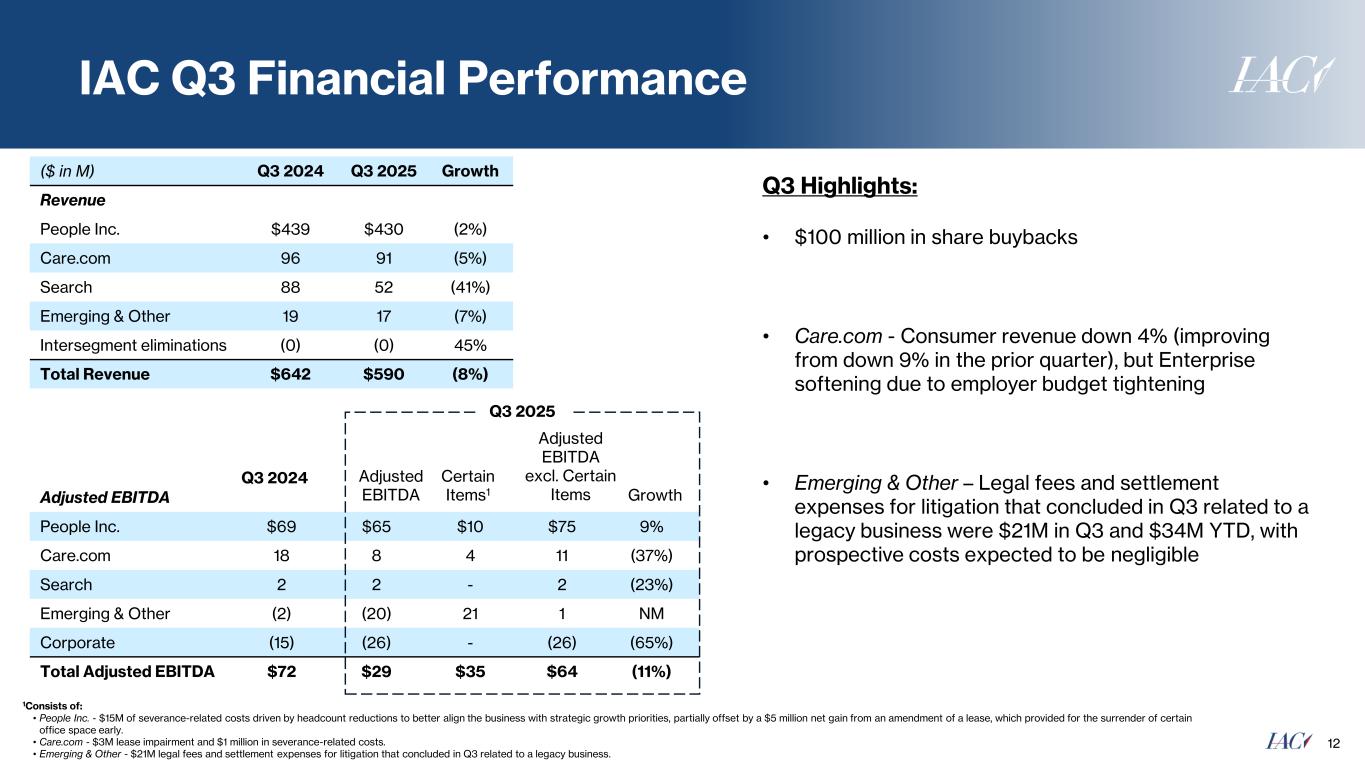
IAC Q3 Financial Performance 12 ($ in M) Q3 2024 Q3 2025 Growth Revenue People Inc. $439 $430 (2%) Care.com 96 91 (5%) Search 88 52 (41%) Emerging & Other 19 17 (7%) Intersegment eliminations (0) (0) 45% Total Revenue $642 $590 (8%) Adjusted EBITDA People Inc. $69 $65 $10 $75 9% Care.com 18 8 4 11 (37%) Search 2 2 - 2 (23%) Emerging & Other (2) (20) 21 1 NM Corporate (15) (26) - (26) (65%) Total Adjusted EBITDA $72 $29 $35 $64 (11%) Q3 Highlights: • $100 million in share buybacks • Care.com - Consumer revenue down 4% (improving from down 9% in the prior quarter), but Enterprise softening due to employer budget tightening • Emerging & Other – Legal fees and settlement expenses for litigation that concluded in Q3 related to a legacy business were $21M in Q3 and $34M YTD, with prospective costs expected to be negligible Certain Items1 Adjusted EBITDA excl. Certain Items Adjusted EBITDA Q3 2025 Q3 2024 1Consists of: • People Inc. - $15M of severance-related costs driven by headcount reductions to better align the business with strategic growth priorities, partially offset by a $5 million net gain from an amendment of a lease, which provided for the surrender of certain office space early. • Care.com - $3M lease impairment and $1 million in severance-related costs. • Emerging & Other - $21M legal fees and settlement expenses for litigation that concluded in Q3 related to a legacy business. Growth
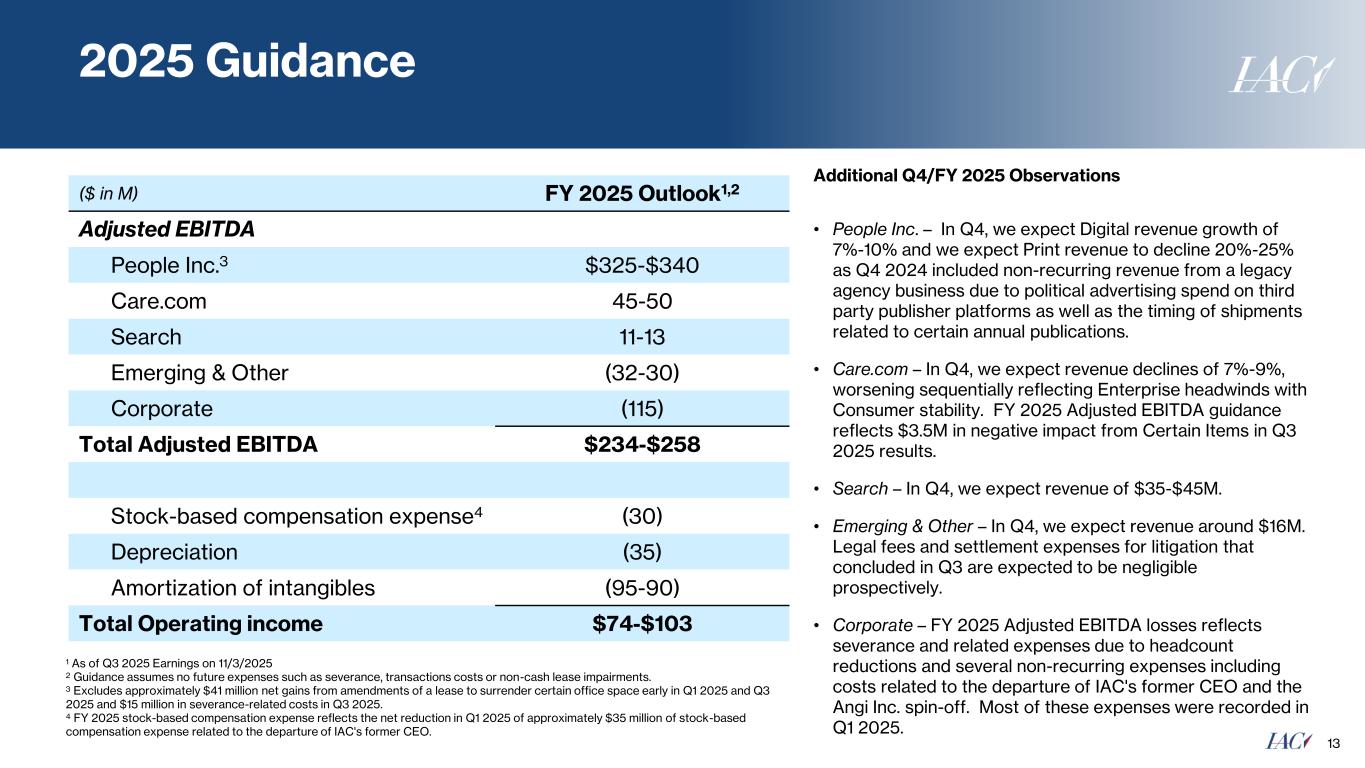
2025 Guidance 13 ($ in M) FY 2025 Outlook1,2 Adjusted EBITDA People Inc.3 $325-$340 Care.com 45-50 Search 11-13 Emerging & Other (32-30) Corporate (115) Total Adjusted EBITDA $234-$258 Stock-based compensation expense4 (30) Depreciation (35) Amortization of intangibles (95-90) Total Operating income $74-$103 1 As of Q3 2025 Earnings on 11/3/2025 2 Guidance assumes no future expenses such as severance, transactions costs or non-cash lease impairments. 3 Excludes approximately $41 million net gains from amendments of a lease to surrender certain office space early in Q1 2025 and Q3 2025 and $15 million in severance-related costs in Q3 2025. 4 FY 2025 stock-based compensation expense reflects the net reduction in Q1 2025 of approximately $35 million of stock-based compensation expense related to the departure of IAC's former CEO. Additional Q4/FY 2025 Observations • People Inc. – In Q4, we expect Digital revenue growth of 7%-10% and we expect Print revenue to decline 20%-25% as Q4 2024 included non-recurring revenue from a legacy agency business due to political advertising spend on third party publisher platforms as well as the timing of shipments related to certain annual publications. • Care.com – In Q4, we expect revenue declines of 7%-9%, worsening sequentially reflecting Enterprise headwinds with Consumer stability. FY 2025 Adjusted EBITDA guidance reflects $3.5M in negative impact from Certain Items in Q3 2025 results. • Search – In Q4, we expect revenue of $35-$45M. • Emerging & Other – In Q4, we expect revenue around $16M. Legal fees and settlement expenses for litigation that concluded in Q3 are expected to be negligible prospectively. • Corporate – FY 2025 Adjusted EBITDA losses reflects severance and related expenses due to headcount reductions and several non-recurring expenses including costs related to the departure of IAC's former CEO and the Angi Inc. spin-off. Most of these expenses were recorded in Q1 2025.
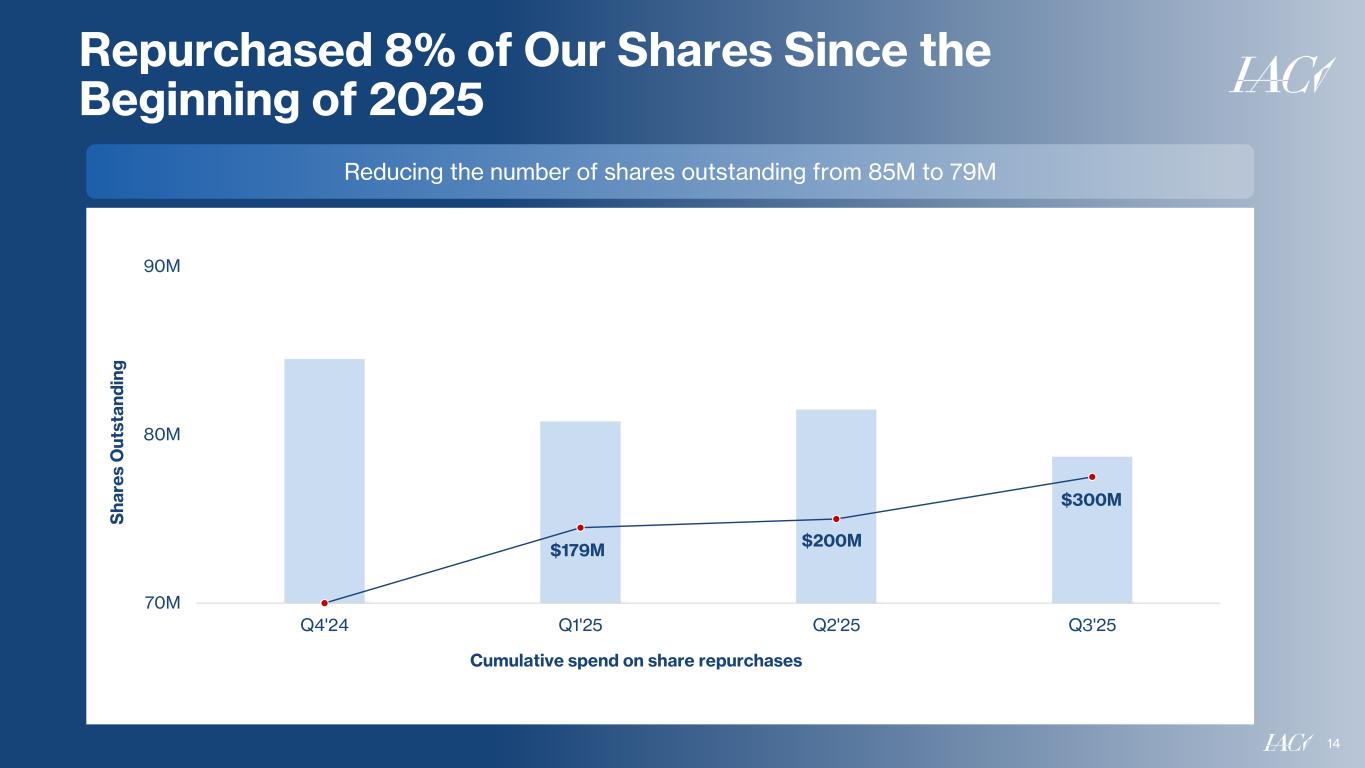
Reducing the number of shares outstanding from 85M to 79M 14 Repurchased 8% of Our Shares Since the Beginning of 2025 $179M $200M $300M 70M 80M 90M Q4'24 Q1'25 Q2'25 Q3'25 S h a re s O u ts ta n d in g Cumulative spend on share repurchases

15 Appendix
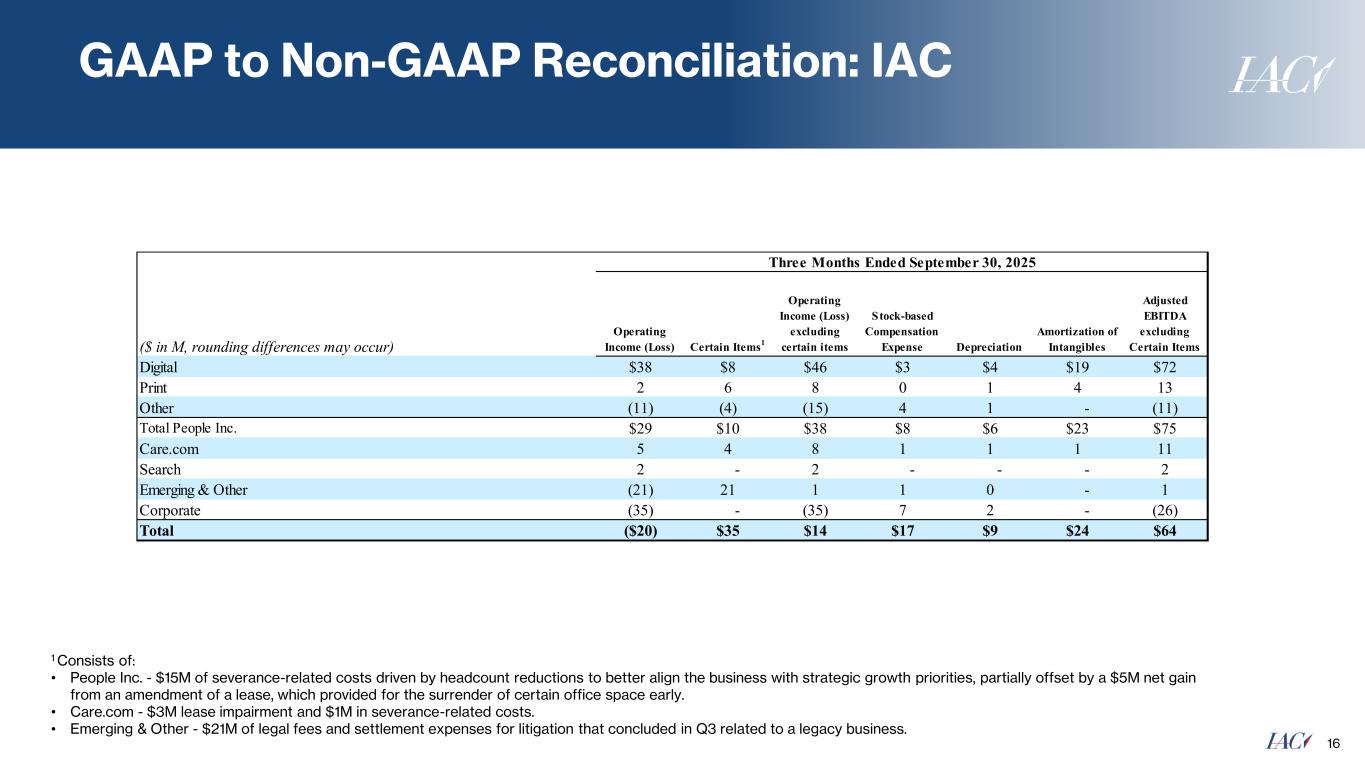
GAAP to Non-GAAP Reconciliation: IAC 16 1 Consists of: • People Inc. - $15M of severance-related costs driven by headcount reductions to better align the business with strategic growth priorities, partially offset by a $5M net gain from an amendment of a lease, which provided for the surrender of certain office space early. • Care.com - $3M lease impairment and $1M in severance-related costs. • Emerging & Other - $21M of legal fees and settlement expenses for litigation that concluded in Q3 related to a legacy business. Three Months Ended September 30, 2025 ($ in M, rounding differences may occur) Operating Income (Loss) Certain Items 1 Operating Income (Loss) excluding certain items Stock-based Compensation Expense Depreciation Amortization of Intangibles Adjusted EBITDA excluding Certain Items Digital $38 $8 $46 $3 $4 $19 $72 Print 2 6 8 0 1 4 13 Other (11) (4) (15) 4 1 - (11) Total People Inc. $29 $10 $38 $8 $6 $23 $75 Care.com 5 4 8 1 1 1 11 Search 2 - 2 - - - 2 Emerging & Other (21) 21 1 1 0 - 1 Corporate (35) - (35) 7 2 - (26) Total ($20) $35 $14 $17 $9 $24 $64
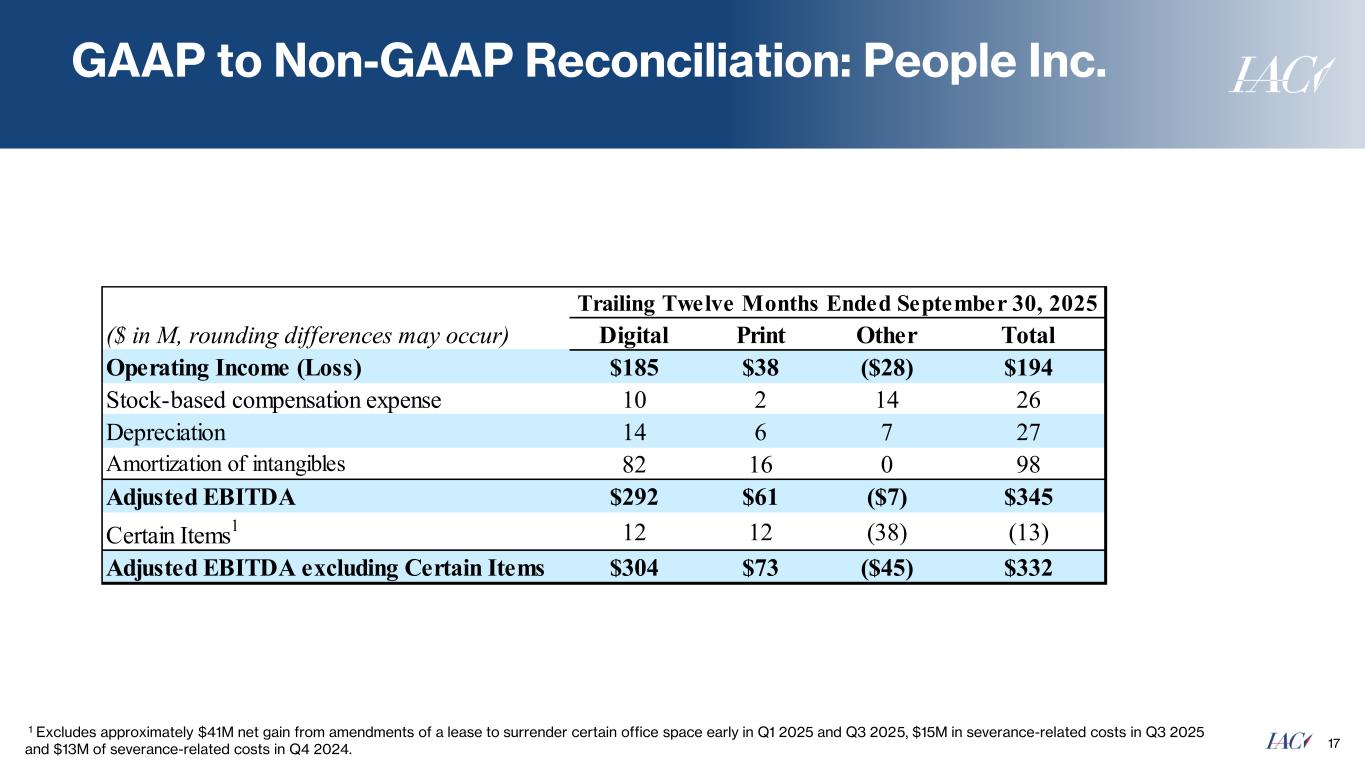
GAAP to Non-GAAP Reconciliation: People Inc. 17 1 Excludes approximately $41M net gain from amendments of a lease to surrender certain office space early in Q1 2025 and Q3 2025, $15M in severance-related costs in Q3 2025 and $13M of severance-related costs in Q4 2024. . Trailing Twelve Months Ended September 30, 2025 ($ in M, rounding differences may occur) Digital Print Other Total Operating Income (Loss) $185 $38 ($28) $194 Stock-based compensation expense 10 2 14 26 Depreciation 14 6 7 27 Amortization of intangibles 82 16 0 98 Adjusted EBITDA $292 $61 ($7) $345 Certain Items 1 12 12 (38) (13) Adjusted EBITDA excluding Certain Items $304 $73 ($45) $332
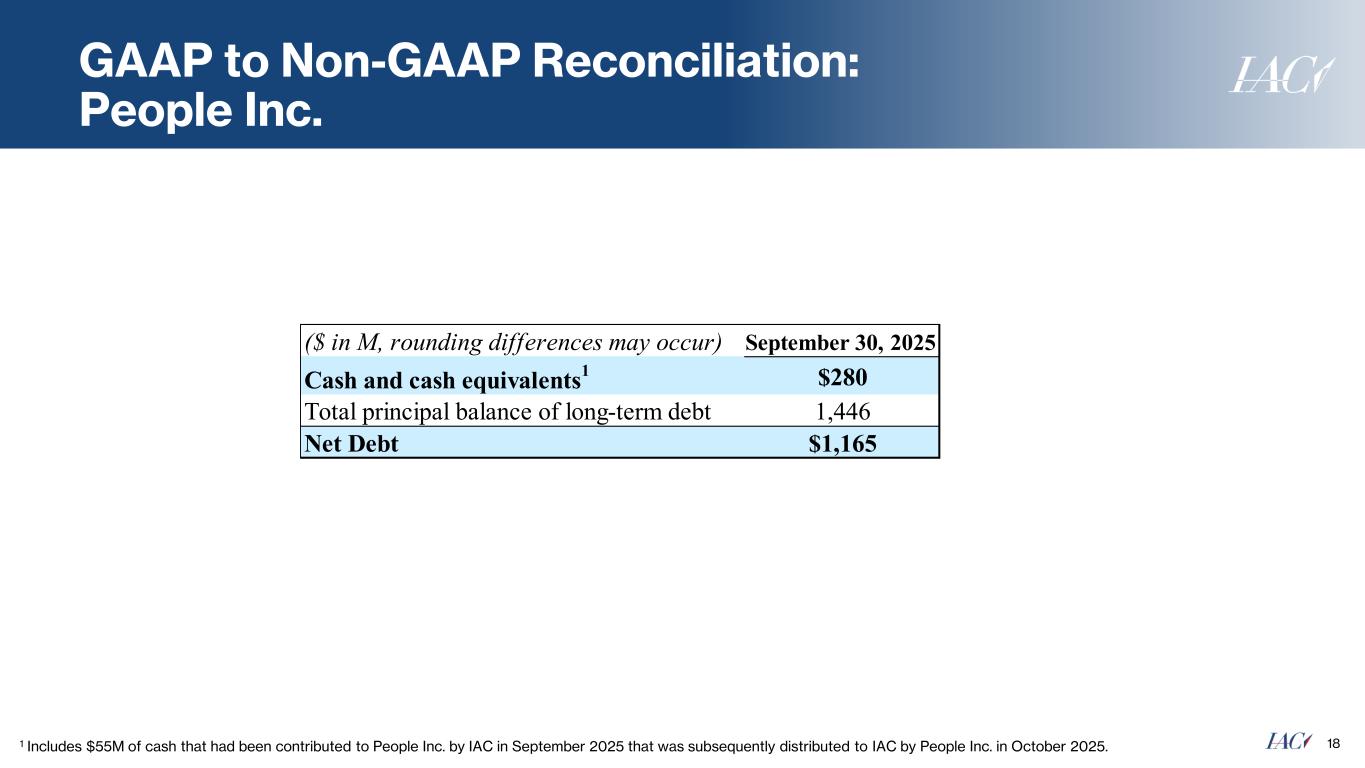
GAAP to Non-GAAP Reconciliation: People Inc. 181 Includes $55M of cash that had been contributed to People Inc. by IAC in September 2025 that was subsequently distributed to IAC by People Inc. in October 2025. ($ in M, rounding differences may occur) September 30, 2025 Cash and cash equivalents 1 $280 Total principal balance of long-term debt 1,446 Net Debt $1,165
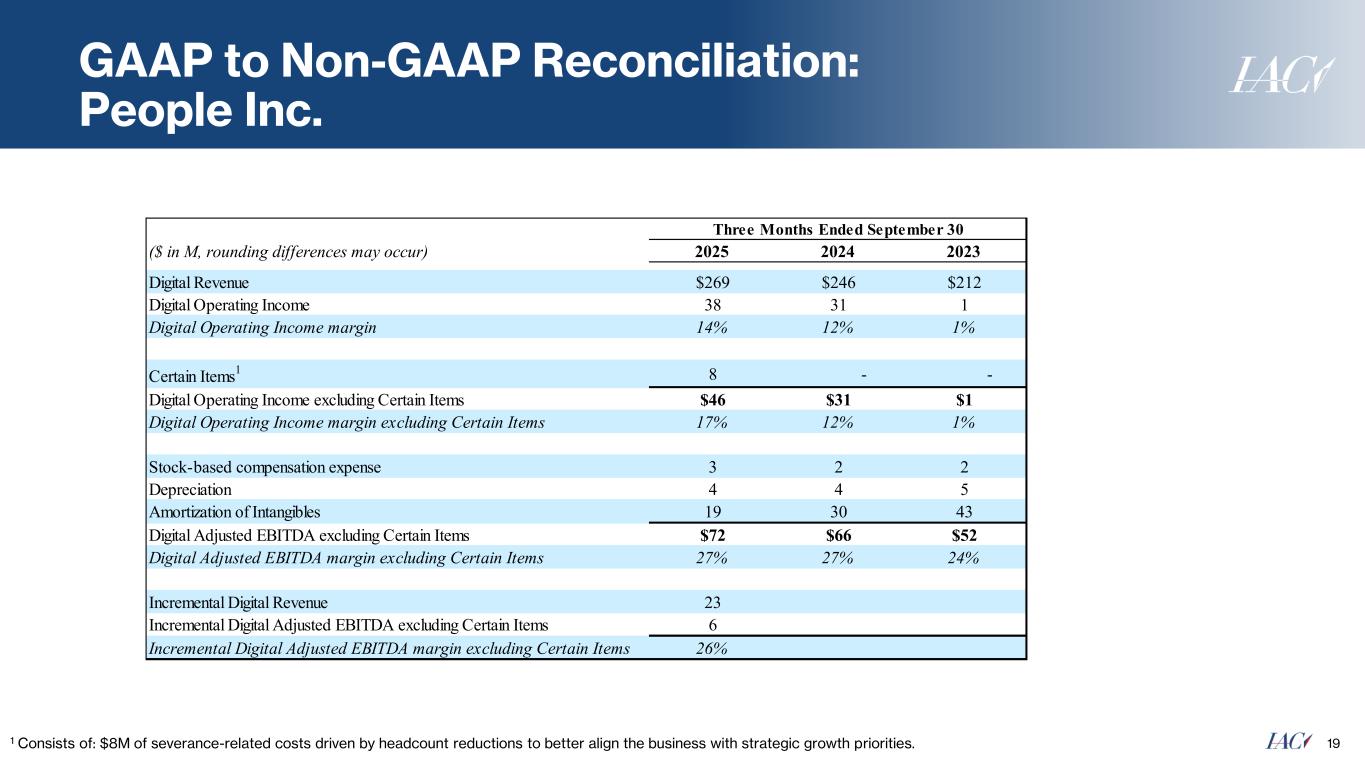
GAAP to Non-GAAP Reconciliation: People Inc. 191 Consists of: $8M of severance-related costs driven by headcount reductions to better align the business with strategic growth priorities. Three Months Ended September 30 ($ in M, rounding differences may occur) 2025 2024 2023 Digital Revenue $269 $246 $212 Digital Operating Income 38 31 1 Digital Operating Income margin 14% 12% 1% Certain Items 1 8 - - Digital Operating Income excluding Certain Items $46 $31 $1 Digital Operating Income margin excluding Certain Items 17% 12% 1% Stock-based compensation expense 3 2 2 Depreciation 4 4 5 Amortization of Intangibles 19 30 43 Digital Adjusted EBITDA excluding Certain Items $72 $66 $52 Digital Adjusted EBITDA margin excluding Certain Items 27% 27% 24% Incremental Digital Revenue 23 Incremental Digital Adjusted EBITDA excluding Certain Items 6 Incremental Digital Adjusted EBITDA margin excluding Certain Items 26%
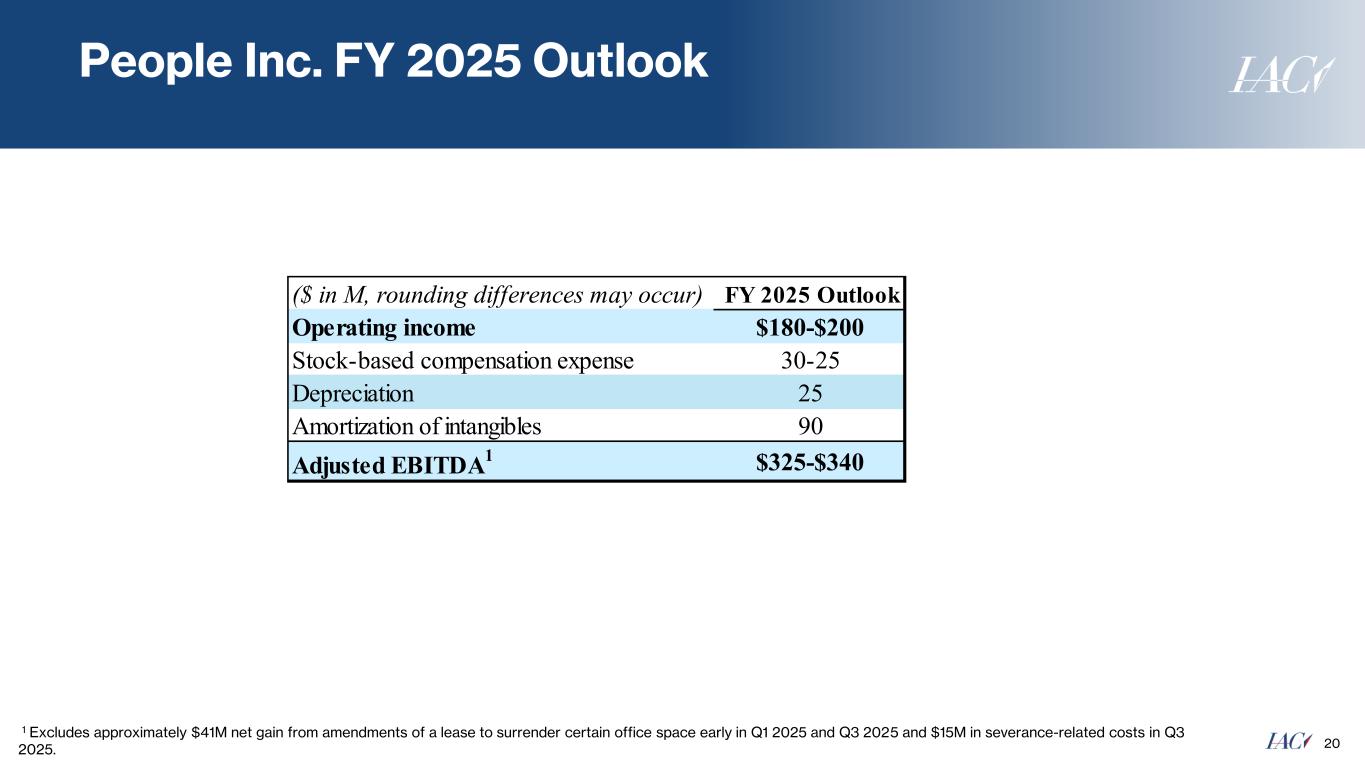
People Inc. FY 2025 Outlook 20 1 Excludes approximately $41M net gain from amendments of a lease to surrender certain office space early in Q1 2025 and Q3 2025 and $15M in severance-related costs in Q3 2025. ($ in M, rounding differences may occur) FY 2025 Outlook Operating income $180-$200 Stock-based compensation expense 30-25 Depreciation 25 Amortization of intangibles 90 Adjusted EBITDA 1 $325-$340
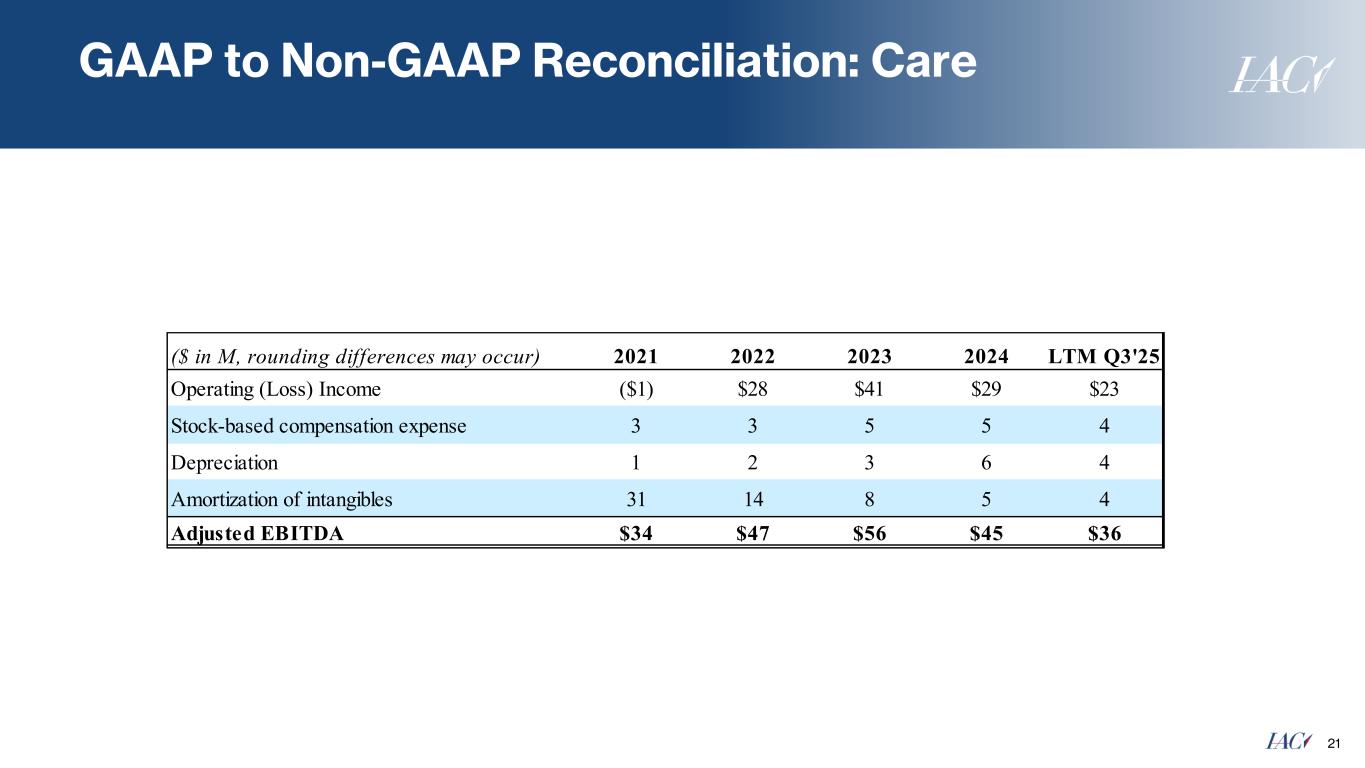
GAAP to Non-GAAP Reconciliation: Care 21 ($ in M, rounding differences may occur) 2021 2022 2023 2024 LTM Q3'25 Operating (Loss) Income ($1) $28 $41 $29 $23 Stock-based compensation expense 3 3 5 5 4 Depreciation 1 2 3 6 4 Amortization of intangibles 31 14 8 5 4 Adjusted EBITDA $34 $47 $56 $45 $36