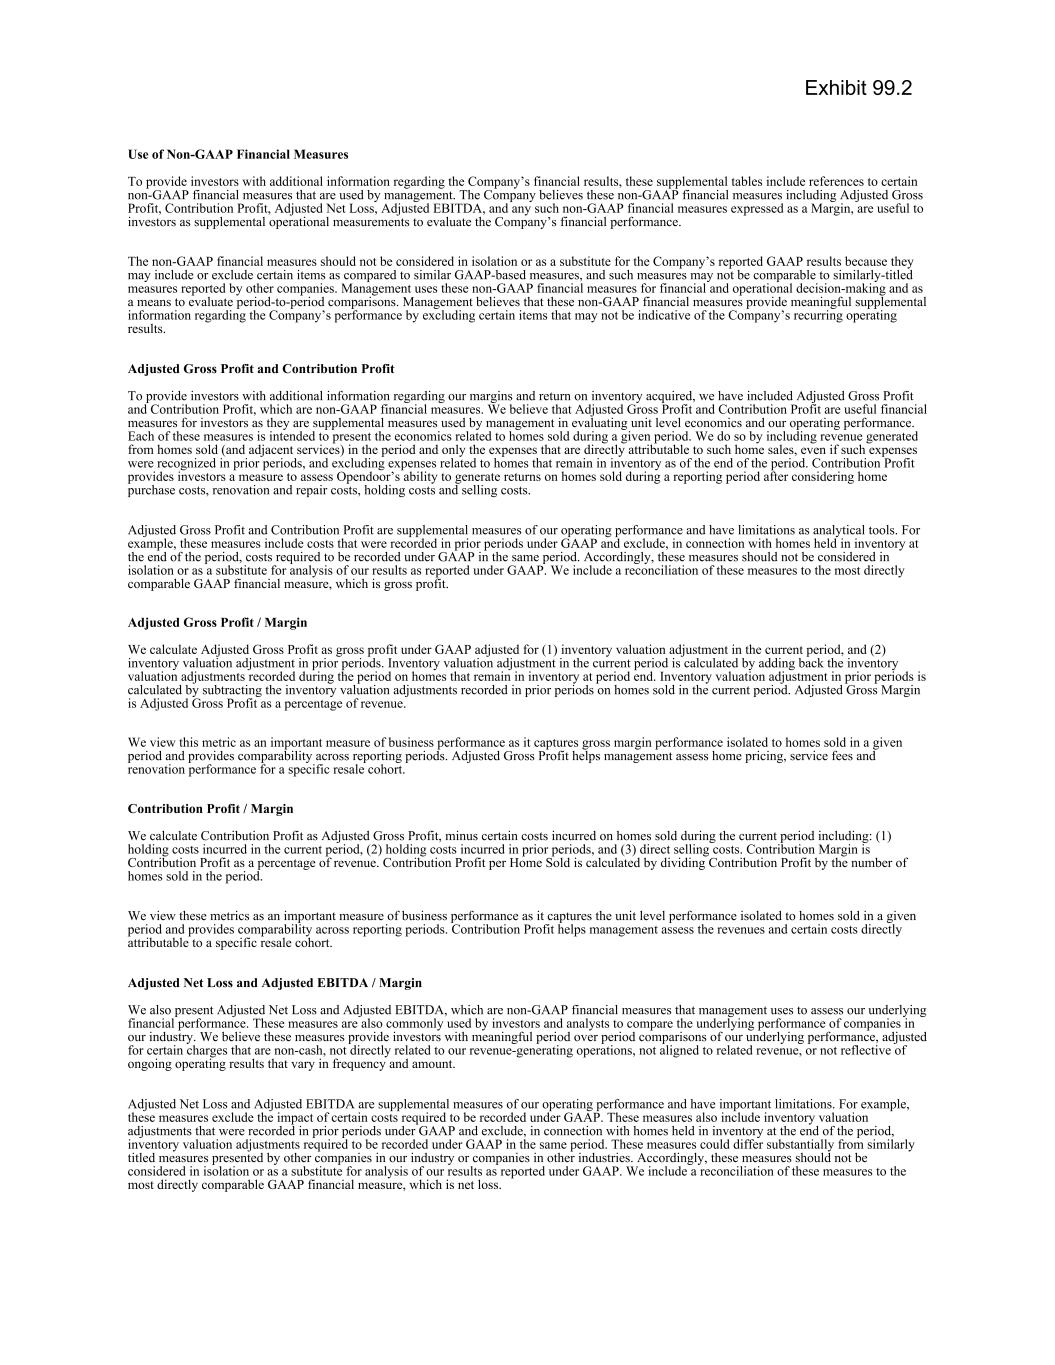
Use of Non-GAAP Financial Measures To provide investors with additional information regarding the Company’s financial results, these supplemental tables include references to certain non-GAAP financial measures that are used by management. The Company believes these non-GAAP financial measures including Adjusted Gross Profit, Contribution Profit, Adjusted Net Loss, Adjusted EBITDA, and any such non-GAAP financial measures expressed as a Margin, are useful to investors as supplemental operational measurements to evaluate the Company’s financial performance. The non-GAAP financial measures should not be considered in isolation or as a substitute for the Company’s reported GAAP results because they may include or exclude certain items as compared to similar GAAP-based measures, and such measures may not be comparable to similarly-titled measures reported by other companies. Management uses these non-GAAP financial measures for financial and operational decision-making and as a means to evaluate period-to-period comparisons. Management believes that these non-GAAP financial measures provide meaningful supplemental information regarding the Company’s performance by excluding certain items that may not be indicative of the Company’s recurring operating results. Adjusted Gross Profit and Contribution Profit To provide investors with additional information regarding our margins and return on inventory acquired, we have included Adjusted Gross Profit and Contribution Profit, which are non-GAAP financial measures. We believe that Adjusted Gross Profit and Contribution Profit are useful financial measures for investors as they are supplemental measures used by management in evaluating unit level economics and our operating performance. Each of these measures is intended to present the economics related to homes sold during a given period. We do so by including revenue generated from homes sold (and adjacent services) in the period and only the expenses that are directly attributable to such home sales, even if such expenses were recognized in prior periods, and excluding expenses related to homes that remain in inventory as of the end of the period. Contribution Profit provides investors a measure to assess Opendoor’s ability to generate returns on homes sold during a reporting period after considering home purchase costs, renovation and repair costs, holding costs and selling costs. Adjusted Gross Profit and Contribution Profit are supplemental measures of our operating performance and have limitations as analytical tools. For example, these measures include costs that were recorded in prior periods under GAAP and exclude, in connection with homes held in inventory at the end of the period, costs required to be recorded under GAAP in the same period. Accordingly, these measures should not be considered in isolation or as a substitute for analysis of our results as reported under GAAP. We include a reconciliation of these measures to the most directly comparable GAAP financial measure, which is gross profit. Adjusted Gross Profit / Margin We calculate Adjusted Gross Profit as gross profit under GAAP adjusted for (1) inventory valuation adjustment in the current period, and (2) inventory valuation adjustment in prior periods. Inventory valuation adjustment in the current period is calculated by adding back the inventory valuation adjustments recorded during the period on homes that remain in inventory at period end. Inventory valuation adjustment in prior periods is calculated by subtracting the inventory valuation adjustments recorded in prior periods on homes sold in the current period. Adjusted Gross Margin is Adjusted Gross Profit as a percentage of revenue. We view this metric as an important measure of business performance as it captures gross margin performance isolated to homes sold in a given period and provides comparability across reporting periods. Adjusted Gross Profit helps management assess home pricing, service fees and renovation performance for a specific resale cohort. Contribution Profit / Margin We calculate Contribution Profit as Adjusted Gross Profit, minus certain costs incurred on homes sold during the current period including: (1) holding costs incurred in the current period, (2) holding costs incurred in prior periods, and (3) direct selling costs. Contribution Margin is Contribution Profit as a percentage of revenue. Contribution Profit per Home Sold is calculated by dividing Contribution Profit by the number of homes sold in the period. We view these metrics as an important measure of business performance as it captures the unit level performance isolated to homes sold in a given period and provides comparability across reporting periods. Contribution Profit helps management assess the revenues and certain costs directly attributable to a specific resale cohort. Adjusted Net Loss and Adjusted EBITDA / Margin We also present Adjusted Net Loss and Adjusted EBITDA, which are non-GAAP financial measures that management uses to assess our underlying financial performance. These measures are also commonly used by investors and analysts to compare the underlying performance of companies in our industry. We believe these measures provide investors with meaningful period over period comparisons of our underlying performance, adjusted for certain charges that are non-cash, not directly related to our revenue-generating operations, not aligned to related revenue, or not reflective of ongoing operating results that vary in frequency and amount. Adjusted Net Loss and Adjusted EBITDA are supplemental measures of our operating performance and have important limitations. For example, these measures exclude the impact of certain costs required to be recorded under GAAP. These measures also include inventory valuation adjustments that were recorded in prior periods under GAAP and exclude, in connection with homes held in inventory at the end of the period, inventory valuation adjustments required to be recorded under GAAP in the same period. These measures could differ substantially from similarly titled measures presented by other companies in our industry or companies in other industries. Accordingly, these measures should not be considered in isolation or as a substitute for analysis of our results as reported under GAAP. We include a reconciliation of these measures to the most directly comparable GAAP financial measure, which is net loss. .2
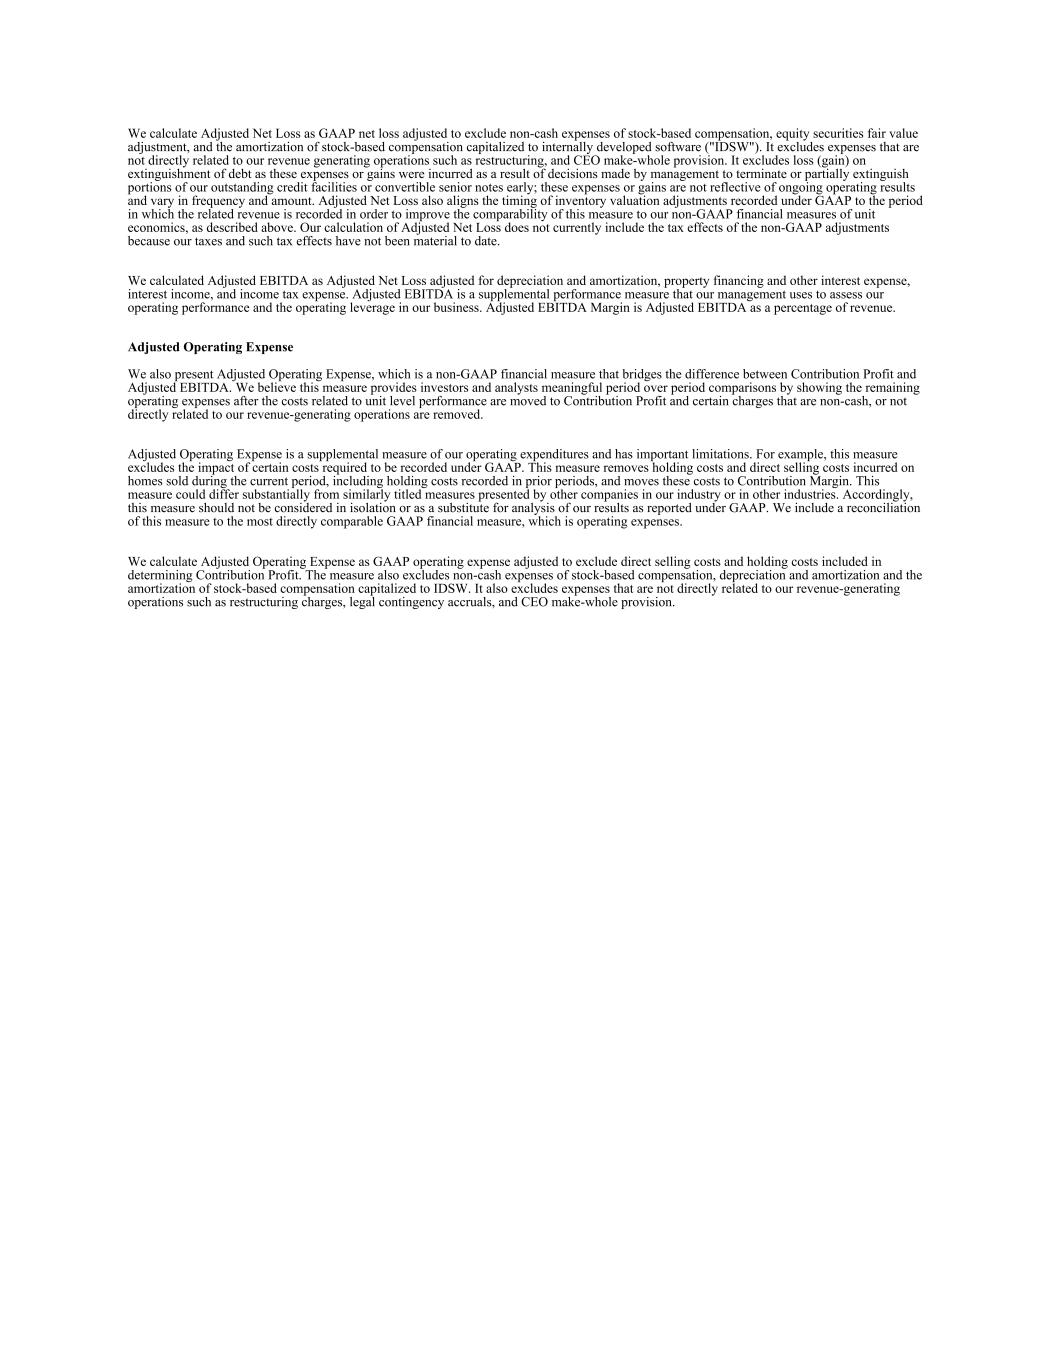
We calculate Adjusted Net Loss as GAAP net loss adjusted to exclude non-cash expenses of stock-based compensation, equity securities fair value adjustment, and the amortization of stock-based compensation capitalized to internally developed software ("IDSW"). It excludes expenses that are not directly related to our revenue generating operations such as restructuring, and CEO make-whole provision. It excludes loss (gain) on extinguishment of debt as these expenses or gains were incurred as a result of decisions made by management to terminate or partially extinguish portions of our outstanding credit facilities or convertible senior notes early; these expenses or gains are not reflective of ongoing operating results and vary in frequency and amount. Adjusted Net Loss also aligns the timing of inventory valuation adjustments recorded under GAAP to the period in which the related revenue is recorded in order to improve the comparability of this measure to our non-GAAP financial measures of unit economics, as described above. Our calculation of Adjusted Net Loss does not currently include the tax effects of the non-GAAP adjustments because our taxes and such tax effects have not been material to date. We calculated Adjusted EBITDA as Adjusted Net Loss adjusted for depreciation and amortization, property financing and other interest expense, interest income, and income tax expense. Adjusted EBITDA is a supplemental performance measure that our management uses to assess our operating performance and the operating leverage in our business. Adjusted EBITDA Margin is Adjusted EBITDA as a percentage of revenue. Adjusted Operating Expense We also present Adjusted Operating Expense, which is a non-GAAP financial measure that bridges the difference between Contribution Profit and Adjusted EBITDA. We believe this measure provides investors and analysts meaningful period over period comparisons by showing the remaining operating expenses after the costs related to unit level performance are moved to Contribution Profit and certain charges that are non-cash, or not directly related to our revenue-generating operations are removed. Adjusted Operating Expense is a supplemental measure of our operating expenditures and has important limitations. For example, this measure excludes the impact of certain costs required to be recorded under GAAP. This measure removes holding costs and direct selling costs incurred on homes sold during the current period, including holding costs recorded in prior periods, and moves these costs to Contribution Margin. This measure could differ substantially from similarly titled measures presented by other companies in our industry or in other industries. Accordingly, this measure should not be considered in isolation or as a substitute for analysis of our results as reported under GAAP. We include a reconciliation of this measure to the most directly comparable GAAP financial measure, which is operating expenses. We calculate Adjusted Operating Expense as GAAP operating expense adjusted to exclude direct selling costs and holding costs included in determining Contribution Profit. The measure also excludes non-cash expenses of stock-based compensation, depreciation and amortization and the amortization of stock-based compensation capitalized to IDSW. It also excludes expenses that are not directly related to our revenue-generating operations such as restructuring charges, legal contingency accruals, and CEO make-whole provision.
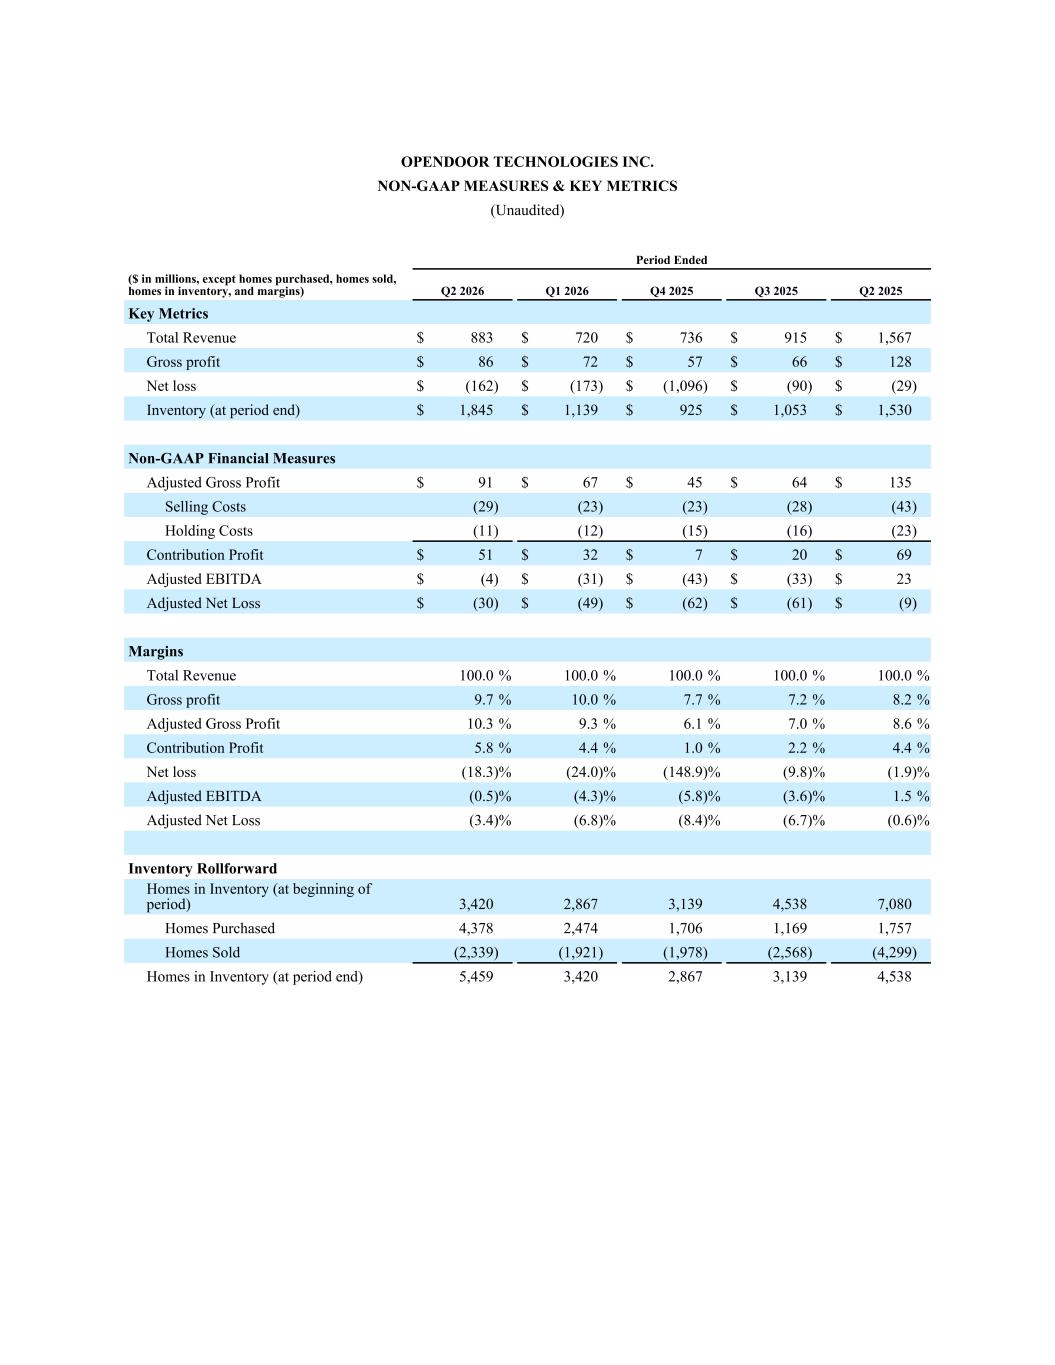
OPENDOOR TECHNOLOGIES INC. NON-GAAP MEASURES & KEY METRICS (Unaudited) Period Ended ($ in millions, except homes purchased, homes sold, homes in inventory, and margins) Q2 2026 Q1 2026 Q4 2025 Q3 2025 Q2 2025 Key Metrics Total Revenue $ 883 $ 720 $ 736 $ 915 $ 1,567 Gross profit $ 86 $ 72 $ 57 $ 66 $ 128 Net loss $ (162) $ (173) $ (1,096) $ (90) $ (29) Inventory (at period end) $ 1,845 $ 1,139 $ 925 $ 1,053 $ 1,530 Non-GAAP Financial Measures Adjusted Gross Profit $ 91 $ 67 $ 45 $ 64 $ 135 Selling Costs (29) (23) (23) (28) (43) Holding Costs (11) (12) (15) (16) (23) Contribution Profit $ 51 $ 32 $ 7 $ 20 $ 69 Adjusted EBITDA $ (4) $ (31) $ (43) $ (33) $ 23 Adjusted Net Loss $ (30) $ (49) $ (62) $ (61) $ (9) Margins Total Revenue 100.0 % 100.0 % 100.0 % 100.0 % 100.0 % Gross profit 9.7 % 10.0 % 7.7 % 7.2 % 8.2 % Adjusted Gross Profit 10.3 % 9.3 % 6.1 % 7.0 % 8.6 % Contribution Profit 5.8 % 4.4 % 1.0 % 2.2 % 4.4 % Net loss (18.3) % (24.0) % (148.9) % (9.8) % (1.9) % Adjusted EBITDA (0.5) % (4.3) % (5.8) % (3.6) % 1.5 % Adjusted Net Loss (3.4) % (6.8) % (8.4) % (6.7) % (0.6) % Inventory Rollforward Homes in Inventory (at beginning of period) 3,420 2,867 3,139 4,538 7,080 Homes Purchased 4,378 2,474 1,706 1,169 1,757 Homes Sold (2,339) (1,921) (1,978) (2,568) (4,299) Homes in Inventory (at period end) 5,459 3,420 2,867 3,139 4,538
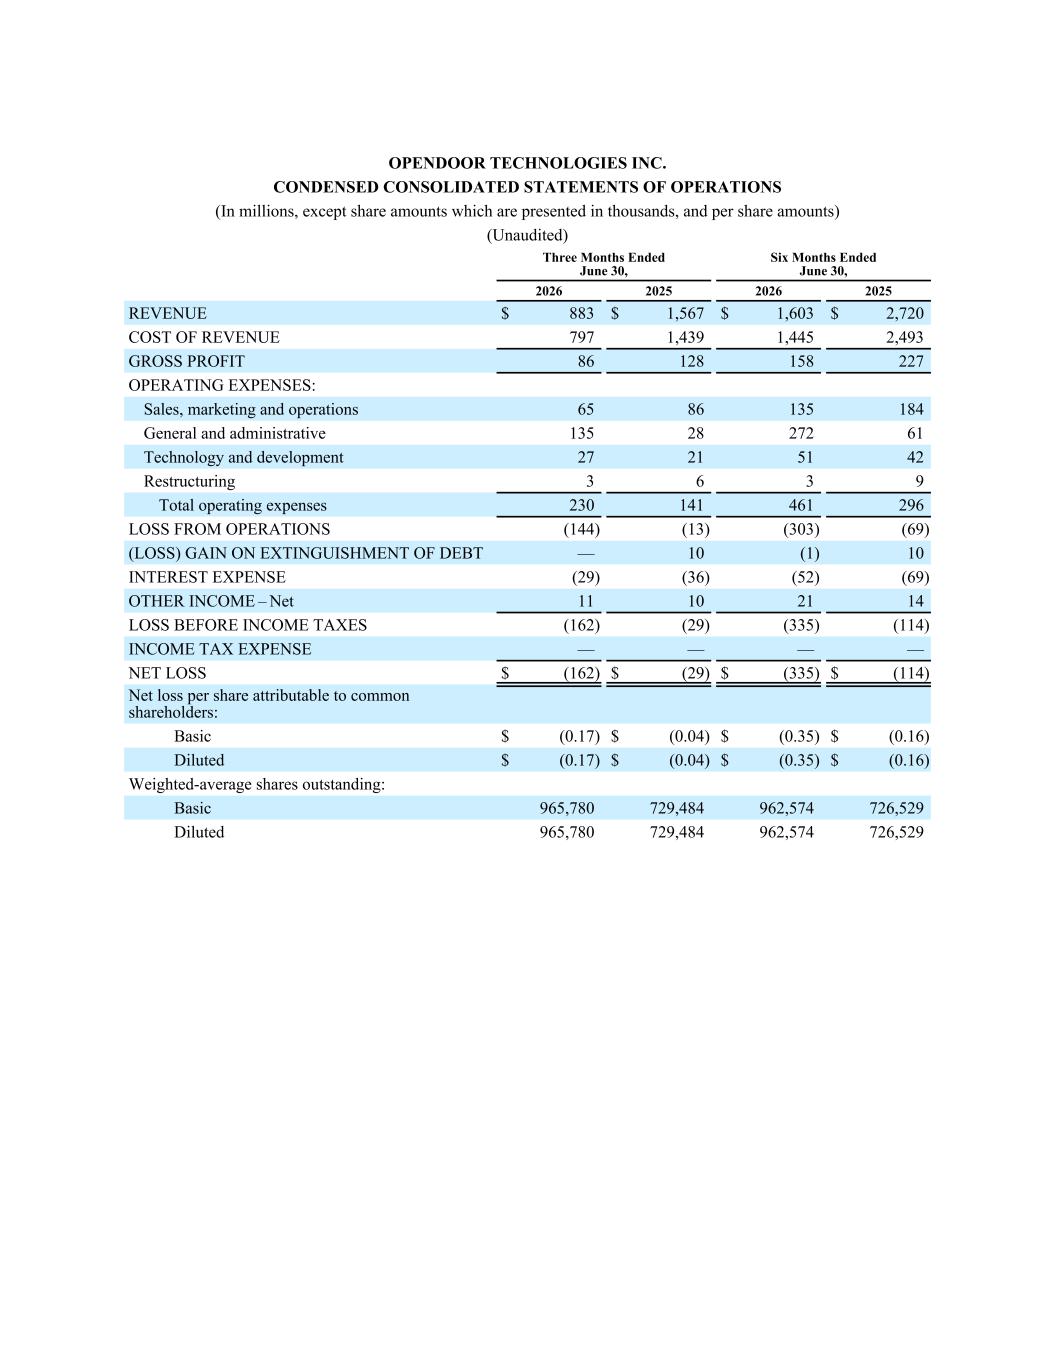
OPENDOOR TECHNOLOGIES INC. CONDENSED CONSOLIDATED STATEMENTS OF OPERATIONS (In millions, except share amounts which are presented in thousands, and per share amounts) (Unaudited) Three Months Ended June 30, Six Months Ended June 30, 2026 2025 2026 2025 REVENUE $ 883 $ 1,567 $ 1,603 $ 2,720 COST OF REVENUE 797 1,439 1,445 2,493 GROSS PROFIT 86 128 158 227 OPERATING EXPENSES: Sales, marketing and operations 65 86 135 184 General and administrative 135 28 272 61 Technology and development 27 21 51 42 Restructuring 3 6 3 9 Total operating expenses 230 141 461 296 LOSS FROM OPERATIONS (144) (13) (303) (69) (LOSS) GAIN ON EXTINGUISHMENT OF DEBT — 10 (1) 10 INTEREST EXPENSE (29) (36) (52) (69) OTHER INCOME – Net 11 10 21 14 LOSS BEFORE INCOME TAXES (162) (29) (335) (114) INCOME TAX EXPENSE — — — — NET LOSS $ (162) $ (29) $ (335) $ (114) Net loss per share attributable to common shareholders: Basic $ (0.17) $ (0.04) $ (0.35) $ (0.16) Diluted $ (0.17) $ (0.04) $ (0.35) $ (0.16) Weighted-average shares outstanding: Basic 965,780 729,484 962,574 726,529 Diluted 965,780 729,484 962,574 726,529
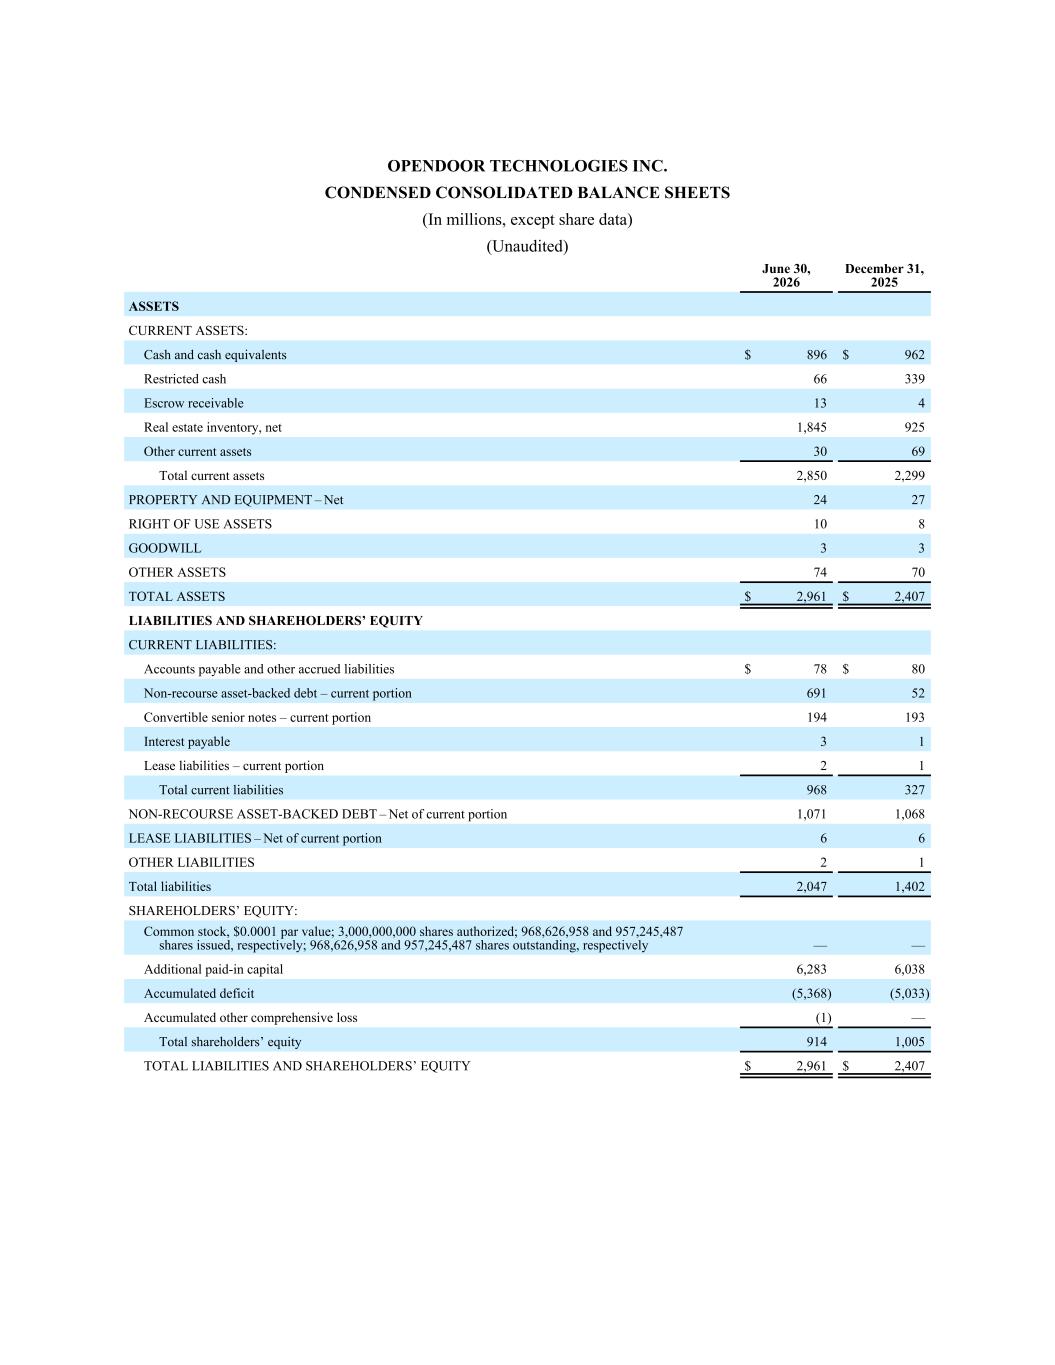
OPENDOOR TECHNOLOGIES INC. CONDENSED CONSOLIDATED BALANCE SHEETS (In millions, except share data) (Unaudited) June 30, 2026 December 31, 2025 ASSETS CURRENT ASSETS: Cash and cash equivalents $ 896 $ 962 Restricted cash 66 339 Escrow receivable 13 4 Real estate inventory, net 1,845 925 Other current assets 30 69 Total current assets 2,850 2,299 PROPERTY AND EQUIPMENT – Net 24 27 RIGHT OF USE ASSETS 10 8 GOODWILL 3 3 OTHER ASSETS 74 70 TOTAL ASSETS $ 2,961 $ 2,407 LIABILITIES AND SHAREHOLDERS’ EQUITY CURRENT LIABILITIES: Accounts payable and other accrued liabilities $ 78 $ 80 Non-recourse asset-backed debt – current portion 691 52 Convertible senior notes – current portion 194 193 Interest payable 3 1 Lease liabilities – current portion 2 1 Total current liabilities 968 327 NON-RECOURSE ASSET-BACKED DEBT – Net of current portion 1,071 1,068 LEASE LIABILITIES – Net of current portion 6 6 OTHER LIABILITIES 2 1 Total liabilities 2,047 1,402 SHAREHOLDERS’ EQUITY: Common stock, $0.0001 par value; 3,000,000,000 shares authorized; 968,626,958 and 957,245,487 shares issued, respectively; 968,626,958 and 957,245,487 shares outstanding, respectively — — Additional paid-in capital 6,283 6,038 Accumulated deficit (5,368) (5,033) Accumulated other comprehensive loss (1) — Total shareholders’ equity 914 1,005 TOTAL LIABILITIES AND SHAREHOLDERS’ EQUITY $ 2,961 $ 2,407
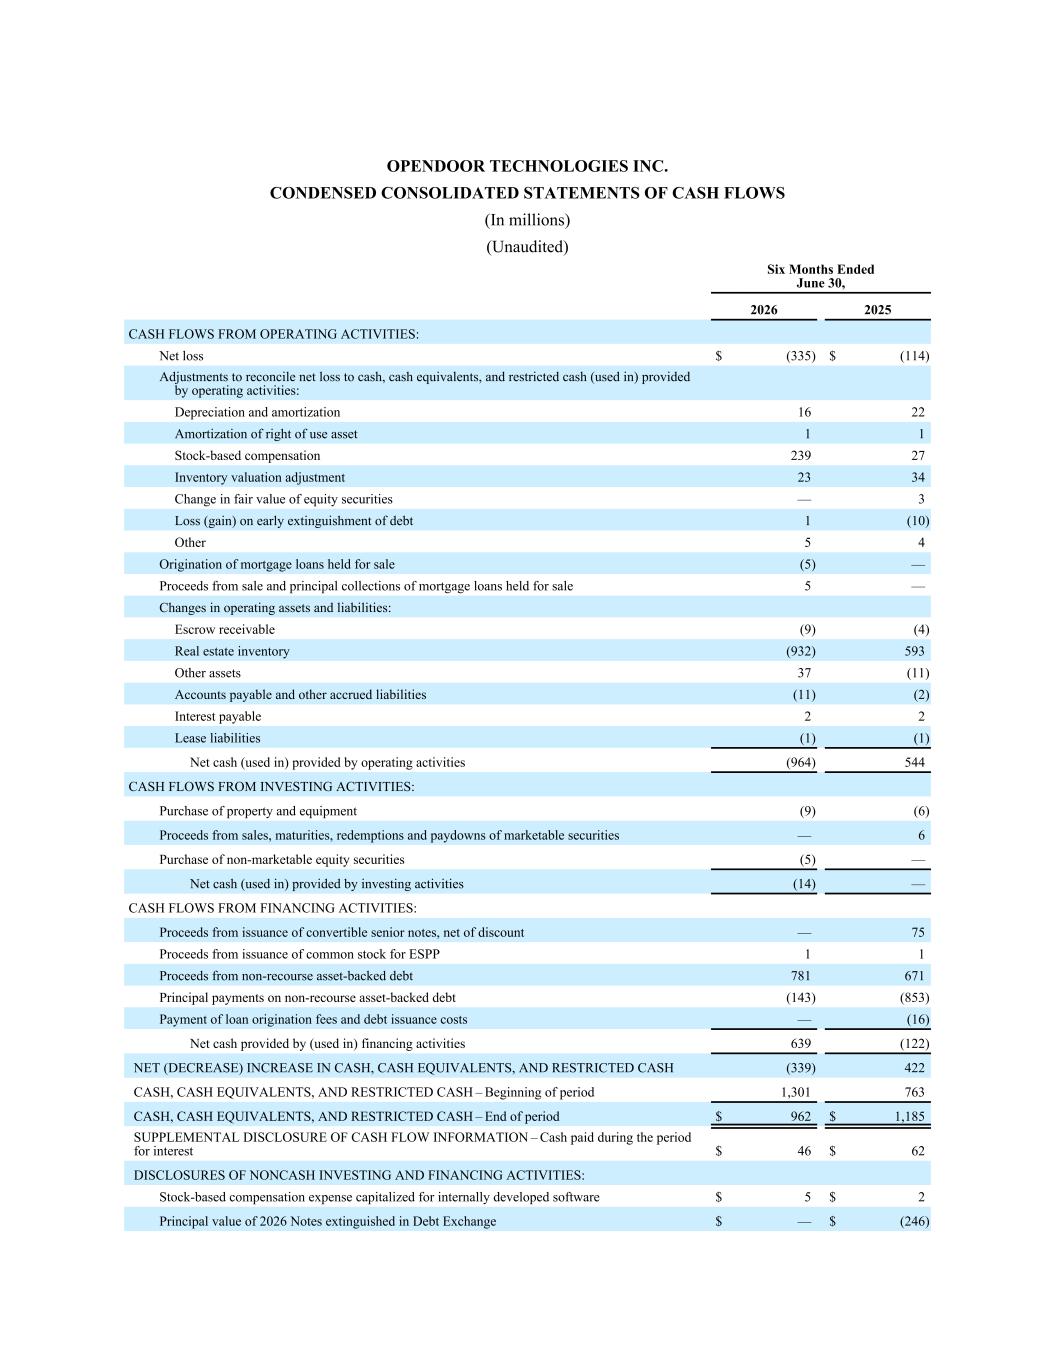
OPENDOOR TECHNOLOGIES INC. CONDENSED CONSOLIDATED STATEMENTS OF CASH FLOWS (In millions) (Unaudited) Six Months Ended June 30, 2026 2025 CASH FLOWS FROM OPERATING ACTIVITIES: Net loss $ (335) $ (114) Adjustments to reconcile net loss to cash, cash equivalents, and restricted cash (used in) provided by operating activities: Depreciation and amortization 16 22 Amortization of right of use asset 1 1 Stock-based compensation 239 27 Inventory valuation adjustment 23 34 Change in fair value of equity securities — 3 Loss (gain) on early extinguishment of debt 1 (10) Other 5 4 Origination of mortgage loans held for sale (5) — Proceeds from sale and principal collections of mortgage loans held for sale 5 — Changes in operating assets and liabilities: Escrow receivable (9) (4) Real estate inventory (932) 593 Other assets 37 (11) Accounts payable and other accrued liabilities (11) (2) Interest payable 2 2 Lease liabilities (1) (1) Net cash (used in) provided by operating activities (964) 544 CASH FLOWS FROM INVESTING ACTIVITIES: Purchase of property and equipment (9) (6) Proceeds from sales, maturities, redemptions and paydowns of marketable securities — 6 Purchase of non-marketable equity securities (5) — Net cash (used in) provided by investing activities (14) — CASH FLOWS FROM FINANCING ACTIVITIES: Proceeds from issuance of convertible senior notes, net of discount — 75 Proceeds from issuance of common stock for ESPP 1 1 Proceeds from non-recourse asset-backed debt 781 671 Principal payments on non-recourse asset-backed debt (143) (853) Payment of loan origination fees and debt issuance costs — (16) Net cash provided by (used in) financing activities 639 (122) NET (DECREASE) INCREASE IN CASH, CASH EQUIVALENTS, AND RESTRICTED CASH (339) 422 CASH, CASH EQUIVALENTS, AND RESTRICTED CASH – Beginning of period 1,301 763 CASH, CASH EQUIVALENTS, AND RESTRICTED CASH – End of period $ 962 $ 1,185 SUPPLEMENTAL DISCLOSURE OF CASH FLOW INFORMATION – Cash paid during the period for interest $ 46 $ 62 DISCLOSURES OF NONCASH INVESTING AND FINANCING ACTIVITIES: Stock-based compensation expense capitalized for internally developed software $ 5 $ 2 Principal value of 2026 Notes extinguished in Debt Exchange $ — $ (246)
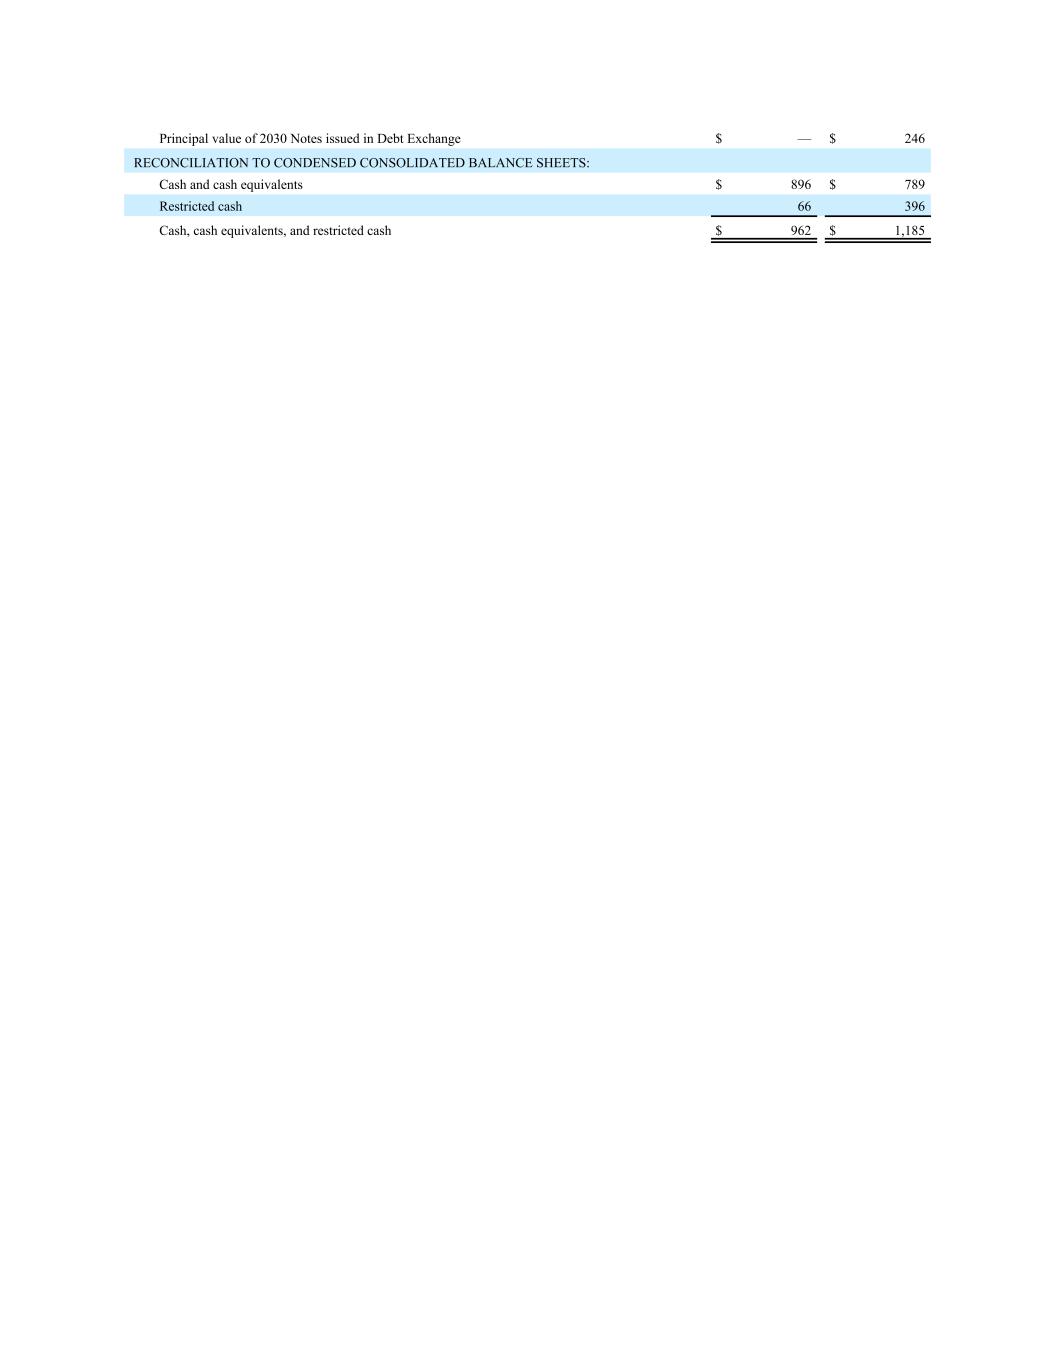
Principal value of 2030 Notes issued in Debt Exchange $ — $ 246 RECONCILIATION TO CONDENSED CONSOLIDATED BALANCE SHEETS: Cash and cash equivalents $ 896 $ 789 Restricted cash 66 396 Cash, cash equivalents, and restricted cash $ 962 $ 1,185
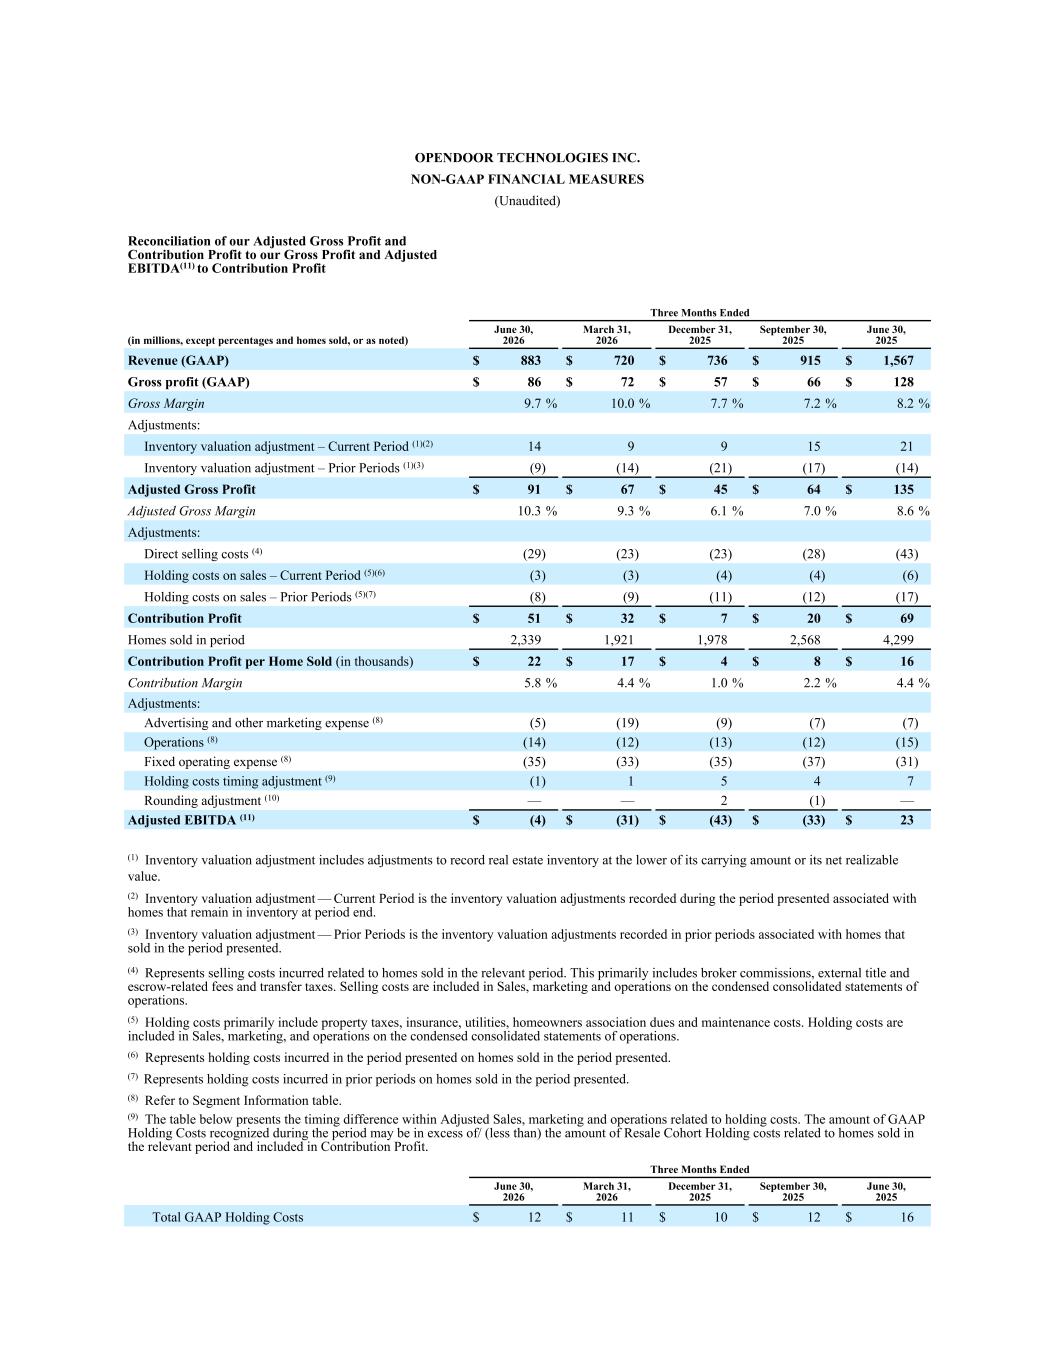
OPENDOOR TECHNOLOGIES INC. NON-GAAP FINANCIAL MEASURES (Unaudited) Reconciliation of our Adjusted Gross Profit and Contribution Profit to our Gross Profit and Adjusted EBITDA(11) to Contribution Profit Three Months Ended (in millions, except percentages and homes sold, or as noted) June 30, 2026 March 31, 2026 December 31, 2025 September 30, 2025 June 30, 2025 Revenue (GAAP) $ 883 $ 720 $ 736 $ 915 $ 1,567 Gross profit (GAAP) $ 86 $ 72 $ 57 $ 66 $ 128 Gross Margin 9.7 % 10.0 % 7.7 % 7.2 % 8.2 % Adjustments: Inventory valuation adjustment – Current Period (1)(2) 14 9 9 15 21 Inventory valuation adjustment – Prior Periods (1)(3) (9) (14) (21) (17) (14) Adjusted Gross Profit $ 91 $ 67 $ 45 $ 64 $ 135 Adjusted Gross Margin 10.3 % 9.3 % 6.1 % 7.0 % 8.6 % Adjustments: Direct selling costs (4) (29) (23) (23) (28) (43) Holding costs on sales – Current Period (5)(6) (3) (3) (4) (4) (6) Holding costs on sales – Prior Periods (5)(7) (8) (9) (11) (12) (17) Contribution Profit $ 51 $ 32 $ 7 $ 20 $ 69 Homes sold in period 2,339 1,921 1,978 2,568 4,299 Contribution Profit per Home Sold (in thousands) $ 22 $ 17 $ 4 $ 8 $ 16 Contribution Margin 5.8 % 4.4 % 1.0 % 2.2 % 4.4 % Adjustments: Advertising and other marketing expense (8) (5) (19) (9) (7) (7) Operations (8) (14) (12) (13) (12) (15) Fixed operating expense (8) (35) (33) (35) (37) (31) Holding costs timing adjustment (9) (1) 1 5 4 7 Rounding adjustment (10) — — 2 (1) — Adjusted EBITDA (11) $ (4) $ (31) $ (43) $ (33) $ 23 (1) Inventory valuation adjustment includes adjustments to record real estate inventory at the lower of its carrying amount or its net realizable value. (2) Inventory valuation adjustment — Current Period is the inventory valuation adjustments recorded during the period presented associated with homes that remain in inventory at period end. (3) Inventory valuation adjustment — Prior Periods is the inventory valuation adjustments recorded in prior periods associated with homes that sold in the period presented. (4) Represents selling costs incurred related to homes sold in the relevant period. This primarily includes broker commissions, external title and escrow-related fees and transfer taxes. Selling costs are included in Sales, marketing and operations on the condensed consolidated statements of operations. (5) Holding costs primarily include property taxes, insurance, utilities, homeowners association dues and maintenance costs. Holding costs are included in Sales, marketing, and operations on the condensed consolidated statements of operations. (6) Represents holding costs incurred in the period presented on homes sold in the period presented. (7) Represents holding costs incurred in prior periods on homes sold in the period presented. (8) Refer to Segment Information table. (9) The table below presents the timing difference within Adjusted Sales, marketing and operations related to holding costs. The amount of GAAP Holding Costs recognized during the period may be in excess of/ (less than) the amount of Resale Cohort Holding costs related to homes sold in the relevant period and included in Contribution Profit. Three Months Ended June 30, 2026 March 31, 2026 December 31, 2025 September 30, 2025 June 30, 2025 Total GAAP Holding Costs $ 12 $ 11 $ 10 $ 12 $ 16
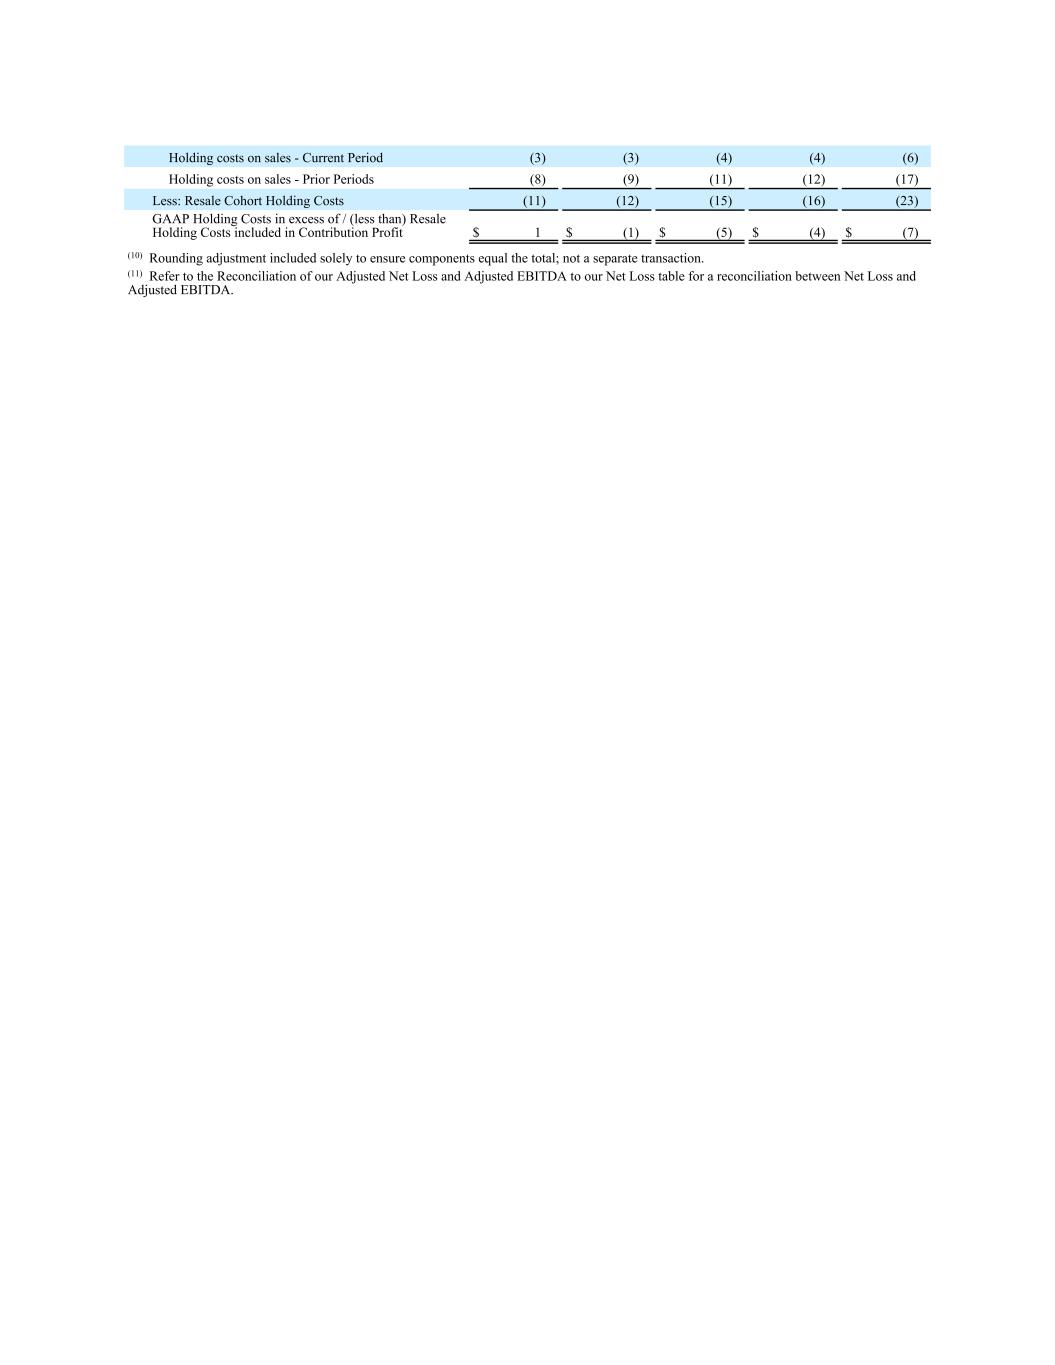
Holding costs on sales - Current Period (3) (3) (4) (4) (6) Holding costs on sales - Prior Periods (8) (9) (11) (12) (17) Less: Resale Cohort Holding Costs (11) (12) (15) (16) (23) GAAP Holding Costs in excess of / (less than) Resale Holding Costs included in Contribution Profit $ 1 $ (1) $ (5) $ (4) $ (7) (10) Rounding adjustment included solely to ensure components equal the total; not a separate transaction. (11) Refer to the Reconciliation of our Adjusted Net Loss and Adjusted EBITDA to our Net Loss table for a reconciliation between Net Loss and Adjusted EBITDA.
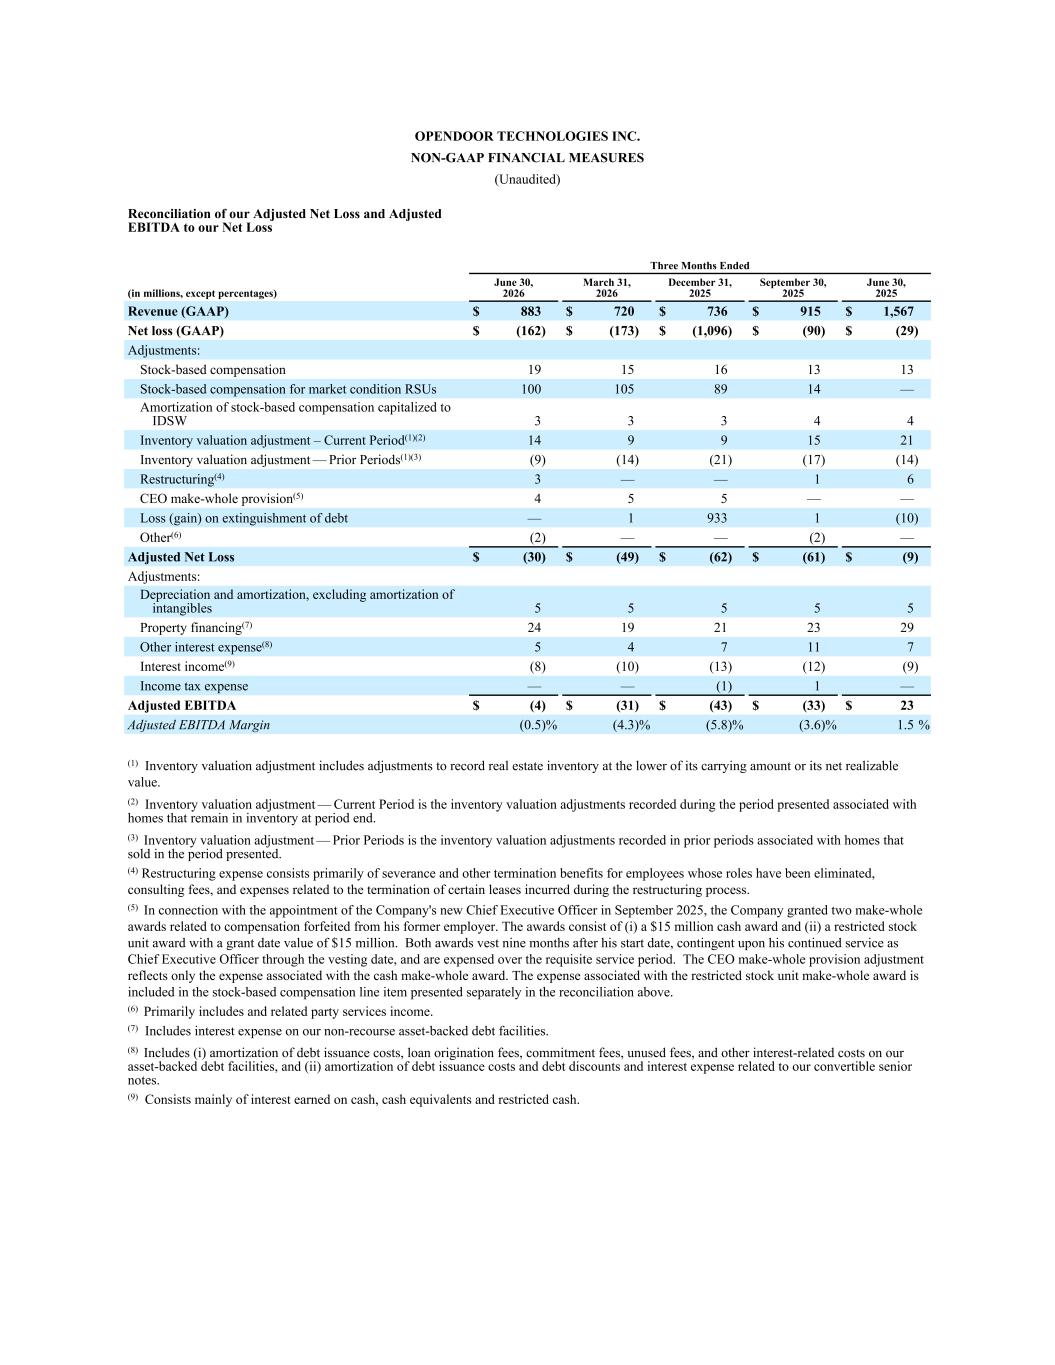
OPENDOOR TECHNOLOGIES INC. NON-GAAP FINANCIAL MEASURES (Unaudited) Reconciliation of our Adjusted Net Loss and Adjusted EBITDA to our Net Loss Three Months Ended (in millions, except percentages) June 30, 2026 March 31, 2026 December 31, 2025 September 30, 2025 June 30, 2025 Revenue (GAAP) $ 883 $ 720 $ 736 $ 915 $ 1,567 Net loss (GAAP) $ (162) $ (173) $ (1,096) $ (90) $ (29) Adjustments: Stock-based compensation 19 15 16 13 13 Stock-based compensation for market condition RSUs 100 105 89 14 — Amortization of stock-based compensation capitalized to IDSW 3 3 3 4 4 Inventory valuation adjustment – Current Period(1)(2) 14 9 9 15 21 Inventory valuation adjustment — Prior Periods(1)(3) (9) (14) (21) (17) (14) Restructuring(4) 3 — — 1 6 CEO make-whole provision(5) 4 5 5 — — Loss (gain) on extinguishment of debt — 1 933 1 (10) Other(6) (2) — — (2) — Adjusted Net Loss $ (30) $ (49) $ (62) $ (61) $ (9) Adjustments: Depreciation and amortization, excluding amortization of intangibles 5 5 5 5 5 Property financing(7) 24 19 21 23 29 Other interest expense(8) 5 4 7 11 7 Interest income(9) (8) (10) (13) (12) (9) Income tax expense — — (1) 1 — Adjusted EBITDA $ (4) $ (31) $ (43) $ (33) $ 23 Adjusted EBITDA Margin (0.5) % (4.3) % (5.8) % (3.6) % 1.5 % (1) Inventory valuation adjustment includes adjustments to record real estate inventory at the lower of its carrying amount or its net realizable value. (2) Inventory valuation adjustment — Current Period is the inventory valuation adjustments recorded during the period presented associated with homes that remain in inventory at period end. (3) Inventory valuation adjustment — Prior Periods is the inventory valuation adjustments recorded in prior periods associated with homes that sold in the period presented. (4) Restructuring expense consists primarily of severance and other termination benefits for employees whose roles have been eliminated, consulting fees, and expenses related to the termination of certain leases incurred during the restructuring process. (5) In connection with the appointment of the Company's new Chief Executive Officer in September 2025, the Company granted two make-whole awards related to compensation forfeited from his former employer. The awards consist of (i) a $15 million cash award and (ii) a restricted stock unit award with a grant date value of $15 million. Both awards vest nine months after his start date, contingent upon his continued service as Chief Executive Officer through the vesting date, and are expensed over the requisite service period. The CEO make-whole provision adjustment reflects only the expense associated with the cash make-whole award. The expense associated with the restricted stock unit make-whole award is included in the stock-based compensation line item presented separately in the reconciliation above. (6) Primarily includes and related party services income. (7) Includes interest expense on our non-recourse asset-backed debt facilities. (8) Includes (i) amortization of debt issuance costs, loan origination fees, commitment fees, unused fees, and other interest-related costs on our asset-backed debt facilities, and (ii) amortization of debt issuance costs and debt discounts and interest expense related to our convertible senior notes. (9) Consists mainly of interest earned on cash, cash equivalents and restricted cash.
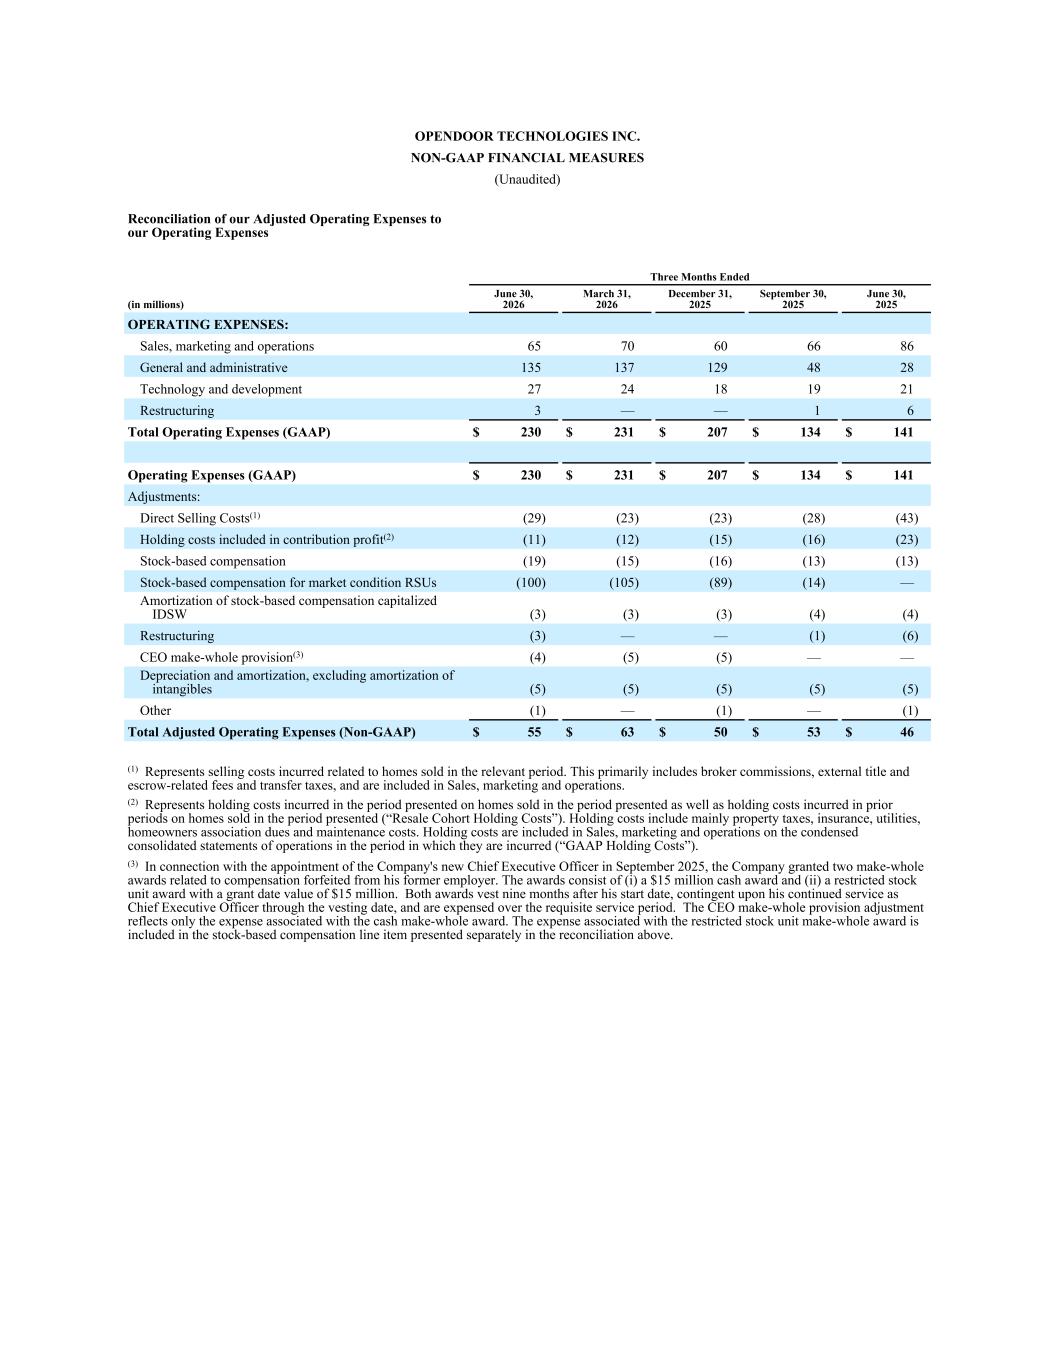
OPENDOOR TECHNOLOGIES INC. NON-GAAP FINANCIAL MEASURES (Unaudited) Reconciliation of our Adjusted Operating Expenses to our Operating Expenses Three Months Ended (in millions) June 30, 2026 March 31, 2026 December 31, 2025 September 30, 2025 June 30, 2025 OPERATING EXPENSES: Sales, marketing and operations 65 70 60 66 86 General and administrative 135 137 129 48 28 Technology and development 27 24 18 19 21 Restructuring 3 — — 1 6 Total Operating Expenses (GAAP) $ 230 $ 231 $ 207 $ 134 $ 141 Operating Expenses (GAAP) $ 230 $ 231 $ 207 $ 134 $ 141 Adjustments: Direct Selling Costs(1) (29) (23) (23) (28) (43) Holding costs included in contribution profit(2) (11) (12) (15) (16) (23) Stock-based compensation (19) (15) (16) (13) (13) Stock-based compensation for market condition RSUs (100) (105) (89) (14) — Amortization of stock-based compensation capitalized IDSW (3) (3) (3) (4) (4) Restructuring (3) — — (1) (6) CEO make-whole provision(3) (4) (5) (5) — — Depreciation and amortization, excluding amortization of intangibles (5) (5) (5) (5) (5) Other (1) — (1) — (1) Total Adjusted Operating Expenses (Non-GAAP) $ 55 $ 63 $ 50 $ 53 $ 46 (1) Represents selling costs incurred related to homes sold in the relevant period. This primarily includes broker commissions, external title and escrow-related fees and transfer taxes, and are included in Sales, marketing and operations. (2) Represents holding costs incurred in the period presented on homes sold in the period presented as well as holding costs incurred in prior periods on homes sold in the period presented (“Resale Cohort Holding Costs”). Holding costs include mainly property taxes, insurance, utilities, homeowners association dues and maintenance costs. Holding costs are included in Sales, marketing and operations on the condensed consolidated statements of operations in the period in which they are incurred (“GAAP Holding Costs”). (3) In connection with the appointment of the Company's new Chief Executive Officer in September 2025, the Company granted two make-whole awards related to compensation forfeited from his former employer. The awards consist of (i) a $15 million cash award and (ii) a restricted stock unit award with a grant date value of $15 million. Both awards vest nine months after his start date, contingent upon his continued service as Chief Executive Officer through the vesting date, and are expensed over the requisite service period. The CEO make-whole provision adjustment reflects only the expense associated with the cash make-whole award. The expense associated with the restricted stock unit make-whole award is included in the stock-based compensation line item presented separately in the reconciliation above.
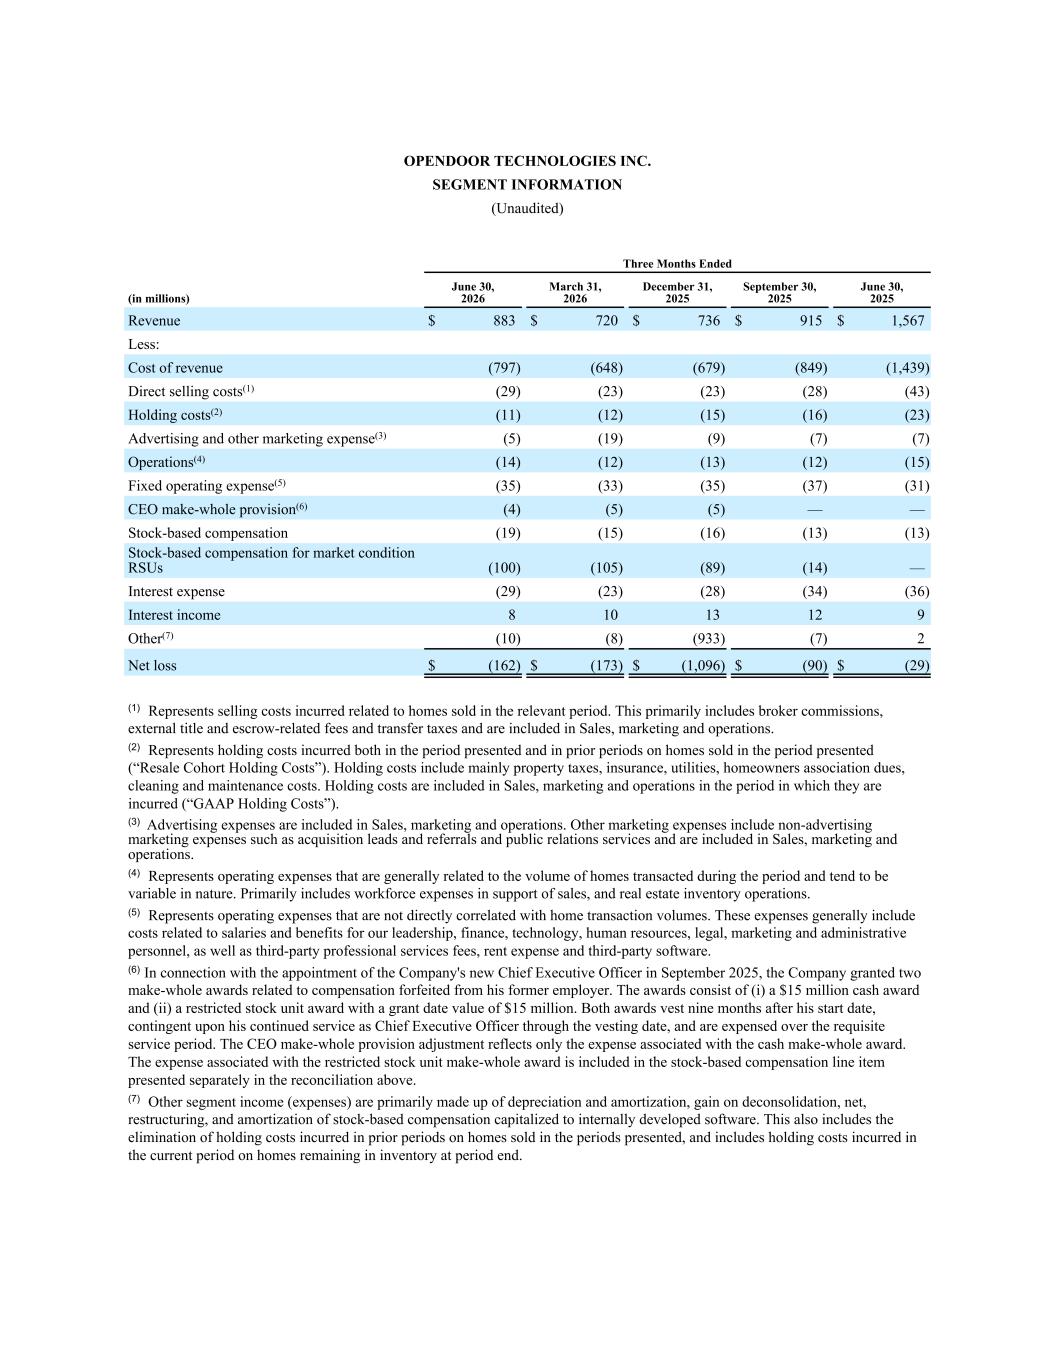
OPENDOOR TECHNOLOGIES INC. SEGMENT INFORMATION (Unaudited) Three Months Ended (in millions) June 30, 2026 March 31, 2026 December 31, 2025 September 30, 2025 June 30, 2025 Revenue $ 883 $ 720 $ 736 $ 915 $ 1,567 Less: Cost of revenue (797) (648) (679) (849) (1,439) Direct selling costs(1) (29) (23) (23) (28) (43) Holding costs(2) (11) (12) (15) (16) (23) Advertising and other marketing expense(3) (5) (19) (9) (7) (7) Operations(4) (14) (12) (13) (12) (15) Fixed operating expense(5) (35) (33) (35) (37) (31) CEO make-whole provision(6) (4) (5) (5) — — Stock-based compensation (19) (15) (16) (13) (13) Stock-based compensation for market condition RSUs (100) (105) (89) (14) — Interest expense (29) (23) (28) (34) (36) Interest income 8 10 13 12 9 Other(7) (10) (8) (933) (7) 2 Net loss $ (162) $ (173) $ (1,096) $ (90) $ (29) (1) Represents selling costs incurred related to homes sold in the relevant period. This primarily includes broker commissions, external title and escrow-related fees and transfer taxes and are included in Sales, marketing and operations. (2) Represents holding costs incurred both in the period presented and in prior periods on homes sold in the period presented (“Resale Cohort Holding Costs”). Holding costs include mainly property taxes, insurance, utilities, homeowners association dues, cleaning and maintenance costs. Holding costs are included in Sales, marketing and operations in the period in which they are incurred (“GAAP Holding Costs”). (3) Advertising expenses are included in Sales, marketing and operations. Other marketing expenses include non-advertising marketing expenses such as acquisition leads and referrals and public relations services and are included in Sales, marketing and operations. (4) Represents operating expenses that are generally related to the volume of homes transacted during the period and tend to be variable in nature. Primarily includes workforce expenses in support of sales, and real estate inventory operations. (5) Represents operating expenses that are not directly correlated with home transaction volumes. These expenses generally include costs related to salaries and benefits for our leadership, finance, technology, human resources, legal, marketing and administrative personnel, as well as third-party professional services fees, rent expense and third-party software. (6) In connection with the appointment of the Company's new Chief Executive Officer in September 2025, the Company granted two make-whole awards related to compensation forfeited from his former employer. The awards consist of (i) a $15 million cash award and (ii) a restricted stock unit award with a grant date value of $15 million. Both awards vest nine months after his start date, contingent upon his continued service as Chief Executive Officer through the vesting date, and are expensed over the requisite service period. The CEO make-whole provision adjustment reflects only the expense associated with the cash make-whole award. The expense associated with the restricted stock unit make-whole award is included in the stock-based compensation line item presented separately in the reconciliation above. (7) Other segment income (expenses) are primarily made up of depreciation and amortization, gain on deconsolidation, net, restructuring, and amortization of stock-based compensation capitalized to internally developed software. This also includes the elimination of holding costs incurred in prior periods on homes sold in the periods presented, and includes holding costs incurred in the current period on homes remaining in inventory at period end.