
Smarter Growth, Better Service
Disclaimers Forward-Looking Statements: This presentation (including oral commentary that accompanies this presentation) has been prepared by Guardian Pharmacy Services, Inc. (“Guardian,” the “Company,” “we” or “us”) and contains forward-looking statements. Forward-looking statements are all statements other than those of historical fact. Any statements about our expectations, beliefs, plans, predictions, forecasts, objectives, assumptions, or future events or performance, are forward- looking. In some cases, you can identify forward-looking statements through the use of words such as “believes,” “expects,” “may,” “will,” “should,” “would,” “seeks,” “intends,” “plans,” “projects,” “estimates,” “contemplates,” “aims,” “continues,” “anticipates” and similar expressions. Although we believe that the expectations reflected in these forward-looking statements are reasonable, these statements are not guarantees of future performance and involve risks and uncertainties. Among the factors that could cause actual results to differ materially from those suggested by forward-looking statements are: our ability to effectively execute our business strategies, implement new initiatives and improve efficiency; our ability to effectively market and sell, customer acceptance of, and competition for, our pharmaceutical and health care services in new and existing markets; our relationships with pharmaceutical wholesalers and key manufacturers, long-term health care facilities (“LTCFs”) and health plan payors; our ability to maintain and expand relationships with LTCF operators on favorable terms; the impact of a national emergency, public health crisis, global pandemic or outbreak of infectious disease on our employees and business and on our supply chain and the LTCFs we serve; continuing government and private efforts to lower pharmaceutical costs, including by limiting pharmacy reimbursements; changes in, and our ability to comply with, healthcare and other applicable laws, regulations or interpretations; further consolidation of managed care organizations and other health plan payors and changes in the terms of our agreements with these parties; our ability to retain members of our senior management team, our local pharmacy management teams and our pharmacy professionals; our exposure to, and the results of, claims, legal proceedings and governmental inquiries; our ability to maintain the security and integrity of our operating and information technology systems and infrastructure (e.g., against cyber-attacks); product liability, product recall, personal injury or other health and safety issues related to the pharmaceuticals we dispense; the impact of supply chain and other manufacturing disruptions or trade policies related to the pharmaceuticals we dispense; the sufficiency of our sources of liquidity and financial resources to fund our future operating expenses and capital expenditure requirements, and our ability to raise additional capital, if needed; the misuse or off-label use, or errors in the dispensing or administration, of the pharmaceuticals we dispense; the volatility of our stock price; and such other risks that are described in our most recent Annual Report on Form 10-K, in any subsequent Quarterly Report on Form 10-Q, and in our other public filings with the Securities and Exchange Commission ( SEC ). The forward-looking statements included in this presentation are made only as of the date hereof. Neither the Company nor its advisors undertake any obligation to update any forward-looking statements for any reason after the date of this presentation to conform these statements to actual results or to changes in the Company’s expectations, except as may be required by law. Accordingly, the Company cautions you not to place any undue reliance on any forward-looking statements. Industry Data: This presentation also includes data, forecasts and information obtained from industry publications and other information available to us. Some data is also based on our good faith estimates, which are derived from management’s knowledge of the industry and independent sources. We have not independently verified any of the data from third- party sources, nor have we ascertained the underlying assumptions relied upon therein. While we are not aware of any misstatements regarding the industry data presented herein, estimates and forecasts involve uncertainties and risks and are subject to change based on various factors. Non-GAAP Financial Measures: The financial information in this presentation includes certain information that is not presented in accordance with U.S. Generally Accepted Accounting Principles (“GAAP”). Non-GAAP financial measures may be considered in addition to GAAP financial information but should not be used as substitutes for the corresponding GAAP measures. The Non-GAAP measures in this presentation may be calculated in a way that is not comparable to similarly titled measures reported by other companies. See the appendix to this presentation for a reconciliation of each non-GAAP measure to its most directly comparable GAAP financial measure. No Offer or Solicitation: This presentation shall not constitute an offer to sell or the solicitation of an offer to buy any securities, nor shall there be any sale of these securities in any state or jurisdiction in which such offer, solicitation or sale would be unlawful prior to registration or qualification under the securities laws of any such state or jurisdiction. 2
David Morris Ashley Stockton Fred Burke EVP, CFO, Co-founder Head of Investor Relations President, CEO, Co-founder • Co-founded Guardian Pharmacy Services in • Co-founded Guardian Pharmacy Services in • Ashley joined Guardian Pharmacy Services in 2004 2004 2025 • Previously co-founded Central Pharmacy • Previously CFO of Central Pharmacy Services, • Ashley has thirty years of experience in equity Services, Inc. (“CPSI”). CPSI, a nuclear Inc., serving in a crucial role as the business markets; most recently, she served as Head of pharmacy company, served over 1,000 quickly grew before being acquired by Cardinal Southeast Institutional Equity Sales for hospitals and clinics in 22 states (acquired by Health J.P. Morgan Cardinal Health) • Earlier in her career, Ashley was an equity • Served as President of the PBM Division of • Founded Sales Technologies, Inc. which research associate at J.P. Morgan and Bear, Complete Health and established and led its provided sales force automation software Stearns & Co across several sectors subsidiary, Rx Management (acquired by Dun & Bradstreet) • Served as an auditor for Ernst & Young • Served as a consultant for McKinsey & Company and a brand manager for Procter & Gamble 3
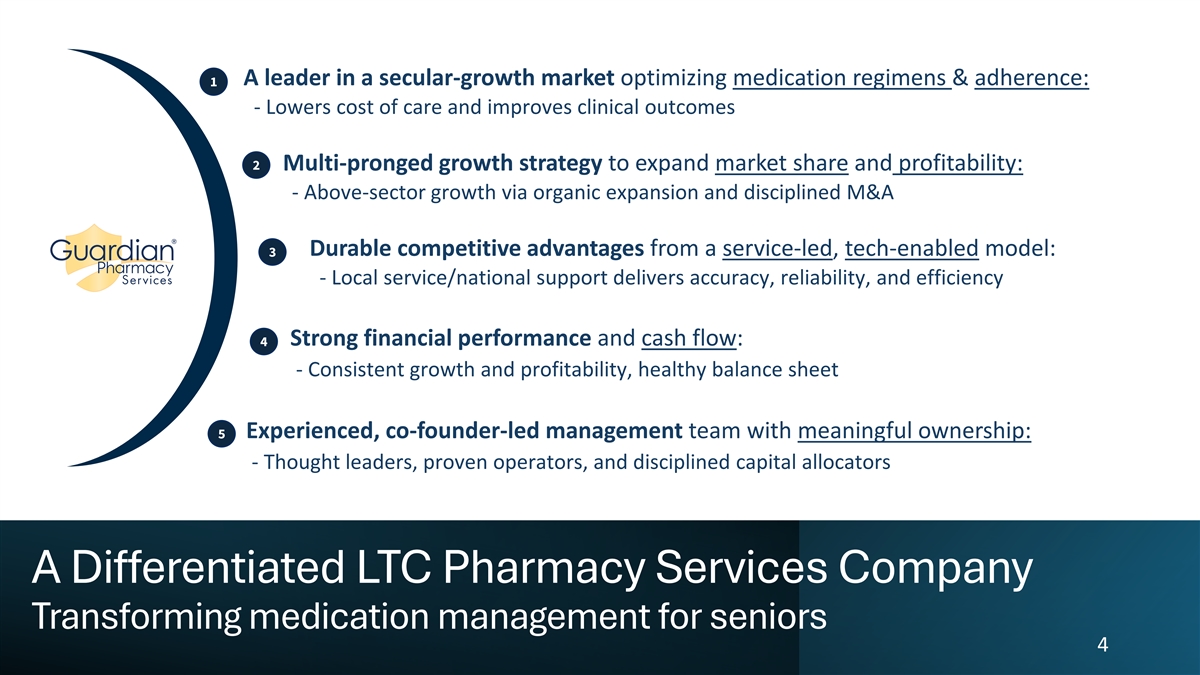
A leader in a secular-growth market optimizing medication regimens & adherence: 1 - Lowers cost of care and improves clinical outcomes 11 states 11 2 Multi-pronged growth strategy to expand market share and profitability: - Above-sector growth via organic expansion and disciplined M&A with > 40% Market Share Durable competitive advantages from a service-led, tech-enabled model: 3 - Local service/national support delivers accuracy, reliability, and efficiency 4 Strong financial performance and cash flow: - Consistent growth and profitability, healthy balance sheet 5 Experienced, co-founder-led management team with meaningful ownership: - Thought leaders, proven operators, and disciplined capital allocators A Differentiated LTC Pharmacy Services Company Transforming medication management for seniors 4

Leading the Way in “ALF” Assisted Living Facilities
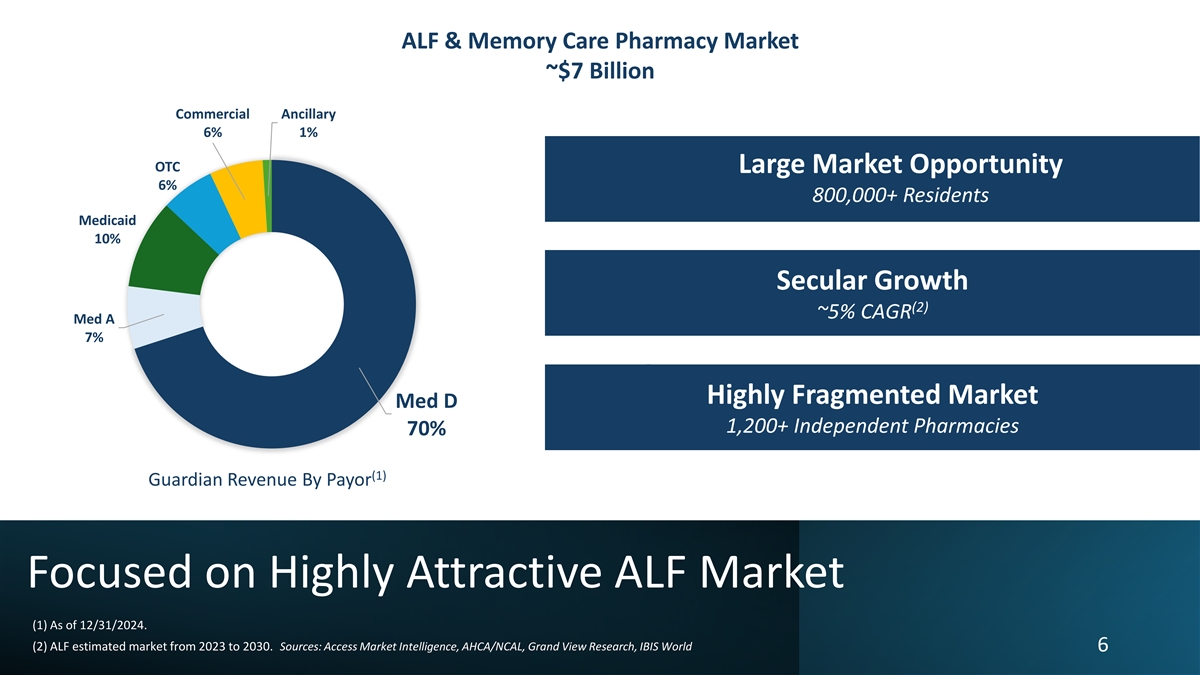
ALF & Memory Care Pharmacy Market ~$7 Billion Commercial Ancillary 11 states 11 6% 1% OTC Large Market Opportunity 6% 800,000+ Residents Medicaid 10% with > 40% Market Share Secular Growth (2) ~5% CAGR Med A 7% Highly Fragmented Market Med D 1,200+ Independent Pharmacies 70% (1) Guardian Revenue By Payor Focused on Highly Attractive ALF Market (1) As of 12/31/2024. (2) ALF estimated market from 2023 to 2030. Sources: Access Market Intelligence, AHCA/NCAL, Grand View Research, IBIS World 6
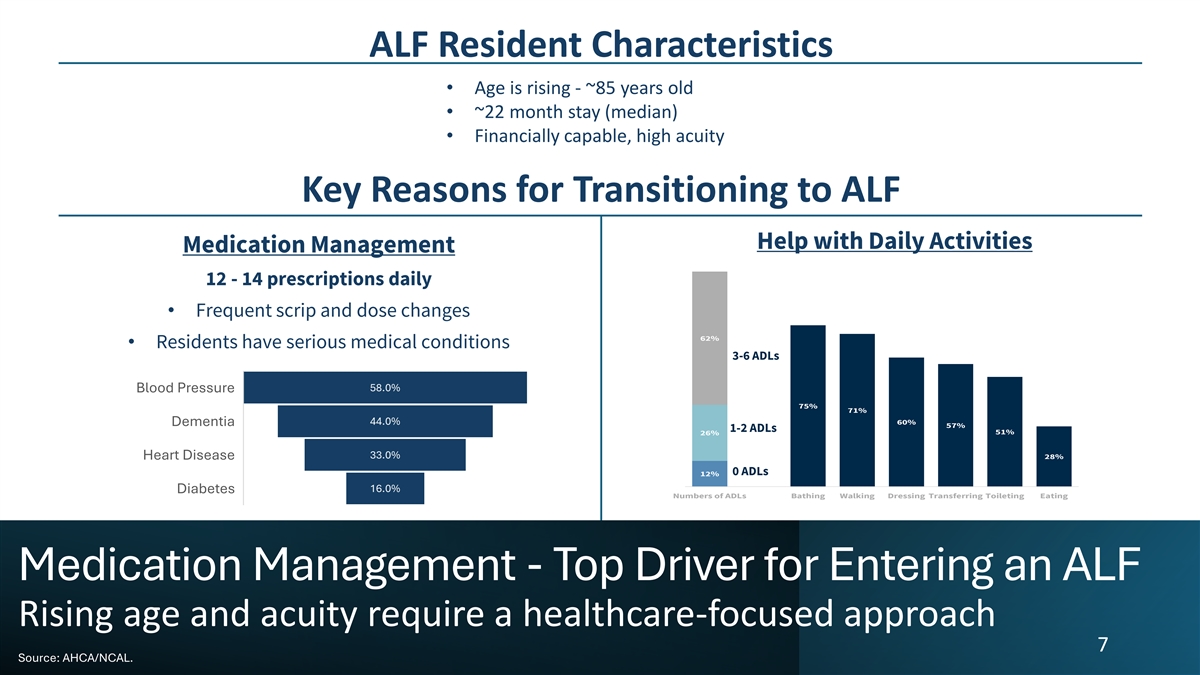
ALF Resident Characteristics • Age is rising - ~85 years old • ~22 month stay (median) • Financially capable, high acuity Key Reasons for Transitioning to ALF Help with Daily Activities Medication Management 12 - 14 prescriptions daily • Frequent scrip and dose changes 62% • Residents have serious medical conditions 3-6 ADLs 58.0% Blood Pressure 75% 71% 44.0% 60% Dementia 57% 1-2 ADLs 26% 51% 33.0% 28% Heart Disease 0 ADLs 12% 16.0% Diabetes Numbers of ADLs Bathing Walking Dressing Transferring Toileting Eating Medication Management - Top Driver for Entering an ALF Rising age and acuity require a healthcare-focused approach 7 Source: AHCA/NCAL.
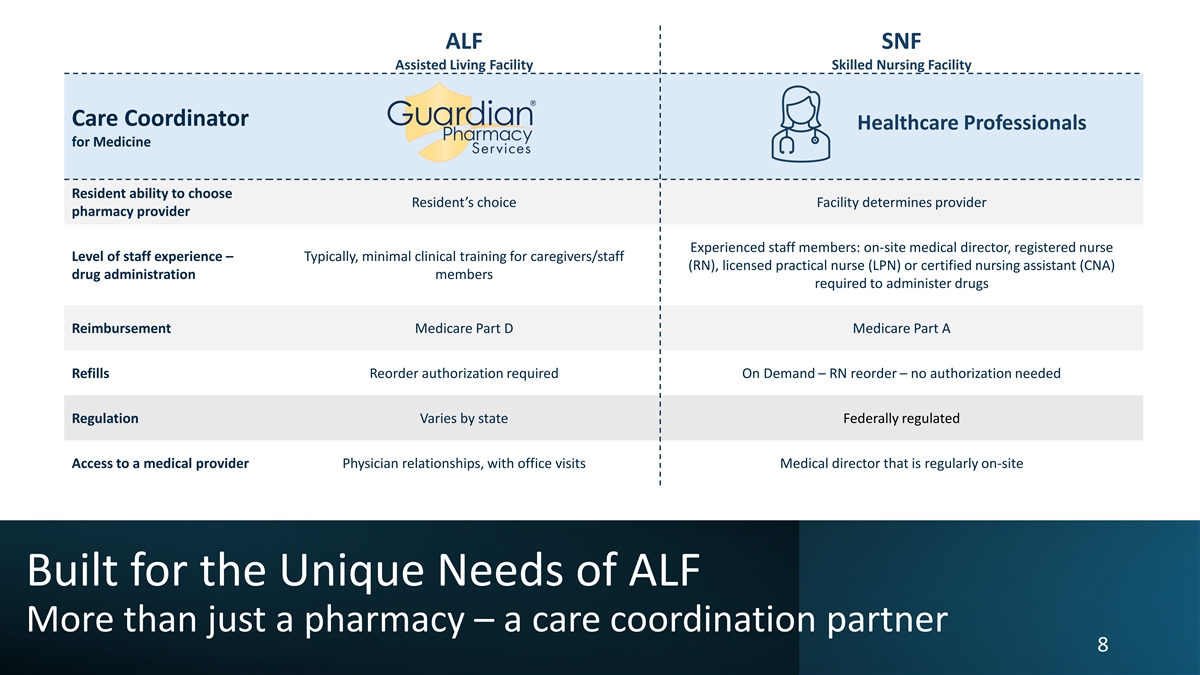
ALF SNF Assisted Living Facility Skilled Nursing Facility Care Coordinator Healthcare Professionals for Medicine Resident ability to choose Resident’s choice Facility determines provider pharmacy provider Experienced staff members: on-site medical director, registered nurse Level of staff experience – Typically, minimal clinical training for caregivers/staff (RN), licensed practical nurse (LPN) or certified nursing assistant (CNA) drug administration members required to administer drugs Reimbursement Medicare Part D Medicare Part A Refills Reorder authorization required On Demand – RN reorder – no authorization needed Regulation Varies by state Federally regulated Access to a medical provider Physician relationships, with office visits Medical director that is regularly on-site Built for the Unique Needs of ALF More than just a pharmacy – a care coordination partner 8
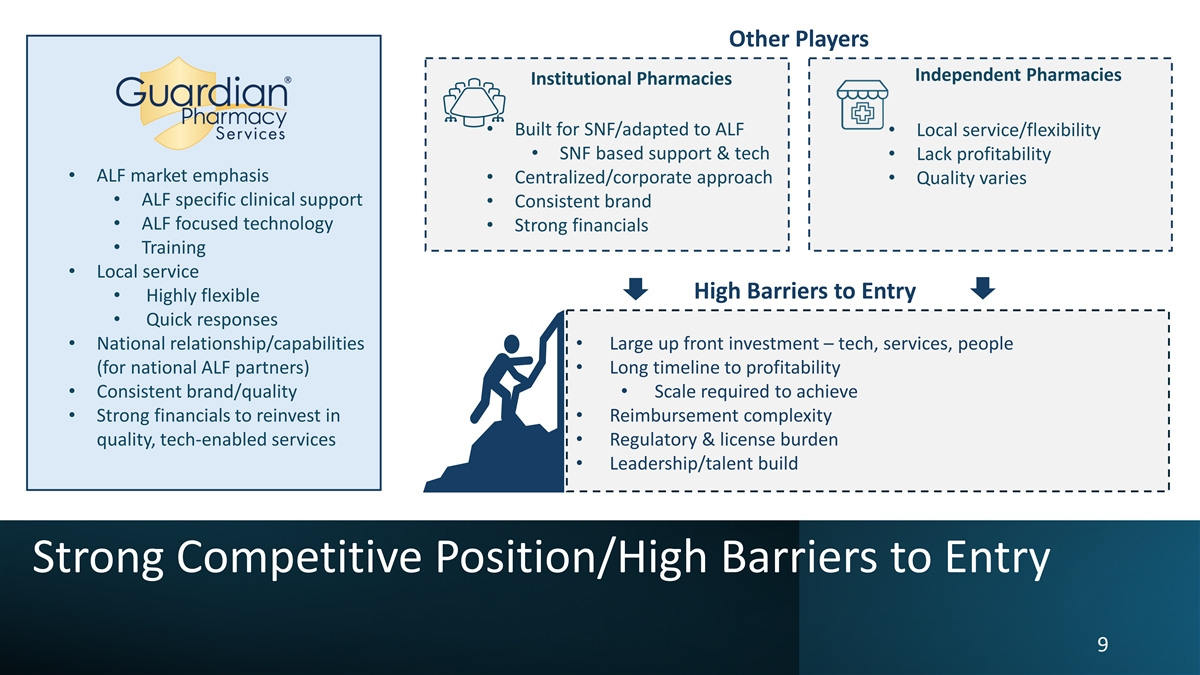
Other Players Independent Pharmacies Institutional Pharmacies • Built for SNF/adapted to ALF • Local service/flexibility • SNF based support & tech • Lack profitability • ALF market emphasis • Centralized/corporate approach • Quality varies • ALF specific clinical support • Consistent brand • ALF focused technology • Strong financials • Training • Local service High Barriers to Entry • Highly flexible • Quick responses • National relationship/capabilities • Large up front investment – tech, services, people (for national ALF partners) • Long timeline to profitability • Consistent brand/quality • Scale required to achieve • Strong financials to reinvest in • Reimbursement complexity quality, tech-enabled services • Regulatory & license burden • Leadership/talent build Strong Competitive Position/High Barriers to Entry 9
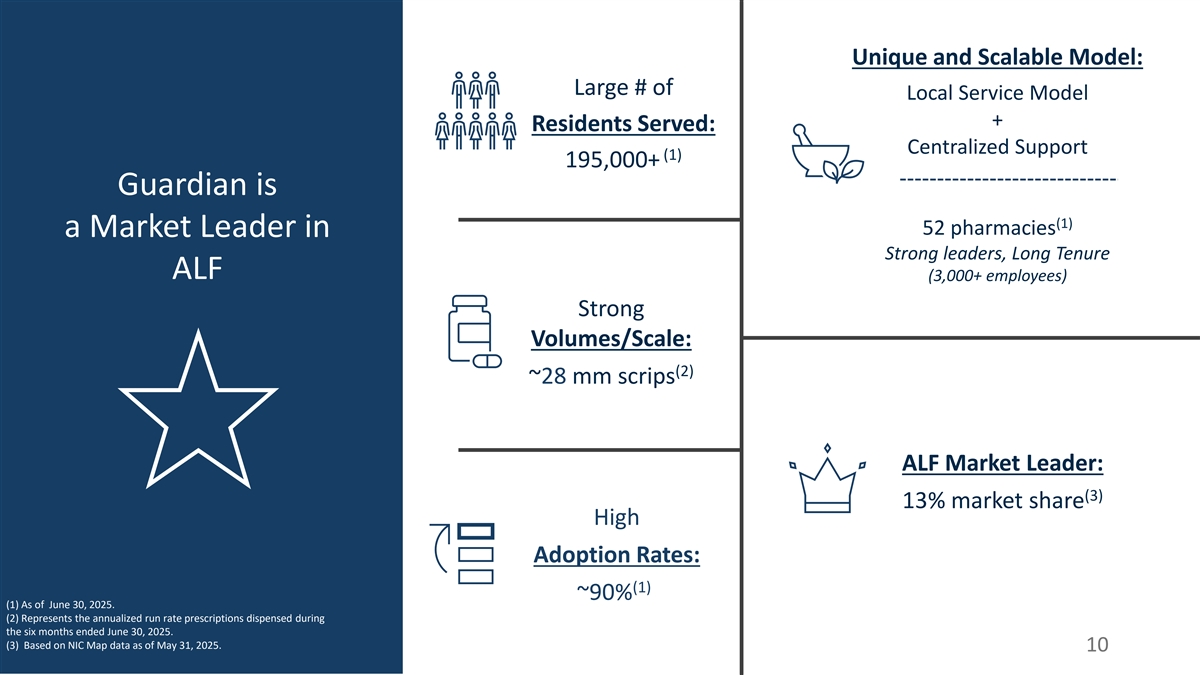
Unique and Scalable Model: Large # of Local Service Model + Residents Served: Centralized Support (1) 195,000+ Guardian is (1) 52 pharmacies a Market Leader in Strong leaders, Long Tenure ALF (3,000+ employees) Strong Volumes/Scale: (2) ~28 mm scrips ALF Market Leader: (3) 13% market share High Adoption Rates: (1) ~90% (1) As of June 30, 2025. (2) Represents the annualized run rate prescriptions dispensed during the six months ended June 30, 2025. (3) Based on NIC Map data as of May 31, 2025. 10
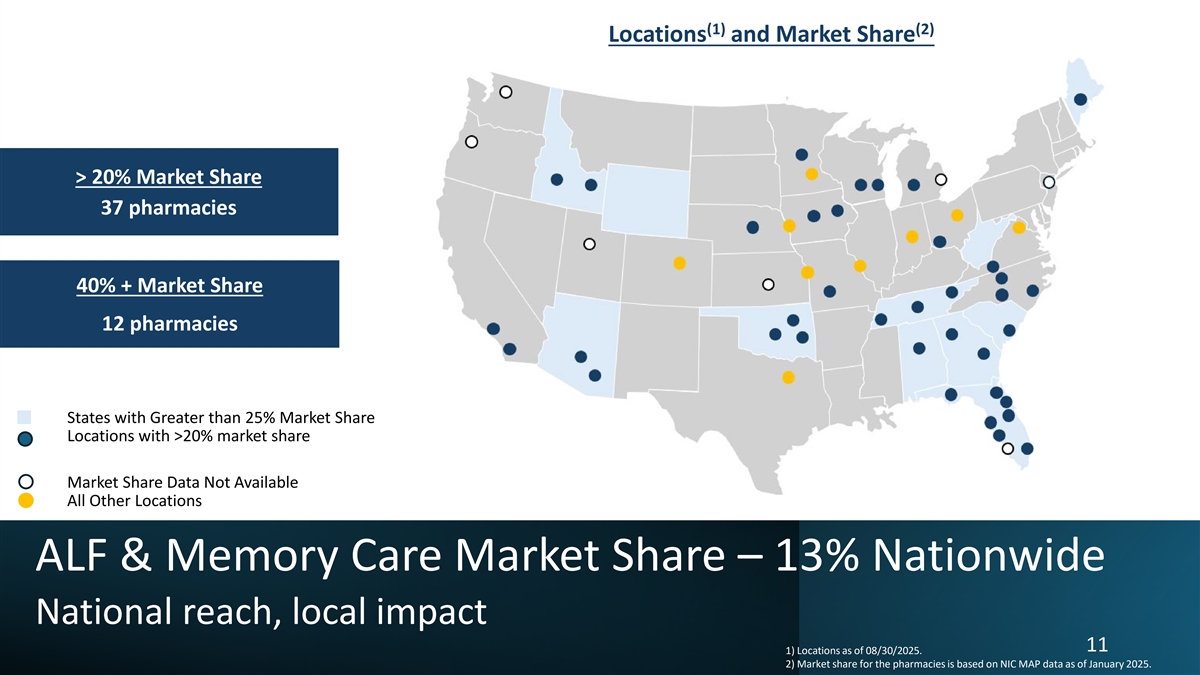
(1) (2) Locations and Market Share 11 states 11 > 20% Market Share 37 pharmacies CA with > 40% Market Share 40% + Market Share with 20%- 40% Market Share 12 pharmacies CA States with Greater than 25% Market Share Locations with >20% market share Market Share Data Not Available All Other Locations ALF & Memory Care Market Share – 13% Nationwide National reach, local impact 11 1) Locations as of 08/30/2025. 2) Market share for the pharmacies is based on NIC MAP data as of January 2025.
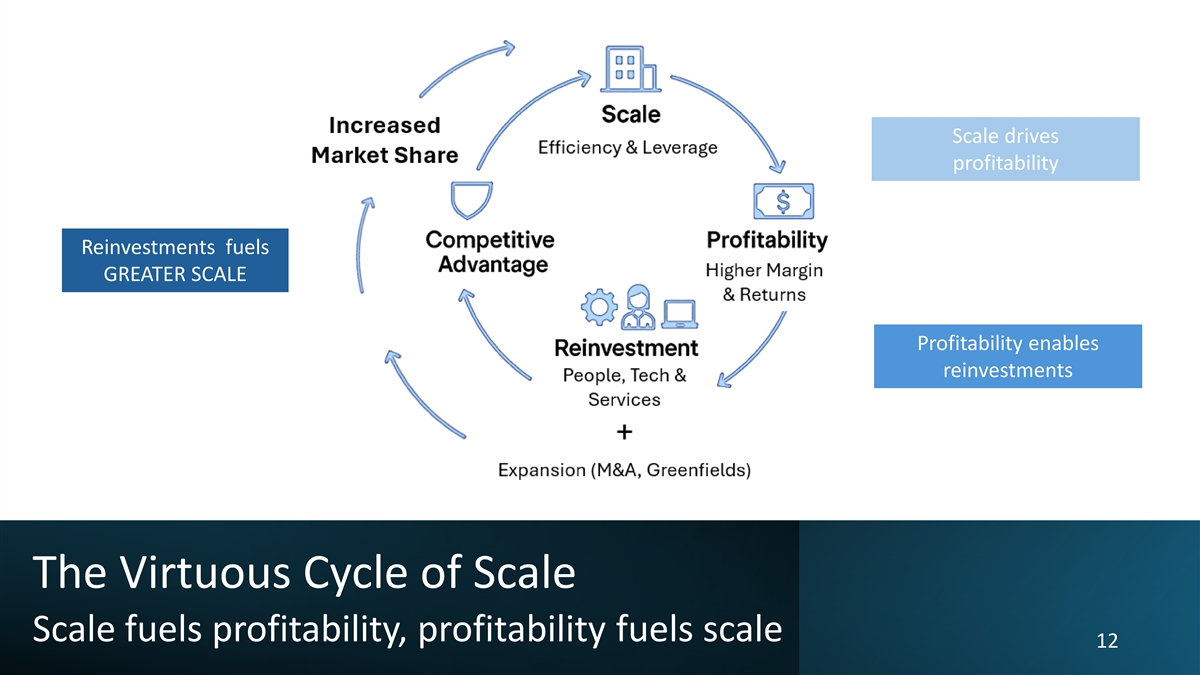
Scale drives profitability Reinvestments fuels GREATER SCALE Profitability enables reinvestments The Virtuous Cycle of Scale Scale fuels profitability, profitability fuels scale 12

Pillars of Growth Organic + Acquisitions
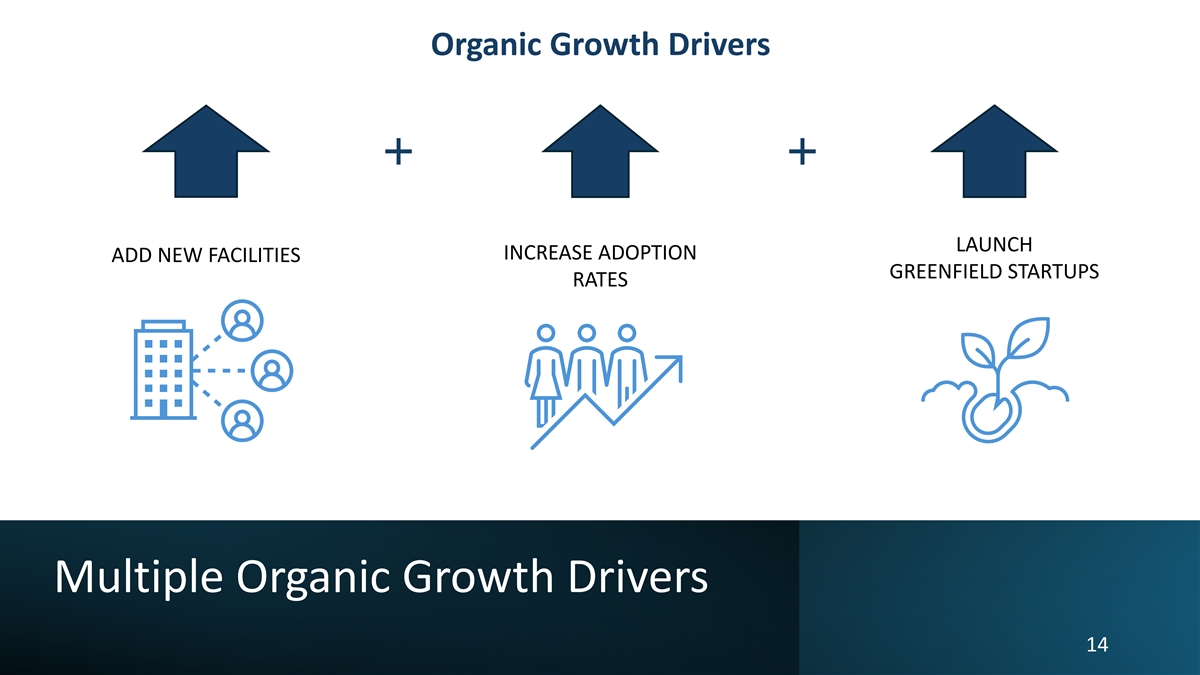
Organic Growth Drivers LAUNCH INCREASE ADOPTION ADD NEW FACILITIES GREENFIELD STARTUPS RATES Multiple Organic Growth Drivers 14
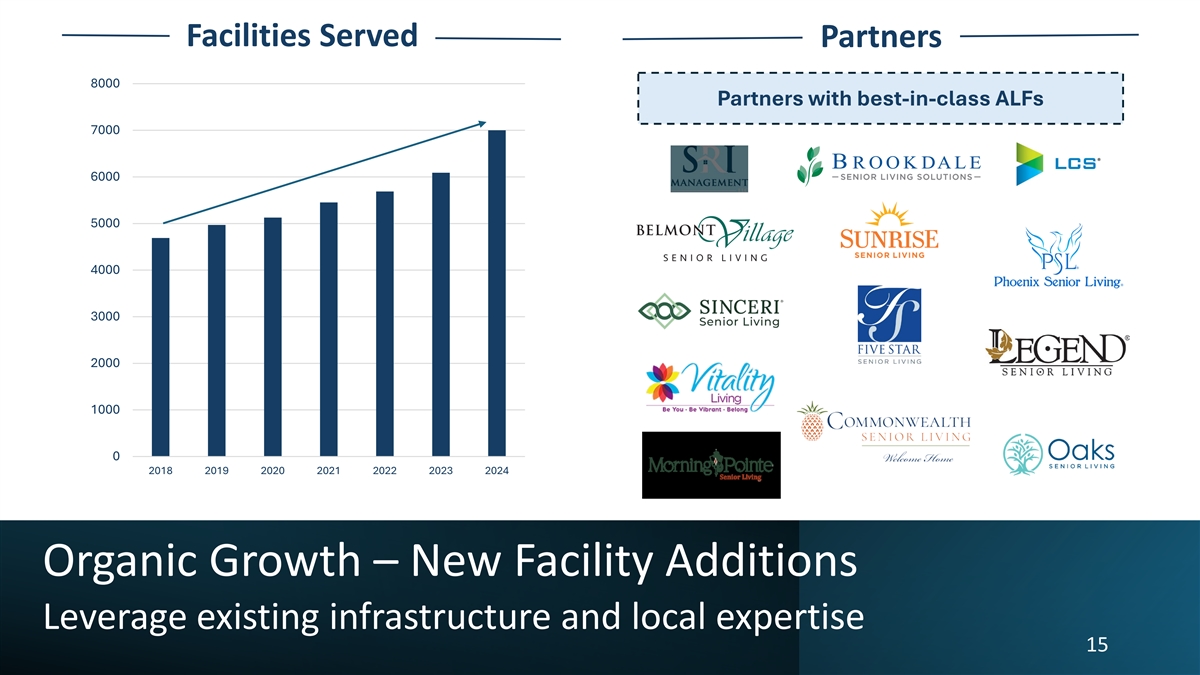
Facilities Served Partners 8000 Partners with best-in-class ALFs 7000 6000 5000 4000 3000 2000 1000 0 2018 2019 2020 2021 2022 2023 2024 Organic Growth – New Facility Additions Leverage existing infrastructure and local expertise 15
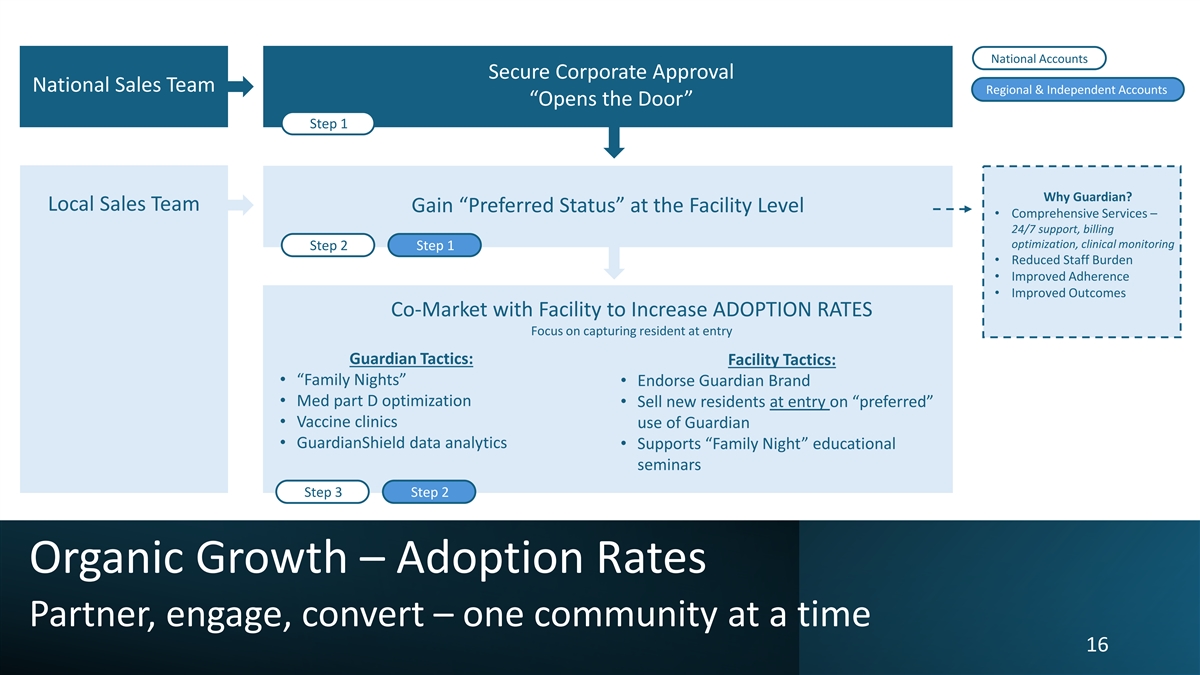
National Accounts Secure Corporate Approval National Sales Team Regional & Independent Accounts “Opens the Door” Step 1 Why Guardian? Local Sales Team Gain “Preferred Status” at the Facility Level • Comprehensive Services – 24/7 support, billing optimization, clinical monitoring Step 2 Step 1 • Reduced Staff Burden • Improved Adherence • Improved Outcomes Co-Market with Facility to Increase ADOPTION RATES Focus on capturing resident at entry Guardian Tactics: Facility Tactics: • “Family Nights” • Endorse Guardian Brand • Med part D optimization • Sell new residents at entry on “preferred” • Vaccine clinics use of Guardian • GuardianShield data analytics • Supports “Family Night” educational seminars Step 3 Step 2 Organic Growth – Adoption Rates Partner, engage, convert – one community at a time 16
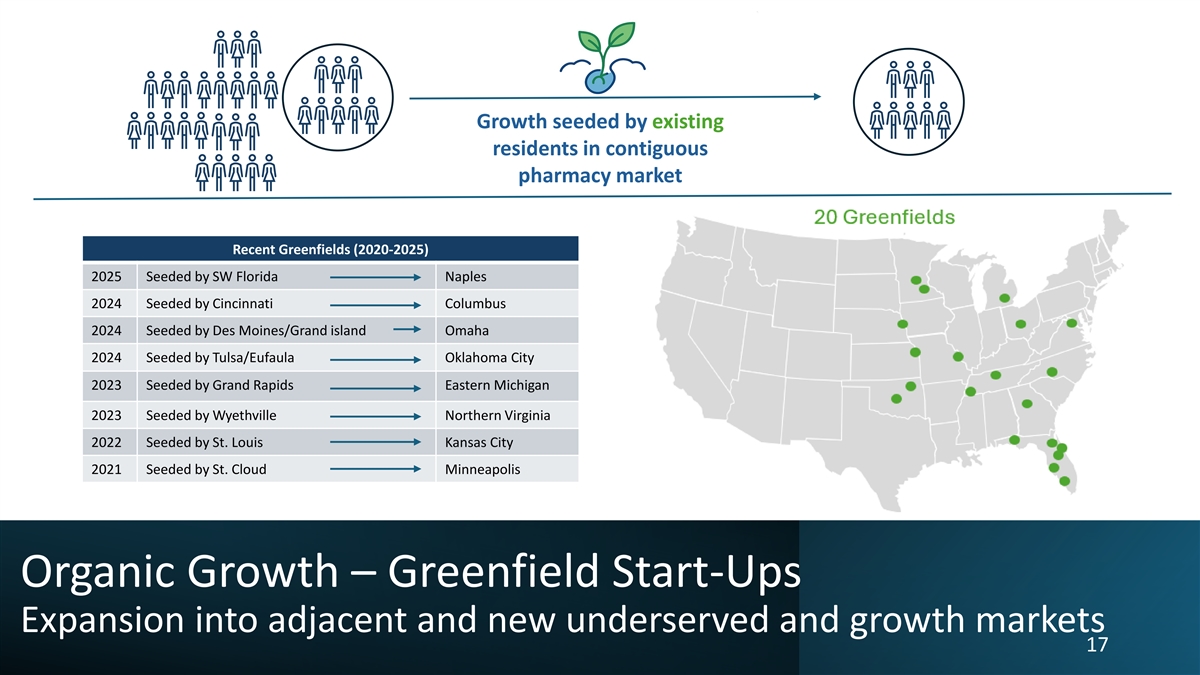
Growth seeded by existing residents in contiguous pharmacy market Recent Greenfields (2020-2025) 2025 Seeded by SW Florida Naples 2024 Seeded by Cincinnati Columbus 2024 Seeded by Des Moines/Grand island Omaha 2024 Seeded by Tulsa/Eufaula Oklahoma City 2023 Seeded by Grand Rapids Eastern Michigan 2023 Seeded by Wyethville Northern Virginia 2022 Seeded by St. Louis Kansas City 2021 Seeded by St. Cloud Minneapolis Organic Growth – Greenfield Start-Ups Expansion into adjacent and new underserved and growth markets 17
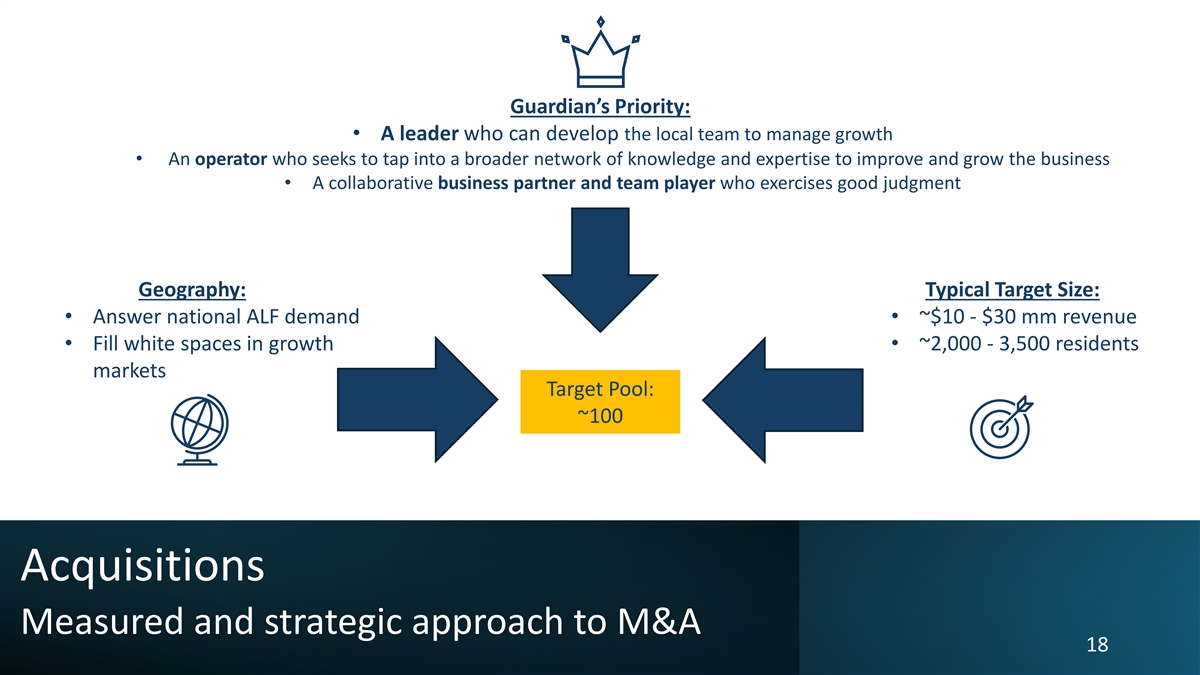
Guardian’s Priority: • A leader who can develop the local team to manage growth • An operator who seeks to tap into a broader network of knowledge and expertise to improve and grow the business • A collaborative business partner and team player who exercises good judgment Geography: Typical Target Size: • Answer national ALF demand • ~$10 - $30 mm revenue • Fill white spaces in growth • ~2,000 - 3,500 residents markets Target Pool: ~100 Acquisitions Measured and strategic approach to M&A 18
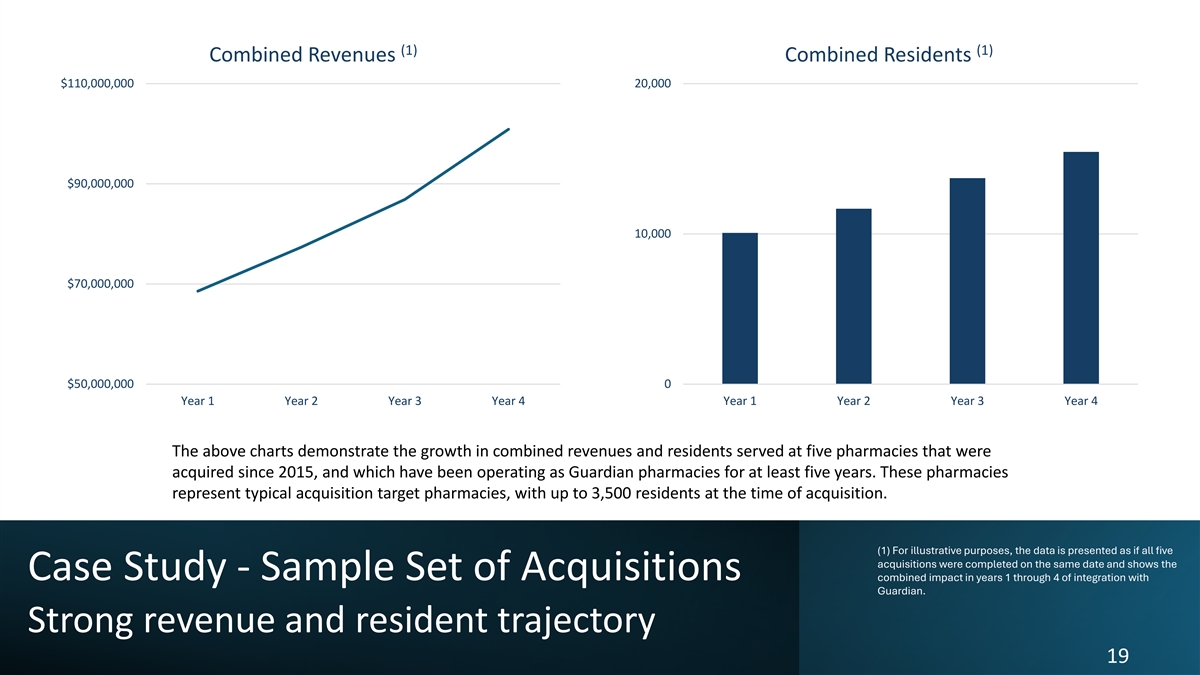
(1) (1) Combined Revenues Combined Residents $110,000,000 20,000 $90,000,000 10,000 $70,000,000 $50,000,000 0 Year 1 Year 2 Year 3 Year 4 Year 1 Year 2 Year 3 Year 4 The above charts demonstrate the growth in combined revenues and residents served at five pharmacies that were acquired since 2015, and which have been operating as Guardian pharmacies for at least five years. These pharmacies represent typical acquisition target pharmacies, with up to 3,500 residents at the time of acquisition. (1) For illustrative purposes, the data is presented as if all five acquisitions were completed on the same date and shows the Case Study - Sample Set of Acquisitions combined impact in years 1 through 4 of integration with Guardian. Strong revenue and resident trajectory 19
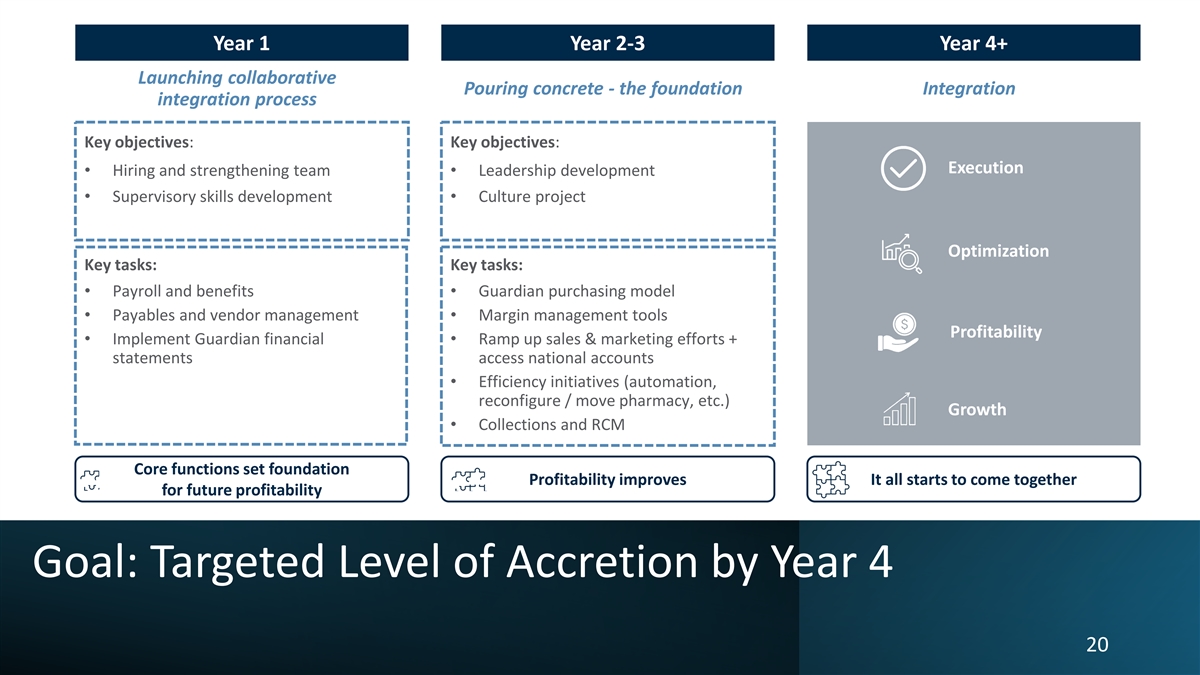
Year 1 Year 2-3 Year 4+ Launching collaborative Pouring concrete - the foundation Integration integration process Key objectives: Key objectives: Execution • Hiring and strengthening team • Leadership development • Supervisory skills development • Culture project Optimization Key tasks: Key tasks: • Payroll and benefits • Guardian purchasing model • Payables and vendor management • Margin management tools Profitability • Implement Guardian financial • Ramp up sales & marketing efforts + statements access national accounts • Efficiency initiatives (automation, reconfigure / move pharmacy, etc.) Growth • Collections and RCM Core functions set foundation Profitability improves It all starts to come together for future profitability Goal: Targeted Level of Accretion by Year 4 20
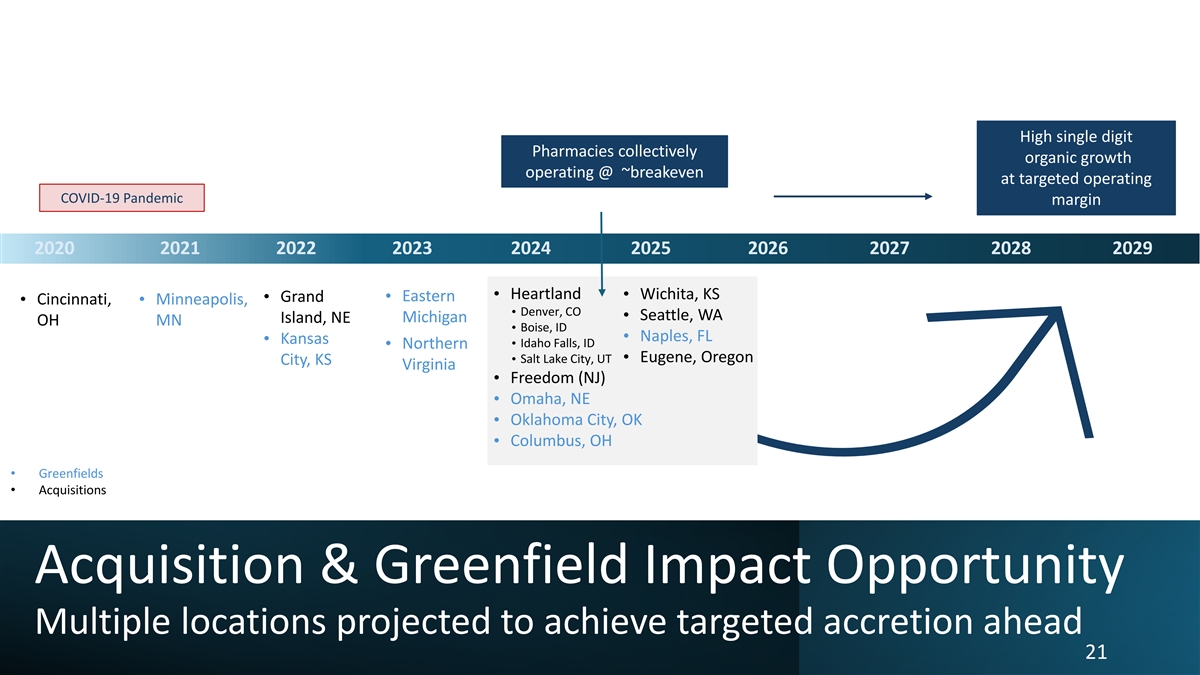
High single digit Pharmacies collectively organic growth operating @ ~breakeven at targeted operating COVID-19 Pandemic margin 2020 2021 2022 2023 2024 2025 2026 2027 2028 2029 Heartland • • Wichita, KS Eastern • Grand • • Cincinnati, • Minneapolis, • Denver, CO Seattle, WA • Island, NE Michigan OH MN Boise, ID • Naples, FL • Kansas • • Idaho Falls, ID • Northern • Eugene, Oregon • Salt Lake City, UT City, KS Virginia • Freedom (NJ) Omaha, NE • Oklahoma City, OK • • Columbus, OH • Greenfields • Acquisitions Acquisition & Greenfield Impact Opportunity Multiple locations projected to achieve targeted accretion ahead 21
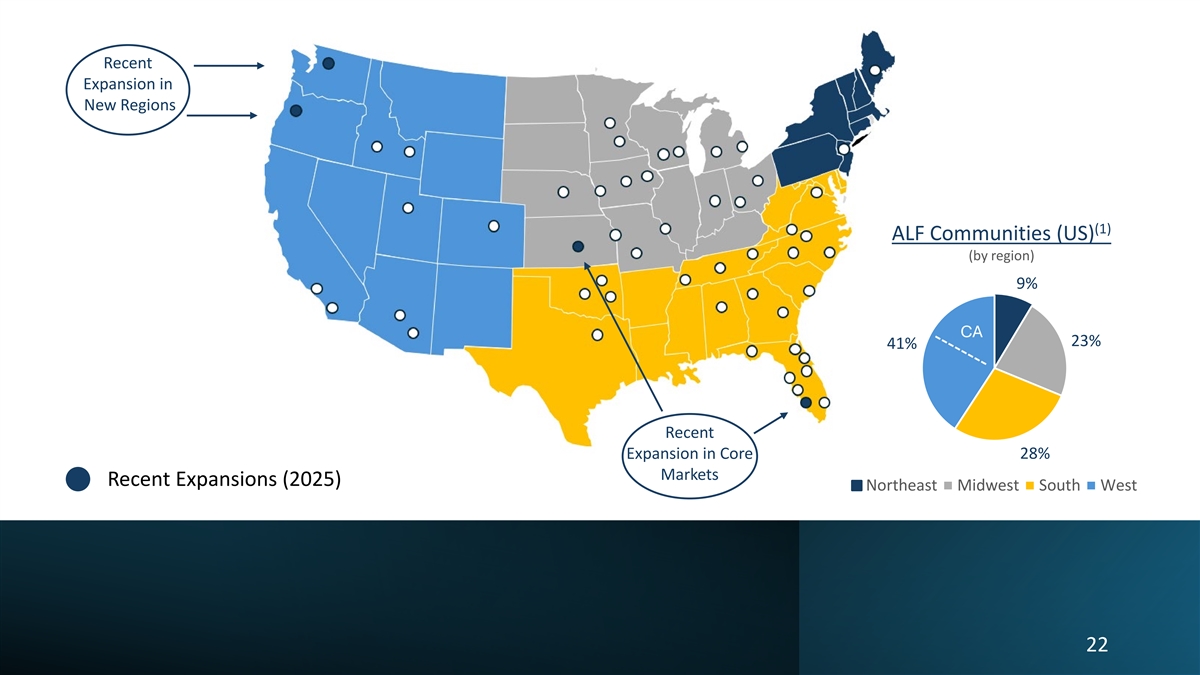
Recent Expansion in New Regions (1) ALF Communities (US) (by region) 9% CA CA 23% 41% CA Recent Expansion in Core 28% Markets Recent Expansions (2025) Northeast Midwest South West 22

Competitive Advantage Differentiated Technology & Services
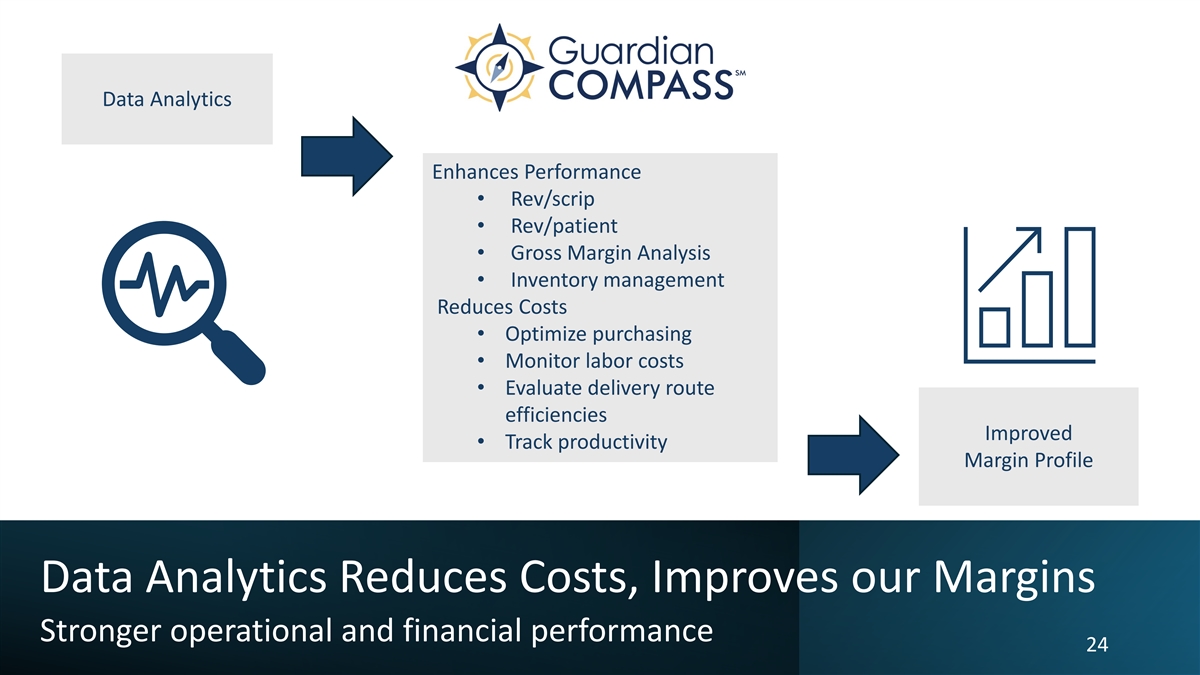
Data Analytics Enhances Performance • Rev/scrip • Rev/patient • Gross Margin Analysis • Inventory management Reduces Costs • Optimize purchasing • Monitor labor costs • Evaluate delivery route efficiencies Improved • Track productivity Margin Profile Data Analytics Reduces Costs, Improves our Margins Stronger operational and financial performance 24
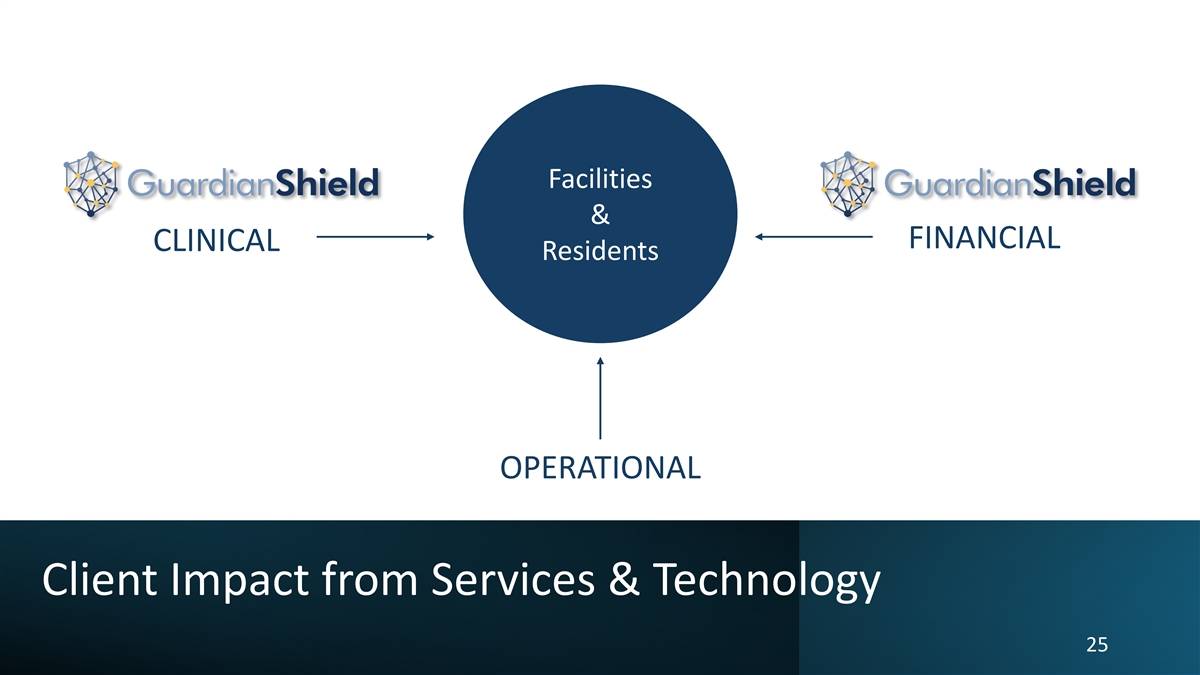
Facilities & FINANCIAL CLINICAL Residents OPERATIONAL Client Impact from Services & Technology 25
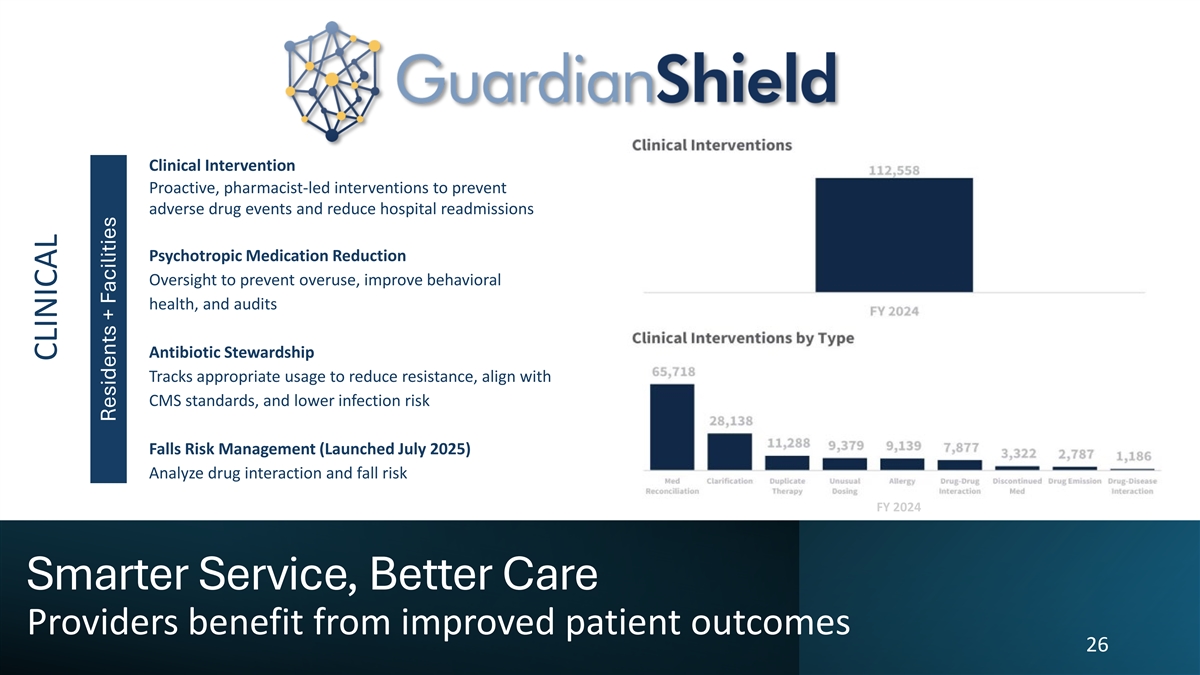
Clinical Intervention Proactive, pharmacist-led interventions to prevent adverse drug events and reduce hospital readmissions Psychotropic Medication Reduction Oversight to prevent overuse, improve behavioral health, and audits Antibiotic Stewardship Tracks appropriate usage to reduce resistance, align with CMS standards, and lower infection risk Falls Risk Management (Launched July 2025) Analyze drug interaction and fall risk FY 2024 Smarter Service, Better Care Providers benefit from improved patient outcomes 26 CLINICAL Residents + Facilities
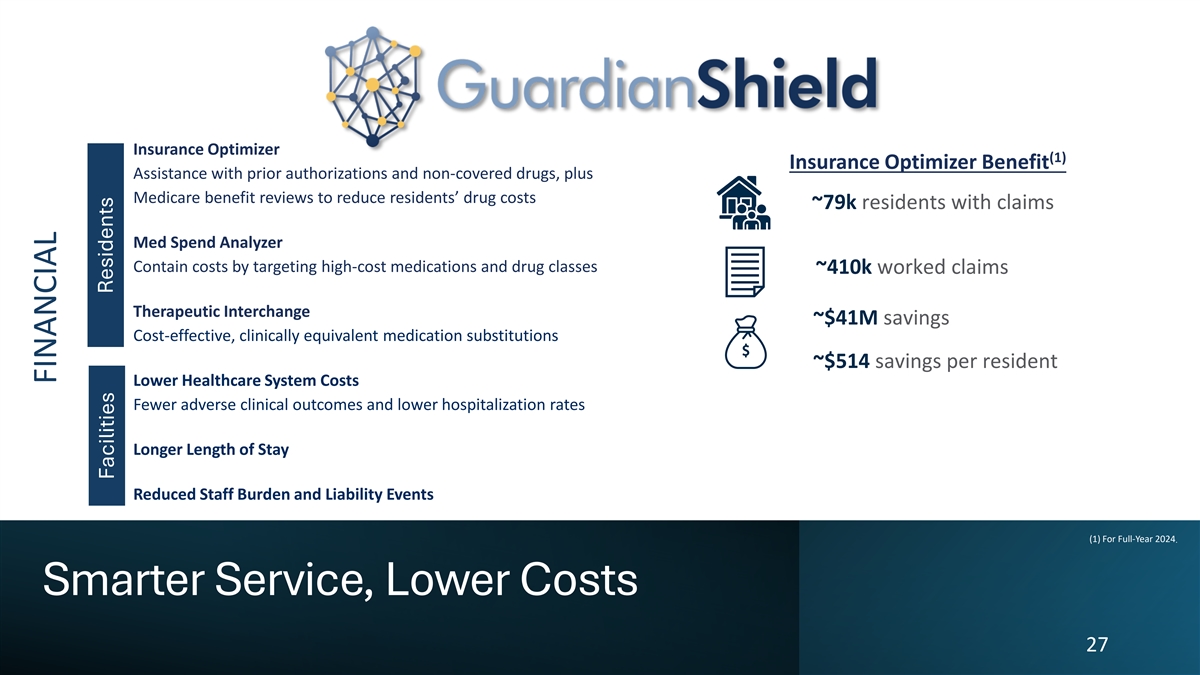
Insurance Optimizer (1) Insurance Optimizer Benefit Assistance with prior authorizations and non-covered drugs, plus Medicare benefit reviews to reduce residents’ drug costs ~79k residents with claims Med Spend Analyzer Contain costs by targeting high-cost medications and drug classes ~410k worked claims Therapeutic Interchange ~$41M savings Cost-effective, clinically equivalent medication substitutions ~$514 savings per resident Lower Healthcare System Costs Fewer adverse clinical outcomes and lower hospitalization rates Longer Length of Stay Reduced Staff Burden and Liability Events (1) For Full-Year 2024. Smarter Service, Lower Costs 27 FINANCIAL Residents Facilities
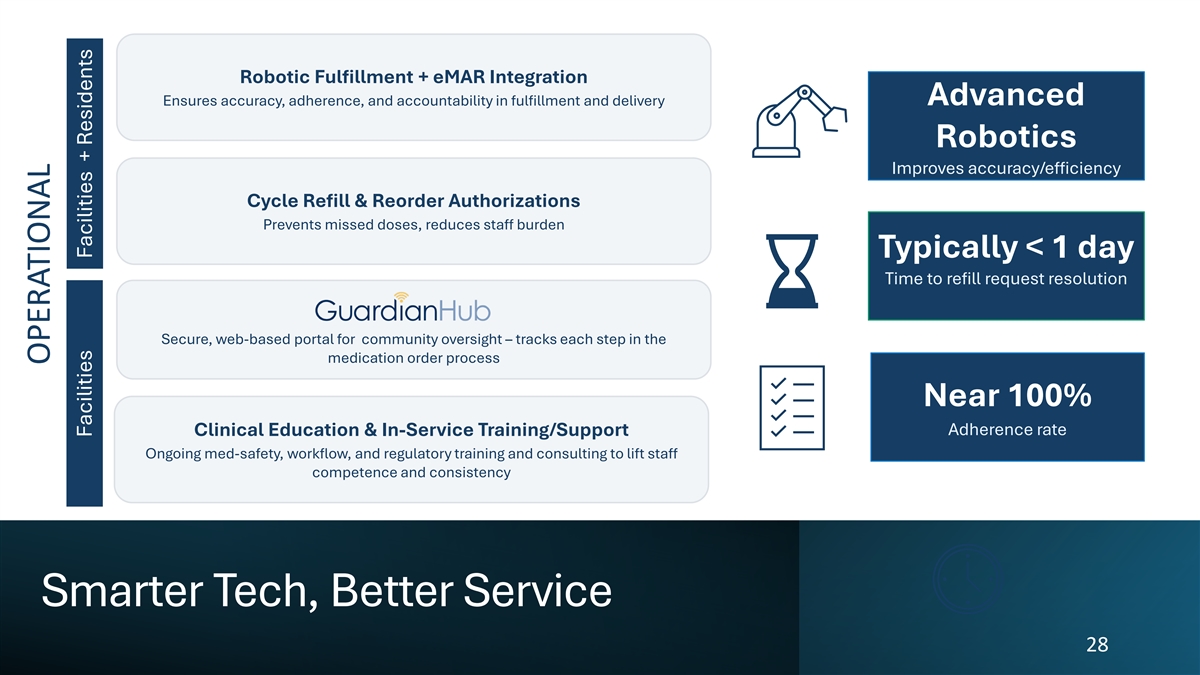
Robotic Fulfillment + eMAR Integration Advanced Ensures accuracy, adherence, and accountability in fulfillment and delivery Robotics Improves accuracy/efficiency Cycle Refill & Reorder Authorizations Prevents missed doses, reduces staff burden Typically < 1 day Time to refill request resolution Secure, web-based portal for community oversight – tracks each step in the medication order process Near 100% Adherence rate Clinical Education & In-Service Training/Support Ongoing med-safety, workflow, and regulatory training and consulting to lift staff competence and consistency Smarter Tech, Better Service 28 OPERATIONAL Facilities Facilities + Residents
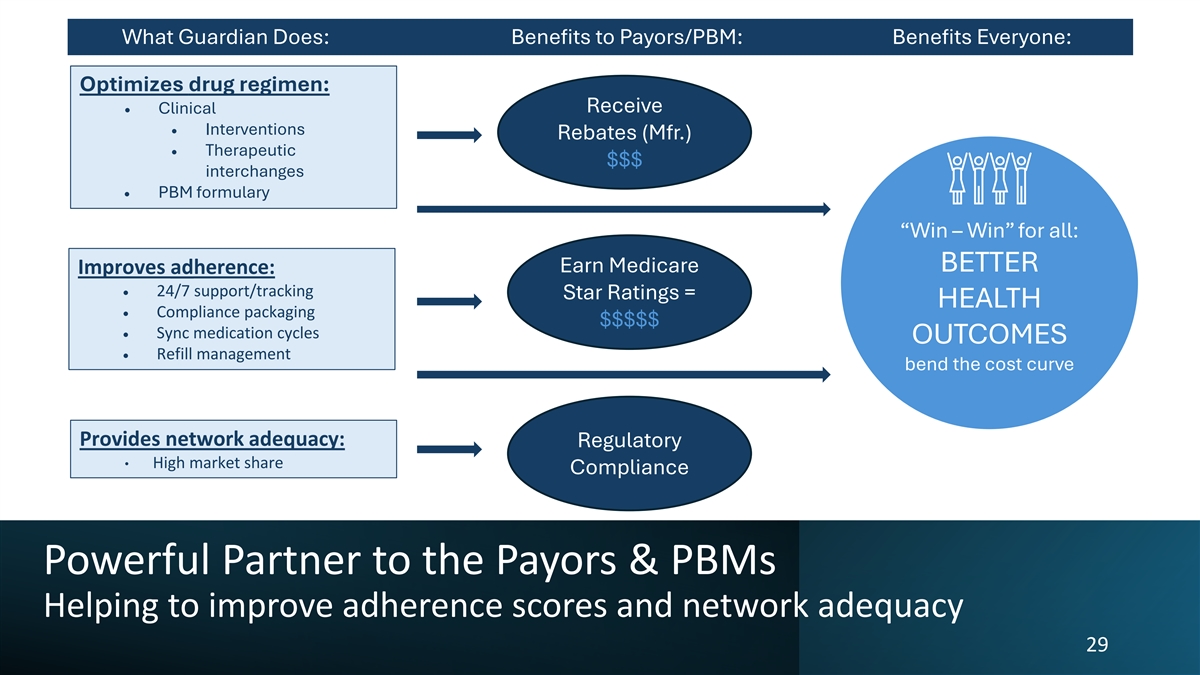
What Guardian Does: Benefits to Payors/PBM: Benefits Everyone: Optimizes drug regimen: Receive • Clinical 11 states 11 • Interventions Rebates (Mfr.) • Therapeutic $$$ interchanges • PBM formulary “Win – Win” for all: BETTER Earn Medicare Improves adherence: • 24/7 support/tracking Star Ratings = HEALTH • Compliance packaging $$$$$ • Sync medication cycles OUTCOMES • Refill management bend the cost curve Provides network adequacy: Regulatory • High market share Compliance Powerful Partner to the Payors & PBMs Helping to improve adherence scores and network adequacy 29

Financial Performance Consistent Execution & Results
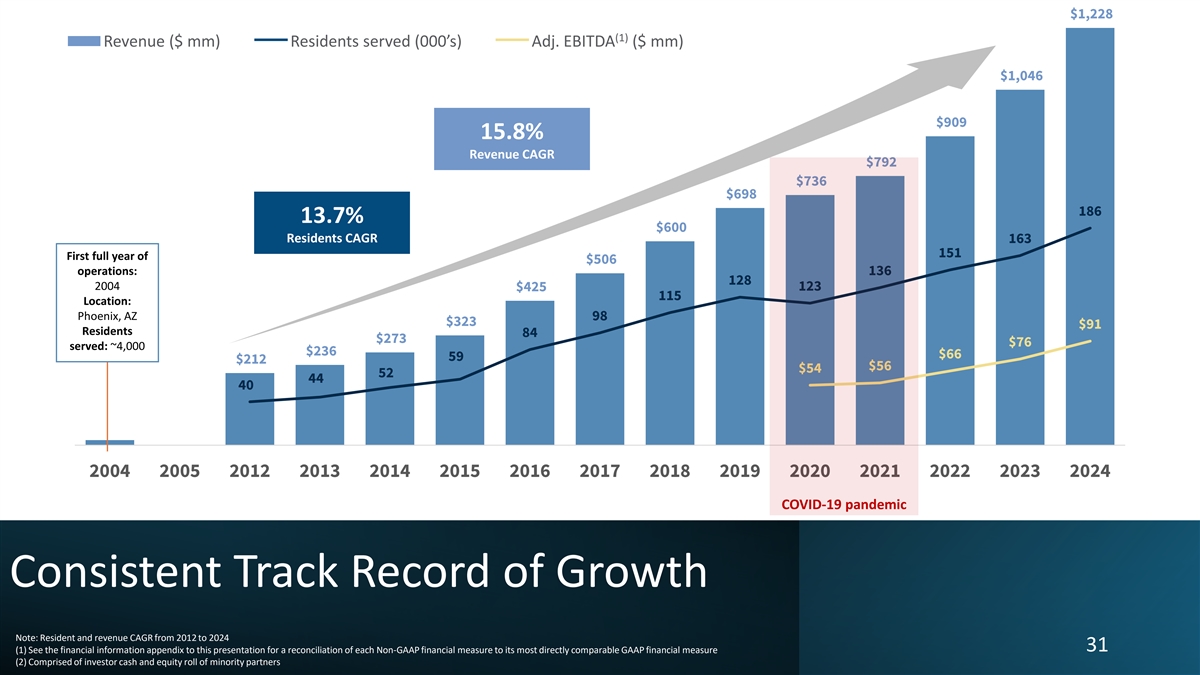
$1,228 (1) Revenue ($ mm) Residents served (000’s) Adj. EBITDA ($ mm) $1,046 $909 15.8% Revenue CAGR $792 $736 $698 186 13.7% $600 Residents CAGR 163 151 First full year of $506 operations: 136 128 2004 $425 123 115 Location: Phoenix, AZ 98 $323 $91 Residents 84 $273 $76 served: ~4,000 $236 $66 59 $212 $56 $54 52 44 40 2004 2005 2012 2013 2014 2015 2016 2017 2018 2019 2020 2021 2022 2023 2024 COVID-19 pandemic Consistent Track Record of Growth Note: Resident and revenue CAGR from 2012 to 2024 31 (1) See the financial information appendix to this presentation for a reconciliation of each Non-GAAP financial measure to its most directly comparable GAAP financial measure (2) Comprised of investor cash and equity roll of minority partners
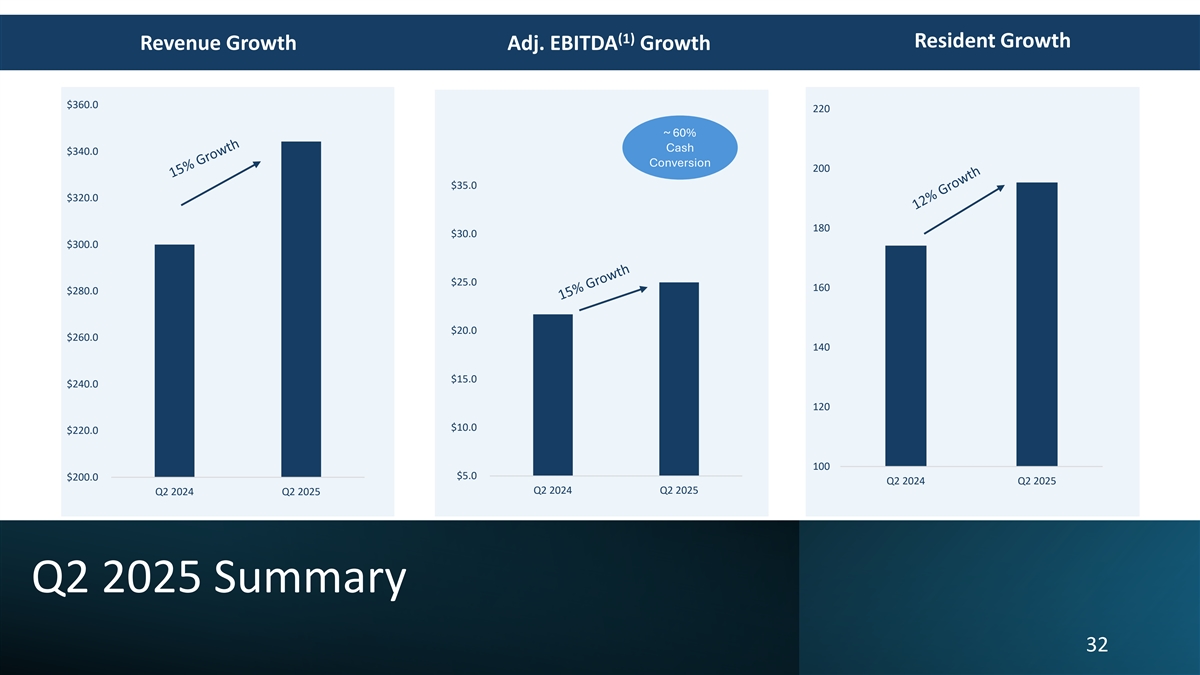
~60% adj EBITDA to cash flow conversion (1) Resident Growth Revenue Growth Adj. EBITDA Growth $360.0 220 ~ 60% Cash $340.0 Conversion 200 $344.3 $35.0 $320.0 195.3 180 $30.0 $300.0 $300.0 174.1 $25.0 160 $280.0 $25.0 $21.7 $20.0 $260.0 140 $15.0 $240.0 120 $10.0 $220.0 100 $5.0 $200.0 Q2 2024 Q2 2025 Q2 2024 Q2 2025 Q2 2024 Q2 2025 Q2 2025 Summary 32
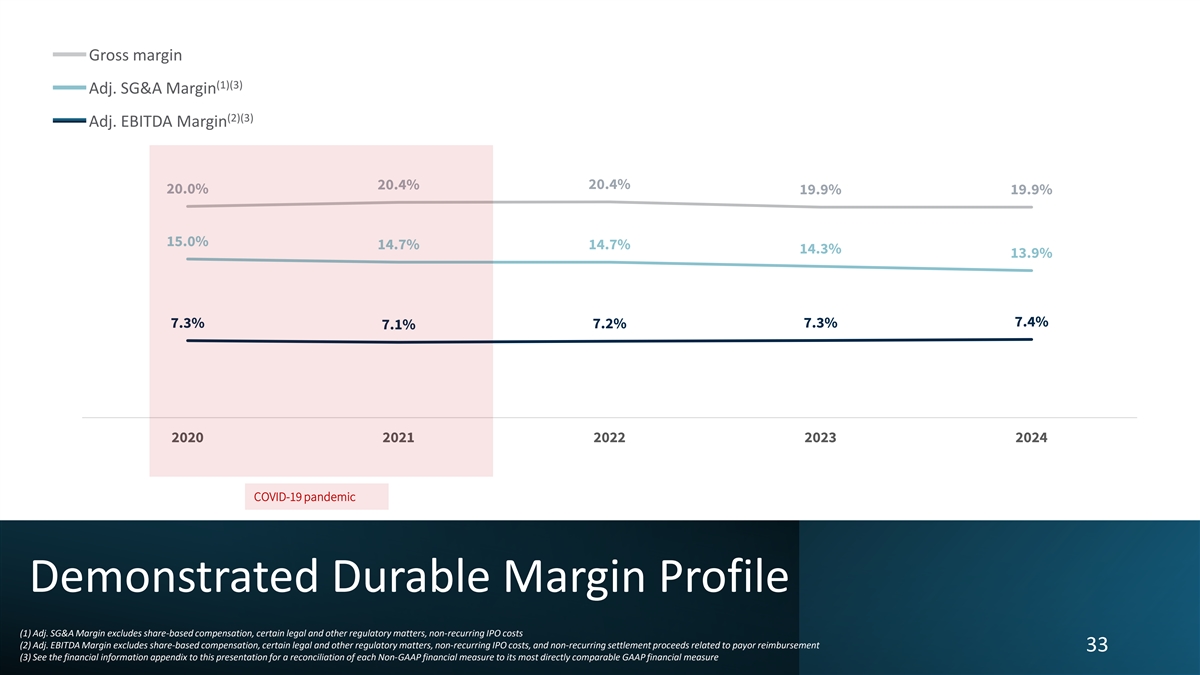
Gross margin (1)(3) Adj. SG&A Margin (2)(3) Adj. EBITDA Margin 20.4% 20.4% 20.0% 19.9% 19.9% 15.0% 14.7% 14.7% 14.3% 13.9% 7.4% 7.3% 7.3% 7.2% 7.1% 2020 2021 2022 2023 2024 COVID-19 pandemic Demonstrated Durable Margin Profile (1) Adj. SG&A Margin excludes share-based compensation, certain legal and other regulatory matters, non-recurring IPO costs (2) Adj. EBITDA Margin excludes share-based compensation, certain legal and other regulatory matters, non-recurring IPO costs, and non-recurring settlement proceeds related to payor reimbursement 33 (3) See the financial information appendix to this presentation for a reconciliation of each Non-GAAP financial measure to its most directly comparable GAAP financial measure
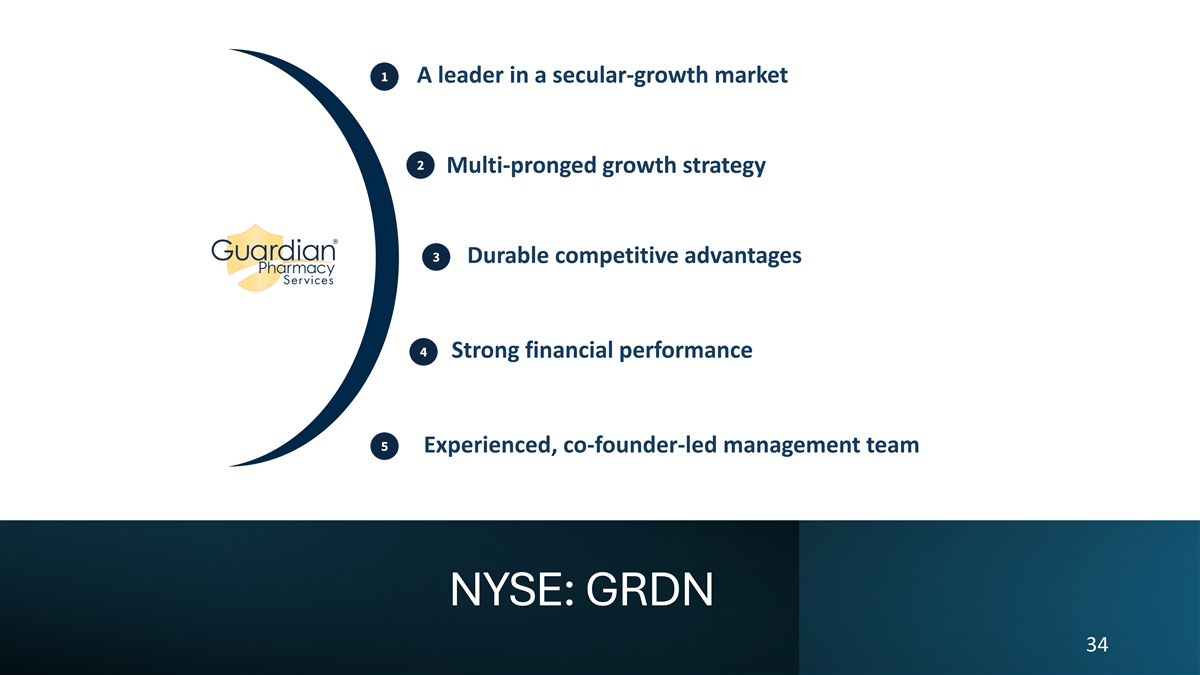
1 A leader in a secular-growth market 11 states 11 2 Multi-pronged growth strategy with > 40% Market Share 3 Durable competitive advantages 4 Strong financial performance 5 Experienced, co-founder-led management team NYSE: GRDN 34

Appendix Guardian Pharmacy Services 2025 | 35
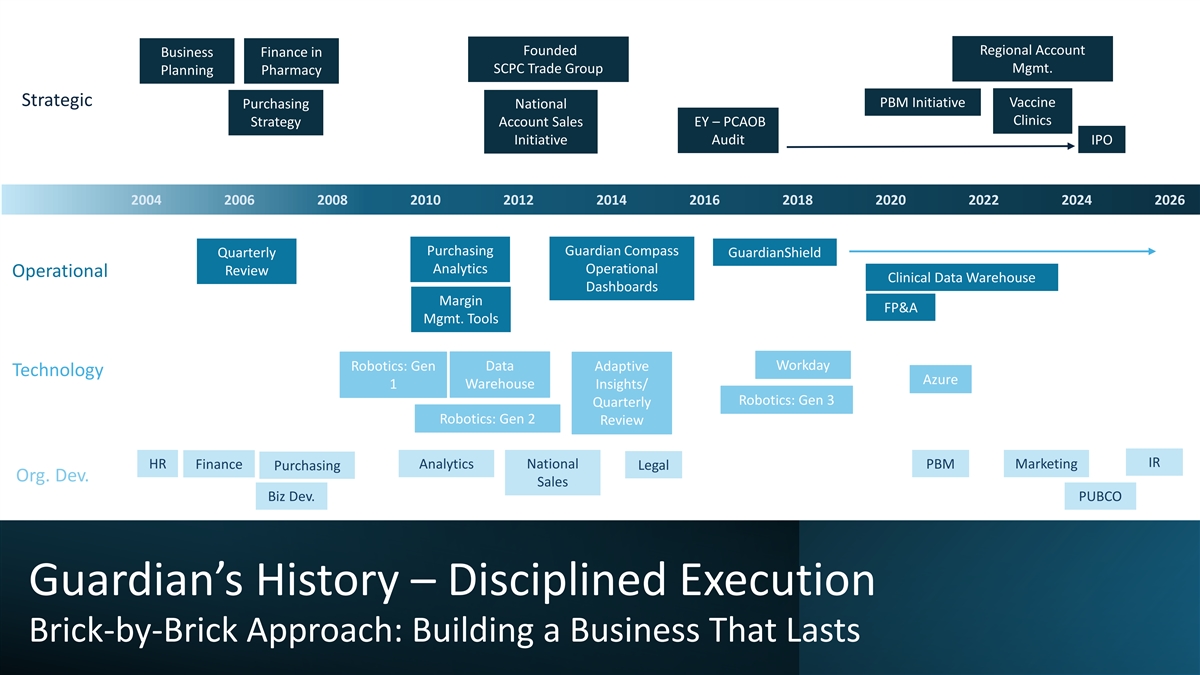
Founded Regional Account Business Finance in Mgmt. SCPC Trade Group Planning Pharmacy Strategic PBM Initiative Vaccine Purchasing National Clinics Strategy Account Sales EY – PCAOB Initiative Audit IPO 2004 2006 2008 2010 2012 2014 2016 2018 2020 2022 2024 2026 Purchasing Guardian Compass Quarterly GuardianShield Analytics Operational Review Operational Clinical Data Warehouse Dashboards Margin FP&A Mgmt. Tools Workday Robotics: Gen Data Adaptive Technology Azure 1 Warehouse Insights/ Robotics: Gen 3 Quarterly Robotics: Gen 2 Review IR HR Finance Analytics National PBM Marketing Purchasing Legal Org. Dev. Sales Biz Dev. PUBCO Guardian’s History – Disciplined Execution Brick-by-Brick Approach: Building a Business That Lasts
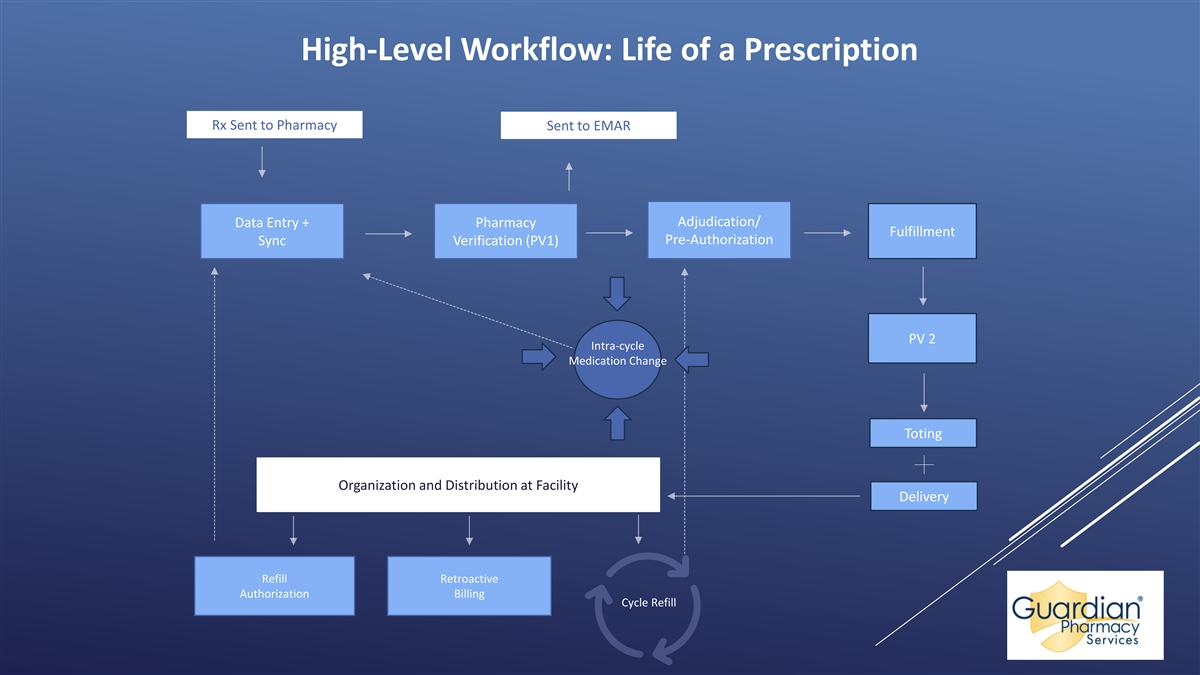
High-Level Workflow: Life of a Prescription Rx Sent to Pharmacy Sent to EMAR Adjudication/ Data Entry + Pharmacy Fulfillment Pre-Authorization Sync Verification (PV1) PV 2 Intra-cycle Medication Change Toting Organization and Distribution at Facility Delivery Refill Retroactive Authorization Billing Cycle Refill

Financial Appendix
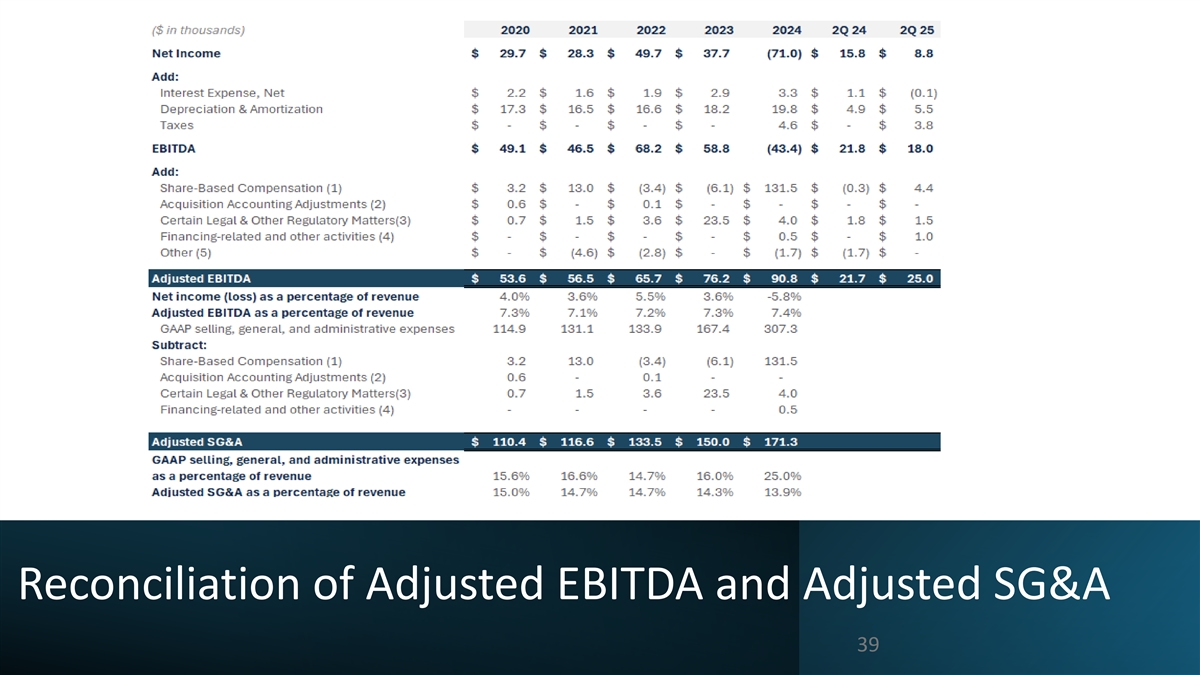
Reconciliation of Adjusted EBITDA and Adjusted SG&A 39
(1) Prior to the Corporate Reorganization and IPO, our share-based compensation expense primarily represented non-cash recognition of changes in the value of Restricted Interest Unit awards, which has historically been recorded as a liability using a cash settlement methodology as calculated on a quarterly basis. In connection with the Corporate Reorganization and IPO, Restricted Interest Unit awards associated with the Converted Subsidiaries and Guardian Pharmacy, LLC were converted into Common Units of Guardian Pharmacy, LLC, and the Common Units of Guardian Pharmacy, LLC were then converted into Class B common stock of the Company. Certain Restricted Interest Unit awards which converted into Class B common stock are subject to additional vesting in the form of a one-year service period ending on September 27, 2025 (“Unvested Class A and B common stock”). The unamortized balance as of September 27, 2024 to be recognized over the twelve-month period ending September 27, 2025 was $13.6 million. This conversion of Restricted Interest Units was treated as a modification, requiring the units to be marked to fair value on the modification date, resulting in us recognizing $125.7 million of incremental share-based compensation expense during the year ended December 31, 2024, including $3.5 million of amortization expense related to the Unvested Class A and B common stock. For the three months ended March 31, 2025, the Company recognized a total of $4.0 million of share-based compensation expense, of which $3.4 million relate to amortization expense for the Unvested Class A and B common stock, with the remainder related to the restricted stock units granted in February 2025. The unamortized share-based compensation expense associated with the Unvested Class A and B common stock is $6.7 million as of March 31, 2025, to be recognized evenly over the remainder of the twelve-month period ending September 27, 2025. (2) Represents fair value adjustments of expected contingent payments related to acquisitions. (3) Represents non-recurring attorney’s fees, settlement costs and other expenses associated with certain legal proceedings. The Company excludes such charges when evaluating operating performance because it does not incur such charges on a predictable basis and exclusion allows for consistent evaluation of operations. (4) Represents non-recurring costs associated with the transition to a public company and various financing-related activities. (5) Represents non-recurring proceeds from settlements related to payor reimbursement, which were recorded as revenue upon settlement. Footnotes to Reconciliation of Adjusted EBITDA 40