(i) Income Based Incentive Fee
The first component of the incentive fees, an income based incentive fee, is based on the Company’s Pre-Incentive Fee Net Investment Income Returns. “Pre-Incentive Fee Net Investment Income Returns” means, as the context requires, either the dollar value of, or percentage rate of return on, the value of the Company’s net assets at the end of the immediately preceding quarter from interest income, dividend income and any other income (including any other fees (other than fees for providing managerial assistance), such as commitment, origination, structuring, diligence and consulting fees or other fees that the Company receives from portfolio companies) accrued during the calendar quarter, minus the Company’s operating expenses accrued for the quarter (including the management fee, expenses payable under the Administration Agreement, and any interest expense or fees on any credit facilities or outstanding debt and dividends paid on any issued and outstanding preferred shares, but excluding the incentive fee and any shareholder servicing and/or distribution fees).
Pre-Incentive Fee Net Investment Income Returns include, in the case of investments with a deferred interest feature (such as original issue discount, debt instruments with payment-in-kind (“PIK”) interest and zero-coupon securities), accrued income that the Company has not yet received in cash. Pre-Incentive Fee Net Investment Income Returns excludes any realized capital gains, realized capital losses or unrealized capital appreciation or depreciation. The Company excludes the impact of expense support payments and recoupments from Pre-Incentive Fee Net Investment Income Returns. Shareholders may be charged a fee on an income amount that is higher than the income shareholders may ultimately receive.
Pre-Incentive Fee Net Investment Income Returns, expressed as a rate of return on the value of the Company’s net assets at the end of the immediately preceding quarter, is compared to a “hurdle rate” of return of 1.25% per quarter (5.0% annualized).
The Company pays the Adviser an income based incentive fee quarterly in arrears with respect to the Company’s Pre-Incentive Fee Net Investment Income Returns in each calendar quarter as follows:
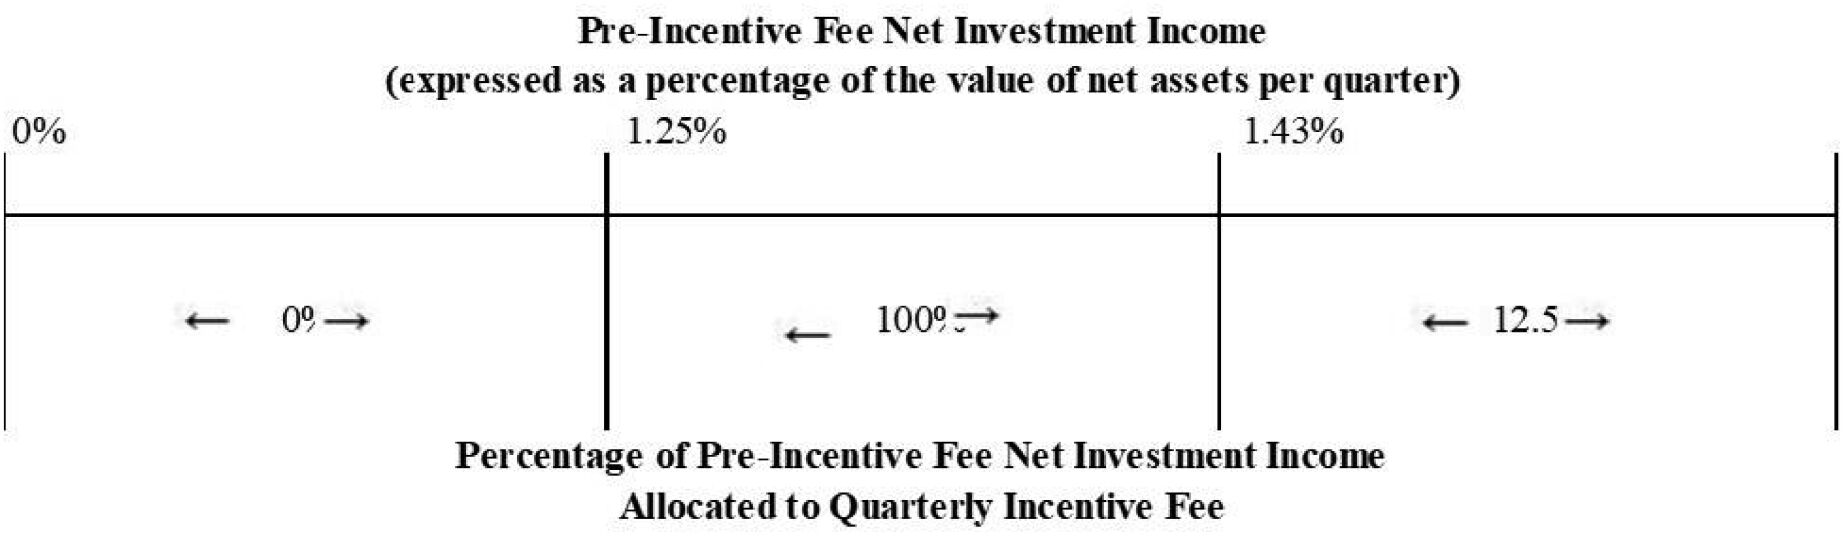
| • | no incentive fee based on Pre-Incentive Fee Net Investment Income Returns in any calendar quarter in which Pre-Incentive Fee Net Investment Income Returns do not exceed the hurdle rate of 1.25% per quarter (5.0% annualized); |
| • | 100% of the dollar amount of Pre-Incentive Fee Net Investment Income Returns with respect to that portion of such Pre-Incentive Fee Net Investment Income Returns, if any, that exceeds the hurdle rate but is less than a rate of return of 1.43% (5.72% annualized). The Company refers to this portion of the Pre-Incentive Fee Net Investment Income Returns (which exceeds the hurdle rate but is less than 1.43%) as the “catch-up.” This “catch-up” is meant to provide the Adviser with approximately 12.5% of Pre-Incentive Fee Net Investment Income Returns as if a hurdle rate did not apply if this net investment income exceeds 1.43% in any calendar quarter; and |
| • | 12.5% of the dollar amount of Pre-Incentive Fee Net Investment Income Returns, if any, that exceed a rate of return of 1.43% (5.72% annualized). This reflects that once the hurdle rate is reached and the catch-up is achieved, 12.5% of all Pre-Incentive Fee Net Investment Income Returns thereafter are allocated to the Adviser. |
29