
KKR Real Estate Select Trust Inc.
Annual Report
December 31, 2025
UNITED STATES
SECURITIES AND EXCHANGE COMMISSION
Washington, D.C. 20549
FORM N-CSR
CERTIFIED SHAREHOLDER REPORT OF REGISTERED
MANAGEMENT INVESTMENT COMPANIES
Investment Company Act file number: 811-23575
KKR Real Estate Select Trust Inc.
(Exact name of registrant as specified in charter)
30 Hudson Yards, New York, NY 10001
(Address of principal executive offices) (Zip code)
Lori Hoffman, Esq.
Megan Gaul
KKR Registered Advisor LLC
30 Hudson Yards
New York, NY 10001
(Name and address of agent for service)
Copies to:
Rajib Chanda, Esq.
Nathan D. Somogie, Esq.
Benjamin C. Wells, Esq.
Simpson Thacher & Bartlett LLP
900 G Street, N.W.
Washington, DC 20001
Registrant’s telephone number, including area code: (212) 750-8300
Date of fiscal year end: December 31
Date of reporting period: December 31, 2025
Form N-CSR is to be used by management investment companies to file reports with the Commission not later than 10 days after the transmission to stockholders of any report that is required to be transmitted to stockholders under Rule 30e-1 under the Investment Company Act of 1940 (17 CFR 270.30e-1). The Commission may use the information provided on Form N-CSR in its regulatory, disclosure review, inspection, and policymaking roles.
A registrant is required to disclose the information specified by Form N-CSR, and the Commission will make this information public. A registrant is not required to respond to the collection of information contained in Form N-CSR unless the Form displays a currently valid Office of Management and Budget (“OMB”) control number. Please direct comments concerning the accuracy of the information collection burden estimate and any suggestions for reducing the burden to Secretary, Securities and Exchange Commission, 450 Fifth Street, NW, Washington, DC 20549-0609. The OMB has reviewed this collection of information under the clearance requirements of 44 U.S.C. § 3507.
Item 1. Reports to Stockholders.
| (a) | Not applicable |
| (b) | A copy of the notice that is the subject of disclosure required by this Item is attached herewith. |
KKR Real Estate Select Trust Inc.
Annual Report
December 31, 2025

| 1 | ||||
| 6 | ||||
| 8 | ||||
| 11 | ||||
| 12 | ||||
| 13 | ||||
| 14 | ||||
| 15 | ||||
| 19 | ||||
| 36 | ||||
| Adjusted Funds from Operations and Funds Available for Distribution |
37 | |||
| 38 | ||||
| 40 | ||||
| 43 | ||||
| 44 | ||||
KKR Real Estate Select Trust Inc. (the “Fund”) publicly files its complete schedule of portfolio holdings with the Securities and Exchange Commission (the “Commission”) for the first and third quarters of each fiscal year on Form N-PORT, and the reports for the last month in each quarter are made publicly available on the Commission’s website at http://www.sec.gov.
A description of the policies and procedures that the Fund uses to determine how to vote proxies relating to portfolio securities, as well as information relating to how the Fund voted proxies relating to portfolio securities during the most recent period ended June 30, will be available (i) without charge, upon request, by calling 855-844-8655; and (ii) on the Commission’s website at http://www.sec.gov.
INFORMATION ABOUT THE FUND’S DIRECTORS
The Fund’s Statement of Additional Information includes information about the Fund’s Directors and is available without charge, upon request, by calling 855-844-8655 and by visiting the Commission’s website at www.sec.gov.

2025 began with strong momentum across real estate and credit markets, gave way to a period of heightened volatility following mid-year policy developments, and ended with what we believe are the early signs of a durable recovery. Throughout the year, we remained focused on disciplined execution and active asset management while positioning the portfolio to capitalize on what we believe is one of the most compelling real estate entry points in over a decade.
The first quarter of 2025 saw real exuberance across credit markets. Spreads tightened meaningfully, liquidity was abundant, and borrowers moved quickly to lock in financing. This constructive backdrop shifted in April following the announcement of tariffs tied to “Liberation Day,” which triggered volatility across rates and risk assets and caused transaction markets to pause as investors reassessed underwriting assumptions.
As the year progressed, uncertainty began to fade. Investors gained better visibility into the macro and policy environment, underwriting confidence improved, and activity resumed. Real estate credit markets led the recovery. U.S. CMBS finished the year at $125.8 billion(1), its highest issuance level since the global financial crisis, banks re-entered the lending landscape, insurance capital remained competitive, and overall real estate debt activity increased meaningfully.
Demand has continued to outpace supply in credit markets, reflecting growing lender confidence in current valuations and the relative value of real estate spreads, which remain wide compared to corporate credit. Combined with the Federal Reserve’s pivot toward easing, these dynamics meaningfully lowered the cost of capital. Borrowing costs declined approximately 75–100 basis points from their spring peaks, improving acquisition and refinancing economics.
This lower borrowing cost has been a catalyst for the equity transaction side, as aggregate transaction volume for U.S. commercial real estate increased roughly 25% year-over-year through the third quarter(2), with early signs of pricing recovery. Green Street’s Commercial Property Price Index was up approximately 2.3% year-over-year as of December 2025(3). Importantly, property-level fundamentals remained resilient: industrial demand continued to outpace supply, multifamily absorption stayed positive nationwide, and senior housing occupancy increased for the twelfth consecutive quarter.
Fund Performance Overview
KREST generated a +0.66% net total return for 2025 (Class I). Second-half results were supported by stabilizing property values, strong rental cash flows, contributions from our real estate credit portfolio, and meaningful asset management wins. Most notably, we executed a new long-term Amazon lease at Veteran’s Point (Industrial; Chicago, IL) in September with no downtime between leases and a 50%+ increase over prior rent.
These gains were partially offset by first-half mark-to-market valuation adjustments from KREST’s independent valuation process. These valuation movements reflected capital market volatility rather than asset-level underperformance. On the income side, same-store NOI increased over 3% year-over-year(4), and tax-efficient income remained a key contributor to total
1
return. As of December 31, 2025, KREST generated a 6.7% annualized net distribution rate (Class I) with 100% Return of Capital treatment for tax purposes(5).
Portfolio and Capital Deployment
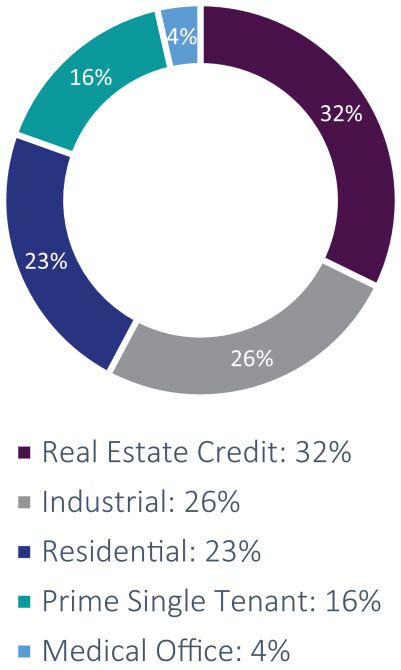
We remain committed to high-quality, needs-based real estate sectors. Our industrial portfolio retains approximately 30% embedded mark-to-market rent growth, and nearly half of the equity portfolio is triple-net leased, with investment-grade tenants comprising roughly two-thirds of those assets. Active asset management remains a core focus as we deploy capital and operating initiatives to grow cash flow.
As capital markets thawed throughout 2025, we believe the risk-return pendulum shifted back toward equity. While real estate credit offered superior risk-adjusted returns through early 2025, tighter spreads and more fully reset values made equity increasingly compelling. We were active deployers of capital in 2025, supported by positive net flows, investing approximately $450 million across real estate strategies. This included over $160 million in real estate equity through the Calhoun 75 Industrial and Senior Living Portfolio acquisitions, while maintaining capital flexibility for identified equity opportunities expected to close in early 2026.
Positioning for the Recovery
We believe today represents one of the most attractive environments for investing in high-quality private real estate in over a decade. Values remain meaningfully below 2022 peaks, rates are declining, construction starts are at decade lows, and demand remains durable. Demographics provide an additional tailwind, particularly in the senior housing segment, where the 80+ population is projected to grow significantly across many markets through 2030 and beyond.
KREST enters 2026 with a high-quality portfolio at below-market-rents, net positive capital flows, a flexible mandate across equity and credit, and the KREST Shareholder Priority Plan(6) supporting up to a $27.00 NAV per share in June 2027. We believe the recovery is underway and that KREST is well positioned to benefit through disciplined deployment, active asset management, and the depth of KKR’s operating platform.
As always, we thank you for your continued trust and partnership and encourage you to reach out to your KKR relationship manager with any questions.
Sincerely,
|
|
|
| ||
| Ralph Rosenberg |
Matt Salem |
Julia Butler | ||
| Chairman of the Board |
Vice Chairman of the Board |
Chief Executive Officer & President |
2
| KREST Performance Summary as of December 31, 20255 | ||||||||||||||||||
| Share Class | Net Distribution Rate5 |
3-Month Net Total Return |
6-Month Net Total Return |
2025 Net Total Return |
3-Yr.
Net (annualized) |
5-Yr.
Net (annualized) |
ITD Net Total (annualized) |
NAV per Share |
Inception Date | |||||||||
|
Class I |
6.66% | 0.91% | 1.18% | 0.66% | -2.63% | 4.74% | 5.28% | $23.45 | 7/2/2020 | |||||||||
|
Class U (No Sales Load) |
5.81% | 0.69% | 0.74% | -0.19% | -3.45% | - | 1.98% | $23.45 | 7/1/2021 | |||||||||
|
Class D7 |
6.41% | 0.84% | 1.05% | 0.40% | -2.87% | - | -1.61% | $23.45 | 3/4/2022 | |||||||||
|
Class S (No Sales Load) |
5.81% | 0.69% | 0.74% | -0.20% | -3.45% | - | -3.81% | $23.45 | 9/9/2022 | |||||||||
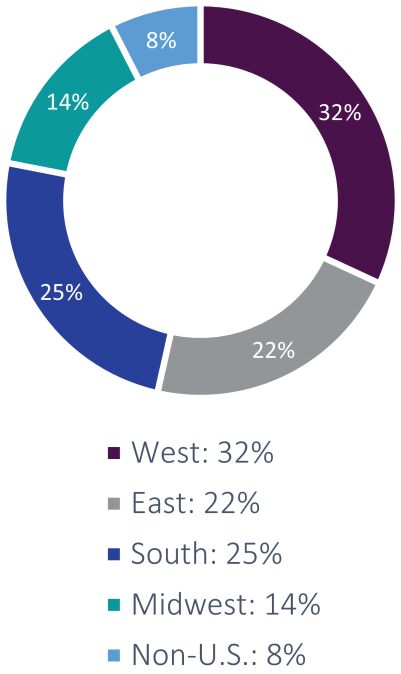
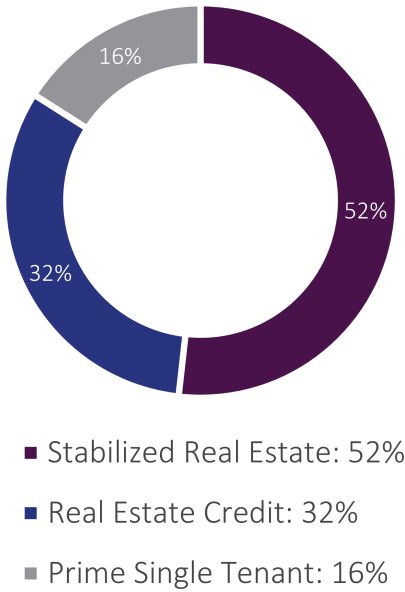
| KREST Portfolio Summary as of December 31, 2025 | ||||||||||||||||
| $1.5 billion | $1.5 billion | 0% | ||||
| Fund Statistics |
Total Assets (GAAP) |
Net Asset Value | Fund-Level Gross Leverage |
| $3.2 billion | ||||||||
| Gross Property Value | 84 | 98% | 43% | |||||
| Real Estate Metrics | (inc. unconsolidated | Total Properties | Occupancy Rate | Combined Net Leverage | ||||
| subsidiaries) | (inc. unconsolidated subsidiaries) |
| PROPERTY SECTOR | GEOGRAPHY | INVESTMENT STRATEGY | ||
|
|
| ||
Notes:
All figures are approximate and as of December 31, 2025, unless otherwise indicated. The terms “we”, “us” and “our” refer to KREST with reference to portfolio and performance data. In all other instances, including with respect to current and forward-looking views and opinions of the market and KREST’s portfolio and performance positioning, as well as the experience of KREST’s management team, these terms refer to KREST’s adviser, KKR Registered Advisor LLC, which is part of the real estate group of Kohlberg Kravis Roberts & Co. L.P. (together with its affiliates, “KKR”), a leading global investment firm.
Certain information contained in this material constitutes “forward-looking statements” within the meaning of the federal securities laws and the Private Securities Litigation Reform Act of 1995. These forward-looking statements can be identified by the use of forward-looking terminology, such as “outlook,” “indicator,” “believes,” “expects,” “potential,” “continues,” “identified,” “may,” “will,” “should,” “seeks,” “approximately,” “predicts,” “intends,” “plans,” “estimates,” “anticipates”, “confident,” “conviction” or the negative versions of these words or other comparable words thereof. These may include KREST’s financial estimates and their underlying assumptions, statements about plans, objectives and expectations with respect to future operations, statements with respect to acquisitions, statements regarding future performance, and
3
statements regarding identified but not yet closed acquisitions. Such forward-looking statements are inherently uncertain and there are or may be important factors that could cause actual outcomes or results to differ materially from those indicated in such statements. KREST believes these factors also include but are not limited to those described under the section entitled “Risk Factors” in its prospectus and most recent annual report, and any such updated factors included in its periodic filings with the Securities and Exchange Commission (the “SEC”), which are accessible on the SEC’s website at www.sec.gov. These factors should not be construed as exhaustive and should be read in conjunction with the other cautionary statements that are included in the annual report (or KREST’s prospectus and other filings). Except as otherwise required by federal securities laws, KREST undertakes no obligation to publicly update or revise any forward-looking statements, whether as a result of new information, future developments or otherwise. Percentages shown may not total 100% due to rounding.
| 1. | Source: Kroll Bond Rating Agency (KBRA). |
| 2. | Source: Altus Group. |
| 3. | Source: Green Street Commercial Property Price Index (CPPI). |
| 4. | As of November 30, 2025. |
| 5. | The Fund employs leverage, which increases the volatility of investment returns and subjects the Fund to magnified losses if investments decline in value. Diversification of portfolio holdings does not assure a profit or protect against loss in a declining market. The Fund is classified as “non-diversified” under the Investment Company Act of 1940, and is not intended to be a complete investment program. Past performance does not guarantee future results. There can be no guarantee that current trends will continue. The investment return and principal value of an investment will fluctuate so that an investor’s shares, when repurchased, may be worth more or less than their original cost and current performance may be lower or higher than the performance data quoted. Class I information is presented above; please refer to www.krest.reit for additional information, including performance details for Class U, Class S and Class D shares. For important information regarding the Net Distribution Rate, please refer to the Glossary of Terms. Class I Inception Date is July 2, 2020. |
| 6. | KREST Shareholder Priority Plan: On June 4, 2024, KKR Alternative Assets LLC (“KAA”) contractually committed to the Fund to continue to hold approximately 7.7 million of KREST Class I shares currently owned by KAA, representing approximately $181 million based on the Fund’s NAV as of December 31, 2025 (the “Support Shares”) through June 1, 2027 and, to the extent necessary, contribute such shares to the Fund to support a NAV per share of $27.00 for each class on such date (the “Shareholder Priority Plan”). If the contribution of the Support Shares is not sufficient to reach a NAV per share of $27.00, KAA will contribute all such Support Shares to support KREST’s NAV per share on such date. While the Shareholder Priority Plan is a contractual obligation to support the Fund’s NAV per share, there is no guarantee the contribution of the Support Shares will be sufficient to achieve a $27.00 NAV per share on June 1, 2027. For the avoidance of doubt, KAA is not obligated to contribute shares prior to June 1, 2027, and KAA is not obligated to contribute any of the Support Shares if the NAV per share for each class equals or exceeds $27.00 per share on June 1, 2027. If KAA were to effect the Shareholder Priority Plan today it would contribute 7.7 million shares (out of the total 7.7 million shares agreed to be contributed) to KREST, which would result in a NAV per share of $26.78 per share for each class. KAA’s allocation of $50 million in new capital investment in KREST along with any future investments are not subject to subordination and/or cancellation. |
| 7. | On May 11, 2023, KREST’s outstanding Class D shares were converted to Class I shares, and there were no outstanding Class D shares between May 12, 2023 and September 18, 2023. For periods including May 11, 2023 through September 18, 2023, which includes the monthly, 3-month, YTD, and ITD periods, net returns presented for Class D are calculated based on actual performance for Class I plus the impact of the Servicing Fee of 0.25% per annum applicable to Class D shares, as detailed in the Fund’s Prospectus. Commissions, fees and expenses are identical between Class D and Class I shares, with the exception of the Servicing Fee. For purposes of performance calculation, Class D inception date reflects the original share class inception date of March 4, 2022. Class D re-issue inception date is September 19, 2023. There have been no changes to the Class D share class specifics from inception to re-issuance. |
Glossary of Terms:
Annualized ITD Net Return and Net Return by Period: Reflects the percentage change in NAV per share plus the applicable distributions per share for the applicable period. Assumes the reinvestment of distributions pursuant to the Fund’s distribution reinvestment plan. Past performance is historical and not a guarantee of future results. Performance since inception through date indicated. Class I inception date is July 2, 2020; Class U inception date is July 1, 2021; Class D inception date is March 4, 2022; Class S inception date is September 9, 2022. On May 11, 2023, KREST’s outstanding Class D shares were converted to Class I and there were no outstanding Class D shares between May 12, 2023 and September 18, 2023. Class D re-issue inception date is September 19, 2023. There have been no changes to the Class D shares terms and offering provisions from inception to re-issuance. ITD performance number is annualized if time period is longer than one year.
Net Distribution Rate: Reflects the annualized monthly dividend for December 2025 divided by the month-end NAV for the respective share class. KREST intends to make distributions necessary to maintain its qualification as a real estate investment trust. However, there is no assurance that we will pay distributions in any particular amount, if at all. Any distributions we make will be at the discretion of our board of directors. KREST may pay distributions from sources other than cash flow from operations, including without limitations, the sale of assets, borrowings, return of capital or offering proceeds. For the year ended December 31, 2025, 81% of KREST’s distributions were funded through adjusted funds from operations (“AFFO”). The Fund defines AFFO as the increase in net assets applicable to common stockholders from operations (calculated in accordance with GAAP), excluding (i) the change in net unrealized (appreciation) depreciation of investments, (ii) amortization premium (accretion of discount) on real estate securities, (iii) amortization of deferred origination fees on real estate loans, (iv) amortization of deferred financing costs, (v) management fees, incentive fees, and director fees paid in shares of the Fund and (vi) realized (gains) losses, (vii) stockholder specific expenses and including undistributed income attributable to the Fund’s unconsolidated subsidiaries. This statement is not an indication of the tax treatment of any KREST distributions. Stockholders will be informed of the tax characteristics of any distributions after the close of KREST’s fiscal year. For the 2025 tax year, 100% of KREST’s distributions were classified as Return of
4
Capital (“ROC”). As of December 31, 2025, the Class I net distribution rate is 6.66%, the Class U net distribution rate is 5.81%, the Class D net distribution rate is 6.41% and the Class S net distribution rate is 5.81%.
Gross Property Value: Represents real estate and other assets held by KREST’s unconsolidated subsidiaries, including any portion not owned by the Fund. As of December 31, 2025, the Fund’s economic interest in such joint ventures ranges from 50.5% to 99.5%. For financial reporting purposes, KREST includes the fair value of its equity interests in these subsidiaries in its total assets. As of December 31, 2025, the estimated fair value of the Fund’s net equity interest in these subsidiaries is $954.6 million.
Fund-Level Gross Leverage: Refers only to borrowings made by the Fund and its consolidated subsidiaries. The Fund may employ leverage in the form of loans, preferred stock, reverse repurchase agreements and/or other instruments. As of December 31, 2025, KREST had no borrowings outstanding under its credit facility and no Fund-level leverage outstanding.
Combined Net Leverage: Is a calculation provided to illustrate the combined leverage of the Fund and the Weighted Average LTV of the Fund’s unconsolidated subsidiaries. It is calculated as the ratio of i) the Fund’s borrowings, less cash and subscription proceeds receivable, plus the Equity-Weighted Unconsolidated Debt of the Fund’s investments divided by ii) the Fund’s total assets plus the Equity-Weighted Unconsolidated Debt of the Fund’s investments.
Equity-Weighted Unconsolidated Debt: Is a measure of the non-recourse property level financing of the Fund’s investments weighted by the Fund’s equity exposure in such investments, calculated as the Fund’s total investments divided by one minus the Weighted Average LTV, with the result then multiplied by the Weighted Average LTV.
Weighted Average LTV: Is the loan-to-value ratio of each of the Fund’s investments (whether consolidated or unconsolidated) averaged with a weighting based on the value of the Fund’s equity in each such investment.
Properties and Occupancy: Are reported based on the equity portion of the KREST portfolio. Excludes equity investment deposits and Real Estate Credit, which includes private real estate debt, including securities, and preferred equity. Property count excludes single family rental homes. Occupancy excludes single family rental homes that have been acquired and/or renovated, as applicable, within 3 months or less.
Past performance does not guarantee future results. There can be no guarantee that current trends will continue. The investment return and principal value of an investment will fluctuate so that an investor’s shares, when repurchased, may be worth more or less than their original cost and current performance may be lower or higher than the performance data quoted.
5
Performance Information (Unaudited)
| Average Annual Total Returns for the Periods Ended December 31, 2025 | ||||||||
| 1 year | 3 year (annualized) |
5 year (annualized) |
Since Inception(1) (annualized) | |||||
| KREST’s Class I |
0.66% | -2.63% | 4.74% | 5.28% | ||||
| NFI - ODCE Index |
2.92% | -4.25% | 2.51% | 2.53% | ||||
| KREST’s Class U |
-0.19% | -3.45% | N/A | 1.98% | ||||
| NFI - ODCE Index |
2.92% | -4.25% | N/A | 1.54% | ||||
| KREST’s Class D |
0.40% | -2.87% | N/A | -1.61%(2) | ||||
| NFI - ODCE Index |
2.92% | -4.25% | N/A | -3.56% | ||||
| KREST’s Class S |
-0.20 % | -3.45% | N/A | -3.81% | ||||
| KREST’s Class S (with sales charge)(3) |
-3.69% | -4.59% | N/A | -4.84% | ||||
| NFI - ODCE Index |
2.92% | -4.25% | N/A | -5.48% | ||||
| (1) | Class I Shares commenced operations on July 2, 2020; Class U Shares commenced operations on July 1, 2021; Class D Shares commenced operations on March 4, 2022; and Class S Shares commenced operations on September 9, 2022. |
| (2) | Class D Shares commenced operations on March 4, 2022. On May 11, 2023, all outstanding Class D Shares were converted to Class I Shares. Class D Shares were reopened on September 19, 2023. |
| (3) | The returns of Class S Shares reflect a deduction for maximum sales charge of up to 3.00% of the offering price and a dealer manager fee of 0.50%. |
The Fund’s registration statement for shares of its common stock, including Class I Shares, Class U Shares, Class D Shares and Class S Shares, was declared effective on May 18, 2021. Benchmark performance is from the original commencement date of each respective Class only and is not the commencement date of the benchmark itself.
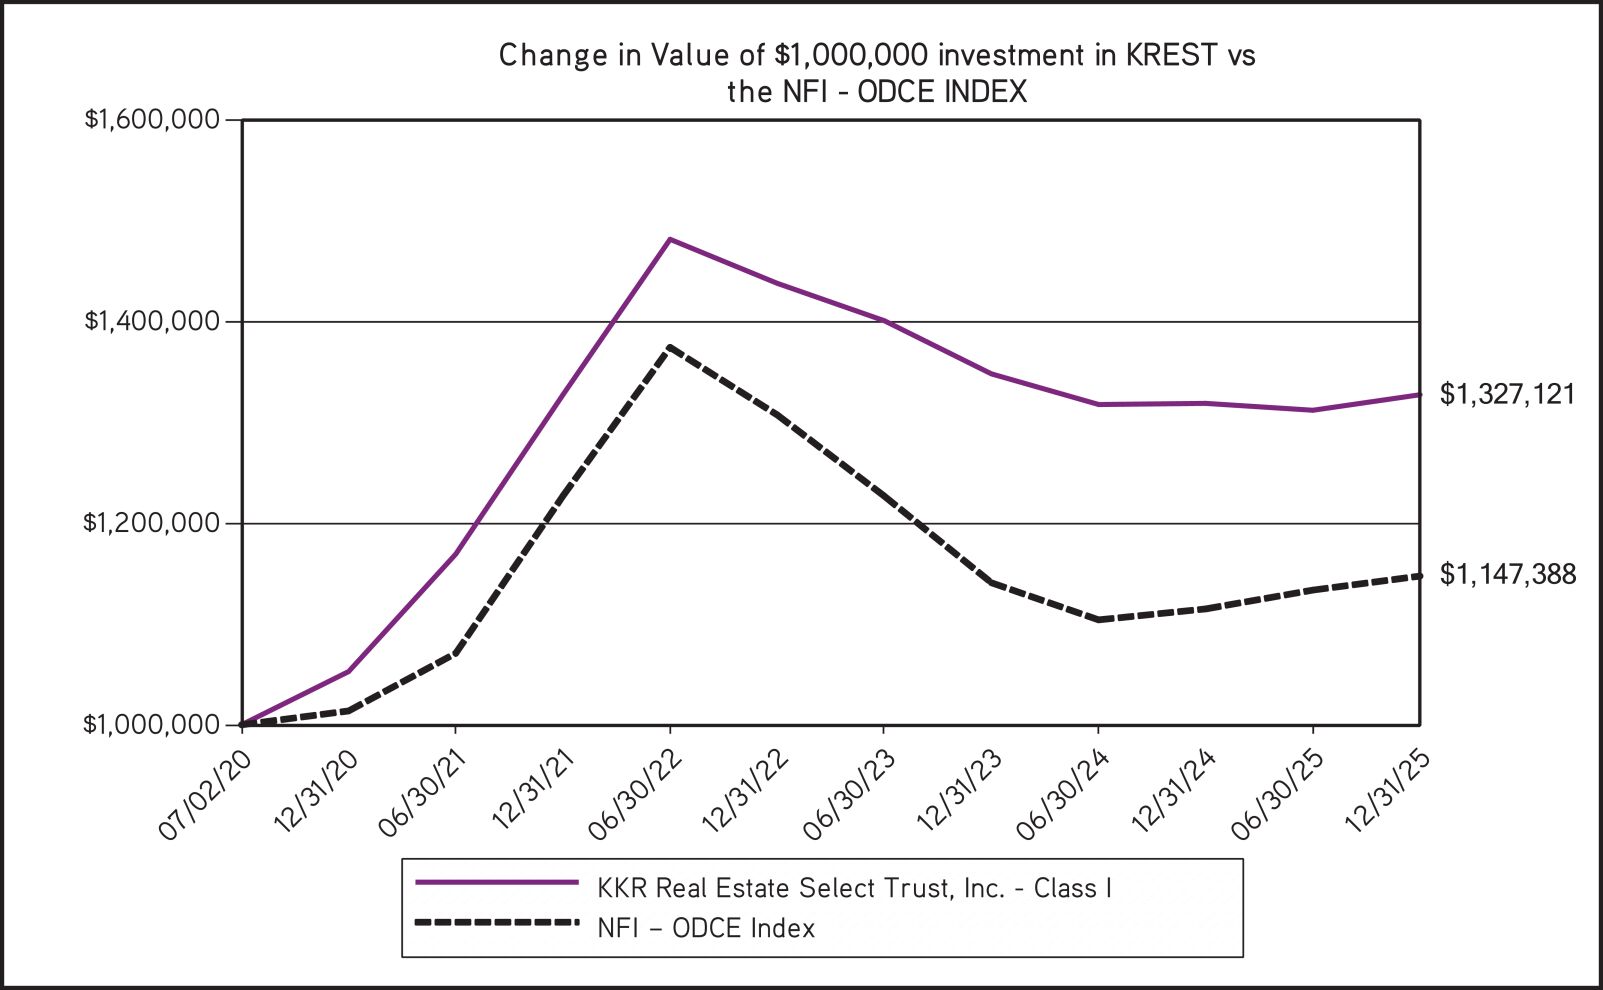
The graph reflects the performance of a hypothetical $1,000,000 investment in Class I Shares of the Fund for the period from inception through December 31, 2025. The performance shown in the table of average annual total returns is for each share class from their respective inception dates through December 31, 2025. Performance data for Class U Shares, Class D Shares and
6
Class S Shares will vary due to differences in fees and charges. The Fund’s performance reflects reinvestments of all dividends and capital gains distributions, if any.
The Fund’s primary investment objective is to provide attractive current income with a secondary objective of long-term capital appreciation. While the Fund does not have a primary benchmark, we may evaluate performance as compared to that of the NFI-ODCE. The NFI-ODCE, short for NCREIF Fund Index – Open End Diversified Core Equity, is an index of investment returns reporting on both a historical and current basis, the results of 38 open-end, commingled private funds that are pursuing, or did pursue in the case of liquidated funds, a core real estate investment strategy. The NFI-ODCE Index is capitalization-weighted and measurement is time-weighted. It is impossible to invest directly in an index. Given differences in the Fund’s investment strategies relative to that of the NFI-ODCE, which may include but are not limited to property sector selection, geographic market selection, property-level risk profile, allocations to real estate credit and the use of leverage by certain of the Fund’s unconsolidated subsidiaries, deviation in the Fund’s performance relative to the NFI-ODCE may be expected.
Performance data shown represents past performance. Current performance may be lower or higher than the performance data quoted above. Past performance is not predictive of future performance. Investment return and principal value will fluctuate so that shares of the Fund when repurchased may be worth more or less than their original cost. The table does not reflect the deduction of taxes that a stockholder would pay on Fund distributions or redemption of Fund shares.
7
Consolidated Schedule of Investments
| Value | ||||||||
| Real Estate Equity (a) (b)—65.5% |
||||||||
| Industrial - AIP-PMR 3-Pack |
$ | 63,823,522 | ||||||
| Industrial - Calhoun 75 |
48,859,171 | |||||||
| Industrial - Charleston |
34,507,674 | |||||||
| Industrial - Lakemont Blvd |
11,844,219 | |||||||
| Industrial - Lambert Farms |
34,295,124 | |||||||
| Industrial - MB Parts Korea DC |
36,872,258 | |||||||
| Industrial - Rickenbacker Logistics Park |
44,317,213 | |||||||
| Industrial - S. 500 Whitestown |
17,998,780 | |||||||
| Industrial - Veterans Point |
66,989,663 | |||||||
| Medical Office - Southeastern Portfolio I |
49,985,125 | |||||||
| Prime ST - 300 Pine |
56,394,325 | |||||||
| Prime ST - El Camino Real |
26,845,644 | |||||||
| Prime ST - HQ @ First |
141,871,810 | |||||||
| Residential - Main Line 4-Pack |
35,171,117 | |||||||
| Residential - National Portfolio 1a |
6,866,001 | |||||||
| Residential - National Portfolio 1b |
87,961,558 | |||||||
| Residential - Phoenix Senior Living Portfolio |
46,343,113 | |||||||
| Residential - Presidential City |
75,020,583 | |||||||
| Residential - The Beach House Apartments |
33,436,533 | |||||||
| Residential - Tokyo Multifamily Portfolio I |
35,170,875 | |||||||
|
|
|
|||||||
| Total Real Estate Equity (Cost — $1,111,216,738) |
954,574,308 | |||||||
|
|
|
|||||||
| Principal Amount | ||||||||
| Real Estate Debt — 31.2% |
||||||||
| Investments in Real Estate Loans —4.6% |
||||||||
| Chicago NEMA, 7.000%, 8/26/2026 (a)(c) |
$ | 65,000,000 | 67,467,016 | |||||
|
|
|
|||||||
| Total Investments in Real Estate Loans (Cost — $67,276,008) |
67,467,016 | |||||||
|
|
|
|||||||
| Real Estate Securities —26.6% |
||||||||
| Commercial Mortgage-backed Securities —26.6% |
||||||||
| BOCA Commercial Mortgage Trust 2025-BOCA C, 6.000% (SOFR + 2.150%), 12/15/2042 (d)(e) |
10,000,000 | 10,035,252 | ||||||
| BX Commercial Mortgage Trust 2021-21M E, 6.035% (SOFR + 2.285%), 10/15/2036 (d)(e) |
7,042,700 | 7,039,524 | ||||||
| BX Commercial Mortgage Trust 2021-21M F, 6.483% (SOFR + 2.733%), 10/15/2036 (d)(e) |
7,000,000 | 6,990,813 | ||||||
| BX Commercial Mortgage Trust 2021-XL2 E, 5.710% (SOFR + 1.960%), 10/15/2038 (d)(e) |
11,642,400 | 11,639,449 | ||||||
| BX Commercial Mortgage Trust 2021-XL2 F, 6.109% (SOFR + 2.359%), 10/15/2038 (d)(e) |
7,378,000 | 7,375,581 | ||||||
| BX Commercial Mortgage Trust 2021-XL2 G, 6.707% (SOFR + 2.957%), 10/15/2038 (d)(e) |
2,100,000 | 2,099,378 | ||||||
| BX Commercial Mortgage Trust 2021-XL2 J, 7.754% (SOFR + 4.004%), 10/15/2038 (d)(e) |
36,067,525 | 36,232,368 | ||||||
| BX Commercial Mortgage Trust 2022-LP2 G, 7.856% (SOFR + 4.106%), 2/15/2039 (d)(e) |
10,500,000 | 10,513,106 | ||||||
| BX Commercial Mortgage Trust 2024-GPA2 E, 7.290% (SOFR + 3.540%), 11/15/2041 (d)(e) |
18,583,000 | 18,631,803 | ||||||
| BX Commercial Mortgage Trust 2024-GPA3 B, 5.392% (SOFR + 1.642%), 12/15/2039 (d)(e) |
11,237,224 | 11,277,483 | ||||||
| BX Commercial Mortgage Trust 2025-JDI B, 5.300% (SOFR + 1.550%), 11/15/2042 (d)(e) |
10,000,000 | 10,031,684 | ||||||
| BX Trust 2025-DELC F, 7.907% (SOFR + 3.950%), 12/15/2042 (d)(e) |
20,000,000 | 20,102,808 | ||||||
| BX Trust 2025-DIME F, 7.450% (SOFR + 3.700%), 2/15/2035 (d)(e) |
43,248,000 | 43,273,923 | ||||||
| BX Trust 2025-DIME JRR, 9.350% (SOFR + 5.600%), 2/15/2035 (a)(d)(e) |
8,000,000 | 7,999,896 | ||||||
| BX Trust 2025-DIME KRR, 9.350% (SOFR + 5.600%), 2/15/2035 (a)(d)(e) |
2,000,000 | 1,999,974 | ||||||
See accompanying notes to consolidated financial statements.
8
| Principal Amount | Value | |||||||
| BX Trust 2025-LUNR A, 5.250% (SOFR + 1.500%), 6/15/2040 (d)(e) |
$ | 2,663,041 | $ | 2,670,229 | ||||
| BX Trust 2025-LUNR B, 5.600% (SOFR + 1.850%), 6/15/2040 (d)(e) |
13,315,204 | 13,355,526 | ||||||
| DBC 2025-DBC Mortgage Trust A, 5.101% (SOFR + 1.350%), 11/15/2042 (d)(e) |
30,000,000 | 30,066,048 | ||||||
| DBC 2025-DBC Mortgage Trust B, 5.351% (SOFR + 1.600%), 11/15/2042 (d)(e) |
20,000,000 | 20,059,452 | ||||||
| Fontainebleau Miami Beach Mortgage Trust 2024-FBLU F, 8.000% (SOFR + 4.250%), 12/15/2039 (d)(e) |
10,000,000 | 10,089,190 | ||||||
| FS Trust 2024-HULA G, 8.687% (SOFR + 4.937%), 8/15/2039 (d)(e) |
9,400,000 | 9,532,925 | ||||||
| Hawaii Hotel Trust 2025-MAUI F, 7.939% (SOFR + 4.189%), 3/15/2042 (d)(e) |
10,000,000 | 9,827,833 | ||||||
| Hawaii Hotel Trust 2025-MAUI JRR, 9.537% (SOFR + 5.787%), 3/15/2042 (a)(d) |
10,600,000 | 10,594,870 | ||||||
| Hawaii Hotel Trust 2025-MAUI KRR, 9.537% (SOFR + 5.787%), 3/15/2042 (a)(d) |
2,650,000 | 2,648,717 | ||||||
| LBA Trust 2024-7IND E, 7.340% (SOFR + 3.590%), 10/15/2041 (d)(e) |
5,412,720 | 5,428,211 | ||||||
| SCG Trust 2025-SNIP, 5.250% (SOFR + 1.500%), 9/15/2042 (d)(e) |
34,000,000 | 34,105,203 | ||||||
| SCG Trust 2025-SNIP, 5.400% (SOFR + 1.650%), 9/15/2042 (d)(e) |
18,000,000 | 18,066,859 | ||||||
| WCORE Commercial Mortgage Trust 2024-CORE D, 6.690% (SOFR + 2.940%), 11/15/2041 (d)(e) |
15,000,000 | 15,118,363 | ||||||
|
|
|
|||||||
| Total Commercial Mortgage-backed Securities (Cost — $384,678,558) |
386,806,468 | |||||||
|
|
|
|||||||
| Total Real Estate Debt (Cost — $451,954,566) |
454,273,484 | |||||||
|
|
|
|||||||
| Total Investments (Cost — $1,563,171,304) — 96.7% |
1,408,847,792 | |||||||
|
|
|
|||||||
| Shares | ||||||||
| Money Market Fund — 2.0% |
||||||||
| U.S. Government Securities —2.0% |
||||||||
| UBS Select Government Institutional Fund, 3.67% (f) |
29,099,687 | 29,099,687 | ||||||
|
|
|
|||||||
| Total Money Market Fund (Cost — $29,099,687) — 2.0% |
29,099,687 | |||||||
|
|
|
|||||||
| Total Investments Including Money Market Fund (Cost — $1,592,270,991) — 98.7% |
1,437,947,479 | |||||||
|
|
|
|||||||
| Other Assets in Excess of Liabilities — 1.3% |
18,648,362 | |||||||
|
|
|
|||||||
| Total Net Assets Applicable to Common Stockholders — 100.0% |
$ | 1,456,595,841 | ||||||
|
|
|
|||||||
| (a) | Level 3 asset. See Note 3. |
| (b) | Affiliated investments. All of the Fund’s investments in real estate equity are joint ventures entered into by one of the Fund’s operating entities and secured by real estate owned by such operating entities. The Fund’s current economic interest in such joint ventures ranges from 50.5% to 99.5% of the venture. In these arrangements the Fund is subject to shared control arrangements where the consents of both the Fund and the joint venture party are required for all material decisions. |
| (c) | Upon full repayment of the loan, the borrower shall pay the Fund an exit fee of up to $3.5 million, accruing monthly. |
| (d) | Variable rate investments. Coupon rate, reference index and spread shown is the rate in effect at December 31, 2025. |
| (e) | Securities exempt from registration pursuant to Rule 144A under the Securities Act of 1933, as amended. These securities may only be resold to qualified institutional buyers in transactions exempt from registration. At December 31, 2025 these securities amounted to $373,562,881 or 25.6% of net assets. |
| (f) | Rate disclosed is the 7-day yield at December 31, 2025. |
At December 31, 2025, the Fund had the following open forward foreign currency contracts:
| Currency Purchased |
Currency Sold |
Counterparty | Settlement Date |
Unrealized Appreciation | ||||||||||||||
| USD |
2,072,933 | JPY | 313,500,000 | GSC | 12/07/2026 | $ | 18,563 | |||||||||||
| USD |
29,183,078 | KRW | 34,377,666,350 | SCB | 12/07/2026 | 4,933,047 | ||||||||||||
| USD |
2,879,862 | KRW | 4,183,000,000 | SCB | 12/07/2026 | (51,038 | ) | |||||||||||
| USD |
1,183,792 | JPY | 126,500,000 | GSC | 12/03/2029 | 262,815 | ||||||||||||
| USD |
36,632,111 | JPY | 3,965,000,000 | MBL | 12/03/2029 | 7,823,901 | ||||||||||||
|
|
|
| ||||||||||||||||
| $ | 12,987,288 | |||||||||||||||||
|
|
|
| ||||||||||||||||
See accompanying notes to consolidated financial statements.
9
| Abbreviations: | ||||||
| GSC |
- | Goldman Sachs & Co. | ||||
| JPY |
- | Japanese Yen | ||||
| KRW |
- | Korean Won | ||||
| MBL |
- | Macquarie Bank Limited | ||||
| SCB |
- | Standard Chartered Bank | ||||
| SOFR |
- | Secured Overnight Financing Rate | ||||
| USD |
- | United States Dollar | ||||
See accompanying notes to consolidated financial statements.
10
Consolidated Statement of Assets and Liabilities
| Assets |
||||
| Investments, at fair value (cost $1,563,171,304) |
$ | 1,408,847,792 | ||
| Cash |
30,273,791 | |||
| Deferred financing costs |
1,896,679 | |||
| Dividend and interest receivable |
1,658,335 | |||
| Due from Adviser |
682,153 | |||
| Forward foreign currency contracts |
13,038,326 | |||
| Receivable for Fund shares sold |
5,411,490 | |||
| Other assets |
2,803,146 | |||
|
|
|
|||
| Total Assets |
$ | 1,464,611,712 | ||
|
|
|
|||
| Liabilities |
||||
| Distributions payable to Common Stockholders |
4,906,284 | |||
| Distribution and servicing fees payable |
505,799 | |||
| Administration and custody fees payable |
458,812 | |||
| Legal fees payable |
374,973 | |||
| Audit and tax fees payable |
269,634 | |||
| Directors’ fees payable |
178,124 | |||
| Forward foreign currency contracts |
51,038 | |||
| Other accrued expenses |
1,271,207 | |||
|
|
|
|||
| Total Liabilities |
$ | 8,015,871 | ||
|
|
|
|||
| Net Assets Applicable to Common Stockholders |
$ | 1,456,595,841 | ||
|
|
|
|||
| Net Assets Applicable to Common Stockholders: |
||||
| Capital stock, $0.001 par value |
$ | 62,117 | ||
| Paid-in capital ($0.001 par value, 500 million shares authorized) |
1,468,833,682 | |||
| Total distributable (loss) |
(12,299,958 | ) | ||
|
|
|
|||
| Total Net Assets Applicable to Common Stockholders |
$ | 1,456,595,841 | ||
|
|
|
|||
| Net Asset Value Per Share(1): |
||||
| Class I : Net Asset Value per share ($831,634,992 / 35,462,269 shares outstanding) |
$ | 23.45 | ||
|
|
|
|||
| Class U : Net Asset Value per share ($624,749,080 / 26,645,242 shares outstanding) |
$ | 23.45 | ||
|
|
|
|||
| Class D : Net Asset Value per share ($169,360 / 7,223 shares outstanding) |
$ | 23.45 | ||
|
|
|
|||
| Class S : Net Asset Value per share ($42,409 / 1,808 shares outstanding) |
$ | 23.45 | ||
|
|
|
|||
| Maximum Offering Price Per Share: |
||||
| Class S (based on a net asset value per share of $23.45/96.50%)(2) |
$ | 24.30 | ||
|
|
|
|||
(1) Please refer to Note 6 for a discussion of distribution and servicing fees incurred by each class of shares.
(2) A maximum sales charge of up to 3.00% of the offering price and a dealer manager fee of 0.50%.
See accompanying notes to consolidated financial statements.
11
Consolidated Statement of Operations
For the Year Ended December 31, 2025
| Investment Income |
||||
| Dividend income (net of foreign taxes withheld $700,983) |
$ | 39,985,743 | ||
| Interest income |
31,895,950 | |||
|
|
|
| ||
| Total Investment Income |
71,881,693 | |||
|
|
|
| ||
| Expenses |
||||
| Advisory fees |
16,236,646 | |||
| Interest expense |
1,825,217 | |||
| Legal fees |
2,684,095 | |||
| Administration and custody fees |
1,478,335 | |||
| Directors’ fees |
647,910 | |||
| Audit and tax fees |
526,481 | |||
| Transfer agent fees |
627,268 | |||
| Insurance |
447,700 | |||
| Distribution and servicing fees |
||||
| Class U |
5,453,364 | |||
| Class D |
420 | |||
| Class S |
362 | |||
| Incentive fees |
6,459,411 | |||
| Other expenses |
1,471,810 | |||
|
|
|
| ||
| Total expenses |
37,859,019 | |||
|
|
|
| ||
| Less: Expenses reimbursed by the Adviser |
(1,251,364) | |||
|
|
|
| ||
| Net Expenses |
36,607,655 | |||
|
|
|
| ||
| Net Investment Income |
35,274,038 | |||
|
|
|
| ||
| Realized and Unrealized Gain (Loss) on Investments |
||||
| Net Realized Gain (Loss) From: |
||||
| Investments |
(208,992) | |||
| Forward foreign currency contracts |
304,045 | |||
| Foreign currency transactions |
(312) | |||
|
|
|
| ||
| Net Realized Gain |
94,741 | |||
|
|
|
| ||
| Change in Net Unrealized Appreciation (Depreciation) From: |
||||
| Investments |
(34,050,268) | |||
| Forward foreign currency contracts |
2,496,898 | |||
| Foreign currency transactions |
63,565 | |||
|
|
|
| ||
| Change in Net Unrealized Depreciation |
(31,489,805) | |||
|
|
|
| ||
| Net Realized and Unrealized Loss on Investments |
(31,395,064) | |||
|
|
|
| ||
| Increase in Net Assets Applicable to Common Stockholders from operations |
$ | 3,878,974 | ||
|
|
|
| ||
See accompanying notes to consolidated financial statements.
12
Consolidated Statements of Changes in Net Assets
| For the Year Ended December 31, 2025 |
For the Year Ended December 31, 2024 |
|||||||
|
|
|
|||||||
| Operations: |
||||||||
| Net Investment Income |
$ | 35,274,038 | $ | 32,412,798 | ||||
| Net realized gain/(loss) |
94,741 | (15,859,252) | ||||||
| Change in net unrealized (depreciation) |
(31,489,805 | ) | (50,288,245) | |||||
|
|
|
|||||||
| Increase (Decrease) in Net Assets Applicable to Common Stockholders from Operations |
3,878,974 | (33,734,699) | ||||||
|
|
|
|||||||
| Distributions to Common Stockholders From: |
||||||||
| Return of capital(1) |
(78,862,866 | ) | (68,778,295) | |||||
|
|
|
|||||||
| Decrease in Net Assets from Distributions to Common Stockholders |
(78,862,866 | ) | (68,778,295) | |||||
|
|
|
|||||||
| Fund Share Transactions |
||||||||
| Net proceeds from sale of shares |
452,626,727 | 250,231,490 | ||||||
| Reinvestment of distributions |
29,821,613 | 27,647,600 | ||||||
| Cost of shares repurchased through tender offer |
(210,795,039 | ) | (248,991,814) | |||||
|
|
|
|||||||
| Increase in Net Assets from Fund Share Transactions |
271,653,301 | 28,887,276 | ||||||
|
|
|
|||||||
| Increase (Decrease) in Net Assets Applicable to Common Stockholders |
196,669,409 | (73,625,718) | ||||||
|
|
|
|||||||
| Net Assets Applicable to Common Stockholders: |
||||||||
| Beginning of year |
1,259,926,432 | 1,333,552,150 | ||||||
| End of year |
$ | 1,456,595,841 | $ | 1,259,926,432 | ||||
|
|
|
|||||||
| (1) | Taxed as a return of capital. The characterization of the amounts of dividends and distributions of net investment income are determined in accordance with federal income tax regulations, which may differ from U.S. GAAP. |
See accompanying notes to consolidated financial statements.
13
Consolidated Statement of Cash Flows
For the Year Ended December 31, 2025
| Cash Flows from Operating Activities:(1) |
||||
| Net increase (decrease) in net assets applicable to Common Stockholders resulting from operations |
$ | 3,878,974 | ||
| Adjustments to reconcile net increase (decrease) in net assets from operations to net cash provided by (used in) operating activities: |
||||
| Purchases of real estate investments and portfolio securities |
(412,390,545) | |||
| Proceeds from disposition of real estate investments and portfolio securities |
192,221,626 | |||
| Net accretion and amortization of discount/premium on investment securities |
(1,901,025) | |||
| Management fee paid in shares of the Fund |
16,236,646 | |||
| Incentive fee paid in shares of the Fund |
6,459,411 | |||
| Directors’ fee paid in shares of the Fund |
300,000 | |||
| Amortization of deferred financing costs |
887,400 | |||
| (Increase) decrease in dividends and interest receivable |
(358,868) | |||
| (Increase) decrease in receivable due from Adviser |
(682,153) | |||
| (Increase) decrease in other assets |
(2,413,185) | |||
| Increase (decrease) in payable due to Adviser |
(185,892) | |||
| Increase (decrease) in administration and custody fees payable |
(47,314) | |||
| Increase (decrease) in directors’ fees payable |
7,569 | |||
| Increase (decrease) in legal fees payable |
(131,294) | |||
| Increase (decrease) in audit and tax fees payable |
(12,701) | |||
| Increase (decrease) in distribution and servicing fees |
(41,042) | |||
| Increase (decrease) in other expenses payable |
659,901 | |||
| Change in net unrealized (appreciation) depreciation on investments |
34,050,268 | |||
| Change in net unrealized (appreciation) depreciation on forward foreign currency contracts |
(2,496,898) | |||
| Net realized (gain) loss on investment security transactions |
208,992 | |||
|
|
|
|||
| Net cash and foreign currency provided by (used in) operating activities |
(165,750,130) | |||
|
|
|
|||
| Cash Flows from Financing Activities: |
||||
| Proceeds from revolving credit facility |
74,500,000 | |||
| Repayment of revolving credit facility |
(74,500,000) | |||
| Payment of deferred financing costs |
(1,876,936) | |||
| Proceeds from sale of common stock |
429,738,960 | |||
| Payment of dividends and distributions to Common Stockholders |
(47,783,710) | |||
| Payment of shares repurchased through tender offer |
(210,795,039) | |||
|
|
|
|||
| Net cash and foreign currency provided by (used in) financing activities |
169,283,275 | |||
|
|
|
|||
| Net Increase (Decrease) in Cash and Foreign Currency |
3,533,145 | |||
|
|
|
|||
| Cash, Cash Equivalents and Foreign Currency: |
||||
| Beginning of year |
26,740,646 | |||
|
|
|
|||
| End of year |
$ | 30,273,791 | ||
|
|
|
|||
| (1) Interest expense paid by the Fund was $717,811. |
||||
| Supplemental disclosure of non-cash financing activities: |
||||
| Reinvestment of distributions |
$ | 29,821,613 | ||
See accompanying notes to consolidated financial statements.
14
Consolidated Financial Highlights
| For the Year Ended December 31, 2025 |
For the Year Ended December 31, 2024 |
For the Year Ended December 31, 2023 |
For the Year Ended December 31, 2022 |
For the Year Ended December 31, 2021 | |||||||||||||||||||||
| Class I Shares |
|||||||||||||||||||||||||
| Per Share Operating Performance(1) |
|||||||||||||||||||||||||
| Net asset value, beginning of year |
$ | 24.86 | $ | 27.00 | $ | 30.39 | $ | 29.49 | $ | 26.32 | |||||||||||||||
| Income (Loss) from operations: |
|||||||||||||||||||||||||
| Net investment income |
0.76 | 0.79 | 0.83 | 1.02 | 1.37 | ||||||||||||||||||||
| Net realized and unrealized gain (loss)(2) |
(0.61 | ) | (1.37 | ) | (2.66 | ) | 1.44 | 5.09 | |||||||||||||||||
|
|
|
|
|
|
|
|
|
|
|
|
|
|
|
| |||||||||||
| Total income (loss) from operations |
0.15 | (0.58 | ) | (1.83 | ) | 2.46 | 6.46 | ||||||||||||||||||
| Less distributions(3): |
(1.56 | ) | (1.56 | ) | (1.56 | ) | (1.56 | ) | (3.29 | ) | |||||||||||||||
|
|
|
|
|
|
|
|
|
|
|
|
|
|
|
| |||||||||||
| Net asset value, end of year |
$ | 23.45 | $ | 24.86 | $ | 27.00 | $ | 30.39 | $ | 29.49 | |||||||||||||||
|
|
|
|
|
|
|
|
|
|
|
|
|
|
|
| |||||||||||
| Total return(4) |
0.66 | % | (2.17 | )% | (6.25 | )% | 8.32 | % | 26.06 | % | |||||||||||||||
| Ratio to average net assets |
|||||||||||||||||||||||||
| Expenses, before waivers(5) |
2.50 | % | 2.44 | % | 2.56 | % | 3.11 | % | 4.09 | % | |||||||||||||||
| Expenses, after waivers(5) |
2.40 | % | 2.34 | % | 2.47 | % | 2.58 | % | 1.67 | % | |||||||||||||||
| Expenses, after waivers and excluding expenses outside the Expense Limitation Agreement(5) |
0.50 | % | 0.50 | % | 0.50 | % | 0.50 | % | 0.50 | % | |||||||||||||||
| Net investment income(5) |
3.17 | % | 3.09 | % | 2.85 | % | 3.25 | % | 4.91 | % | |||||||||||||||
| Supplemental data |
|||||||||||||||||||||||||
| Net assets, end of year (000’s) |
$ | 831,635 | $ | 556,619 | $ | 460,975 | $ | 511,959 | $ | 340,123 | |||||||||||||||
| Portfolio turnover rate(6) |
15.25 | % | 18.23 | % | 6.41 | % | 7.44 | % | 32.00 | % | |||||||||||||||
| (1) | Per share calculations were performed using the average shares outstanding for the year. Per share data may be rounded in order to recompute the ending net asset value per share. |
| (2) | The amount shown is the balancing amount derived from the other figures in the schedule. The amount shown for a share outstanding throughout the period may not agree with the change in the aggregate gains and losses on investments for the period because of the timing of sales of the Fund’s shares in relation to fluctuating market values for the portfolio. |
| (3) | Taxed as a return of capital. |
| (4) | Total return is for the year indicated and has not been annualized. Total return assumes a purchase of common stock at the net asset value on the first day and a sale at the net asset value on the last day of each period reported on the table. Total return assumes reinvestment of dividends and distributions at prices obtained pursuant to the Fund’s dividend reinvestment plan. |
| (5) | Please refer to Note 6 for a discussion of the timing of management and incentive fees (as applicable) as well as the Expense Limitation Agreement. |
| (6) | Portfolio turnover is calculated on the basis of the Fund as a whole and has not been annualized. |
See accompanying notes to consolidated financial statements.
15
Consolidated Financial Highlights
| For the Year Ended December 31, 2025 |
For the Year Ended December 31, 2024 |
For the Year Ended December 31, 2023 |
For the Year Ended December 31, 2022 |
For the Period 2021(1) to December 31, 2021 | |||||||||||||||||||||
| Class U Shares |
|||||||||||||||||||||||||
| Per Share Operating Performance(2) |
|||||||||||||||||||||||||
| Net asset value, beginning of year |
$ | 24.86 | $ | 27.00 | $ | 30.39 | $ | 29.49 | $ | 26.71 | |||||||||||||||
| Income (Loss) from operations: |
|||||||||||||||||||||||||
| Net investment income |
0.54 | 0.59 | 0.59 | 0.75 | 0.54 | ||||||||||||||||||||
| Net realized and unrealized gain (loss)(3) |
(0.59 | ) | (1.39 | ) | (2.67 | ) | 1.45 | 2.90 | |||||||||||||||||
|
|
|
|
|
|
|
|
|
|
|
|
|
|
|
| |||||||||||
| Total income (loss) from operations |
(0.05 | ) | (0.80 | ) | (2.08 | ) | 2.20 | 3.44 | |||||||||||||||||
| Less distributions(4): |
(1.36 | ) | (1.34 | ) | (1.31 | ) | (1.30 | ) | (0.66 | ) | |||||||||||||||
|
|
|
|
|
|
|
|
|
|
|
|
|
|
|
| |||||||||||
| Net asset value, end of year |
$ | 23.45 | $ | 24.86 | $ | 27.00 | $ | 30.39 | $ | 29.49 | |||||||||||||||
|
|
|
|
|
|
|
|
|
|
|
|
|
|
|
| |||||||||||
| Total return(5) |
(0.19 | )% | (3.00 | )% | (7.04 | )% | 7.40 | % | 13.03 | % | |||||||||||||||
| Ratio to average net assets |
|||||||||||||||||||||||||
| Expenses, before waivers(6) |
3.34 | % | 3.29 | % | 3.41 | % | 3.93 | % | 5.10 | % | |||||||||||||||
| Expenses, after waivers(6) |
3.25 | % | 3.19 | % | 3.32 | % | 3.44 | % | 2.81 | % | |||||||||||||||
| Expenses, after waivers and excluding expenses outside the Expense Limitation Agreement(6) |
0.50 | % | 0.50 | % | 0.50 | % | 0.50 | % | 0.50 | % | |||||||||||||||
| Net investment income(6) |
2.25 | % | 2.30 | % | 2.00 | % | 2.39 | % | 3.77 | % | |||||||||||||||
| Supplemental data |
|||||||||||||||||||||||||
| Net assets, end of year (000’s) |
$ | 624,749 | $ | 703,083 | $ | 872,317 | $ | 1,091,336 | $ | 370,590 | |||||||||||||||
| Portfolio turnover rate(7) |
15.25 | % | 18.23 | % | 6.41 | % | 7.44 | % | 32.00 | % | |||||||||||||||
| (1) | Class U Shares commenced operations on July 1, 2021. |
| (2) | Per share calculations were performed using the average shares outstanding for the year. Per share data may be rounded in order to recompute the ending net asset value per share. |
| (3) | The amount shown is the balancing amount derived from the other figures in the schedule. The amount shown for a share outstanding throughout the period may not agree with the change in the aggregate gains and losses on investments for the period because of the timing of sales of the Fund’s shares in relation to fluctuating market values for the portfolio. |
| (4) | Taxed as a return of capital. |
| (5) | Total return is for the year indicated and has not been annualized. Total return assumes a purchase of common stock at the net asset value on the first day and a sale at the net asset value on the last day of each period reported on the table. Total return assumes reinvestment of dividends and distributions at prices obtained pursuant to the Fund’s dividend reinvestment plan. |
| (6) | Please refer to Note 6 for a discussion of the timing of management and incentive fees (as applicable) as well as the Expense Limitation Agreement. |
| (7) | Portfolio turnover is calculated on the basis of the Fund as a whole and has not been annualized. |
See accompanying notes to consolidated financial statements.
16
Consolidated Financial Highlights
|
For the Year 2025 |
For the Year 2024 |
For the Period December 31, 2023 |
For the Period 2023 to May 11, |
For the Period 2022(1) to December 31, | |||||||||||||||||||||
| Class D Shares |
|||||||||||||||||||||||||
| Per Share Operating Performance(2) |
|||||||||||||||||||||||||
| Net asset value, beginning of year |
$ | 24.86 | $ | 27.00 | $ | 28.52 | $ | 30.39 | $ | 30.80 | |||||||||||||||
| Income (Loss) from operations: |
|||||||||||||||||||||||||
| Net investment income |
0.69 | 0.74 | 0.16 | 0.27 | 0.78 | ||||||||||||||||||||
| Net realized and unrealized gain (loss)(3) |
(0.60 | ) | (1.38 | ) | (1.26 | ) | (0.03 | ) | 0.03 | ||||||||||||||||
|
|
|
|
|
|
|
|
|
|
|
|
|
|
|
| |||||||||||
| Total income (loss) from operations |
0.09 | (0.64 | ) | (1.10 | ) | 0.24 | 0.81 | ||||||||||||||||||
| Less distributions(4): |
(1.50 | ) | (1.50 | ) | (0.42 | ) | (0.53 | ) | (1.22 | ) | |||||||||||||||
|
|
|
|
|
|
|
|
|
|
|
|
|
|
|
| |||||||||||
| Net asset value, end of year |
$ | 23.45 | $ | 24.86 | $ | 27.00 | $ | 30.10 | $ | 30.39 | |||||||||||||||
|
|
|
|
|
|
|
|
|
|
|
|
|
|
|
| |||||||||||
| Total return(5) |
0.40 | % | (2.42 | )% | (3.89 | )% | 0.80 | % | 2.56 | % | |||||||||||||||
| Ratio to average net assets |
|||||||||||||||||||||||||
| Expenses, before waivers(6) |
2.74 | % | 2.69 | % | 2.79 | % | 2.80 | % | 3.26 | % | |||||||||||||||
| Expenses, after waivers(6) |
2.65 | % | 2.59 | % | 2.70 | % | 2.73 | % | 2.83 | % | |||||||||||||||
| Expenses, after waivers and excluding expenses outside the Expense Limitation Agreement(6) |
0.50 | % | 0.50 | % | 0.50 | % | 0.50 | % | 0.50 | % | |||||||||||||||
| Net investment income(6) |
2.87 | % | 2.86 | % | 2.02 | % | 2.52 | % | 3.00 | % | |||||||||||||||
| Supplemental data |
|||||||||||||||||||||||||
| Net assets, end of year (000’s) |
$ | 169 | $ | 169 | $ | 173 | $- | $ | 440 | ||||||||||||||||
| Portfolio turnover rate(7) |
15.25 | % | 18.23 | % | 0.47 | % | 3.96 | % | 7.44 | % | |||||||||||||||
| (1) | Class D Shares commenced operations on March 4, 2022. On May 11, 2023, all outstanding Class D Shares were converted to Class I Shares at $30.10 per share. Class D Shares were reopened on September 19, 2023 at $28.52 per share. |
| (2) | Per share calculations were performed using the average shares outstanding for the year. Per share data may be rounded in order to recompute the ending net asset value per share. |
| (3) | The amount shown is the balancing amount derived from the other figures in the schedule. The amount shown for a share outstanding throughout the period may not agree with the change in the aggregate gains and losses on investments for the period because of the timing of sales of the Fund’s shares in relation to fluctuating market values for the portfolio. |
| (4) | Taxed as a return of capital. |
| (5) | Total return is for the year indicated and has not been annualized. Total return assumes a purchase of common stock at the net asset value on the first day and a sale at the net asset value on the last day of each period reported on the table. Total return assumes reinvestment of dividends and distributions at prices obtained pursuant to the Fund’s dividend reinvestment plan. |
| (6) | Please refer to Note 6 for a discussion of the timing of management and incentive fees (as applicable) as well as the Expense Limitation Agreement. |
| (7) | Portfolio turnover is calculated on the basis of the Fund as a whole and has not been annualized. |
See accompanying notes to consolidated financial statements.
17
Consolidated Financial Highlights
| For the Year 31, 2025 |
For the Year 31, 2024 |
For the Year 31, 2023 |
For the Period December 31, 2022 |
|||||||||||||
| Class S Shares |
||||||||||||||||
| Per Share Operating Performance(2) |
||||||||||||||||
| Net asset value, beginning of year |
$ | 24.86 | $ | 27.00 | $ | 30.39 | $ | 31.50 | ||||||||
| Income (Loss) from operations: |
||||||||||||||||
| Net investment income |
0.55 | 0.59 | 0.59 | 0.21 | ||||||||||||
| Net realized and unrealized loss(3) |
(0.60) | (1.39) | (2.67) | (0.93) | ||||||||||||
|
|
|
|
|
|
|
|
|
|||||||||
| Total (loss) from operations |
(0.05) | (0.80) | (2.08) | (0.72) | ||||||||||||
| Less distributions(4): |
(1.36) | (1.34) | (1.31) | (0.39) | ||||||||||||
|
|
|
|
|
|
|
|
|
|||||||||
| Net asset value, end of year |
$ | 23.45 | $ | 24.86 | $ | 27.00 | $ | 30.39 | ||||||||
|
|
|
|
|
|
|
|
|
|||||||||
| Total return(5) |
(0.20)% | (3.00)% | (7.04)% | (2.29)% | ||||||||||||
| Ratio to average net assets |
||||||||||||||||
| Expenses, before waivers(6) |
3.34% | 3.29% | 3.41% | 4.32% | ||||||||||||
| Expenses, after waivers(6) |
3.24% | 3.20% | 3.32% | 3.57% | ||||||||||||
| Expenses, after waivers and excluding expenses outside the Expense Limitation Agreement(6) |
0.50% | 0.50% | 0.50% | 0.50% | ||||||||||||
| Net investment income(6) |
2.27% | 2.28% | 2.01% | 2.26% | ||||||||||||
| Supplemental data |
||||||||||||||||
| Net assets, end of year (000’s) |
$ | 42 | $ | 55 | $ | 88 | $ | 94 | ||||||||
| Portfolio turnover rate(7) |
15.25% | 18.23% | 6.41% | 7.44% | ||||||||||||
| (1) | Class S Shares commenced operations on September 9, 2022. |
| (2) | Per share calculations were performed using the average shares outstanding for the year. Per share data may be rounded in order to recompute the ending net asset value per share. |
| (3) | The amount shown is the balancing amount derived from the other figures in the schedule. The amount shown for a share outstanding throughout the period may not agree with the change in the aggregate gains and losses on investments for the period because of the timing of sales of the Fund’s shares in relation to fluctuating market values for the portfolio. |
| (4) | Taxed as a return of capital. |
| (5) | Total return is for the year indicated and has not been annualized. Total return assumes a purchase of common stock at the net asset value on the first day and a sale at the net asset value on the last day of each period reported on the table. Total return assumes reinvestment of dividends and distributions at prices obtained pursuant to the Fund’s dividend reinvestment plan. |
| (6) | Please refer to Note 6 for a discussion of the timing of management and incentive fees (as applicable) as well as the Expense Limitation Agreement. |
| (7) | Portfolio turnover is calculated on the basis of the Fund as a whole and has not been annualized. |
See accompanying notes to consolidated financial statements.
18
Notes to Consolidated Financial Statements
1. Organization
KKR Real Estate Select Trust Inc. (the “Fund”) is a non-diversified, closed-end management investment company registered under the Investment Company Act of 1940, as amended (the “1940 Act”), that continuously offers its shares of common stock. The Fund is a Maryland corporation and has elected and has qualified, and intends to continue to qualify annually, as a real estate investment trust (a “REIT”) for U.S. federal income tax purposes under the Internal Revenue Code of 1986, as amended (the “Code”). The Fund’s Board of Directors (the “Board”) authorized 500 million shares of $0.001 par value common stock. The Fund’s currently effective registration statement has registered for sale to the public a total of $5,000,000,000 in shares of common stock. The Fund’s primary investment objective is to provide attractive current income with a secondary objective of long-term capital appreciation. The Fund seeks to achieve its objective by investing primarily in a portfolio of real estate, including in the form of property investments and real estate-related debt interests and to a lesser extent in traded real estate-related securities.
KKR Registered Advisor LLC serves as the Fund’s investment adviser (the “Adviser”). The Fund entered into an investment advisory agreement (the “Advisory Agreement”) with KKR Registered Advisor LLC on May 18, 2021, following Board approval on July 29, 2020. The Board most recently approved the continuation of the Advisory Agreement for an additional year on November 18, 2025.
As of December 31, 2025, the Fund had the following shares outstanding:
| Class I Shares |
35,462,269 | |||
| Class U Shares |
26,645,242 | |||
| Class D Shares |
7,223 | |||
| Class S Shares |
1,808 | |||
As of December 31, 2025 and December 31, 2024, respectively, an affiliate of the Adviser owned 11,157,986 and 10,209,500 Class I Shares.
Class I Shares, Class U Shares, Class D Shares and Class S Shares are offered at net asset value (“NAV”) per share, plus in the case of Class S Shares, a maximum sales charge of up to 3.00% of the offering price and a dealer manager fee of 0.50% of the offering price. Certain participating broker-dealers may offer Class S Shares subject to a dealer manager fee of up to 1.50%, provided that the sum of the sales charge and dealer manager fee will not exceed 3.50% of the offering price.
2. Summary of Significant Accounting Policies
Basis of Presentation — The Fund is considered an investment company as defined in Accounting Standards Codification (“ASC”) Topic 946 Financial Services – Investment Companies (“ASC 946”). The accompanying financial statements are presented in accordance with accounting principles generally accepted in the United States of America (“GAAP”), using the specialized guidance in ASC 946, and are stated in United States (“U.S.”) dollars. The preparation of consolidated financial statements in conformity with GAAP requires management to make estimates and assumptions that affect the reported amounts and disclosures in these consolidated financial statements. Actual results could differ from those estimates. The Fund owns and plans to continue to own all or substantially all of its property investments through a wholly-owned operating partnership. These financial statements are consolidated financial statements of the Fund and its wholly-owned operating partnership. All intercompany transactions have been eliminated in consolidation.
Valuation of Investments — The Board of the Fund has approved valuation policies and procedures adopted by the Adviser to ensure investments are valued in a manner consistent with GAAP as required by the 1940 Act. The Board has designated the Adviser as its “valuation designee” pursuant to Rule 2a-5 under the 1940 Act, and in that role the Adviser is responsible for performing fair value determinations relating to all of the Fund’s investments, including periodically assessing and managing any material valuation risks and establishing and applying fair value methodologies, in accordance with valuation policies and procedures that have been approved by the Board. The Board ultimately is responsible for fair value determinations under the 1940 Act and satisfies its responsibility through the oversight of the valuation designee in accordance with Rule 2a-5.
19
Investments are stated at fair value in a manner consistent with GAAP. Fair value is the price that would be received from the sale of an asset or paid to transfer a liability in an orderly transaction between market participants at the measurement date. Where available, fair value is based on observable market prices or parameters, or derived from such prices or parameters. Where observable prices or inputs are not available, valuation models are applied. These valuation techniques involve some level of management estimation and judgment, the degree of which is dependent on the price transparency for the instruments or market and the instruments’ complexity for disclosure purposes.
Assets and liabilities recorded at fair value on the Consolidated Statement of Assets and Liabilities are categorized based upon the level of judgment associated with the inputs used to measure their value. Hierarchical levels, as defined under GAAP, are directly related to the amount of subjectivity associated with the inputs to fair valuations of these assets and liabilities, are as follows:
Level 1 — Inputs are unadjusted, quoted prices in active markets for identical assets or liabilities at the measurement date.
Level 2 — Inputs other than quoted prices included in Level 1 that are observable for the asset or liability, either directly or indirectly. Level 2 inputs include quoted prices for similar instruments in active markets, and inputs other than quoted prices that are observable for the asset or liability.
Level 3 — Inputs are unobservable for the asset or liability, and include situations where there is little, if any, market activity for the asset or liability.
A significant decrease in the volume and level of activity for the asset or liability is an indication that transactions or quoted prices may not be representative of fair value because in such market conditions there may be increased instances of transactions that are not orderly. In those circumstances, further analysis of transactions or quoted prices is needed, and a significant adjustment to the transactions or quoted prices may be necessary to estimate fair value.
The availability of observable inputs can vary depending on the financial asset or liability and is affected by a wide variety of factors, including, for example, the type of product, whether the product is new, whether the product is traded on an active exchange or in the secondary market, and the current market condition. To the extent that valuation is based on models or inputs that are less observable or unobservable in the market, the determination of fair value requires more judgment. Accordingly, the degree of judgment exercised in determining fair value is greatest for instruments categorized in Level 3. In certain cases, the inputs used to measure fair value may fall into different levels of the fair value hierarchy. In such cases, for disclosure purposes, the level in the fair value hierarchy within which the fair value measurement in its entirety falls is determined based on the lowest level input that is significant to the fair value measurement in its entirety. The assessment of the significance of a particular input to the fair value measurement in its entirety requires judgment and consideration of factors specific to the asset. The variability of the observable inputs affected by the factors described above may cause transfers between Levels 1, 2 and/or 3, which the Adviser recognizes at the beginning of the period the inputs change.
Many financial assets and liabilities have bid and ask prices that can be observed in the marketplace. Bid prices reflect the highest price that the Fund and others are willing to pay for an asset. Ask prices represent the lowest price that the Fund and others are willing to accept for an asset. For financial assets and liabilities whose inputs are based on bid-ask prices, the Adviser does not require that fair value always be a predetermined point in the bid-ask range. The Adviser’s policy is to allow for mid-market pricing and adjust to the point within the bid-ask range that meets the Fund’s best estimate of fair value.
Depending on the relative liquidity in the markets for certain assets, the Adviser may transfer assets to Level 3 if it determines that observable quoted prices, obtained directly or indirectly, are not available. Assets and liabilities that are valued using Level 3 of the fair value hierarchy are initially valued at transaction price and are subsequently valued using market data for similar instruments (e.g., recent transactions or broker quotes), comparisons to benchmark derivative indices and valuation models. Valuation models are based on discounted cash flow techniques, for which the key inputs are the amount of expected future cash flows, market yields for such instruments and recovery assumptions. Inputs are determined based on relative value analyses, which incorporate similar instruments from similar issuers.
Independent Valuation Advisor — The Board, including a majority of the independent directors, has appointed an independent valuation advisor (“Independent Valuation Advisor”) to provide valuation services to the Fund in respect of the Fund’s investments in real estate debt (e.g., mortgage loans and mezzanine loans) and real property (e.g., direct investments in real property and interests
20
in private holding vehicles of real property), which do not have readily available market prices. The Independent Valuation Advisor, subject to the oversight of the Adviser in its capacity as valuation designee, and ultimately the Board, is responsible for coordinating third party appraisals of the Fund’s underlying investments in real properties (including investments held through unconsolidated subsidiaries) and providing valuations and appraisals of the Fund’s underlying investments in real properties and debt investments for which there are not reliable readily available market prices.
Private Commercial Real Estate — The Fund’s investments in real estate ventures are valued based on the fair value of the underlying real estate and any related mortgage loans payable. The Adviser expects the primary methodology used to value the Fund’s underlying real properties owned by the Fund’s real estate ventures will be the income approach, whereby value is derived by determining the present value of an asset’s expected stream of future cash flows. Consistent with industry practices, the income approach incorporates subjective judgments regarding comparable rental and operating expense data, the capitalization or discount rate and projections of future rent and expenses based on appropriate evidence. Fair value using the income approach is generally assessed at regular intervals and also in response to material, unbudgeted non-recurring income and expense events such as capital expenditures, prepayment penalties, assumption fees, tenant buyouts, lease termination fees and tenant turnover with respect to such property when the Adviser becomes aware of such events and the relevant information is available. Ongoing adjustments to the fair value derived using the income approach are also made to reflect (1) the accrual of income by the Fund’s investment in real estate ventures on the basis of data extracted from the annual budget for such property and (2) the calculated change in fair value resulting from the application of the income approach as of the next regular future valuation date recognized on straight-line basis through such date. Other methodologies that may also be used to value properties include sales comparisons and replacement cost approaches. Under the sales comparison approach, the Independent Valuation Advisor or the third-party appraiser, as applicable, develops an opinion of value by comparing the subject property to similar, recently sold properties in the surrounding or competing area. For portfolios of properties, the sales comparison approach could include a portfolio premium or portfolio discount, as applicable. The replacement cost approach relies on the principle of substitution, which holds that when a property is replaceable in the market, its value tends to be set at the cost of acquiring an equally desirable substitute property, assuming that no costly delay is encountered in making the substitution.
Except for single family rental properties, each asset is appraised by a third-party appraiser other than the Independent Valuation Advisor at least once per year and is valued by the Independent Valuation Advisor (or, in the case of certain assets located outside of the United States, a valuation firm designated by the Independent Valuation Advisor and approved by the Adviser) the remaining months of the year. Single family rental properties that have been acquired leased will be valued by the Independent Valuation Advisor each month following the first 45 days after acquisition. Single family rental properties that have been acquired vacant will be valued at cost until 45 days following the date the property is leased or the later of (a) 45 days following the date the property completes renovations or (b) three months after the acquisition date, and thereafter will be valued by the Independent Valuation Advisor each month.
Commercial Mortgage-backed Securities — Commercial mortgage-backed securities (“CMBS”) are securities backed by obligations (including certificates of participation in obligations) that are principally secured by commercial mortgages on real property or interests therein having a multifamily or commercial use, such as retail, office or industrial properties, hotels, apartments, nursing homes and senior living facilities. CMBS are typically issued in multiple tranches whereby the more senior classes are entitled to priority distributions from the trust’s income to make specified interest and principal payments on such tranches. Losses and other shortfalls from expected amounts to be received on the mortgage pool are borne by the most subordinate classes, which receive principal payments only after the more senior classes have received all principal payments to which they are entitled. The credit quality of CMBS depends on the credit quality of the underlying mortgage loans, which is a function of factors such as the principal amount of loans relative to the value of the related properties; the cash flow produced by the property; the mortgage loan terms, such as principal amortization; market assessment and geographic location; construction quality of the property; and the creditworthiness of the borrowers. The Fund has historically invested a significant portion of its portfolio in CMBS.
The valuations for CMBS are typically the prices supplied by independent third party pricing services, which may use market prices or broker/ dealer quotations or a variety of valuation techniques and methodologies. If independent third party pricing services are unable to supply prices for a portfolio investment, or if the prices supplied are deemed by the Adviser to be unreliable, the market price may be determined by the Adviser using quotations from one or more broker/dealers or at the transaction price if the security has recently been purchased and no value has yet been obtained from a pricing service or pricing broker.
21
Real Estate Loans — The Fund currently holds a mezzanine loan. Mezzanine loans are a type of subordinate loan in which the loan is secured by one or more direct or indirect ownership interests in an entity that directly or indirectly owns real estate. Mezzanine loans are subordinate to a first mortgage or other senior debt. Investors in mezzanine loans are generally compensated for the increased credit risk from a pricing perspective and still benefit from the right to foreclose on its security, in many instances more efficiently than the rights of foreclosure for first mortgage loans. Upon a default by the borrower under a mezzanine loan, the mezzanine lender generally can take control of the property owning entity on an expedited basis, subject to the rights of the holders of debt senior in priority on the property. Rights of holders of mezzanine loans are usually governed by intercreditor or interlender agreements, which may limit the Fund’s ability to pursue remedies.
Investment Transactions and Investment Income — Investment transactions are accounted for on the trade date, the date the order to buy or sell is executed. Amortization and accretion is calculated using the effective interest method over the life of the investment. Realized gains and losses are calculated on the identified cost basis.
Share Class Accounting — The Fund’s investment income, expenses (other than class-specific expenses, such as distribution and servicing fees) and unrealized and realized gains and losses are allocated daily to each class of shares based upon the relative proportion of net assets of each class at the beginning of the day. Please refer to Note 6 for additional information on distribution and servicing fees allocated to certain share classes.
Cash and Cash Equivalents — Cash and cash equivalents substantially consists of money market funds with financial institutions that invest in securities with maturities of three or fewer months. As of December 31, 2025, the Fund was invested in the UBS Select Government Institutional Fund.
Statement of Cash Flows — Information on financial transactions which have been settled through the receipt or disbursement of cash or foreign cash is presented in the Consolidated Statement of Cash Flows. Cash and foreign cash include cash and foreign cash on hand at the Fund’s custodian bank and do not include any short-term investments. As of and for the year ended December 31, 2025, the Fund had no restricted cash presented on the Consolidated Statement of Assets and Liabilities.
Foreign Currency Translation — Assets and liabilities initially expressed in non-U.S. currencies are translated into U.S. dollars based on the applicable exchange rates at the date of the last business day of the financial statement period. Purchases and sales of securities, interest income, dividends, variation margin received and expenses denominated in foreign currencies are translated into U.S. dollars at the exchange rates in effect on the transaction date. The Fund does not separately report the effect of changes in foreign exchange rates from changes in market prices of securities held. Such changes are included within the net realized gain or loss and change in unrealized appreciation or depreciation on investments in the Consolidated Statement of Operations. Other foreign currency transactions resulting in realized and unrealized gain or loss are reported separately as net realized gain or loss and change in unrealized appreciation or depreciation on foreign currency transactions in the Consolidated Statement of Operations.
Income from Underlying Investments — Distributions made to the Fund by the underlying investments in which the Fund invests may take several forms. The Fund re-characterizes distributions received from the underlying investments based on information provided by the underlying investment into the following categories: dividend income, long-term capital gains, and return of capital.
Financing Costs — Financing costs related to the Fund’s credit agreements are recorded as a deferred charge and amortized through the maturity date of the respective credit agreement. For the year ended December 31, 2025, the amortization of deferred financing costs totaled $887,400.
Distributions to Stockholders — Distributions from net investment income of the Fund, if any, are paid on a monthly basis. Distributions to stockholders of the Fund are recorded on the ex-dividend date and are determined in accordance with income tax regulations, which may differ from GAAP. For tax purposes, a distribution that for purposes of GAAP is comprised of return of capital and net investment income may be subsequently re-characterized to also include capital gains. Stockholders will be informed of the tax characteristics of the distributions after the close of the 2025 fiscal year.
Income Taxes — The Fund has elected to be taxed as a REIT. The Fund’s qualification and taxation as a REIT depend upon the Fund’s ability to meet on a continuing basis, through actual operating results, certain qualification tests set forth in the U.S. federal tax laws. Those qualification tests involve the percentage of income that the Fund earns from specified sources, the percentage of the Fund’s assets that falls within specified categories, the diversity of the ownership of the Fund’s shares of common stock, and the percentage of the Fund’s taxable income that the Fund distributes. No assurance can be given that the Fund will in fact satisfy such requirements for any taxable year. If the Fund qualifies as a REIT, the Fund generally will be allowed to deduct dividends paid to
22
stockholders and, as a result, the Fund generally will not be subject to U.S. federal income tax on that portion of the Fund’s ordinary income and net capital gain that the Fund annually distributes to stockholders. The Fund intends to make distributions to stockholders on a regular basis as necessary to avoid material U.S. federal income tax and to comply with the REIT distribution requirements.
Other Information — The Fund believes the estimates and assumptions underlying these consolidated financial statements are reasonable and supportable based on the information available as of December 31, 2025; however, uncertainty over the ultimate impact that significant domestic and macroeconomic events, such as ongoing trade and inflationary pressures, shifting interest rates, uncertainty caused by bank failures, U.S. military action overseas, the war in Ukraine, and the conflict and escalating tensions in the Middle East, will have on the global economy generally, and the Fund’s business in particular, makes any estimates and assumptions as of December 31, 2025 inherently less certain than they would be absent these impacts. Actual results may ultimately differ materially from those estimates.
Certain events particular to each real estate market in which the Fund’s existing investments conduct their operations, as well as general economic, political, and geographic conditions, may have a significant negative impact on the operations and profitability of the investments. Such events are beyond the Fund’s control and cannot be predicted with certainty.
Segment Reporting Disclosure — During the period ending December 31, 2024, the Fund adopted Financial Accounting Standards Board Update 2023-07, Segment Reporting (Topic 280) - Improvements to Reportable Segment Disclosures (“ASU 2023-07”). The Fund’s adoption of the new standard impacted financial statement disclosures only and did not affect the Fund’s financial position or results of operations. The Chief Executive Officer acts as the Fund’s Chief Operating Decision Maker (“CODM”) and is responsible for assessing performance and allocating resources with respect to the Fund. The CODM has concluded that the Fund operates as a single operating segment based on the fact that the Fund has a single investment strategy as disclosed in its prospectus, against which the CODM assesses the performance. The financial information provided to and reviewed by the CODM is presented within the Fund’s financial statements.
3. Fair Value
The following table presents information about the Fund’s assets measured on a recurring basis as of December 31, 2025, and indicates the fair value hierarchy of the inputs utilized by the Fund to determine such fair value:
| Assets | ||||||||||||||||
|
|
||||||||||||||||
| Description | Quoted Prices (Level 1) |
Other Significant Observable Inputs (Level 2) |
Significant Inputs (Level 3) |
Total | ||||||||||||
|
|
||||||||||||||||
| Investment:† |
||||||||||||||||
| Investments in Real Estate Equity |
$ | — | $ | — | $ | 954,574,308 | $ | 954,574,308 | ||||||||
| Investments in Real Estate Loans |
— | — | 67,467,016 | 67,467,016 | ||||||||||||
| Commercial Mortgage-backed Securities |
— | 363,563,011 | 23,243,457 | 386,806,468 | ||||||||||||
| Money Market Fund |
29,099,687 | — | — | 29,099,687 | ||||||||||||
|
|
|
|||||||||||||||
| Total Investments |
$ | 29,099,687 | $ | 363,563,011 | $ | 1,045,284,781 | $ | 1,437,947,479 | ||||||||
|
|
|
|||||||||||||||
| Derivatives: |
||||||||||||||||
| Foreign Currency Exchange Contracts |
— | 13,038,326 | — | 13,038,326 | ||||||||||||
|
|
|
|||||||||||||||
| Liabilities | ||||||||||||||||
|
|
||||||||||||||||
| Description | Quoted Prices (Level 1) |
Other Significant Observable Inputs (Level 2) |
Significant (Level 3) |
Total | ||||||||||||
|
|
||||||||||||||||
| Derivatives: |
||||||||||||||||
|
|
|
|||||||||||||||
| Foreign Currency Exchange Contracts |
— | 51,038 | — | 51,038 | ||||||||||||
|
|
|
|||||||||||||||
23
| † | See Consolidated Schedule of Investments for additional detailed categorizations. |
The following is a reconciliation of the investments in which significant unobservable inputs (Level 3) were used in determining value:
| Investments in Real Estate Equity |
Investments in Loans |
Commercial Mortgage- backed Securities |
Total | |||||||||||||
|
|
|
|||||||||||||||
| Balance as of December 31, 2024 |
$ | 878,210,884 | $ | 65,997,304 | $ | 30,549,612 | $ | 974,757,800 | ||||||||
| Purchases |
111,458,192 | — | 23,216,875 | 134,675,067 | ||||||||||||
| Sales & Returns of Capital |
(818,525 | ) | — | (30,573,000 | ) | (31,391,525) | ||||||||||
| Realized gain |
— | — | 58,916 | 58,916 | ||||||||||||
| Accrued premiums/(discounts) |
— | 1,736,525 | 11,899 | 1,748,424 | ||||||||||||
| Net change in unrealized appreciation/(depreciation) | (34,276,243 | ) | (266,813 | ) | (20,845 | ) | (34,563,901) | |||||||||
|
|
|
|||||||||||||||
| Balance as of December 31, 2025 |
$ | 954,574,308 | $ | 67,467,016 | $ | 23,243,457 | $ | 1,045,284,781 | ||||||||
|
|
|
|||||||||||||||
| Net change in unrealized appreciation/(depreciation) on investments held at December 31, 2025 | $ | (34,276,243) | $ | (266,813 | ) | $ | 18,063 | $ | (34,524,993) | |||||||
|
|
|
|||||||||||||||
The following table summarizes the valuation techniques and unobservable inputs used to determine the fair value of certain material Level 3 investments.
| Fair Value at 2025 |
Valuation Technique |
Unobservable Input(s) | Range of Values (Weighted Average) |
Impact to Valuation from an Increase in Input | ||||||||||
| Discounted | Discount Rate | 4.20% - 7.51% (6.97%) | Decrease | |||||||||||
| Investments in Real Estate Equity |
$908,231,195 | Cash Flow | Exit Capitalization Rate | 3.90% - 6.59% (5.87%) | Decrease | |||||||||
| Investments in Real Estate Loans |
$67,467,016 | Yield Method | Credit Spread | 9.00% (9.00%) | Decrease | |||||||||
| Commercial Mortgage-backed Securities | $23,243,457 | Yield Method | Credit Spread | 5.60% - 5.80% (5.71%) | Decrease | |||||||||
As of December 31, 2025, the fair value of the Fund’s investment in Phoenix Senior Living Portfolio is categorized as Level 3 because the valuation was determined using the transaction price approach.
4. Investments
Below is a summary of the latest available financial information for the Fund’s unconsolidated significant subsidiaries as of December 31, 2025. The values below represent a 100% share of the unconsolidated significant subsidiaries, including any portion not owned by the Fund. Each of the Fund’s significant subsidiaries is a real estate operating venture that uses historical cost based accounting whereby real properties are initially capitalized at cost and subject to a depreciation charge over time. As of December 31, 2025, the real estate properties reflected below at a gross carrying value of $2,930,728,402 on such depreciated historical cost basis were deemed to have an equivalent estimated fair value of $3,187,114,105 under the Fund’s valuation procedures. For additional information about each property (including the segment and investment, number of properties, location, acquisition date, ownership interest, square footage and occupancy rate), please refer to the Fund’s website at www.krest.reit.
In connection with the financing arrangements of certain unconsolidated joint ventures, the Fund has provided limited recourse guarantees related to the joint ventures’ indebtedness, under which the Fund may be required to perform only upon the occurrence
24
of specified non-economic events, including, but not limited to, fraud, willful misconduct, misapplication of funds, voluntary bankruptcy filings, or other prohibited actions as defined in the applicable loan agreements. Management believes that the likelihood of the Fund being required to perform under these guarantees is remote. Accordingly, no liability related to these guarantees has been recorded in the accompanying Consolidated Statement of Assets and Liabilities as of December 31, 2025.
The Fund values its share of net equity interests in these significant subsidiaries at fair value. At December 31, 2025, the estimated fair value of the Fund’s net equity interest in these significant subsidiaries was $954,574,308.
| As of December 31, 2025 |
||||
| Balance Sheet: |
||||
| Assets: |
||||
| Real estate properties |
$2,930,728,402 | |||
| Cash |
62,859,967 | |||
| Other assets |
235,060,550 | |||
|
|
|
|||
| Total assets |
3,228,648,919 | |||
|
|
|
|||
| Liabilities and equity: |
||||
| Financing secured by properties |
2,388,162,372 | |||
| Other liabilities |
86,971,238 | |||
|
|
|
|||
| Total liabilities |
2,475,133,610 | |||
|
|
|
|||
| Equity |
753,515,309 | |||
|
|
|
|||
| Total liabilities and equity |
$3,228,648,919 | |||
|
|
|
|||
| For the Year Ended December 31, 2025 |
||||
| Income Statement: |
||||
| Revenue |
$217,578,866 | |||
| Expenses |
(272,061,868) | |||
|
|
|
|||
| Net income (loss) |
$(54,483,002) | |||
|
|
|
|||
5. Forward Foreign Currency Contracts
The Fund enters into forward foreign currency contracts to hedge against foreign currency exchange rate risk on its non-U.S. dollar denominated securities or to facilitate settlement of foreign currency denominated portfolio transactions. A forward foreign currency contract is an agreement between two parties to buy and sell a currency at a set price with delivery and settlement at a future date. The contract is marked-to-market daily and the change in value is recorded by the Fund as an unrealized gain or loss. When a forward foreign currency contract is closed, through either delivery or offset by entering into another forward foreign currency contract, the Fund recognizes a realized gain or loss equal to the difference between the value of the contract at the time it was opened and the value of the contract at the time it is closed. Forward foreign currency contracts involve elements of market risk in excess of the amounts reflected on the Consolidated Statement of Assets and Liabilities. The Fund’s primary risk related to hedging is the risk of an unfavorable change in the foreign exchange rate underlying the forward foreign currency contract. Risks may also arise upon entering into these contracts from the potential inability of the counterparties to meet the terms of their contracts.
At December 31, 2025, the fair value of forward foreign currency contracts were assets of $13,038,326, and liabilities of $51,038. This is located on the Consolidated Statement of Assets and Liabilities under Forward foreign currency contracts. For the year ended December 31, 2025, the change in net unrealized appreciation on forward foreign currency contracts was $2,496,898 and the net realized gain was $304,045. These are located on the Consolidated Statement of Operations under Forward foreign currency
25
contracts. The primary risk exposure of forward foreign currency contracts is foreign exchange risk. For the year ended December 31, 2025, the Fund’s average monthly market value of forward foreign currency contracts sold was $62,027,158.
6. Related Party Transactions
Investment Advisory Agreement — The Board approved the Advisory Agreement on July 29, 2020 and the Fund entered into the Advisory Agreement on May 18, 2021. The Board approved the continuation of the Advisory Agreement for an additional year on November 18, 2025. In consideration of the advisory and other services provided by the Adviser to the Fund, the Fund pays the Adviser a monthly Management Fee at the annual rate of 1.25% of the average daily value of the Fund’s net assets (the “Management Fee”) and a quarterly Incentive Fee at the annual rate of 12.5% of the Fund’s Portfolio Operating Income, as defined below.
“Portfolio Operating Income” means (1) the Fund’s share of Net Operating Income (as defined below) from the Fund’s real estate equity investments; plus (2) the Fund’s net investment income (or loss) from debt, preferred equity investments and traded real estate-related securities; minus (3) the Fund’s expenses (excluding the Incentive Fee and distribution and servicing fees).
“Net Operating Income” means operating revenue net of operating expenses (inclusive of interest on investment level debt) for the Fund’s operating entities that invest in real estate and excludes (i) gains or losses from sales of depreciable real property, (ii) impairment writedowns on depreciable real property, (iii) real estate-related depreciation and amortization for each real estate operating venture and (iv) adjustments for recognizing straight line rent.
Under the Advisory Agreement and pursuant to exemptive relief received from the SEC, the Adviser may elect to receive all or a portion of its management and Incentive Fees in shares of the Fund’s common stock. For more information on the exemptive relief, refer to the Fund’s amended application for exemptive relief (File No. 812-15096-01), filed with the SEC on December 18, 2020.
During the year ended December 31, 2025, the Adviser earned a Management Fee of $16,236,646 and an Incentive Fee of $6,459,411. During the year ended December 31, 2025, the Fund issued 677,719 shares and 270,767 shares to an affiliate of the Adviser in lieu of Management Fees and Incentive Fees, respectively.
Expense Limitation Agreement — The Fund has entered into an Expense Limitation and Reimbursement Agreement (the “Expense Limitation Agreement”) with the Adviser pursuant to which the Adviser waives its monthly Management Fee and/or pay, absorb or reimburse the Fund’s “Specified Expenses” (as defined below) to the extent necessary so that, for any fiscal year, the Fund’s Specified Expenses do not exceed a 0.50% of the average daily value of the Fund’s net assets. “Specified Expenses” is defined to include all expenses incurred in the business of the Fund, including organizational and offering costs, with the exception of (i) the Management Fee, (ii) the Incentive Fee, (iii) the servicing fee, (iv) the distribution fee, (v) property level expenses, (vi) brokerage costs or other investment-related out-of-pocket expenses, including with respect to unconsummated investments, (vii) dividend/interest payments (including any dividend payments, interest expenses, commitment fees, or other expenses related to any leverage incurred by the Fund), (viii) taxes, and (ix) extraordinary expenses (as determined in the sole discretion of the Adviser). The Fund has agreed to repay these amounts (“Reimbursement Payment”), when and if requested by the Adviser, but only if and to the extent that Specified Expenses are less than 0.50% of net assets (annualized) (or, if a lower expense limit is then in effect, such lower limit) within the 36-month period after the Adviser waived or reimbursed such fees or expenses. The Expense Limitation Agreement will be in effect through April 30, 2027, but may be renewed by the mutual agreement of the Adviser and the Fund for successive terms.
For the year ended December 31, 2025, the Adviser agreed to reimburse expenses of $1,251,364 incurred by the Fund pursuant to the Expense Limitation Agreement. The amounts are subject to recoupment within the 36-month period after the Adviser waived or reimbursed such fees or expenses. The Due from Adviser amount of $682,153 as of December 31, 2025 is related to amounts waived under the Expense Limitation Agreement by the Adviser on behalf of the Fund, net of amounts due to the Advisor for expenses paid on behalf of the Fund.
Shareholder Priority Plan — On June 4, 2024, KKR Alternative Assets LLC (“KAA”), an affiliate of the Adviser, contractually committed to the Fund to continue to hold approximately 7,732,436 of Class I Shares currently owned by KAA, representing approximately $200 million based on the Fund’s NAV as of May 28, 2024 (the “Support Shares”), through June 1, 2027 and, to the extent necessary, contribute such shares to the Fund to support a NAV per share of $27.00 on June 1, 2027. If on June 1, 2027 the
26
Fund’s NAV per share is less than $27.00 per share for any share class, KAA will contribute to the Fund as many of the Support Shares as are required, up to the maximum number of Support Shares, to reduce the number of outstanding shares and increase the NAV per share for each class of the Fund’s shares up to $27.00 per share (the “Shareholder Priority Plan”). If the Fund’s NAV per share for any class on June 1, 2027 is less than $27.00 per share and the contribution of all of the Support Shares is not sufficient to cause the NAV per share for each class to equal $27.00 per share, KAA will contribute all such Support Shares to support the Fund’s NAV per share on such date. While the Shareholder Priority Plan is a contractual obligation to support the Fund’s NAV per share, there is no guarantee that the contribution of the Support Shares will be sufficient to achieve a $27.00 per share NAV on June 1, 2027. For the avoidance of doubt, KAA is not obligated to contribute any of the Support Shares prior to June 1, 2027, and KAA is not obligated to contribute any of the Support Shares if the NAV per share for each class equals or exceeds $27.00 per share on June 1, 2027.
Administrator — KKR Fund Administration LLC (the “Administrator”) serves as the Fund’s administrator and accounting agent. The Administrator provides, or oversees the performance of, administrative and compliance services, including, but not limited to, maintaining financial records, overseeing the calculation of net asset value, compliance monitoring (including diligence and oversight of our other service providers), preparing reports to stockholders and reports filed with the SEC, preparing materials and coordinating meetings of the Board, managing the payment of expenses and the performance of administrative and professional services rendered by others and providing office space, equipment and office services. The Fund bears all costs and expenses of its operations, administration and transactions, including the Fund’s allocable portion of compensation, overhead (including rent, office equipment and utilities) and other expenses incurred by the Administrator in performing its duties, including the allocable portion of the compensation paid by the Administrator (or its affiliates) to the Fund’s chief compliance officer and chief financial officer and their respective staffs as well as investor relations, legal, operations and other non-investment professionals at the Administrator that perform duties for the Fund. For the year ended December 31, 2025, the Fund incurred $738,000 for these services.
The Bank of New York Mellon serves as sub-administrator to the Fund (the “Sub-Administrator”). Under the Sub-Administration Agreement, the Sub-Administrator maintains the Fund’s general ledger, assists in making certain regulatory filings for the Fund, and is responsible for calculating the net asset value of the Fund’s shares of common stock and generally managing the administrative affairs of the Fund. The Sub-Administrator also provides real estate administrative services to the Fund.
Distributor — Pursuant to a Distribution Agreement, KKR Capital Markets LLC (the “Distributor”), an affiliate of the Adviser, serves as distributor of the Fund’s shares. The Fund has adopted a distribution and service plan for Class U Shares, Class D Shares and Class S Shares in accordance with Rule 12b-1 under the 1940 Act. Pursuant to the plan, the Fund compensates the Distributor for direct and indirect costs and expenses incurred in connection with shareholder servicing and advertising, marketing and other distribution services in an amount not to exceed 0.85% (0.60% Rule 12b-1 distribution fee and 0.25% shareholder service fee), for Class U and Class S Shares, and 0.25%, for Class D Shares, on an annualized basis of the average daily net assets of the respective class. On May 11, 2023, all outstanding Class D Shares were converted to Class I Shares. Class D Shares were reopened on September 19, 2023. Class I Shares do not incur distribution or servicing fees.
Property Managers — The Fund and its real estate ventures have hired and expect in the future to hire third-party or affiliated property managers (who could also be joint venture partners for an investment) at prevailing market rates to perform management and specialized services for the Fund’s commercial real estate investments.
AIP — Alpha Industrial Properties (the “AIP Manager”) is an industrial property operating platform owned by another KKR-managed fund. The AIP Manager provides property management and asset management services to the industrial assets owned by the Fund’s unconsolidated subsidiaries for market based compensation on an arm’s length basis. The property management and asset management fees paid to the AIP Manager by the Fund’s unconsolidated subsidiaries totaled $1,285,706 for the year ended December 31, 2025.
Drawbridge — Drawbridge Realty Management, LLC (“Drawbridge”) is a vertically integrated platform that manages high quality net lease office assets across the United States and provides property management services to the Fund’s unconsolidated subsidiaries for prime single tenant properties on an arm’s length basis. KKR has a majority ownership interest in Drawbridge and Drawbridge is controlled by a board of managers comprised of two KKR members and two non-KKR members. The property management fees paid to Drawbridge by the Fund’s unconsolidated subsidiaries totaled $806,191 for the year ended December 31, 2025.
27
MCH — My Community Homes (“MCH”) provides certain management services to permit the institutional ownership of SFR homes which the Fund engages. MCH is a platform owned by another KKR-managed fund that was established to non-exclusively support the accumulation and management SFR homes on behalf of KKR-affiliated accounts, including the Fund’s unconsolidated subsidiaries. MCH does not charge fees to the KKR funds and accounts it manages homes on behalf of, and instead allocates a pro-rata share of its actual costs to those KKR funds and investments. Expenses are allocated between the applicable accounts based on homes under management, homes acquired in a given period, or other reasonable methods. The expenses allocated to the Fund’s unconsolidated subsidiaries totaled $2,206,719 for the year ended December 31, 2025.
SLP — Strategic Lease Partners (“SLP”) was formed by KKR in 2021 as a platform for specific KKR real estate and credit funds to aggregate a diversified portfolio of net lease investments. The SLP platform targets a relatively broad range of properties across (i) manufacturing/food production, (ii) warehouse/logistics, (iii) specialized (lab, R&D, hybrid) and (iv) long-term office. It is contemplated that SLP could be engaged as the property manager for future long-leased industrial/manufacturing properties where relevant on the same market terms as the Fund currently engages the AIP Manager, discussed above. During the year ended December 31, 2025, the Fund did not incur a fee.
GA — Global Atlantic (“GA”) is a U.S. retirement and life insurance company, with a broad range of investment products and access to a network of financial advisers and independent broker-dealers. As of 2024, GA is a wholly-owned subsidiary of KKR, operating as a standalone insurance business. Global Atlantic Distributors, LLC, a subsidiary of GA, serves as a sub-distributor of the Fund and provides wholesaling distribution services for the Fund in the independent broker-dealer channel. For the year ended December 31, 2025, the Fund incurred a fee of $19,890 for these services.
Sentio — Sentio Investments, LLC (“Sentio”) is a vertically integrated platform owned by another KKR-managed fund that manages a national portfolio of senior housing communities. Sentio has been engaged to serve as property manager for certain senior housing investments by the Fund. During the year ended December 31, 2025, the Fund incurred a fee of $8,430 for these services.
K-STAR — K-STAR Asset Management LLC (“K-STAR”) is a real estate credit asset management and special servicing platform. K-STAR has been engaged to serve as special servicer of certain CMBS trusts where the Fund is the directing certificate holder, and has been appointed by the Fund to carry out the operational aspects of certain directly originated loans held by KREST. During the year ended December 31, 2025, the Fund incurred a fee of $250 for these services.
Elevate — Elevate is a platform setup under University Partners in 2024. Elevate is an operationally-focused asset management platform, which KKR expects to create immediate value across the Fund’s portfolio. Elevate’s capabilities are designed to provide maximum, cost efficient leverage at the most impactful points of inefficiency or within operational areas in which KKR has experienced the least amount of consistency from third party operations. The capabilities are primarily operationally focused by design in an effort to drive value at the asset level and be complimentary rather than redundant to the skill set within KKR asset management. In January 2025, the platform changed its name from Multico to Elevate. It is contemplated that Elevate will seek reimbursement for such services a portion of which may be directly or indirectly borne on KREST on arm’s length terms. During the year ended December 31, 2025, the Fund did not incur a fee.
K-STAR EMEA — K-STAR EMEA is a special servicer for commercial mortgage loans originated in Europe. K-Star EMEA provides services to replace external servicers in provision of certain activities and to provide oversight of Primary Servicing Activities performed by Primary Servicers. K-Star EMEA will provide many value-add services to KKR Lenders (including KREST) previously provided by KKR. It is contemplated that K-Star EMEA will seek reimbursement for such services a portion of which may be directly or indirectly borne on KREST on arm’s length terms. During the year ended December 31, 2025, the Fund did not incur a fee.
Debt Arrangement Fees — The Distributor provided debt arrangement services, including in connection with Fund financings and property level debt placements for certain of the Fund’s real estate ventures, resulting in aggregate fees of $802,941 for the year ended December 31, 2025.
Other — Certain officers of the Fund are also officers of the Adviser. Such officers are paid no fees by the Fund for serving as officers of the Fund.
28
7. Investment Transactions
The cost of investments purchased and the proceeds from the sale of investments, other than short-term investments, for the year ended December 31, 2025 were as follows:
| Investments(1) | ||||
| Purchases |
$ |
412,390,545 |
| |
|
Sales |
$ | 192,455,310 | ||
| (1) | Includes non-cash real estate investment purchases and returns of capital. |
The following were considered affiliates for all or some portion of the year ended December 31, 2025, along with the respective transactions.
| Affiliate Value at December 31, 2024 |
Purchased Cost |
Sold Proceeds | ||||||||||
|
|
||||||||||||
| Industrial - AIP-PMR 3-Pack |
$ | 68,580,999 | $ | 195,920 | $ | — | ||||||
| Industrial - Calhoun 75 |
— | 47,759,520 | — | |||||||||
| Industrial - Charleston |
34,864,227 | 108,667 | — | |||||||||
| Industrial - Lakemont Blvd |
10,795,454 | 19,709 | — | |||||||||
| Industrial - Lambert Farms |
32,131,798 | 101,529 | — | |||||||||
| Industrial - MB Parts Korea DC |
37,773,897 | — | — | |||||||||
| Industrial - Rickenbacker Logistics Park |
43,239,034 | 113,195 | — | |||||||||
| Industrial - S. 500 Whitestown |
17,734,573 | 41,187 | — | |||||||||
| Industrial - Veterans Point |
54,983,576 | 3,336,528 | — | |||||||||
| Medical Office - Southeastern Portfolio I |
68,490,048 | — | — | |||||||||
| Prime ST - 300 Pine |
56,994,263 | — | — | |||||||||
| Prime ST - El Camino Real |
24,633,962 | — | — | |||||||||
| Prime ST - HQ @ First |
142,990,592 | — | — | |||||||||
| Residential - 80 Dekalb |
1,126,559 | — | 924,527 | |||||||||
| Residential - Main Line 4-Pack |
40,513,044 | 1,671,824 | — | |||||||||
| Residential - National Portfolio 1a |
8,828,357 | — | 568,525 | |||||||||
| Residential - National Portfolio 1b |
85,635,147 | 6,084,109 | 250,000 | |||||||||
| Residential - Phoenix Senior Living Portfolio |
— | 46,125,787 | — | |||||||||
| Residential - Presidential City |
81,608,012 | 5,309,941 | — | |||||||||
| Residential - The Beach House Apartments |
34,362,888 | 590,276 | — | |||||||||
| Residential - Tokyo Multifamily Portfolio I |
34,051,013 | — | — | |||||||||
|
|
|
|||||||||||
| $ | 879,337,443 | $ | 111,458,192 | $ | 1,743,052 | |||||||
|
|
|
|||||||||||
29
| (cont’d) | Realized Gain (Loss) | Dividend Income | Net Increase (Decrease) in Unrealized Appreciation (Depreciation) |
Affiliate Value at December 31, 2025 |
||||||||||||
| Industrial - AIP-PMR 3-Pack |
— | 3,245,657 | (4,953,397 | ) | 63,823,522 | |||||||||||
| Industrial - Calhoun 75 |
— | 696,493 | 1,099,651 | 48,859,171 | ||||||||||||
| Industrial - Charleston |
— | 781,067 | (465,220 | ) | 34,507,674 | |||||||||||
| Industrial - Lakemont Blvd |
— | 334,317 | 1,029,056 | 11,844,219 | ||||||||||||
| Industrial - Lambert Farms |
— | 365,161 | 2,061,797 | 34,295,124 | ||||||||||||
| Industrial - MB Parts Korea DC |
— | 3,143,321 | (901,639 | ) | 36,872,258 | |||||||||||
| Industrial - Rickenbacker Logistics Park |
— | 1,088,519 | 964,984 | 44,317,213 | ||||||||||||
| Industrial - S. 500 Whitestown |
— | 660,673 | 223,020 | 17,998,780 | ||||||||||||
| Industrial - Veterans Point |
— | 38,805 | 8,669,559 | 66,989,663 | ||||||||||||
| Medical Office - Southeastern Portfolio I |
— | 5,089,500 | (18,504,923 | ) | 49,985,125 | |||||||||||
| Prime ST - 300 Pine |
— | 6,186,863 | (599,938 | ) | 56,394,325 | |||||||||||
| Prime ST - El Camino Real |
— | 2,253,652 | 2,211,682 | 26,845,644 | ||||||||||||
| Prime ST - HQ @ First |
— | 13,432,365 | (1,118,782 | ) | 141,871,810 | |||||||||||
| Residential - 80 Dekalb |
(202,032 | ) | — | — | — | |||||||||||
| Residential - Main Line 4-Pack |
— | — | (7,013,751 | ) | 35,171,117 | |||||||||||
| Residential - National Portfolio 1a |
— | — | (1,393,831 | ) | 6,866,001 | |||||||||||
| Residential - National Portfolio 1b |
— | — | (3,507,698 | ) | 87,961,558 | |||||||||||
| Residential - Phoenix Senior Living Portfolio |
— | — | 217,326 | 46,343,113 | ||||||||||||
| Residential - Presidential City |
— | — | (11,897,370 | ) | 75,020,583 | |||||||||||
| Residential - The Beach House Apartments |
— | 1,532,285 | (1,516,631 | ) | 33,436,533 | |||||||||||
| Residential - Tokyo Multifamily Portfolio I |
— | 1,838,048 | 1,119,862 | 35,170,875 | ||||||||||||
|
|
|
|||||||||||||||
| $ | (202,032 | ) | $ | 40,686,726 | $ | (34,276,243) | $ | 954,574,308 | ||||||||
|
|
|
|||||||||||||||
8. Fund Borrowings
In December 2022, the Fund entered into a Revolving Credit Facility (the “Credit Agreement”) with Barclays Bank PLC, Goldman Sachs Lending Partners LLC and Wells Fargo Bank, N.A. in the amount of $250,000,000. The interest rate on Benchmark Advances under the Credit Agreement is the Secured Overnight Financing Rate (“SOFR”) plus applicable margin of (a) 3.05% for borrowings in U.S. dollars or Sterling or (b) 3.00% for borrowings in currencies other than U.S dollars and Sterling. The Fund pays a non-usage fee equal to 0.35% per annum on the daily unused portion of the committed line. In May 2025, the Fund extended the Credit Agreement for three years through May 12, 2028. The Credit Agreement also has a one year extension option through May 12, 2029. At December 31, 2025, the Fund had no borrowings outstanding under the Credit Agreement. Under the terms of the Credit Agreement, the Fund is subject to customary affirmative and negative covenants. As of December 31, 2025, the Fund was in compliance with all of its covenants.
With respect to these borrowings, during the year ended December 31, 2025, the average dollar amount of borrowings on the days that the Fund had a loan outstanding was $14,636,364 at an average interest rate of 7.430%. Interest expense of $1,825,217 in connection with these borrowings is included on the Consolidated Statement of Operations.
30
9. Distributions to Stockholders by Class
| Year Ended December 31, 2025(1) |
Year Ended December 31, 2024(1) |
|||||||||||||||
| Per Share | Amount | Per Share | Amount | |||||||||||||
| Class I |
$ | 1.56 | $ | 42,679,742 | $ | 1.56 | $ | 29,619,518 | ||||||||
| Class U |
1.36 | 36,170,248 | 1.34 | 39,144,833 | ||||||||||||
| Class D |
1.50 | 10,475 | 1.50 | 9,832 | ||||||||||||
| Class S |
1.36 | 2,401 | 1.34 | 4,112 | ||||||||||||
|
|
|
|
|
|||||||||||||
| Total |
$ | 78,862,866 | $ | 68,778,295 | ||||||||||||
|
|
|
|
|
|||||||||||||
| (1) | Taxed as a return of capital. The characterization of the amounts of dividends and distributions of net investment income are determined in accordance with federal income tax regulations, which may differ from U.S. GAAP. |
10. Capital Stock Transactions
At December 31, 2025, the Fund had 500 million shares of capital stock authorized with a par value of $0.001 per share. Transactions in shares of each class were as follows for the periods indicated:
| Year Ended December 31, 2025 |
Year Ended December 31, 2024 |
|||||||||||||||||||
| Shares | Amount | Shares | Amount | |||||||||||||||||
| Class I |
||||||||||||||||||||
| Shares issued |
15,130,572 | $ | 361,734,316 | 7,077,155 | $ | 180,692,516 | ||||||||||||||
| Shares issued on reinvestment |
357,236 | 8,543,366 | 221,904 | 5,684,427 | ||||||||||||||||
| Shares repurchased through tender offer |
(2,416,043 | ) | (58,223,362) | (1,982,950 | ) | (51,486,353) | ||||||||||||||
|
|
|
|
|
|||||||||||||||||
| Net increase |
13,071,765 | $ | 312,054,320 | 5,316,109 | $ | 134,890,590 | ||||||||||||||
|
|
|
|
|
|||||||||||||||||
| Class U |
||||||||||||||||||||
| Shares issued |
3,784,581 | $ | 90,892,411 | 2,724,685 | $ | 69,538,974 | ||||||||||||||
| Shares issued on reinvestment |
886,791 | 21,265,394 | 855,483 | 21,949,642 | ||||||||||||||||
| Shares repurchased through tender offer |
(6,308,758 | ) | (152,559,038) | (7,610,565 | ) | (197,475,904) | ||||||||||||||
|
|
|
|
|
|||||||||||||||||
| Net decrease |
(1,637,386 | ) | $ | (40,401,233) | (4,030,397 | ) | $ | (105,987,288) | ||||||||||||
|
|
|
|
|
|||||||||||||||||
| Class D |
||||||||||||||||||||
| Shares issued on reinvestment |
437 | 10,475 | 384 | 9,832 | ||||||||||||||||
|
|
|
|
|
|||||||||||||||||
| Net increase |
437 | $ | 10,475 | 384 | $ | 9,832 | ||||||||||||||
|
|
|
|
|
|||||||||||||||||
| Class S |
||||||||||||||||||||
| Shares issued on reinvestment |
99 | 2,378 | 143 | 3,699 | ||||||||||||||||
| Shares repurchased through tender offer |
(509 | ) | (12,639) | (1,171 | ) | (29,557) | ||||||||||||||
|
|
|
|
|
|||||||||||||||||
| Net decrease |
(410 | ) | $ | (10,261) | (1,028 | ) | $ | (25,858) | ||||||||||||
|
|
|
|
|
|||||||||||||||||
31
11. Tender Offers
On the commencement dates below, the Fund commenced tender offers for up to 5% of all of its outstanding shares of common stock subject to the right to purchase additional shares representing up to 2.0% of the Fund’s aggregate NAV without amending or extending the offer. The purchase prices of properly tendered Shares were equal to the net asset value per Share as of the close of the New York Stock Exchange trading session on the date the tender offer expired. The duly tendered Shares were not withdrawn.
| Commencement Date |
Expiration Date |
Announcement Date |
Share Class |
Total Shares Tendered(1) |
Total Shares Repurchased(1) |
Purchase Price | ||||||||||||||
| Class I | 830,389 | 630,608 | $26.93 | |||||||||||||||||
| December 13, 2023 |
January 12, 2024 | January 18, 2024 | Class U | 2,396,409 | 1,819,925 | $26.93 | ||||||||||||||
| Class I | 617,922 | 296,661 | $26.02 | |||||||||||||||||
| March 15, 2024 |
April 14, 2024 | April 19, 2024 | Class U | 4,361,423 | 2,092,235 | $26.02 | ||||||||||||||
| Class I | 708,940 | 398,779 | $25.59 | |||||||||||||||||
| June 12, 2024 |
July 12, 2024 | July 17, 2024 | Class U | 3,442,792 | 1,936,322 | $25.59 | ||||||||||||||
| Class I | 942,118 | 656,902 | $25.24 | |||||||||||||||||
| Class U | 2,526,285 | 1,762,083 | $25.24 | |||||||||||||||||
| September 13, 2024 |
October 11, 2024 | October 15, 2024 | Class S | 1,680 | 1,171 | $25.24 | ||||||||||||||
| Class I | 481,081 | 481,081 | $24.83 | |||||||||||||||||
| Class U | 1,615,384 | 1,615,384 | $24.83 | |||||||||||||||||
| December 11, 2024 |
January 10, 2025 | January 14, 2025 | Class S | 509 | 509 | $24.83 | ||||||||||||||
| Class I | 365,898 | 365,898 | $24.24 | |||||||||||||||||
| March 14, 2025 |
April 11, 2025 | April 15, 2025 | Class U | 1,884,621 | 1,884,621 | $24.24 | ||||||||||||||
| Class I | 1,215,575 | 1,215,575 | $23.90 | |||||||||||||||||
| June 11, 2025 |
July 11, 2025 | July 15, 2025 | Class U | 1,410,437 | 1,410,437 | $23.90 | ||||||||||||||
| Class I | 353,489 | 353,489 | $23.64 | |||||||||||||||||
| September 18, 2025 |
October 17, 2025 | October 21, 2025 | Class U | 1,398,316 | 1,398,316 | $23.64 | ||||||||||||||
| Class I | 2,868,766 | 2,332,806 | $23.50 | |||||||||||||||||
| December 10, 2025 |
January 9, 2026 | January 13, 2026 | Class U | 744,401 | 605,330 | $23.49 | ||||||||||||||
| (1) | Subsequent to certain tender offer expiration dates, the Fund accepted repurchase requests that were submitted timely and in good order by a Fund stockholder, and as a result, the number of shares tendered and repurchased in connection with certain tender offers, reported in this shareholder report on Form N-CSR, differ immaterially from the number of shares reported as tendered and repurchased in certain Fund Schedule TO filings. |
12. Risk Considerations
An investment in the Fund, and the Fund’s investments, will be subject to the risks inherent in the ownership and operation of real estate and real estate-related businesses and assets, among other risks. These risks include, but are not limited to, those described below:
Private Commercial Real Estate Risk — Lease defaults, terminations by one or more tenants or landlord-tenant disputes may reduce the Fund’s revenues and net income. Any of these situations may result in extended periods during which there is a significant decline in revenues or no revenues generated by a property. If this occurred, it could adversely affect the Fund’s results of operations. The Fund’s financial position and its ability to make distributions may also be adversely affected by financial difficulties experienced by any major tenants, including bankruptcy, insolvency or a general downturn in the business, or in the event any major tenants do not renew or extend their relationship as their lease terms expire. A tenant in bankruptcy may be able to restrict the ability to collect unpaid rents or interest during the bankruptcy proceeding. Furthermore, dealing with a tenants’ bankruptcy or other default may divert management’s attention and cause the Fund to incur substantial legal and other costs. The Fund’s investments in real estate will be pressured in challenging economic and rental market conditions. If the Fund is unable to re-let or renew leases for all
32
or substantially all of the space at these properties, if the rental rates upon such renewal or re-letting are significantly lower than expected, or if the Fund’s reserves for these purposes prove inadequate, the Fund will experience a reduction in net income and may be required to reduce or eliminate cash distributions. The Fund may obtain only limited warranties when it purchases an equity investment in private commercial real estate. The purchase of properties with limited warranties increases the risk that the Fund may lose some or all of its invested capital in the property, as well as the loss of rental income from that property if an issue should arise that decreases the value of that property and is not covered by the limited warranties. If any of these results occur, it may have a material adverse effect on the Fund’s business, financial condition and results of operations and the Fund’s ability to make distributions.
Prime Single Tenant Risk — The Fund depends on its tenants for revenue, and therefore the Fund’s revenue is dependent on the success and economic viability of its tenants. The Fund’s reliance on single tenants in prime single tenant properties may decrease its ability to lease vacated space and could adversely affect its income, performance, operations and ability to pay distributions. Certain of the Fund’s investments in properties will be leased out to single tenants that the Adviser believes have favorable credit profiles and/or performance attributes supporting highly visible long-term cash flows. Adverse impacts to such tenants, businesses or operators, including as a result of changes in market or economic conditions, natural disasters, outbreaks of an infectious disease, pandemic or any other serious public health concern, political events or other factors that may impact the operation of these properties, may have negative effects on our business and financial results.
Liquidity Risk — The Fund is designed primarily for long-term investors and an investment in the Fund’s common stock should be considered illiquid. The common stock is not currently listed for trading on any securities exchange. There is currently no public market for the common stock and none is expected to develop. Although the Fund may offer to repurchase common stock from stockholders, no assurance can be given that these repurchases will occur as scheduled or at all.
CMBS Risk — CMBS are, generally, securities backed by obligations (including certificates of participation in obligations) that are principally secured by mortgages on real property or interests therein having a multifamily or commercial use, such as regional malls, other retail space, office buildings, industrial or warehouse properties, hotels, nursing homes and senior living centers. CMBS are subject to particular risks, including lack of standardized terms, shorter maturities than residential mortgage loans and payment of all or substantially all of the principal only at maturity rather than regular amortization of principal. The Fund has historically invested a significant portion of its portfolio in CMBS.
Single Family Rental Market Risk — A portion of the Fund’s investment portfolio will consist of interests in private investment vehicles that own or otherwise have interests in single family rental properties that are professionally managed. The Fund may also have direct interests in single family rental properties or debt instruments or preferred equity securities providing exposure to such properties. Until recently, the single family rental business consisted primarily of private and individual investors in local markets and was managed individually or by small, non-institutional owners and property managers, many of which may have more specialized market knowledge than the Adviser. Entry into this market by large, well-capitalized investors is a relatively recent trend, so few peer funds or companies exist and none have yet established long-term track records that might assist the Adviser in predicting whether such a business model and investment strategy can be implemented and sustained over an extended period of time. A downturn or slowdown in the rental demand for single family housing caused by adverse economic, regulatory, or environmental conditions, or other events may have an impact on the value of the Fund’s assets or operating results. There may be seasonal fluctuations in rental demand, with demand higher in the spring and summer than in the late fall and winter. Such seasonal fluctuations may impact the Fund’s performance.
Leverage Risk — The Fund may use leverage in connection with its investments. Leverage may result in greater volatility of the NAV of, and distributions on, the common stock because changes in the value of the Fund’s portfolio investments, including investments purchased with the proceeds from borrowings or the issuance of Preferred Stock, if any, are borne entirely by holders of common stock.
Risks Related to Developments in the Banking Sector — Uncertainty caused by bank failures—and general concern regarding the financial health and outlook for other financial institutions—could have an overall negative effect on banking systems and financial markets generally. The developments could also have other implications for broader economic and monetary policy, including interest rate policy. There can be no assurances that conditions in the banking sector and in global financial markets will not worsen and/or adversely affect the Fund or one or more of its portfolio investments or its overall performance.
33
Risks Related to the Fund’s REIT Status — The Fund expects to operate so as to qualify as a REIT under the Code. However, qualification as a REIT involves the application of highly technical and complex Code provisions for which only a limited number of judicial or administrative interpretations exist. Notwithstanding the availability of cure provisions in the Code, various compliance requirements could be breached and could jeopardize the Fund’s REIT status.
Valuation Risk — Within the parameters of the Fund’s valuation guidelines and applicable U.S. Securities and Exchange Commission and accounting rules and guidance, the valuation methodologies used to value the Fund’s assets will involve subjective judgments and projections and that ultimately may not materialize. Ultimate realization of the value of an asset depends to a great extent on economic, market and other conditions beyond the Fund’s control and the control of the Adviser and the Independent Valuation Advisor. Rapidly changing market conditions or material events may not be immediately reflected in our daily NAV.
Investment and Market Risk — An investment in the Fund involves a considerable amount of risk. Before making an investment decision, a prospective investor should (i) consider the suitability of this investment with respect to his or her investment objectives and personal situation and (ii) consider factors such as his or her personal net worth, income, age, risk tolerance and liquidity needs. An investment in common stock represents an indirect investment in the assets owned by the Fund, and the value of these assets will fluctuate, sometimes rapidly and unpredictably, and such investment is subject to investment risk, including the possible loss of the entire principal amount invested. The Fund will be materially affected by market, economic and political conditions globally and in the jurisdictions and sectors in which it invests or operates, including factors affecting interest rates, the availability of credit, currency exchange rates and trade barriers.
Inflation Risk — Globally, inflation and rapid fluctuations in inflation rates have in the past had negative effects on economies and financial markets, particularly in emerging economies, and may do so in the future. Wages and prices of inputs increase during periods of inflation, which can negatively impact investment returns. In an attempt to stabilize inflation, governments may impose wage and price controls, or otherwise intervene in the economy. Governmental efforts to curb inflation often have negative effects on levels of economic activity.
Interest Rate Risk — The Fund’s investments will expose it to interest rate risk, meaning that changes in prevailing market interest rates could negatively affect the value of such investments. If interest rates increase, so could the Fund’s interest costs for new debt, including variable rate debt obligations under any credit facility or other financing. This increased cost could make the financing of any development or acquisition more costly. Changes in interest rates may also affect certain of the Fund’s investments in traded real estate-related securities to the extent such debt does not float as a result of floors or otherwise. Factors that will affect market interest rates include, without limitation, inflation, deflation, slow or stagnant economic growth or recession, unemployment, money supply, governmental monetary policies, international disorders and instability in domestic and foreign financial markets.
Illiquid Investment Risk — Many of the Fund’s investments will be illiquid, including the Fund’s commercial real estate investments. A variety of factors could make it difficult for the Fund to dispose of any of its illiquid assets on acceptable terms even if a disposition is in the best interests of the Fund’s stockholders. The Fund cannot predict whether it will be able to sell any asset for the price or on the terms set by it or whether any price or other terms offered by a prospective purchaser would be acceptable to the Fund.
Non-U.S. Investment Risk — The Fund has in the past invested and may in the future continue to invest in real estate located outside of the United States and real estate debt issued in, and/or backed by real estate in, countries outside the United States, including Asia and Europe. Non-U.S. real estate and real estate-related investments involve certain factors not typically associated with investing in real estate and real estate-related investments in the U.S., including risks relating to (i) currency exchange matters; (ii) differences in conventions relating to documentation, settlement, corporate actions, stakeholder rights and other matters; (iii) differences between U.S. and non-U.S. real estate markets, including potential price volatility in and relative illiquidity of some non-U.S. markets; (iv) the absence of uniform accounting, auditing and financial reporting standards, practices and disclosure requirements and differences in government supervision and regulation; (v) certain economic, social and political risks; (vi) the possible imposition of non-U.S. taxes on income and gains and gross sales or other proceeds recognized with respect to such investments; (vii) differing and potentially less well-developed or well-tested corporate laws regarding stakeholder rights, creditors’ rights (including the rights of secured parties), fiduciary duties and the protection of investors; (viii) different laws and regulations including differences in the legal and regulatory environment or enhanced legal and regulatory compliance; (ix) political hostility to investments by foreign investors; (x) less publicly available information; (xi) obtaining or enforcing a court judgement abroad; (xii) restrictions on foreign investment in other jurisdictions; and (xiii) difficulties in effecting repatriation of capital.
34
Trade Risk — In recent years, the U.S. government has indicated its intent to alter its approach to international trade policy and in some cases to renegotiate, or potentially terminate, certain existing bilateral or multi-lateral trade agreements and treaties with foreign countries, and has made proposals and taken actions related thereto. Tariffs on imported goods could further increase costs, decrease margins, reduce the competitiveness of products and services offered by current and future tenants and adversely affect the revenues and profitability of the Fund’s tenants whose businesses rely on goods imported from such impacted jurisdictions.
There is uncertainty as to further actions that may be taken under the current U.S. administration with respect to U.S. trade policy. Further governmental actions related to the imposition of tariffs or other trade barriers or changes to international trade agreements or policies, could further increase costs, decrease margins, reduce the competitiveness of products and services offered by current and future portfolio companies and adversely affect the revenues and profitability of companies whose businesses rely on goods imported from outside of the United States.
For more information on these and other risks, refer to the Fund’s prospectus.
13. Federal Income Taxes
The timing and characterization of certain income, capital gains, and return of capital distributions are determined annually in accordance with federal tax regulations, which may differ from GAAP. As a result, the net investment income (loss) and net realized gain (loss) on investment transactions for a reporting period may differ significantly from distributions during such period. These book/tax differences may be temporary or permanent in nature. To the extent these differences are permanent, they are charged or credited to paid-in capital, accumulated net investment income/loss or accumulated net realized gain/loss, as appropriate, in the period in which the differences arise.
GAAP requires that certain components of net assets be reclassified to reflect permanent differences between financial and tax reporting. These reclassifications have no effect on net assets or net asset value per share. During the current period, the Fund did not have any reclassifications.
For the year ended December 31, 2025, the tax character of distributions paid by the Fund was $78,862,866 of return of capital.
The following shows the components of distributable earnings (losses) on a federal income tax basis at December 31, 2025:
| Accumulated net operating loss |
$ | (99,481,505) | ||||
| Net unrealized depreciation |
(141,287,895) | |||||
| Other book/tax temporary differences |
228,469,442 | |||||
|
|
|
|||||
| Total distributable earnings (losses) |
$ | (12,299,958) | ||||
|
|
|
At December 31, 2025, the federal tax basis, aggregate gross unrealized appreciation and depreciation of investments held by the Fund were as follows:
| Federal tax cost |
$ | 1,290,480,155 | ||
|
|
|
|||
| Gross unrealized appreciation |
$ | 169,410,224 | ||
| Gross unrealized depreciation |
(51,042,586) | |||
|
|
|
|||
| Net unrealized appreciation |
$ | 118,367,638 | ||
|
|
|
|||
Taxable income amounts disclosed above are estimates based on the best available information as of the date of this report.
35
Report of Independent Registered Public Accounting Firm
To the Stockholders and the Board of Directors of KKR Real Estate Select Trust Inc.
Opinion on the Financial Statements and Financial Highlights
We have audited the accompanying consolidated statement of assets and liabilities of KKR Real Estate Select Trust Inc. (the “Fund”), including the consolidated schedule of investments, as of December 31, 2025, the related consolidated statements of operations and cash flows for the year then ended, the consolidated statements of changes in net assets for each of the two years in the period then ended, the consolidated financial highlights for each of the five years in the period then ended, and the related notes (collectively referred to as the “financial statements”). In our opinion, the financial statements and financial highlights present fairly, in all material respects, the consolidated financial position of the Fund as of December 31, 2025, and the consolidated results of its operations and its cash flows for the year then ended, the consolidated changes in its net assets for each of the two years in the period then ended, and consolidated financial highlights for each of the five years in the period then ended in conformity with accounting principles generally accepted in the United States of America.
Basis for Opinion
These financial statements and financial highlights are the responsibility of the Fund’s management. Our responsibility is to express an opinion on the Fund’s financial statements and financial highlights based on our audits. We are a public accounting firm registered with the Public Company Accounting Oversight Board (United States) (PCAOB) and are required to be independent with respect to the Fund in accordance with the U.S. federal securities laws and the applicable rules and regulations of the Securities and Exchange Commission and the PCAOB.
We conducted our audits in accordance with the standards of the PCAOB and in accordance with auditing standards generally accepted in the United States of America. Those standards require that we plan and perform the audit to obtain reasonable assurance about whether the financial statements and financial highlights are free of material misstatement, whether due to error or fraud. The Fund is not required to have, nor were we engaged to perform, an audit of its internal control over financial reporting. As part of our audits, we are required to obtain an understanding of internal control over financial reporting but not for the purpose of expressing an opinion on the effectiveness of the Fund’s internal control over financial reporting. Accordingly, we express no such opinion.
Our audits included performing procedures to assess the risks of material misstatement of the financial statements and financial highlights, whether due to error or fraud, and performing procedures that respond to those risks. Such procedures included examining, on a test basis, evidence regarding the amounts and disclosures in the financial statements and financial highlights. Our audits also included evaluating the accounting principles used and significant estimates made by management, as well as evaluating the overall presentation of the consolidated financial statements and financial highlights. Our procedures included confirmation of securities owned as of December 31, 2025, by correspondence with the custodian and brokers. We believe that our audits provide a reasonable basis for our opinion.
/s/ Deloitte & Touche LLP
New York, New York
February 24, 2026
We have served as the auditor of one or more KKR Family of Registered Investment Companies since 2013.
36
Adjusted Funds from Operations and Funds Available for Distribution (Unaudited)
We believe adjusted funds from operations (“AFFO”) is a meaningful non-GAAP supplemental measure of the operating results of the Fund and its investments excluding the impact of certain non-cash items. The Fund defines AFFO as the increase in net assets applicable to Common Stockholders from operations (calculated in accordance with GAAP), excluding (i) the change in net unrealized (appreciation) depreciation of investments, (ii) amortization premium (accretion of discount) on real estate securities, (iii) amortization of deferred origination fees on real estate loans, (iv) amortization of deferred financing costs, (v) management fees, incentive fees, and directors’ fees paid in shares of the Fund, (vi) realized (gains) losses, and (vii) stockholder specific expenses and including undistributed income attributable to the Fund’s unconsolidated subsidiaries. Stockholder specific expenses are included within Total Distributions, distribution and servicing fees to reflect that distributions paid on each of the Fund’s share class are generally reduced relative to the distributions paid to Class I stockholders by such amounts.
AFFO should not be considered to be more relevant or accurate than the GAAP methodology in evaluating our operating performance. In addition, AFFO should not be considered as alternatives to net investment income (loss) or increase (decrease) in net assets applicable to common stockholders from operations, or as indications of our performance, but rather should be reviewed in conjunction with these and other GAAP measurements. Further, AFFO is not intended to be used as liquidity measures indicative of cash flow available to fund our cash needs, including our ability to make distributions to our stockholders.
| For the Year Ended December 31, 2025 |
||||
|
Increase in Net Assets Applicable to Common Stockholders from operations |
$ |
3,878,974 |
| |
| Adjustments to arrive at AFFO: |
||||
| Change in net unrealized (appreciation) depreciation |
31,489,805 | |||
| Amortization of premium (accretion of discount) on real estate securities |
(164,500) | |||
| Amortization of fees on real estate loans |
(1,736,525) | |||
| Amortization of deferred financing costs |
887,400 | |||
| Non-cash management fees |
16,236,646 | |||
| Non-cash incentive fees |
6,459,411 | |||
| Non-cash directors’ fees |
300,000 | |||
| Realized (gain) loss on foreign currency transactions |
312 | |||
| Realized (gain) loss on investments |
208,992 | |||
| Realized (gain) loss on forward foreign currency contracts |
(304,045) | |||
| Distribution and servicing fees |
5,454,146 | |||
| Undistributed income attributable to non-consolidated joint ventures |
4,955,021 | |||
|
|
|
|||
| AFFO attributable to Common Stockholders |
67,665,637 | |||
|
|
|
|||
| Distributions to Common Stockholders |
78,862,866 | |||
| Distribution and servicing fees |
5,454,146 | |||
|
|
|
|||
| Total Distributions, distribution and servicing fees |
$ | 84,317,012 | ||
|
|
|
|||
37
Directors and Officers (Unaudited)
| Name, Year of Birth |
Position(s) with the Fund |
Term of Office and Length of Time Served |
Principal
Occupation(s) |
Number of Registered Investment Companies in Fund Complex Overseen by Director (2) |
Other Directorships Held by Director | |||||||||
| Interested Directors | ||||||||||||||
| Ralph Rosenberg (1964) | Chairman and Director | Since July 2020 | Chairman of Real Assets (since 2025); Global Head of KKR Real Estate (2011-2024) | 1 | KKR Real Estate Finance Trust Inc. | |||||||||
| Julia Butler (1978) | Director, Chief Executive Officer and President | |
Since August 2024 |
|
Chief Investment Officer of the Fund (May 2023-August 2024), Managing Director, KKR Real Estate (since 2017) | 1 | None | |||||||
| Matt Salem (1974) | Director and Vice Chairman | |
Since August 2024 |
|
Partner, Head of Real Estate Credit (since 2015) | 1 | KKR Real Estate Finance Trust Inc. | |||||||
| Independent Directors | ||||||||||||||
| Fran Bermanzohn (1957) | Director | Since July 2020 | Managing Director and Deputy General Counsel, Goldman Sachs (1992-2018) |
1 | None | |||||||||
| Joan Binstock (1954) | Director | Since July 2020 | Senior Advisor at Lovell Minnick Partners, LLC (since June 2018); Partner at Lord, Abbett & Co. LLC, including positions as Chief Operations Officer and Chief Financial Officer (1999 - 2018) | 1 | Brown Brothers Harriman US Mutual Funds; Morgan Stanley Direct Lending Funds, including North Haven Private Income Fund(s); 2023 ETF Series Trust | |||||||||
| James Kropp (1949) | Director | Since July 2020 | Director, FS KKR Capital Corp. (since 2018); Director, KKR Real Estate Select Trust Inc. (since 2020); Trustee, AMH (formerly American Homes 4 Rent) (2012-2025); Director, PS Business Parks Inc. (1998 – 2021); CFO, Microproperties LLC (2012 – 2019); CIO, SLKW Investments LLC (2009 – 2019). | 4 | FS KKR Capital Corp.; KKR FS Income Trust; KKR FS Income Trust Select; KKR Enhanced US Direct Lending Fund-L Inc. | |||||||||
| Susan Meaney (1960) | Director | Since July 2020 | Senior Advisor, KSL Capital Partners (since May 2020); Managing Director, Makena Capital Management (2006-2019) | 1 | None | |||||||||
| (1) | Each Director may be contacted by writing to the Director, c/o KKR Registered Advisor LLC, 30 Hudson Yards, New York, NY 10001, Attn: General Counsel. |
| (2) | The Fund Complex is comprised of the Fund, KKR Asset-Based Finance Fund, KKR Income Opportunities Fund, KKR Asset-Based Income Fund and KKR US Direct Lending Fund-U Inc. |
38
Principal Officers who are not Directors
| Name, Year of Birth |
Position(s) with Fund |
Term of Office Served |
Principal Occupation(s) During Past 5 Years | |||
| Nicholas O’Neill (1989) |
Chief Operating Officer | Since April 2025 | Chief Operating Officer, Goldman Sachs REIT (Since 2021); Vice President, Goldman Sachs Real Estate (2023-2024); Vice president and Associate, Goldman Sachs Real Estate Investing (2018-2020) | |||
| Megan Gaul (1976) |
Treasurer, Chief Financial Officer and Chief Accounting Officer |
Since July 2020 | Managing Director, KKR Finance Group (since 2020); Chief Financial Officer, Chief Operating Officer and Chief Compliance Officer of Willow Tree Credit Partners (November 2017-January 2020) | |||
| James Amler (1977) |
Chief Compliance Officer | Since November 2025 | Director, KKR Private Markets (since 2024); Counsel, Debevoise & Plimpton LLP (2007-2024) | |||
| Lori Hoffman (1988) |
Chief Legal Officer and Secretary | Since July 2020 | Director, KKR Credit Advisors (US) LLC (since 2020) | |||
| Doug Krupa (1978) |
Vice President and Head of Investor Relations | Since July 2020 | Partner and Head of Global Wealth Solutions, KKR Client and Partner Group (since 2019) | |||
| (1) | Each Officer may be contacted by writing to the Officer, c/o KKR Registered Advisor LLC, 30 Hudson Yards, New York, NY 10001, Attn: General Counsel. |
39
Continuation of Investment Advisory Agreement (Unaudited)
At a meeting of the Board of Directors (the “Board”) of KKR Real Estate Select Trust Inc. (the “Fund”) held on November 18, 2025 (the “Meeting”), the members of the Board, including the Directors who are not “interested persons” of the Fund (the “Independent Directors”), as defined in the Investment Company Act of 1940, as amended, considered and unanimously approved the continuance of the investment advisory agreement (the “Investment Advisory Agreement”) between KKR Registered Advisor LLC (the “Adviser”) and the Fund for another year.
The Board’s Evaluation Process
Prior to the Meeting, the Independent Directors had requested and received materials that the Independent Directors deemed reasonably necessary for the Board’s review of the Investment Advisory Agreement, including, but not limited to, materials comparing the Fund’s fees, expenses and performance to a collection of registered closed-end funds and real estate investment trusts (“REITs”) believed by the Adviser to have comparable investment objectives and strategies (collectively, the “Peer Funds”). The Independent Directors met prior to the Meeting to discuss these materials and were advised by their legal counsel of the duties and responsibilities of board members in considering approval of the Investment Advisory Agreement. At the Meeting, the Independent Directors, together with their independent legal counsel, discussed with management the materials that had been provided in response to their request as well as additional information presented by the Adviser. In addition, the Board took into account the information provided to the Board and its committees throughout the year, in considering whether to approve the continuance of the Investment Advisory Agreement.
In its consideration of the approval of the continuance of the Investment Advisory Agreement, the Board considered various factors, including, but not limited to, the following:
Nature, Extent and Quality of Services
In considering the nature, extent and quality of services provided by the Adviser, the Board members relied on their ongoing experience as Directors of the Fund, their collective experience with real estate and real estate-related funds and the experience of certain Independent Directors as directors of other closed-end funds or business development companies, as well as on the materials provided at and prior to the Meeting. The Board reviewed and considered the nature and extent of the investment advisory services provided by the Adviser under the Investment Advisory Agreement, including portfolio management, investment research and overseeing portfolio transactions. The Board noted that the Adviser receives support from its ultimate parent, KKR & Co., Inc. (“KKR”) and other affiliates (collectively, the “Adviser Affiliates”) in providing services to the Fund and its subsidiaries. The Board noted in particular the significant support that KKR provided the Fund and its shareholders by making a substantial new investment in the Fund and putting its investment at risk by implementing the Shareholder Priority Plan (“SPP”) that was publicly announced in June 2024.
The Board considered information regarding the programs for and resources devoted to risk management by the Adviser and Adviser Affiliates, including management of investment, enterprise, operational, liquidity, valuation and compliance risks, and technology used to manage such risks.
The Board also considered the additional services provided by the Adviser and the Adviser Affiliates to the Fund due to the fact that the Fund is a closed-end tender offer fund, including, but not limited to, leverage management and facilitation and management of the Fund’s quarterly repurchase offers. The Board also considered non-advisory services that the Adviser and Adviser Affiliates provide to the Fund and its subsidiaries and assets, such as debt arrangement, property management, various back office support functions, internal audit, valuation, portfolio trading and legal and compliance. The Board noted that the Adviser, in collaboration with KKR Fund Administration LLC, the affiliated administrator of the Fund, coordinates and oversees the provision of services provided to the Fund by other service providers.
The Board reviewed and considered the qualifications, background and experience of the investment team and other key personnel of the Adviser and Adviser Affiliates who provide advisory and non-advisory services to the Fund. The Board noted the addition of Julia Butler and Matt Salem, each a senior leader at KKR, to the Board in August 2024. The Board also considered the resources, operations and practices of the Adviser and the Adviser Affiliates both generally and in managing the Fund’s portfolio. The Board
40
noted the substantial experience and expertise of the Adviser and the Adviser Affiliates as real estate investors, including managing real estate portfolios comprised of equity and debt, and their analytical and risk management capabilities. The Board also considered how the depth and breadth of global real estate-related investments by KKR and its affiliates had and could benefit the Fund. The Board determined that the nature, extent and quality of services provided by the Adviser to the Fund were appropriate and that the Fund should continue to benefit from these services as a result of the experience, personnel, operations and resources of the Adviser and the Adviser Affiliates and KKR’s commitment to the Fund.
Performance, Fees and Expenses of the Fund
With regard to the Fund’s management and incentive fee, total expenses and performance, the Board received comparative data prepared by an independent investment bank and data provider dedicated to the real estate sector (the “Independent Data Provider”). The Board also received information on the methodology used by the Independent Data Provider to determine the Peer Funds.
The Board considered the performance of the Fund for various time periods under the management of the Adviser on an absolute basis and in comparison to the performance of the Peer Funds as well as the MSCI US REIT Gross Total Return Index and Cohen & Steers Realty Majors Index. The Board noted that the Fund’s performance for these periods was below the median cumulative and annualized since inception performance of the Peer Funds and the MSCI US REIT Gross Total Return Index and above the cumulative and annualized since inception performance of the Cohen & Steers Realty Majors Index. The Adviser also discussed with the Board the key contributors to and detractors from the Fund’s performance during the period. The Board acknowledged limitations regarding the comparative data, in particular that differences may exist between the investment objective, principal investment strategies and/or investment restrictions of the Fund and the Peer Funds.
The Board discussed with the Adviser the Fund’s fees and expenses relative to the Peer Funds and other accounts advised by the Adviser or its affiliates. The Board considered the similarities and differences in fee structures among the Fund and the Peer Funds and the potential effect of those differences on total expenses. The Board noted that the Fund’s base management fee was equal to the management fee charged by a majority of the Peer Funds structured as REITs but higher than the remaining Peer Funds, including certain Peer Funds structured as tender offer funds. The Board considered that over the long-term, the Fund’s 12.5% incentive fee was anticipated to be lower compared to the REIT Peer Funds since the Fund’s incentive fee is charged only on the Fund’s portfolio operating income and the REIT Peer Funds charge such fees on total return, noting that the Peer Funds structured as tender offer funds charged a lower or no incentive fee. The Board also discussed the rationale for the Fund’s incentive fee not including a minimum rate of return, in contrast to the incentive fee of certain REIT Peer Funds.
The Board noted that the Fund’s expense ratio, both including and excluding incentive fees, was slightly above the expense ratio mean and median of the Peer Funds. The Board considered the expense limitation and reimbursement agreement between the Fund and the Adviser (“Expense Limitation Agreement”) pursuant to which the Adviser will waive its monthly management fee and/or pay, absorb or reimburse certain Fund expenses so that, for any fiscal year, the expenses specified in the Expense Limitation Agreement do not exceed 0.50% of the average daily value of the Fund’s net assets.
Following its review, in light of the nature, extent and quality of services that the Fund receives, the Board determined that the Fund’s performance under the management of the Adviser was satisfactory and that the Fund’s fees and expenses were reasonable.
Economies of Scale
The Board considered the size and growth prospects of the Fund and how they relate to the structure of the Fund’s advisory fee schedule, which does not include breakpoints. The Board concluded that the Fund’s advisory fee is appropriate in light of the size of the Fund and appropriately reflects the current economic and competitive environment for the Adviser. The Board also observed that it will have the opportunity to periodically re-examine whether the Fund has achieved economies of scale in the future as the Fund grows to determine if and how any such economies of scale could be shared with the Fund and its investors.
41
Profitability of the Adviser
The Board considered the profitability of the Adviser from its relationship with the Fund. The Board had been provided information concerning revenues from and costs incurred by the Adviser under the Investment Advisory Agreement, including the Adviser’s cost allocation methodology. The Board noted the information provided indicated that the Adviser had earned a profit from its management of the Fund during the measurement period. The Board concluded that the profit earned by the Adviser was not unreasonable.
Other Benefits of the Relationship
The Board considered other benefits to the Adviser and the Adviser Affiliates derived from their relationship with the Fund, including, but not limited to, the revenues earned by certain Adviser Affiliates for providing services to the Fund or its subsidiaries and potential benefits from joint venture arrangements involving the Fund’s subsidiaries or assets. Based on information provided by and discussions with the Adviser, the Board concluded that these benefits, sometimes referred to as “fall out” benefits, were not unreasonable.
Resources of the Adviser and Relationship with the Fund
The Board considered the financial circumstances of the Adviser and whether the Adviser has the resources necessary to perform its obligations under the Investment Advisory Agreement. The Board noted in this regard the substantial financial commitment that an Adviser Affiliate had made to provide the initial seed capital for the Fund, its additional capital contribution in 2024 and its implementation of the SPP. The Board also reviewed and considered the proposed relationship between the Fund and the Adviser, including the policies and procedures formulated and adopted by the Adviser for managing the Fund’s operations and the Board’s confidence in the competence and integrity of senior managers and key personnel of the Adviser and the Adviser Affiliates. The Board concluded that the Adviser has the financial resources necessary to fulfill its obligations under the Investment Advisory Agreement and that it is beneficial for the Fund to continue this relationship with the Adviser.
Other Factors
The Board considered the controls and procedures adopted and implemented by the Adviser and monitored by the Fund’s Chief Compliance Officer and concluded that the conduct of business by the Adviser demonstrates a good faith effort on its part to adhere to high ethical standards in the conduct of the Fund’s business.
General Conclusion
After considering and weighing all of the above factors, the Board concluded that the advisory fee (including both the base management fee and incentive fee) was reasonable in light of the services provided by the Adviser and that it would be in the best interests of the Fund and its shareholders to approve renewal of the Investment Advisory Agreement for another year. In reaching this conclusion the Board did not give particular weight to any single factor referenced above. Individual Board members may have ascribed different weights to these factors in their individual considerations in reaching their unanimous decision to approve the renewal of the Investment Advisory Agreement.
42
Dividend Reinvestment Plan (Unaudited)
Pursuant to the Fund’s Distribution Reinvestment Plan (the “DRIP”), income dividends and/or capital gain distributions to stockholders will automatically be reinvested in additional shares of common stock (“Shares”) by SS&C Global Investor & Distribution Solutions, Inc. (the “DRIP Administrator”) unless the stockholders elect to receive cash. A stockholder may terminate participation in the DRIP at any time by notifying the DRIP Administrator by telephone at (855) 844-8655 or in writing to SS&C Global Investor & Distribution Solutions, Inc. at KKR Real Estate Select Trust, Inc., PO Box 219302, Kansas City, MO 64121-9302. Stockholders whose Shares are held in the name of a broker or other nominee and who wish to elect to receive any dividends and distributions in cash must contact their broker or nominee. All distributions to stockholders who do not participate in the DRIP, or have elected to terminate their participation in the DRIP, are paid by wire or check mailed directly to the record holder by or under the direction of the DRIP Administrator when the Fund’s board of directors declares a distribution.
The DRIP Administrator maintains all stockholder accounts in the DRIP and furnishes written confirmations of all transactions in the account, including information needed by stockholders for tax records. Shares in the account of each DRIP participant are held by the DRIP Administrator in non-certificated form in the name of the participant, and each stockholder’s proxy includes Shares purchased pursuant to the DRIP. The DRIP Administrator will forward all proxy solicitation materials to participants and vote proxies for Shares held under the DRIP in accordance with the instructions of the participants.
There is no charge to participants for reinvesting regular distributions and capital gains distributions; however, the Fund reserves the right to amend the DRIP to include a service charge payable by the participants. The fees of the DRIP Administrator for handling the reinvestment of regular distributions and capital gains distributions are included in the fee to be paid by us to our transfer agent. There are no brokerage charges with respect to Shares issued directly by us as a result of regular distributions or capital gains distributions payable either in Shares Stock or in cash.
The automatic reinvestment of such dividends or distributions does not relieve participants of any income tax that may be payable on such dividends or distributions. The Fund reserves the right to amend or terminate the DRIP at any time. Any expenses of the DRIP will be borne by the Fund. All correspondence or questions concerning the DRIP should be directed to the DRIP Administrator.
For direct stockholders, if you elect to receive distributions and/or capital gains paid in cash, and the U.S. Postal Service cannot deliver the check, or if a check remains outstanding for six months, the Fund reserves the right to reinvest the distribution check in your account, at the Fund’s current net asset value, and to reinvest all subsequent distributions. Stockholders that invest through a financial intermediary should contact their financial intermediary directly.
43
Protection and Security of Your Personal Information
Kohlberg Kravis Roberts & Co. L.P. (“KKR”) respects our investors’ right to privacy. All financial companies choose how they share personal information. Consumers have the right under U.S. federal law to limit some, but not all, sharing of personal information. U.S. federal law also requires us to inform you how we collect, share and protect your personal information. Investors may also have additional limiting rights under their respective State’s law. This notice is provided by KKR, its affiliates, and funds (“KKR”, “we”, or “us”). Please read this notice carefully to understand what we do, and call us at (212) 750-8300 if you have any questions.
The Personal Information We Collect and How We Collect It
We collect the following types of personal information about individuals who are our investors:
| • | Information we receive from investors in subscription agreements, questionnaires and in other forms, such as name, address, account information, social security number, the types and amounts of investments, statements of net worth, telephone number, and other contact information; |
| • | Information we receive from investors, affiliates and other companies about investors’ transactions with us, our affiliates, or other financial institutions with which we have relationships; and |
| • | Information we receive from third parties such as demographic information and information collected to comply with law and regulation. |
When you are no longer an investor with us, we continue to share your information as described in this notice.
How and Why We Share Personal Information
This section lists reasons why financial companies can share their customers’ personal information. With respect to each reason, we explain whether KKR chooses to share for this reason and, if we do share, whether you can limit this sharing.
| • | For everyday business purposes: KKR shares personal information for everyday business purposes, such as to |
| • | process your transactions; |
| • | provide financial products or services to you; |
| • | maintain your investment(s); |
| • | secure business services, including printing, mailing, and processing or analyzing data; |
| • | secure professional services, including accounting and legal services; or |
| • | respond to court orders and legal investigations. |
You cannot limit sharing by KKR for everyday business purposes.
| • | For our marketing purposes: KKR shares personal information for our marketing purposes so that we can offer products and services to you. You cannot limit sharing by KKR for this reason. |
| • | For joint marketing with other financial companies: KKR does not share personal information for joint marketing with other financial companies. |
| • | For use by affiliates in providing products and services to you: KKR shares personal information for our affiliates’ use in providing you with products and services that meet your financial services needs. You cannot limit sharing by KKR for this reason. |
| • | For the everyday business purposes of affiliates: KKR does not share personal information, including information about your credit worthiness, with our affiliates for their everyday business purposes. |
44
| • | For use by affiliates to market to you: KKR does not share personal information with affiliates so that they can market to you. |
| • | For use by non-affiliates to market to you: KKR does not share personal information with non-affiliates so that they can market to you. |
U.S. Federal law gives you the right to limit sharing of your personal information only for use (i) by affiliates everyday business purposes (information about your creditworthiness), (ii) by affiliates to market to you, and (iii) by non-affiliates to market to you. U.S. State laws and individual companies may give you additional rights to limit sharing.
How We Protect Your Personal Information
To protect your personal information from unauthorized access and use, we use security measures that comply with federal law. These measures include computer safeguards and secured files and buildings.
Definitions
Affiliates: Companies related by common ownership or control. They can be financial and nonfinancial companies. KKR does not share with our affiliates, except to provide you products and services that meet your financial needs.
Non-affiliates: Companies not related by common ownership or control. They can be financial and nonfinancial companies. KKR does not share with non-affiliates so they can market to you.
Joint Marketing: A formal agreement between nonaffiliated financial companies that together market financial products and services to you. KKR does not jointly market.
|
Notice is hereby given, in accordance with Section 23(c) of the Investment Company Act of 1940 and the rules promulgated thereunder, that the Fund may from time to time purchase its shares at net asset value. |
45
KRE HQ AT FIRST LLC AND SUBSIDIARIES
Consolidated Financial Statements
As of and for the year ended December 31, 2025
(And Independent Auditor’s Report thereon)
KRE HQ AT FIRST LLC AND SUBSIDIARIES
Table of Contents
| Page(s) | ||||
| 48-49 | ||||
| 50 | ||||
| 51 | ||||
| 52 | ||||
| 53 | ||||
| 54-59 | ||||
|
|
Deloitte & Touche LLP 30 Rockefeller Plaza New York, NY 10112-0015 USA Tel: +1 212 492 4000 Fax: +1 212 489 1687 www.deloitte.com |
To KRE HQ at First LLC and subsidiaries
Opinion
We have audited the consolidated financial statements of KRE HQ at First LLC and subsidiaries (the “Company”), which comprise the consolidated balance sheet as of December 31, 2025, and the related consolidated statements of operations, changes in members’ equity, and cash flows for the year then ended, and the related notes to the consolidated financial statements (collectively referred to as the “financial statements”).
In our opinion, the accompanying financial statements present fairly, in all material respects, the financial position of the Company as of December 31, 2025, and the results of its operations and its cash flows for the year then ended in accordance with accounting principles generally accepted in the United States of America.
Basis for Opinion
We conducted our audit in accordance with auditing standards generally accepted in the United States of America (GAAS). Our responsibilities under those standards are further described in the Auditor’s Responsibilities for the Audit of the Financial Statements section of our report. We are required to be independent of the Company and to meet our other ethical responsibilities, in accordance with the relevant ethical requirements relating to our audit. We believe that the audit evidence we have obtained is sufficient and appropriate to provide a basis for our audit opinion.
Responsibilities of Management for the Financial Statements
Management is responsible for the preparation and fair presentation of the financial statements in accordance with accounting principles generally accepted in the United States of America, and for the design, implementation, and maintenance of internal control relevant to the preparation and fair presentation of financial statements that are free from material misstatement, whether due to fraud or error.
In preparing the financial statements, management is required to evaluate whether there are conditions or events, considered in the aggregate, that raise substantial doubt about the Company’s ability to continue as a going concern for one year after the date that the financial statements are available to be issued.
Auditor’s Responsibilities for the Audit of the Financial Statements
Our objectives are to obtain reasonable assurance about whether the financial statements as a whole are free from material misstatement, whether due to fraud or error, and to issue an auditor’s report that includes our opinion. Reasonable assurance is a high level of assurance but is not absolute assurance and therefore is not a guarantee that an audit conducted in accordance with GAAS will always detect a material misstatement when it exists. The risk of not detecting a material misstatement resulting from fraud is higher than for one resulting from error, as fraud may involve collusion, forgery, intentional omissions, misrepresentations, or the override of internal control. Misstatements are considered material if there is a substantial likelihood that, individually or in the aggregate, they would influence the judgment made by a reasonable user based on the financial statements.
In performing an audit in accordance with GAAS, we:
| • | Exercise professional judgment and maintain professional skepticism throughout the audit. |
48
| • | Identify and assess the risks of material misstatement of the financial statements, whether due to fraud or error, and design and perform audit procedures responsive to those risks. Such procedures include examining, on a test basis, evidence regarding the amounts and disclosures in the financial statements. |
| • | Obtain an understanding of internal control relevant to the audit in order to design audit procedures that are appropriate in the circumstances, but not for the purpose of expressing an opinion on the effectiveness of the Company’s internal control. Accordingly, no such opinion is expressed. |
| • | Evaluate the appropriateness of accounting policies used and the reasonableness of significant accounting estimates made by management, as well as evaluate the overall presentation of the financial statements. |
| • | Conclude whether, in our judgment, there are conditions or events, considered in the aggregate, that raise substantial doubt about the Company’s ability to continue as a going concern for a reasonable period of time. |
We are required to communicate with those charged with governance regarding, among other matters, the planned scope and timing of the audit, significant audit findings, and certain internal control-related matters that we identified during the audit.

49
KRE HQ AT FIRST LLC AND SUBSIDIARIES
As of December 31, 2025
| Assets: |
||||||||
| Investment in real estate, at cost |
$ | 489,642,917 | ||||||
| Less: accumulated depreciation |
(53,650,999 | ) | ||||||
|
|
|
|||||||
| Investment in real estate, net |
435,991,918 | |||||||
| Cash and cash equivalents |
9,686,411 | |||||||
| Note receivable |
515,157 | |||||||
| Intangibles, net |
28,083,199 | |||||||
| Leasing commissions, net |
6,523,445 | |||||||
| Deferred rent receivable |
17,150,435 | |||||||
| Other assets |
1,233,093 | |||||||
|
|
|
|||||||
| Total assets |
$ | 499,183,658 | ||||||
|
|
|
|||||||
| Liabilities: |
||||||||
| Mortgage notes payable, net |
$ | 402,813,923 | ||||||
| Accounts payable and accrued expenses |
1,349,388 | |||||||
| Other liabilities |
3,211,712 | |||||||
|
|
|
|||||||
| Total liabilities |
407,375,023 | |||||||
| Commitments and Contingencies (Note 8) |
||||||||
| Members’ equity |
91,808,635 | |||||||
|
|
|
|||||||
| Total liabilities and members’ equity |
$ | 499,183,658 | ||||||
|
|
|
|||||||
See accompanying notes to consolidated financial statements.
50
KRE HQ AT FIRST LLC AND SUBSIDIARIES
Consolidated Statement of Operations
For the year ended December 31, 2025
| Revenues: |
||||||||
| Rental revenue |
$ | 38,487,545 | ||||||
| Other income |
350,524 | |||||||
|
|
|
|||||||
| Total revenue |
38,838,069 | |||||||
|
|
|
|||||||
| Expenses: |
||||||||
| Property operating expenses |
10,482,240 | |||||||
| General and administrative |
233,640 | |||||||
| Depreciation and amortization |
14,113,656 | |||||||
| Interest expense |
12,873,003 | |||||||
|
|
|
|||||||
| Total expenses |
37,702,539 | |||||||
|
|
|
|||||||
|
|
|
|||||||
| Net income |
$ | 1,135,530 | ||||||
|
|
|
|||||||
See accompanying notes to consolidated financial statements.
51
KRE HQ AT FIRST LLC AND SUBSIDIARIES
Consolidated Statement of Changes in Members’ Equity
For the year ended December 31, 2025
| KREST Operating Partnership L.P. |
Drawbridge Asset Management, LLC |
Total | ||||||||||||||||||||||
| Members’ equity at January 1, 2025 |
$ | 103,651,197 | $ | 521,908 | $ | 104,173,105 | ||||||||||||||||||
| Contributions from members |
— | — | — | |||||||||||||||||||||
| Distributions to members |
(13,432,365 | ) | (67,635 | ) | (13,500,000 | ) | ||||||||||||||||||
| Net income |
1,129,841 | 5,689 | 1,135,530 | |||||||||||||||||||||
|
|
|
|
|
|
|
|||||||||||||||||||
| Members’ equity at December 31, 2025 |
$ | 91,348,673 | $ | 459,962 | $ | 91,808,635 | ||||||||||||||||||
|
|
|
|
|
|
|
|||||||||||||||||||
See accompanying notes to consolidated financial statements.
52
KRE HQ AT FIRST LLC AND SUBSIDIARIES
Consolidated Statement of Cash Flows
For the year ended December 31, 2025
| Cash flows from operating activities: |
||||||||
| Net income |
$ | 1,135,530 | ||||||
| Adjustments to reconcile net income to net cash provided by operating activities: |
||||||||
| Depreciation of real estate |
12,147,396 | |||||||
| Amortization of deferred financing costs |
587,103 | |||||||
| Amortization of acquired in-place lease value |
1,241,436 | |||||||
| Amortization of acquired above-market leases |
1,878,924 | |||||||
| Amortization of leasing commissions |
724,824 | |||||||
| Straight line rent |
(2,533,653 | ) | ||||||
| Interest income on note receivable |
(25,969 | ) | ||||||
| Change in certain operating assets and liabilities: |
||||||||
| Accounts receivable |
53,986 | |||||||
| Other liabilities |
3,211,712 | |||||||
| Other assets |
689,342 | |||||||
| Accounts payable and accrued expenses |
68,259 | |||||||
|
|
|
|||||||
| Net cash provided by operating activities |
19,178,890 | |||||||
|
|
|
|||||||
| Cash flows from financing activities: |
||||||||
| Distributions to members |
(13,466,182 | ) | ||||||
|
|
|
|||||||
| Cash used in financing activities |
(13,466,182 | ) | ||||||
|
|
|
|||||||
| Net increase in cash and cash equivalents |
5,712,708 | |||||||
| Cash and cash equivalents at beginning of year |
3,973,703 | |||||||
|
|
|
|||||||
| Cash and cash equivalents at end of year |
$ | 9,686,411 | ||||||
|
|
|
|||||||
| Supplemental disclosure of non-cash financing activities: |
||||||||
| Distributions to members |
33,818 | |||||||
| Supplemental disclosure of cash flow information: |
||||||||
| Cash paid for interest |
12,285,900 | |||||||
See accompanying notes to consolidated financial statements.
53
KRE HQ AT FIRST LLC AND SUBSIDIARIES
Notes to Consolidated Financial Statements
As of and for the year ended December 31, 2025
| (1) | Organization and Basis of Presentation |
KRE HQ at First LLC and Subsidiaries (the “Company”) is a Delaware limited liability company formed on June 24, 2021, with operations commencing on July 30, 2021. The Company was formed with the purpose of directly, or indirectly, acquiring, owning, and leasing certain real property related to an investment in San Jose, California.
The Company is a limited liability company (LLC). LLCs are formed in accordance with the laws of the state in which they are organized. An LLC is generally an unincorporated association of one or more persons, and no member shall be bound by, or personally liable for, the expenses, liabilities, or obligations of the individual company. The members are not obligated to restore capital deficits. The Company will continue in existence until dissolved in accordance with the provisions of the LLC operating agreement and is funded through the equity contributions of the members. Profits, losses, and distributions are generally allocated to the members in accordance with the provisions of the LLC operating agreement.
| (2) | Summary of Significant Accounting Policies |
| (a) | Basis of Presentation |
The accompanying consolidated financial statements have been prepared in accordance with U.S. generally accepted accounting principles (GAAP). The consolidated financial statements include the financial statements of the Company and its wholly owned subsidiaries, KRE HQ at First Mezz B LLC, KRE HQ at First Mezz A LLC and KRE HQ at First Owner LLC. All intercompany transactions and balances have been eliminated in consolidation.
| (b) | Investment in Real Estate, Net |
Real estate investments are stated at cost less accumulated depreciation and amortization. The cost includes acquisitions, development and construction, and tenant improvements. Depreciation and amortization are recorded over estimated useful lives ranging from 5 to 40 years by use of the straight-line method. Tenant improvements are depreciated over the shorter of the estimated useful lives or the term of the related leases. Maintenance and repairs are expensed as incurred; major improvements and betterments are capitalized.
| (c) | Cash and Cash Equivalents |
The Company considers short-term investments with original maturities of 90 days or less to be cash equivalents. The Company’s cash balances may exceed amounts insured by the Federal Deposit Insurance Corporation. The Company believes it is not exposed to any significant credit risk on cash and cash equivalents.
| (d) | Deferred Financing Costs |
Debt issuance costs are reflected as a reduction to the mortgage notes payable liability on the balance sheet. Deferred financing costs are recorded at cost and amortized to interest expense using the effective-interest method over the term of the related loan. As of December 31, 2025, the Company had deferred financing costs of $5,186,077 which is net of accumulated amortization of $2,593,038.
| (e) | Impairment of Long-Lived Assets |
The Company assesses the carrying value of long-lived assets whenever events or changes in circumstances indicate that the carrying amount of an asset, or group of assets, may not be recoverable. Impairment losses are recorded on long-lived assets when indicators of impairment are present and the future undiscounted net cash flows estimated to be generated by those assets are less than the assets’ carrying amount. The Company recognizes an impairment loss to the extent the carrying amount exceeds the fair value of the assets. Fair value is determined through various techniques including discounted cash flow models, and third-party independent appraisals, as considered necessary. No impairment charges were recognized for the period ended December 31, 2025.
54
KRE HQ AT FIRST LLC AND SUBSIDIARIES
Notes to Consolidated Financial Statements
As of and for the year ended December 31, 2025
| (f) | Acquisition Accounting |
The Company accounts for the purchase of real estate as asset acquisitions. The related acquired physical assets, in-place leases, and customer relationships, if any, are recorded at their estimated fair values. The fair value of the acquired property is determined on an “as-if-vacant” basis considering a variety of factors, including the physical condition and quality of the properties, estimated rental and absorption rates, estimated future cash flows, and valuation assumptions consistent with current market conditions. The “as-if-vacant” fair value is allocated to land and building based on relevant information obtained in connection with the acquisition of the properties. The fair value of acquired in-place leases consists of the following components, as applicable (1) the estimated cost to replace the leases, including foregone rents during the period of finding a new tenant, foregone recovery of tenant pass-through costs, tenant improvements, and other direct costs associated with obtaining a new tenant, and (2) the above-market/below-market portion of the leases, determined by comparing the projected cash flows of leases in place to projected cash flows of comparable market-rate leases, measured over a period equal to the remaining noncancelable lease term for above-market leases, and the remaining noncancelable lease term plus the term of any below-market, fixed rate, renewal options for below-market leases. Acquired in-place lease value is amortized as amortization expense on a straight-line basis over the remaining term of the underlying lease, which was 13 years at acquisition. Acquired above-market and below-market leases are amortized on a straight-line basis as an adjustment to rental revenue over the remaining term of the underlying lease, which was 13 years at acquisition. Should a tenant terminate its lease, the unamortized portion of the acquired in-place lease value, acquired above-market leases and below-market leases associated with that tenant are written off to amortization expense or rental revenue.
| (g) | Revenue Recognition |
The Company’s revenues consist of rental revenue and other income.
Rental Revenue
Rental revenue is recognized in accordance with ASC Topic 842, Leases, and consists of (i) cash rents, which represents revenue each tenant pays in accordance with the terms of its respective lease that is recognized on a straight-line basis over the non-cancelable term of the lease, and includes the effects of rent steps and rent abatements under the leases, (ii) amortization of acquired above and below-market leases, net, (iii) tenant reimbursements, which are recoveries of all or a portion of the operating expenses and real estate taxes of the property and is recognized in the same period as the expenses are incurred and (iv) lease termination income, if any. The Company’s leases, which comprise the lease-up of office, garage and telecom space to tenants, primarily under non-cancellable operating leases, have terms generally ranging from five to fifteen years. Most of the Company’s leases provide tenants with extension options at either fixed or market rates and a number of its leases provide tenants with options to early terminate, but such options generally impose an economic penalty on the tenant upon exercising.
The Company evaluates the collectability of tenant receivables for payments required under the lease agreements. If the Company determines that collectability is not probable, the difference between rental revenue recognized and rental payments received is recorded as an adjustment to “rental revenue” in its consolidated statement of operations.
Other Income
Other income includes interest income. For the period ended December 31, 2025, the Company earned $350,524 of interest income, which consists of interest income from banks and notes receivable.
55
KRE HQ AT FIRST LLC AND SUBSIDIARIES
Notes to Consolidated Financial Statements
As of and for the year ended December 31, 2025
| (h) | Income Taxes |
The Company is an LLC. The Company is treated as a partnership for federal income tax purposes. Members are responsible for reporting their allocable share of the Company’s income, gains, deductions, losses, and credits on their respective tax returns. The Company is disregarded for income tax purposes as it is a multi-member LLC. As a result, the Company is not subject to either federal, state, or local income taxes, as the obligation for the Company’s taxable income is its members. Therefore, no provision or liability for federal, state, or local income taxes has been included in the accompanying consolidated financial statements.
| (i) | Use of Estimates |
The preparation of the consolidated financial statements in conformity with GAAP requires management to make estimates and assumptions about future events. These estimates and the underlying assumptions affect the amounts of assets, liabilities, revenue, and expenses reported. Such estimates include the allocation of the purchase price of acquired real estate investments among tangible and intangible assets, determination of the useful life of property and other long-lived assets, and valuation and impairment analysis of long-lived assets. These estimates and assumptions are based on management’s best judgment and subject to change as conditions change.
| (j) | Credit Risks |
The preparation of the consolidated financial statements in conformity with GAAP requires management to make estimates and assumptions about future events. We are subject to risks incidental to the ownership and sale of real estate. These include, among others, the risks normally associated with changes in the general economic climate, trends in the real estate industry, availability of real estate, changes in tax laws, interest rate levels, and availability of financing and potential liability under environmental and other laws.
The Company believes the estimates and assumptions underlying these financial statements are reasonable and supportable based on the information available as of December 31, 2025.
| (k) | Recently Issued Accounting Pronouncements Not Materially Impacting the Financial Statements |
In March 2024, FASB issued ASU No. 2024-02, Codification Improvements—Amendments to Remove References to the Concepts Statements (ASU 2024-02). This ASU eliminates sixteen discrete references to the Concepts Statements across a variety of defined terms and Topics within the Codification, such as ASC 480, Distinguishing Liabilities from Equity, ASC 410, Asset Retirement and Environment Obligations, ASC 805, Business Combinations, ASC 815, Derivatives and Hedging, and ASC 845, Nonmonetary Transactions. Removing all references to Concepts Statements in the guidance will simplify the Codification and draw a distinction between authoritative and nonauthoritative literature. The amendments are effective for fiscal years beginning after December 15, 2025, for nonpublic business entities and early application of the amendments is permitted. Management does not expect the adoption of the new standard to have a material impact on the consolidated financial position or performance of the Company.
56
KRE HQ AT FIRST LLC AND SUBSIDIARIES
Notes to Consolidated Financial Statements
As of and for the year ended December 31, 2025
| (3) | Investment in Real Estate, net and Related Lease Intangible Assets and Liabilities |
As of December 31, 2025, real estate, net consists of the following components:
| Land |
$ | 89,382,168 | ||||||
| Building |
357,123,366 | |||||||
| Site improvements |
1,718,298 | |||||||
| Tenant improvements |
41,419,085 | |||||||
|
|
|
|||||||
| Total investment in real estate, at cost |
489,642,917 | |||||||
| Accumulated depreciation |
(53,650,999) | |||||||
|
|
|
|||||||
| Investment in real estate, net |
$ | 435,991,918 | ||||||
|
|
|
|||||||
Lease intangible assets and liabilities subject to amortization consist of the following as of December 31, 2025:
| Cost basis |
Accumulated amortization |
Net | ||||||||||
| Acquired in-place leases |
$ | 16,655,845 | (5,483,009 | ) | 11,172,836 | |||||||
| Acquired above-market leases |
25,208,944 | (8,298,581 | ) | 16,910,363 | ||||||||
| Leasing commissions |
$ | 9,724,751 | (3,201,306 | ) | 6,523,445 | |||||||
The weighted average amortization period for intangibles, net, and leasing commissions, net as of December 31, 2025, is 9 years. Amortization of above-market leases was $1,878,924 for the year ended December 31, 2025, and was recorded as a decrease to rental revenue on the accompanying consolidated statement of operations. Amortization of in-place leases and leasing commissions was $1,241,436 and $724,824, respectively, for the year ended December 31, 2025, and was recorded to depreciation and amortization expense on the accompanying consolidated statement of operations.
At December 31, 2025, the estimated amortization in aggregate and for each of the next five years ending December 31 and thereafter is:
| Assets | ||||||||
| 2026 |
$ | 3,845,184 | ||||||
| 2027 |
3,845,184 | |||||||
| 2028 |
3,845,184 | |||||||
| 2029 |
3,845,184 | |||||||
| 2030 |
3,845,184 | |||||||
| Thereafter |
15,380,724 | |||||||
|
|
|
|||||||
| Total |
$ | 34,606,644 | ||||||
|
|
|
|||||||
| (4) | Mortgage Notes Payable |
On July 30, 2021, the Company entered into a $408,000,000 mortgage loan agreement with JP Morgan Chase Bank, NA, and Barclays Capital Real Estate Inc. collectively as Lenders.
57
KRE HQ AT FIRST LLC AND SUBSIDIARIES
Notes to Consolidated Financial Statements
As of and for the year ended December 31, 2025
The loan terms are summarized as follows:
| Mortgage Note | Interest Rate | Maturity Date | Debt Balance as of 12/31/2025 |
|||||||||
| JP Morgan Chase Bank |
2.970 | % | November 1, 2034 | $ | 285,600,000 | |||||||
| Barclays Capital Real Estate |
2.970 | % | November 1, 2034 | $ | 122,400,000 | |||||||
The following table summarizes the Company’s mortgage notes payable activity for the year ended December 31, 2025:
| 2025 | ||||||||
| Mortgage notes payable, beginning of period |
$ | 408,000,000 | ||||||
| Proceeds from notes payable |
— | |||||||
| Debt issuance costs, net of amortization |
(5,186,077) | |||||||
|
|
|
|||||||
| Mortgage notes payable, net, end of period |
$ | 402,813,923 | ||||||
|
|
|
|||||||
| (5) | Revenue |
The Company’s revenue consists of rental revenue and other income. The Company leases office space to a single tenant with a remaining term of 9 years, expiring in December 2034 with renewal options for additional terms. The components of rental revenue for the year ended December 31, 2025 were as follows:
| 2025 | ||||||||
| Fixed lease revenue |
$ | 27,994,815 | ||||||
| Variable lease revenue |
10,492,730 | |||||||
|
|
|
|||||||
| Total rental revenue |
$ | 38,487,545 | ||||||
|
|
|
|||||||
The following is a schedule of future minimum rentals on non-cancelable operating leases as of December 31, 2025, for each of the five succeeding years commencing January 1, 2026.
| 2026 |
$ | 28,111,542 | ||||||
| 2027 |
28,954,888 | |||||||
| 2028 |
29,823,535 | |||||||
| 2029 |
30,718,241 | |||||||
| 2030 |
31,639,788 | |||||||
| Thereafter |
136,340,145 | |||||||
|
|
|
|||||||
| $ | 285,588,139 | |||||||
|
|
|
|||||||
| (6) | Members’ Equity |
The Company’s outstanding membership interests are governed by their limited liability company agreement.
58
KRE HQ AT FIRST LLC AND SUBSIDIARIES
Notes to Consolidated Financial Statements
As of and for the year ended December 31, 2025
| (7) | Transactions with Related Parties |
Company Loan
The Company has made a loan (Company Loan) to Drawbridge Asset Management LLC (DAM), as evidenced by the Amended and Restated Non-Recourse Promissory Note dated August 13, 2021, in the principal amount of $538,375 and is included in note receivable on the balance sheet. Per the terms of the non-recourse promissory note, interest shall be compounded annually at a rate per annum equal to 5.0%. As of December 31, 2025, the note receivable balance is $515,157.
Property Management Fee
The property is managed by Drawbridge Realty Management LLC (“DRM”), an affiliate of the Company. DRM earns property management fees equal to the amount of management fees charged to and paid by tenants pursuant to each tenant lease, less the amount paid to a third-party manager. For the year ended December 31, 2025, the Company incurred property management fees of $716,783 which are included in property operating expenses on the consolidated statement of operations. As of December 31, 2025, the Company had $0 of unpaid property management fees.
| (8) | Commitments and Contingencies |
The Company is not subject to any material litigation nor to management’s knowledge is any material litigation currently threatened against the Company other than routine litigation, claims, and administrative proceedings arising in the ordinary course of business. Management believes that such routine litigation, claims, and administrative proceedings will not have a material adverse impact on the Company’s consolidated financial position or results of operations.
| (9) | Fair Value Disclosure |
The Company’s financial instruments mainly consist of cash and cash equivalents, tenant receivables, accounts payable, accrued expenses and other liabilities. Due to the short-term nature of these instruments, the carrying amounts approximate fair value as December 31, 2025.
| (10) | Subsequent Events |
The Company has evaluated subsequent events from the consolidated balance sheet date through February 27, 2026, the date at which the consolidated financial statements were available to be issued. Based on this evaluation, there are no events that would require additional recognition or disclosure.
59
Item 2. Code of Ethics.
KKR Real Estate Select Trust Inc. (the “registrant” or the “Fund”) has adopted a code of ethics that applies to the registrant’s principal executive officer, principal financial officer, comptroller or principal accounting officer, and any person who performs a similar function. The registrant has not made any substantive amendments to its code of ethics during the period covered by this report. The registrant has not granted any waivers from any provisions of the code of ethics during the period covered by this report.
A copy of the Fund’s code of ethics is filed herewith.
Item 3. Audit Committee Financial Expert.
As of the end of the period covered by the report, the registrant’s board of trustees has determined that Joan Binstock is qualified to serve as an audit committee financial expert serving on its audit committee and that she is “independent,” as defined by Item 3 of Form N-CSR.
Item 4. Principal Accountant Fees and Services.
The following table shows the aggregate fees billed in the fiscal years ended December 31, 2024 and December 31, 2025 for audit services, audit-related services and tax services provided to the Fund by Deloitte & Touche LLP (“Deloitte”), the Fund’s principal accountant. “Audit services” refer to performing an audit of the registrant’s annual financial statements or services that are normally provided by Deloitte in connection with statutory and regulatory filings or engagements. “Audit-related services” refer to the assurance and related services by Deloitte that are reasonably related to the performance of the audit. “Tax services” refer to professional services rendered by Deloitte for tax compliance, tax advice, and tax planning.
| FYE 12/31/2025 |
FYE 12/31/2024 |
|||||||
| (a) Audit Fees |
$ | 390,000 | $ | 441,100 | ||||
| (b) Audit-Related Fees |
$ | 0 | $ | 0 | ||||
| (c) Tax Fees |
$ | 0 | $ | 0 | ||||
| (d) All Other Fees |
N/A | N/A | ||||||
(e)(1) The Audit Committee is required to pre-approve, to the extent required by applicable regulations (including paragraph (c)(7) of Rule 2-01 of Regulation S-X), (i) all audit and permitted non-audit services rendered by the independent accountants to the registrant and (ii) all non-audit services rendered by the independent accountants to the registrant’s investment adviser and to certain affiliates of the investment adviser.
(e)(2) The percentage of fees billed by Deloitte applicable to non-audit services pursuant to waiver of pre-approval requirement were as follows:
| FYE 12/31/2025 |
FYE 12/31/2024 |
|||||||
| Audit-Related Fees |
0 | % | 0 | % | ||||
| Tax Fees |
0 | % | 0 | % | ||||
| All Other Fees |
N/A | N/A | ||||||
(f) Not applicable.
(g) The aggregate non-audit fees and services billed by Deloitte for the fiscal years ended December 31, 2024 and December 31, 2025 were $0 and $0, respectively.
(h) Not applicable.
Item 5. Audit Committee of Listed Registrants.
| (a) | Registrant has a separately-designated standing Audit Committee established in accordance with Section 3(a)(58)(A) of the Securities Exchange Act of 1934 (the “Exchange Act”). The Audit Committee consists of the following Board members: Joan Binstock, Fran Bermanzohn and Susan Meaney. |
| (b) | Not applicable to the registrant. |
Item 6. Investments.
| (a) | Schedule of Investments in securities of unaffiliated issuers as of the close of the reporting period is included as part of the report to shareholders filed under Item 1(a) of this form. |
| (b) | Not applicable. |
Item 7. Financial Statements and Financial Highlights for Open-End Management Investment Companies.
Not applicable.
Item 8. Changes in and Disagreements with Accountants for Open-End Management Investment Companies.
Not applicable.
Item 9. Proxy Disclosures for Open-End Management Investment Companies.
Not applicable.
Item 10. Remuneration Paid to Directors, Officers, and Others of Open-End Management Investment Companies.
Not applicable.
Item 11. Statement Regarding Basis for Approval of Investment Advisory Contract.
Not applicable.
Item 12. Disclosure of Proxy Voting Policies and Procedures for Closed-End Management Investment Companies.
The registrant’s proxy voting and corporate actions policy and procedures are as follows:
A. Overview
Kohlberg Kravis Roberts & Co. L.P. (“KKR”), KKR Registered Advisor LLC (“KRA”), and their respective investment advisory affiliates (collectively, the “Firm”) are committed to act in the best interests of our clients (“Clients”) and to conduct our business in accordance with all applicable laws, rules and regulations and the highest ethical standards. Rule 206(4)-6 of the Investment Advisers Act of 1940, as amended (the “Advisers Act”) requires registered investment advisers that exercise voting authority over securities held in Client portfolios to adopt and implement written policies and procedures that are reasonably designed to ensure that proxies are voted in the best interest of its Clients as well as describe how the Firm addresses material conflicts that may arise between the Firm and its Clients. Additionally, the Firm is required to disclose its proxy voting policies and procedures, including the manner in which Clients may request and receive a copy of the Firm’s Proxy Voting Policies and Procedures as well as how Clients may obtain their proxy voting records. The Firm has adopted proxy voting policies and procedures (“Proxy Voting Policy”) in accordance with these requirements under Rule 206(4)-6.
B. General
The Firm provides investment advisory services to its Clients, and invests the assets of these Clients in securities issued by public and private issuers. The Firm has authority to vote proxies relating to such securities on behalf of its Clients. The Securities and Exchange Commission has adopted Rule 206(4)-6 under the Advisers Act. Under this rule, registered investment advisers that exercise voting authority over securities held in client portfolios are required to implement proxy voting policies and describe those policies to their clients.
This policy is designed to ensure that all proxies are voted in the best interest of the Firm’s Clients, to provide disclosure of the Firm’s proxy voting records and to ensure that certain documentation is retained.
C. Proxy Voting Procedures
To assist it in its proxy-voting responsibilities, the Firm currently subscribes to proxy-related services offered by the proxy advisory firm Institutional Shareholder Services, Inc. (“ISS”). ISS provides the Firm with its’ independent analysis and recommendation with respect to generally all proxy proposals that the Firm votes on behalf of its Clients, with respect to both U.S. and non-U.S. securities of publicly traded companies.
The Firm will have the responsibility of voting proxies that it receives on behalf of its Clients. The Firm has engaged ISS to assist with its proxy voting, however, the Firm retains ultimate voting discretion with respect to its Clients. To the extent that ISS pre-populates ballots for the Firm, the Firm will review ISS’s recommendations prior to submitting those ballots. The Firm may depart from an ISS recommendation in order to avoid voting decisions believed to be contrary to the best interests of its Clients. In each instance where the Firm votes contrary to the ISS recommendation, Compliance, in conjunction with the Firm’s investment analyst(s) who provides coverage for the relevant issuer, will document the basis for its contrary voting decision. The Firm currently does not use any automatic voting of proxies.
In addition, the Firm may choose not to vote proxies in certain situations, such as where the Firm has deemed the cost of voting would exceed any anticipated benefit to the Firm’s Clients or where a proxy is received by the Firm for a security it no longer manages on behalf of its Clients. Compliance, in conjunction with the Firm’s investment analyst(s) who provides coverage for the relevant issuer, will document the basis for the Firm’s decision not to vote.
In instances where the Firm receives ballots for positions entered into for cash management purposes (i.e. exchange traded funds, money market instruments), the Firm will vote alongside ISS’s recommendations, to the extent available.
D. Proxy Advisor Oversight
The Firm will take appropriate steps to determine whether any proxy advisory firm that it engages, such as ISS, has the capacity and competency to analyze matters upon which the Firm looks to the proxy advisor for analysis and recommendations. Factors that the Firm will consider will include whether the proxy advisor has an effective process for seeking timely input from issuers and its clients concerning relevant matters such proxy voting policies; and how the proxy advisor arrives at voting recommendations. The Firm will also consider the adequacy of the proxy advisor’s policies and procedures concerning identifying, disclosing and addressing conflicts of interest.
Generally, the Firm will conduct diligence concerning these topics at the outset of its relationship with the proxy advisor, periodically thereafter, consistent with the KKR Global Vendor Management Policy.
E. Conflicts of Interest
The Firm may occasionally be subject to conflicts of interest in the voting of proxies due to business or personal relationships it maintains with persons having an interest in the outcome of certain votes. The Firm, its affiliates and/or its employees may also occasionally have business or personal relationships with the proponents of proxy proposals, participants in proxy contests, corporate directors and officers or candidates for directorships.
If at any time, the Firm becomes aware of an existing or potential conflict of interest relating to a particular proxy proposal, the Firm’s Global Conflicts Committee (the “Conflicts Committee”), or its designee, must be notified. Provided the Conflicts Committee has determined that a conflict or potential for a conflict exists, the proxy must be voted in alignment with the recommendation set forth by ISS. Appropriate documentation will be maintained by the Conflicts Committee and Legal & Compliance.
F. Proxy Voting Records
In accordance with Rule 204-2 of the Advisers Act, the Firm will maintain the following records in connection with KKR’s proxy voting policies and procedures:
· a copy of the proxy voting policies and procedures;
· a copy of all proxy statements received regarding securities of its Clients;
· a record of each vote the Firm casts on behalf of its Clients;
· records of the Firm’s Client requests for proxy voting information, including a copy of each written request for information on how the Firm voted proxies on behalf of the Client, and a copy of any written response by the Firm to any Client request for information on how the Firm voted proxies on its behalf; and
· any documentation prepared by the Firm that was material to making a decision on how to vote, or that memorialized the basis for the voting decision.
The foregoing records will be maintained and preserved in accordance with the Firm’s Maintenance of Books and Records Policy.
G. Disclosure
The Firm discloses in its Form ADV Part 2A that Clients and Investors may submit a written request to the Firm in order to obtain information on how the Firm voted Client proxies and to request a copy of the Proxy Voting Policies and Procedures. Any such request will be forwarded to Legal and Compliance teams. Questions relating to proxy voting should be directed to Compliance.
Item 13. Portfolio Managers of Closed-End Management Investment Companies.
(a)(1) Investment Team
The Fund is positioned, under the management of the Adviser, to take advantage of the full resources of Kohlberg Kravis Roberts & Co. L.P.’s (together with its affiliates, “KKR”) global network. The Fund will benefit from a deep and seasoned team of over 100 dedicated investment and asset management professionals with a leadership team that has worked together for over eight years. The Adviser believes the Fund will benefit from KKR Real Estate’s (KKR’s dedicated real estate team) existing relationships, sourcing channels, market knowledge and operating expertise. The investment professionals of the Adviser, who have primary responsibility for day-to-day management and oversight of the Fund, are:
Ralph Rosenberg — Ralph Rosenberg joined KKR in 2011 and became Chairman of Real Assets in 2025. Prior to that, he was a Partner and the Global Head of KKR’s Real Estate Platform. Mr. Rosenberg is Chairman of the Board of Directors of KKR Real Estate Finance Trust Inc., Chairman of the Board of Directors of KKR Real Estate Select Trust, and a member of the Board of Directors of KKR Realty Japan Management. Prior to joining KKR, he was a partner at Eton Park Capital Management and managed his own firm, R6 Capital Management, which later merged into Eton Park. Previously, Mr. Rosenberg was a partner at Goldman Sachs. Mr. Rosenberg is a Governor of the Urban Land Institute Foundation, and serves on the Brown University Investment Committee and the Investment Committee of the Urban Land Institute. He is a former global and U.S. Trustee of the Urban Land Institute, former chair of the Board of Directors of the Pension Real Estate Association (PREA) and a former member of the Board of Directors of the PREA Foundation. He is an Emeriti Member of the Brown University Corporation and is an Honorary Trustee of the Francis W. Parker School in Chicago, Illinois. He is also a former trustee of the Stanford Graduate School of Business Trust and a former trustee and former vice-chair of the Board of Directors of the Masters School in Dobbs Ferry, New York. Mr. Rosenberg holds an undergraduate degree from Brown University, where he graduated magna cum laude, and holds an M.B.A from the Stanford Graduate School of Business.
Matt Salem — Matt Salem joined KKR in 2015 and is a Partner and Head of Real Estate Credit. He also serves as Chief Executive Officer and Director on the Board of KKR Real Estate Finance Trust Inc (NYSE: KREF) and Vice Chairman of KKR Real Estate Select Trust Inc. (KREST). Mr. Salem sits on KKR’s Real Estate Investment Committees. Prior to joining KKR, Mr. Salem was a managing director at Rialto Capital Management. Before joining Rialto in 2012, he was a managing director and head of CMBS trading at Goldman Sachs. Before joining Goldman Sachs in 2006, Mr. Salem held positions at Morgan Stanley and Citigroup Alternative Investments where he invested in mezzanine debt and other high yield CRE credit on behalf of the Travelers Insurance Companies. He began his career in 1996 at Midland Loan Services in Kansas City. Mr. Salem has a B.A. in Economics from Bates College. He has served on the Board of Governors of the Commercial Real Estate Finance Council and as Chair of the B-Piece Buyer Forum.
Julia Butler – Julia Butler joined KKR in 2017 and is a Managing Director in Real Estate, as well as the Chief Executive Officer and President of KKR Real Estate Select Trust Inc. Ms. Butler has more than two decades of real estate investing experience across both real estate equity and credit. Prior to joining the KREST senior leadership team as Chief Investment Officer, Ms. Butler had been actively involved in the growth of KKR’s Real Estate Credit business, including sourcing,
underwriting, and structuring real estate credit investment opportunities as well as capital formation. Prior to joining KKR, Ms. Butler spent thirteen years at iStar where she was an executive vice president, responsible for sourcing, negotiating and managing debt and equity investments in the U.S. and Europe. Prior to iStar, Ms. Butler worked in the treasury department of The Walt Disney Company in Los Angeles, CA. She leads the Women’s Network at KKR and is actively involved with several non-profits and currently serves on the Board of Directors for WIN (Women in Need), NYC’s largest homeless organization for women and children. Ms. Butler is also a member of several real estate organizations, including the Urban Land Institute where she serves as a national multifamily council leader, the Commercial Real Estate Finance Council, and WX. Ms. Butler graduated cum laude from Harvard College with a B.A. in Government.
Chris Lee — Chris Lee joined KKR in 2012 and is President of KKR’s global real estate business. Mr. Lee also serves as Portfolio Manager for KKR Property Partners Americas. He is currently Vice Chairman of the Board of Directors of KKR Real Estate Finance Trust Inc. (NYSE: KREF) where he previously served as Co-Chief Executive Officer and Co-President since October 2015 and March 2016, respectively, through March 2020. Mr. Lee sits on KKR’s Operating Committee, KKR’s Real Estate Equity and Credit Investment Committees in the Americas, KKR’s Real Estate Equity and Credit Portfolio Management Committees in the Americas, KKR’s ESG Committee, KKR’s Global Inclusion and Diversity Council, co-chairs KKR’s Americas Inclusion and Diversity Council and chairs KKR’s Real Estate Valuation Committee. Previously, he served as Head of Real Estate in the Americas, overseeing both equity and credit investing platforms in the region. Prior to joining KKR, he spent three years at Apollo Global Management on their global real estate team where he focused on real estate acquisitions. Mr. Lee also worked at Goldman Sachs in the merchant banking division’s real estate principal investment area (REPIA) for over five years after spending two years in the investment banking division. He earned his MBA from Harvard Business School and his Bachelor’s degree in Economics from Emory University. Mr. Lee currently serves as a trustee of St. Mark’s School of Texas in Dallas, Texas, as a member of the Board of Directors of Sponsors for Educational Opportunity (SEO) in New York, New York, as a member of the Board of Directors of the PREA Foundation in Hartford, Connecticut, as a trustee of Collegiate School in New York, New York and as a member of the Dean’s Advisory Council for Emory College of Arts and Sciences in Atlanta, Georgia. He is a member of the CRE Finance Council, Pension Real Estate Association, Real Estate Capital Policy Advisory Committee for the Real Estate Roundtable, Real Estate Executive Council, Manhattan Chapter of YPO and Urban Land Institute where he sits on one of its Urban Development and Mixed-Use Councils.
Justin Pattner — Justin Pattner joined KKR in 2011 to help found the Global Real Estate business. He is a Partner of the firm and is responsible for KKR’s Real Estate Private Equity business in the Americas, overseeing all aspects of the business including investment strategy, asset management and fundraising. Mr. Pattner sits on KKR’s Real Estate Equity and Credit Investment Committees in the Americas and on KKR’s Real Estate Equity and Credit Portfolio Management Committees in the Americas. Prior to joining KKR, Mr. Pattner was at Eton Park Capital Management where he focused on real estate and real estate related opportunities. Prior to Eton Park, he worked at Lehman Brothers in the real estate private equity group (LBREP) as well as at Lubert Adler Partners. Mr. Pattner graduated magna cum laude from the University of Pennsylvania where he received a B.A. in Economics. Mr. Pattner sits on the Americas Executive Committee of ULI and is member of the Executive Committee for the Fisher Center Policy Advisory
Roger Morales — Roger Morales joined KKR in 2011 as part of the founding team that formed KKR’s Real Estate Platform. He is the Head of Commercial Real Estate Acquisitions in the Americas. He sits on KKR’s Real Estate Equity Investment Committee in the Americas and Europe, Credit Investment Committee and Portfolio Management Committee in the Americas. Prior to joining KKR, Mr. Morales worked with Eton Park Capital Management and with Vornado Realty Trust where he focused on real estate and real estate related investment opportunities. Before attending business school, he worked with JP Morgan Partners where he focused on middle market corporate private equity, and with Goldman, Sachs & Co.’s leveraged finance group. He received a B.A. from the University of Miami and an M.B.A. from Harvard Business School. Mr. Morales is a member of the Urban Land Institute and is a member of one of its Industrial and Office Park Development Councils. He is also a member of the University of Miami Real Estate Advisory Board. Mr. Morales is an alumnus and a former board member of Sponsors for Educational Opportunities (SEO).
Guillaume Cassou — Guillaume Cassou joined KKR in 2012 and is a Senior Advisor. Prior to joining KKR, Mr. Cassou was an executive director in Goldman Sachs’ real estate principal investment area in London since 2007, focusing on real estate and real estate-related investments across Europe. Previously, Mr. Cassou worked in Goldman Sachs investment banking group from 2001 to 2007, where he was involved in a number of mergers, acquisitions, and capital market transactions. He holds an M.Sc. from Ecole Polytechnique, Paris. Mr. Cassou is currently Chairman of the Ecole Polytechnique Charitable Trust.
John Pattar — John Pattar joined KKR in 2018 and is a Partner and Head of KKR’s Real Estate business in Asia Pacific. He oversees all aspects of the firm’s Asia Real Estate business including the investment strategy, asset management and fundraising of KKR’s Asia Real Estate opportunistic fund series, as well as the firm’s Asia Core Plus Real Estate strategy. Mr. Pattar is a member of KKR’s Asia Real Estate Investment Committee and KKR’s Asia Real Estate Portfolio Management Committee. In addition to this, Mr. Pattar sits on the Board of Directors of KKR Japan Realty Management (KJRM), a $14bn1 REIT manager in Japan that manages about 200 properties across two listed J-REITs. Prior to joining KKR, Mr. Pattar was the CEO of CLSA Real Estate sinc/e 2004. At CLSA, Mr. Pattar built a Pan-Asian real estate platform for the firm. Mr. Pattar holds a Bachelor of Laws degree from King’s College London, University of London (LLB) and is a Fellow of the Royal Institution of Chartered Surveyors (F.R.I.C.S.).
(a)(2) Other Accounts Managed by Portfolio Manager(s) or Management Team Member and Potential Conflicts of Interest
The portfolio managers primarily responsible for the day-to-day management of the Fund also manage other registered investment companies, other pooled investment vehicles and other accounts, as indicated below. The following table identifies, as of December 31, 2025: (i) the number of registered investment companies, pooled investment vehicles and other accounts managed by the portfolio managers; and (ii) the total assets under management (“AUM”) of such companies, vehicles and accounts, and the number and total AUM of such companies, vehicles and accounts with respect to which the advisory fee is based on performance.
Ralph Rosenberg
| Account(s) Managed |
Assets of Accounts (in billions) |
Number of Accounts Subject to a Performance Fee |
Assets Subject to a Performance Fee (in billions) |
|||||||||||||
| Registered Investment Companies |
0 | N/A | N/A | N/A | ||||||||||||
| Pooled Investment Vehicles Other Than Registered Investment Companies |
76 | $ | 30.209 | 42 | $ | 28.454 | ||||||||||
| Other Accounts |
0 | N/A | N/A | N/A | ||||||||||||
Matt Salem
| Account(s) Managed |
Assets of Accounts (in billions) |
Number of Accounts Subject to a Performance Fee |
Assets Subject to a Performance Fee (in billions) |
|||||||||||||
| Registered Investment Companies |
0 | N/A | N/A | N/A | ||||||||||||
| Pooled Investment Vehicles Other Than Registered Investment Companies |
30 | $ | 18.042 | 18 | $ | 17.058 | ||||||||||
| Other Accounts |
0 | N/A | N/A | N/A | ||||||||||||
Julia Butler
| Account(s) Managed |
Assets of Accounts (in billions) |
Number of Accounts Subject to a Performance Fee |
Assets Subject to a Performance Fee (in billions) |
|||||||||||||
| Registered Investment Companies |
0 | N/A | N/A | N/A | ||||||||||||
| Pooled Investment Vehicles Other Than Registered Investment Companies |
0 | N/A | 0 | N/A | ||||||||||||
| Other Accounts |
0 | N/A | N/A | N/A | ||||||||||||
Chris Lee
| Account(s) Managed |
Assets of Accounts (in billions) |
Number of Accounts Subject to a Performance Fee |
Assets Subject to a Performance Fee (in billions) |
|||||||||||||
| Registered Investment Companies |
0 | N/A | N/A | N/A | ||||||||||||
| Pooled Investment Vehicles Other Than Registered Investment Companies |
76 | $ | 30.209 | 42 | $ | 28.454 | ||||||||||
| Other Accounts |
0 | N/A | N/A | N/A | ||||||||||||
Justin Pattner
| Account(s) Managed |
Assets of Accounts (in billions) |
Number of Accounts Subject to a Performance Fee |
Assets Subject to a Performance Fee (in billions) |
|||||||||||||
| Registered Investment Companies |
0 | N/A | N/A | N/A | ||||||||||||
| Pooled Investment Vehicles Other Than Registered Investment Companies |
30 | $ | 18.042 | 18 | $ | 17.058 | ||||||||||
| Other Accounts |
0 | N/A | N/A | N/A | ||||||||||||
Roger Morales
| Account(s) Managed |
Assets of Accounts (in billions) |
Number of Accounts Subject to a Performance Fee |
Assets Subject to a Performance Fee (in billions) |
|||||||||||||
| Registered Investment Companies |
0 | N/A | N/A | N/A | ||||||||||||
| Pooled Investment Vehicles Other Than Registered Investment Companies |
30 | $ | 18.042 | 18 | $ | 17.058 | ||||||||||
| Other Accounts |
0 | N/A | N/A | N/A | ||||||||||||
Guillaume Cassou
| Account(s) Managed |
Assets of Accounts (in billions) |
Number of Accounts Subject to a Performance Fee |
Assets Subject to a Performance Fee (in billions) |
|||||||||||||
| Registered Investment Companies |
0 | N/A | N/A | N/A | ||||||||||||
| Pooled Investment Vehicles Other Than Registered Investment Companies |
25 | $ | 4.961 | 15 | $ | 4.538 | ||||||||||
| Other Accounts |
0 | N/A | N/A | N/A | ||||||||||||
John Pattar
| Account(s) Managed |
Assets of Accounts (in billions) |
Number of Accounts Subject to a Performance Fee |
Assets Subject to a Performance Fee (in billions) |
|||||||||||||
| Registered Investment Companies |
0 | N/A | N/A | N/A | ||||||||||||
| Pooled Investment Vehicles Other Than Registered Investment Companies |
23 | $ | 7.206 | 10 | $ | 6.858 | ||||||||||
| Other Accounts |
0 | N/A | N/A | N/A | ||||||||||||
Potential Conflicts of Interests
The Adviser and portfolio managers will experience conflicts of interest in connection with the management of the Fund, including, but not limited to, those discussed below relating to the Adviser and portfolio managers’ management of other funds and accounts. Dealing with conflicts of interest is complex and difficult, and new and different types of conflicts may subsequently arise.
| • | The members, officers and other personnel of the Adviser allocate their time, resources and other services between the Fund and other investment and business activities in which they are involved, including other funds, investment vehicles and accounts managed by KKR. The Adviser intends to devote such time as shall be necessary to conduct the Fund’s business affairs in an appropriate manner. However, the Adviser will continue to devote the time, resources and other services necessary to managing its other investment and business activities, and the Adviser is not precluded from conducting activities unrelated to the Fund. Substantial time will be spent by such members, officers and personnel monitoring the investments of other funds, investment vehicles and accounts managed by KKR. |
| • | The Adviser will, on behalf of the Fund, at times, compete with certain of its affiliates, including other entities it manages, for investments for the Fund, subjecting the Adviser to certain conflicts of interest in evaluating the suitability of investment opportunities and making or recommending acquisitions on the Fund’s behalf. The Adviser will receive advisory and other fees from the other entities it manages, and due to fee-offset provisions contained in the management agreements for such entities, the fees, at times, will not be proportionate to such entities’ investment accounts for any given transaction and the Adviser will have an incentive to favor entities from which it receives higher fees. |
| • | The Adviser’s allocation policy is designed to fairly and equitably distribute investment opportunities over time and in accordance with the Order, if required, among funds or pools of capital managed by the Adviser which may include proprietary accounts, including investment or co-investment vehicles established for personnel of KKR or and its affiliates. The Adviser’s allocation policy provides that once an investment has been approved it will be allocated to the funds or other pools of capital that have investment strategies suitable for such investment opportunity. If an investment opportunity is suitable for more than one fund or pool of capital, each suitable fund or pool of capital will receive a share of the investment based on its desired hold amount. Determinations as to desired hold amounts are based on such factors as: investment objectives and focus, target investment sizes, available capital, the timing of capital inflows and outflows and anticipated capital commitments and subscriptions, liquidity profile, applicable concentration limits and other investment restrictions, mandatory minimum investment rights and other contractual obligations applicable to participating funds and pools of capital, portfolio diversification, tax efficiencies and potential adverse tax consequences, regulatory restrictions applicable to participating funds and pools of capital, policies and restrictions (including internal policies and procedures) applicable to the participating funds and pools of capital, the avoidance of odd-lots or cases where a pro rata or other defined allocation methodology would result in a de minimis allocation to any participating funds and pools of capital, the potential dilutive effect of a new position, the overall risk profile, targeted leverage levels and targeted return of a portfolio, and the potential return available from a debt investment as compared to an equity investment. The outcome of this determination will result in the allocation of all, some or none of an investment opportunity to the Fund, subject to any applicable requirements of the Order. In addition, subject to applicable law, affiliates of the Adviser will, from time to time, invest in one of the Fund’s portfolio investments and hold a different class of securities than the Fund. To the extent that an affiliate of the Adviser holds a different class of securities than the Fund, its interests might not be aligned with the Fund’s. Notwithstanding the foregoing, the Adviser will act in the best interest of the Fund in accordance with its fiduciary duty to the Fund. |
Additionally, certain investment opportunities that may be appropriate for us may be allocated to other existing or future funds, investment vehicles and accounts managed by KKR and its affiliates, subject to any applicable requirements of the Order. Currently, KKR manages funds that invest in “core+” real estate in the United States, Europe and Asia (which are generally substantially stabilized assets generating relatively stable cash flow), with a focus on multifamily housing, build-to-rent properties, industrial properties, prime single tenant offices in innovation markets, senior housing and student housing (together with future accounts with similar investment strategies, the “Private Core+ Accounts”). KKR expects that there could be overlap of investment opportunities for the Fund and the Private Core+ Accounts. To the extent a potential investment satisfies the investment objectives, targets and restrictions of us and the Private Core+ Accounts on the same terms, including at the lower leverage targeted by the Private Core+ Accounts, such investment
will be allocated in accordance with KKR’s prevailing policies and procedures described above, subject to any applicable requirements of the Investment Company Act and the Order. Such policies and procedures generally provide that negotiated investment opportunities in the United States that are deemed suitable for KREST and the Private Core+ Accounts will be shared in accordance with the allocation factors described above and in compliance with the conditions of the Order, while negotiated opportunities in Europe and Asia that are deemed suitable for KREST and the Private Core+ Accounts will be allocated between KREST and the Private Core+ Accounts on a rotational basis, while not precluding occasional participation by KREST alongside Private Core+ Accounts in opportunities in Europe or Asia, as applicable, subject and pursuant to the conditions of the Order. KKR also manages KKR Real Estate Finance Trust Inc. and other investment vehicles and accounts, which invest in loans collateralized by commercial real estate (the “RE Credit Accounts”). KKR believes it is likely that there will be a limited overlap of investment opportunities for the Fund and the RE Credit Accounts because the Fund’s focus on private mezzanine and preferred equity debt interests as compared to the RE Credit Accounts’ investment focus on transitional whole loans. To the extent an investment satisfies the investment objectives of the Fund and the RE Credit Accounts on the same terms, such investment will be allocated in accordance with KKR’s prevailing policies and procedures described above, subject to any applicable requirements of the Investment Company Act and the Order. KKR also manages KKR Opportunistic Real Estate Credit, KKR Real Estate Stabilized Credit Partners L.P. and other vehicles and accounts, which invest in the risk retention securities of commercial mortgage securitizations along with other CMBS securities senior to risk retention tranches in commercial mortgage securitizations secured by institutional quality real estate assets (the “Risk Retention Accounts”). KKR expects there could be overlap of investment opportunities for the Fund and the Risk Retention Accounts for a limited subset of available investments opportunities. To the extent an investment satisfies the investment objectives of the Fund and the Risk Retention Accounts on the same terms, such investment will be allocated in accordance with KKR’s prevailing policies and procedures described above, which in some cases may grant a preferential allocation to the Risk Retention Accounts, subject to any applicable requirements of the Investment Company Act, the Order, and SEC staff interpretive guidance.
| • | The appropriate allocation among the Fund and other KKR funds and accounts of expenses and fees generated in the course of evaluating and making investments often will not be clear, especially where more than one KKR fund or account participates. The Adviser will determine, in its sole discretion, the appropriate allocation of investment-related expenses, including broken deal expenses incurred in respect of unconsummated investments and expenses more generally relating to a particular investment strategy, among the funds and accounts participating or that would have participated in such investments or that otherwise participate in the relevant investment strategy, as applicable, which could result in the Fund bearing more or less of these expenses than other participants or potential participants in the relevant investments. |
| • | From time to time, to the extent consistent with the Investment Company Act and the rules and regulations promulgated thereunder, and in accordance with the Order, if required, the Fund and other clients for which the Adviser or its affiliates provides investment management services or carries on investment activities (including, among others, clients that are employee benefit plans subject to the Employee Retirement Income Security Act of 1974, as amended (“ERISA”) and related regulations) will make investments at different levels of an investment entity’s capital structure or otherwise in different classes of an issuer’s securities. These investments inherently give rise to conflicts of interest or perceived conflicts of interest between or among the various classes of securities held by the Fund and such other clients, including in the case of financial distress of the investment entity. |
| • | KKR and the Adviser sponsor and advise, and expect in the future to sponsor and advise, a broad range of investment funds, vehicles and other accounts, including proprietary vehicles that make investments worldwide. KKR will, from time to time, also make investments for its own account, including, for example, through investment and co-investment vehicles established for KKR personnel and associates. The Adviser and its affiliates are not restricted from forming additional investment funds, from entering into other investment advisory relationships (including, among others, relationships with clients that are employee benefit plans subject to ERISA and related regulations) or from engaging in other business activities, even to the extent such activities are in competition with the Fund and/or involve substantial time and resources of the Adviser. For example, the Adviser could invest, on behalf of an affiliated fund, in a company that is a competitor of one of the Fund’s portfolio investments or that is a service provider, supplier, customer or other counterparty with respect to one of the Fund’s portfolio investments. In providing advice and recommendations to, or with respect to, such investments and in dealing in such investments on behalf of such other affiliated fund, to the extent permitted by law, the Adviser or its affiliates will not take into consideration the interests of the Fund and its portfolio investments and issuers thereof. Accordingly, such advice, recommendations and dealings will result in conflicts of interest for the Adviser. In addition, the Adviser’s ability to effectively implement the Fund’s investment strategies will be limited to the extent that contractual obligations relating to these permitted activities restrict the Adviser’s ability to engage in transactions that it would otherwise be interested in pursuing. Affiliates of the Adviser, whose primary business includes the origination of investments, engage in investment advisory business with accounts that compete with the Fund. |
| • | The Adviser and its affiliates will, from time to time, give advice and recommend securities to other clients that differs from, or is contrary to, advice given to or securities recommended or bought for the Fund even though their investment objectives are similar to the Fund’s. |
| • | To the extent not restricted by confidentiality requirements or applicable law, the Adviser will, from time to time, apply experience and information gained in providing services to the Fund’s portfolio investments in providing services to competing companies invested in by affiliates’ other clients, which could have adverse consequences for the Fund or its portfolio investments. In addition, in providing services in respect of such portfolio |
investments and other issuers of portfolio investments, the Adviser or its affiliates will, from time to time, come into possession of information that it is prohibited from acting on (including on behalf of the Fund) or disclosing as a result of applicable confidentiality requirements or applicable law, even though such action or disclosure would be in the interests of the Fund.
| • | The Adviser’s relationship with other advisory clients and with KKR could create a conflict of interest to the extent the Adviser becomes aware of inside information concerning investments or potential investment targets. KKR has adopted information-sharing policies and procedures which address both (i) the handling of confidential information and (ii) the information barrier that exists between the public and private sides of KKR. KKR has compliance functions to administer KKR’s information-sharing policies and procedures and monitor potential conflicts of interest. The Fund cannot assure its investors, however, that these procedures and practices will be effective. Although the Fund plans to leverage KKR’s firm-wide resources to help source, conduct due diligence on, structure, syndicate and create value for the Fund’s investments (to the extent permitted by applicable law), KKR’s information-sharing policies and procedures referenced above, as well as certain legal, contractual and tax constraints, could significantly limit KKR’s ability to do so. For example, from time to time KKR’s personnel will be in possession of material non-public information with respect to the Fund’s investments or potential investments, and as a result, such professionals will be restricted by KKR’s information-sharing policies or by law or contract, from sharing such information with the KKR professionals responsible for making the Fund’s investment decisions, even where the disclosure of such information would be in the best interest of the Fund or would otherwise influence the decisions taken by such investment professionals with respect to such investment or potential investment. In addition, this conflict and these procedures and practices could limit the freedom of the Adviser to enter into or exit from potentially profitable investments for the Fund which could have an adverse effect on the Fund’s results of operations. Conversely, the Adviser could pursue investments for the Fund without obtaining access to confidential information otherwise in its or KKR’s possession, which information, if reviewed, might otherwise impact the Adviser’s judgment with respect to such investments. Accordingly, as a result of such restrictions, the investment activities of KKR’s other businesses will differ from, or be inconsistent with, the interests of and activities that are undertaken for the Fund and there can be no assurance that the Fund will be able to fully leverage all of the available resources and industry expertise of KKR’s other businesses. Additionally, there will be circumstances in which one or more individuals associated with the Adviser will be precluded from providing services to the Fund because of certain confidential information available to those individuals or to other parts of KKR. |
| • | Certain other KKR client accounts or proprietary accounts have investment objectives, programs, strategies and positions that are similar to, or conflict with, those of the Fund, or compete with, or have interests adverse to, the Fund. This type of conflict could affect the prices and availability of the assets in which the Fund invests. KKR will, from time to time, give advice or take action with respect to the investments held by, and transactions of, other KKR client accounts or proprietary accounts that could be different from or otherwise inconsistent with the advice given or timing or nature of any action taken with respect to the investments held by, and timing or nature of any action taken with respect to the |
| investments held by, and transactions of, the Fund. Such different advice and/or inconsistent actions could be due to a variety of reasons, including, without limitation, the differences between the investment objective, program, strategy and tax treatment of the other KKR client accounts or proprietary accounts and the Fund or the regulatory status of other KKR client accounts and any related restrictions or obligations imposed on KKR as a fiduciary thereof. Such advice and actions could adversely impact the Fund. |
Each of the Adviser and the other investment advisers and/or investment managers affiliated with KKR will deal with conflicts of interest using its best judgment, but in its sole discretion. When conflicts arise between the Fund and another affiliated fund, the Adviser will represent the interests of the Fund and the other participating affiliated adviser will represent the interests of the affiliated fund it sponsors, manages or advises. In resolving conflicts, the Adviser and the other affiliated advisers will consider various factors, including applicable restrictions under the Investment Company Act, the interests of the funds and accounts they advise in the context of both the immediate issue at hand and the longer term course of dealing among the Fund and the other affiliated fund. As with all conflicts involving the Fund, the Adviser’s determination as to which factors are relevant and the resolution of such conflicts will be made in the Adviser’s sole discretion except as required by the Investment Company Act or by the governing documents of the Fund. Although the Adviser has established procedures and policies addressing conflicts of interest, there can be no assurance that the Adviser will be able to resolve all conflicts in a manner that is favorable to the Fund.
(a)(3) Compensation Structure of Portfolio Manager(s) or Management Team Members
Consistent with KKR’s global, integrated culture, KKR has one firm-wide compensation and incentive structure based on a global profit and loss statement, which covers the portfolio manager. KKR’s compensation structure is designed to align the interests of the investment personnel serving the Fund with those of the Fund’s shareholders and to give everyone a direct financial incentive to ensure that all of KKR’s resources, knowledge and relationships around the world are utilized to maximize risk-adjusted returns for each strategy.
Each of KKR’s senior executives, including the portfolio manager responsible for the day-to-day management of the Fund, receives a base salary and is eligible for a cash bonus and equity compensation, as well as additional incentives including “dollars at work” in certain KKR fund investments (other than the Fund). The cash bonus, equity compensation and “dollars at work” are discretionary, and “dollars at work” and equity awards are typically subject to a vesting period of several years.
Compensation and other incentives are not formulaic, but rather are judgment and merit driven, and are determined based on a combination of overall firm performance, individual contribution and performance, business unit performance, and relevant market and competitive compensation practices for KKR’s various businesses and the individual roles/responsibilities within each of those businesses.
(a)(4) Disclosure of Securities Ownership
As of the fiscal year ended December 31, 2025, the portfolio managers beneficially owned the following shares of the Fund:
| Portfolio Manager |
Dollar Range of Equity Securities Owned** | |
| Ralph Rosenberg | Over $1,000,000 | |
| Julia Butler | $50,001-$100,000 | |
| Matt Salem | None | |
| Justin Pattner | None | |
| Roger Morales | None | |
| Chris Lee | None | |
| Guillaume Cassou | None | |
| John Pattar | None |
| ** | Ranges (None, $1-$10,000, $10,001-$50,000, $50,001-$100,000, $100,001-$500,000, $500,001-$1,000,000 or over $1,000,000). |
Item 14. Purchases of Equity Securities by Closed-End Management Investment Company and Affiliated Purchasers.
No purchases were made during the reporting period by or on behalf of the Fund or any “affiliated purchaser,” as defined in Rule 10b-18(a)(3) under the Exchange Act of shares or other units of any class of the Fund’s equity securities that is registered by the registrant pursuant to Section 12 of the Exchange Act (15 U.S.C. 781).
Item 15. Submission of Matters to a Vote of Security Holders.
There have been no material changes to the procedures by which the shareholders may recommend nominees to the registrant’s board of directors, where those changes were implemented after the registrant last provided disclosure in response to the requirements of Item 407(c)(2)(iv) of Regulation S-K (17 CFR 229.407) (as required by Item 22(b)(15) of Schedule 14A (17 CFR 240.14a-101)), or this Item.
Item 16. Controls and Procedures.
| (a) | The registrant’s principal executive and principal financial officers, or persons performing similar functions, have concluded that the registrant’s disclosure controls and procedures (as defined in Rule 30a-3(c) under the Investment Company Act of 1940, as amended (the “1940 Act”) (17 CFR 270.30a-3(c))) are effective, as of a date within 90 days of the filing date of the report that includes the disclosure required by this paragraph, based on their evaluation of these controls and procedures required by Rule 30a-3(b) under the 1940 Act (17 CFR 270.30a-3(b)) and Rules 13a-15(b) or 15d-15(b) under the Securities Exchange Act of 1934, as amended (17 CFR 240.13a-15(b) or 240.15d-15(b)). |
There were no changes in the registrant’s internal control over financial reporting (as defined in Rule 30a-3(d) under the 1940 Act (17 CFR 270.30a-3(d))) that occurred during the period covered by this report that has materially affected, or is reasonably likely to materially affect, the registrant’s internal control over financial reporting.
Item 17. Disclosure of Securities Lending Activities for Closed-End Management Investment Companies.
Not applicable to the registrant.
Item 18. Recovery of Erroneously Awarded Compensation.
Not applicable to the registrant.
Item 19. Exhibits.
SIGNATURES
Pursuant to the requirements of the Securities Exchange Act of 1934 and the Investment Company Act of 1940, the registrant has duly caused this report to be signed on its behalf by the undersigned, thereunto duly authorized.
| (Registrant) KKR Real Estate Select Trust Inc. | ||
| By (Signature and Title)* | /s/ Julia Butler | |
| Julia Butler, Chief Executive Officer and President | ||
| (principal executive officer) | ||
Date: March 2, 2026
Pursuant to the requirements of the Securities Exchange Act of 1934 and the Investment Company Act of 1940, this report has been signed below by the following persons on behalf of the registrant and in the capacities and on the dates indicated.
| By (Signature and Title)* | /s/ Julia Butler | |
Julia Butler, Chief Executive Officer and President | ||
| (principal executive officer) |
Date: March 2, 2026
| By (Signature and Title)* | /s/ Megan Gaul | |
Megan Gaul, Chief Financial Officer, Chief Accounting Officer and Treasurer | ||
| (principal financial officer) |
Date: March 2, 2026
| * | Print the name and title of each signing officer under his or her signature. |