Q1 FISCAL 2025 LETTER TO SHAREHOLDERS April 23, 2025
Dear shareholders,
We are excited to provide an update on our activities over the first quarter of 2025.
Launch Program Update
We continue to work closely with our prospective launch customer. As a reminder, this launch program is designed to be a low-volume but high-visibility project. It is intended to serve as a real-world vehicle demonstration, highlighting the exceptional performance characteristics of our technology platform as a step toward large-scale commercialization. The program is planned to unfold over multiple phases, with field testing slated to begin in 2026.
This quarter, we have commenced shipping QSE-5 samples to our prospective launch customer for module and systems-level integration and testing, including design validation and calibration of the battery management system. This is consistent with our development approach: we focus on getting rapid customer feedback while making systematic and methodical improvements. We are tracking to the shipment targets we have established with our launch customer.
These shipments are powered by our Raptor separator process, which is exceeding our key internal benchmarks for yield and quality. Raptor is our workhorse for both customer shipments and development activities on our technology platform as we progress toward baselining our Cobra process. Cobra is a step-change innovation in ceramics processing, which can enable an order-of-magnitude improvement in separator productivity relative to Raptor.

Separator processing equipment undergoing qualification.
2025 Annual Goals
Our first key goal for the year is to bring the Cobra separator process into baseline production. This project is ahead of schedule: all the required separator processing equipment has already been installed, and qualification is progressing well. We expect to bring Cobra into the baseline in Q2.
Our second goal is to install higher-volume cell assembly equipment to match the higher throughput of Cobra. Working as a joint team with on-site PowerCo engineers, we are enhancing the level of equipment automation, which will allow us to increase the output and quality of QSE-5 samples. These equipment designs also represent an important piece of the technology platform that PowerCo will use in their large-scale production. We have placed purchase orders for key pieces of equipment and will upgrade the baseline continuously as they arrive.
Our third goal for 2025 is to begin shipping QSE-5 B1 samples, and this goal remains on track. The increased volumes of QSE-5 cells enabled by Cobra separator production will go into the launch program, which is intended to demonstrate the exceptional performance capabilities of the QSE-5 platform in a real-world application. B1 cells are the version that will supply the field testing phase of the launch program in 2026.
We report on our fourth annual goal in the Commercial Engagement Update below.
Commercial Engagement Update
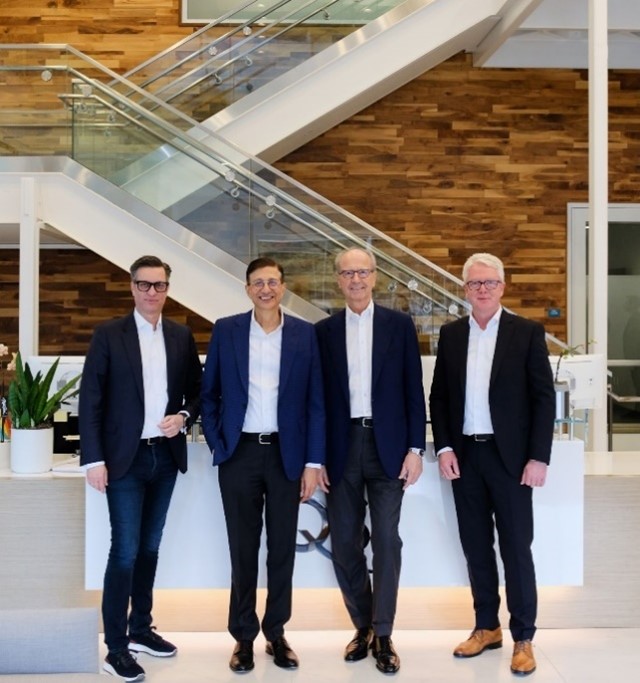
We continue to intensify development activities with PowerCo, the battery manufacturing company of the Volkswagen Group, as we work toward industrializing our technology for gigawatt-hour-scale production. In Q1, we welcomed to our San Jose facilities Hans Dieter Pötsch, chairman of the Supervisory Board of the Volkswagen Group, Thomas Schmall, chairman of the Supervisory Board of PowerCo, and Frank Blome, the CEO of PowerCo, to personally review the progress made by the joint team.
Leadership from PowerCo and Volkswagen Group with QuantumScape CEO Siva Sivaram (second from left) in March 2025 |
PowerCo is the anchor customer in our growing technology ecosystem. To further expand this ecosystem, we are working with additional automotive OEM customers, as mentioned in our Q4 2024 Shareholder Letter. We are also building a global network of equipment vendors, materials suppliers, contract manufacturers, and technology partners, leveraging the expertise of industry leaders across the value chain. To that end, we have announced the first phase of an agreement to explore a collaboration with Murata Manufacturing for ceramics production. Murata Manufacturing is a worldwide leader in ceramic materials and electronics manufacturing headquartered in Kyoto, Japan and has decades of experience manufacturing advanced ceramics for electronic components, energy storage and industrial applications. By combining our groundbreaking Cobra separator production process with Murata’s proven capabilities and global manufacturing strength, we can accelerate the industrialization of our solid-state battery technology while maintaining our strong focus on innovation and technological advancement. |

Representatives of the Volkswagen Group and PowerCo reviewing the joint team’s progress
on industrialization of the QSE-5 technology platform.
Financial Outlook
Capital expenditures in the first quarter were $5.8M. Q1 capex primarily supported facilities and equipment purchases as we prepare for higher-volume QSE-5 B1 sample production using the Cobra separator process. We reiterate our full-year guidance for capex of between $45M and $75M.
GAAP operating expenses and GAAP net loss in Q1 were $123.6M and $114.4M, respectively. Adjusted EBITDA loss was $64.6M in Q1, in line with expectations. A table reconciling GAAP net loss and Adjusted EBITDA is available in the financial statement at the end of this shareholder letter. We reiterate our full-year guidance for Adjusted EBITDA loss to be between $250M and $280M.
We ended Q1 with $860.3M in liquidity and maintain our guidance that our cash runway extends into the second half of 2028. Any additional funds from customer inflows or capital markets activity would further extend this cash runway.
As always, we encourage investors to read more on our financial information, business outlook, and risk factors in our quarterly and annual SEC filings on our investor relations website.
Strategic Outlook
This quarter we released our Strategic Blueprint. This is our playbook for commercializing our next-generation battery technology at a global scale, and we encourage all shareholders to read it. Here, we’d like to highlight a few important aspects of this blueprint.
First, as a technology company, we believe our business model is resilient to changes in global trade regimes. By partnering with customers around the world and licensing our technology for their own production, we can achieve a global impact while limiting our exposure to the risks presented by policy changes.
Second, we will continue to create value by pushing the technology frontier. We have a development roadmap of future innovation in battery technology that builds on our solid-state lithium-metal platform, innovations designed to unlock even higher performance, drive wider adoption, and increase our value creation as a company.
Finally, we are building an ecosystem of partners to help rapidly bring our technology to the world. Technological revolutions can only happen when companies around the world see the opportunity and work together to make it a reality. Our framework agreement with Murata Manufacturing represents another important step in this direction.
The electric powertrain is set to dominate the global automotive industry, and automakers are looking to solid-state battery technology to remain competitive. We believe our technology edge, when combined with our strong balance sheet and consistent record of execution, sets us apart as the clear leader in solid-state batteries, and we are well positioned to expand our advantage over our competitors in this space and generate exceptional shareholder value over the long term.
Thank you for your support, and we are excited to report on our continued progress over the coming quarter.
|
|
Dr. Siva Sivaram President, CEO and Director |
Kevin Hettrich CFO |
QuantumScape Corporation
Condensed Consolidated Balance Sheets (Unaudited)
(In Thousands)
|
|
March 31, |
|
|
December 31, |
|
||
|
|
2025 |
|
|
2024 |
|
||
Assets |
|
|
|
|
|
|
||
Current assets |
|
|
|
|
|
|
||
Cash and cash equivalents |
|
$ |
153,555 |
|
|
$ |
140,866 |
|
Marketable securities |
|
|
706,754 |
|
|
|
769,901 |
|
Prepaid expenses and other current assets |
|
|
11,173 |
|
|
|
11,519 |
|
Total current assets |
|
|
871,482 |
|
|
|
922,286 |
|
Property and equipment, net |
|
|
289,465 |
|
|
|
299,992 |
|
Right-of-use assets - finance lease |
|
|
21,549 |
|
|
|
22,267 |
|
Right-of-use assets - operating lease |
|
|
50,144 |
|
|
|
51,472 |
|
Other assets |
|
|
26,252 |
|
|
|
26,378 |
|
Total assets |
|
$ |
1,258,892 |
|
|
$ |
1,322,395 |
|
Liabilities and stockholders’ equity |
|
|
|
|
|
|
||
Current liabilities |
|
|
|
|
|
|
||
Accounts payable |
|
$ |
7,786 |
|
|
$ |
6,466 |
|
Accrued liabilities |
|
|
22,176 |
|
|
|
17,447 |
|
Accrued compensation and benefits |
|
|
13,332 |
|
|
|
32,212 |
|
Operating lease liability, short-term |
|
|
5,693 |
|
|
|
5,526 |
|
Finance lease liability, short-term |
|
|
3,319 |
|
|
|
3,233 |
|
Total current liabilities |
|
|
52,306 |
|
|
|
64,884 |
|
Operating lease liability, long-term |
|
|
51,474 |
|
|
|
52,913 |
|
Finance lease liability, long-term |
|
|
30,995 |
|
|
|
31,865 |
|
Other liabilities |
|
|
15,519 |
|
|
|
14,886 |
|
Total liabilities |
|
|
150,294 |
|
|
|
164,548 |
|
Total stockholders’ equity |
|
|
1,108,598 |
|
|
|
1,157,847 |
|
Total liabilities and stockholders’ equity |
|
$ |
1,258,892 |
|
|
$ |
1,322,395 |
|
QuantumScape Corporation
Condensed Consolidated Statements of Operations and Comprehensive Loss (Unaudited)
(In Thousands, Except per Share Amounts)
|
|
Three Months Ended March 31, |
|
|||||
|
|
2025 |
|
|
2024 |
|
||
Operating expenses: |
|
|
|
|
|
|
||
Research and development |
|
$ |
95,589 |
|
|
$ |
83,847 |
|
General and administrative |
|
|
27,986 |
|
|
|
48,054 |
|
Total operating expenses |
|
|
123,575 |
|
|
|
131,901 |
|
Loss from operations |
|
|
(123,575 |
) |
|
|
(131,901 |
) |
Other income (expense): |
|
|
|
|
|
|
||
Interest expense |
|
|
(528 |
) |
|
|
(572 |
) |
Interest income |
|
|
9,769 |
|
|
|
12,065 |
|
Other expense, net |
|
|
(89 |
) |
|
|
(220 |
) |
Total other income |
|
|
9,152 |
|
|
|
11,273 |
|
Net loss |
|
|
(114,423 |
) |
|
|
(120,628 |
) |
Less: Net income attributable to non-controlling interest, net of tax of $0 |
|
|
— |
|
|
|
20 |
|
Net loss attributable to common stockholders |
|
$ |
(114,423 |
) |
|
$ |
(120,648 |
) |
Net loss |
|
$ |
(114,423 |
) |
|
$ |
(120,628 |
) |
Other comprehensive income (loss): |
|
|
|
|
|
|
||
Unrealized gain (loss) on marketable securities |
|
|
(328 |
) |
|
|
1,490 |
|
Total comprehensive loss |
|
|
(114,751 |
) |
|
|
(119,138 |
) |
Less: Comprehensive income attributable to non-controlling interest |
|
|
— |
|
|
|
20 |
|
Comprehensive loss attributable to common stockholders |
|
$ |
(114,751 |
) |
|
$ |
(119,158 |
) |
|
|
|
|
|
|
|
||
Basic and Diluted net loss per share |
|
$ |
(0.21 |
) |
|
$ |
(0.24 |
) |
Basic and Diluted weighted-average common shares outstanding |
|
|
548,006 |
|
|
|
496,145 |
|
QuantumScape Corporation
Condensed Consolidated Statements of Cash Flows (Unaudited)
(In Thousands)
|
|
Three Months Ended March 31, |
|
|||||
|
|
2025 |
|
|
2024 |
|
||
Operating activities |
|
|
|
|
|
|
||
Net loss |
|
$ |
(114,423 |
) |
|
$ |
(120,628 |
) |
Adjustments to reconcile net loss to net cash used in operating activities: |
|
|
|
|
|
|
||
Depreciation and amortization |
|
|
18,335 |
|
|
|
11,983 |
|
Amortization of right-of-use assets and non-cash lease expense |
|
|
2,046 |
|
|
|
1,985 |
|
Amortization of premiums and accretion of discounts on marketable securities |
|
|
(5,048 |
) |
|
|
(8,159 |
) |
Stock-based compensation expense |
|
|
40,639 |
|
|
|
19,287 |
|
Other |
|
|
40 |
|
|
|
107 |
|
Changes in operating assets and liabilities: |
|
|
|
|
|
|
||
Prepaid expenses and other current assets and other assets |
|
|
472 |
|
|
|
(22,679 |
) |
Accounts payable, accrued liabilities and accrued compensation and benefits |
|
|
(1,532 |
) |
|
|
61,564 |
|
Operating lease liability |
|
|
(1,272 |
) |
|
|
(1,261 |
) |
Other liabilities |
|
|
(6 |
) |
|
|
(144 |
) |
Net cash used in operating activities |
|
|
(60,749 |
) |
|
|
(57,945 |
) |
Investing activities |
|
|
|
|
|
|
||
Purchases of property and equipment |
|
|
(5,835 |
) |
|
|
(14,120 |
) |
Proceeds from maturities of marketable securities |
|
|
281,220 |
|
|
|
384,639 |
|
Proceeds from sales of marketable securities |
|
|
— |
|
|
|
1,245 |
|
Purchases of marketable securities |
|
|
(213,352 |
) |
|
|
(265,265 |
) |
Net cash provided by investing activities |
|
|
62,033 |
|
|
|
106,499 |
|
Financing activities |
|
|
|
|
|
|
||
Proceeds from exercise of stock options |
|
|
11,182 |
|
|
|
1,948 |
|
Proceeds from issuance of common stock, net of issuance costs paid |
|
|
1,007 |
|
|
|
— |
|
Principal payment for finance lease |
|
|
(784 |
) |
|
|
(705 |
) |
Net cash provided by financing activities |
|
|
11,405 |
|
|
|
1,243 |
|
Net increase in cash, cash equivalents and restricted cash |
|
|
12,689 |
|
|
|
49,797 |
|
Cash, cash equivalents and restricted cash at beginning of period |
|
|
158,914 |
|
|
|
160,572 |
|
Cash, cash equivalents and restricted cash at end of period |
|
$ |
171,603 |
|
|
$ |
210,369 |
|
Supplemental disclosure |
|
|
|
|
|
|
||
Cash paid for interest |
|
$ |
528 |
|
|
$ |
572 |
|
Purchases of property and equipment, not yet paid |
|
$ |
4,624 |
|
|
$ |
9,772 |
|
Common stock issuance costs, accrued but not paid |
|
$ |
110 |
|
|
$ |
— |
|
Net Loss to Adjusted EBITDA
Adjusted EBITDA is a non-GAAP supplemental measure of operating performance that does not represent and should not be considered an alternative to operating loss or cash flow from operations, as determined by GAAP. Adjusted EBITDA is defined as net income (loss) before interest expense, non-controlling interest, revaluations, impairments, stock-based compensation, depreciation and amortization expense, and other non-recurring charges. We use Adjusted EBITDA to measure the operating performance of our business, excluding specifically identified items that we do not believe directly reflect our core operations and may not be indicative of our recurring operations. Adjusted EBITDA may not be comparable to similarly titled measures provided by other companies due to potential differences in methods of calculations. A reconciliation of Adjusted EBITDA to net loss is as follows:
($ in Thousands) |
|
Three Months Ended |
|
|||||
|
|
2025 |
|
|
2024 |
|
||
GAAP net loss attributable to Common Stockholders |
|
$ |
(114,423 |
) |
|
$ |
(120,648 |
) |
Interest expense (income), net |
|
|
(9,241 |
) |
|
|
(11,493 |
) |
Other expense (income), net |
|
|
89 |
|
|
|
220 |
|
Net gain (loss) attributable to non-controlling interests |
|
|
— |
|
|
|
20 |
|
Stock-based compensation |
|
|
40,639 |
|
|
|
19,287 |
|
Litigation settlement accrual and legal fees, net |
|
|
— |
|
|
|
24,455 |
|
Non-GAAP operating loss |
|
$ |
(82,936 |
) |
|
$ |
(88,159 |
) |
Depreciation and amortization expense |
|
|
18,376 |
|
|
|
11,983 |
|
Adjusted EBITDA |
|
$ |
(64,560 |
) |
|
$ |
(76,176 |
) |
Management’s Use of Non-GAAP Financial Measures
This letter includes certain non-GAAP financial measures as defined by SEC rules. These non-GAAP financial measures are in addition to, and not a substitute for or superior to, measures of financial performance prepared in accordance with U.S. GAAP. There are a number of limitations related to the use of these non-GAAP financial measures versus their nearest GAAP equivalents. For example, other companies may calculate non-GAAP financial measures differently or may use other measures to evaluate their performance, all of which could reduce the usefulness of our non-GAAP financial measures as tools for comparison. We urge you to review the reconciliations of our non-GAAP financial measures to the most directly comparable U.S. GAAP financial measures set forth in this letter, and not to rely on any single financial measure to evaluate our business.
Forward-Looking Statements
This letter contains “forward-looking statements” within the meaning of the federal securities laws based on management’s current expectations as of the date of this letter. All statements, other than historical facts, including those about the Company’s battery technology, benefits, performance, goals, operations, cash usage, spending, and investment, are forward-looking statements. Words like “may,” “will,” “can,” “estimate,” “when,” “aim,” “pro forma,” “expect,” “plan,” “believe,” “designed,” “slate,” “allow,” “focus,” “potential,” “predict,” “target,” “forecast,” “should,” “would,” “could,” “continue,” “capable,” “ongoing,” “project,” “intend,” “anticipate,” “enable,” “promising,” “working toward,” “progress toward,” “step toward,” “prospective,” “roadmap,” and the negative of such terms and other similar expressions identify forward-looking statements, though not all forward-looking statements include these words. These statements rely on management’s current expectations, assumptions, and available information about future events and involve significant risks and uncertainties that could cause actual results to differ materially.
Many factors are outside the Company’s control and difficult to predict, and include without limitation those listed here. The Company’s 2025 goals are ambitious and subject to various risks and uncertainties. The Company could face significant delays or technical challenges replicating and scaling performance from its earlier low-volume sample cells, achieving the quality, consistency, reliability, safety, cost, and throughput required for commercial production, and developing a cell architecture meeting all technical requirements and customer expectations. The Company has encountered and may encounter delays, unforeseen technical issues, and other obstacles in developing, acquiring, installing, and operating new manufacturing equipment for automated or continuous-flow processes like Raptor and Cobra, including vendor delays, supply chain disruptions, and challenges in optimizing its manufacturing processes and transitioning from Raptor to Cobra. The Company may encounter delays and cost overruns hiring and retaining the engineers needed to expand development and production, including under the Collaboration Agreement with PowerCo, building out or scaling our pilot line in San Jose, and establishing supply relationships for required materials, components, or equipment, including in contract manufacturing relationships. Delays in increasing sample production have previously slowed the Company’s development. Such delays could affect our sample delivery and delay or prevent successful demonstration, commercialization of our products, entry into the IP License Agreement with PowerCo, or engagement with new partners across the battery value chain. Our relationship with Volkswagen and PowerCo faces risks that could adversely affect our business and future prospects. The Company may encounter delays, difficulties, and technical challenges collaborating with PowerCo or other partners to industrialize its battery technology. Delays or difficulties meeting technical milestones, including those required to trigger the IP License Agreement and royalty prepayment, scaling up our pilot line in San Jose, or readying our technology platform for transfer to prospective licensees, could cause prospective customers and partners not to purchase cells or license our technology. If the Company does not enter the IP License Agreement with PowerCo, it will not receive the royalty prepayment or other expected benefits. Certain agreements and relationships currently or may in the future restrict our operations, commercialization, and revenue. While our collaboration with Murata Manufacturing and other partners across the battery value chain could accelerate industrialization of the Company’s solid-state battery technology, there is no assurance these engagements will progress beyond initial phases or achieve intended outcomes. The Company may be unable to control costs tied to its operations and the components needed to build solid-state battery cells at competitive prices. The Company’s spending may exceed current expectations, requiring additional fundraising, including in public markets, which may dilute our investors’ ownership. The Company may face difficulties from changes in its economic and financial conditions and market conditions affecting demand for its technology, potentially hindering success in the battery industry or undermining confidence in its long-term business among partners and customers. The Company faces competition from major manufacturers, automotive OEMs, and new entrants, including conventional lithium-ion battery suppliers, in developing and commercializing solid-state battery technology. If the Company cannot protect or assert its intellectual property, its business and competitive position would be harmed. The Company cautions the foregoing list of factors is not exclusive. The Company cautions readers not to place undue reliance on any forward-looking statements, which speak only as of their date.
Except as required by law, the Company disclaims any duty to update forward-looking statements. If assumptions prove incorrect, actual results and projections could differ materially from those in forward-looking statements. Additional information about these and other factors that could materially affect the Company’s actual results can be found in the Company’s SEC filings, available at www.sec.gov.