Q3 Fiscal 2025 Letter to Shareholders
Q3 Fiscal 2025 Letter to Shareholders
Dear shareholders,
We are excited to provide you with an update on our progress over the past quarter.
Customer Launch Event
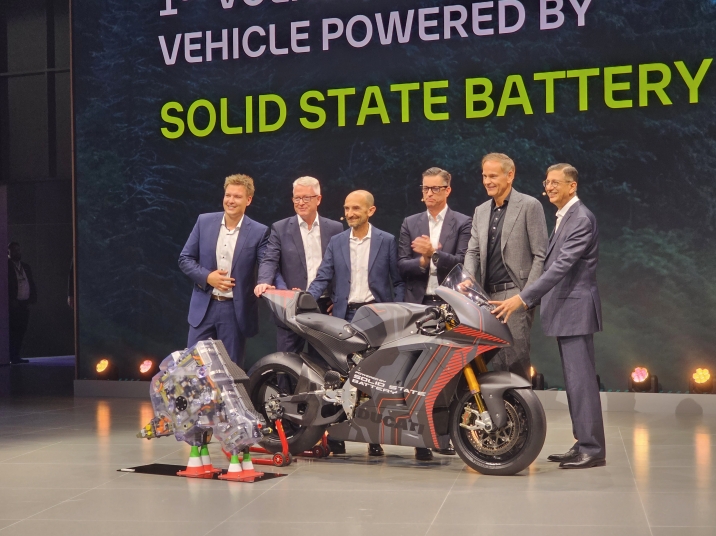
On September 8, at IAA Mobility in Munich, Germany, we unveiled our launch program with the VW Group: the Ducati V21L race motorcycle, developed as a collaboration among Ducati, Audi, PowerCo and QS. The Ducati V21L is a first-of-its-kind vehicle demonstration planned as a showcase for the exceptional performance of our no-compromise next-generation battery technology.
As a launch program, the Ducati V21L is ideal: it is a low-volume but high-visibility demonstration that allows us to put QSE-5 technology into a demanding real-world application. Track motorcycles require both extremely high power capability and high energy density simultaneously. Moreover, a motorcycle represents a rigorous test platform to demonstrate our differentiated solid-state battery technology, as the pack is not large enough to accommodate exotic thermal management or pressure application mechanisms. The next step for the Ducati program is field testing.
|
The Ducati V21L powered by QS technology debuted at IAA Mobility in Munich, Germany |
Annual Goals and Commercial Engagement
We are pleased to report that during Q3 we began shipping Cobra-based QSE-5 B1 samples, completing another of our key annual goals for 2025. These cells are part of the Ducati launch program and were featured on stage at the IAA Mobility conference. Our remaining operational goal for the year is to install higher-volume cell production equipment for our highly automated pilot line in San Jose, named the Eagle Line. Equipment for certain key assembly steps has already been installed on the Eagle Line, and this goal remains on track.
Another important goal for 2025 has been to expand our commercial engagement, including deepening relationships with existing customers, engaging new customers, and bringing additional partners into our growing QS technology ecosystem. In Q3, we made substantial progress on all three aspects.
With respect to existing customers, the successful launch event with Ducati, Audi and PowerCo at IAA Mobility was a major milestone in our long collaboration with the VW Group. Last quarter we also announced a new joint development agreement (JDA) with an existing customer, and we are continuing to work closely with them as we progress through the first phase of the development and commercialization engagement. We are also in an active engagement with a new Top-10 global automotive OEM in addition to our existing customers.
|
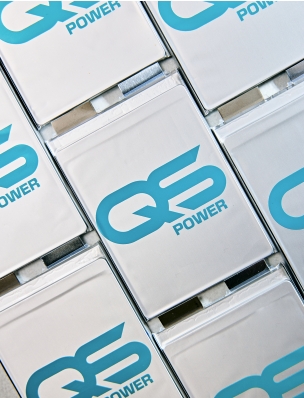
With regard to QS ecosystem development, we continue to add world-class partners: on September 30 we announced an agreement with Corning to jointly develop ceramic separator manufacturing capabilities based on our Cobra process. Corning is a global leader in advanced materials, and they bring deep expertise in ceramics processing and proven manufacturing excellence to the QS ecosystem. In parallel, we successfully completed the initial phase of our collaboration with Murata Manufacturing, have signed a subsequent contract, and progressed to the next phase of that relationship. Our goal is to make QS technology the clear choice by providing our customers with a turnkey ecosystem to serve the global demand for better batteries. With Murata and Corning, we have two of the most world-renowned technical ceramics manufacturers as ecosystem partners, and we will continue to grow our ecosystem further. |
Financial Outlook
GAAP operating expenses and GAAP net loss in Q3 were $115.0M and $105.8M, respectively. Adjusted EBITDA loss was $61.4M in Q3, in line with expectations. A table reconciling GAAP net loss and Adjusted EBITDA is available in the financial statement at the end of this shareholder letter. We continue to drive operational efficiency consistent with our capital-light licensing focus and improve our full-year guidance for Adjusted EBITDA loss to $245M – $260M.
Capital expenditures in the third quarter were $9.6M. Q3 capex primarily supported facilities and equipment purchases for the Eagle Line. As a result of efficiency gains and process improvements, including from the Cobra process, as well as a change in timing of certain equipment ordering, we revise the range of our full-year capex guidance to $30M – $40M.
We ended Q3 with $1.0B in liquidity and now project that our cash runway extends through the end of the decade, a 12-month extension from our previous guidance of into 2029. We completed our at-the-market equity program before our shelf registration statement expired on August 10. Going forward, we plan to move away from providing updates on cash runway and will begin providing updates on customer billings.
Customer billings represent the total value of all invoices issued by QS to our customers and partners in the period, regardless of accounting treatment. "Customer billings" is a key operational metric meant to give insight into customer activity and future cash inflows. The metric is not a substitute for revenue under U.S. GAAP. Customer billings in Q3 were $12.8M.
Strategic Outlook
With our achievements this quarter, our vision for commercialization of our next-generation battery technology is beginning to take shape. We are executing consistently toward our key annual goals, demonstrating our technology, engaging with partners, and building out our capital-light development and licensing business model. Everything starts with execution, and we are proud of our team’s performance. This year, we have already accomplished two of our key operational goals: baselining our Cobra process and beginning shipment of Cobra-based QSE-5 cells, continuing our track record of consistent execution against our goals. Q3 also saw our first public technology demonstration with the VW Group, the Ducati V21L. It showed the determination of our customers to bring QS technology to market as soon as possible, and we continue to work together closely to achieve automotive-grade reliability, industrialization and mass production of our next-generation battery technology. We believe the economic value of our differentiated technology is clear, and we are expanding our collaboration with existing and new customers.
|
From left: Peter Juris, High-Energy Battery Systems Lead, Audi; Frank Blome, CEO, PowerCo; Claudio Domenicali, CEO, Ducati; Thomas Schmall, Member of the Board of Management, Technology, VW Group, and CEO, Volkswagen Group Technology; Oliver Blume, CEO, Porsche, and CEO and Chairman of the Board of Management, VW Group; Siva Sivaram, CEO, QS
|
We have also expanded our global ecosystem of world-class partners, and this quarter we announced Corning as a partner and took the next step in our collaboration with Murata Manufacturing. The third quarter also marks another exciting milestone: we are beginning to show returns from our capital-light development and licensing business model, posting over $12M in customer billings in Q3.
Our ambitious targets naturally present many challenges to overcome, and there is much work left to do. Our objective is clear: revolutionize energy storage, capitalize on our enormous market opportunity and create exceptional value for shareholders. With this aim in mind, we are excited to update shareholders on our continued progress over the months and years to come.
|
|
Dr. Siva Sivaram |
Kevin Hettrich |
QuantumScape Corporation
Condensed Consolidated Balance Sheets (Unaudited)
(In Thousands)
|
|
September 30, |
|
|
December 31, |
|
||
|
|
2025 |
|
|
2024 |
|
||
Assets |
|
|
|
|
|
|
||
Current assets |
|
|
|
|
|
|
||
Cash and cash equivalents |
|
$ |
225,826 |
|
|
$ |
140,866 |
|
Marketable securities |
|
|
777,907 |
|
|
|
769,901 |
|
Prepaid expenses and other current assets |
|
|
11,798 |
|
|
|
11,519 |
|
Total current assets |
|
|
1,015,531 |
|
|
|
922,286 |
|
Property and equipment, net |
|
|
250,323 |
|
|
|
299,992 |
|
Right-of-use assets - operating lease |
|
|
35,134 |
|
|
|
51,472 |
|
Right-of-use assets - finance lease |
|
|
20,112 |
|
|
|
22,267 |
|
Other assets |
|
|
22,132 |
|
|
|
26,378 |
|
Total assets |
|
$ |
1,343,232 |
|
|
$ |
1,322,395 |
|
Liabilities and stockholders’ equity |
|
|
|
|
|
|
||
Current liabilities |
|
|
|
|
|
|
||
Accounts payable |
|
$ |
6,446 |
|
|
$ |
6,466 |
|
Accrued liabilities |
|
|
13,994 |
|
|
|
17,447 |
|
Accrued compensation and benefits |
|
|
19,551 |
|
|
|
32,212 |
|
Operating lease liability, short-term |
|
|
4,558 |
|
|
|
5,526 |
|
Finance lease liability, short-term |
|
|
3,493 |
|
|
|
3,233 |
|
Total current liabilities |
|
|
48,042 |
|
|
|
64,884 |
|
Operating lease liability, long-term |
|
|
35,728 |
|
|
|
52,913 |
|
Finance lease liability, long-term |
|
|
29,216 |
|
|
|
31,865 |
|
Other liabilities |
|
|
14,498 |
|
|
|
14,886 |
|
Total liabilities |
|
|
127,484 |
|
|
|
164,548 |
|
Total stockholders’ equity |
|
|
1,215,748 |
|
|
|
1,157,847 |
|
Total liabilities and stockholders’ equity |
|
$ |
1,343,232 |
|
|
$ |
1,322,395 |
|
QuantumScape Corporation
Condensed Consolidated Statements of Operations and Comprehensive Loss (Unaudited)
(In Thousands, Except per Share Amounts)
|
|
Three Months Ended September 30, |
|
|
Nine Months Ended September 30, |
|
||||||||||
|
|
2025 |
|
|
2024 |
|
|
2025 |
|
|
2024 |
|
||||
Operating expenses: |
|
|
|
|
|
|
|
|
|
|
|
|
||||
Research and development |
|
$ |
92,074 |
|
|
$ |
96,994 |
|
|
$ |
288,840 |
|
|
$ |
278,587 |
|
General and administrative |
|
|
22,919 |
|
|
|
33,164 |
|
|
|
73,314 |
|
|
|
117,929 |
|
Total operating expenses |
|
|
114,993 |
|
|
|
130,158 |
|
|
|
362,154 |
|
|
|
396,516 |
|
Loss from operations |
|
|
(114,993 |
) |
|
|
(130,158 |
) |
|
|
(362,154 |
) |
|
|
(396,516 |
) |
Other income (expense): |
|
|
|
|
|
|
|
|
|
|
|
|
||||
Interest expense |
|
|
(503 |
) |
|
|
(550 |
) |
|
|
(1,547 |
) |
|
|
(1,684 |
) |
Interest income |
|
|
9,997 |
|
|
|
11,347 |
|
|
|
28,706 |
|
|
|
35,428 |
|
Other income (expense) |
|
|
(325 |
) |
|
|
(338 |
) |
|
|
50 |
|
|
|
(508 |
) |
Total other income |
|
|
9,169 |
|
|
|
10,459 |
|
|
|
27,209 |
|
|
|
33,236 |
|
Net loss |
|
|
(105,824 |
) |
|
|
(119,699 |
) |
|
|
(334,945 |
) |
|
|
(363,280 |
) |
Less: Net loss attributable to non-controlling interest, net of tax of $0 |
|
|
— |
|
|
|
(127 |
) |
|
|
— |
|
|
|
(85 |
) |
Net loss attributable to common stockholders |
|
$ |
(105,824 |
) |
|
$ |
(119,572 |
) |
|
$ |
(334,945 |
) |
|
$ |
(363,195 |
) |
Net loss |
|
$ |
(105,824 |
) |
|
$ |
(119,699 |
) |
|
$ |
(334,945 |
) |
|
$ |
(363,280 |
) |
Other comprehensive income (loss): |
|
|
|
|
|
|
|
|
|
|
|
|
||||
Unrealized gain on marketable securities |
|
|
656 |
|
|
|
1,458 |
|
|
|
115 |
|
|
|
3,816 |
|
Total comprehensive loss |
|
|
(105,168 |
) |
|
|
(118,241 |
) |
|
|
(334,830 |
) |
|
|
(359,464 |
) |
Less: Comprehensive loss attributable to non-controlling interest |
|
|
— |
|
|
|
(127 |
) |
|
|
— |
|
|
|
(85 |
) |
Comprehensive loss attributable to common stockholders |
|
$ |
(105,168 |
) |
|
$ |
(118,114 |
) |
|
$ |
(334,830 |
) |
|
$ |
(359,379 |
) |
|
|
|
|
|
|
|
|
|
|
|
|
|
||||
Basic and Diluted net loss per share |
|
$ |
(0.18 |
) |
|
$ |
(0.23 |
) |
|
$ |
(0.59 |
) |
|
$ |
(0.72 |
) |
Basic and Diluted weighted-average common shares outstanding |
|
|
588,728 |
|
|
|
508,957 |
|
|
|
566,293 |
|
|
|
502,136 |
|
QuantumScape Corporation
Condensed Consolidated Statements of Cash Flows (Unaudited)
(In Thousands)
|
|
Three Months Ended September 30, |
|
|
Nine Months Ended September 30, |
|
||||||||||
|
|
2025 |
|
|
2024 |
|
|
2025 |
|
|
2024 |
|
||||
Operating activities |
|
|
|
|
|
|
|
|
|
|
|
|
||||
Net loss |
|
$ |
(105,824 |
) |
|
$ |
(119,699 |
) |
|
$ |
(334,945 |
) |
|
$ |
(363,280 |
) |
Adjustments to reconcile net loss to net cash used in operating activities: |
|
|
|
|
|
|
|
|
|
|
|
|
||||
Depreciation and amortization |
|
|
14,169 |
|
|
|
14,943 |
|
|
|
51,974 |
|
|
|
39,795 |
|
Amortization of right-of-use assets and non-cash lease expense |
|
|
1,745 |
|
|
|
2,013 |
|
|
|
5,859 |
|
|
|
5,980 |
|
Amortization of premiums and accretion of discounts on marketable securities |
|
|
(4,583 |
) |
|
|
(7,445 |
) |
|
|
(13,696 |
) |
|
|
(23,124 |
) |
Stock-based compensation expense |
|
|
29,223 |
|
|
|
43,359 |
|
|
|
96,117 |
|
|
|
110,471 |
|
Write-off of fixed assets |
|
|
9,522 |
|
|
|
283 |
|
|
|
24,410 |
|
|
|
1,533 |
|
Other |
|
|
(2,657 |
) |
|
|
84 |
|
|
|
(2,936 |
) |
|
|
186 |
|
Changes in operating assets and liabilities: |
|
|
|
|
|
|
|
|
|
|
|
|
||||
Prepaid expenses and other current assets and other assets |
|
|
(1,988 |
) |
|
|
21,933 |
|
|
|
1,120 |
|
|
|
(777 |
) |
Accounts payable, accrued liabilities and accrued compensation and benefits |
|
|
(2,185 |
) |
|
|
(47,335 |
) |
|
|
(9,045 |
) |
|
|
15,984 |
|
Operating lease liability |
|
|
(1,098 |
) |
|
|
(1,184 |
) |
|
|
(3,692 |
) |
|
|
(3,717 |
) |
Other liabilities |
|
|
(58 |
) |
|
|
246 |
|
|
|
(1,489 |
) |
|
|
1,051 |
|
Net cash used in operating activities |
|
|
(63,734 |
) |
|
|
(92,802 |
) |
|
|
(186,323 |
) |
|
|
(215,898 |
) |
Investing activities |
|
|
|
|
|
|
|
|
|
|
|
|
||||
Purchases of property and equipment |
|
|
(9,580 |
) |
|
|
(18,038 |
) |
|
|
(24,001 |
) |
|
|
(51,085 |
) |
Proceeds from sale of property and equipment |
|
|
828 |
|
|
|
112 |
|
|
|
1,106 |
|
|
|
116 |
|
Proceeds from maturities of marketable securities |
|
|
293,100 |
|
|
|
252,744 |
|
|
|
830,664 |
|
|
|
1,146,587 |
|
Proceeds from sales of marketable securities |
|
|
— |
|
|
|
— |
|
|
|
— |
|
|
|
1,245 |
|
Purchases of marketable securities |
|
|
(440,726 |
) |
|
|
(168,686 |
) |
|
|
(824,858 |
) |
|
|
(858,921 |
) |
Net cash (used in) provided by investing activities |
|
|
(156,378 |
) |
|
|
66,132 |
|
|
|
(17,089 |
) |
|
|
237,942 |
|
Financing activities |
|
|
|
|
|
|
|
|
|
|
|
|
||||
Proceeds from exercise of stock options and employee stock purchase plan |
|
|
7,986 |
|
|
|
7,398 |
|
|
|
23,645 |
|
|
|
13,968 |
|
Proceeds from issuance of common stock |
|
|
267,621 |
|
|
|
— |
|
|
|
268,654 |
|
|
|
— |
|
Common stock issuance costs paid |
|
|
(4,160 |
) |
|
|
— |
|
|
|
(4,387 |
) |
|
|
— |
|
Principal payment for finance lease |
|
|
(808 |
) |
|
|
(726 |
) |
|
|
(2,388 |
) |
|
|
(2,146 |
) |
Dissolution of joint venture |
|
|
— |
|
|
|
(1,685 |
) |
|
|
— |
|
|
|
(1,685 |
) |
Net cash provided by financing activities |
|
|
270,639 |
|
|
|
4,987 |
|
|
|
285,524 |
|
|
|
10,137 |
|
Net increase in cash, cash equivalents and restricted cash |
|
|
50,527 |
|
|
|
(21,683 |
) |
|
|
82,112 |
|
|
|
32,181 |
|
Cash, cash equivalents and restricted cash at beginning of period |
|
|
190,499 |
|
|
|
214,436 |
|
|
|
158,914 |
|
|
|
160,572 |
|
Cash, cash equivalents and restricted cash at end of period |
|
$ |
241,026 |
|
|
$ |
192,753 |
|
|
$ |
241,026 |
|
|
$ |
192,753 |
|
Supplemental disclosure |
|
|
|
|
|
|
|
|
|
|
|
|
||||
Cash paid for interest |
|
$ |
503 |
|
|
$ |
550 |
|
|
$ |
1,547 |
|
|
$ |
1,684 |
|
Purchases of property and equipment, not yet paid |
|
$ |
4,862 |
|
|
$ |
4,702 |
|
|
$ |
4,862 |
|
|
$ |
4,702 |
|
Common stock issuance costs, not yet paid |
|
$ |
101 |
|
|
$ |
— |
|
|
$ |
101 |
|
|
$ |
— |
|
Net Loss to Adjusted EBITDA
Adjusted EBITDA is a non-GAAP supplemental measure of operating performance that does not represent and should not be considered an alternative to operating loss or cash flow from operations, as determined by GAAP. Adjusted EBITDA is defined as net income (loss) before interest expense, non-controlling interest, revaluations, impairments, stock-based compensation, depreciation and amortization expense, and other non-recurring charges. We use Adjusted EBITDA to measure the operating performance of our business, excluding specifically identified items that we do not believe directly reflect our core operations and may not be indicative of our recurring operations. Adjusted EBITDA may not be comparable to similarly titled measures provided by other companies due to potential differences in methods of calculations. A reconciliation of Adjusted EBITDA to net loss is as follows:
($ in Thousands) |
|
Three Months Ended |
|
|
Three Months Ended |
|
||||||||||
|
|
2025 |
|
|
2024 |
|
|
2025 |
|
|
2024 |
|
||||
GAAP net loss attributable to Common Stockholders |
|
$ |
(105,824 |
) |
|
$ |
(119,572 |
) |
|
$ |
(334,945 |
) |
|
$ |
(363,195 |
) |
Interest expense (income), net |
|
|
(9,494 |
) |
|
|
(10,797 |
) |
|
|
(27,159 |
) |
|
|
(33,744 |
) |
Other expense (income), net |
|
|
325 |
|
|
|
338 |
|
|
|
(50 |
) |
|
|
508 |
|
Net gain (loss) attributable to non-controlling interests |
|
|
— |
|
|
|
(127 |
) |
|
|
— |
|
|
|
(85 |
) |
Stock-based compensation |
|
|
29,223 |
|
|
|
43,359 |
|
|
|
96,117 |
|
|
|
110,471 |
|
Lease termination loss |
|
|
652 |
|
|
|
— |
|
|
|
652 |
|
|
|
— |
|
Litigation settlement accrual and legal fees, net |
|
|
— |
|
|
|
— |
|
|
|
— |
|
|
|
24,455 |
|
Non-GAAP operating loss |
|
$ |
(85,118 |
) |
|
$ |
(86,799 |
) |
|
$ |
(265,385 |
) |
|
$ |
(261,590 |
) |
Depreciation and amortization expense (1) |
|
|
23,691 |
|
|
|
15,226 |
|
|
|
76,384 |
|
|
|
41,328 |
|
Adjusted EBITDA |
|
$ |
(61,427 |
) |
|
$ |
(71,573 |
) |
|
$ |
(189,001 |
) |
|
$ |
(220,262 |
) |
(1) Depreciation and amortization expense includes accelerated depreciation and write-off of property and equipment no longer in use of approximately $9.5 million and $24.4 million, respectively, for the three and nine months ended September 30, 2025, and approximately $0.3 million and $1.5 million, respectively, for the three and nine months ended September 30, 2024.
Management’s Use of Non-GAAP Financial Measures
This letter includes certain non-GAAP financial measures as defined by SEC rules. These non-GAAP financial measures are in addition to, and not a substitute for or superior to, measures of financial performance prepared in accordance with U.S. GAAP. There are a number of limitations related to the use of these non-GAAP financial measures versus their nearest GAAP equivalents. For example, other companies may calculate non-GAAP financial measures differently or may use other measures to evaluate their performance, all of which could reduce the usefulness of our non-GAAP financial measures as tools for comparison. We urge you to review the reconciliations of our non-GAAP financial measures to the most directly comparable U.S. GAAP financial measures set forth in this letter, and not to rely on any single financial measure to evaluate our business.
Forward-Looking Statements
This letter contains “forward-looking statements” within the meaning of the federal securities laws based on management’s current expectations, assumptions, and available information about future events as of the date of this letter. All statements, other than historical facts, including those about the Company’s anticipated commercial and operational milestones, financial outlook, and strategic objectives, particularly concerning its battery technology development, benefits and performance, collaborations and partnerships, market expansion and goals, among others, are forward-looking statements. Words like “may,” “will,” “can,” “estimate,” “permit,” “expect,” “plan,” “believe,” “designed to,” “seek,” “allow,” “focus,” “potential,” “target,” “forecast,” “should,” “would,” “could,” “continue,” “intend,” “anticipate,” “enable,” “work toward,” “prospective,” “future,” “up to,” “outlook,” and the negative of such terms and other similar expressions identify forward-looking statements, though not all forward-looking statements include these words.
These forward-looking statements are not guarantees of future performance and are subject to a number of risks, uncertainties, and assumptions, including but not limited to, the following: Technological development and commercialization risks, including significant delays or technical challenges replicating and scaling performance from earlier low-volume sample cells, achieving the quality, consistency, reliability, safety, cost, and throughput required for commercial production, and developing a cell architecture meeting all technical requirements and customer expectations; Production risks, including encountered or potential delays, unforeseen technical issues, and other obstacles in developing, acquiring, installing, and operating new equipment for automated or continuous flow processes like Raptor and Cobra, including vendor delays, supply chain disruptions, and challenges in optimizing production processes and scaling up Cobra for B1 sample production; Personnel risks, including potential delays and cost overruns in hiring and retaining the talent needed to expand development and production, including under the amended Collaboration Agreement with PowerCo; Infrastructure and supply chain risks, including challenges building out or scaling the Eagle Line and establishing supply relationships for required materials, components, or equipment, including in contract manufacturing relationships; Sample delivery and commercialization risks, where delays in increasing sample production have previously slowed our development, and such delays could affect our sample delivery and delay or prevent successful demonstration, commercialization of our products, entry into the IP License Agreement with PowerCo, or engagement with new partners across the battery value chain; Risks related to our relationship with Volkswagen and PowerCo, which could adversely affect our business and future prospects, including potential delays, difficulties, and technical challenges collaborating to industrialize our battery technology; Milestone and licensing risks, including delays or difficulties meeting technical milestones, particularly those linked to program payments or required to trigger entry into the IP License Agreement and royalty prepayment, difficulties in achieving the performance, quality, consistency, reliability, safety, cost and throughput required for commercial production and sale, scaling up the Eagle Line, or readying our technology platform for transfer to prospective licensees, any of which could cause prospective customers and partners not to purchase cells or license our technology. If we do not enter into the IP License Agreement with PowerCo, we will not receive the royalty prepayment or other expected benefits; Operational and commercial restrictions, as certain agreements and relationships currently or may in the future restrict our operations, commercialization, and revenue; Partnership and collaboration risks, as while our collaboration with Murata Manufacturing, Corning Incorporated, and other partners across the battery value chain could accelerate industrialization of our solid-state battery technology, there is no assurance these engagements will progress beyond initial phases or achieve intended outcomes; Cost control risks, including inability to control costs tied to our operations and the components needed to build solid-state battery cells at competitive prices; Financial risks, including exceeding current spend expectations, requiring additional fundraising, including in public markets, which may dilute our investors’ ownership, or related to our customer billings, such as disputes or delays in payments and the consistency of billings; Market and economic risks, including difficulties from changes in our economic and financial conditions, market conditions affecting demand for our technology, regulatory changes or changes to broader economic conditions, among other factors, potentially hindering success in the battery industry or undermining confidence in our long-term business among partners and customers; Competition risks from major manufacturers, automotive OEMs, and new entrants, including conventional lithium-ion battery suppliers, in developing and commercializing solid-state battery technology; and Intellectual property risks, where inability to protect or assert our intellectual property could harm our business and competitive position.
The foregoing list of factors is not exhaustive. We caution readers not to place undue reliance on any forward-looking statements, which speak only as of their date. Except as required by law, we disclaim any duty to update forward-looking statements. If assumptions prove incorrect, actual results and projections could differ materially from those in forward looking statements. Additional information about these and other factors that could materially affect our actual results can be found in our SEC filings, available at www.sec.gov.