As confidentially submitted to the Securities and Exchange Commission on February 9, 2024. This draft registration statement has not been filed publicly with the Securities and Exchange Commission and all information contained herein remains confidential.
CONFIDENTIAL TREATMENT REQUESTED BY HAFNIA LIMITED PURSUANT TO 17 C.F.R. SECTION 200.83
 | | |  |
Product Tanker Demand
Introduction
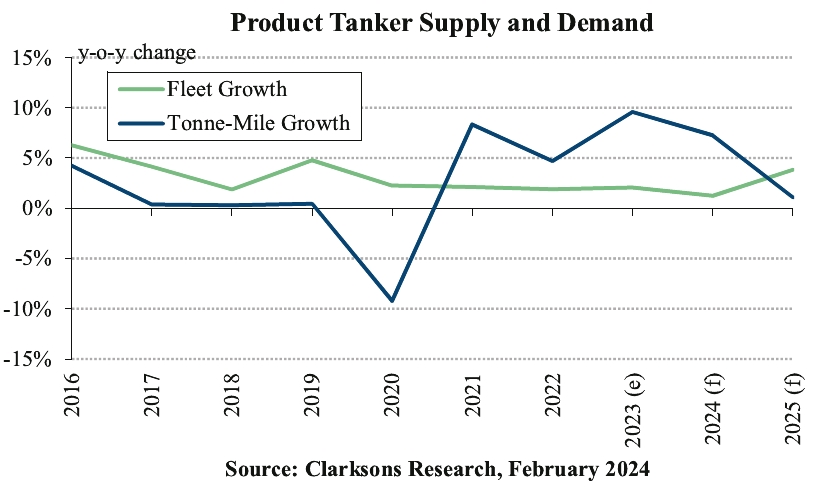
Demand for oil tankers is dictated by world oil demand and trade, and the location and accessibility of oil products supplies relative to the principal locations for discharging such cargoes. The metric of tonne-miles is often used as a proxy for oil tanker demand and is a product of (a) the amount of cargo transported in tankers, multiplied by (b) the distance which cargo is transported. Macroeconomic forces, both globally and regionally, have a significant impact upon world oil products consumption and, consequently, upon the volume of oil products to be transported by sea. The average distance of sea transportation of oil products is affected by trading patterns, which are determined by a combination of economic and geographic factors, refinery developments, regional products imbalances, seasonal variations, oil price trends and differentials in oil products prices between regions, environmental influences, exceptional climatic conditions and geopolitical events.
Oil demand cycles move broadly in line with developments in the global economy and are often a key factor influencing tanker demand. In 2023, oil accounted for around a third of world energy consumption. Daily oil demand has increased from 91.9 million barrels per day (“m bpd”) in 2012 to 101.3m bpd in 2023, driven by increasing world population, global economic expansion and rising oil consumption in the transportation industries in developing countries. The developing world has been the key driver of continued growth in global oil consumption, with oil demand in these nations growing by a CAGR of 1.8% p.a. over the past ten years, whilst oil demand in OECD countries has remained relatively steady (CAGR 0.0%). Global oil demand is projected to increase by 1.5% in 2024, following growth of 2.3% in 2023 to above the (pre-Covid) 2019 level for the first time. Increased consumption in Asia is expected to support growth in oil demand this year, notably in China though some economic headwinds remain. In 2025, global oil demand growth is projected to slow to 1.1% as energy transition related pressures limit consumption in the United States and Europe, though some support is expected from potential improvements in the global macroeconomic backdrop.
105