ESG Repor2t 025
Contents Contents Page | Disclosure Requirements Contents Disclosure
Requirements 1 Social 43 Responsibility Statement 2025 3 S1 - Own Workforce 44 General Disclosures 4 S2 - Workers in the Value Chain 54 ESRS2 - General Disclosures 5 Governance 57 Environment 19 G1 - Business Conduct 58 EU
Taxonomy Reporting in 2025 20 Limited Assurance Report 63 E1 - Climate Change 25 E2 - Pollution 35 E4 - Biodiversity and Ecosystems 38 E5 - Resource Use and Circular Economy 40
Disclosure Requirements Disclosure Requirements Description Page ESRS 2 –
General Disclosures 5 BP-1 General Basis for Preparation of the Sustainability Statement 5 BP-2 Disclosures in Relation to Specific Circumstances 5 GOV-1 The Role of The Administrative, Management and Supervisory
Bodies 5 GOV-2 Information Provided to and Sustainability Matters Addressed by the Undertaking’s Administrative, Management and Supervisory Bodies 6 GOV-3 Integration of Sustainability-Related Performance in Incentive
Schemes 8 GOV-4 Statement on Due Diligence 8 GOV-5 Risk Management and Internal Controls Over Sustainability Reporting 8 SBM-1 Strategy, Business Model, and Value Chain 9 SBM-2 Interests and Views of
Stakeholders 12 SBM-3 Material Impacts, Risks, and Opportunities and their Interactions with Strategy and Business Model 13 IRO-1 Description of the Process to Identify and Assess Material Impacts, Risks, and
Opportunities 16 IRO-2 Disclosure Requirements in ESRS Covered by the Undertaking’s Sustainability Statement 1 ESRS E1 – Climate Change 25 E1-GOV-3 Integration of Sustainability-Related Performance in Incentive
Schemes 25 E1-1 Transition Plan for Climate Change Mitigation 26 E1-SBM-3 (ESRS 2) Material Impacts, Risks and Opportunities, and their Interaction with Strategy and Business Model 25 E1-IRO-1 (ESRS 2) Description of the Processes to
Identify and Assess Material Climate-Related Impacts, Risks 17 E1-2 Policies Related to Climate Change Mitigation and Adaptation 28 E1-3 Actions and Resources in Relation to Climate Change Policies 28 E1-4 Targets Related to Climate
Change Mitigation and Adaptation 29 E1-5 Energy Consumption and Mix 30 E1-6 Gross Scope 1, 2, 3, and Total GHG Emissions 31 ESRS E2 – Pollution 35 E2-IRO-1 (ESRS 2) Description of the Processes to Identify and Assess Material
Pollution-Related Impacts, Risks and Opportunities 17 E2-1 Policies Related to Pollution 35 E2-2 Actions and Resources Related to Pollution 36 E2-3 Targets Related to Pollution 37 E2-4 Pollution of Air 37 ESRS E4– Biodiversity and
Ec osystems 38 E4-SBM-3 Material Impacts, Risks, and Opportunities and their Interaction with Strategy and Business Model 38 E4-IRO-1 (ESRS 2) Description of Processes to Identify and Assess Material Biodiversity and Ecosystem-Related
Impacts, Risks, Dependencies, and Opportunities 18 IRO-2 Disclosure Requirements 1 Contents Page | Disclosure Requirements Disclosure Requirements in ESRS Covered by the Undertaking’s Sustainability Statement
Disclosure Requirements Description Page E4-1 Transition Plan and
Consideration of Biodiversity and Ecosystems in Strategy and Business Model 38 E4-2 Policies Related to Biodiversity and Ecosystems 38 E4-3 Actions and Resources Related to Biodiversity and Ecosystems 39 E4-4 Targets and Metrics
Related to Biodiversity and Ecosystems 39 ESRS E5 – Resource Use and Circular Economy 40 E5-IRO-1 (ESRS 2) Description of the Processes to Identify and Assess Material Resource Use and Circular Economy-Related Impacts, Risks, and
Opportunities 18 E5-1 Policies Related to Resource Use and Circular Economy 40 E5-2 Actions and Resources Related to Resource Use and Circular Economy 41 E5-3 Targets Related to Resource Use and Circular Economy 41 E5-5 Resource
Outflows 42 ESRS S1 – Own Workforce 44 S1-SBM-2 (ESRS 2) Interests and views of stakeholders 12 S1-SBM-3 Material Impacts, Risks, and Opportunities and Their Interaction with Strategy and Business Model 44 S1-1 Policies Related to
Own Workforce 45 S1-2 Processes for Engaging with Own Workers and Workers’ Representatives About Impacts 46 S1-3 Processes to Remediate Negative Impacts and Channels for Own Workers to Raise Concerns 46 S1-4 Taking Action on Material
Impacts on Own Workforce, and Approaches to Mitigating Material Risks and Pursuing Material Opportunities Related to Own Workforce, and Effectiveness of Those Actions 47 S1-5 Targets Related to Managing Material Negative Impacts, Advancing
Positive Impacts, and Managing Material Risks and Opportunities 50 S1-6 Characteristics of Our Employees 50 S1-8 Collective Bargaining Agreement and Social Dialogue 52 S1-9 Diversity Metrics 52 S1-10 Adequate
Wages 52 S1-14 Health and Safety Metrics 52 S1-16 Remuneration Metrics (Pay Gap and Total Remuneration) 53 S1-17 Incidents, Complaints and Severe Human Rights Impacts 53 ESRS S2 – Workers in the Value Chain 54 S2-SBM-3 Material
Impacts, Risks and Opportunities, and their Interaction with Strategy and Business Model 54 S2-1 Policies Related to Value Chain Workers 54 S2-2 Processes for Engaging with Value Chain Workers about Impacts 55 S2-3 Processes to Remediate
Negative Impacts and Channels for Value Chain Workers to Raise Concerns 55 S2-4 Taking Action on Material Impacts on Value Chain Workers, Approaches to Managing Material Risks and Pursuing Material Opportunities Related to Value Chain
Workers, and Effectiveness of Those Actions 56 S2-5 Targets Related to Managing Material Negative Impacts, Advancing Positive Impacts, and Managing Material Risks and Opportunities 56 ESRS G1 – Business Conduct 58 G1-GOV-1 Role of
Administrative, Supervisory and Management Bodies 58 G1-IRO-1 (ESRS 2) Description of the Process to Identify and Assess Material Impacts, Risks and Opportunities 18 G1-1 Business Conduct Policies and Corporate Culture 59 G1-3 Prevention
and Detection of Corruption or Bribery 61 G1-4 Incidents of Corruption or Bribery 62 Disclosure Requirements 2 Contents Page | Disclosure Requirements
Responsibility Statement 2025 In 2025, Hafnia continued to make progress towards its sustainability objectives while navigating a complex and volatile geopolitical
landscape. In our second year of reporting under the Corporate Sustainability Reporting Directive (CSRD), we further strengthened the quality and reliability of our disclosures in accordance with the European Sustainability Reporting Standards
(ESRS). During the year, Hafnia advanced several strategic initiatives supporting our decarbonization ambitions and the wider maritime energy transition. Hafnia completed the ECOMAR four-ship newbuilding program together with Socatra of France.
These dual-fuel vessels represent a pragmatic approach to the maritime energy transition, combining improved operational efficiency with readiness for methanol, a fuel capable of reducing nitrogen oxides, sulfur oxides, and particulate emissions.
Together with Cargill’s Ocean Transportation business, we launched Seascale Energy, a joint venture established to improve the sourcing and supply of marine fuels. In its first year of operations, Seascale Energy was officially recognized as a
Top 10 Bunker company. Beyond environmental initiatives, we remain committed to fostering an inclusive, safe, and high-performing work environment across our shore-based organization and fleet. In 2025, we released the findings of our Culture Lab
research project, conducted in partnership with the University of Southern Denmark and the Danish Maritime Fund. Alongside embedding these insights within our own fleet, we aim to encourage maritime dialogue and collaboration. The strength of
Hafnia’s organizational culture is underpinned by robust governance frameworks. Hafnia maintains a zerotolerance approach to corruption and bribery and continues to embed ethical conduct and responsible business practices throughout the
organization. These commitments are reinforced by clear accountability at the highest levels of leadership. The Board of Directors and the Chief Executive Officer are responsible for preparing this report in accordance with the applicable laws of
Singapore and the additional requirements for listed companies under the Norwegian Securities Trading Act. To the best of our knowledge, the report complies with Section 2-6 of the Norwegian Accounting Act, incorporating the CSRD, ESRS, and
Article Eight of the EU Taxonomy Regulation. Mikael Skov CEO Perry van Echtelt CFO Andreas Sohmen-Pao Chair Su Yin Anand Director Peter Graham Read Director Donald John Ridgway Director Emily Tan Director Responsibility Statement 2025 Contents
Page | Disclosure Requirements 3
General Disclosures Contents Page | Disclosure Requirements 4 General
Disclosures | Environment | Social | Governance | Limited Assurance Report
ESRS2 General Disclosures BP-1 General Basis for Preparation of the
Sustainability Statement Hafnia’s Sustainability Statement for the period from 1 January 2025 to 31 December 2025 is prepared in accordance with the EU’s Corporate Sustainability Reporting Directive (CSRD) and the European Sustainability
Reporting Standards (ESRS). Sustainability data is consolidated using the same principles as financial reporting and covers Hafnia Limited and all controlled subsidiaries. An exception applies to greenhouse gas (GHG) and pollutant emissions,
including emissions from joint venture vessels based on Hafnia’s ownership share. The Sustainability Statement and Double Materiality Assessment (DMA) cover Hafnia’s entire value chain, both upstream and downstream, including an assessment of
the supply chain. Where relevant, suppliers are integrated into Hafnia’s policies. Omitted Information OPEX and CAPEX for implementing the energy transition plan described in E1-1 have not been disclosed (E1-3) due to commercial sensitivity
related to strategic planning. No other intellectual property information has been omitted. Matters under negotiation are excluded unless already publicly disclosed and relevant for reporting. BP-2 Disclosures in Relation to
Specific Circumstances Time Horizons We assess potential impacts, risks, and opportunities across the three-time horizons in line with ESRS: short term (up to one year), medium term (one to five years), and long-term (more than five
years). Value Chain Data Estimation For Scope 3 reporting, Hafnia uses a spend-based methodology to estimate carbon emissions by mapping invoice spend to emission factors to generate estimate emissions. The classifications and emissions
estimates will be further refined as data availability, methodologies, and engagement with value chain partners improves. Other Estimations and Disclosures Subject to Uncertainty Estimates are used for certain Scope 2 and Scope 3 data points
with methodologies and assumptions detailed in the relevant accounting policy sections. No disclosure has been identified as having high uncertainty. Changes in Sustainability Statement In 2025, Hafnia enhanced its methodology for Scope 1
greenhouse gas and pollutant emissions to align with updates to the EU MRV/ETS requirements. Hafnia also adopted DNV’s updated calculation methodology within the Emissions Connect platform to 2 verify all ESRS E1 greenhouse gases (CO , 4 2
x CH , N O) and ESRS E2 air pollutants (SO , NO , PM , PM ). This update provides a x 10 2.5 single source for emissions reporting and strengthens the data verification process. Reporting Errors in Prior Period Electricity consumption
data from 2024 was overestimated for our Singapore office. For 2025, we allocated electricity consumption and the associated emissions based on the Singapore office’s square footage, ensuring figures reflect our operational footprint. Scope
3.3 emissions for 2024 have been restated, because six vessels were not supposed to be included under Scope 3.3, as we do not have operational control over them. General Disclosures 5 Contents Page | Disclosure Requirements The amount of
waste reported has been restated for 2024 to account for hazardous waste previously excluded. Seafarers remuneration metrics for 2024 have also been restated due to previously misstated technical external manager seafarer data. Reporting for
Other Frameworks than the ESRS Our Sustainability Statement includes information prepared in compliance with the EU Taxonomy (see page 20). GOV-1 The Role of the Administrative, Management, and Supervisory Bodies Table 1 provides an
overview of the Board of Directors composition, gender diversity, and independence, reflecting our commitment to balanced and inclusive governance.
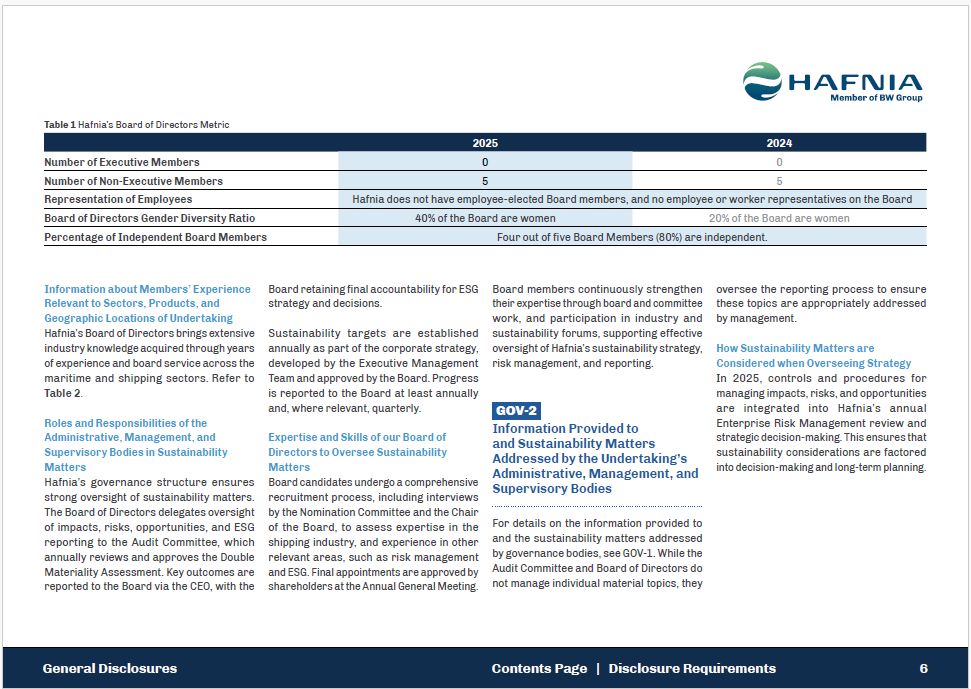
Table 1 Hafnia’s Board of Directors Metric 2025 2024 Number of Executive
Members 0 0 Number of Non-Executive Members 5 5 Representation of Employees Hafnia does not have employee-elected Board members, and no employee or worker representatives on the Board Board of Directors Gender Diversity Ratio 40% of
the Board are women 20% of the Board are women Percentage of Independent Board Members Four out of five Board Members (80%) are independent. Information about Members’ Experience Relevant to Sectors, Products, and Geographic Locations of
Undertaking Hafnia’s Board of Directors brings extensive industry knowledge acquired through years of experience and board service across the maritime and shipping sectors. Refer to Table 2. Roles and Responsibilities of the Administrative,
Management, and Supervisory Bodies in Sustainability Matters Hafnia’s governance structure ensures strong oversight of sustainability matters. The Board of Directors delegates oversight of impacts, risks, opportunities, and ESG reporting to
the Audit Committee, which annually reviews and approves the Double Materiality Assessment. Key outcomes are reported to the Board via the CEO, with the Board retaining final accountability for ESG strategy and decisions. Sustainability
targets are established annually as part of the corporate strategy, developed by the Executive Management Team and approved by the Board. Progress is reported to the Board at least annually and, where relevant, quarterly. Expertise and Skills
of our Board of Directors to Oversee Sustainability Matters Board candidates undergo a comprehensive recruitment process, including interviews by the Nomination Committee and the Chair of the Board, to assess expertise in the shipping
industry, and experience in other relevant areas, such as risk management and ESG. Final appointments are approved by shareholders at the Annual General Meeting. Board members continuously strengthen their expertise through board and committee
work, and participation in industry and sustainability forums, supporting effective oversight of Hafnia’s sustainability strategy, risk management, and reporting. General Disclosures 6 Contents Page | Disclosure
Requirements GOV-2 Information Provided to and Sustainability Matters Addressed by the Undertaking’s Administrative, Management, and Supervisory Bodies For details on the information provided to and the sustainability matters addressed by
governance bodies, see GOV-1. While the Audit Committee and Board of Directors do not manage individual material topics, they oversee the reporting process to ensure these topics are appropriately addressed by management. How Sustainability
Matters are Considered when Overseeing Strategy In 2025, controls and procedures for managing impacts, risks, and opportunities are integrated into Hafnia’s annual Enterprise Risk Management review and strategic decision-making. This ensures
that sustainability considerations are factored into decision-making and long-term planning.
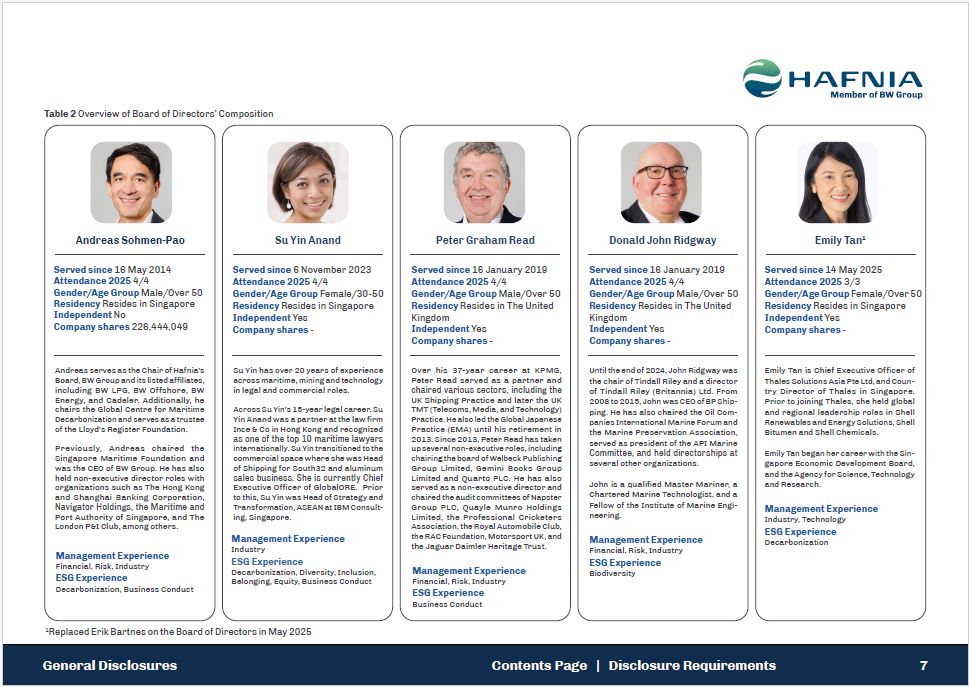
1Replaced Erik Bartnes on the Board of Directors in May 2025 Andreas
Sohmen-Pao Su Yin Anand Peter Graham Read Donald John Ridgway Emily Tan1 Served since 16 May 2014 Attendance 2025 4/4 Gender/Age Group Male/Over 50 Residency Resides in Singapore Independent No Company shares 226,444,049 Management
Experience Financial, Risk, Industry ESG Experience Decarbonization, Business Conduct Management Experience Industry ESG Experience Decarbonization, Diversity, Inclusion, Belonging, Equity, Business Conduct Management
Experience Financial, Risk, Industry ESG Experience Business Conduct Management Experience Financial, Risk, Industry ESG Experience Biodiversity Management Experience Industry, Technology ESG Experience Decarbonization Served since
6 November 2023 Attendance 2025 4/4 Gender/Age Group Female/30-50 Residency Resides in Singapore Independent Yes Company shares - Served since 14 May 2025 Attendance 2025 3/3 Gender/Age Group Female/Over 50 Residency Resides in Singapore
Independent Yes Company shares - Served since 16 January 2019 Attendance 2025 4/4 Gender/Age Group Male/Over 50 Residency Resides in The United Kingdom Independent Yes Company shares - Served since 16 January 2019 Attendance 2025 4/4
Gender/Age Group Male/Over 50 Residency Resides in The United Kingdom Independent Yes Company shares - General Disclosures 7 Contents Page | Disclosure Requirements Over his 37-year career at KPMG, Peter Read served as a partner and
chaired various sectors, including the UK Shipping Practice and later the UK TMT (Telecoms, Media, and Technology) Practice. He also led the Global Japanese Practice (EMA) until his retirement in 2013. Since 2013, Peter Read has taken up
several non-executive roles, including chairing the board of Welbeck Publishing Group Limited, Gemini Books Group Limited and Quarto PLC. He has also served as a non-executive director and chaired the audit committees of Napster Group PLC,
Quayle Munro Holdings Limited, the Professional Cricketers Association, the Royal Automobile Club, the RAC Foundation, Motorsport UK, and the Jaguar Daimler Heritage Trust. Andreas serves as the Chair of Hafnia’s Board, BW Group and its listed
affiliates, including BW LPG, BW Offshore, BW Energy, and Cadeler. Additionally, he chairs the Global Centre for Maritime Decarbonization and serves as a trustee of the Lloyd’s Register Foundation. Previously, Andreas chaired the Singapore
Maritime Foundation and was the CEO of BW Group. He has also held non-executive director roles with organizations such as The Hong Kong and Shanghai Banking Corporation, Navigator Holdings, the Maritime and Port Authority of Singapore, and The
London P&I Club, among others. Su Yin has over 20 years of experience across maritime, mining and technology in legal and commercial roles. Across Su Yin’s 15-year legal career. Su Yin Anand was a partner at the law firm Ince & Co in
Hong Kong and recognized as one of the top 10 maritime lawyers internationally. Su Yin transitioned to the commercial space where she was Head of Shipping for South32 and aluminum sales business. She is currently Chief Executive Officer of
GlobalORE. Prior to this, Su Yin was Head of Strategy and Transformation, ASEAN at IBM Consult-ing, Singapore. Until the end of 2024, John Ridgway was the chair of Tindall Riley and a director of Tindall Riley (Britannia) Ltd. From 2008 to
2015, John was CEO of BP Ship-ping. He has also chaired the Oil Com-panies International Marine Forum and the Marine Preservation Association, served as president of the API Marine Committee, and held directorships at several other
organizations. John is a qualified Master Mariner, a Chartered Marine Technologist, and a Fellow of the Institute of Marine Engi-neering. Emily Tan is Chief Executive Officer of Thales Solutions Asia Pte Ltd, and Coun-try Director of Thales
in Singapore. Prior to joining Thales, she held global and regional leadership roles in Shell Renewables and Energy Solutions, Shell Bitumen and Shell Chemicals. Emily Tan began her career with the Sin-gapore Economic Development Board, and
the Agency for Science, Technology and Research. Table 2 Overview of Board of Directors’ Composition
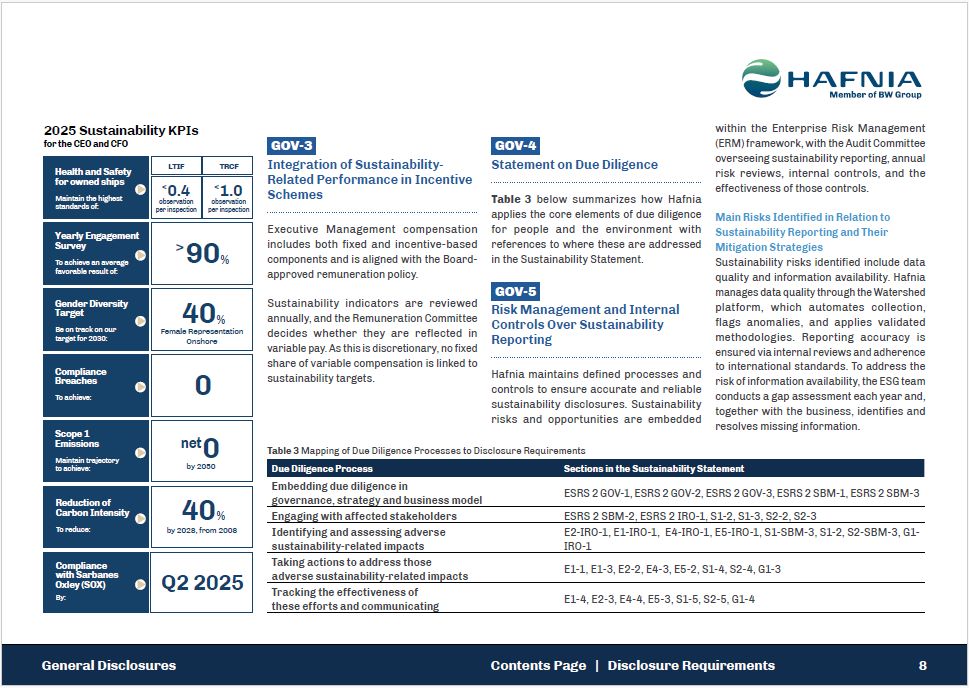
GOV-3 Integration of Sustainability-Related Performance in Incentive
Schemes Executive Management compensation includes both fixed and incentive-based components and is aligned with the Board-approved remuneration policy. Sustainability indicators are reviewed annually, and the Remuneration Committee decides
whether they are reflected in variable pay. As this is discretionary, no fixed share of variable compensation is linked to sustainability targets. Health and Safety for owned ships Maintain the highest standards of: LTIF TRCF <
0.4 observation per inspection < 1.0 observation per inspection Yearly Engagement Survey To achieve an average favorable result of: Gender Diversity Target Be on track on our target for 2030: Compliance Breaches To achieve: Scope
1 Emissions Maintain trajectory to achieve: Reduction of Carbon Intensity To reduce: > 90% 40% 0 net0 40% by 2028, from 2008 Female Representation Onshore by 2050 Compliance with Sarbanes Oxley (SOX) By: Q2 2025 2025
Sustainability KPIs for the CEO and CFO GOV-4 Statement on Due Diligence Table 3 below summarizes how Hafnia applies the core elements of due diligence for people and the environment with references to where these are addressed in the
Sustainability Statement. GOV-5 Risk Management and Internal Controls Over Sustainability Reporting Hafnia maintains defined processes and controls to ensure accurate and reliable sustainability disclosures. Sustainability risks and
opportunities are embedded within the Enterprise Risk Management (ERM) framework, with the Audit Committee overseeing sustainability reporting, annual risk reviews, internal controls, and the effectiveness of those controls. Main Risks
Identified in Relation to Sustainability Reporting and Their Mitigation Strategies Sustainability risks identified include data quality and information availability. Hafnia manages data quality through the Watershed platform, which automates
collection, flags anomalies, and applies validated methodologies. Reporting accuracy is ensured via internal reviews and adherence to international standards. To address the risk of information availability, the ESG team conducts a gap
assessment each year and, together with the business, identifies and resolves missing information. Table 3 Mapping of Due Diligence Processes to Disclosure Requirements Due Diligence Process Sections in the Sustainability Statement General
Disclosures 8 Contents Page | Disclosure Requirements Embedding due diligence in governance, strategy and business model ESRS 2 GOV-1, ESRS 2 GOV-2, ESRS 2 GOV-3, ESRS 2 SBM-1, ESRS 2 SBM-3 Engaging with affected stakeholders ESRS 2
SBM-2, ESRS 2 IRO-1, S1-2, S1-3, S2-2, S2-3 Identifying and assessing adverse sustainability-related impacts E2-IRO-1, E1-IRO-1, E4-IRO-1, E5-IRO-1, S1-SBM-3, S1-2, S2-SBM-3, G1-IRO-1 Taking actions to address those adverse
sustainability-related impacts E1-1, E1-3, E2-2, E4-3, E5-2, S1-4, S2-4, G1-3 Tracking the effectiveness of these efforts and communicating E1-4, E2-3, E4-4, E5-3, S1-5, S2-5, G1-4
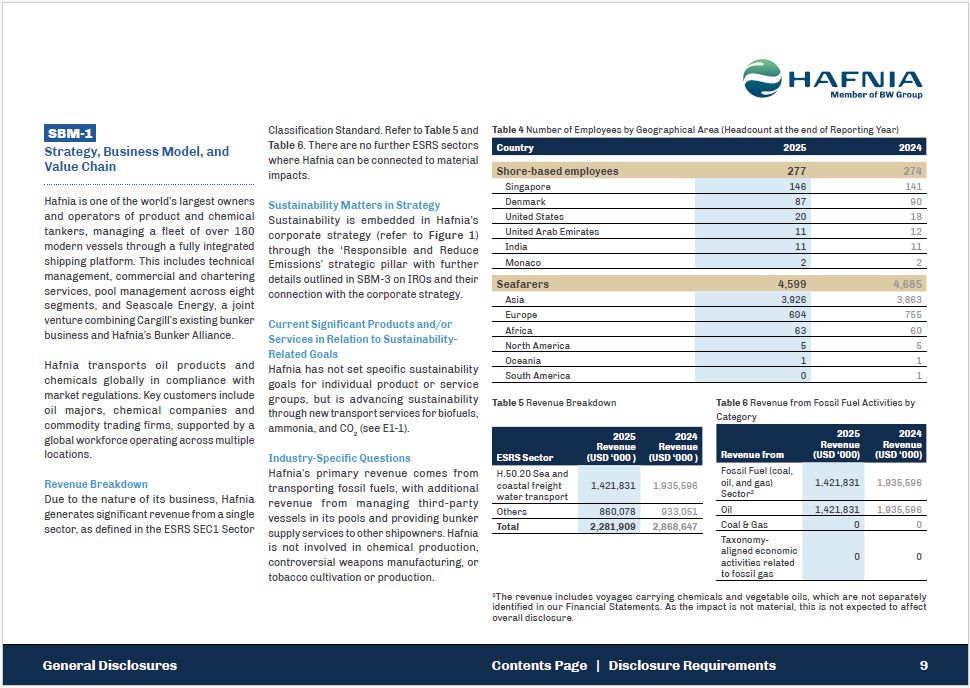
SBM-1 General Disclosures 9 Contents Page | Disclosure Requirements Strategy,
Business Model, and Value Chain Hafnia is one of the world’s largest owners and operators of product and chemical tankers, managing a fleet of over 180 modern vessels through a fully integrated shipping platform. This includes technical
management, commercial and chartering services, pool management across eight segments, and Seascale Energy, a joint venture combining Cargill’s existing bunker business and Hafnia’s Bunker Alliance. Hafnia transports oil products and chemicals
globally in compliance with market regulations. Key customers include oil majors, chemical companies and commodity trading firms, supported by a global workforce operating across multiple locations. Revenue Breakdown Due to the nature of its
business, Hafnia generates significant revenue from a single sector, as defined in the ESRS SEC1 Sector Classification Standard. Refer to Table 5 and Table 6. There are no further ESRS sectors where Hafnia can be connected to material
impacts. Sustainability Matters in Strategy Sustainability is embedded in Hafnia’s corporate strategy (refer to Figure 1) through the ‘Responsible and Reduce Emissions’ strategic pillar with further details outlined in SBM-3 on IROs and their
connection with the corporate strategy. Current Significant Products and/or Services in Relation to Sustainability-Related Goals Hafnia has not set specific sustainability goals for individual product or service groups, but is advancing
sustainability through new transport services for biofuels, 2 ammonia, and CO (see E1-1). Industry-Specific Questions Hafnia’s primary revenue comes from transporting fossil fuels, with additional revenue from managing third-party vessels
in its pools and providing bunker supply services to other shipowners. Hafnia is not involved in chemical production, controversial weapons manufacturing, or tobacco cultivation or production. Table 4 Number of Employees by Geographical Area
(Headcount at the end of Reporting Year) Shore-based employees 277 274 Singapore 146 141 Denmark 87 90 United States 20 18 United Arab
Emirates 11 12 India 11 11 Monaco 2 2 Seafarers 4,599 4,685 Asia 3,926 3,863 Europe 604 755 Africa 63 60 North America 5 5 Oceania 1 1 South America 0 1 Country 2025 2024 Table 5 Revenue Breakdown ESRS
Sector 2025 Revenue (USD ‘000 ) 2024 Revenue (USD ‘000 ) H.50.20 Sea and coastal freight water transport 1,421,831 1,935,596 Others 860,078 933,051 Total 2,281,909 2,868,647 Table 6 Revenue from Fossil Fuel Activities by
Category 2025 2024 Revenue Revenue Revenue from (USD ‘000) (USD ‘000) Fossil Fuel (coal, oil, and gas) Sector2 1,421,831 1,935,596 Oil 1,421,831 1,935,596 Coal & Gas 0 0 Taxonomy-aligned economic activities related to fossil
gas 0 0 2The revenue includes voyages carrying chemicals and vegetable oils, which are not separately identified in our Financial Statements. As the impact is not material, this is not expected to affect overall disclosure.
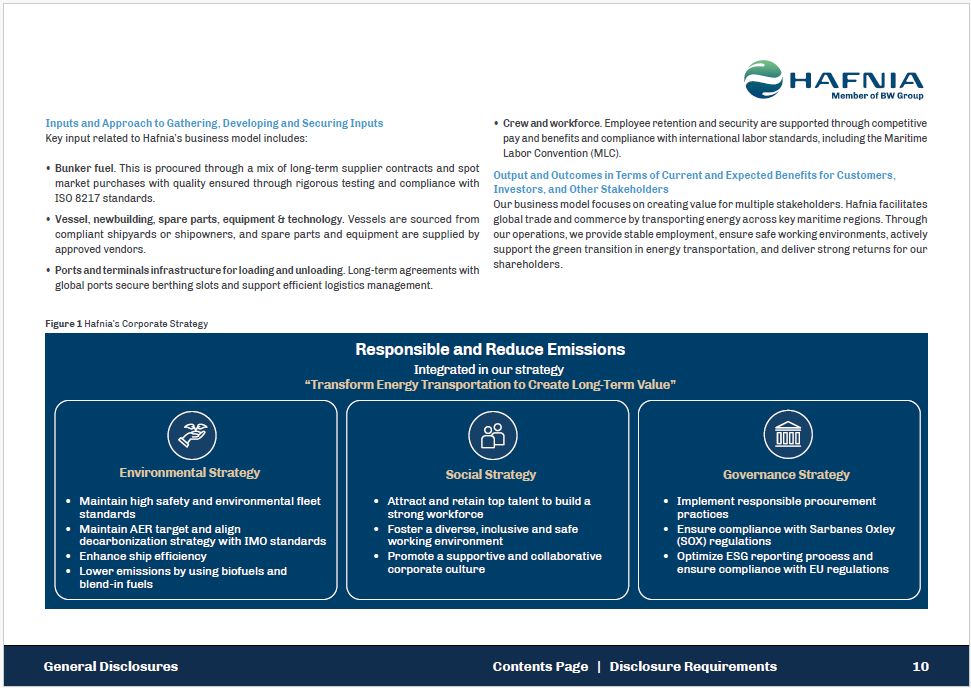
Inputs and Approach to Gathering, Developing and Securing Inputs Key input
related to Hafnia’s business model includes: Bunker fuel. This is procured through a mix of long-term supplier contracts and spot market purchases with quality ensured through rigorous testing and compliance with ISO 8217 standards. Vessel,
newbuilding, spare parts, equipment & technology. Vessels are sourced from compliant shipyards or shipowners, and spare parts and equipment are supplied by approved vendors. Ports and terminals infrastructure for loading and unloading.
Long-term agreements with global ports secure berthing slots and support efficient logistics management. Crew and workforce. Employee retention and security are supported through competitive pay and benefits and compliance with international
labor standards, including the Maritime Labor Convention (MLC). Output and Outcomes in Terms of Current and Expected Benefits for Customers, Investors, and Other Stakeholders Our business model focuses on creating value for multiple
stakeholders. Hafnia facilitates global trade and commerce by transporting energy across key maritime regions. Through our operations, we provide stable employment, ensure safe working environments, actively support the green transition in
energy transportation, and deliver strong returns for our shareholders. Responsible and Reduce Emissions Integrated in our strategy “Transform Energy Transportation to Create Long-Term Value” Environmental Strategy Maintain high safety and
environmental fleet standards Maintain AER target and align decarbonization strategy with IMO standards Enhance ship efficiency Lower emissions by using biofuels and blend-in fuels General Disclosures 10 Contents Page | Disclosure
Requirements Social Strategy Attract and retain top talent to build a strong workforce Foster a diverse, inclusive and safe working environment Promote a supportive and collaborative corporate culture Governance Strategy Implement
responsible procurement practices Ensure compliance with Sarbanes Oxley (SOX) regulations Optimize ESG reporting process and ensure compliance with EU regulations Figure 1 Hafnia’s Corporate Strategy
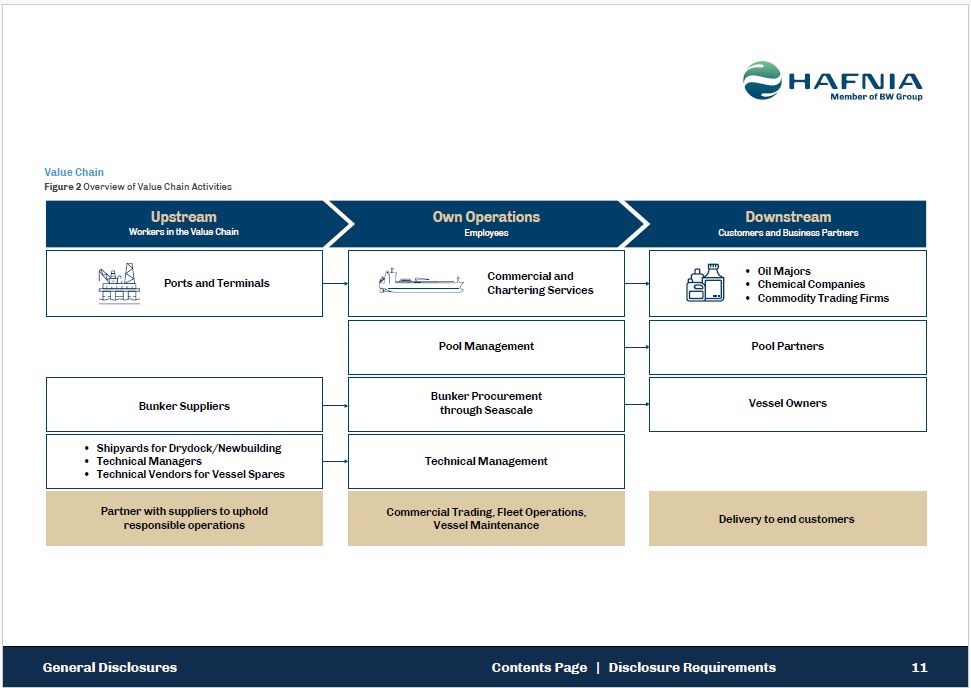
Pool Management Bunker Suppliers Pool Partners Vessel Owners Shipyards for
Drydock/Newbuilding Technical Managers Technical Vendors for Vessel Spares Own Operations Employees Downstream Customers and Business Partners Partner with suppliers to uphold responsible operations Technical Management Bunker
Procurement through Seascale Commercial Trading, Fleet Operations, Vessel Maintenance Delivery to end customers Ports and Terminals Oil Majors Chemical Companies Commodity Trading Firms Commercial and Chartering
Services Upstream Workers in the Value Chain General Disclosures 11 Contents Page | Disclosure Requirements Value Chain Figure 2 Overview of Value Chain Activities
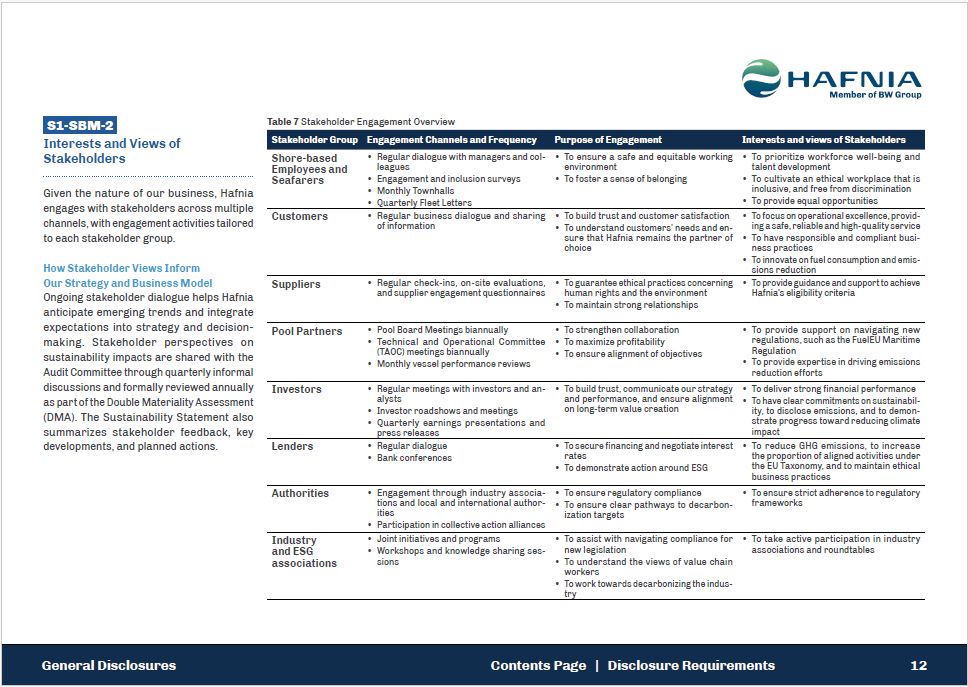
S1-SBM-2 Interests and Views of Stakeholders Given the nature of our business,
Hafnia engages with stakeholders across multiple channels, with engagement activities tailored to each stakeholder group. How Stakeholder Views Inform Our Strategy and Business Model Ongoing stakeholder dialogue helps Hafnia anticipate
emerging trends and integrate expectations into strategy and decision-making. Stakeholder perspectives on sustainability impacts are shared with the Audit Committee through quarterly informal discussions and formally reviewed annually as part
of the Double Materiality Assessment (DMA). The Sustainability Statement also summarizes stakeholder feedback, key developments, and planned actions. Table 7 Stakeholder Engagement Overview Stakeholder Group Engagement Channels and Frequency
Purpose of Engagement Interests and views of Stakeholders General Disclosures 12 Contents Page | Disclosure Requirements Shore-based Employees and Seafarers Regular dialogue with managers and col- leagues Engagement and inclusion
surveys Monthly Townhalls Quarterly Fleet Letters To ensure a safe and equitable working environment To foster a sense of belonging To prioritize workforce well-being and talent development To cultivate an ethical workplace that is
inclusive, and free from discrimination To provide equal opportunities Customers Regular business dialogue and sharing of information To build trust and customer satisfaction To understand customers’ needs and en- sure that Hafnia remains
the partner of choice To focus on operational excellence, provid- ing a safe, reliable and high-quality service To have responsible and compliant busi- ness practices To innovate on fuel consumption and emis- sions
reduction Suppliers Regular check-ins, on-site evaluations, and supplier engagement questionnaires To guarantee ethical practices concerning human rights and the environment To maintain strong relationships To provide guidance and support
to achieve Hafnia’s eligibility criteria Pool Partners Pool Board Meetings biannually Technical and Operational Committee (TAOC) meetings biannually Monthly vessel performance reviews To strengthen collaboration To maximize
profitability To ensure alignment of objectives To provide support on navigating new regulations, such as the FuelEU Maritime Regulation To provide expertise in driving emissions reduction efforts Investors Regular meetings with investors
and an- alysts Investor roadshows and meetings Quarterly earnings presentations and press releases To build trust, communicate our strategy and performance, and ensure alignment on long-term value creation To deliver strong financial
performance To have clear commitments on sustainabil- ity, to disclose emissions, and to demon- strate progress toward reducing climate impact Lenders Regular dialogue Bank conferences To secure financing and negotiate interest rates To
demonstrate action around ESG To reduce GHG emissions, to increase the proportion of aligned activities under the EU Taxonomy, and to maintain ethical business practices Authorities Engagement through industry associa- tions and local and
international author- ities Participation in collective action alliances To ensure regulatory compliance To ensure clear pathways to decarbon- ization targets To ensure strict adherence to regulatory frameworks Industry and ESG
associations Joint initiatives and programs Workshops and knowledge sharing ses- sions To assist with navigating compliance for new legislation To understand the views of value chain workers To work towards decarbonizing the indus- try To
take active participation in industry associations and roundtables
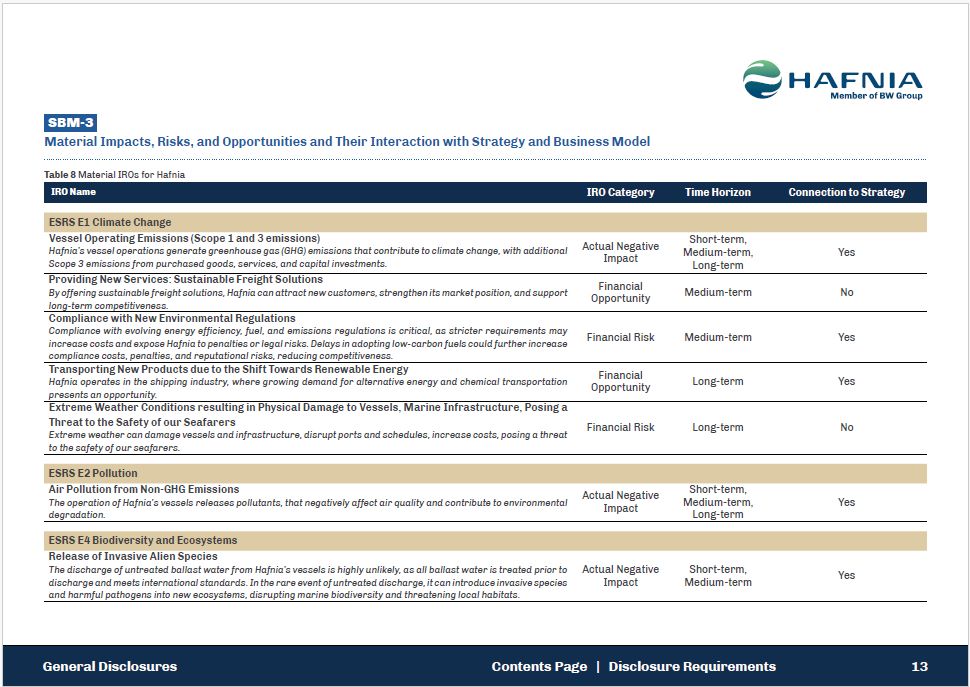
SBM-3 Material Impacts, Risks, and Opportunities and Their Interaction with
Strategy and Business Model Table 8 Material IROs for Hafnia IRO Name IRO Category Time Horizon Connection to Strategy General Disclosures 13 Contents Page | Disclosure Requirements ESRS E1 Climate Change Vessel Operating Emissions
(Scope 1 and 3 emissions) Hafnia’s vessel operations generate greenhouse gas (GHG) emissions that contribute to climate change, with additional Scope 3 emissions from purchased goods, services, and capital investments. Actual Negative
Impact Short-term, Medium-term, Long-term Yes Providing New Services: Sustainable Freight Solutions By offering sustainable freight solutions, Hafnia can attract new customers, strengthen its market position, and support long-term
competitiveness. Compliance with New Environmental Regulations Financial Opportunity Medium-term No Compliance with evolving energy efficiency, fuel, and emissions regulations is critical, as stricter requirements may increase costs and
expose Hafnia to penalties or legal risks. Delays in adopting low-carbon fuels could further increase compliance costs, penalties, and reputational risks, reducing competitiveness. Transporting New Products due to the Shift Towards Renewable
Energy Financial Risk Medium-term Yes Hafnia operates in the shipping industry, where growing demand for alternative energy and chemical transportation presents an opportunity. Extreme Weather Conditions resulting in Physical Damage to
Vessels, Marine Infrastructure, Posing a Financial Opportunity Long-term Yes Threat to the Safety of our Seafarers Extreme weather can damage vessels and infrastructure, disrupt ports and schedules, increase costs, posing a threat to the
safety of our seafarers. Financial Risk Long-term No ESRS E2 Pollution Air Pollution from Non-GHG Emissions The operation of Hafnia’s vessels releases pollutants, that negatively affect air quality and contribute to environmental
degradation. Actual Negative Impact Short-term, Medium-term, Long-term Yes ESRS E4 Biodiversity and Ecosystems Release of Invasive Alien Species The discharge of untreated ballast water from Hafnia’s vessels is highly unlikely, as all
ballast water is treated prior to discharge and meets international standards. In the rare event of untreated discharge, it can introduce invasive species and harmful pathogens into new ecosystems, disrupting marine biodiversity and threatening
local habitats. Actual Negative Impact Short-term, Medium-term Yes
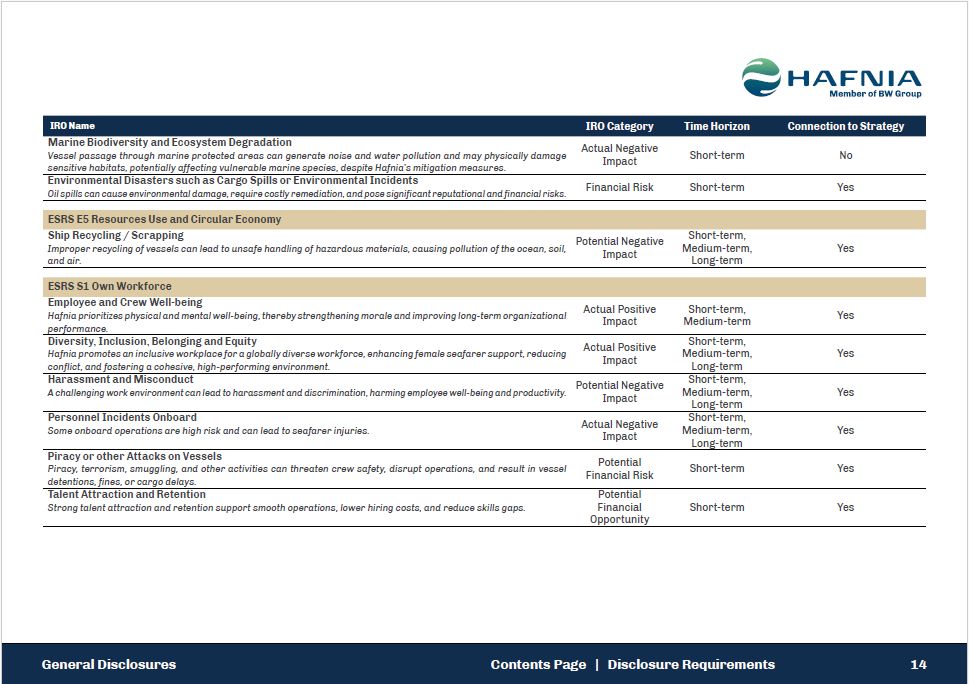
IRO Name IRO Category Time Horizon Connection to Strategy General
Disclosures 14 Contents Page | Disclosure Requirements Marine Biodiversity and Ecosystem Degradation Vessel passage through marine protected areas can generate noise and water pollution and may physically damage sensitive habitats,
potentially affecting vulnerable marine species, despite Hafnia’s mitigation measures. Environmental Disasters such as Cargo Spills or Environmental Incidents Actual Negative Impact Short-term No Oil spills can cause environmental damage,
require costly remediation, and pose significant reputational and financial risks. Financial Risk Short-term Yes ESRS E5 Resources Use and Circular Economy Ship Recycling / Scrapping Improper recycling of vessels can lead to unsafe handling
of hazardous materials, causing pollution of the ocean, soil, and air. Potential Negative Impact Short-term, Medium-term, Long-term Yes ESRS S1 Own Workforce Employee and Crew Well-being Hafnia prioritizes physical and mental well-being,
thereby strengthening morale and improving long-term organizational performance. Diversity, Inclusion, Belonging and Equity Actual Positive Impact Short-term, Medium-term Yes Actual Positive Impact Short-term, Medium-term,
Long-term Hafnia promotes an inclusive workplace for a globally diverse workforce, enhancing female seafarer support, reducing conflict, and fostering a cohesive, high-performing environment. Harassment and Misconduct Yes A challenging work
environment can lead to harassment and discrimination, harming employee well-being and productivity. Potential Negative Impact Short-term, Medium-term, Long-term Yes Personnel Incidents Onboard Some onboard operations are high risk and can
lead to seafarer injuries. Actual Negative Impact Short-term, Medium-term, Long-term Yes Piracy or other Attacks on Vessels Piracy, terrorism, smuggling, and other activities can threaten crew safety, disrupt operations, and result in
vessel detentions, fines, or cargo delays. Talent Attraction and Retention Short-term Yes Strong talent attraction and retention support smooth operations, lower hiring costs, and reduce skills gaps. Potential Financial
Risk Potential Financial Opportunity Short-term Yes
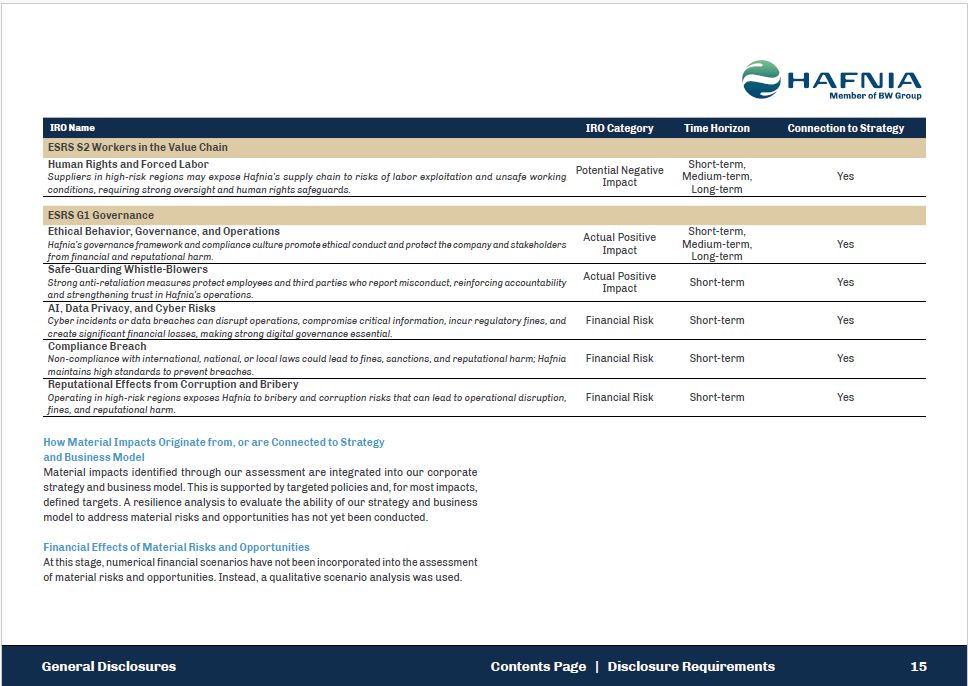
IRO Name IRO Category Time Horizon Connection to Strategy ESRS S2 Workers in the
Value Chain Safe-Guarding Whistle-Blowers Strong anti-retaliation measures protect employees and third parties who report misconduct, reinforcing accountability and strengthening trust in Hafnia’s operations. Actual Positive
Impact Short-term Yes AI, Data Privacy, and Cyber Risks Cyber incidents or data breaches can disrupt operations, compromise critical information, incur regulatory fines, and Financial Risk Short-term Yes create significant financial
losses, making strong digital governance essential. Compliance Breach Non-compliance with international, national, or local laws could lead to fines, sanctions, and reputational harm; Hafnia Financial Risk Short-term Yes maintains high
standards to prevent breaches. Reputational Effects from Corruption and Bribery Operating in high-risk regions exposes Hafnia to bribery and corruption risks that can lead to operational disruption, Financial Risk Short-term Yes fines,
and reputational harm. How Material Impacts Originate from, or are Connected to Strategy and Business Model Material impacts identified through our assessment are integrated into our corporate strategy and business model. This is supported
by targeted policies and, for most impacts, defined targets. A resilience analysis to evaluate the ability of our strategy and business model to address material risks and opportunities has not yet been conducted. Financial Effects of
Material Risks and Opportunities At this stage, numerical financial scenarios have not been incorporated into the assessment of material risks and opportunities. Instead, a qualitative scenario analysis was used. Human Rights and Forced
Labor Suppliers in high-risk regions may expose Hafnia’s supply chain to risks of labor exploitation and unsafe working conditions, requiring strong oversight and human rights safeguards. General Disclosures 15 Contents Page | Disclosure
Requirements Potential Negative Impact Short-term, Medium-term, Long-term Yes ESRS G1 Governance Ethical Behavior, Governance, and Operations Hafnia’s governance framework and compliance culture promote ethical conduct and protect the
company and stakeholders from financial and reputational harm. Actual Positive Impact Short-term, Medium-term, Long-term Yes
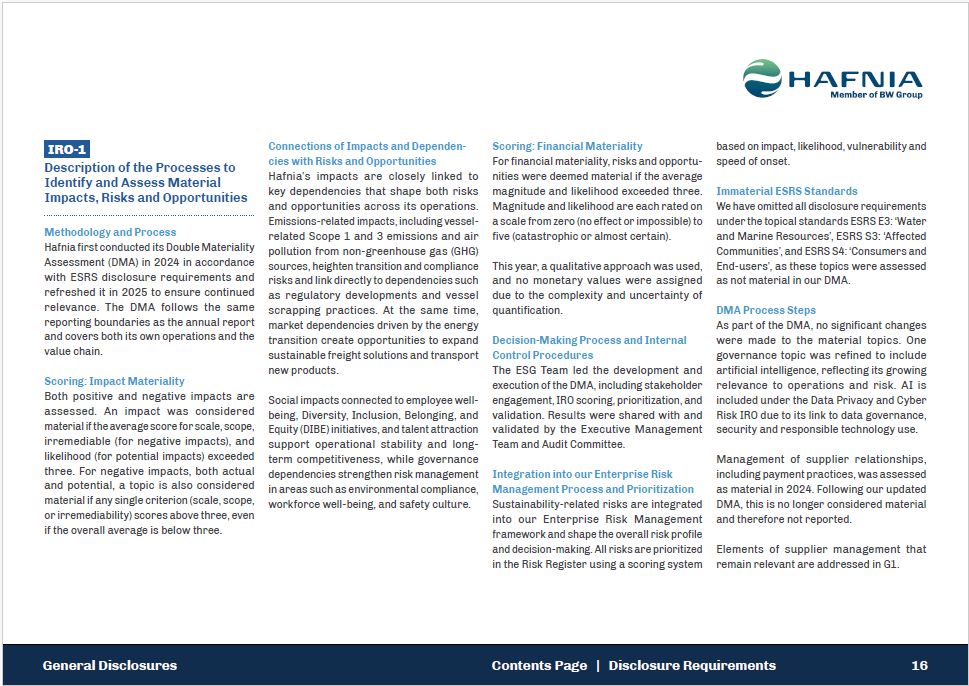
IRO-1 General Disclosures 16 Contents Page | Disclosure
Requirements Description of the Processes to Identify and Assess Material Impacts, Risks and Opportunities Methodology and Process Hafnia first conducted its Double Materiality Assessment (DMA) in 2024 in accordance with ESRS disclosure
requirements and refreshed it in 2025 to ensure continued relevance. The DMA follows the same reporting boundaries as the annual report and covers both its own operations and the value chain. Scoring: Impact Materiality Both positive and
negative impacts are assessed. An impact was considered material if the average score for scale, scope, irremediable (for negative impacts), and likelihood (for potential impacts) exceeded three. For negative impacts, both actual and potential,
a topic is also considered material if any single criterion (scale, scope, or irremediability) scores above three, even if the overall average is below three. Connections of Impacts and Dependen-cies with Risks and Opportunities Hafnia’s
impacts are closely linked to key dependencies that shape both risks and opportunities across its operations. Emissions-related impacts, including vessel-related Scope 1 and 3 emissions and air pollution from non-greenhouse gas (GHG) sources,
heighten transition and compliance risks and link directly to dependencies such as regulatory developments and vessel scrapping practices. At the same time, market dependencies driven by the energy transition create opportunities to expand
sustainable freight solutions and transport new products. Social impacts connected to employee well-being, Diversity, Inclusion, Belonging, and Equity (DIBE) initiatives, and talent attraction support operational stability and long-term
competitiveness, while governance dependencies strengthen risk management in areas such as environmental compliance, workforce well-being, and safety culture. Scoring: Financial Materiality For financial materiality, risks and opportu-nities
were deemed material if the average magnitude and likelihood exceeded three. Magnitude and likelihood are each rated on a scale from zero (no effect or impossible) to five (catastrophic or almost certain). This year, a qualitative approach was
used, and no monetary values were assigned due to the complexity and uncertainty of quantification. Decision-Making Process and Internal Control Procedures The ESG Team led the development and execution of the DMA, including stakeholder
engagement, IRO scoring, prioritization, and validation. Results were shared with and validated by the Executive Management Team and Audit Committee. Integration into our Enterprise Risk Management Process and Prioritization
Sustainability-related risks are integrated into our Enterprise Risk Management framework and shape the overall risk profile and decision-making. All risks are prioritized in the Risk Register using a scoring system based on impact,
likelihood, vulnerability and speed of onset. Immaterial ESRS Standards We have omitted all disclosure requirements under the topical standards ESRS E3: ‘Water and Marine Resources’, ESRS S3: ‘Affected Communities’, and ESRS S4: ‘Consumers
and End-users’, as these topics were assessed as not material in our DMA. DMA Process Steps As part of the DMA, no significant changes were made to the material topics. One governance topic was refined to include artificial intelligence,
reflecting its growing relevance to operations and risk. AI is included under the Data Privacy and Cyber Risk IRO due to its link to data governance, security and responsible technology use. Management of supplier relationships, including
payment practices, was assessed as material in 2024. Following our updated DMA, this is no longer considered material and therefore not reported. Elements of supplier management that remain relevant are addressed in G1.
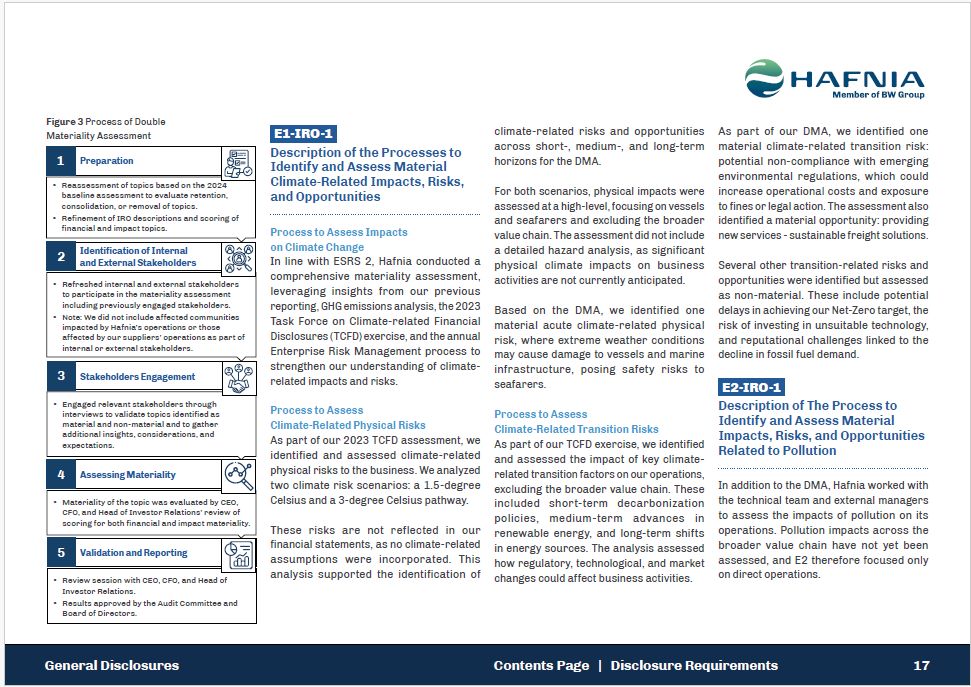
E1-IRO-1 Description of the Processes to Identify and Assess Material
Climate-Related Impacts, Risks, and Opportunities Process to Assess Impacts on Climate Change In line with ESRS 2, Hafnia conducted a comprehensive materiality assessment, leveraging insights from our previous reporting, GHG emissions
analysis, the 2023 Task Force on Climate-related Financial Disclosures (TCFD) exercise, and the annual Enterprise Risk Management process to strengthen our understanding of climate-related impacts and risks. Process to Assess Climate-Related
Physical Risks As part of our 2023 TCFD assessment, we identified and assessed climate-related physical risks to the business. We analyzed two climate risk scenarios: a 1.5-degree Celsius and a 3-degree Celsius pathway. These risks are not
reflected in our financial statements, as no climate-related assumptions were incorporated. This analysis supported the identification of climate-related risks and opportunities across short-, medium-, and long-term horizons for the DMA. For
both scenarios, physical impacts were assessed at a high-level, focusing on vessels and seafarers and excluding the broader value chain. The assessment did not include a detailed hazard analysis, as significant physical climate impacts on
business activities are not currently anticipated. Based on the DMA, we identified one material acute climate-related physical risk, where extreme weather conditions may cause damage to vessels and marine infrastructure, posing safety risks to
seafarers. Process to Assess Climate-Related Transition Risks As part of our TCFD exercise, we identified and assessed the impact of key climate-related transition factors on our operations, excluding the broader value chain. These included
short-term decarbonization policies, medium-term advances in renewable energy, and long-term shifts in energy sources. The analysis assessed how regulatory, technological, and market changes could affect business activities. As part of our
DMA, we identified one material climate-related transition risk: potential non-compliance with emerging environmental regulations, which could increase operational costs and exposure to fines or legal action. The assessment also identified a
material opportunity: providing new services - sustainable freight solutions. Several other transition-related risks and opportunities were identified but assessed as non-material. These include potential delays in achieving our Net-Zero
target, the risk of investing in unsuitable technology, and reputational challenges linked to the decline in fossil fuel demand. E2-IRO-1 Description of The Process to Identify and Assess Material Impacts, Risks, and Opportunities Related to
Pollution In addition to the DMA, Hafnia worked with the technical team and external managers to assess the impacts of pollution on its operations. Pollution impacts across the broader value chain have not yet been assessed, and E2 therefore
focused only on direct operations. 1 2 3 4 5 Preparation Identification of Internal and External Stakeholders Stakeholders Engagement Assessing Materiality Validation and Reporting Reassessment of topics based on the 2024 baseline
assessment to evaluate retention, consolidation, or removal of topics. Refinement of IRO descriptions and scoring of financial and impact topics. Refreshed internal and external stakeholders to participate in the materiality assessment
including previously engaged stakeholders. Note: We did not include affected communities impacted by Hafnia’s operations or those affected by our suppliers’ operations as part of internal or external stakeholders. Engaged relevant
stakeholders through interviews to validate topics identified as material and non-material and to gather additional insights, considerations, and expectations. Materiality of the topic was evaluated by CEO, CFO, and Head of Investor Relations’
review of scoring for both financial and impact materiality. Review session with CEO, CFO, and Head of Investor Relations. Results approved by the Audit Committee and Board of Directors. Figure 3 Process of Double Materiality
Assessment General Disclosures 17 Contents Page | Disclosure Requirements
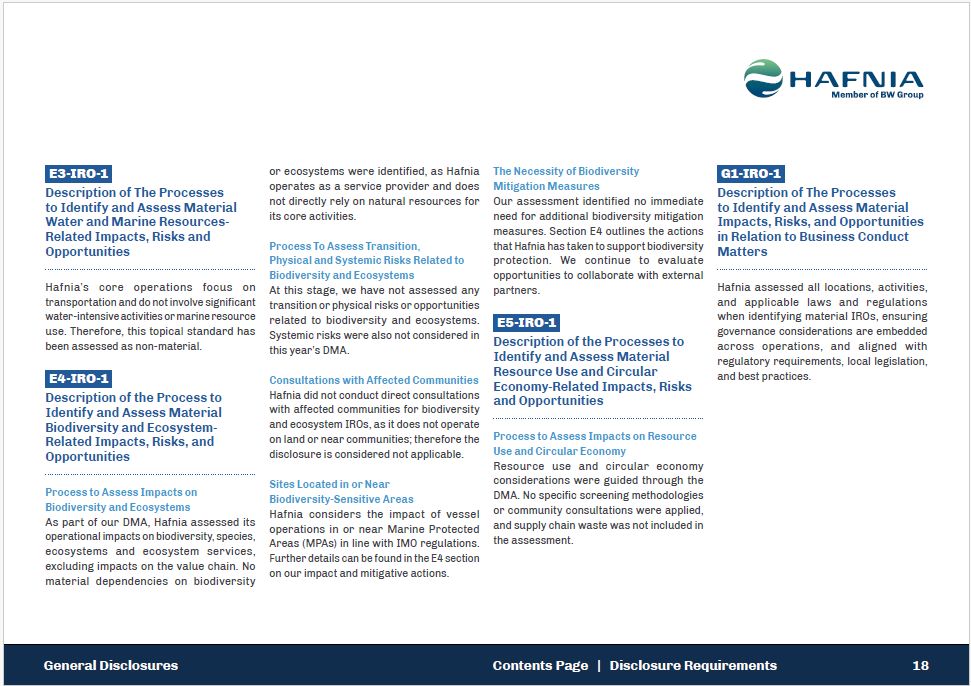
E3-IRO-1 Description of The Processes to Identify and Assess Material Water and
Marine Resources-Related Impacts, Risks and Opportunities Hafnia’s core operations focus on transportation and do not involve significant water-intensive activities or marine resource use. Therefore, this topical standard has been assessed as
non-material. E4-IRO-1 Description of the Process to Identify and Assess Material Biodiversity and Ecosystem-Related Impacts, Risks, and Opportunities Process to Assess Impacts on Biodiversity and Ecosystems As part of our DMA, Hafnia
assessed its operational impacts on biodiversity, species, ecosystems and ecosystem services, excluding impacts on the value chain. No material dependencies on biodiversity or ecosystems were identified, as Hafnia operates as a service
provider and does not directly rely on natural resources for its core activities. Process To Assess Transition, Physical and Systemic Risks Related to Biodiversity and Ecosystems At this stage, we have not assessed any transition or physical
risks or opportunities related to biodiversity and ecosystems. Systemic risks were also not considered in this year’s DMA. Consultations with Affected Communities Hafnia did not conduct direct consultations with affected communities for
biodiversity and ecosystem IROs, as it does not operate on land or near communities; therefore the disclosure is considered not applicable. Sites Located in or Near Biodiversity-Sensitive Areas Hafnia considers the impact of vessel operations
in or near Marine Protected Areas (MPAs) in line with IMO regulations. Further details can be found in the E4 section on our impact and mitigative actions. The Necessity of Biodiversity Mitigation Measures Our assessment identified no
immediate need for additional biodiversity mitigation measures. Section E4 outlines the actions that Hafnia has taken to support biodiversity protection. We continue to evaluate opportunities to collaborate with external
partners. E5-IRO-1 Description of the Processes to Identify and Assess Material Resource Use and Circular Economy-Related Impacts, Risks and Opportunities Process to Assess Impacts on Resource Use and Circular Economy Resource use and
circular economy considerations were guided through the DMA. No specific screening methodologies or community consultations were applied, and supply chain waste was not included in the assessment. G1-IRO-1 General Disclosures 18 Contents
Page | Disclosure Requirements Description of The Processes to Identify and Assess Material Impacts, Risks, and Opportunities in Relation to Business Conduct Matters Hafnia assessed all locations, activities, and applicable laws and
regulations when identifying material IROs, ensuring governance considerations are embedded across operations, and aligned with regulatory requirements, local legislation, and best practices.
Environment Contents Page | Disclosure Requirements 19 General Disclosures |
Environment | Social | Governance | Limited Assurance Report
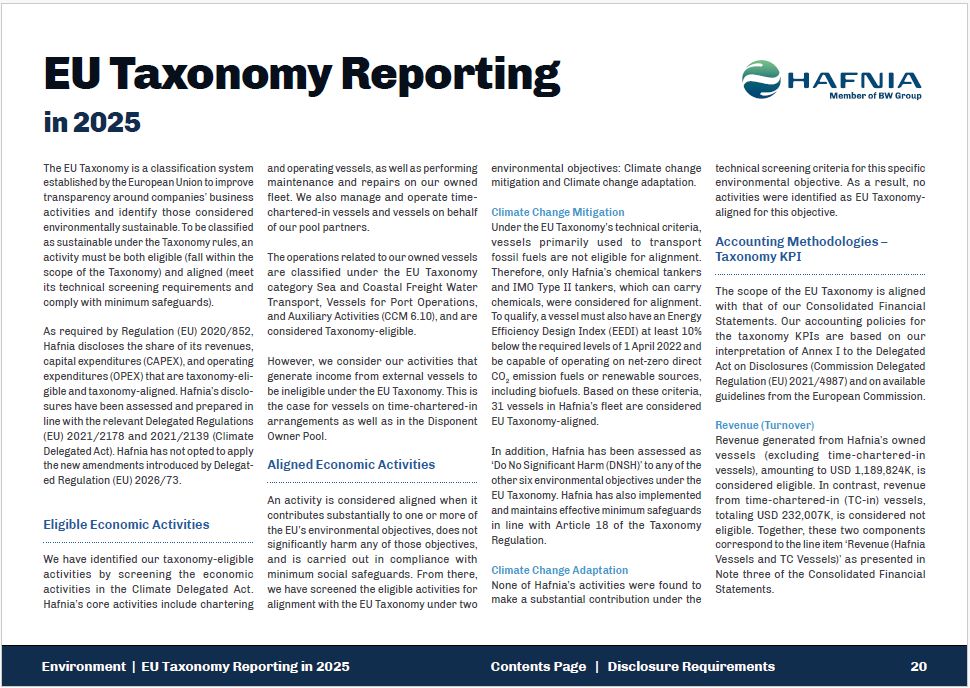
EU Taxonomy Reporting in 2025 The EU Taxonomy is a classification system
established by the European Union to improve transparency around companies’ business activities and identify those considered environmentally sustainable. To be classified as sustainable under the Taxonomy rules, an activity must be both
eligible (fall within the scope of the Taxonomy) and aligned (meet its technical screening requirements and comply with minimum safeguards). As required by Regulation (EU) 2020/852, Hafnia discloses the share of its revenues, capital
expenditures (CAPEX), and operating expenditures (OPEX) that are taxonomy-eli-gible and taxonomy-aligned. Hafnia’s disclo-sures have been assessed and prepared in line with the relevant Delegated Regulations (EU) 2021/2178 and 2021/2139
(Climate Delegated Act). Hafnia has not opted to apply the new amendments introduced by Delegat-ed Regulation (EU) 2026/73. Eligible Economic Activities We have identified our taxonomy-eligible activities by screening the economic activities
in the Climate Delegated Act. Hafnia’s core activities include chartering and operating vessels, as well as performing maintenance and repairs on our owned fleet. We also manage and operate time-chartered-in vessels and vessels on behalf of
our pool partners. The operations related to our owned vessels are classified under the EU Taxonomy category Sea and Coastal Freight Water Transport, Vessels for Port Operations, and Auxiliary Activities (CCM 6.10), and are considered
Taxonomy-eligible. However, we consider our activities that generate income from external vessels to be ineligible under the EU Taxonomy. This is the case for vessels on time-chartered-in arrangements as well as in the Disponent Owner
Pool. Aligned Economic Activities An activity is considered aligned when it contributes substantially to one or more of the EU’s environmental objectives, does not significantly harm any of those objectives, and is carried out in compliance
with minimum social safeguards. From there, we have screened the eligible activities for alignment with the EU Taxonomy under two environmental objectives: Climate change mitigation and Climate change adaptation. Climate Change
Mitigation Under the EU Taxonomy’s technical criteria, vessels primarily used to transport fossil fuels are not eligible for alignment. Therefore, only Hafnia’s chemical tankers and IMO Type II tankers, which can carry chemicals, were
considered for alignment. To qualify, a vessel must also have an Energy Efficiency Design Index (EEDI) at least 10% below the required levels of 1 April 2022 and be capable of operating on net-zero direct CO2 emission fuels or renewable
sources, including biofuels. Based on these criteria, 31 vessels in Hafnia’s fleet are considered EU Taxonomy-aligned. In addition, Hafnia has been assessed as ‘Do No Significant Harm (DNSH)’ to any of the other six environmental objectives
under the EU Taxonomy. Hafnia has also implemented and maintains effective minimum safeguards in line with Article 18 of the Taxonomy Regulation. Climate Change Adaptation None of Hafnia’s activities were found to make a substantial
contribution under the technical screening criteria for this specific environmental objective. As a result, no activities were identified as EU Taxonomy-aligned for this objective. Environment | EU Taxonomy Reporting in 2025 20 Contents
Page | Disclosure Requirements Accounting Methodologies – Taxonomy KPI The scope of the EU Taxonomy is aligned with that of our Consolidated Financial Statements. Our accounting policies for the taxonomy KPIs are based on our interpretation
of Annex I to the Delegated Act on Disclosures (Commission Delegated Regulation (EU) 2021/4987) and on available guidelines from the European Commission. Revenue (Turnover) Revenue generated from Hafnia’s owned vessels (excluding
time-chartered-in vessels), amounting to USD 1,189,824K, is considered eligible. In contrast, revenue from time-chartered-in (TC-in) vessels, totaling USD 232,007K, is considered not eligible. Together, these two components correspond to the
line item ‘Revenue (Hafnia Vessels and TC Vessels)’ as presented in Note three of the Consolidated Financial Statements.
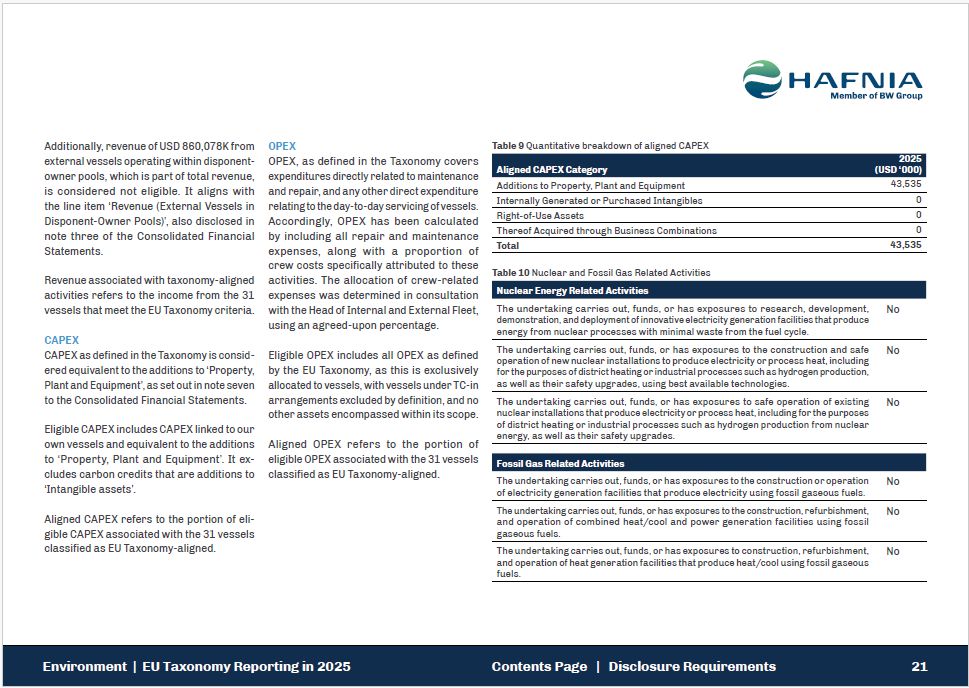
Additionally, revenue of USD 860,078K from external vessels operating within
disponent-owner pools, which is part of total revenue, is considered not eligible. It aligns with the line item ‘Revenue (External Vessels in Disponent-Owner Pools)’, also disclosed in note three of the Consolidated Financial
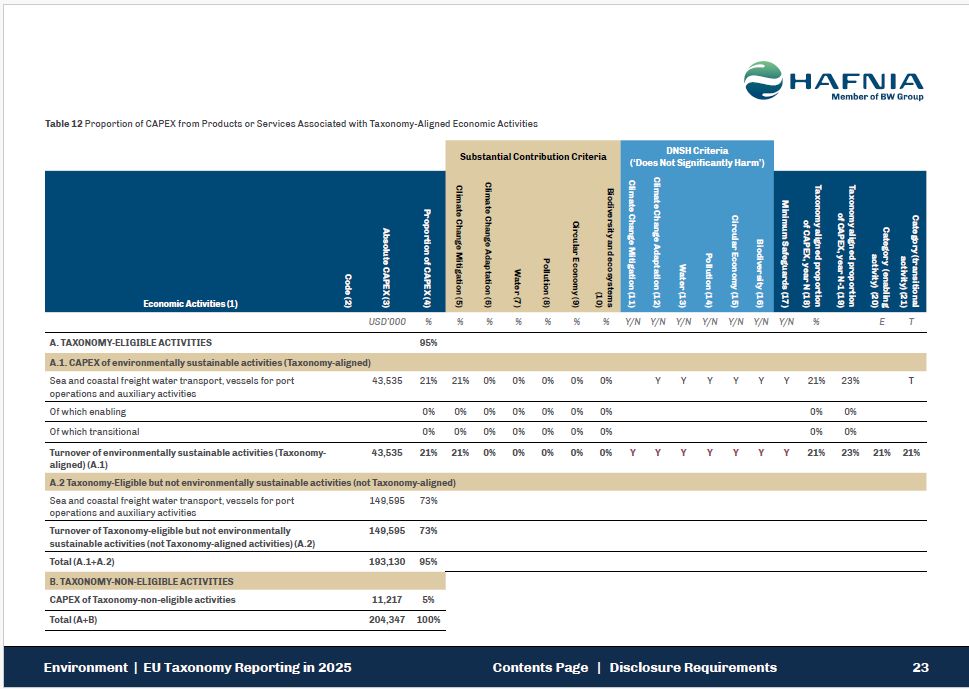
Statements. Revenue associated with taxonomy-aligned activities refers to the income from the 31 vessels that meet the EU Taxonomy criteria. CAPEX CAPEX as defined in the Taxonomy is consid-ered equivalent to the additions to ‘Property,
Plant and Equipment’, as set out in note seven to the Consolidated Financial Statements. Eligible CAPEX includes CAPEX linked to our own vessels and equivalent to the additions to ‘Property, Plant and Equipment’. It ex-cludes carbon credits
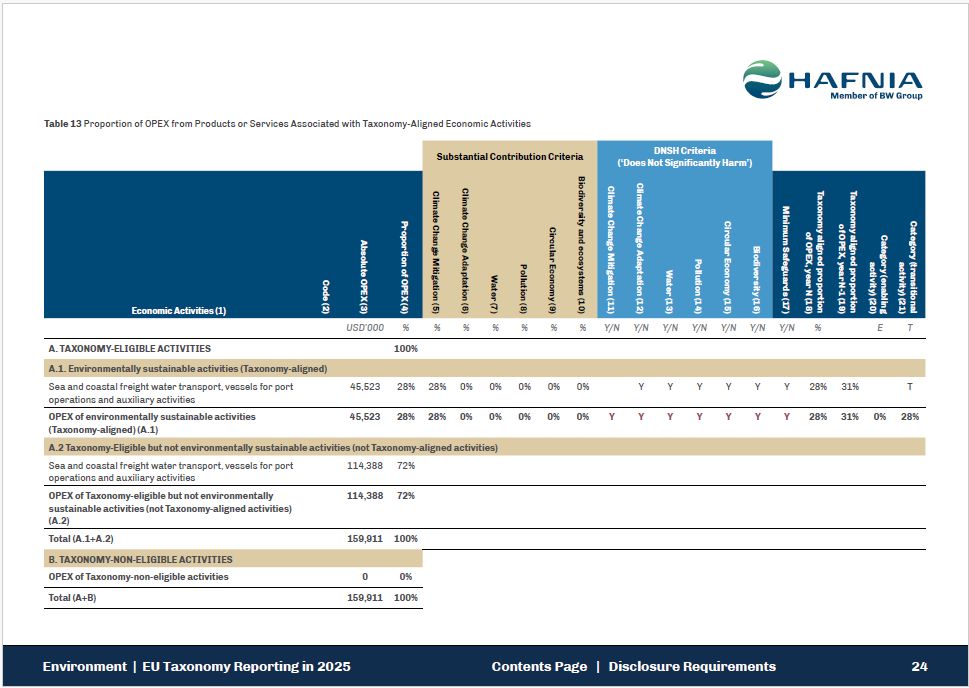
that are additions to ‘Intangible assets’. Aligned CAPEX refers to the portion of eli-gible CAPEX associated with the 31 vessels classified as EU Taxonomy-aligned. OPEX OPEX, as defined in the Taxonomy covers expenditures directly related to
maintenance and repair, and any other direct expenditure relating to the day-to-day servicing of vessels. Accordingly, OPEX has been calculated by including all repair and maintenance expenses, along with a proportion of crew costs specifically
attributed to these activities. The allocation of crew-related expenses was determined in consultation with the Head of Internal and External Fleet, using an agreed-upon percentage. Eligible OPEX includes all OPEX as defined by the EU
Taxonomy, as this is exclusively allocated to vessels, with vessels under TC-in arrangements excluded by definition, and no other assets encompassed within its scope. Aligned OPEX refers to the portion of eligible OPEX associated with the 31
vessels classified as EU Taxonomy-aligned. Table 9 Quantitative breakdown of aligned CAPEX Aligned CAPEX Category 2025 (USD ‘000) Additions to Property, Plant and Equipment 43,535 Internally Generated or Purchased
Intangibles 0 Right-of-Use Assets 0 Thereof Acquired through Business Combinations 0 Total 43,535 Table 10 Nuclear and Fossil Gas Related Activities Nuclear Energy Related Activities The undertaking carries out, funds, or has
exposures to research, development, demonstration, and deployment of innovative electricity generation facilities that produce energy from nuclear processes with minimal waste from the fuel cycle. Environment | EU Taxonomy Reporting in
2025 21 Contents Page | Disclosure Requirements No The undertaking carries out, funds, or has exposures to the construction and safe operation of new nuclear installations to produce electricity or process heat, including for the purposes
of district heating or industrial processes such as hydrogen production, as well as their safety upgrades, using best available technologies. No The undertaking carries out, funds, or has exposures to safe operation of existing nuclear
installations that produce electricity or process heat, including for the purposes of district heating or industrial processes such as hydrogen production from nuclear energy, as well as their safety upgrades. No Fossil Gas Related
Activities The undertaking carries out, funds, or has exposures to the construction or operation of electricity generation facilities that produce electricity using fossil gaseous fuels. No The undertaking carries out, funds, or has
exposures to the construction, refurbishment, and operation of combined heat/cool and power generation facilities using fossil gaseous fuels. No The undertaking carries out, funds, or has exposures to construction, refurbishment, No and
operation of heat generation facilities that produce heat/cool using fossil gaseous fuels.
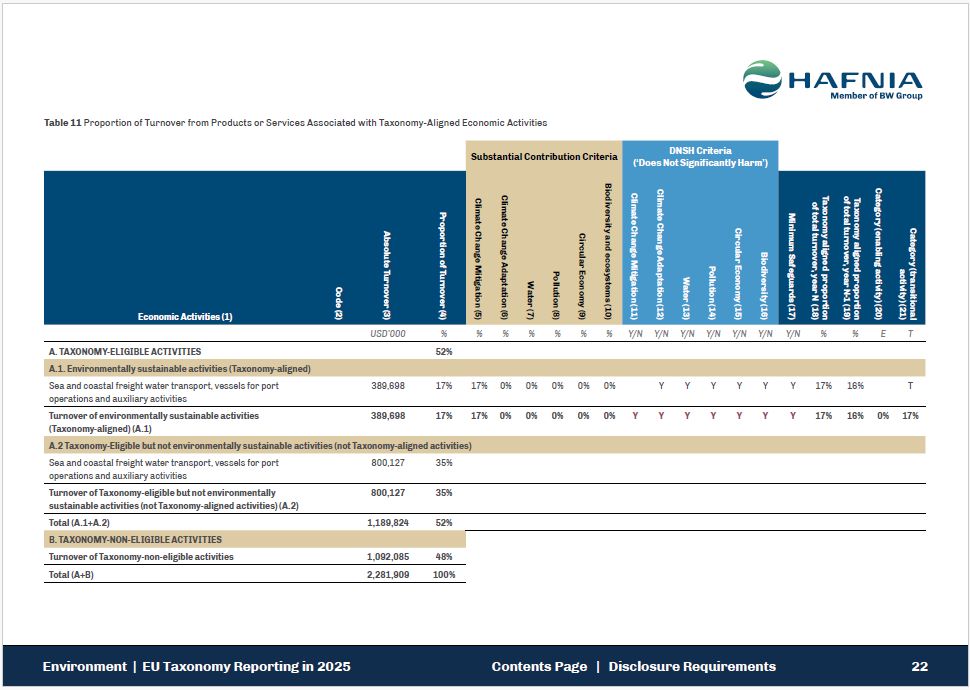
USD’000 % % % % % % % Y/N Y/N Y/N Y/N Y/N Y/N Y/N % % E T A.
TAXONOMY-ELIGIBLE ACTIVITIES 52% A.1. Environmentally sustainable activities (Taxonomy-aligned) Sea and coastal freight water transport, vessels for port operations and auxiliary
activities 389,698 17% 17% 0% 0% 0% 0% 0% Y Y Y Y Y Y 17% 16% T Turnover of environmentally sustainable activities (Taxonomy-aligned) (A.1) 389,698 17% 17% 0% 0% 0% 0% 0% Y Y Y Y Y Y Y 17% 16% 0% 17% A.2
Taxonomy-Eligible but not environmentally sustainable activities (not Taxonomy-aligned activities) Sea and coastal freight water transport, vessels for port operations and auxiliary activities 800,127 35% Turnover of Taxonomy-eligible but
not environmentally sustainable activities (not Taxonomy-aligned activities) (A.2) 800,127 35% Total (A.1+A.2) 1,189,824 52% B. TAXONOMY-NON-ELIGIBLE ACTIVITIES Turnover of Taxonomy-non-eligible activities 1,092,085 48% Total
(A+B) 2,281,909 100% Substantial Contribution Criteria Environment | EU Taxonomy Reporting in 2025 22 Contents Page | Disclosure Requirements DNSH Criteria (‘Does Not Significantly Harm’) Economic Activities (1) Code (2) Absolute
Turnover (3) Proportion of Turnover (4) Climate Change Mitigation (5) Climate Change Adaptation (6) Water (7) Pollution (8) Circular Economy (9) Biodiversity and ecosystems (10) Climate Change Mitigation (11) Climate Change Adaptation
(12) Water (13) Pollution (14) Circular Economy (15) Biodiversity (16) Minimum Safeguards (17) Taxonomy aligned proportion of total turnover, year N (18) Taxonomy aligned proportion of total turnover, year N-1 (19) Category (enabling
activity) (20) Category (transitional activity) (21) Table 11 Proportion of Turnover from Products or Services Associated with Taxonomy-Aligned Economic Activities
USD’000 % % % % % % % Y/N Y/N Y/N Y/N Y/N Y/N Y/N % E T A.
TAXONOMY-ELIGIBLE ACTIVITIES 95% A.1. CAPEX of environmentally sustainable activities (Taxonomy-aligned) Sea and coastal freight water transport, vessels for port 43,535 operations and auxiliary
activities 21% 21% 0% 0% 0% 0% 0% Y Y Y Y Y Y 21% 23% T Of which enabling 0% 0% 0% 0% 0% 0% 0% 0% 0% Of which transitional 0% 0% 0% 0% 0% 0% 0% 0% 0% Turnover of environmentally sustainable activities
(Taxonomy- 43,535 aligned) (A.1) 21% 21% 0% 0% 0% 0% 0% Y Y Y Y Y Y Y 21% 23% 21% 21% A.2 Taxonomy-Eligible but not environmentally sustainable activities (not Taxonomy-aligned) Sea and coastal freight water transport,
vessels for port operations and auxiliary activities 149,595 73% Turnover of Taxonomy-eligible but not environmentally sustainable activities (not Taxonomy-aligned activities) (A.2) 149,595 73% Total (A.1+A.2) 193,130 95% B.
TAXONOMY-NON-ELIGIBLE ACTIVITIES CAPEX of Taxonomy-non-eligible activities 11,217 5% Total (A+B) 204,347 100% Substantial Contribution Criteria Environment | EU Taxonomy Reporting in 2025 23 Contents Page | Disclosure
Requirements DNSH Criteria (‘Does Not Significantly Harm’) Economic Activities (1) Code (2) Absolute CAPEX (3) Proportion of CAPEX (4) Climate Change Mitigation (5) Climate Change Adaptation (6) Water (7) Pollution (8) Circular
Economy (9) Biodiversity and ecosystems (10) Climate Change Mitigation (11) Climate Change Adaptation (12) Water (13) Pollution (14) Circular Economy (15) Biodiversity (16) Minimum Safeguards (17) Taxonomy aligned proportion of CAPEX,
year N (18) Taxonomy aligned proportion of CAPEX, year N-1 (19) Category (transitional activity) (21) Category (enabling activity) (20) Table 12 Proportion of CAPEX from Products or Services Associated with Taxonomy-Aligned Economic
Activities
USD’000 % % % % % % % Y/N Y/N Y/N Y/N Y/N Y/N Y/N % E T A.
TAXONOMY-ELIGIBLE ACTIVITIES 100% A.1. Environmentally sustainable activities (Taxonomy-aligned) Sea and coastal freight water transport, vessels for port operations and auxiliary
activities 45,523 28% 28% 0% 0% 0% 0% 0% Y Y Y Y Y Y 28% 31% T OPEX of environmentally sustainable activities (Taxonomy-aligned) (A.1) 45,523 28% 28% 0% 0% 0% 0% 0% Y Y Y Y Y Y Y 28% 31% 0% 28% A.2
Taxonomy-Eligible but not environmentally sustainable activities (not Taxonomy-aligned activities) Sea and coastal freight water transport, vessels for port operations and auxiliary activities 114,388 72% OPEX of Taxonomy-eligible but not
environmentally sustainable activities (not Taxonomy-aligned activities) (A.2) 114,388 72% Total (A.1+A.2) 159,911 100% B. TAXONOMY-NON-ELIGIBLE ACTIVITIES OPEX of Taxonomy-non-eligible activities 0 0% Total
(A+B) 159,911 100% Substantial Contribution Criteria Environment | EU Taxonomy Reporting in 2025 24 Contents Page | Disclosure Requirements DNSH Criteria (‘Does Not Significantly Harm’) Economic Activities (1) Code (2) Absolute OPEX
(3) Proportion of OPEX (4) Climate Change Mitigation (5) Climate Change Adaptation (6) Water (7) Pollution (8) Circular Economy (9) Biodiversity and ecosystems (10) Climate Change Mitigation (11) Climate Change Adaptation (12) Water
(13) Pollution (14) Circular Economy (15) Biodiversity (16) Minimum Safeguards (17) Taxonomy aligned proportion of OPEX, year N (18) Category (transitional activity) (21) Category (enabling activity) (20) Taxonomy aligned proportion
of OPEX, year N-1 (19) Table 13 Proportion of OPEX from Products or Services Associated with Taxonomy-Aligned Economic Activities
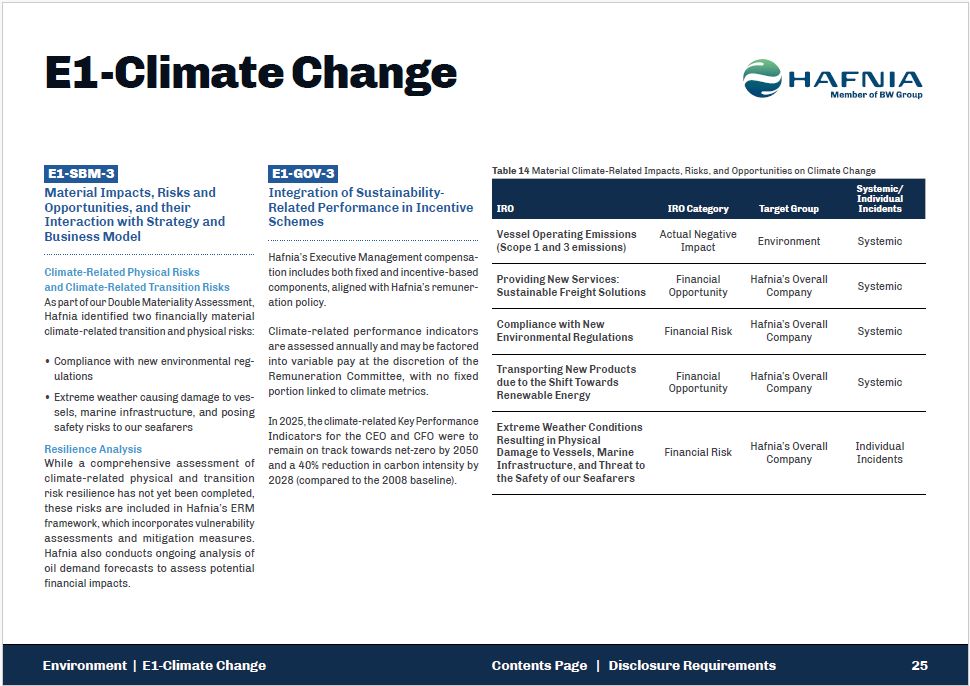
E1-Climate Change E1-SBM-3 Material Impacts, Risks and Opportunities, and their
Interaction with Strategy and Business Model Climate-Related Physical Risks and Climate-Related Transition Risks As part of our Double Materiality Assessment, Hafnia identified two financially material climate-related transition and physical
risks: Compliance with new environmental reg-ulations Extreme weather causing damage to ves-sels, marine infrastructure, and posing safety risks to our seafarers Resilience Analysis While a comprehensive assessment of climate-related
physical and transition risk resilience has not yet been completed, these risks are included in Hafnia’s ERM framework, which incorporates vulnerability assessments and mitigation measures. Hafnia also conducts ongoing analysis of oil demand
forecasts to assess potential financial impacts. E1-GOV-3 Integration of Sustainability-Related Performance in Incentive Schemes Hafnia’s Executive Management compensa-tion includes both fixed and incentive-based components, aligned with
Hafnia’s remuner-ation policy. Climate-related performance indicators are assessed annually and may be factored into variable pay at the discretion of the Remuneration Committee, with no fixed portion linked to climate metrics. In 2025, the
climate-related Key Performance Indicators for the CEO and CFO were to remain on track towards net-zero by 2050 and a 40% reduction in carbon intensity by 2028 (compared to the 2008 baseline). Table 14 Material Climate-Related Impacts, Risks,
and Opportunities on Climate Change IRO Environment | E1-Climate Change 25 Contents Page | Disclosure Requirements IRO Category Target Group Systemic/ Individual Incidents Vessel Operating Emissions (Scope 1 and 3 emissions) Actual
Negative Impact Environment Systemic Providing New Services: Sustainable Freight Solutions Financial Opportunity Hafnia’s Overall Company Systemic Compliance with New Environmental Regulations Financial Risk Hafnia’s Overall
Company Systemic Transporting New Products due to the Shift Towards Renewable Energy Financial Opportunity Hafnia’s Overall Company Systemic Extreme Weather Conditions Resulting in Physical Damage to Vessels, Marine Infrastructure, and
Threat to the Safety of our Seafarers Financial Risk Hafnia’s Overall Company Individual Incidents
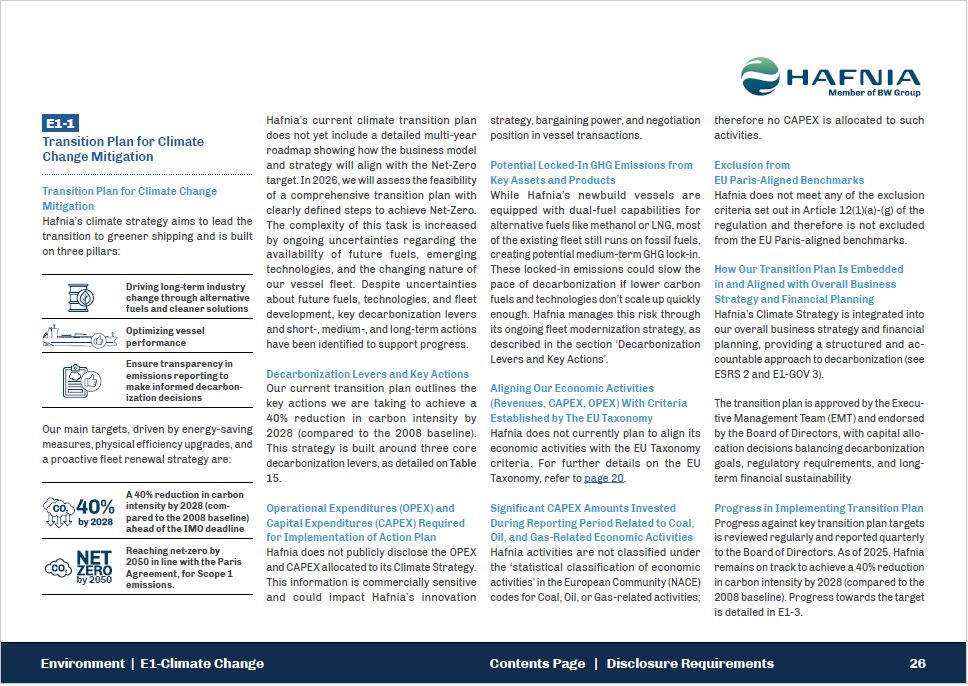
Hafnia’s current climate transition plan does not yet include a detailed
multi-year roadmap showing how the business model and strategy will align with the Net-Zero target. In 2026, we will assess the feasibility of a comprehensive transition plan with clearly defined steps to achieve Net-Zero. The complexity of
this task is increased by ongoing uncertainties regarding the availability of future fuels, emerging technologies, and the changing nature of our vessel fleet. Despite uncertainties about future fuels, technologies, and fleet development, key
decarbonization levers and short-, medium-, and long-term actions have been identified to support progress. Transition Plan for Climate Change Mitigation Hafnia’s climate strategy aims to lead the transition to greener shipping and is built
on three pillars: Driving long-term industry change through alternative fuels and cleaner solutions Decarbonization Levers and Key Actions Our current transition plan outlines the key actions we are taking to achieve a 40% reduction in
carbon intensity by 2028 (compared to the 2008 baseline). This strategy is built around three core decarbonization levers, as detailed on Table 15. Operational Expenditures (OPEX) and Capital Expenditures (CAPEX) Required for Implementation of
Action Plan Hafnia does not publicly disclose the OPEX and CAPEX allocated to its Climate Strategy. This information is commercially sensitive and could impact Hafnia’s innovation strategy, bargaining power, and negotiation position in vessel
transactions. Potential Locked-In GHG Emissions from Key Assets and Products While Hafnia’s newbuild vessels are equipped with dual-fuel capabilities for alternative fuels like methanol or LNG, most of the existing fleet still runs on fossil
fuels, creating potential medium-term GHG lock-in. These locked-in emissions could slow the pace of decarbonization if lower carbon fuels and technologies don’t scale up quickly enough. Hafnia manages this risk through its ongoing fleet
modernization strategy, as described in the section ‘Decarbonization Levers and Key Actions’. Aligning Our Economic Activities (Revenues, CAPEX, OPEX) With Criteria Established by The EU Taxonomy Hafnia does not currently plan to align its
economic activities with the EU Taxonomy criteria. For further details on the EU Taxonomy, refer to page 20. Significant CAPEX Amounts Invested During Reporting Period Related to Coal, Oil, and Gas-Related Economic Activities Hafnia activities
are not classified under the ‘statistical classification of economic activities’ in the European Community (NACE) codes for Coal, Oil, or Gas-related activities; therefore no CAPEX is allocated to such activities. Exclusion from EU
Paris-Aligned Benchmarks Hafnia does not meet any of the exclusion criteria set out in Article 12(1)(a)-(g) of the regulation and therefore is not excluded from the EU Paris-aligned benchmarks. How Our Transition Plan Is Embedded in and
Aligned with Overall Business Strategy and Financial Planning Hafnia’s Climate Strategy is integrated into our overall business strategy and financial planning, providing a structured and ac-countable approach to decarbonization (see ESRS 2
and E1-GOV 3). The transition plan is approved by the Execu-tive Management Team (EMT) and endorsed by the Board of Directors, with capital allo-cation decisions balancing decarbonization goals, regulatory requirements, and long-term financial
sustainability Progress in Implementing Transition Plan Progress against key transition plan targets is reviewed regularly and reported quarterly to the Board of Directors. As of 2025, Hafnia remains on track to achieve a 40% reduction in
carbon intensity by 2028 (compared to the 2008 baseline). Progress towards the target is detailed in E1-3. E1-1 Transition Plan for Climate Change Mitigation Optimizing vessel performance Ensure transparency in emissions reporting to make
informed decarbon-ization decisions Our main targets, driven by energy-saving measures, physical efficiency upgrades, and a proactive fleet renewal strategy are: A 40% reduction in carbon intensity by 2028 (com-pared to the 2008 baseline)
ahead of the IMO deadline Reaching net-zero by 2050 in line with the Paris Agreement, for Scope 1 emissions. by 2050 Environment | E1-Climate Change 26 Contents Page | Disclosure Requirements
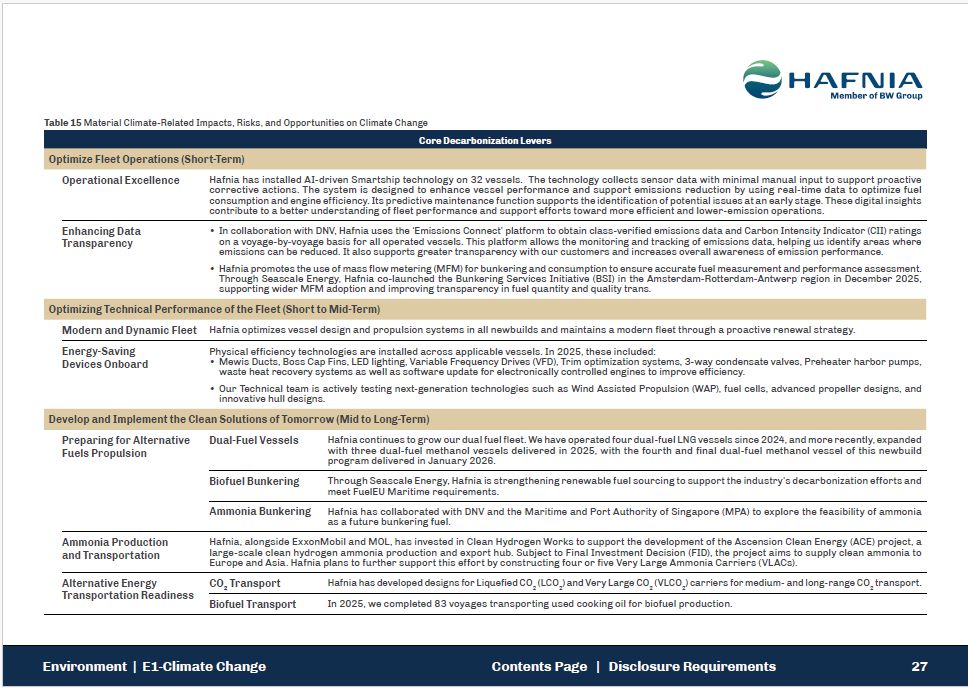
Table 15 Material Climate-Related Impacts, Risks, and Opportunities on Climate
Change Core Decarbonization Levers Optimize Fleet Operations (Short-Term) Operational Excellence Environment | E1-Climate Change 27 Contents Page | Disclosure Requirements Hafnia has installed AI-driven Smartship technology on 32
vessels. The technology collects sensor data with minimal manual input to support proactive corrective actions. The system is designed to enhance vessel performance and support emissions reduction by using real-time data to optimize fuel
consumption and engine efficiency. Its predictive maintenance function supports the identification of potential issues at an early stage. These digital insights contribute to a better understanding of fleet performance and support efforts
toward more efficient and lower-emission operations. Enhancing Data Transparency In collaboration with DNV, Hafnia uses the ‘Emissions Connect’ platform to obtain class-verified emissions data and Carbon Intensity Indicator (CII) ratings on a
voyage-by-voyage basis for all operated vessels. This platform allows the monitoring and tracking of emissions data, helping us identify areas where emissions can be reduced. It also supports greater transparency with our customers and
increases overall awareness of emission performance. Hafnia promotes the use of mass flow metering (MFM) for bunkering and consumption to ensure accurate fuel measurement and performance assessment. Through Seascale Energy, Hafnia co-launched
the Bunkering Services Initiative (BSI) in the Amsterdam-Rotterdam-Antwerp region in December 2025, supporting wider MFM adoption and improving transparency in fuel quantity and quality trans. Optimizing Technical Performance of the Fleet
(Short to Mid-Term) Modern and Dynamic Fleet Hafnia optimizes vessel design and propulsion systems in all newbuilds and maintains a modern fleet through a proactive renewal strategy. Energy-Saving Devices Onboard Physical efficiency
technologies are installed across applicable vessels. In 2025, these included: Mewis Ducts, Boss Cap Fins, LED lighting, Variable Frequency Drives (VFD), Trim optimization systems, 3-way condensate valves, Preheater harbor pumps, waste heat
recovery systems as well as software update for electronically controlled engines to improve efficiency. Our Technical team is actively testing next-generation technologies such as Wind Assisted Propulsion (WAP), fuel cells, advanced propeller
designs, and innovative hull designs. Develop and Implement the Clean Solutions of Tomorrow (Mid to Long-Term) Preparing for Alternative Dual-Fuel Vessels Fuels Propulsion Hafnia continues to grow our dual fuel fleet. We have operated four
dual-fuel LNG vessels since 2024, and more recently, expanded with three dual-fuel methanol vessels delivered in 2025, with the fourth and final dual-fuel methanol vessel of this newbuild program delivered in January 2026. Biofuel
Bunkering Through Seascale Energy, Hafnia is strengthening renewable fuel sourcing to support the industry’s decarbonization efforts and meet FuelEU Maritime requirements. Ammonia Bunkering Hafnia has collaborated with DNV and the Maritime
and Port Authority of Singapore (MPA) to explore the feasibility of ammonia as a future bunkering fuel. Ammonia Production and Transportation Hafnia, alongside ExxonMobil and MOL, has invested in Clean Hydrogen Works to support the
development of the Ascension Clean Energy (ACE) project, a large-scale clean hydrogen ammonia production and export hub. Subject to Final Investment Decision (FID), the project aims to supply clean ammonia to Europe and Asia. Hafnia plans to
further support this effort by constructing four or five Very Large Ammonia Carriers (VLACs). CO2 Transport Hafnia has developed designs for Liquefied CO2 (LCO2) and Very Large CO2 (VLCO2) carriers for medium- and long-range CO2
transport. Biofuel Transport In 2025, we completed 83 voyages transporting used cooking oil for biofuel production. Alternative Energy Transportation Readiness
E1-2 Policies Related to Climate Change Mitigation and Adaptation While we do
not have a standalone policy, our approach to climate change is guided by our Climate Strategy, which defines targets and pillars that address material climate-related impacts, risks, and opportunities. E1-3 Actions and Resources in Relation
to Climate Change Policies Our Action to Address Material Impacts, Manage Material Risks, and Pursue Material Opportunities Actions to address most material climate-related IROs are embedded in Hafnia’s energy transition plan (see E1-1). The
remaining risk relates to potential non-compliance with stricter energy efficiency, fuel, and emissions regulations. Hafnia manages this through proactive regulatory engagement, including industry forums, dialogue with legislators and
consultants, and regular updates to management and the Board on regulatory developments and required actions. Climate Change Mitigation Actions Presented by Decarbonization Lever Hafnia’s current decarbonization levers are presented in
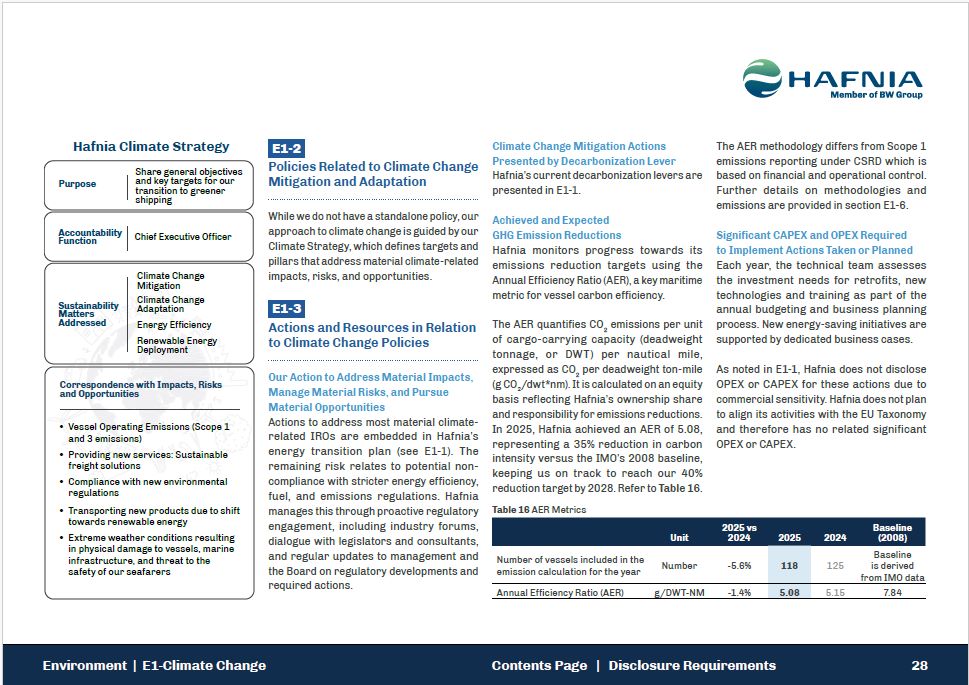
E1-1. Achieved and Expected GHG Emission Reductions Hafnia monitors progress towards its emissions reduction targets using the Annual Efficiency Ratio (AER), a key maritime metric for vessel carbon efficiency. The AER quantifies CO2
emissions per unit of cargo-carrying capacity (deadweight tonnage, or DWT) per nautical mile, expressed as CO2 per deadweight ton-mile (g CO2/dwt*nm). It is calculated on an equity basis reflecting Hafnia’s ownership share and responsibility
for emissions reductions. In 2025, Hafnia achieved an AER of 5.08, representing a 35% reduction in carbon intensity versus the IMO’s 2008 baseline, keeping us on track to reach our 40% reduction target by 2028. Refer to Table 16. Table 16 AER
Metrics The AER methodology differs from Scope 1 emissions reporting under CSRD which is based on financial and operational control. Further details on methodologies and emissions are provided in section E1-6. Significant CAPEX and OPEX
Required to Implement Actions Taken or Planned Each year, the technical team assesses the investment needs for retrofits, new technologies and training as part of the annual budgeting and business planning process. New energy-saving
initiatives are supported by dedicated business cases. As noted in E1-1, Hafnia does not disclose OPEX or CAPEX for these actions due to commercial sensitivity. Hafnia does not plan to align its activities with the EU Taxonomy and therefore
has no related significant OPEX or CAPEX. Unit 2025 vs 2024 2025 Baseline 2024 (2008) Number of vessels included in the emission calculation for the year Number -5.6% 118 Baseline 125 is derived from IMO data Annual Efficiency
Ratio (AER) g/DWT-NM -1.4% 5.08 5.15 7.84 Purpose Hafnia Climate Strategy Share general objectives and key targets for our transition to greener shipping Accountability Function Chief Executive Officer Sustainability Matters
Addressed Climate Change Mitigation Climate Change Adaptation Energy Efficiency Renewable Energy Deployment Vessel Operating Emissions (Scope 1 and 3 emissions) Providing new services: Sustainable freight solutions Compliance with new
environmental regulations Transporting new products due to shift towards renewable energy Extreme weather conditions resulting in physical damage to vessels, marine infrastructure, and threat to the safety of our seafarers Correspondence
with Impacts, Risks and Opportunities Environment | E1-Climate Change 28 Contents Page | Disclosure Requirements
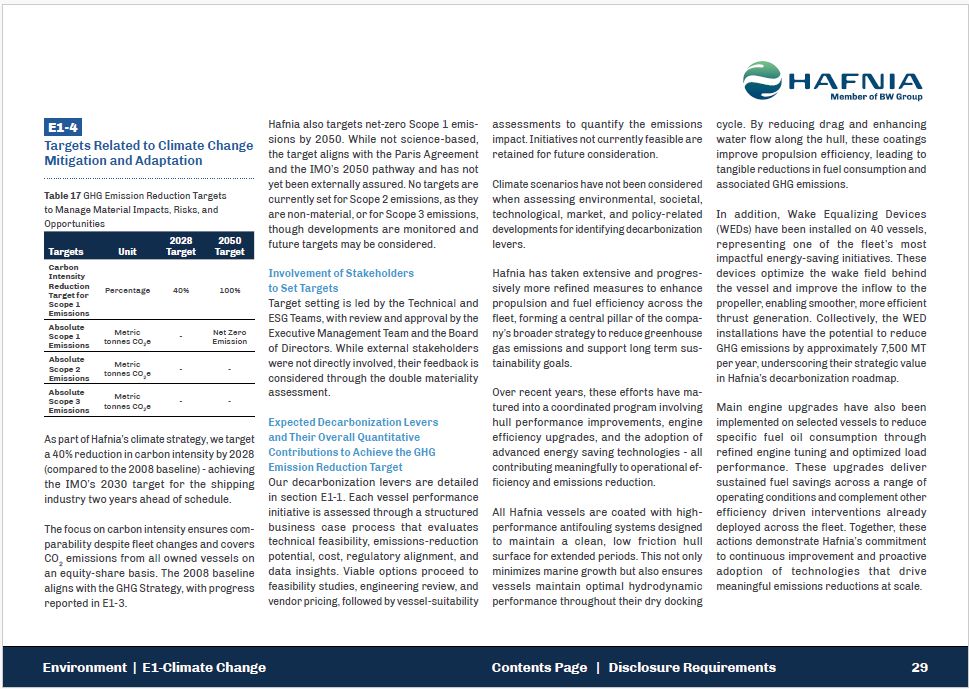
E1-4 Targets Related to Climate Change Mitigation and Adaptation Table 17 GHG
Emission Reduction Targets to Manage Material Impacts, Risks, and Opportunities Targets Unit Environment | E1-Climate Change 29 Contents Page | Disclosure Requirements 2028 2050 Target Target Carbon Intensity Reduction Target for Scope 1
Emissions Percentage 40% 100% Absolute Scope 1 Emissions 2 Metric tonnes CO e - Net Zero Emission Absolute Scope 2 Emissions 2 Metric tonnes CO e - - Absolute Scope 3 Emissions 2 Metric tonnes CO e - - As part of Hafnia’s
climate strategy, we target a 40% reduction in carbon intensity by 2028 (compared to the 2008 baseline) - achieving the IMO’s 2030 target for the shipping industry two years ahead of schedule. The focus on carbon intensity ensures
com-parability despite fleet changes and covers CO emissions from all owned vessels on 2 an equity-share basis. The 2008 baseline aligns with the GHG Strategy, with progress reported in E1-3. Hafnia also targets net-zero Scope 1 emis-sions
by 2050. While not science-based, the target aligns with the Paris Agreement and the IMO’s 2050 pathway and has not yet been externally assured. No targets are currently set for Scope 2 emissions, as they are non-material, or for Scope 3
emissions, though developments are monitored and future targets may be considered. Involvement of Stakeholders to Set Targets Target setting is led by the Technical and ESG Teams, with review and approval by the Executive Management Team and
the Board of Directors. While external stakeholders were not directly involved, their feedback is considered through the double materiality assessment. Expected Decarbonization Levers and Their Overall Quantitative Contributions to Achieve the
GHG Emission Reduction Target Our decarbonization levers are detailed in section E1-1. Each vessel performance initiative is assessed through a structured business case process that evaluates technical feasibility, emissions-reduction
potential, cost, regulatory alignment, and data insights. Viable options proceed to feasibility studies, engineering review, and vendor pricing, followed by vessel-suitability assessments to quantify the emissions impact. Initiatives not
currently feasible are retained for future consideration. Climate scenarios have not been considered when assessing environmental, societal, technological, market, and policy-related developments for identifying decarbonization levers. Hafnia
has taken extensive and progres-sively more refined measures to enhance propulsion and fuel efficiency across the fleet, forming a central pillar of the compa-ny’s broader strategy to reduce greenhouse gas emissions and support long term
sus-tainability goals. Over recent years, these efforts have ma-tured into a coordinated program involving hull performance improvements, engine efficiency upgrades, and the adoption of advanced energy saving technologies - all contributing
meaningfully to operational ef-ficiency and emissions reduction. All Hafnia vessels are coated with high-performance antifouling systems designed to maintain a clean, low friction hull surface for extended periods. This not only minimizes
marine growth but also ensures vessels maintain optimal hydrodynamic performance throughout their dry docking cycle. By reducing drag and enhancing water flow along the hull, these coatings improve propulsion efficiency, leading to tangible
reductions in fuel consumption and associated GHG emissions. In addition, Wake Equalizing Devices (WEDs) have been installed on 40 vessels, representing one of the fleet’s most impactful energy-saving initiatives. These devices optimize the
wake field behind the vessel and improve the inflow to the propeller, enabling smoother, more efficient thrust generation. Collectively, the WED installations have the potential to reduce GHG emissions by approximately 7,500 MT per year,
underscoring their strategic value in Hafnia’s decarbonization roadmap. Main engine upgrades have also been implemented on selected vessels to reduce specific fuel oil consumption through refined engine tuning and optimized load performance.
These upgrades deliver sustained fuel savings across a range of operating conditions and complement other efficiency driven interventions already deployed across the fleet. Together, these actions demonstrate Hafnia’s commitment to continuous
improvement and proactive adoption of technologies that drive meaningful emissions reductions at scale.
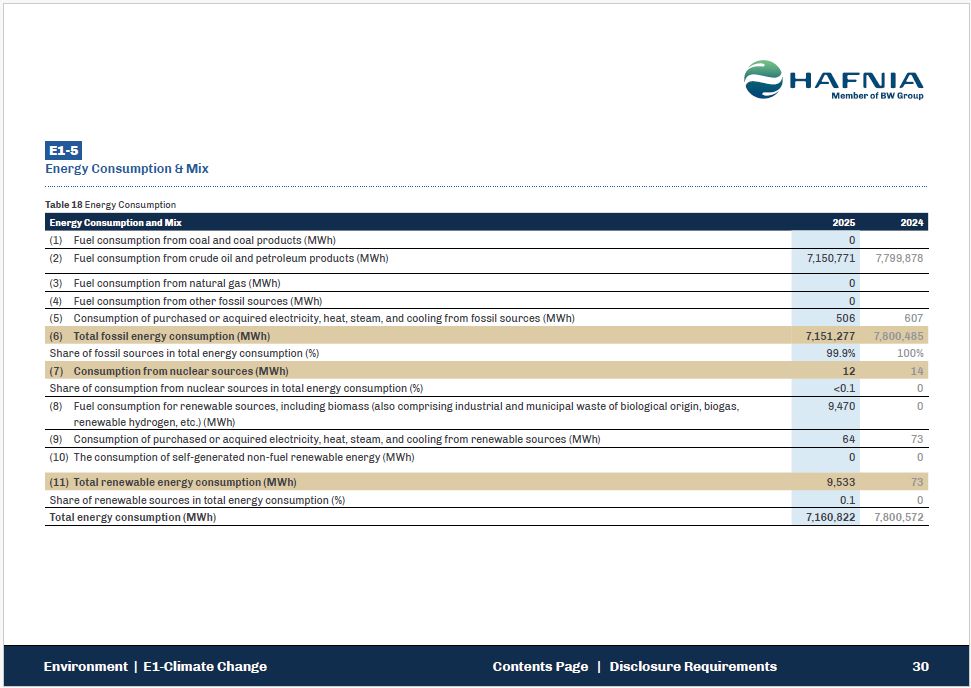
E1-5 Environment | E1-Climate Change 30 Contents Page | Disclosure
Requirements Energy Consumption & Mix Table 18 Energy Consumption Energy Consumption and Mix 2025 2024 (1) Fuel consumption from coal and coal products (MWh) 0 (2) Fuel consumption from crude oil and petroleum products
(MWh) 7,150,771 7,799,878 (3) Fuel consumption from natural gas (MWh) 0 (4) Fuel consumption from other fossil sources (MWh) 0 (5) Consumption of purchased or acquired electricity, heat, steam, and cooling from fossil sources
(MWh) 506 607 (6) Total fossil energy consumption (MWh) 7,151,277 7,800,485 Share of fossil sources in total energy consumption (%) 99.9% 100% (7) Consumption from nuclear sources (MWh) 12 14 Share of consumption from nuclear
sources in total energy consumption (%) <0.1 0 (8) Fuel consumption for renewable sources, including biomass (also comprising industrial and municipal waste of biological origin, biogas, renewable hydrogen, etc.) (MWh) 9,470 0 (9)
Consumption of purchased or acquired electricity, heat, steam, and cooling from renewable sources (MWh) 64 73 (10) The consumption of self-generated non-fuel renewable energy (MWh) 0 0 (11) Total renewable energy consumption
(MWh) 9,533 73 Share of renewable sources in total energy consumption (%) 0.1 0 Total energy consumption (MWh) 7,160,822 7,800,572
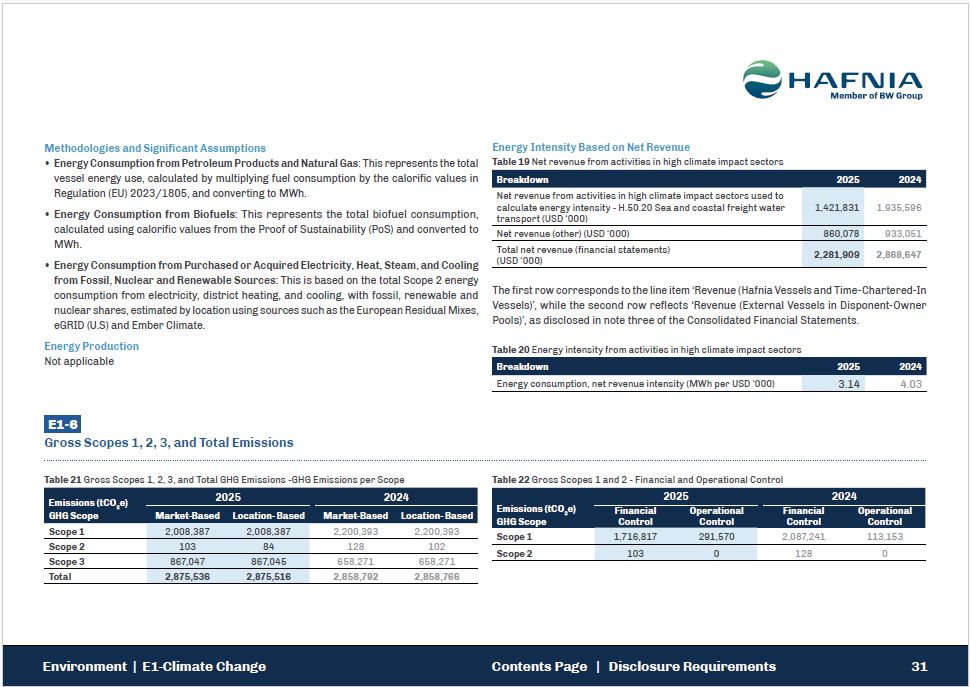
Methodologies and Significant Assumptions Energy Consumption from Petroleum
Products and Natural Gas: This represents the total vessel energy use, calculated by multiplying fuel consumption by the calorific values in Regulation (EU) 2023/1805, and converting to MWh. Energy Consumption from Biofuels: This represents
the total biofuel consumption, calculated using calorific values from the Proof of Sustainability (PoS) and converted to MWh. Energy Consumption from Purchased or Acquired Electricity, Heat, Steam, and Cooling from Fossil, Nuclear and
Renewable Sources: This is based on the total Scope 2 energy consumption from electricity, district heating, and cooling, with fossil, renewable and nuclear shares, estimated by location using sources such as the European Residual Mixes, eGRID
(U.S) and Ember Climate. Energy Production Not applicable Energy Intensity Based on Net Revenue Table 19 Net revenue from activities in high climate impact sectors Breakdown 2025 2024 Net revenue from activities in high climate impact
sectors used to calculate energy intensity - H.50.20 Sea and coastal freight water transport (USD ‘000) 1,421,831 1,935,596 Net revenue (other) (USD ‘000) 860,078 933,051 Total net revenue (financial statements) (USD
‘000) 2,281,909 2,868,647 The first row corresponds to the line item ‘Revenue (Hafnia Vessels and Time-Chartered-In Vessels)’, while the second row reflects ‘Revenue (External Vessels in Disponent-Owner Pools)’, as disclosed in note three of
the Consolidated Financial Statements. Table 20 Energy intensity from activities in high climate impact sectors Breakdown 2025 2024 Energy consumption, net revenue intensity (MWh per USD ‘000) 3.14 4.03 E1-6 Environment | E1-Climate
Change 31 Contents Page | Disclosure Requirements Gross Scopes 1, 2, 3, and Total Emissions Table 21 Gross Scopes 1, 2, 3, and Total GHG Emissions -GHG Emissions per Scope Emissions (tCO2e) GHG Scope 2025 Market-Based Location-
Based 2024 Market-Based Location- Based Scope 1 2,008,387 2,008,387 2,200,393 2,200,393 Scope 2 103 84 128 102 Scope 3 867,047 867,045 658,271 658,271 Total 2,875,536 2,875,516 2,858,792 2,858,766 Table 22 Gross Scopes 1
and 2 - Financial and Operational Control Emissions (tCO2e) GHG Scope Financial Control 2025 Operational Control Financial Control 2024 Operational Control Scope 1 1,716,817 291,570 2,087,241 113,153 Scope 2 103 0 128 0
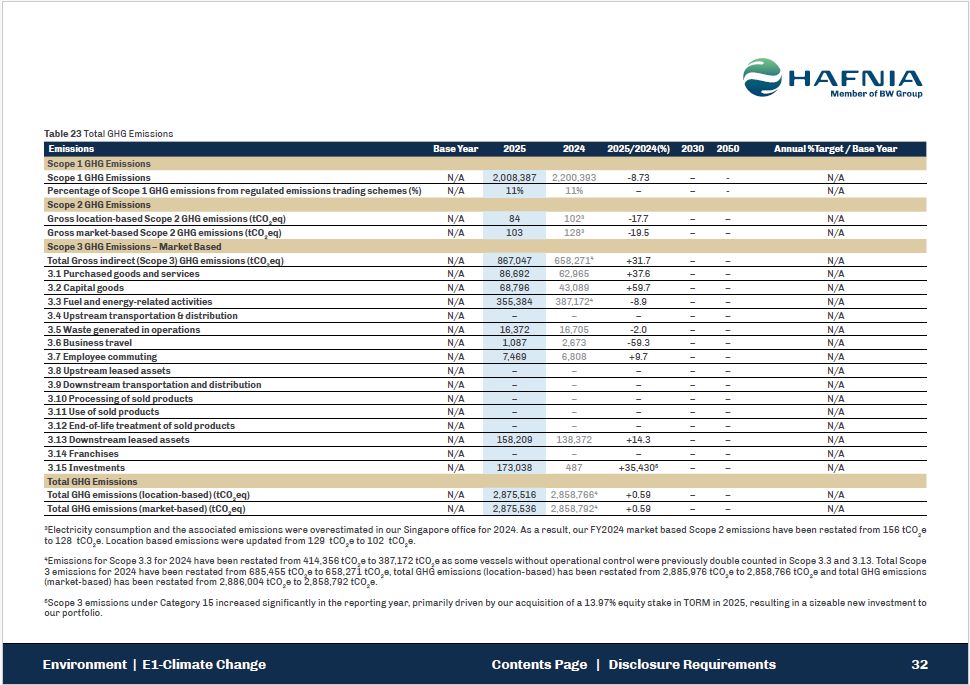
Table 23 Total GHG Emissions Environment | E1-Climate Change 32 Contents Page |
Disclosure Requirements Emissions Base Year 2025 2024 2025/2024(%) 2030 2050 Annual %Target / Base Year Scope 1 GHG Emissions Scope 1 GHG Emissions N/A 2,008,387 2,200,393 -8.73 – - N/A Percentage of Scope 1 GHG emissions from
regulated emissions trading schemes (%) N/A 11% 11% – – - N/A Scope 2 GHG Emissions Gross location-based Scope 2 GHG emissions (tCO2eq) N/A 84 1023 -17.7 – – N/A Gross market-based Scope 2 GHG emissions
(tCO2eq) N/A 103 1283 -19.5 – – N/A Scope 3 GHG Emissions – Market Based Total Gross indirect (Scope 3) GHG emissions (tCO2eq) N/A 867,047 658,2714 +31.7 – – N/A 3.1 Purchased goods and
services N/A 86,692 62,965 +37.6 – – N/A 3.2 Capital goods N/A 68,796 43,089 +59.7 – – N/A 3.3 Fuel and energy-related activities N/A 355,384 387,1724 -8.9 – – N/A 3.4 Upstream transportation &
distribution N/A – – – – – N/A 3.5 Waste generated in operations N/A 16,372 16,705 -2.0 – – N/A 3.6 Business travel N/A 1,087 2,673 -59.3 – – N/A 3.7 Employee commuting N/A 7,469 6,808 +9.7 – – N/A 3.8 Upstream
leased assets N/A – – – – – N/A 3.9 Downstream transportation and distribution N/A – – – – – N/A 3.10 Processing of sold products N/A – – – – – N/A 3.11 Use of sold products N/A – – – – – N/A 3.12 End-of-life
treatment of sold products N/A – – – – – N/A 3.13 Downstream leased assets N/A 158,209 138,372 +14.3 – – N/A 3.14 Franchises N/A – – – – – N/A 3.15 Investments N/A 173,038 487 +35,4305 – – N/A Total GHG
Emissions Total GHG emissions (location-based) (tCO2eq) N/A 2,875,516 2,858,7664 +0.59 – – N/A Total GHG emissions (market-based) (tCO2eq) N/A 2,875,536 2,858,7924 +0.59 – – N/A 3Electricity consumption and the associated
emissions were overestimated in our Singapore office for 2024. As a result, our FY2024 market based Scope 2 emissions have been restated from 156 tCO2e to 128 tCO2e. Location based emissions were updated from 129 tCO2e to 102 tCO2e. 4Emissions
for Scope 3.3 for 2024 have been restated from 414,356 tCO2e to 387,172 tCO2e as some vessels without operational control were previously double counted in Scope 3.3 and 3.13. Total Scope 3 emissions for 2024 have been restated from 685,455
tCO2e to 658,271 tCO2e, total GHG emissions (location-based) has been restated from 2,885,976 tCO2e to 2,858,766 tCO2e and total GHG emissions (market-based) has been restated from 2,886,004 tCO2e to 2,858,792 tCO2e. 5Scope 3 emissions under
Category 15 increased significantly in the reporting year, primarily driven by our acquisition of a 13.97% equity stake in TORM in 2025, resulting in a sizeable new investment to our portfolio.
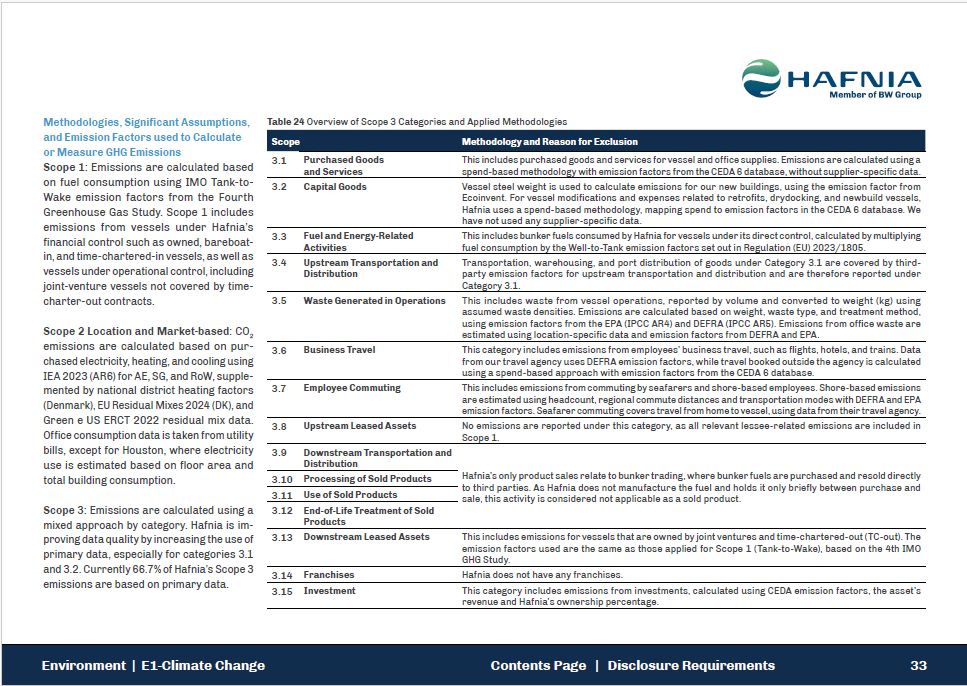
Methodologies, Significant Assumptions, and Emission Factors used to Calculate or
Measure GHG Emissions Scope 1: Emissions are calculated based on fuel consumption using IMO Tank-to-Wake emission factors from the Fourth Greenhouse Gas Study. Scope 1 includes emissions from vessels under Hafnia’s financial control such as
owned, bareboat-in, and time-chartered-in vessels, as well as vessels under operational control, including joint-venture vessels not covered by time-charter-out contracts. Scope 2 Location and Market-based: CO2 emissions are calculated based
on pur-chased electricity, heating, and cooling using IEA 2023 (AR6) for AE, SG, and RoW, supple-mented by national district heating factors (Denmark), EU Residual Mixes 2024 (DK), and Green e US ERCT 2022 residual mix data. Office consumption
data is taken from utility bills, except for Houston, where electricity use is estimated based on floor area and total building consumption. Scope 3: Emissions are calculated using a mixed approach by category. Hafnia is im-proving data
quality by increasing the use of primary data, especially for categories 3.1 and 3.2. Currently 66.7% of Hafnia’s Scope 3 emissions are based on primary data. Table 24 Overview of Scope 3 Categories and Applied
Methodologies Scope Methodology and Reason for Exclusion 3.1 Purchased Goods and Services This includes purchased goods and services for vessel and office supplies. Emissions are calculated using a spend-based methodology with emission
factors from the CEDA 6 database, without supplier-specific data. 3.2 Capital Goods Vessel steel weight is used to calculate emissions for our new buildings, using the emission factor from Ecoinvent. For vessel modifications and expenses
related to retrofits, drydocking, and newbuild vessels, Hafnia uses a spend-based methodology, mapping spend to emission factors in the CEDA 6 database. We have not used any supplier-specific data. 3.3 Fuel and Energy-Related
Activities This includes bunker fuels consumed by Hafnia for vessels under its direct control, calculated by multiplying fuel consumption by the Well-to-Tank emission factors set out in Regulation (EU) 2023/1805. 3.4 Upstream Transportation
and Distribution Transportation, warehousing, and port distribution of goods under Category 3.1 are covered by third-party emission factors for upstream transportation and distribution and are therefore reported under Category
3.1. 3.5 Waste Generated in Operations This includes waste from vessel operations, reported by volume and converted to weight (kg) using assumed waste densities. Emissions are calculated based on weight, waste type, and treatment
method, using emission factors from the EPA (IPCC AR4) and DEFRA (IPCC AR5). Emissions from office waste are estimated using location-specific data and emission factors from DEFRA and EPA. 3.6 Business Travel This category includes
emissions from employees’ business travel, such as flights, hotels, and trains. Data from our travel agency uses DEFRA emission factors, while travel booked outside the agency is calculated using a spend-based approach with emission factors
from the CEDA 6 database. 3.7 Employee Commuting This includes emissions from commuting by seafarers and shore-based employees. Shore-based emissions are estimated using headcount, regional commute distances and transportation modes with
DEFRA and EPA emission factors. Seafarer commuting covers travel from home to vessel, using data from their travel agency. 3.8 Upstream Leased Assets No emissions are reported under this category, as all relevant lessee-related emissions
are included in Scope 1. 3.9 Downstream Transportation and Distribution Environment | E1-Climate Change 33 Contents Page | Disclosure Requirements to third parties. As Hafnia does not manufacture the fuel and holds it only briefly
between purchase and 3.10 Processing of Sold Products Hafnia’s only product sales relate to bunker trading, where bunker fuels are purchased and resold directly 3.11 Use of Sold Products sale, this activity is considered not applicable as a
sold product. 3.12 End-of-Life Treatment of Sold Products 3.13 Downstream Leased Assets This includes emissions for vessels that are owned by joint ventures and time-chartered-out (TC-out). The emission factors used are the same as those
applied for Scope 1 (Tank-to-Wake), based on the 4th IMO GHG Study. 3.14 Franchises Hafnia does not have any franchises. 3.15 Investment This category includes emissions from investments, calculated using CEDA emission factors, the asset’s
revenue and Hafnia’s ownership percentage.
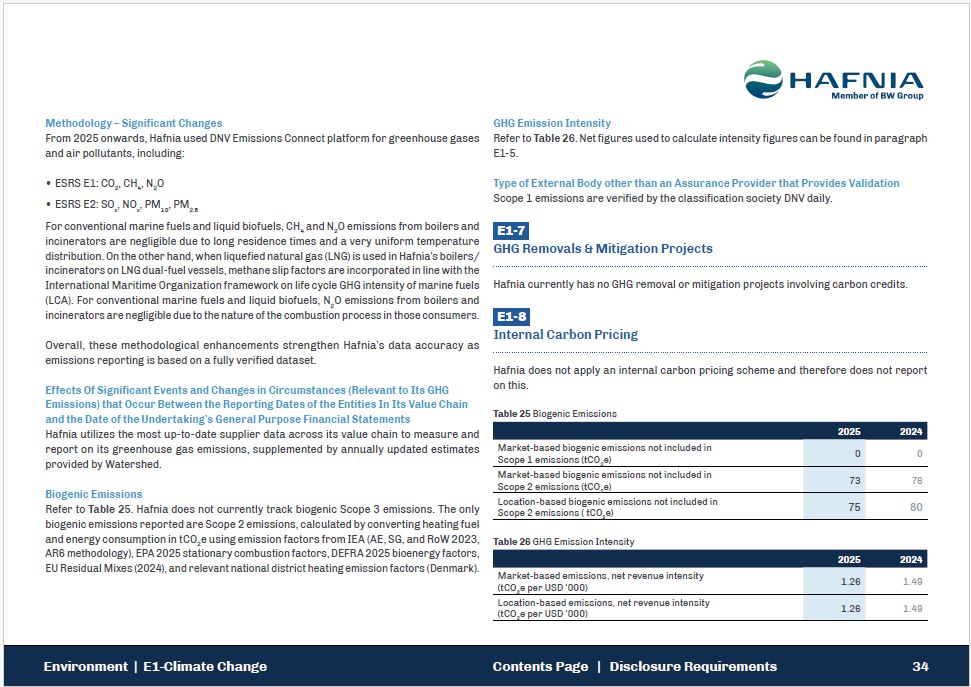
Methodology – Significant Changes From 2025 onwards, Hafnia used DNV Emissions
Connect platform for greenhouse gases and air pollutants, including: ESRS E1: CO2, CH4, N2O ESRS E2: SOx, NOx, PM10, PM2.5 For conventional marine fuels and liquid biofuels, CH4 and N2O emissions from boilers and incinerators are negligible
due to long residence times and a very uniform temperature distribution. On the other hand, when liquefied natural gas (LNG) is used in Hafnia’s boilers/ incinerators on LNG dual-fuel vessels, methane slip factors are incorporated in line with
the International Maritime Organization framework on life cycle GHG intensity of marine fuels (LCA). For conventional marine fuels and liquid biofuels, N2O emissions from boilers and incinerators are negligible due to the nature of the
combustion process in those consumers. Overall, these methodological enhancements strengthen Hafnia’s data accuracy as emissions reporting is based on a fully verified dataset. Effects Of Significant Events and Changes in Circumstances
(Relevant to Its GHG Emissions) that Occur Between the Reporting Dates of the Entities In Its Value Chain and the Date of the Undertaking’s General Purpose Financial Statements Hafnia utilizes the most up-to-date supplier data across its value
chain to measure and report on its greenhouse gas emissions, supplemented by annually updated estimates provided by Watershed. Biogenic Emissions Refer to Table 25. Hafnia does not currently track biogenic Scope 3 emissions. The only biogenic
emissions reported are Scope 2 emissions, calculated by converting heating fuel and energy consumption in tCO2e using emission factors from IEA (AE, SG, and RoW 2023, AR6 methodology), EPA 2025 stationary combustion factors, DEFRA 2025
bioenergy factors, EU Residual Mixes (2024), and relevant national district heating emission factors (Denmark). GHG Emission Intensity Refer to Table 26. Net figures used to calculate intensity figures can be found in paragraph
E1-5. Environment | E1-Climate Change 34 Contents Page | Disclosure Requirements Type of External Body other than an Assurance Provider that Provides Validation Scope 1 emissions are verified by the classification society DNV
daily. E1-7 GHG Removals & Mitigation Projects Hafnia currently has no GHG removal or mitigation projects involving carbon credits. E1-8 Internal Carbon Pricing Hafnia does not apply an internal carbon pricing scheme and therefore
does not report on this. Table 25 Biogenic Emissions 2025 2024 Market-based biogenic emissions not included in Scope 1 emissions (tCO2e) 0 0 Market-based biogenic emissions not included in Scope 2 emissions
(tCO2e) 73 76 Location-based biogenic emissions not included in Scope 2 emissions ( tCO2e) 75 80 Table 26 GHG Emission Intensity 2025 2024 Market-based emissions, net revenue intensity (tCO2e per USD ‘000) 1.26 1.49 Location-based
emissions, net revenue intensity (tCO2e per USD ‘000) 1.26 1.49
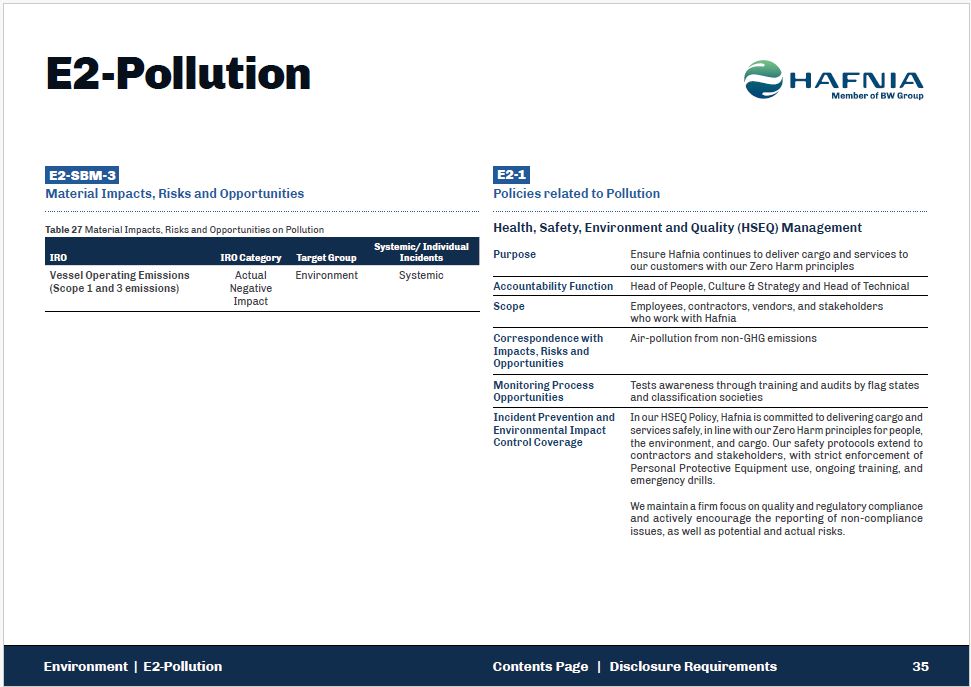
E2-Pollution E2-SBM-3 Material Impacts, Risks and Opportunities Table 27
Material Impacts, Risks and Opportunities on Pollution IRO Systemic/ Individual IRO Category Target Group Incidents Vessel Operating Emissions (Scope 1 and 3 emissions) Actual Negative Impact Environment Systemic E2-1 Policies related to
Pollution Health, Safety, Environment and Quality (HSEQ) Management Purpose Environment | E2-Pollution 35 Contents Page | Disclosure Requirements Ensure Hafnia continues to deliver cargo and services to our customers with our Zero Harm
principles Accountability Function Head of People, Culture & Strategy and Head of Technical Scope Employees, contractors, vendors, and stakeholders who work with Hafnia Correspondence with Impacts, Risks and
Opportunities Air-pollution from non-GHG emissions Monitoring Process Opportunities Tests awareness through training and audits by flag states and classification societies Incident Prevention and Environmental Impact Control Coverage In
our HSEQ Policy, Hafnia is committed to delivering cargo and services safely, in line with our Zero Harm principles for people, the environment, and cargo. Our safety protocols extend to contractors and stakeholders, with strict enforcement of
Personal Protective Equipment use, ongoing training, and emergency drills. We maintain a firm focus on quality and regulatory compliance and actively encourage the reporting of non-compliance issues, as well as potential and actual risks.
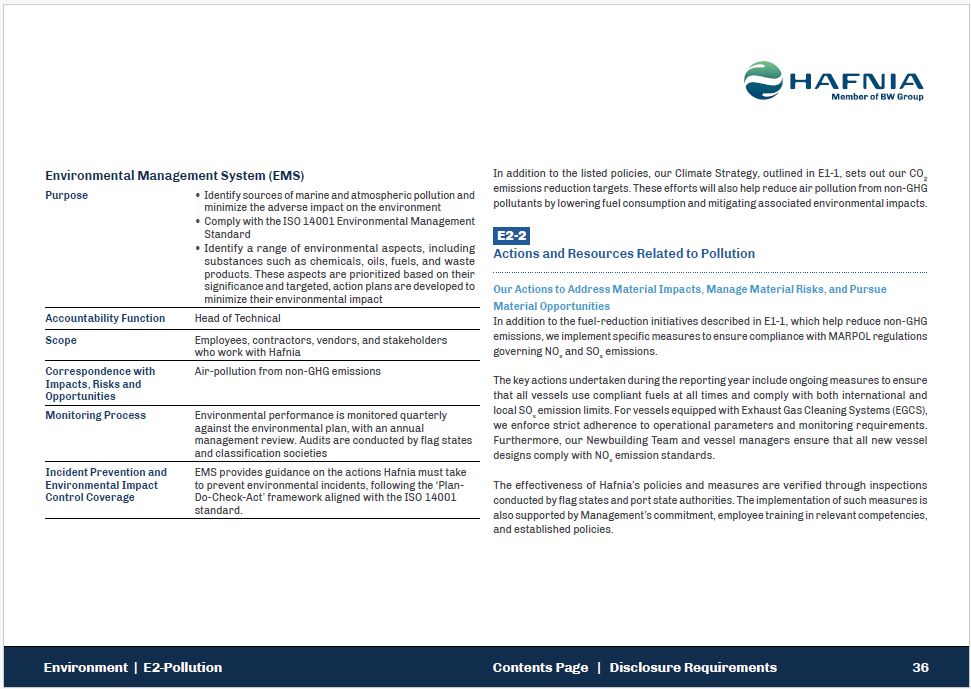
In addition to the listed policies, our Climate Strategy, outlined in E1-1, sets
out our CO2 emissions reduction targets. These efforts will also help reduce air pollution from non-GHG pollutants by lowering fuel consumption and mitigating associated environmental impacts. E2-2 Actions and Resources Related to
Pollution Our Actions to Address Material Impacts, Manage Material Risks, and Pursue Material Opportunities In addition to the fuel-reduction initiatives described in E1-1, which help reduce non-GHG emissions, we implement specific measures
to ensure compliance with MARPOL regulations governing NOx and SOx emissions. The key actions undertaken during the reporting year include ongoing measures to ensure that all vessels use compliant fuels at all times and comply with both
international and local SOx emission limits. For vessels equipped with Exhaust Gas Cleaning Systems (EGCS), we enforce strict adherence to operational parameters and monitoring requirements. Furthermore, our Newbuilding Team and vessel managers
ensure that all new vessel designs comply with NOx emission standards. The effectiveness of Hafnia’s policies and measures are verified through inspections conducted by flag states and port state authorities. The implementation of such
measures is also supported by Management’s commitment, employee training in relevant competencies, and established policies. Environmental Management System (EMS) Purpose Environment | E2-Pollution 36 Contents Page | Disclosure
Requirements Identify sources of marine and atmospheric pollution and minimize the adverse impact on the environment Comply with the ISO 14001 Environmental Management Standard Identify a range of environmental aspects, including substances
such as chemicals, oils, fuels, and waste products. These aspects are prioritized based on their significance and targeted, action plans are developed to minimize their environmental impact Accountability Function Head of
Technical Scope Employees, contractors, vendors, and stakeholders who work with Hafnia Correspondence with Impacts, Risks and Opportunities Air-pollution from non-GHG emissions Monitoring Process Environmental performance is monitored
quarterly against the environmental plan, with an annual management review. Audits are conducted by flag states and classification societies Incident Prevention and Environmental Impact Control Coverage EMS provides guidance on the actions
Hafnia must take to prevent environmental incidents, following the ‘Plan-Do-Check-Act’ framework aligned with the ISO 14001 standard.
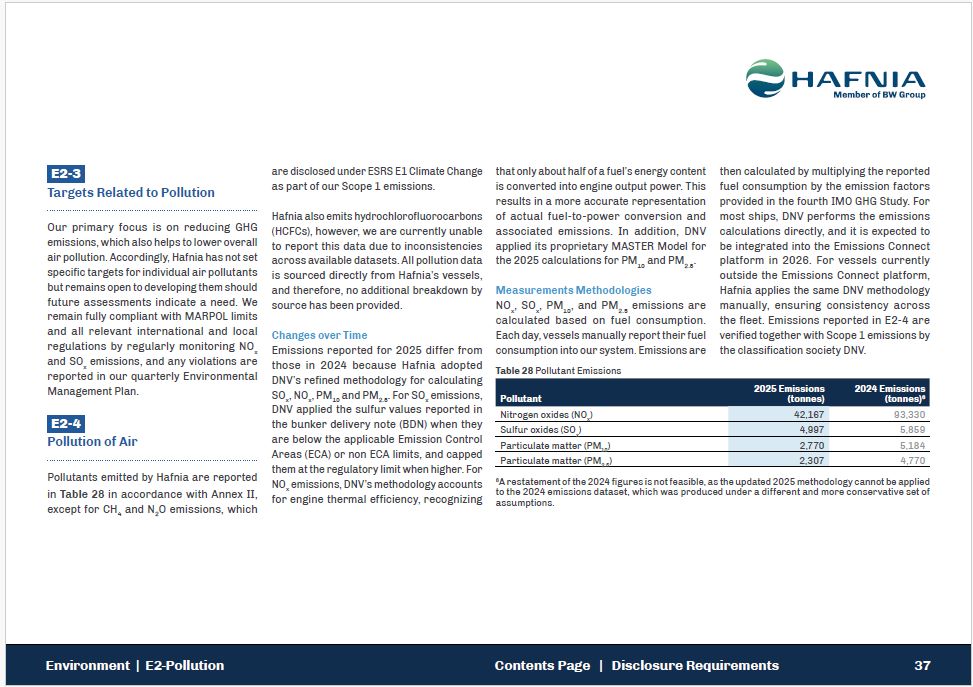
E2-3 Environment | E2-Pollution 37 Contents Page | Disclosure
Requirements Targets Related to Pollution Our primary focus is on reducing GHG emissions, which also helps to lower overall air pollution. Accordingly, Hafnia has not set specific targets for individual air pollutants but remains open to
developing them should future assessments indicate a need. We remain fully compliant with MARPOL limits and all relevant international and local regulations by regularly monitoring NOx and SOx emissions, and any violations are reported in our
quarterly Environmental Management Plan. E2-4 Pollution of Air Pollutants emitted by Hafnia are reported in Table 28 in accordance with Annex II, except for CH4 and N2O emissions, which are disclosed under ESRS E1 Climate Change as part of
our Scope 1 emissions. Hafnia also emits hydrochlorofluorocarbons (HCFCs), however, we are currently unable to report this data due to inconsistencies across available datasets. All pollution data is sourced directly from Hafnia’s vessels, and
therefore, no additional breakdown by source has been provided. Changes over Time Emissions reported for 2025 differ from those in 2024 because Hafnia adopted DNV’s refined methodology for calculating x x 10 2.5 x SO , NO , PM and PM . For
SO emissions, DNV applied the sulfur values reported in the bunker delivery note (BDN) when they are below the applicable Emission Control Areas (ECA) or non ECA limits, and capped them at the regulatory limit when higher. For NO emissions,
DNV’s methodology accounts x for engine thermal efficiency, recognizing that only about half of a fuel’s energy content is converted into engine output power. This results in a more accurate representation of actual fuel-to-power conversion
and associated emissions. In addition, DNV applied its proprietary MASTER Model for the 2025 calculations for PM10 and PM2.5. Measurements Methodologies x x 10 2.5 NO , SO , PM , and PM emissions are calculated based on fuel consumption.
Each day, vessels manually report their fuel consumption into our system. Emissions are Table 28 Pollutant Emissions then calculated by multiplying the reported fuel consumption by the emission factors provided in the fourth IMO GHG Study.
For most ships, DNV performs the emissions calculations directly, and it is expected to be integrated into the Emissions Connect platform in 2026. For vessels currently outside the Emissions Connect platform, Hafnia applies the same DNV
methodology manually, ensuring consistency across the fleet. Emissions reported in E2-4 are verified together with Scope 1 emissions by the classification society DNV. 6A restatement of the 2024 figures is not feasible, as the updated 2025
methodology cannot be applied to the 2024 emissions dataset, which was produced under a different and more conservative set of assumptions. Pollutant 2025 Emissions (tonnes) 2024 Emissions (tonnes)6 Nitrogen oxides
(NOx) 42,167 93,330 Sulfur oxides (SOx) 4,997 5,859 Particulate matter (PM10) 2,770 5,184 Particulate matter (PM2.5) 2,307 4,770
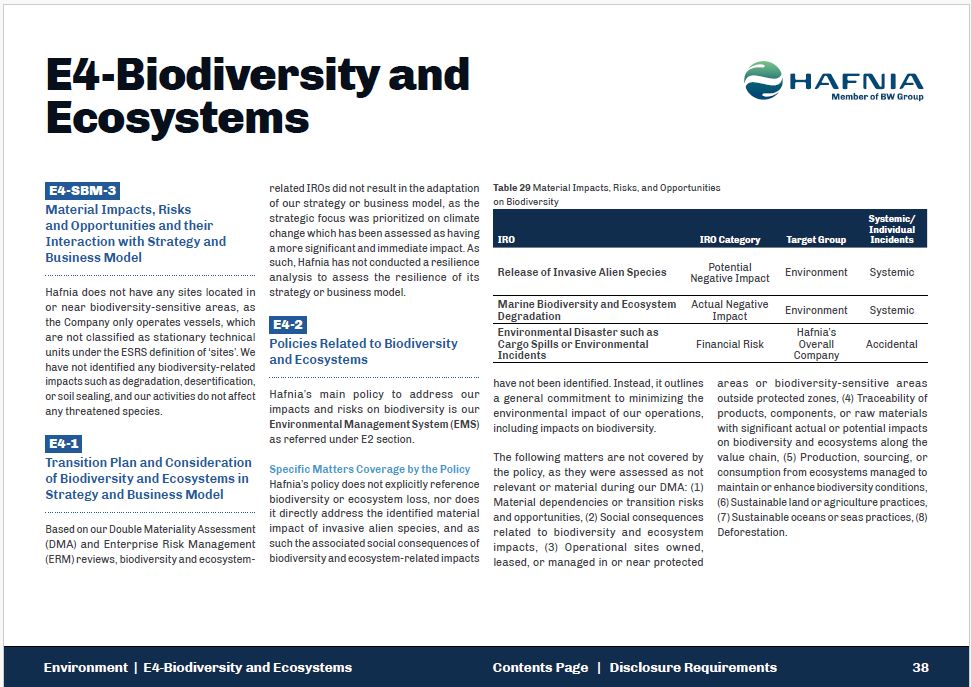
E4-Biodiversity and Ecosystems E4-SBM-3 Material Impacts, Risks and
Opportunities and their Interaction with Strategy and Business Model Hafnia does not have any sites located in or near biodiversity-sensitive areas, as the Company only operates vessels, which are not classified as stationary technical units
under the ESRS definition of ‘sites’. We have not identified any biodiversity-related impacts such as degradation, desertification, or soil sealing, and our activities do not affect any threatened species. E4-1 Transition Plan and
Consideration of Biodiversity and Ecosystems in Strategy and Business Model Based on our Double Materiality Assessment (DMA) and Enterprise Risk Management (ERM) reviews, biodiversity and ecosystem- related IROs did not result in the
adaptation of our strategy or business model, as the strategic focus was prioritized on climate change which has been assessed as having a more significant and immediate impact. As such, Hafnia has not conducted a resilience analysis to assess
the resilience of its strategy or business model. E4-2 Policies Related to Biodiversity and Ecosystems Hafnia’s main policy to address our impacts and risks on biodiversity is our Environmental Management System (EMS) as referred under E2
section. Specific Matters Coverage by the Policy Hafnia’s policy does not explicitly reference biodiversity or ecosystem loss, nor does it directly address the identified material impact of invasive alien species, and as such the associated
social consequences of biodiversity and ecosystem-related impacts Table 29 Material Impacts, Risks, and Opportunities on Biodiversity IRO Environment | E4-Biodiversity and Ecosystems 38 Contents Page | Disclosure Requirements IRO
Category Systemic/ Individual Target Group Incidents Release of Invasive Alien Species Potential Negative Impact Environment Systemic Marine Biodiversity and Ecosystem Degradation Actual Negative
Impact Environment Systemic Environmental Disaster such as Cargo Spills or Environmental Incidents Financial Risk Hafnia’s Overall Company Accidental have not been identified. Instead, it outlines a general commitment to minimizing the
environmental impact of our operations, including impacts on biodiversity. The following matters are not covered by the policy, as they were assessed as not relevant or material during our DMA: (1) Material dependencies or transition risks and
opportunities, (2) Social consequences related to biodiversity and ecosystem impacts, (3) Operational sites owned, leased, or managed in or near protected areas or biodiversity-sensitive areas outside protected zones, (4) Traceability of
products, components, or raw materials with significant actual or potential impacts on biodiversity and ecosystems along the value chain, (5) Production, sourcing, or consumption from ecosystems managed to maintain or enhance biodiversity
conditions, (6) Sustainable land or agriculture practices, (7) Sustainable oceans or seas practices, (8) Deforestation.
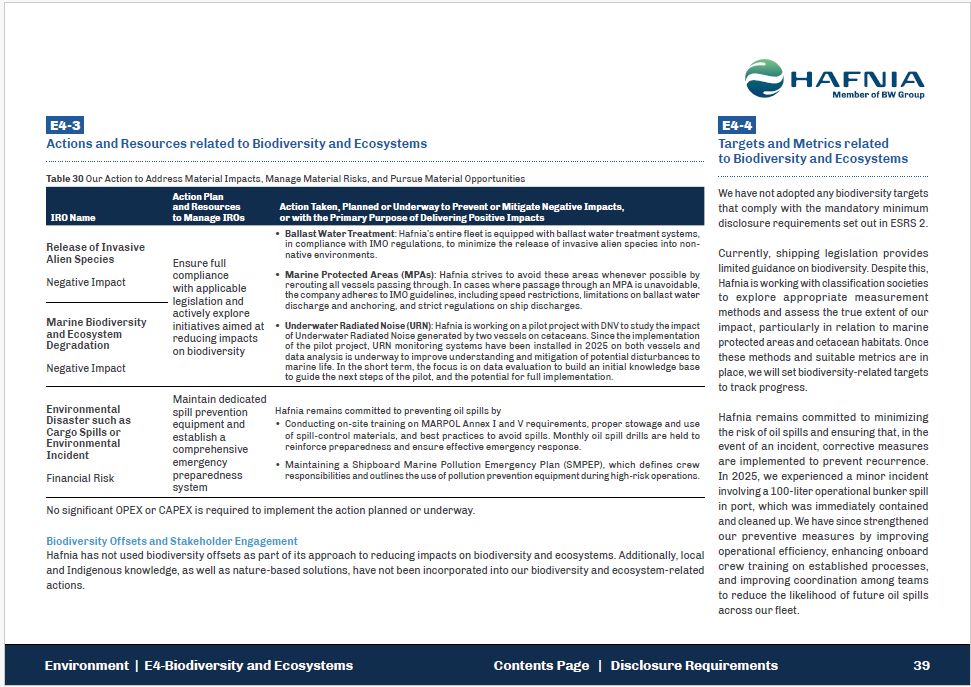
E4-3 Actions and Resources related to Biodiversity and Ecosystems Table 30 Our
Action to Address Material Impacts, Manage Material Risks, and Pursue Material Opportunities IRO Name Action Plan and Resources to Manage IROs Action Taken, Planned or Underway to Prevent or Mitigate Negative Impacts, or with the Primary
Purpose of Delivering Positive Impacts Release of Invasive Alien Species Negative Impact Ensure full compliance with applicable legislation and actively explore initiatives aimed at reducing impacts on biodiversity Ballast Water Treatment:
Hafnia’s entire fleet is equipped with ballast water treatment systems, in compliance with IMO regulations, to minimize the release of invasive alien species into non- native environments. Marine Protected Areas (MPAs): Hafnia strives to avoid
these areas whenever possible by rerouting all vessels passing through. In cases where passage through an MPA is unavoidable, the company adheres to IMO guidelines, including speed restrictions, limitations on ballast water discharge and
anchoring, and strict regulations on ship discharges. Underwater Radiated Noise (URN): Hafnia is working on a pilot project with DNV to study the impact of Underwater Radiated Noise generated by two vessels on cetaceans. Since the
implementation of the pilot project, URN monitoring systems have been installed in 2025 on both vessels and data analysis is underway to improve understanding and mitigation of potential disturbances to marine life. In the short term, the focus
is on data evaluation to build an initial knowledge base to guide the next steps of the pilot, and the potential for full implementation. Marine Biodiversity and Ecosystem Degradation Negative Impact Environmental Disaster such as Cargo
Spills or Environmental Incident Financial Risk Maintain dedicated spill prevention equipment and establish a comprehensive emergency preparedness system Hafnia remains committed to preventing oil spills by Conducting on-site training on
MARPOL Annex I and V requirements, proper stowage and use of spill-control materials, and best practices to avoid spills. Monthly oil spill drills are held to reinforce preparedness and ensure effective emergency response. Maintaining a
Shipboard Marine Pollution Emergency Plan (SMPEP), which defines crew responsibilities and outlines the use of pollution prevention equipment during high-risk operations. No significant OPEX or CAPEX is required to implement the action planned
or underway. Biodiversity Offsets and Stakeholder Engagement Hafnia has not used biodiversity offsets as part of its approach to reducing impacts on biodiversity and ecosystems. Additionally, local and Indigenous knowledge, as well as
nature-based solutions, have not been incorporated into our biodiversity and ecosystem-related actions. E4-4 Environment | E4-Biodiversity and Ecosystems 39 Contents Page | Disclosure Requirements Targets and Metrics related to
Biodiversity and Ecosystems We have not adopted any biodiversity targets that comply with the mandatory minimum disclosure requirements set out in ESRS 2. Currently, shipping legislation provides limited guidance on biodiversity. Despite
this, Hafnia is working with classification societies to explore appropriate measurement methods and assess the true extent of our impact, particularly in relation to marine protected areas and cetacean habitats. Once these methods and suitable
metrics are in place, we will set biodiversity-related targets to track progress. Hafnia remains committed to minimizing the risk of oil spills and ensuring that, in the event of an incident, corrective measures are implemented to prevent
recurrence. In 2025, we experienced a minor incident involving a 100-liter operational bunker spill in port, which was immediately contained and cleaned up. We have since strengthened our preventive measures by improving operational efficiency,
enhancing onboard crew training on established processes, and improving coordination among teams to reduce the likelihood of future oil spills across our fleet.
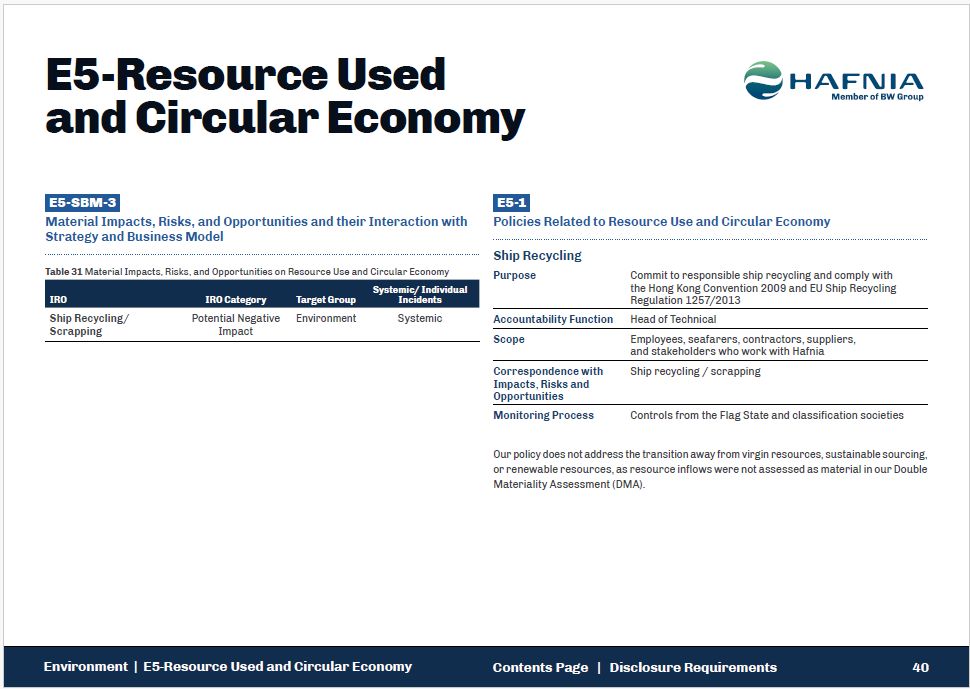
E5-Resource Used and Circular Economy E5-SBM-3 Material Impacts, Risks, and
Opportunities and their Interaction with Strategy and Business Model Table 31 Material Impacts, Risks, and Opportunities on Resource Use and Circular Economy IRO IRO Category Systemic/ Individual Target Group Incidents Environment
Systemic Ship Recycling/ Scrapping Potential Negative Impact E5-1 Policies Related to Resource Use and Circular Economy Ship Recycling Purpose Commit to responsible ship recycling and comply with the Hong Kong Convention 2009 and EU Ship
Recycling Regulation 1257/2013 Environment | E5-Resource Used and Circular Economy 40 Contents Page | Disclosure Requirements Accountability Function Head of Technical Scope Employees, seafarers, contractors, suppliers, and stakeholders
who work with Hafnia Correspondence with Impacts, Risks and Opportunities Ship recycling / scrapping Monitoring Process Controls from the Flag State and classification societies Our policy does not address the transition away from virgin
resources, sustainable sourcing, or renewable resources, as resource inflows were not assessed as material in our Double Materiality Assessment (DMA).
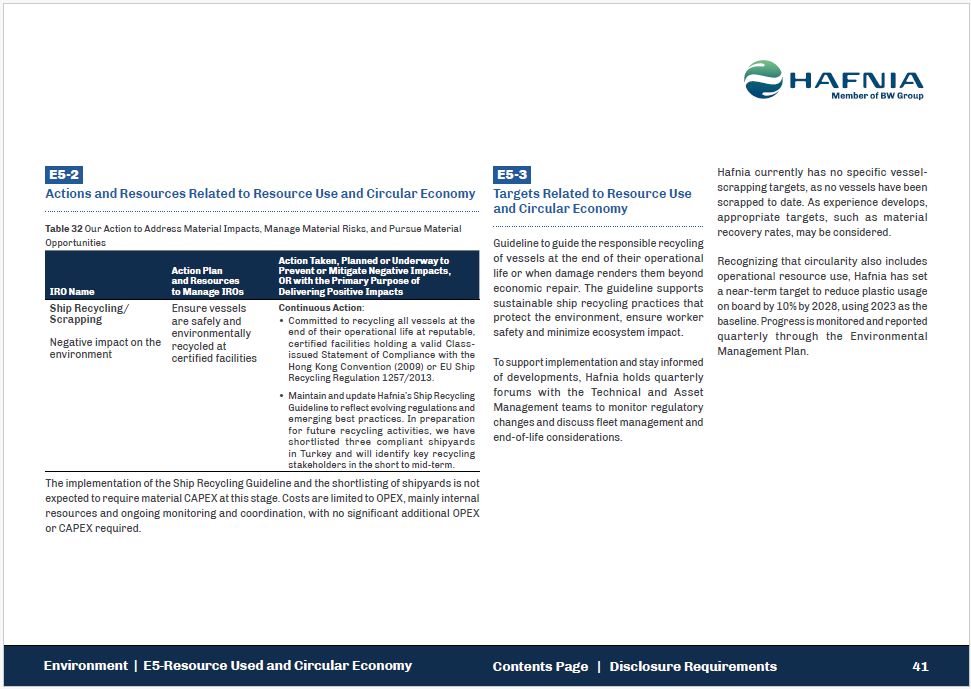
E5-3 Targets Related to Resource Use and Circular Economy Guideline to guide the
responsible recycling of vessels at the end of their operational life or when damage renders them beyond economic repair. The guideline supports sustainable ship recycling practices that protect the environment, ensure worker safety and
minimize ecosystem impact. To support implementation and stay informed of developments, Hafnia holds quarterly forums with the Technical and Asset Management teams to monitor regulatory changes and discuss fleet management and end-of-life
considerations. E5-2 Actions and Resources Related to Resource Use and Circular Economy Table 32 Our Action to Address Material Impacts, Manage Material Risks, and Pursue Material Opportunities IRO Name Environment | E5-Resource Used and
Circular Economy 41 Contents Page | Disclosure Requirements Action Plan and Resources to Manage IROs Action Taken, Planned or Underway to Prevent or Mitigate Negative Impacts, OR with the Primary Purpose of Delivering Positive
Impacts Ship Recycling/ Scrapping Negative impact on the environment Ensure vessels are safely and environmentally recycled at certified facilities Continuous Action: Committed to recycling all vessels at the end of their operational life
at reputable, certified facilities holding a valid Class- issued Statement of Compliance with the Hong Kong Convention (2009) or EU Ship Recycling Regulation 1257/2013. Maintain and update Hafnia’s Ship Recycling Guideline to reflect evolving
regulations and emerging best practices. In preparation for future recycling activities, we have shortlisted three compliant shipyards in Turkey and will identify key recycling stakeholders in the short to mid-term. The implementation of the
Ship Recycling Guideline and the shortlisting of shipyards is not expected to require material CAPEX at this stage. Costs are limited to OPEX, mainly internal resources and ongoing monitoring and coordination, with no significant additional
OPEX or CAPEX required. Hafnia currently has no specific vessel-scrapping targets, as no vessels have been scrapped to date. As experience develops, appropriate targets, such as material recovery rates, may be considered. Recognizing that
circularity also includes operational resource use, Hafnia has set a near-term target to reduce plastic usage on board by 10% by 2028, using 2023 as the baseline. Progress is monitored and reported quarterly through the Environmental Management
Plan.
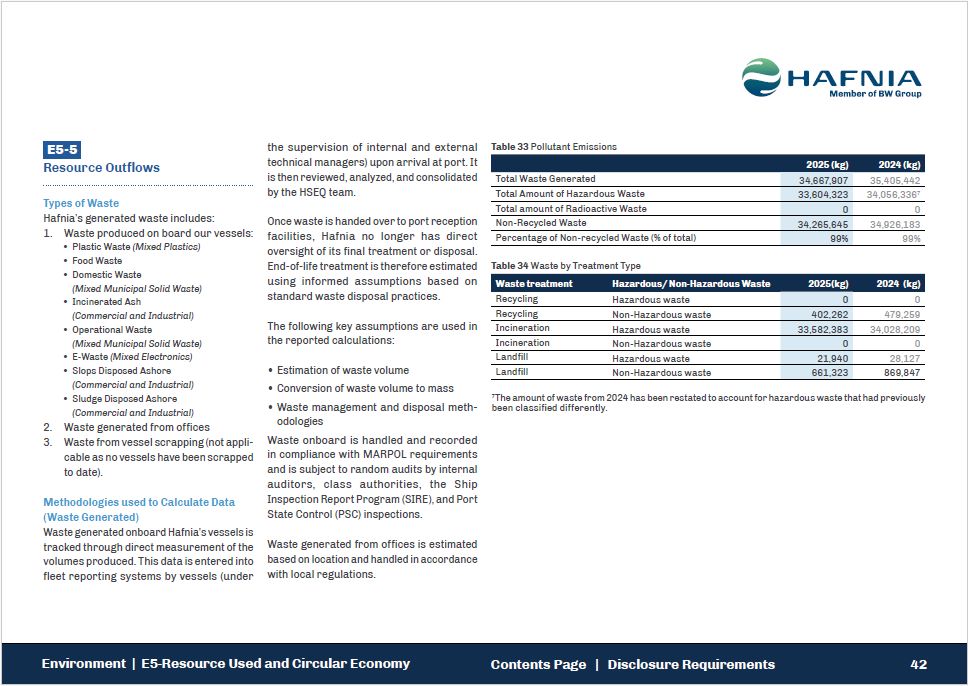
E5-5 Environment | E5-Resource Used and Circular Economy 42 Contents Page |
Disclosure Requirements Resource Outflows Types of Waste Hafnia’s generated waste includes: Waste produced on board our vessels: Plastic Waste (Mixed Plastics) Food Waste Domestic Waste (Mixed Municipal Solid Waste) Incinerated
Ash (Commercial and Industrial) Operational Waste (Mixed Municipal Solid Waste) E-Waste (Mixed Electronics) Slops Disposed Ashore (Commercial and Industrial) Sludge Disposed Ashore (Commercial and Industrial) Waste generated from
offices Waste from vessel scrapping (not appli-cable as no vessels have been scrapped to date). Methodologies used to Calculate Data (Waste Generated) Waste generated onboard Hafnia’s vessels is tracked through direct measurement of the
volumes produced. This data is entered into fleet reporting systems by vessels (under the supervision of internal and external technical managers) upon arrival at port. It is then reviewed, analyzed, and consolidated by the HSEQ team. Once
waste is handed over to port reception facilities, Hafnia no longer has direct oversight of its final treatment or disposal. End-of-life treatment is therefore estimated using informed assumptions based on standard waste disposal
practices. The following key assumptions are used in the reported calculations: Estimation of waste volume Conversion of waste volume to mass Waste management and disposal meth-odologies Waste onboard is handled and recorded in compliance
with MARPOL requirements and is subject to random audits by internal auditors, class authorities, the Ship Inspection Report Program (SIRE), and Port State Control (PSC) inspections. Waste generated from offices is estimated based on location
and handled in accordance with local regulations. 7The amount of waste from 2024 has been restated to account for hazardous waste that had previously been classified differently. Table 33 Pollutant Emissions 2025 (kg) 2024 (kg) Total Waste
Generated 34,667,907 35,405,442 Total Amount of Hazardous Waste 33,604,323 34,056,3367 Total amount of Radioactive Waste 0 0 Non-Recycled Waste 34,265,645 34,926,183 Percentage of Non-recycled Waste (% of total) 99% 99% Table 34
Waste by Treatment Type Waste treatment Hazardous/ Non-Hazardous Waste 2025(kg) 2024 (kg) Recycling Hazardous waste 0 0 Recycling Non-Hazardous waste 402,262 479,259 Incineration Hazardous
waste 33,582,383 34,028,209 Incineration Non-Hazardous waste 0 0 Landfill Hazardous waste 21,940 28,127 Landfill Non-Hazardous waste 661,323 869,847
Social Contents Page | Disclosure Requirements 43 General Disclosures |
Environment | Social | Governance | Limited Assurance Report
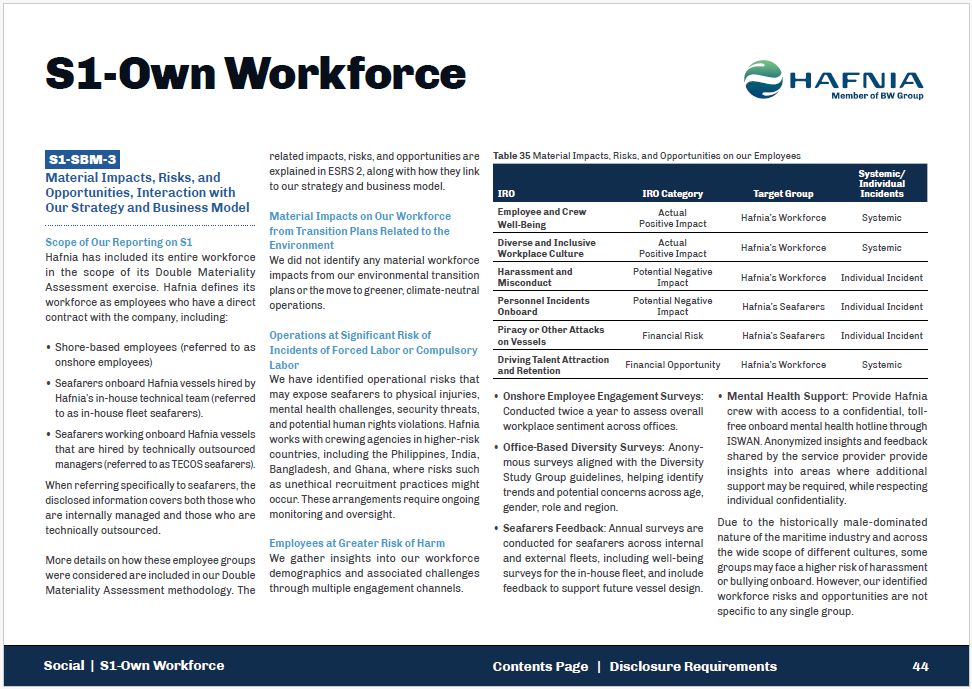
S1-Own Workforce S1-SBM-3 Material Impacts, Risks, and Opportunities,
Interaction with Our Strategy and Business Model Scope of Our Reporting on S1 Hafnia has included its entire workforce in the scope of its Double Materiality Assessment exercise. Hafnia defines its workforce as employees who have a direct
contract with the company, including: Shore-based employees (referred to as onshore employees) Seafarers onboard Hafnia vessels hired by Hafnia’s in-house technical team (referred to as in-house fleet seafarers). Seafarers working onboard
Hafnia vessels that are hired by technically outsourced managers (referred to as TECOS seafarers). When referring specifically to seafarers, the disclosed information covers both those who are internally managed and those who are technically
outsourced. More details on how these employee groups were considered are included in our Double Materiality Assessment methodology. The Table 35 Material Impacts, Risks, and Opportunities on our Employees IRO Social | S1-Own
Workforce 44 Contents Page | Disclosure Requirements IRO Category Target Group Systemic/ Individual Incidents Employee and Crew Well-Being Actual Positive Impact Hafnia’s Workforce Systemic Diverse and Inclusive Workplace
Culture Actual Positive Impact Hafnia’s Workforce Systemic Harassment and Misconduct Potential Negative Impact Hafnia’s Workforce Individual Incident Personnel Incidents Onboard Potential Negative Impact Hafnia’s Seafarers Individual
Incident Piracy or Other Attacks on Vessels Financial Risk Hafnia’s Seafarers Individual Incident Driving Talent Attraction and Retention Financial Opportunity Hafnia’s Workforce Systemic related impacts, risks, and opportunities are
explained in ESRS 2, along with how they link to our strategy and business model. Material Impacts on Our Workforce from Transition Plans Related to the Environment We did not identify any material workforce impacts from our environmental
transition plans or the move to greener, climate-neutral operations. Operations at Significant Risk of Incidents of Forced Labor or Compulsory Labor We have identified operational risks that may expose seafarers to physical injuries, mental
health challenges, security threats, and potential human rights violations. Hafnia works with crewing agencies in higher-risk countries, including the Philippines, India, Bangladesh, and Ghana, where risks such as unethical recruitment
practices might occur. These arrangements require ongoing monitoring and oversight. Employees at Greater Risk of Harm We gather insights into our workforce demographics and associated challenges through multiple engagement channels. Mental
Health Support: Provide Hafnia crew with access to a confidential, toll- free onboard mental health hotline through ISWAN. Anonymized insights and feedback shared by the service provider provide insights into areas where additional support may
be required, while respecting individual confidentiality. Due to the historically male-dominated nature of the maritime industry and across the wide scope of different cultures, some groups may face a higher risk of harassment or bullying
onboard. However, our identified workforce risks and opportunities are not specific to any single group. Onshore Employee Engagement Surveys: Conducted twice a year to assess overall workplace sentiment across offices. Office-Based Diversity
Surveys: Anony- mous surveys aligned with the Diversity Study Group guidelines, helping identify trends and potential concerns across age, gender, role and region. Seafarers Feedback: Annual surveys are conducted for seafarers across internal
and external fleets, including well-being surveys for the in-house fleet, and include feedback to support future vessel design.
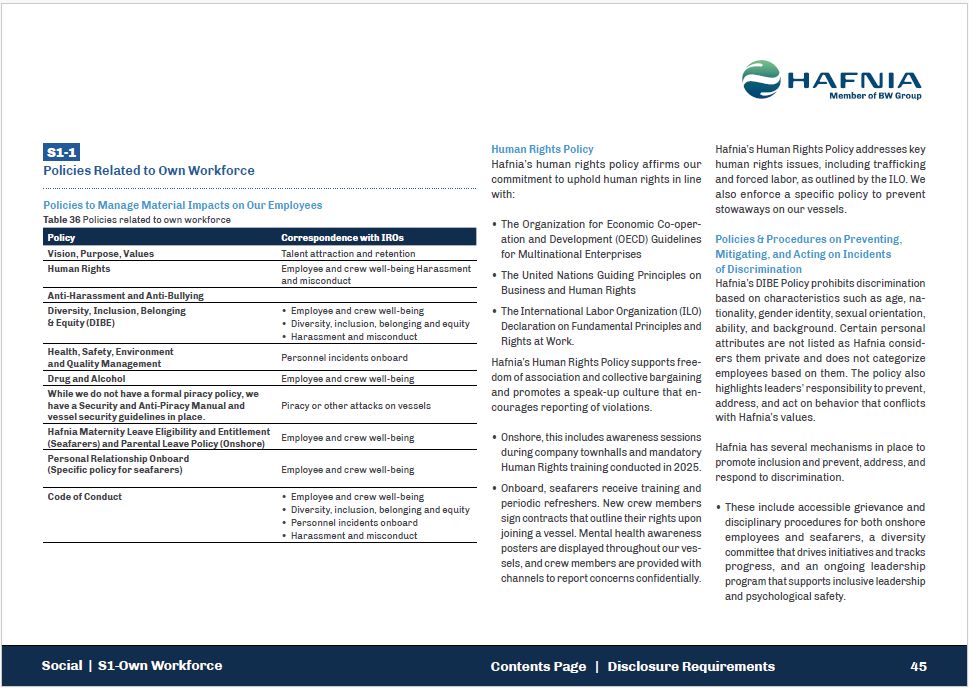
S1-1 Policies Related to Own Workforce Policies to Manage Material Impacts on
Our Employees Table 36 Policies related to own workforce Policy Correspondence with IROs Social | S1-Own Workforce 45 Contents Page | Disclosure Requirements Vision, Purpose, Values Talent attraction and retention Human Rights Employee
and crew well-being Harassment and misconduct Anti-Harassment and Anti-Bullying Diversity, Inclusion, Belonging & Equity (DIBE) Employee and crew well-being Diversity, inclusion, belonging and equity • Harassment and misconduct
Health, Safety, Environment and Quality Management Personnel incidents onboard Drug and Alcohol Employee and crew well-being While we do not have a formal piracy policy, we have a Security and Anti-Piracy Manual and Piracy or other
attacks on vessels vessel security guidelines in place. Hafnia Maternity Leave Eligibility and Entitlement Employee and crew well-being (Seafarers) and Parental Leave Policy (Onshore) Personal Relationship Onboard (Specific policy for
seafarers) Employee and crew well-being Code of Conduct Employee and crew well-being Diversity, inclusion, belonging and equity Personnel incidents onboard • Harassment and misconduct Human Rights Policy Hafnia’s human rights policy
affirms our commitment to uphold human rights in line with: The Organization for Economic Co-oper-ation and Development (OECD) Guidelines for Multinational Enterprises The United Nations Guiding Principles on Business and Human Rights The
International Labor Organization (ILO) Declaration on Fundamental Principles and Rights at Work. Hafnia’s Human Rights Policy supports free-dom of association and collective bargaining and promotes a speak-up culture that en-courages reporting
of violations. Onshore, this includes awareness sessions during company townhalls and mandatory Human Rights training conducted in 2025. Onboard, seafarers receive training and periodic refreshers. New crew members sign contracts that outline
their rights upon joining a vessel. Mental health awareness posters are displayed throughout our ves-sels, and crew members are provided with channels to report concerns confidentially. Hafnia’s Human Rights Policy addresses key human rights
issues, including trafficking and forced labor, as outlined by the ILO. We also enforce a specific policy to prevent stowaways on our vessels. Policies & Procedures on Preventing, Mitigating, and Acting on Incidents of
Discrimination Hafnia’s DIBE Policy prohibits discrimination based on characteristics such as age, na-tionality, gender identity, sexual orientation, ability, and background. Certain personal attributes are not listed as Hafnia consid-ers them
private and does not categorize employees based on them. The policy also highlights leaders’ responsibility to prevent, address, and act on behavior that conflicts with Hafnia’s values. Hafnia has several mechanisms in place to promote
inclusion and prevent, address, and respond to discrimination. These include accessible grievance and disciplinary procedures for both onshore employees and seafarers, a diversity committee that drives initiatives and tracks progress, and an
ongoing leadership program that supports inclusive leadership and psychological safety.
To protect individuals who may be more vulnerable, Hafnia has implemented targeted
measures. These include improving onboard facilities and equipment for women, such as redesigned spaces, properly fitting PPE, and tailored boiler suits. Female crew assignments are planned to ensure at least two women are onboard where
possible, and direct access to shore-based crewing support is available if concerns cannot be raised onboard. Hafnia also recognizes that vulnerability extends beyond gender. All crew members, particularly those joining a vessel for the first
time, receive dedicated onboarding to ensure they understand safety procedures, reporting channels, and available support. S1-2 Processes for Engaging with Own Workers and Workers’ Representatives about Impacts Engagement with our Workforce
and Actions Identified to Address Negative Impacts Workforce engagement is overseen by the Head of People, Culture & Strategy for onshore employees and the Head of Crewing for seafarers. Engagement examples include: All Employees:
Workforce insights are gathered through multiple engagement channels, as outlined in the ‘Employees at Greater Risk of Harm’ and ‘Channels for Raising Concerns’ sections. Shore-Based Employees: Shore-based employees are engaged through
structured communication and feedback channels, including leadership strategy off-sites, monthly townhalls, the company intranet, regular manager discussions, and think tanks for open dialogue. Seafarers (Both Internally and Externally
Managed): Seafarers are engaged through formal and informal channels, including a bi-annual Seafarers’ Advisory Board, quarterly crew conferences, and informal platforms like WhatsApp groups for women seafarers. Seafarers – Externally Managed
Fleet: Engagement is supported by annual seminars with technical managers, vessel visits by the Owner and external managers, and Document of Compliance (DOC) -related inspections. Further insights are gathered through quarterly reports and
onboard sessions, which also reinforce anti- corruption and anti-bullying commitments. Seafarers Unions: Regular discussions are represented by the Head of Crewing to gather input and address concerns. How Decisions Are Influenced by
Employee Perspectives Feedback from multiple engagement channels is considered in Hafnia’s decision-making. Relevant input is discussed, translated into action plans, and communicated back through the same engagement channels. Hafnia’s
Diversity Committee, both onshore and at sea, leads the DIBE agenda. Seafarers on externally managed vessels are engaged through technical managers, with ongoing coordination with Hafnia to implement mitigation measures such as updated safety
protocols. Crew training feedback is regularly collected and used to improve future programs. Engagement with external managers is overseen by the Head of Technical. Our Framework Agreements with Workers’ Representatives related to Human
Rights Hafnia does not have a Global Framework Agreement in place. All seafarers are cov-ered by a Collective Bargaining Agreement. Effectiveness of Our Engagement with Employees To ensure effective engagement, Hafnia targets a response rate
of over 90% for onshore employee engagement surveys. Survey results are reviewed to identify actions, supported by data analysis and benchmarking against peers in the shipping industry. Performance coaching, along with mid-year and end-of-year
reviews, supports continuous improvement and effective employee engagement. For our seafarers, the effectiveness of our engagement is monitored based on participation in formal annual surveys, crewing conferences, and virtual calls as well as
the timely follow-up of issues raised. These insights are reviewed to assess the effectiveness of engagement and inform continuous improvements in seafarer welfare and onboard practices. Social | S1-Own Workforce 46 Contents Page |
Disclosure Requirements Insight into the Perspectives of Employees that may be Particularly Vulnerable Refer to ‘Employees at Greater Risk of Harm’. S1-3 Processes to Remediate Negative Impacts and Channels for Own Workers to Raise
Concerns Approach to Remediation in Case of Material Negative Impact and Assessment of Effectiveness When issues are identified, Hafnia takes corrective and supportive actions to prevent their recurrence, such as improving safety procedures
and working conditions, and providing professional support. Remediation
is overseen by the People, Culture & Strategy and Crewing teams, together with
the Leadership Group. For seafarers on externally managed vessels, technical managers are asked to conduct investigations, keep Hafnia informed, and implement appropriate corrective measures. All processes are handled confidentially to protect
both the investigation and those involved. Channels for Raising Concerns Hafnia maintains a non-retaliation policy, encourages open communication, and asks all employees to speak up about inappropriate behavior. Seafarers on externally
managed vessels are encouraged to use their company’s whistleblowing systems first. Further details on reporting channels are provided in G1-1. Hafnia ensures employees are aware of reporting channels through regular policy refreshers,
intranet communication, townhalls and onboard posters. Office employees must annually confirm their awareness of the Code of Conduct, which includes procedures for whistleblowing. The platform is accessible to all, both online and by phone,
with location-specific contact numbers. Effectiveness of the Channels for Concerns Measuring the effectiveness of our concern-raising channels is challenging. For onshore employees and seafarers on internally managed fleet, reports made
through the Whistleblowing Platform are monitored directly, while seafarers on externally managed vessels use an external whistleblowing platform. In both cases, effectiveness is primarily assessed by the number of reported cases, which
indicates accessibility and channel use. A similar approach is used for Designated Person Ashore (DPA) notifications for seafarers. Issues reported through the Open-Door policy are not systematically tracked unless they are escalated to the
Whistleblowing Platform. Currently, Hafnia does not use KPIs to measure resolution outcomes or employee satisfaction with these processes. S1-4 Social | S1-Own Workforce 47 Contents Page | Disclosure Requirements Taking Action on Material
Impacts on Own Workforce, and Approaches to Mitigating Material Risks and Pursuing Material Opportunities Related to Own Workforce, and Effectiveness of Those Actions Our actions are detailed in the next page. The implementation of Hafnia’s
action plans and actions underway related to S1 does not require significant OPEX or CAPEX ex-penditures. These actions are supported by dedicated personnel, internal systems, and existing operational processes. How We Ensure that Our
Practices Do Not Cause or Contribute to Material Negative Impacts on Our Workforce Hafnia aims to ensure its work practices do not cause a material negative impact on em-ployees. When business pressures arose, we prioritize alternatives, such
as reskilling and redeployment over layoffs, wherever possible. If employment or business rela-tionships must be terminated, decisions are made in accordance with international labor standards, internal ethical guidelines, and national laws,
including the provision of le-gally required severance. Effectiveness is measured through employee surveys and KPIs such as turnover and satisfaction, supporting continuous improvement and compliance with labor standards. Effectiveness of Our
Actions In addition to tracking targets and actions for identified IROs, Hafnia assesses the ef-fectiveness of its measures through internal audits and external standards, including ISO 14001 and ISO 9001. Where negative im-pacts become
systemic, policies, training, and awareness initiatives are strengthened and followed up until resolved. Effectiveness is also monitored through engagement surveys and direct feedback, including seafarer input at crewing confer-ences. Hafnia
benchmarks performance against industry peers and participates in industry forums to support continuous im-provement.
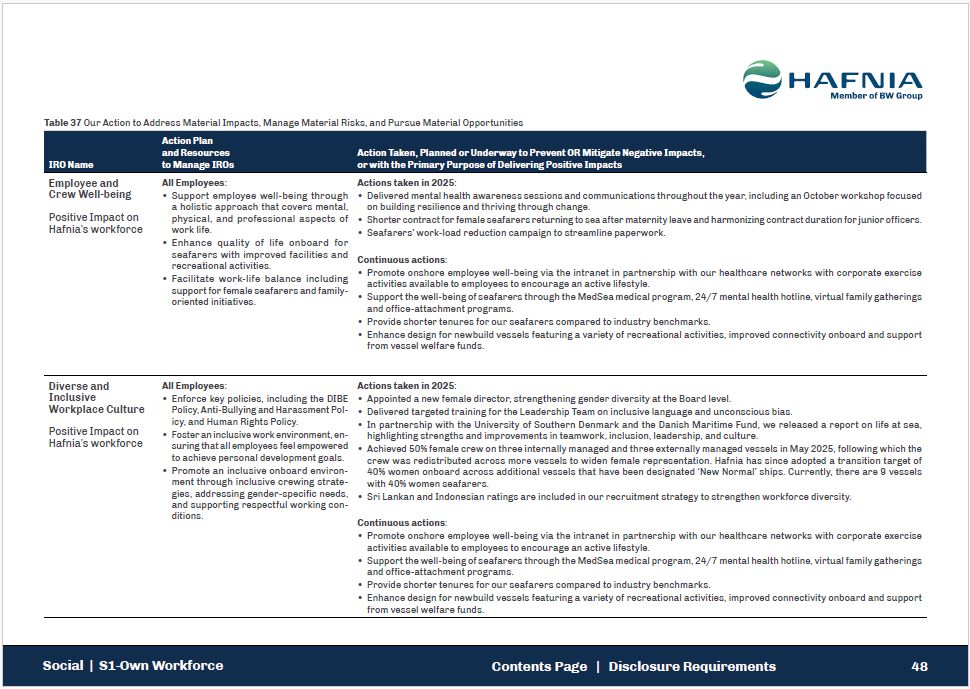
Table 37 Our Action to Address Material Impacts, Manage Material Risks, and Pursue
Material Opportunities IRO Name Social | S1-Own Workforce 48 Contents Page | Disclosure Requirements Action Plan and Resources to Manage IROs Action Taken, Planned or Underway to Prevent OR Mitigate Negative Impacts, or with the Primary
Purpose of Delivering Positive Impacts Employee and Crew Well-being Positive Impact on Hafnia’s workforce All Employees: Support employee well-being through a holistic approach that covers mental, physical, and professional aspects of work
life. Enhance quality of life onboard for seafarers with improved facilities and recreational activities. Facilitate work-life balance including support for female seafarers and family- oriented initiatives. Actions taken in 2025: Delivered
mental health awareness sessions and communications throughout the year, including an October workshop focused on building resilience and thriving through change. Shorter contract for female seafarers returning to sea after maternity leave and
harmonizing contract duration for junior officers. Seafarers’ work-load reduction campaign to streamline paperwork. Continuous actions: Promote onshore employee well-being via the intranet in partnership with our healthcare networks with
corporate exercise activities available to employees to encourage an active lifestyle. Support the well-being of seafarers through the MedSea medical program, 24/7 mental health hotline, virtual family gatherings and office-attachment
programs. Provide shorter tenures for our seafarers compared to industry benchmarks. Enhance design for newbuild vessels featuring a variety of recreational activities, improved connectivity onboard and support from vessel welfare
funds. Diverse and Inclusive Workplace Culture Positive Impact on Hafnia’s workforce All Employees: Enforce key policies, including the DIBE Policy, Anti-Bullying and Harassment Pol- icy, and Human Rights Policy. Foster an inclusive work
environment, en- suring that all employees feel empowered to achieve personal development goals. Promote an inclusive onboard environ- ment through inclusive crewing strate- gies, addressing gender-specific needs, and supporting respectful
working con- ditions. Actions taken in 2025: Appointed a new female director, strengthening gender diversity at the Board level. Delivered targeted training for the Leadership Team on inclusive language and unconscious bias. In partnership
with the University of Southern Denmark and the Danish Maritime Fund, we released a report on life at sea, highlighting strengths and improvements in teamwork, inclusion, leadership, and culture. Achieved 50% female crew on three internally
managed and three externally managed vessels in May 2025, following which the crew was redistributed across more vessels to widen female representation. Hafnia has since adopted a transition target of 40% women onboard across additional vessels
that have been designated ‘New Normal’ ships. Currently, there are 9 vessels with 40% women seafarers. Sri Lankan and Indonesian ratings are included in our recruitment strategy to strengthen workforce diversity. Continuous actions: Promote
onshore employee well-being via the intranet in partnership with our healthcare networks with corporate exercise activities available to employees to encourage an active lifestyle. Support the well-being of seafarers through the MedSea medical
program, 24/7 mental health hotline, virtual family gatherings and office-attachment programs. Provide shorter tenures for our seafarers compared to industry benchmarks. Enhance design for newbuild vessels featuring a variety of recreational
activities, improved connectivity onboard and support from vessel welfare funds.
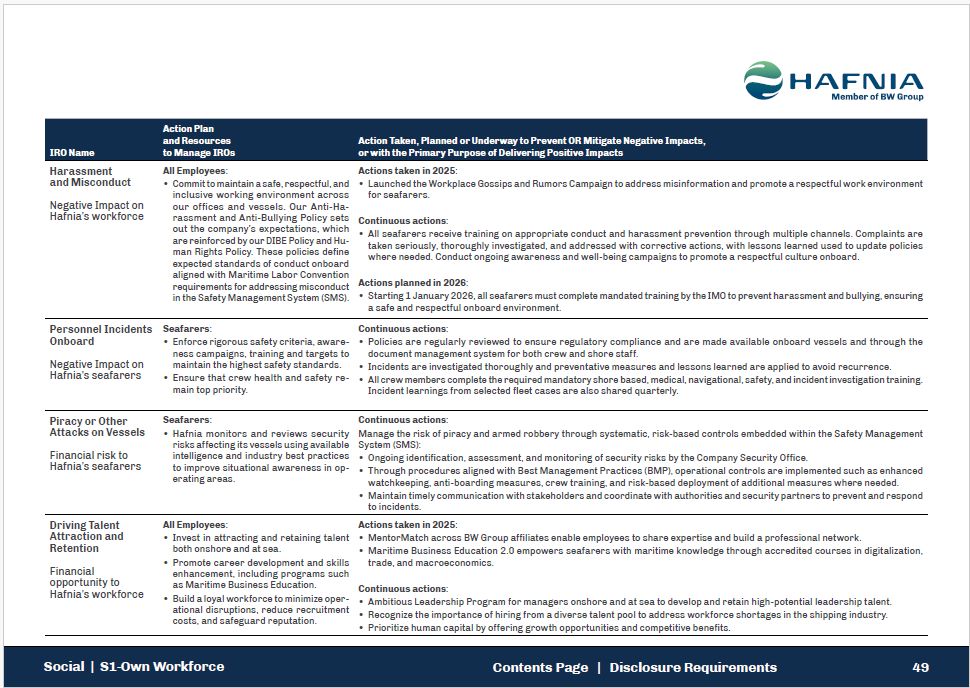
IRO Name Social | S1-Own Workforce 49 Contents Page | Disclosure
Requirements Action Plan and Resources to Manage IROs Action Taken, Planned or Underway to Prevent OR Mitigate Negative Impacts, or with the Primary Purpose of Delivering Positive Impacts Harassment and Misconduct Negative Impact on
Hafnia’s workforce All Employees: Commit to maintain a safe, respectful, and inclusive working environment across our offices and vessels. Our Anti-Ha- rassment and Anti-Bullying Policy sets out the company’s expectations, which are
reinforced by our DIBE Policy and Hu- man Rights Policy. These policies define expected standards of conduct onboard aligned with Maritime Labor Convention requirements for addressing misconduct in the Safety Management System (SMS). Actions
taken in 2025: Launched the Workplace Gossips and Rumors Campaign to address misinformation and promote a respectful work environment for seafarers. Continuous actions: All seafarers receive training on appropriate conduct and harassment
prevention through multiple channels. Complaints are taken seriously, thoroughly investigated, and addressed with corrective actions, with lessons learned used to update policies where needed. Conduct ongoing awareness and well-being campaigns
to promote a respectful culture onboard. Actions planned in 2026: Starting 1 January 2026, all seafarers must complete mandated training by the IMO to prevent harassment and bullying, ensuring a safe and respectful onboard
environment. Personnel Incidents Onboard Negative Impact on Hafnia’s seafarers Seafarers: Enforce rigorous safety criteria, aware- ness campaigns, training and targets to maintain the highest safety standards. Ensure that crew health and
safety re- main top priority. Continuous actions: Policies are regularly reviewed to ensure regulatory compliance and are made available onboard vessels and through the document management system for both crew and shore staff. Incidents are
investigated thoroughly and preventative measures and lessons learned are applied to avoid recurrence. All crew members complete the required mandatory shore based, medical, navigational, safety, and incident investigation training. Incident
learnings from selected fleet cases are also shared quarterly. Piracy or Other Attacks on Vessels Financial risk to Hafnia’s seafarers Seafarers: Hafnia monitors and reviews security risks affecting its vessels using available intelligence
and industry best practices to improve situational awareness in op- erating areas. Continuous actions: Manage the risk of piracy and armed robbery through systematic, risk-based controls embedded within the Safety Management System
(SMS): Ongoing identification, assessment, and monitoring of security risks by the Company Security Office. Through procedures aligned with Best Management Practices (BMP), operational controls are implemented such as enhanced watchkeeping,
anti-boarding measures, crew training, and risk-based deployment of additional measures where needed. Maintain timely communication with stakeholders and coordinate with authorities and security partners to prevent and respond to
incidents. Driving Talent Attraction and Retention Financial opportunity to Hafnia’s workforce All Employees: Invest in attracting and retaining talent both onshore and at sea. Promote career development and skills enhancement, including
programs such as Maritime Business Education. Build a loyal workforce to minimize oper- ational disruptions, reduce recruitment costs, and safeguard reputation. Actions taken in 2025: MentorMatch across BW Group affiliates enable employees
to share expertise and build a professional network. Maritime Business Education 2.0 empowers seafarers with maritime knowledge through accredited courses in digitalization, trade, and macroeconomics. Continuous actions: Ambitious Leadership
Program for managers onshore and at sea to develop and retain high-potential leadership talent. Recognize the importance of hiring from a diverse talent pool to address workforce shortages in the shipping industry. Prioritize human capital by
offering growth opportunities and competitive benefits.
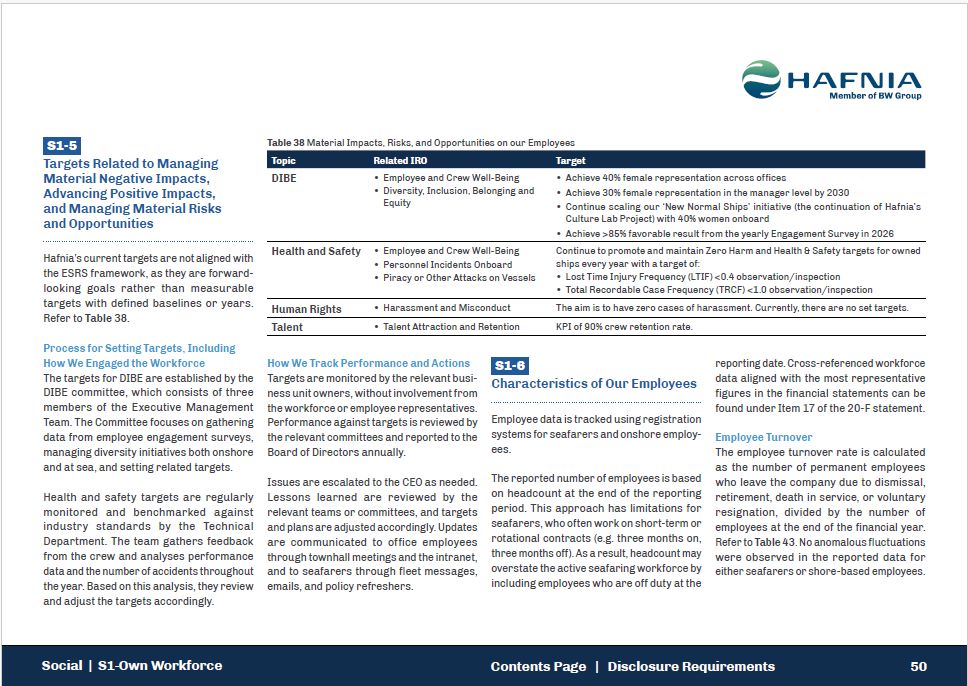
S1-5 Targets Related to Managing Material Negative Impacts, Advancing Positive
Impacts, and Managing Material Risks and Opportunities Hafnia’s current targets are not aligned with the ESRS framework, as they are forward-looking goals rather than measurable targets with defined baselines or years. Refer to Table
38. Process for Setting Targets, Including How We Engaged the Workforce The targets for DIBE are established by the DIBE committee, which consists of three members of the Executive Management Team. The Committee focuses on gathering data from
employee engagement surveys, managing diversity initiatives both onshore and at sea, and setting related targets. Health and safety targets are regularly monitored and benchmarked against industry standards by the Technical Department. The
team gathers feedback from the crew and analyses performance data and the number of accidents throughout the year. Based on this analysis, they review and adjust the targets accordingly. How We Track Performance and Actions Targets are
monitored by the relevant busi-ness unit owners, without involvement from the workforce or employee representatives. Performance against targets is reviewed by the relevant committees and reported to the Board of Directors annually. Issues are
escalated to the CEO as needed. Lessons learned are reviewed by the relevant teams or committees, and targets and plans are adjusted accordingly. Updates are communicated to office employees through townhall meetings and the intranet, and to
seafarers through fleet messages, emails, and policy refreshers. S1-6 Social | S1-Own Workforce 50 Contents Page | Disclosure Requirements Characteristics of Our Employees Employee data is tracked using registration systems for seafarers
and onshore employ-ees. The reported number of employees is based on headcount at the end of the reporting period. This approach has limitations for seafarers, who often work on short-term or rotational contracts (e.g. three months on, three
months off). As a result, headcount may overstate the active seafaring workforce by including employees who are off duty at the reporting date. Cross-referenced workforce data aligned with the most representative figures in the financial
statements can be found under Item 17 of the 20-F statement. Employee Turnover The employee turnover rate is calculated as the number of permanent employees who leave the company due to dismissal, retirement, death in service, or voluntary
resignation, divided by the number of employees at the end of the financial year. Refer to Table 43. No anomalous fluctuations were observed in the reported data for either seafarers or shore-based employees. Table 38 Material Impacts, Risks,
and Opportunities on our Employees Achieve >85% favorable result from the yearly Engagement Survey in 2026 Health and Safety Employee and Crew Well-Being Personnel Incidents Onboard Continue to promote and maintain Zero Harm and Health
& Safety targets for owned ships every year with a target of: Piracy or Other Attacks on Vessels Lost Time Injury Frequency (LTIF) <0.4 observation/inspection Total Recordable Case Frequency (TRCF) <1.0
observation/inspection Human Rights Harassment and Misconduct The aim is to have zero cases of harassment. Currently, there are no set targets. Talent Talent Attraction and Retention KPI of 90% crew retention rate. Topic Related IRO
Target DIBE Employee and Crew Well-Being Diversity, Inclusion, Belonging and Equity Achieve 40% female representation across offices Achieve 30% female representation in the manager level by 2030 Continue scaling our ‘New Normal Ships’
initiative (the continuation of Hafnia’s Culture Lab Project) with 40% women onboard
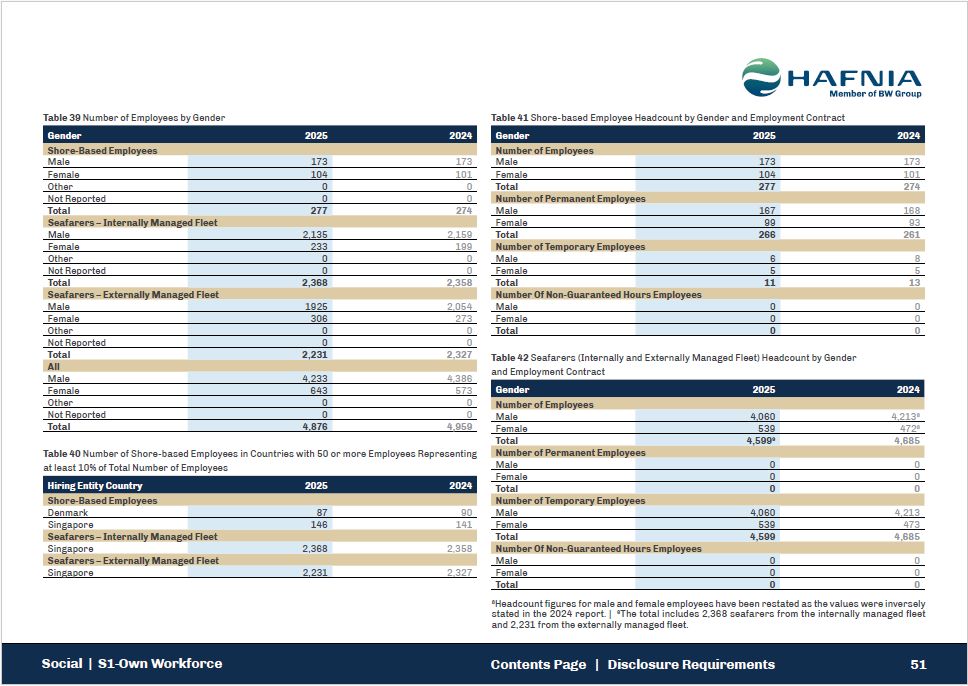
Table 39 Number of Employees by Gender Social | S1-Own Workforce 51 Contents
Page | Disclosure Requirements Gender 2025 2024 Shore-Based Employees Male 173 173 Female 104 101 Other 0 0 Not Reported 0 0 Total 277 274 Seafarers – Internally Managed
Fleet Male 2,135 2,159 Female 233 199 Other 0 0 Not Reported 0 0 Total 2,368 2,358 Seafarers – Externally Managed Fleet Male 1925 2,054 Female 306 273 Other 0 0 Not
Reported 0 0 Total 2,231 2,327 All Male 4,233 4,386 Female 643 573 Other 0 0 Not Reported 0 0 Total 4,876 4,959 Table 40 Number of Shore-based Employees in Countries with 50 or more Employees Representing at least 10% of
Total Number of Employees Hiring Entity Country 2025 2024 Shore-Based Employees Denmark 87 90 Singapore 146 141 Seafarers – Internally Managed Fleet Singapore 2,368 2,358 Seafarers – Externally Managed
Fleet Singapore 2,231 2,327 Table 41 Shore-based Employee Headcount by Gender and Employment Contract Gender 2025 2024 Number of Employees Male 173 173 Female 104 101 Total 277 274 Number of Permanent
Employees Male 167 168 Female 99 93 Total 266 261 Number of Temporary Employees Male 6 8 Female 5 5 Total 11 13 Number Of Non-Guaranteed Hours Employees Male 0 0 Female 0 0 Total 0 0 Table 42 Seafarers (Internally
and Externally Managed Fleet) Headcount by Gender and Employment Contract Gender 2025 2024 Number of Employees Male 4,060 4,2138 Female 539 4728 Total 4,5999 4,685 Number of Permanent
Employees Male 0 0 Female 0 0 Total 0 0 Number of Temporary Employees Male 4,060 4,213 Female 539 473 Total 4,599 4,685 Number Of Non-Guaranteed Hours Employees Male 0 0 Female 0 0 Total 0 0 8Headcount figures for
male and female employees have been restated as the values were inversely stated in the 2024 report. | 9The total includes 2,368 seafarers from the internally managed fleet and 2,231 from the externally managed fleet.
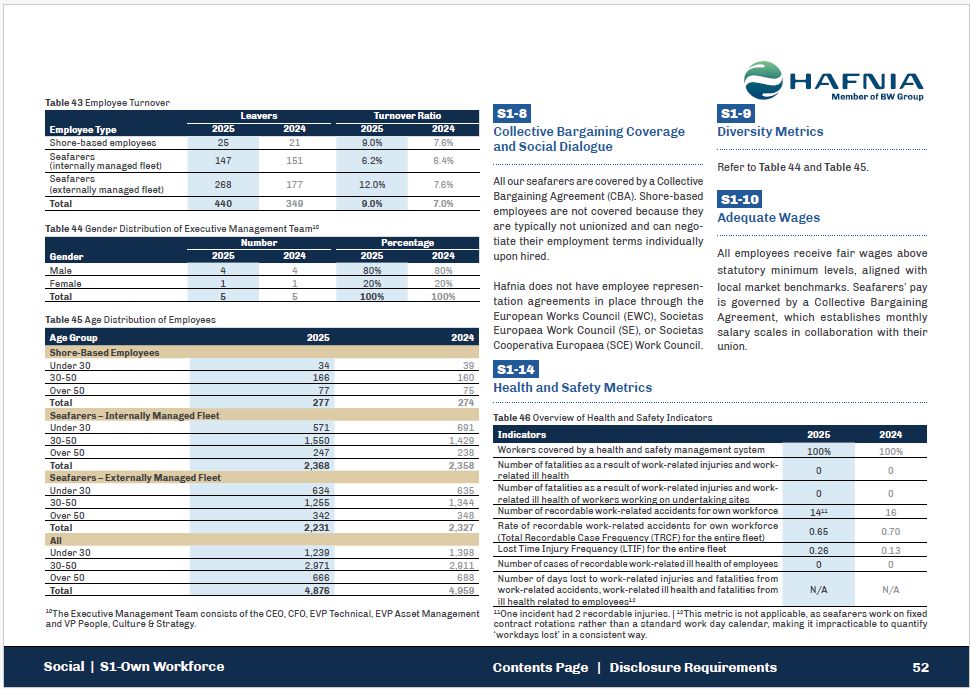
S1-8 Collective Bargaining Coverage and Social Dialogue All our seafarers are
covered by a Collective Bargaining Agreement (CBA). Shore-based employees are not covered because they are typically not unionized and can nego-tiate their employment terms individually upon hired. Hafnia does not have employee represen-tation
agreements in place through the European Works Council (EWC), Societas Europaea Work Council (SE), or Societas Cooperativa Europaea (SCE) Work Council. Table 43 Employee Turnover Employee Type Leavers 2025 2024 Turnover Ratio 2025
2024 Shore-based employees 25 21 9.0% 7.6% Seafarers (internally managed fleet) 147 151 6.2% 6.4% Seafarers (externally managed fleet) 268 177 12.0% 7.6% Total 440 349 9.0% 7.0% Table 44 Gender Distribution of Executive
Management Team10 Gender Number 2025 2024 Percentage 2025 2024 Male 4 4 80% 80% Female 1 1 20% 20% Total 5 5 100% 100% Table 45 Age Distribution of Employees Age Group 2025 2024 Shore-Based Employees Under
30 34 39 30-50 166 160 Over 50 77 75 Total 277 274 Seafarers – Internally Managed Fleet Under 30 571 691 30-50 1,550 1,429 Over 50 247 238 Total 2,368 2,358 Seafarers – Externally Managed Fleet Under
30 634 635 30-50 1,255 1,344 Over 50 342 348 Total 2,231 2,327 All Under 30 1,239 1,398 30-50 2,971 2,911 Over 50 666 688 Total 4,876 4,959 10The Executive Management Team consists of the CEO, CFO, EVP Technical, EVP
Asset Management and VP People, Culture & Strategy. 11One incident had 2 recordable injuries. | 12This metric is not applicable, as seafarers work on fixed contract rotations rather than a standard work day calendar, making it
impracticable to quantify ‘workdays lost’ in a consistent way. S1-9 Diversity Metrics Refer to Table 44 and Table 45. S1-10 Adequate Wages All employees receive fair wages above statutory minimum levels, aligned with local market
benchmarks. Seafarers’ pay is governed by a Collective Bargaining Agreement, which establishes monthly salary scales in collaboration with their union. S1-14 Social | S1-Own Workforce 52 Contents Page | Disclosure Requirements Health and
Safety Metrics Table 46 Overview of Health and Safety Indicators Indicators 2025 2024 Workers covered by a health and safety management system 100% 100% Number of fatalities as a result of work-related injuries and work-related ill
health 0 0 Number of fatalities as a result of work-related injuries and work-related ill health of workers working on undertaking sites 0 0 Number of recordable work-related accidents for own workforce 1411 16 Rate of recordable
work-related accidents for own workforce (Total Recordable Case Frequency (TRCF) for the entire fleet) 0.65 0.70 Lost Time Injury Frequency (LTIF) for the entire fleet 0.26 0.13 Number of cases of recordable work-related ill health of
employees 0 0 Number of days lost to work-related injuries and fatalities from work-related accidents, work-related ill health and fatalities from ill health related to employees12 N/A N/A
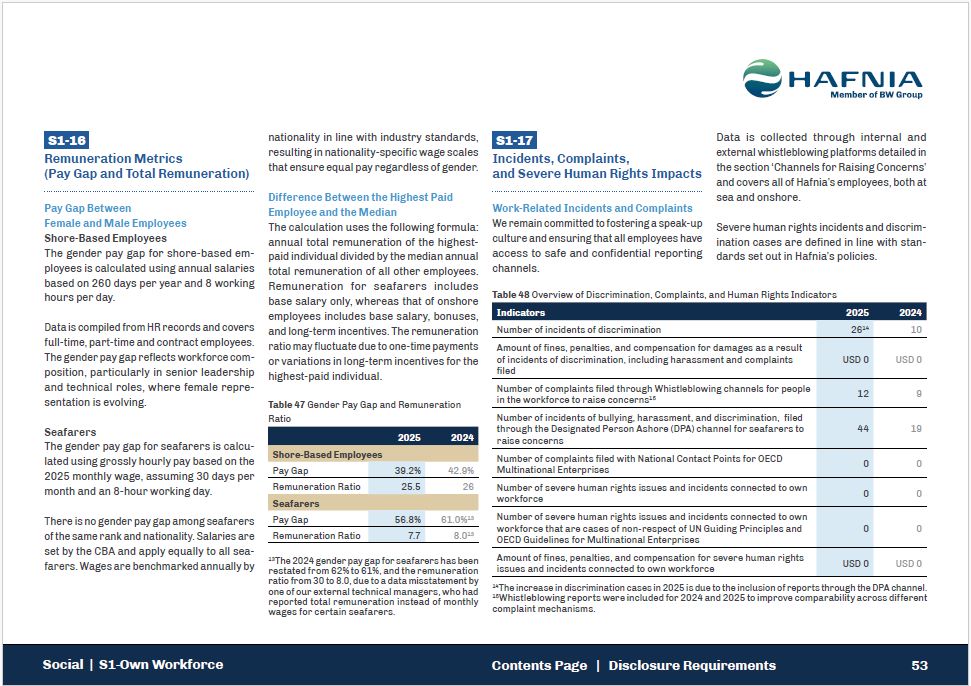
S1-16 Remuneration Metrics (Pay Gap and Total Remuneration) Pay Gap Between Female and Male Employees Shore-Based Employees The gender pay gap for
shore-based employees is calculated using annual salaries based on 260 days per year and 8 working hours per day. Data is compiled from HR records and covers full-time, part-time and contract employees. The gender pay gap reflects workforce
composition, particularly in senior leadership and technical roles, where female representation is evolving. Seafarers The gender pay gap for seafarers is calculated using grossly hourly pay based on the 2025 monthly wage, assuming 30 days per
month and an 8-hour working day. There is no gender pay gap among seafarers of the same rank and nationality. Salaries are set by the CBA and apply equally to all seafarers. Wages are benchmarked annually by nationality in line with industry
standards, resulting in nationality-specific wage scales that ensure equal pay regardless of gender. Difference Between the Highest Paid Employee and the Median The calculation uses the following formula: annual total remuneration of the
highestpaid individual divided by the median annual total remuneration of all other employees. Remuneration for seafarers includes base salary only, whereas that of onshore employees includes base salary, bonuses, and long-term incentives. The
remuneration ratio may fluctuate due to one-time payments or variations in long-term incentives for the highest-paid individual. Table 47 Gender Pay Gap and Remuneration Ratio 2025 2024 Shore Based Employees Pay Gap 39.2% 42.9% Remuneration Ratio
25.5 26 Seafarers Pay Gap 56.8% 61.0%13 Remuneration Ratio 7.7 8.013 13The 2024 gender pay gap for seafarers has been restated from 62% to 61%, and the remuneration ratio from 30 to 8.0, due to a data misstatement by one of our external technical
managers, who had reported total remuneration instead of monthly wages for certain seafarers. S1-17 Incidents, Complaints, and Severe Human Rights Impacts Work-Related Incidents and Complaints We remain committed to fostering a speak-up culture
and ensuring that all employees have access to safe and confidential reporting channels. Data is collected through internal and external whistleblowing platforms detailed in the section ‘Channels for Raising Concerns’ and covers all of Hafnia’s
employees, both at sea and onshore. Severe human rights incidents and discrimination cases are defined in line with standards set out in Hafnia’s policies. Table 48 Overview of Discrimination, Complaints, and Human Rights Indicators Indicators
2025 2024 Number of incidents of discrimination 2614 10 Amount of fines, penalties, and compensation for damages as a result of incidents of discrimination, including harassment and complaints filed USD 0 USD 0 Number of complaints filed through
Whistleblowing channels for people in the workforce to raise concerns15 12 9 Number of incidents of bullying, harassment, and discrimination, filed through the Designated Person Ashore (DPA) channel for seafarers to raise concerns 44 19 Number of
complaints filed with National Contact Points for OECD Multinational Enterprises 0 0 Number of severe human rights issues and incidents connected to own Workforce 0 0 Number of severe human rights issues and incidents connected to own workforce
that are cases of non-respect of UN Guiding Principles and OECD Guidelines for Multinational Enterprises 0 0 Amount of fines, penalties, and compensation for severe human rights issues and incidents connected to own workforce USD 0 USD 0 14The
increase in discrimination cases in 2025 is due to the inclusion of reports through the DPA channel. 15Whistleblowing reports were included for 2024 and 2025 to improve comparability across different complaint mechanisms. Social | S1-Own
Workforce Contents Page | Disclosure Requirements 53
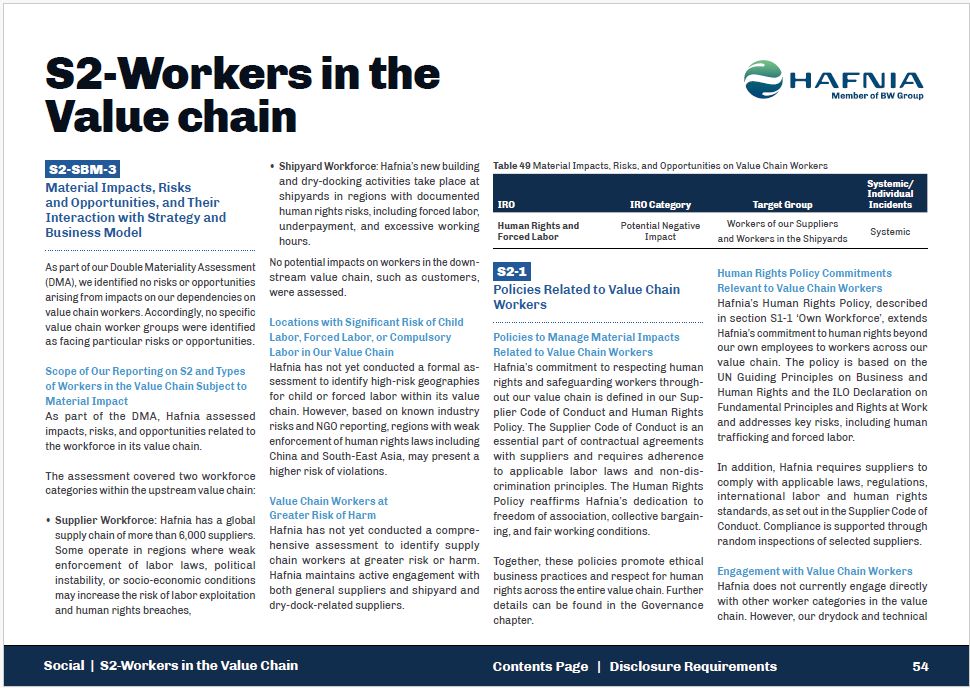
S2-Workers in the Value chain S2-SBM-3 Material Impacts, Risks and
Opportunities, and Their Interaction with Strategy and Business Model As part of our Double Materiality Assessment (DMA), we identified no risks or opportunities arising from impacts on our dependencies on value chain workers. Accordingly, no
specific value chain worker groups were identified as facing particular risks or opportunities. Scope of Our Reporting on S2 and Types of Workers in the Value Chain Subject to Material Impact As part of the DMA, Hafnia assessed impacts,
risks, and opportunities related to the workforce in its value chain. The assessment covered two workforce categories within the upstream value chain: Supplier Workforce: Hafnia has a global supply chain of more than 6,000 suppliers. Some
operate in regions where weak enforcement of labor laws, political instability, or socio-economic conditions may increase the risk of labor exploitation and human rights breaches, Shipyard Workforce: Hafnia’s new building and dry-docking
activities take place at shipyards in regions with documented human rights risks, including forced labor, underpayment, and excessive working hours. No potential impacts on workers in the down-stream value chain, such as customers, were
assessed. Locations with Significant Risk of Child Labor, Forced Labor, or Compulsory Labor in Our Value Chain Hafnia has not yet conducted a formal as-sessment to identify high-risk geographies for child or forced labor within its value
chain. However, based on known industry risks and NGO reporting, regions with weak enforcement of human rights laws including China and South-East Asia, may present a higher risk of violations. Value Chain Workers at Greater Risk of
Harm Hafnia has not yet conducted a compre-hensive assessment to identify supply chain workers at greater risk or harm. Hafnia maintains active engagement with both general suppliers and shipyard and dry-dock-related suppliers. Table 49
Material Impacts, Risks, and Opportunities on Value Chain Workers IRO IRO Category Target Group Systemic/ Individual Incidents Human Rights and Forced Labor Potential Negative Impact Workers of our Suppliers and Workers in the
Shipyards Systemic S2-1 Social | S2-Workers in the Value Chain 54 Contents Page | Disclosure Requirements Policies Related to Value Chain Workers Policies to Manage Material Impacts Related to Value Chain Workers Hafnia’s commitment to
respecting human rights and safeguarding workers through-out our value chain is defined in our Sup-plier Code of Conduct and Human Rights Policy. The Supplier Code of Conduct is an essential part of contractual agreements with suppliers and
requires adherence to applicable labor laws and non-dis-crimination principles. The Human Rights Policy reaffirms Hafnia’s dedication to freedom of association, collective bargain-ing, and fair working conditions. Together, these policies
promote ethical business practices and respect for human rights across the entire value chain. Further details can be found in the Governance chapter. Human Rights Policy Commitments Relevant to Value Chain Workers Hafnia’s Human Rights
Policy, described in section S1-1 ‘Own Workforce’, extends Hafnia’s commitment to human rights beyond our own employees to workers across our value chain. The policy is based on the UN Guiding Principles on Business and Human Rights and the ILO
Declaration on Fundamental Principles and Rights at Work and addresses key risks, including human trafficking and forced labor. In addition, Hafnia requires suppliers to comply with applicable laws, regulations, international labor and human
rights standards, as set out in the Supplier Code of Conduct. Compliance is supported through random inspections of selected suppliers. Engagement with Value Chain Workers Hafnia does not currently engage directly with other worker categories
in the value chain. However, our drydock and technical
team maintain regular communication with yard managers. Measures to Provide
Remedy for Human Rights Impacts All measures for addressing human rights impacts, described in the S1-1 ‘Own Workforce’ chapter, also apply to workers in Hafnia’s value chain. These workers are protected by the same policies as Hafnia’s
employees, including access to the whistleblowing platform. When potential adverse human rights impacts are identified, we are committed to prompt remediation. Our grievance and remediation approach addresses adverse impacts on individuals,
workers, and communities that Hafnia has caused or contributed to. Cases of Human Rights Violations in the Value Chain In 2025, Hafnia identified no breaches of its Supplier Code of Conduct or human rights violations through audits and
supplier background checks. However, we acknowledge that we currently lack the capacity to fully assess our entire value chain. To strengthen responsible supply chain management, Hafnia has mapped our largest suppliers by spending, conducted
enhanced due diligence, and introduced a supplier questionnaire focused on ESG matters, including environmental performance, human rights, ethical labor practices, and grievance mechanisms. S2-2 Processes for Engaging with Value Chain Workers
About Impacts How we Engage with our Value Chain Workers Supplier Workforce: Supplier engagement primarily takes place through selected audits conducted throughout the year. Shipyard Workforce: Hafnia’s engagement is limited to shipyard
management and does not involve direct interaction with the shipyard workforce. As a result, workers’ perspectives are not yet incorporated into decision-making or impact mitigation activities. Since joining the Business and Human Rights
Accelerator program in 2024, Hafnia has strengthened our approach to engagement, including mapping our supply chain in 2025 to identify and address potential negative impacts. Social | S2-Workers in the Value Chain 55 Contents Page |
Disclosure Requirements For details on the global framework agree-ment, see ‘Our Framework Agreements with Workers’ Representatives related to Human Rights’ under S1-2. Gaining Insight into Vulnerable Workers Although Hafnia has not yet
implemented specific actions to better identify vulnerable workers, we have strengthened responsible supply chain practices through the supplier questionnaire described in the ‘Cases of Human Rights Violations in the Value Chain’
sections. S2-3 Processes to Remediate Negative Impacts and Channels for Value Chain Workers to Raise Concerns Approach to Remediation of Material Negative Impact In general, Hafnia’s remediation approach combines preventive measures set out
in our Supplier Code of Conduct with detective and corrective actions informed by supplier questionnaires and audits. To date, Hafnia has not taken remedial action in response to negative impacts identified through the DMA. Channels for Value
Chain Workers to Raise Concerns All workers in Hafnia’s value chain have access to the whistleblowing platform. Suppliers are informed through the Supplier Code of Conduct, Hafnia’s website, and ongoing dialogue. The whistleblowing policy
includes a non-retaliation clause as described in S1-3 ‘Channels for Raising Concerns’. Hafnia has not yet assessed the value chain workers’ awareness of or trust in these channels. Effectiveness of Channels for Concerns Hafnia tracks all
cases raised through its whistleblowing channels until resolution, as detailed in S1-3 ‘Effectiveness of the Channels for Concerns’. In cases of immediate risk to workers, such as forced labor or unsafe conditions, Hafnia takes prompt action,
including corrective measures in notifying authorities or suspending collaboration.
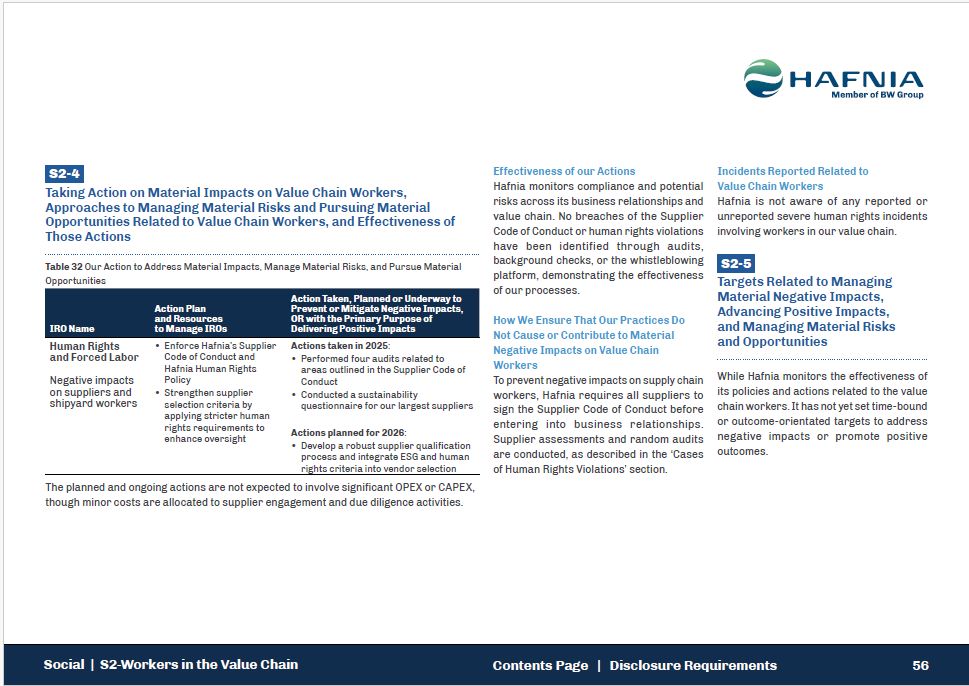
S2-4 Taking Action on Material Impacts on Value Chain Workers, Approaches to
Managing Material Risks and Pursuing Material Opportunities Related to Value Chain Workers, and Effectiveness of Those Actions Table 32 Our Action to Address Material Impacts, Manage Material Risks, and Pursue Material Opportunities IRO
Name Action Plan and Resources to Manage IROs Action Taken, Planned or Underway to Prevent or Mitigate Negative Impacts, OR with the Primary Purpose of Delivering Positive Impacts Human Rights and Forced Labor Negative impacts on suppliers
and shipyard workers Enforce Hafnia’s Supplier Code of Conduct and Hafnia Human Rights Policy Strengthen supplier selection criteria by applying stricter human rights requirements to enhance oversight Actions taken in 2025: Performed four
audits related to areas outlined in the Supplier Code of Conduct Conducted a sustainability questionnaire for our largest suppliers Actions planned for 2026: Develop a robust supplier qualification process and integrate ESG and human
rights criteria into vendor selection The planned and ongoing actions are not expected to involve significant OPEX or CAPEX, though minor costs are allocated to supplier engagement and due diligence activities. Effectiveness of our
Actions Hafnia monitors compliance and potential risks across its business relationships and value chain. No breaches of the Supplier Code of Conduct or human rights violations have been identified through audits, background checks, or the
whistleblowing platform, demonstrating the effectiveness of our processes. How We Ensure That Our Practices Do Not Cause or Contribute to Material Negative Impacts on Value Chain Workers To prevent negative impacts on supply chain workers,
Hafnia requires all suppliers to sign the Supplier Code of Conduct before entering into business relationships. Supplier assessments and random audits are conducted, as described in the ‘Cases of Human Rights Violations’ section. Incidents
Reported Related to Value Chain Workers Hafnia is not aware of any reported or unreported severe human rights incidents involving workers in our value chain. Social | S2-Workers in the Value Chain 56 Contents Page | Disclosure
Requirements S2-5 Targets Related to Managing Material Negative Impacts, Advancing Positive Impacts, and Managing Material Risks and Opportunities While Hafnia monitors the effectiveness of its policies and actions related to the value chain
workers. It has not yet set time-bound or outcome-orientated targets to address negative impacts or promote positive outcomes.
Governance Contents Page | Disclosure Requirements 57 General Disclosures |
Environment | Social | Governance | Limited Assurance Report
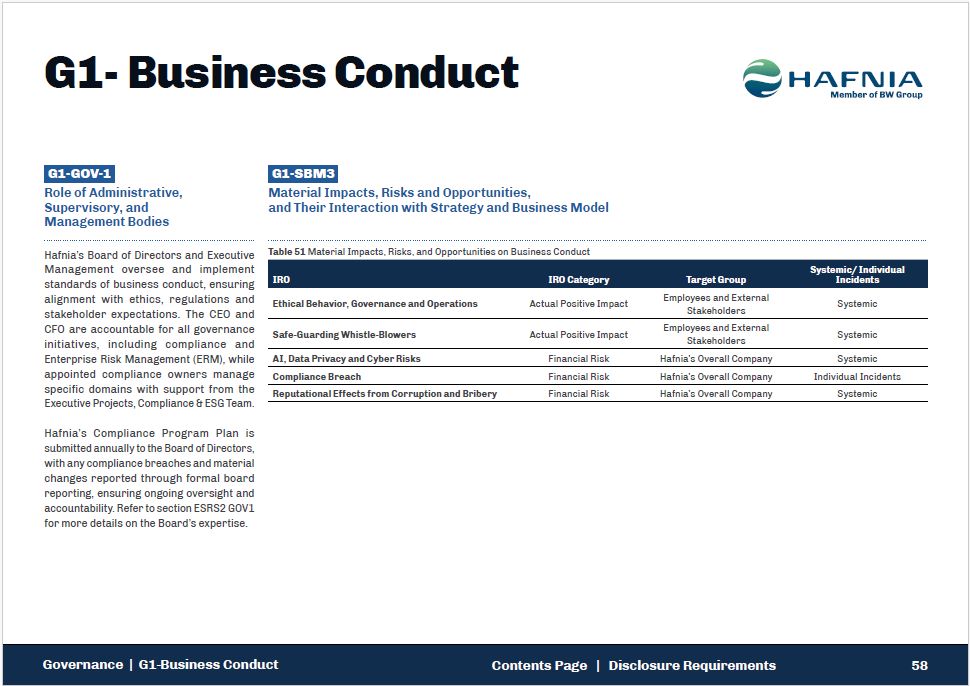
G1-GOV-1 Role of Administrative, Supervisory, and Management Bodies Hafnia’s
Board of Directors and Executive Management oversee and implement standards of business conduct, ensuring alignment with ethics, regulations and stakeholder expectations. The CEO and CFO are accountable for all governance initiatives, including
compliance and Enterprise Risk Management (ERM), while appointed compliance owners manage specific domains with support from the Executive Projects, Compliance & ESG Team. Hafnia’s Compliance Program Plan is submitted annually to the Board
of Directors, with any compliance breaches and material changes reported through formal board reporting, ensuring ongoing oversight and accountability. Refer to section ESRS2 GOV1 for more details on the Board’s expertise. G1-SBM3 Material
Impacts, Risks and Opportunities, and Their Interaction with Strategy and Business Model Target Group Governance | G1-Business Conduct 58 Contents Page | Disclosure Requirements Systemic/ Individual Incidents Table 51 Material Impacts,
Risks, and Opportunities on Business Conduct IRO IRO Category Ethical Behavior, Governance and Operations Actual Positive Impact Employees and External Stakeholders Systemic Safe-Guarding Whistle-Blowers Actual Positive Impact Employees
and External Stakeholders Systemic AI, Data Privacy and Cyber Risks Financial Risk Hafnia’s Overall Company Systemic Compliance Breach Financial Risk Hafnia’s Overall Company Individual Incidents Reputational Effects from Corruption
and Bribery Financial Risk Hafnia’s Overall Company Systemic G1- Business Conduct
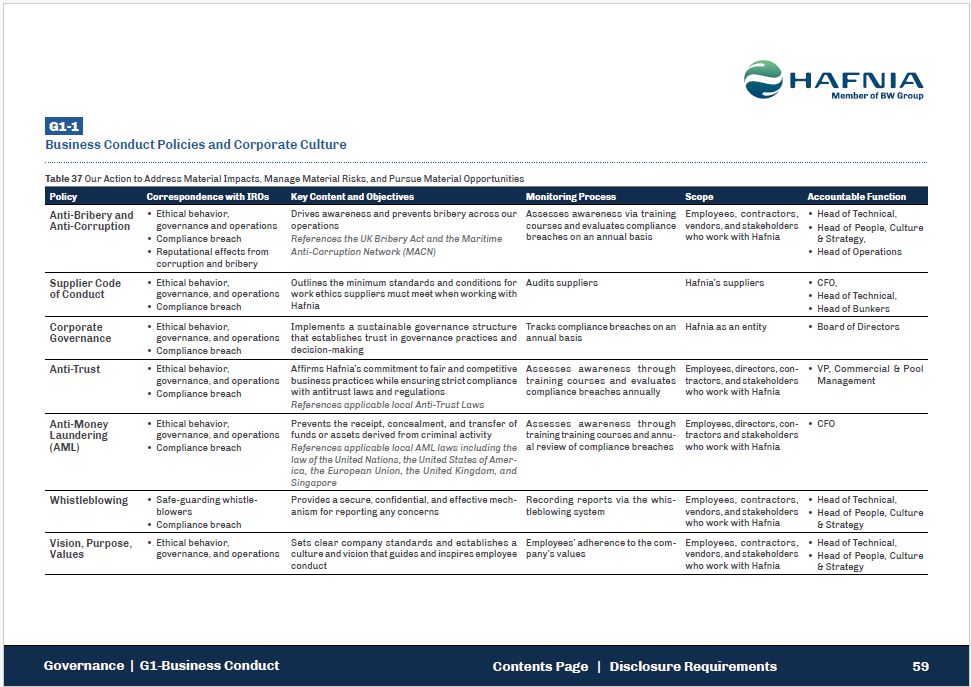
Policy Correspondence with IROs Key Content and Objectives Monitoring
Process Scope Accountable Function Anti-Bribery and Ethical behavior, Drives awareness and prevents bribery across our Assesses awareness via training Employees, contractors, Head of Technical, Anti-Corruption governance and
operations Compliance breach operations References the UK Bribery Act and the Maritime courses and evaluates compliance breaches on an annual basis vendors, and stakeholders who work with Hafnia Head of People, Culture &
Strategy, Reputational effects from Anti-Corruption Network (MACN) Head of Operations corruption and bribery Supplier Code of Conduct Ethical behavior, governance, and operations Outlines the minimum standards and conditions for work
ethics suppliers must meet when working with Audits suppliers Hafnia’s suppliers CFO, Head of Technical, Compliance breach Hafnia Head of Bunkers Corporate Governance Ethical behavior, governance, and operations Compliance
breach Implements a sustainable governance structure that establishes trust in governance practices and decision-making Tracks compliance breaches on an annual basis Hafnia as an entity Board of Directors Anti-Trust Ethical behavior,
governance, and operations Affirms Hafnia’s commitment to fair and competitive business practices while ensuring strict compliance Assesses awareness through training courses and evaluates Employees, directors, con-tractors, and
stakeholders VP, Commercial & Pool Management Compliance breach with antitrust laws and regulations compliance breaches annually who work with Hafnia References applicable local Anti-Trust Laws Anti-Money Laundering (AML) Ethical
behavior, governance, and operations Compliance breach Prevents the receipt, concealment, and transfer of funds or assets derived from criminal activity References applicable local AML laws including the Assesses awareness through training
training courses and annu-al review of compliance breaches Employees, directors, con-tractors and stakeholders who work with Hafnia CFO law of the United Nations, the United States of Amer- ica, the European Union, the United Kingdom,
and Singapore Whistleblowing Safe-guarding whistle- blowers Compliance breach Provides a secure, confidential, and effective mech-anism for reporting any concerns Recording reports via the whis-tleblowing system Employees, contractors,
vendors, and stakeholders who work with Hafnia Head of Technical, Head of People, Culture & Strategy Vision, Purpose, Ethical behavior, Sets clear company standards and establishes a Employees’ adherence to the com- Employees,
contractors, Head of Technical, Values governance, and operations culture and vision that guides and inspires employee conduct pany’s values vendors, and stakeholders who work with Hafnia Head of People, Culture &
Strategy Business Conduct Policies and Corporate Culture Table 37 Our Action to Address Material Impacts, Manage Material Risks, and Pursue Material Opportunities Governance | G1-Business Conduct 59 Contents Page | Disclosure
Requirements G1-1
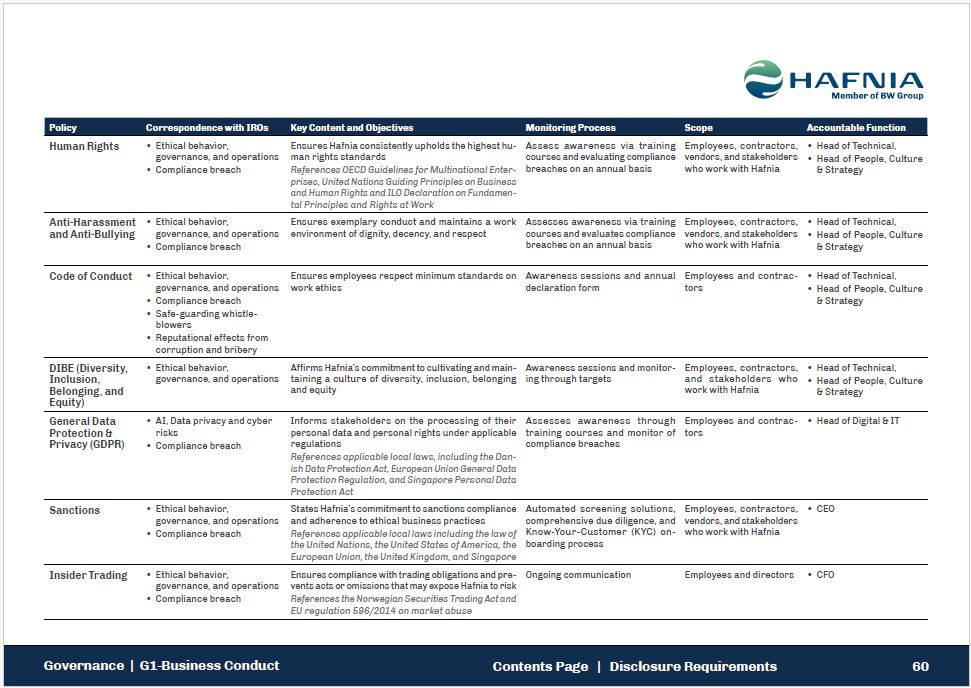
DIBE (Diversity, Inclusion, Belonging, and Equity) Ethical behavior, governance,
and operations Affirms Hafnia’s commitment to cultivating and main-taining a culture of diversity, inclusion, belonging and equity Awareness sessions and monitor-ing through targets Employees, contractors, and stakeholders who work with
Hafnia Head of Technical, Head of People, Culture & Strategy General Data Protection & Privacy (GDPR) AI, Data privacy and cyber risks Compliance breach Informs stakeholders on the processing of their personal data and personal
rights under applicable regulations Assesses awareness through training courses and monitor of compliance breaches Employees and contrac-tors Head of Digital & IT References applicable local laws, including the Dan- ish Data Protection
Act, European Union General Data Protection Regulation, and Singapore Personal Data Protection Act Sanctions Ethical behavior, governance, and operations States Hafnia’s commitment to sanctions compliance and adherence to ethical business
practices Automated screening solutions, comprehensive due diligence, and Employees, contractors, vendors, and stakeholders CEO Compliance breach References applicable local laws including the law of the United Nations, the United States
of America, the Know-Your-Customer (KYC) on- boarding process who work with Hafnia European Union, the United Kingdom, and Singapore Insider Trading Ethical behavior, governance, and operations Ensures compliance with trading obligations
and pre-vents acts or omissions that may expose Hafnia to risk Ongoing communication Employees and directors CFO Compliance breach References the Norwegian Securities Trading Act and EU regulation 596/2014 on market abuse Governance |
G1-Business Conduct 60 Contents Page | Disclosure Requirements Compliance breach References OECD Guidelines for Multinational Enter-prises, United Nations Guiding Principles on Business and Human Rights and ILO Declaration on Fundamen-tal
Principles and Rights at Work breaches on an annual basis who work with Hafnia Policy Correspondence with IROs Key Content and Objectives Monitoring Process Scope Accountable Function Human Rights Ethical behavior, governance, and
operations Ensures Hafnia consistently upholds the highest hu-man rights standards Assess awareness via training courses and evaluating compliance Employees, contractors, vendors, and stakeholders Head of Technical, Head of People,
Culture & Strategy Anti-Harassment and Anti-Bullying Ethical behavior, governance, and operations Compliance breach Ensures exemplary conduct and maintains a work environment of dignity, decency, and respect Assesses awareness via
training courses and evaluates compliance breaches on an annual basis Employees, contractors, vendors, and stakeholders who work with Hafnia Head of Technical, Head of People, Culture & Strategy Code of Conduct Ethical behavior,
governance, and operations Compliance breach Safe-guarding whistle- blowers Reputational effects from corruption and bribery Ensures employees respect minimum standards on work ethics Awareness sessions and annual declaration
form Employees and contrac-tors Head of Technical, Head of People, Culture & Strategy
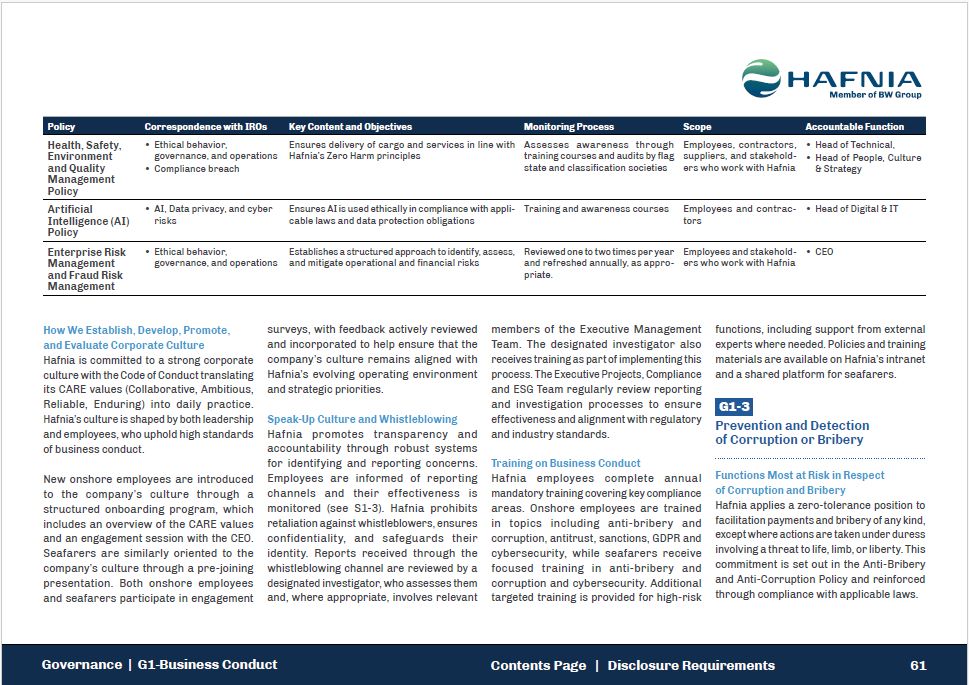
and Quality Management Policy Compliance breach state and classification
societies ers who work with Hafnia Policy Correspondence with IROs Key Content and Objectives Monitoring Process Scope Accountable Function Health, Safety, Ethical behavior, Ensures delivery of cargo and services in line
with Assesses awareness through Employees, contractors, Head of Technical, Environment governance, and operations Hafnia’s Zero Harm principles training courses and audits by flag suppliers, and stakehold- Head of People,
Culture & Strategy Artificial Intelligence (AI) AI, Data privacy, and cyber risks Ensures AI is used ethically in compliance with appli- Training and awareness courses cable laws and data protection obligations Employees and contrac-
• Head of Digital & IT tors Policy Enterprise Risk Management and Fraud Risk Management Ethical behavior, governance, and operations Establishes a structured approach to identify, assess, and mitigate operational and financial
risks Reviewed one to two times per year and refreshed annually, as appro-priate. Employees and stakehold-ers who work with Hafnia CEO How We Establish, Develop, Promote, and Evaluate Corporate Culture Hafnia is committed to a strong
corporate culture with the Code of Conduct translating its CARE values (Collaborative, Ambitious, Reliable, Enduring) into daily practice. Hafnia’s culture is shaped by both leadership and employees, who uphold high standards of business
conduct. New onshore employees are introduced to the company’s culture through a structured onboarding program, which includes an overview of the CARE values and an engagement session with the CEO. Seafarers are similarly oriented to the
company’s culture through a pre-joining presentation. Both onshore employees and seafarers participate in engagement surveys, with feedback actively reviewed and incorporated to help ensure that the company’s culture remains aligned with
Hafnia’s evolving operating environment and strategic priorities. Speak-Up Culture and Whistleblowing Hafnia promotes transparency and accountability through robust systems for identifying and reporting concerns. Employees are informed of
reporting channels and their effectiveness is monitored (see S1-3). Hafnia prohibits retaliation against whistleblowers, ensures confidentiality, and safeguards their identity. Reports received through the whistleblowing channel are reviewed by
a designated investigator, who assesses them and, where appropriate, involves relevant members of the Executive Management Team. The designated investigator also receives training as part of implementing this process. The Executive Projects,
Compliance and ESG Team regularly review reporting and investigation processes to ensure effectiveness and alignment with regulatory and industry standards. Training on Business Conduct Hafnia employees complete annual mandatory training
covering key compliance areas. Onshore employees are trained in topics including anti-bribery and corruption, antitrust, sanctions, GDPR and cybersecurity, while seafarers receive focused training in anti-bribery and corruption and
cybersecurity. Additional targeted training is provided for high-risk functions, including support from external experts where needed. Policies and training materials are available on Hafnia’s intranet and a shared platform for
seafarers. Governance | G1-Business Conduct 61 Contents Page | Disclosure Requirements G1-3 Prevention and Detection of Corruption or Bribery Functions Most at Risk in Respect of Corruption and Bribery Hafnia applies a zero-tolerance
position to facilitation payments and bribery of any kind, except where actions are taken under duress involving a threat to life, limb, or liberty. This commitment is set out in the Anti-Bribery and Anti-Corruption Policy and reinforced
through compliance with applicable laws.
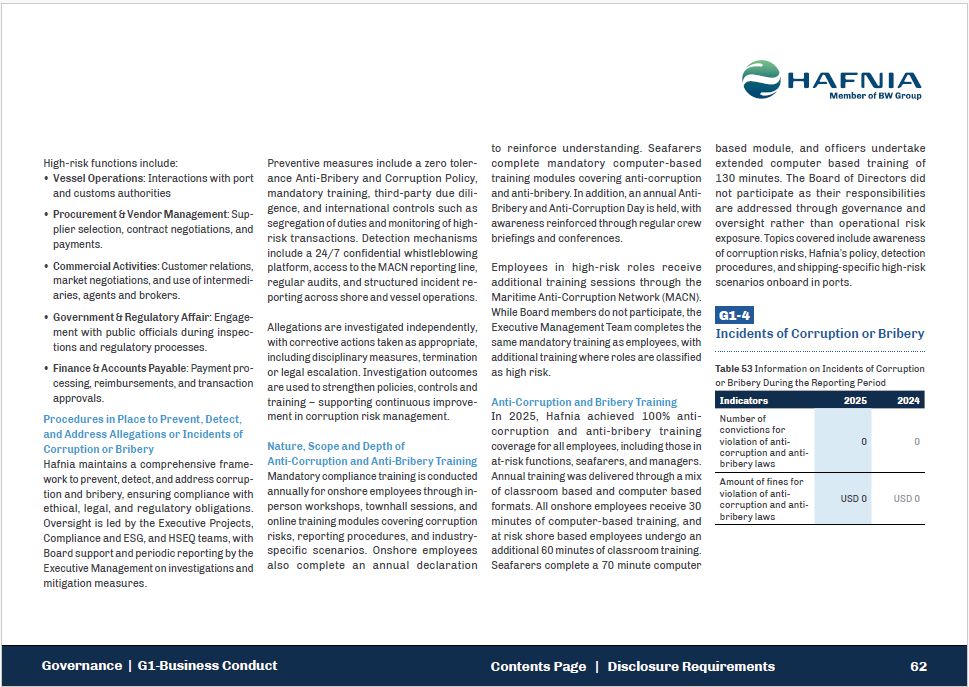
High-risk functions include: Vessel Operations: Interactions with port and
customs authorities Procurement & Vendor Management: Sup- plier selection, contract negotiations, and payments. Commercial Activities: Customer relations, market negotiations, and use of intermedi- aries, agents and brokers. Government
& Regulatory Affair: Engage- ment with public officials during inspec- tions and regulatory processes. Finance & Accounts Payable: Payment pro- cessing, reimbursements, and transaction approvals. Procedures in Place to Prevent,
Detect, and Address Allegations or Incidents of Corruption or Bribery Hafnia maintains a comprehensive frame-work to prevent, detect, and address corrup-tion and bribery, ensuring compliance with ethical, legal, and regulatory obligations.
Oversight is led by the Executive Projects, Compliance and ESG, and HSEQ teams, with Board support and periodic reporting by the Executive Management on investigations and mitigation measures. Preventive measures include a zero toler-ance
Anti-Bribery and Corruption Policy, mandatory training, third-party due dili-gence, and international controls such as segregation of duties and monitoring of high-risk transactions. Detection mechanisms include a 24/7 confidential
whistleblowing platform, access to the MACN reporting line, regular audits, and structured incident re-porting across shore and vessel operations. Allegations are investigated independently, with corrective actions taken as appropriate,
including disciplinary measures, termination or legal escalation. Investigation outcomes are used to strengthen policies, controls and training – supporting continuous improve-ment in corruption risk management. Nature, Scope and Depth
of Anti-Corruption and Anti-Bribery Training Mandatory compliance training is conducted annually for onshore employees through in-person workshops, townhall sessions, and online training modules covering corruption risks, reporting procedures,
and industry-specific scenarios. Onshore employees also complete an annual declaration to reinforce understanding. Seafarers complete mandatory computer-based training modules covering anti-corruption and anti-bribery. In addition, an annual
Anti-Bribery and Anti-Corruption Day is held, with awareness reinforced through regular crew briefings and conferences. Employees in high-risk roles receive additional training sessions through the Maritime Anti-Corruption Network (MACN).
While Board members do not participate, the Executive Management Team completes the same mandatory training as employees, with additional training where roles are classified as high risk. Anti-Corruption and Bribery Training In 2025, Hafnia
achieved 100% anti-corruption and anti-bribery training coverage for all employees, including those in at-risk functions, seafarers, and managers. Annual training was delivered through a mix of classroom based and computer based formats. All
onshore employees receive 30 minutes of computer-based training, and at risk shore based employees undergo an additional 60 minutes of classroom training. Seafarers complete a 70 minute computer based module, and officers undertake extended
computer based training of 130 minutes. The Board of Directors did not participate as their responsibilities are addressed through governance and oversight rather than operational risk exposure. Topics covered include awareness of corruption
risks, Hafnia’s policy, detection procedures, and shipping-specific high-risk scenarios onboard in ports. Governance | G1-Business Conduct 62 Contents Page | Disclosure Requirements G1-4 Incidents of Corruption or Bribery Table 53
Information on Incidents of Corruption or Bribery During the Reporting Period Indicators 2025 2024 Number of convictions for violation of anti-corruption and anti-bribery laws 0 0 Amount of fines for violation of anti-corruption and
anti-bribery laws USD 0 USD 0
Limited Assurance Report Contents Page | Disclosure Requirements 63 General
Disclosures | Environment | Social | Governance | Limited Assurance Report
KPMG AS Dronning Eufemias gate 6A P.O. Box 7000 Majorstuen N-0306
Oslo Telephone +47 45 40 40 63 Internet www.kpmg.no Enterprise 935 174 627 MVA To the General Meeting of Hafnia Limited Limited Assurance Report 64 Contents Page | Disclosure Requirements Independent Sustainability Auditor’s Limited
Assurance Report Limited Assurance Conclusion We have conducted a limited assurance engagement on the consolidated sustainability statement of Hafnia Limited (the «Company»), included in in the ESG section of the Board of Directors' report
(the «Sustainability Statement»), as at 31 December 2025 and for the year then ended. Based on the procedures we have performed and the evidence we have obtained, nothing has come to our attention that causes us to believe that the
Sustainability Statement is not prepared, in all material respects, in accordance with the Norwegian Accounting Act section 2-3, including: compliance with the European Sustainability Reporting Standards (ESRS), including that the process
carried out by the Company to identify the information reported in the Sustainability Statement (the «Process») is in accordance with the description set out in the section ESRS 2 subsection IRO-1: Description of the Process to Identify and
Assess Material Impacts, Risks and Opportunities; and compliance of the disclosures in the Environment section, subsection EU Taxonomy Reporting in 2025 of the Sustainability Statement with Article 8 of EU Regulation 2020/852 (the «Taxonomy
Regulation»). Basis for Conclusion We conducted our limited assurance engagement in accordance with International Standard on Assurance Engagements (ISAE) 3000 (Revised), Assurance engagements other than audits or reviews of historical
financial information («ISAE 3000 (Revised)»), issued by the International Auditing and Assurance Standards Board. We believe that the evidence we have obtained is sufficient and appropriate to provide a basis for our conclusion. Our
responsibilities under this standard are further described in the Sustainability Auditor’s Responsibilities section of our report. Our Independence and Quality Management We have complied with the independence and other ethical requirements
as required by relevant laws and regulations in Norway and the International Code of Ethics for Professional Accountants (including International Independence Standards) issued by the International Ethics Standards Board for Accountants
(IESBA Code), which is founded on fundamental principles of integrity, objectivity, professional competence and due care, confidentiality and professional behaviour. The firm applies International Standard on Quality Management 1, which
requires the firm to design, implement and operate a system of quality
management including policies or procedures regarding compliance with ethical requirements, professional standards and applicable legal and regulatory requirements. Limited Assurance Report 65 Contents Page | Disclosure
Requirements Responsibilities for the Sustainability Statement The Board of Directors and the Managing Director (Management) are responsible for designing and implementing a process to identify the information reported in the Sustainability
Statement in accordance with the ESRS and for disclosing this Process in the section ESRS 2 subsection IRO-1: Description of the Process to Identify and Assess Material Impacts, Risks and Opportunities of the Sustainability Statement. This
responsibility includes: understanding the context in which the Group's activities and business relationships take place and developing an understanding of its affected stakeholders; the identification of the actual and potential impacts
(both negative and positive) related to sustainability matters, as well as risks and opportunities that affect, or could reasonably be expected to affect, the Group's financial position, financial performance, cash flows, access to finance or
cost of capital over the short-, medium-, or long-term; the assessment of the materiality of the identified impacts, risks and opportunities related to sustainability matters by selecting and applying appropriate thresholds; and making
assumptions that are reasonable in the circumstances. Management is further responsible for the preparation of the Sustainability Statement, in accordance with the Norwegian Accounting Act section 2-3, including: compliance with the
ESRS; preparing the disclosures in the Environment section, subsection EU Taxonomy Reporting in 2025 of the Sustainability Statement, in compliance with the Taxonomy Regulation; designing, implementing and maintaining such internal control
that Management determines is necessary to enable the preparation of the Sustainability Statement that is free from material misstatement, whether due to fraud or error; and the selection and application of appropriate sustainability
reporting methods and making assumptions and estimates that are reasonable in the circumstances. Inherent limitations in preparing the Sustainability Statement In reporting forward-looking information in accordance with ESRS, Management is
required to prepare the forward-looking information on the basis of disclosed assumptions about events that may occur in the future and possible future actions by the Group. Actual outcomes are likely to be different since anticipated events
frequently do not occur as expected. Sustainability Auditor’s Responsibilities Our responsibility is to plan and perform the assurance engagement to obtain limited assurance about whether the Sustainability Statement is free from material
misstatement, whether due to fraud or error, and to issue a limited assurance report that includes our conclusion. Misstatements can arise from fraud or error and are considered material if, individually or in the aggregate, they could
reasonably be expected to influence decisions of users taken on the basis of the Sustainability Statement as a whole. As part of a limited assurance engagement in accordance with ISAE 3000 (Revised) we exercise professional judgement and
maintain professional scepticism throughout the engagement. Our responsibilities in respect of the Sustainability Statement, in relation to the Process, include: Obtaining an understanding of the Process, but not for the purpose of
providing a conclusion on the effectiveness of the Process, including the outcome of the Process;
Considering whether the information identified addresses the applicable
disclosure requirements of the ESRS; and Limited Assurance Report 66 Contents Page | Disclosure Requirements Designing and performing procedures to evaluate whether the Process is consistent with the Company’s description of its Process
set out in the section ESRS 2 subsection IRO-1: Description of the Process to Identify and Assess Material Impacts, Risks and Opportunities. Our other responsibilities in respect of the Sustainability Statement include: Identifying where
material misstatements are likely to arise, whether due to fraud or error; and Designing and performing procedures responsive to where material misstatements are likely to arise in the Sustainability Statement. The risk of not detecting a
material misstatement resulting from fraud is higher than for one resulting from error, as fraud may involve collusion, forgery, intentional omissions, misrepresentations, or the override of internal control. Summary of the Work Performed A
limited assurance engagement involves performing procedures to obtain evidence about the Sustainability Statement. The procedures in a limited assurance engagement vary in nature and timing from, and are less in extent than for, a reasonable
assurance engagement. Consequently, the level of assurance obtained in a limited assurance engagement is substantially lower than the assurance that would have been obtained had a reasonable assurance engagement been performed. The nature,
timing and extent of procedures selected depend on professional judgement, including the identification of disclosures where material misstatements are likely to arise in the Sustainability Statement, whether due to fraud or error. In
conducting our limited assurance engagement, with respect to the Process, we: Obtained an understanding of the Process by: performing inquiries to understand the sources of the information used by management (e.g., stakeholder engagement,
business plans and strategy documents); and reviewing the Company’s internal documentation of its Process; and Evaluated whether the evidence obtained from our procedures with respect to the Process implemented by the Company was consistent
with the description of the Process set out in the section ESRS 2 subsection IRO-1: Description of the Process to Identify and Assess Material Impacts, Risks and Opportunities. In conducting our limited assurance engagement, with respect to
the Sustainability Statement, we: Obtained an understanding of the Group’s reporting processes relevant to the preparation of its Sustainability Statement by: Obtaining an understanding of the Group's control environment, processes, control
activities and information system relevant to the preparation of the Sustainability Statement, but not for the purpose of providing a conclusion on the effectiveness of the Group’s internal control; and Obtaining an understanding of the
Group’s risk assessment process; Evaluated whether the information identified by the Process is included in the Sustainability Statement; Evaluated whether the structure and the presentation of the Sustainability Statement is in accordance
with the ESRS; Performed inquiries of relevant personnel and analytical procedures on selected information in the Sustainability
Statement; Performed substantive assurance procedures on selected information
in the Sustainability Statement; Where applicable, compared disclosures in the Sustainability Statement with the corresponding disclosures in the financial statements and other sections of the Board of Directors' report; Evaluated the
methods, assumptions and data for developing estimates and forward-looking information; Obtained an understanding of the Company’s process to identify taxonomy-eligible and taxonomy-aligned economic activities and the corresponding
disclosures in the Sustainability Statement; Evaluated whether information about the identified taxonomy-eligible and taxonomy-aligned economic activities is included in the Sustainability Statement; and Performed inquiries of relevant
personnel and substantive procedures on selected taxonomy disclosures included in the Sustainability Statement. Oslo, 17 April 2026 KPMG AS Dave Vijfvinkel State Authorised Public Accountant – Sustainability Auditor Limited Assurance
Report 67 Contents Page | Disclosure Requirements