QUARTERLY REPORT PURSUANT TO SECTION 13 OR 15(d) OF THE SECURITIES EXCHANGE ACT OF 1934
For the quarterly period ended June 30, 2025
OR
☐
TRANSITION REPORT PURSUANT TO SECTION 13 OR 15(d) OF THE SECURITIES EXCHANGE ACT OF 1934
For the transition period from______ to______
Commission File Number: 001-39493
SPIRE GLOBAL, INC.
(Exact Name of Registrant as Specified in its Charter)
Delaware
85-1276957
(State or other jurisdiction of
incorporation or organization)
(I.R.S. Employer Identification No.)
8000 Towers Crescent Drive
Suite 1100
Vienna, Virginia22182
(Address of principal executive offices) (Zip Code)
(202) 301-5127
(Registrant’s telephone number, including area code)
Securities registered pursuant to Section 12(b) of the Act:
Title of each class
Trading
Symbol(s)
Name of each exchange on which registered
Class A common stock, par value of $0.0001 per share
SPIR
New York Stock Exchange
Indicate by check mark whether the registrant (1) has filed all reports required to be filed by Section 13 or 15(d) of the Securities Exchange Act of 1934 during the preceding 12 months (or for such shorter period that the registrant was required to file such reports), and (2) has been subject to such filing requirements for the past 90 days. Yes ☒ No ☐
Indicate by check mark whether the registrant has submitted electronically every Interactive Data File required to be submitted pursuant to Rule 405 of Regulation S-T (§232.405 of this chapter) during the preceding 12 months (or for such shorter period that the registrant was required to submit such files). Yes ☒ No ☐
Indicate by check mark whether the registrant is a large accelerated filer, an accelerated filer, a non-accelerated filer, smaller reporting company, or an emerging growth company. See the definitions of “large accelerated filer,” “accelerated filer,” “smaller reporting company,” and “emerging growth company” in Rule 12b-2 of the Exchange Act.
Large accelerated filer
☐
Accelerated filer
☐
Non-accelerated filer
☒
Smaller reporting company
☒
Emerging growth company
☒
If an emerging growth company, indicate by check mark if the registrant has elected not to use the extended transition period for complying with any new or revised financial accounting standards provided pursuant to Section 13(a) of the Exchange Act. ☐
Indicate by check mark whether the registrant is a shell company (as defined in Rule 12b-2 of the Exchange Act). Yes ☐ No ☒
The registrant had outstanding32,724,586 shares of Class A common stock and 1,507,325 shares of Class B common stock as of October 24, 2025.
This Quarterly Report on Form 10-Q contains forward-looking statements within the meaning of the federal securities laws, which statements involve substantial risks and uncertainties. Forward-looking statements generally relate to future events or our future financial or operating performance. In some cases, you can identify forward-looking statements because they contain words such as “may,” “will,” “should,” “expect,” “plan,” “anticipate,” “could,” “would,” “intend,” “target,” “project,” “contemplate,” “believe,” “estimate,” “predict,” “potential,” “seek” or “continue” or the negative of these words or other similar terms or expressions that concern our expectations, strategy, plans or intentions. Forward-looking statements contained in this Quarterly Report on Form 10-Q include, but are not limited to, statements about:
•
significant political, trade, regulatory developments, and other circumstances beyond our control, including as a result of recently announced tariffs, could have a material adverse effect on our financial condition or results of operations;
•
changes in our growth, strategy, future operations, financial position, estimated revenues and losses, projected costs, prospects, and plans;
•
our ability to remedy identified material weaknesses;
•
the ability to develop new offerings, services, solutions and features and bring them to market in a timely manner and make enhancements to our business;
•
the quality and effectiveness of and advancements in our technology and our ability to accurately and effectively use data and engage in predictive analytics;
•
overall level of customer demand for our products and services;
•
expectations and timing related to product launches;
•
expectations of achieving and maintaining profitability;
•
projections of total addressable markets, market opportunity, and market share;
•
our ability to acquire data sets, software, equipment, satellite components, and regulatory approvals from third parties;
•
our expectations concerning relationships with third parties;
•
our ability to acquire or develop products or technologies we believe could complement or expand our platform or to expand our products and services internationally;
•
our ability to obtain and protect patents, trademarks, licenses and other intellectual property rights;
•
our ability to utilize potential net operating loss carryforwards;
•
developments and projections relating to our competitors and industries, such as the projected growth in demand for space-based data;
•
our ability to acquire new customers and partners or obtain renewals, upgrades, or expansions from our existing customers;
•
our ability to compete with existing and new competitors in existing and new markets and offerings;
•
our ability to retain or recruit officers, key employees or directors;
•
our business, expansion plans, and opportunities;
•
our expectations regarding regulatory approvals and authorizations;
•
the expectations regarding the effects of existing and developing laws and regulations, including with respect to regulations around satellites, intellectual property law, and privacy and data protection; and
•
global and domestic economic conditions, including currency exchange rate fluctuations, inflation, elevated interest rates, and geopolitical uncertainty and instability, and their impact on demand and pricing for our offerings in affected markets.
We caution you that the foregoing list may not contain all of the forward-looking statements made in this Quarterly Report on Form 10-Q. You should not rely upon forward-looking statements as predictions of future events. We have based the forward-looking statements contained in this Quarterly Report on Form 10-Q primarily on our current expectations and projections about
3
future events and trends that we believe may affect our business, financial condition, results of operations, and prospects. The outcome of the events described in these forward-looking statements is subject to risks, uncertainties, and other factors, including those described in Part I, Item 1A “Risk Factors” of our Annual Report on Form 10-K/A for the year ended December 31, 2024 and in Part II, Item 1A “Risk Factors” of this Quarterly Report on Form 10-Q. Moreover, we operate in a very competitive and rapidly changing environment. New risks and uncertainties emerge from time to time and it is not possible for us to predict all risks and uncertainties that could have an impact on the forward-looking statements contained in this Quarterly Report on Form 10-Q. We cannot assure you that the results, events, and circumstances reflected in the forward-looking statements will be achieved or occur, and actual results, events, or circumstances could differ materially from those described in the forward-looking statements.
Neither we nor any other person assumes responsibility for the accuracy and completeness of any of these forward-looking statements. Moreover, the forward-looking statements made in this Quarterly Report on Form 10-Q relate only to expectations as of the date on which the statements are made. We undertake no obligation to update any forward-looking statements made in this Quarterly Report on Form 10-Q to reflect events or circumstances after the date of this Quarterly Report on Form 10-Q or to reflect new information or the occurrence of unanticipated events, except as required by law. We may not actually achieve the plans, intentions or expectations disclosed in our forward-looking statements and you should not place undue reliance on our forward-looking statements. Our forward-looking statements do not reflect the potential impact of any future acquisitions, mergers, dispositions, joint ventures or investments we may make.
In addition, statements that “we believe” and similar statements reflect our beliefs and opinions on the relevant subject. These statements are based upon information available to us as of the date of this Quarterly Report on Form 10-Q, and while we believe such information forms a reasonable basis for such statements, such information may be limited or incomplete, and our statements should not be read to indicate that we have conducted an exhaustive inquiry into, or review of, all potentially available relevant information. These statements are inherently uncertain and investors are cautioned not to unduly rely upon these statements.
(In thousands, except share and per share amounts)
(Unaudited)
June 30,
December 31,
2025
2024
Assets
Current assets
Cash and cash equivalents
$
36,114
$
19,206
Marketable securities
81,503
—
Accounts receivable, net (including allowance of $364 and $148 as of June 30, 2025 and December 31, 2024, respectively)
7,484
11,926
Contract assets
2,376
785
Other current assets
4,846
3,278
Assets classified as held for sale
—
56,963
Total current assets
132,323
92,158
Property and equipment, net
68,994
63,338
Operating lease right-of-use assets
11,300
11,074
Goodwill
15,485
14,735
Other intangible assets
9,880
10,161
Other long-term assets
1,548
2,109
Total assets
$
239,530
$
193,575
Liabilities and Stockholders’ Equity
Current liabilities
Accounts payable
$
8,893
$
11,592
Long-term debt, current portion
—
93,936
Contract liabilities, current portion
24,609
22,037
Other accrued expenses
20,897
16,361
Liabilities associated with assets classified as held for sale
—
7,667
Total current liabilities
54,399
151,593
Contract liabilities, non-current
24,501
23,489
Warrant liability
252
13,641
Operating lease liabilities, net of current portion
9,178
9,598
Other long-term liabilities
1,966
6,941
Total liabilities
90,296
205,262
Commitments and contingencies (Note 10)
Stockholders’ equity
Common stock, $0.0001 par value, 1,000,000,000 Class A and 15,000,000 Class B shares authorized, 32,236,004 Class A and 1,507,325 Class B shares issued and outstanding at June 30, 2025; 25,711,165 Class A and 1,507,325 Class B shares issued and outstanding at December 31, 2024
3
3
Additional paid-in capital
596,804
536,725
Accumulated other comprehensive loss
(5,003
)
(9,770
)
Accumulated deficit
(442,570
)
(538,645
)
Total stockholders’ equity (deficit)
149,234
(11,687
)
Total liabilities and stockholders’ equity
$
239,530
$
193,575
The accompanying notes are an integral part of these unaudited Condensed Consolidated Financial Statements.
5
Spire Global, Inc.
Condensed Consolidated Statements of Operations
(In thousands, except share and per share amounts)
(Unaudited)
Three Months Ended June 30,
Six Months Ended June 30,
2025
2024
2025
2024
Revenue
$
19,182
$
25,399
$
43,058
$
60,224
Cost of revenue
9,806
14,488
24,970
40,084
Gross profit
9,376
10,911
18,088
20,140
Operating expenses:
Research and development
10,195
7,517
18,854
13,554
Sales and marketing
4,412
5,168
9,943
10,286
General and administrative
17,186
10,009
34,836
19,853
Loss on decommissioned satellites
1,110
529
6,270
707
Allowance for current expected credit loss on notes receivable
—
40
—
80
Total operating expenses
32,903
23,263
69,903
44,480
Loss from operations
(23,527
)
(12,352
)
(51,815
)
(24,340
)
Other income (expense):
Interest income
646
571
666
1,025
Interest expense
(1,686
)
(4,773
)
(7,416
)
(9,826
)
Gain on sale of a business
154,305
—
154,305
—
Loss on extinguishment of debt
(12,008
)
—
(12,008
)
—
Change in fair value of contingent earnout liability
(227
)
(1,187
)
811
(1,232
)
Change in fair value of warrant liabilities
(2,790
)
2,239
3,047
(1,963
)
Issuance of stock warrants
—
—
—
(2,399
)
Foreign exchange gain (loss)
6,965
(513
)
10,791
(2,299
)
Other expense, net
(287
)
(477
)
(511
)
(1,011
)
Total other income (expense), net
144,918
(4,140
)
149,685
(17,705
)
Income (loss) before income taxes
121,391
(16,492
)
97,870
(42,045
)
Income tax provision
1,801
67
1,795
58
Net income (loss)
$
119,590
$
(16,559
)
$
96,075
$
(42,103
)
Earnings (loss) per share:
Basic
$
3.80
$
(0.68
)
$
3.29
$
(1.82
)
Diluted
$
3.72
$
(0.68
)
$
3.03
$
(1.82
)
Shares used in computing earnings per share:
Basic
31,398,176
24,487,484
29,105,374
23,150,265
Diluted
32,093,646
24,487,484
30,441,536
23,150,265
The accompanying notes are an integral part of these unaudited Condensed Consolidated Financial Statements.
6
Spire Global, Inc.
Condensed Consolidated Statements of Comprehensive Income (Loss)
(In thousands)
(Unaudited)
Three Months Ended June 30,
Six Months Ended June 30,
2025
2024
2025
2024
Net income (loss)
$
119,590
$
(16,559
)
$
96,075
$
(42,103
)
Other comprehensive income (loss):
Foreign currency translation adjustments
7,445
(729
)
4,770
(2,289
)
Net unrealized loss on investments (net of tax)
(3
)
—
(3
)
(2
)
Comprehensive income (loss)
$
127,032
$
(17,288
)
$
100,842
$
(44,394
)
The accompanying notes are an integral part of these unaudited Condensed Consolidated Financial Statements.
7
Spire Global, Inc.
Condensed Consolidated Statements of Changes in Stockholders’ Equity
(In thousands, except share amounts)
(Unaudited)
Common Stock
Additional Paid in
Accumulated Other Comprehensive
Accumulated
Total Stockholders'
Shares
Amount
Capital
Loss
Deficit
Equity
Balance, March 31, 2025
32,474,439
$
3
$
578,317
$
(12,445
)
$
(562,160
)
$
3,715
Release of Restricted Stock Units and Performance Stock Units
513,077
—
—
—
—
—
Issuance of common stock under Employee Stock Purchase Plan
50,266
—
443
—
—
443
Exercise of stock options
32,401
—
230
—
—
230
Stock compensation expense
—
—
6,222
—
—
6,222
Exercise of warrants
673,146
11,592
11,592
Net income
—
—
—
—
119,590
119,590
Foreign currency translation adjustments
—
—
—
7,445
—
7,445
Net unrealized loss on investments (net of tax)
—
—
—
(3
)
—
(3
)
Balance, June 30, 2025
33,743,329
$
3
$
596,804
$
(5,003
)
$
(442,570
)
$
149,234
Common Stock
Additional Paid in
Accumulated Other Comprehensive
Accumulated
Total Stockholders'
Shares
Amount
Capital
Loss
Deficit
(Deficit) Equity
Balance, December 31, 2024
27,218,490
$
3
$
536,725
$
(9,770
)
$
(538,645
)
$
(11,687
)
Release of Restricted Stock Units and Performance Stock Units
852,136
—
—
—
—
—
Issuance of common stock under Employee Stock Purchase Plan
50,266
443
443
Exercise of stock options
105,541
—
870
—
—
870
Stock compensation expense
—
—
11,127
—
—
11,127
Issuance of common stock under the Securities Purchase Agreements, net
4,843,750
—
36,047
—
—
36,047
Exercise of warrants
673,146
11,592
11,592
Net income
—
—
—
—
96,075
96,075
Foreign currency translation adjustments
—
—
—
4,770
—
4,770
Net unrealized loss on investments (net of tax)
—
—
—
(3
)
—
(3
)
Balance, June 30, 2025
33,743,329
$
3
$
596,804
$
(5,003
)
$
(442,570
)
$
149,234
8
Common Stock
Additional Paid in
Accumulated Other Comprehensive
Accumulated
Total Stockholders'
Shares
Amount
Capital
Loss
Deficit
Equity
Balance, March 31, 2024
25,822,914
$
3
$
519,400
$
(6,118
)
$
(460,830
)
$
52,455
Release of Restricted Stock Units
380,235
—
—
—
—
—
Issuance of common stock under Employee Stock Purchase Plan
79,903
—
370
—
—
370
Exercise of stock options
222
—
2
—
—
2
Stock compensation expense
—
—
4,795
—
—
4,795
Net loss
—
—
—
—
(16,559
)
(16,559
)
Foreign currency translation adjustments
—
—
—
(729
)
—
(729
)
Balance, June 30, 2024
26,283,274
$
3
$
524,567
$
(6,847
)
$
(477,389
)
$
40,334
Common Stock
Additional Paid in
Accumulated Other Comprehensive
Accumulated
Total Stockholders'
Shares
Amount
Capital
Loss
Deficit
Equity
Balance, December 31, 2023
22,604,676
$
2
$
477,624
$
(4,556
)
$
(435,286
)
$
37,784
Release of Restricted Stock Units and Performance Stock Units
584,746
—
—
—
—
—
Issuance of common stock under Employee Stock Purchase Plan
79,903
—
370
—
—
370
Exercise of stock options
37,758
—
269
—
—
269
Stock compensation expense
—
—
8,423
—
—
8,423
Issuance of common stock under Securities Purchase Agreements, net
2,976,191
1
37,881
—
—
37,882
Net loss
—
—
—
—
(42,103
)
(42,103
)
Foreign currency translation adjustments
—
—
—
(2,289
)
—
(2,289
)
Net unrealized loss on investments (net of tax)
—
—
—
(2
)
—
(2
)
Balance, June 30, 2024
26,283,274
$
3
$
524,567
$
(6,847
)
$
(477,389
)
$
40,334
The accompanying notes are an integral part of these unaudited Condensed Consolidated Financial Statements.
9
Spire Global, Inc.
Condensed Consolidated Statements of Cash Flows
(In thousands)
(Unaudited)
Six Months Ended June 30,
2025
2024
Cash flows from operating activities
Net income (loss)
$
96,075
$
(42,103
)
Adjustments to reconcile net income (loss) to net cash used in operating activities:
Depreciation and amortization
6,937
12,489
Stock-based compensation
11,127
8,423
Amortization of operating lease right-of-use assets
1,519
1,798
Change in fair value of warrant liabilities
(3,047
)
1,963
Change in fair value of contingent earnout liability
(811
)
1,232
Issuance of stock warrants
—
2,399
Loss on decommissioned satellites and disposal of assets
6,270
924
Loss on extinguishment of debt
12,008
—
Gain on sale of a business
(154,305
)
—
Transaction costs on sale of a business
(23,744
)
—
Other, net
2,483
1,652
Changes in operating assets and liabilities:
Accounts receivable, net
5,597
(2,689
)
Contract assets
(1,285
)
712
Other current assets
(1,769
)
7,656
Other long-term assets
(959
)
965
Accounts payable
(4,931
)
(965
)
Accrued wages and benefits
2,693
(117
)
Contract liabilities
2,497
(6,161
)
Other accrued expenses
1,404
275
Operating lease liabilities
(1,255
)
(1,692
)
Other long-term liabilities
(8
)
—
Net cash used in operating activities
(43,504
)
(13,239
)
Cash flows from investing activities
Purchases of short-term investments
(81,118
)
(30,147
)
Maturities of short-term investments
—
20,000
Purchase of property and equipment
(12,507
)
(12,585
)
Proceeds from sale of a business, net of cash
238,948
—
Net cash provided by (used in) investing activities
145,323
(22,732
)
Cash flows from financing activities
Proceeds from Securities Purchase Agreements, net
37,297
37,881
Payments on long-term debt
(105,742
)
(10,113
)
Payments on long-term debt closing fees
(9,091
)
—
Proceeds from exercise of stock options
870
269
Proceeds from employee stock purchase plan
443
370
Net cash (used in) provided by financing activities
(76,223
)
28,407
Effect of foreign currency translation on cash, cash equivalents and restricted cash
(8,588
)
1,947
Net increase (decrease) in cash, cash equivalents and restricted cash
17,008
(5,617
)
Cash, cash equivalents and restricted cash
Beginning balance
19,684
29,633
Ending balance
$
36,692
$
24,016
Supplemental disclosure of cash flow information
Cash paid for interest
$
6,919
$
7,643
Income taxes paid
$
—
$
42
Noncash operating, investing and financing activities
Property and equipment purchased but not yet paid
$
2,264
$
1,373
Right-of-use assets obtained in exchange for lease liabilities
$
1,136
$
490
The accompanying notes are an integral part of these unaudited Condensed Consolidated Financial Statements.
10
Spire Global, Inc.
Notes to Condensed Consolidated Financial Statements
(In thousands, except shares and per share data, unless otherwise noted)
(Unaudited)
1.
Nature of Business
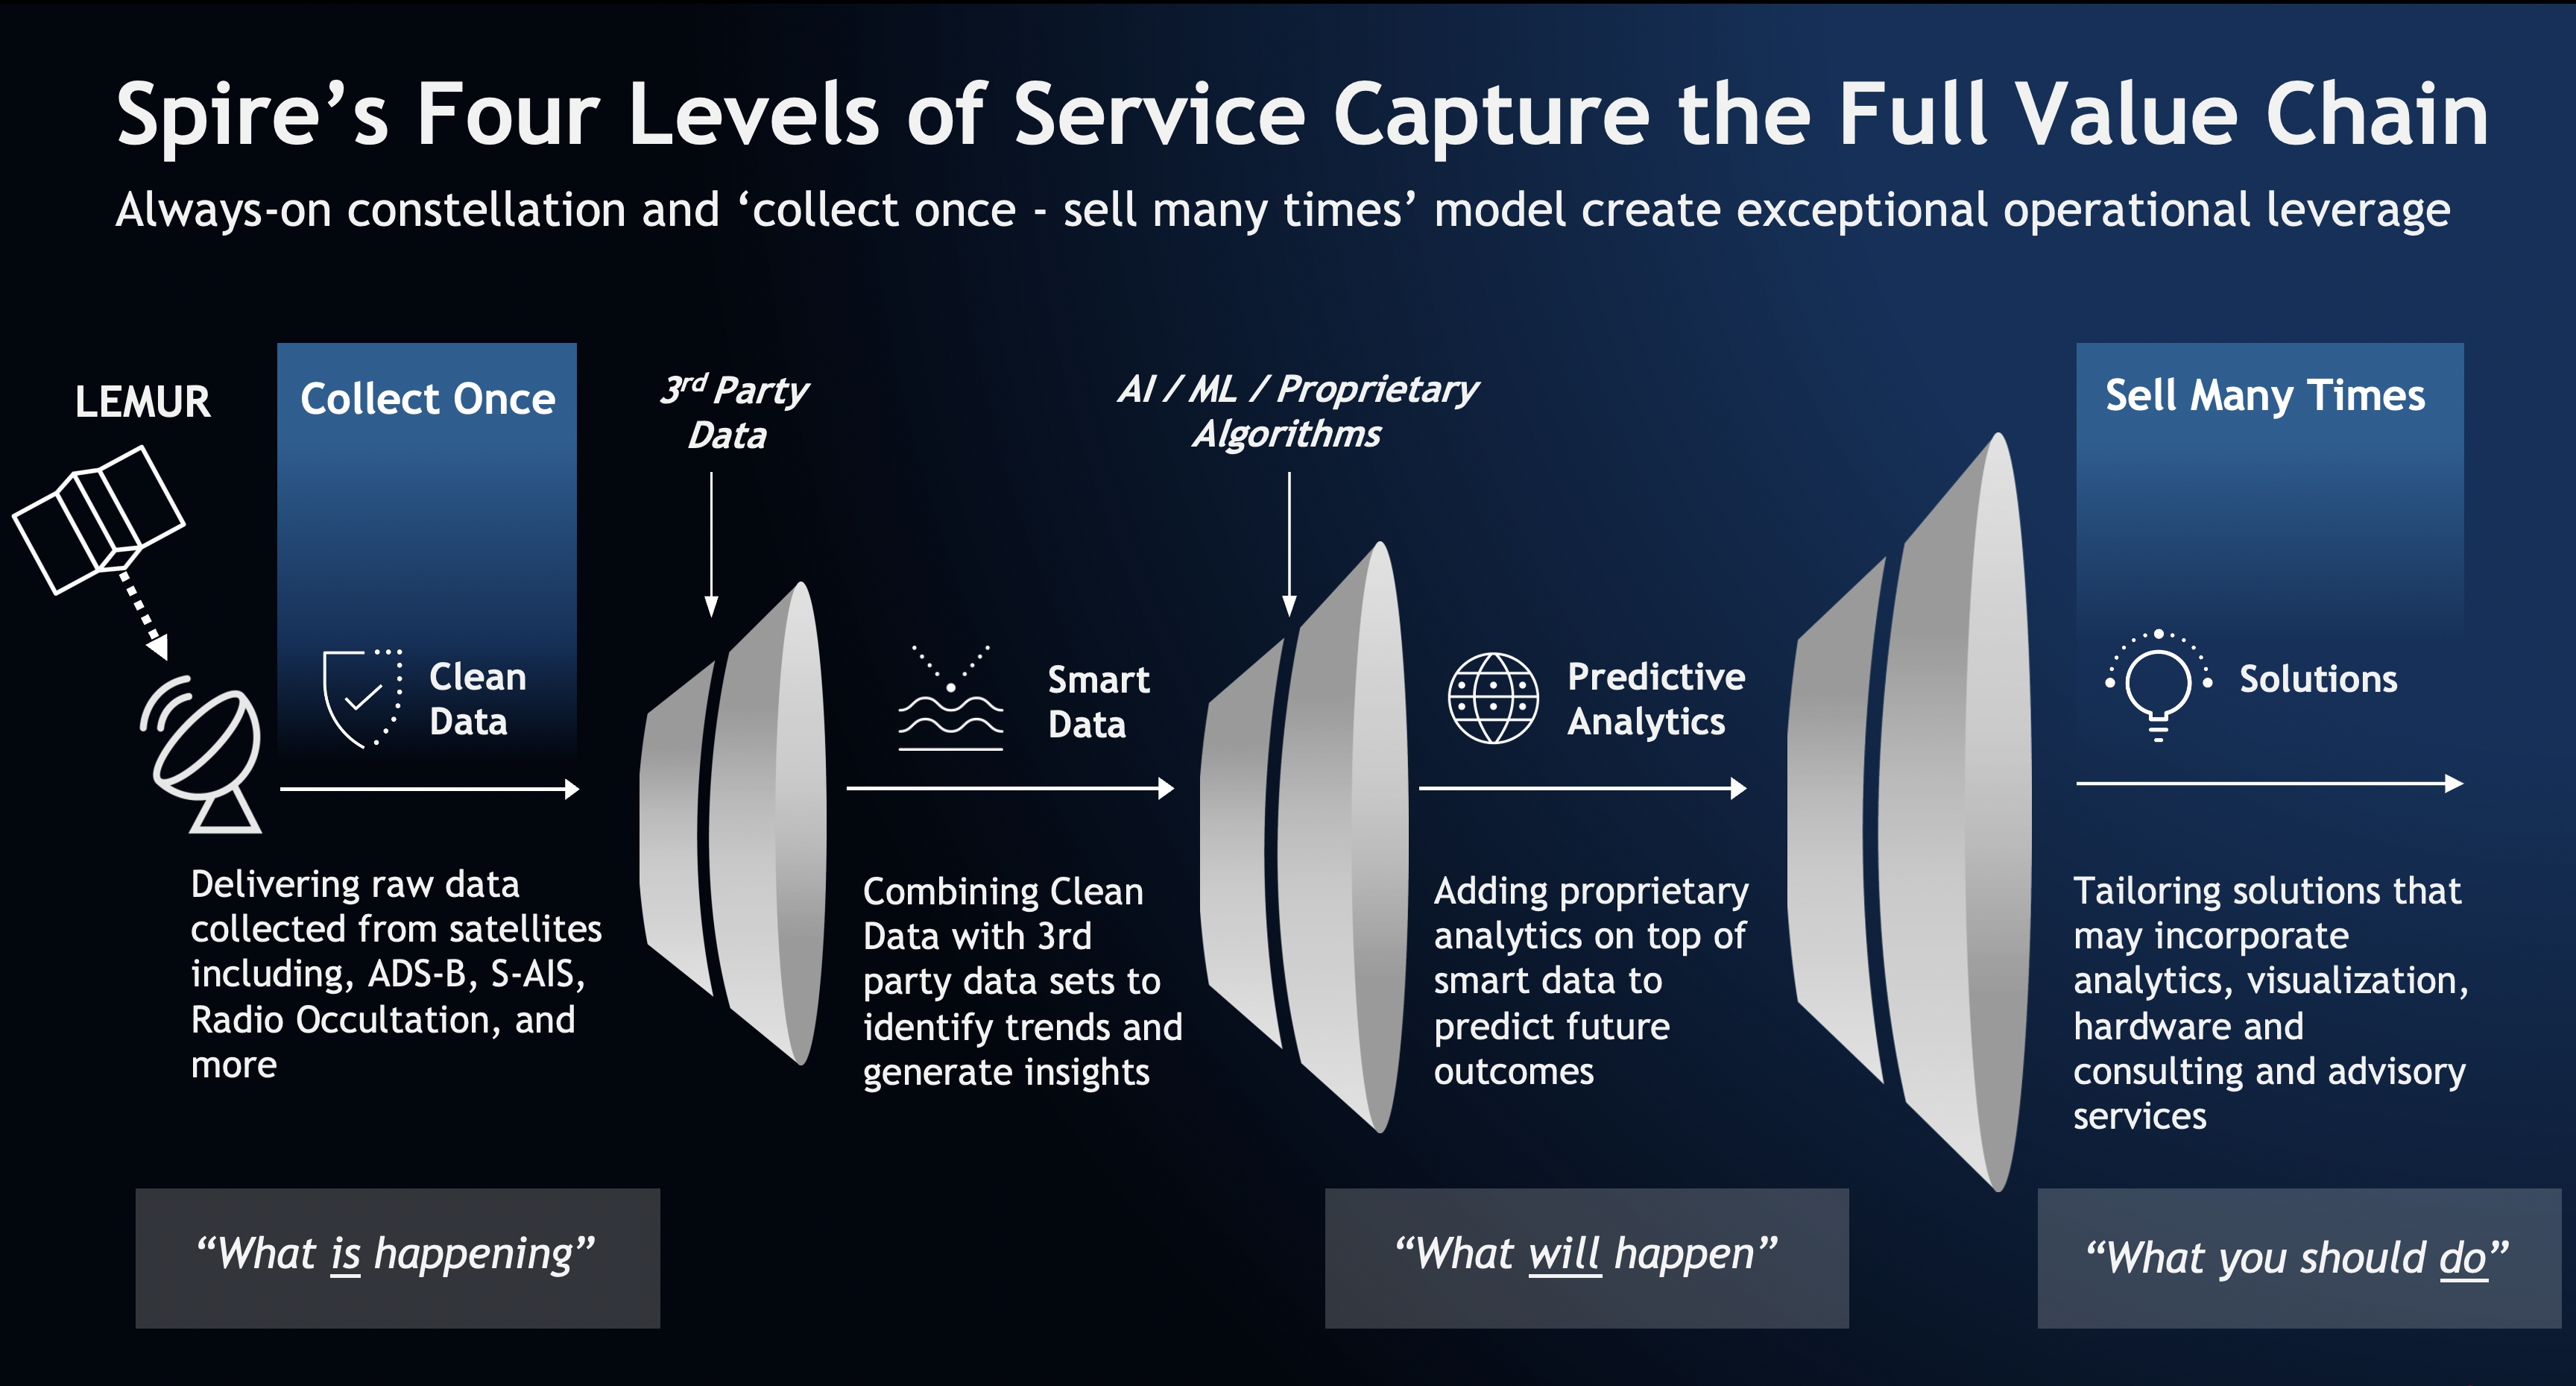
Spire Global, Inc. (“Spire” or the “Company”), founded in August 2012, is a global provider of space-based data, analytics and space services, offering unique datasets and powerful insights about Earth from space. The Company collects this space-based data through its proprietary constellation of multi-purpose nanosatellites. The Company builds, owns, and operates a fully deployed satellite constellation that observes the Earth in real time using radio frequency technology. The data acquired by Spire’s satellites provide global weather intelligence, ship and plane movements, and spoofing and jamming detection to better predict how their patterns impact economies, global security, business operations, and the environment. The Company also offers Space Services solutions that empower customers to leverage Spire's established infrastructure to put their business in space.
The Company is headquartered in Vienna, Virginia and has wholly owned operating subsidiaries in the United States, United Kingdom, Luxembourg, Singapore, Germany, and Canada.
On August 16, 2021, Spire Global Subsidiary, Inc. (formerly known as Spire Global, Inc.) (“Legacy Spire”) merged with NavSight Holdings, Inc. (“NavSight”), a special purpose acquisition company. As a result, Legacy Spire continued as the surviving corporation and a wholly owned subsidiary of NavSight (the “Merger,”). NavSight then changed its name to Spire Global, Inc. and Legacy Spire changed its name to Spire Global Subsidiary, Inc.
On November 13, 2024, the Company entered into a Share Purchase Agreement (the “Purchase Agreement”) with Kpler Holding SA, a Belgian corporation (“Buyer”), pursuant to which the Company agreed to sell its maritime business to Buyer and enter into certain ancillary agreements (the “Transactions”). The maritime business sold pursuant to the Transactions did not include any part of the Company’s satellite network or operations. On April 25, 2025, the Company and L3Harris Technologies, Inc. (“L3Harris”), entered into the Confidential Settlement Agreement and Mutual Release (the “Settlement Agreement”) among the Company, exactEarth Ltd. (“exactEarth”) and L3Harris, pursuant to which, upon the closing of the Transactions, Buyer paid L3Harris $17,000 (the “Settlement”) for full and complete resolution and release of all disputes asserted in connection with the Amended and Restated L3Harris Agreement dated January 21, 2020 (the “A&R L3Harris Agreement”) between the Company and L3Harris. The Company and Buyer further agreed that the Company would contribute $7,000 toward the Settlement in the form of a reduction to the cash paid by Buyer to the Company at the closing of the Transactions.
On April 25, 2025, the Company completed the sale of its maritime business to Buyer for approximately $238,948, which reflects an increase to the original purchase price to account for funds contributed by the Buyer toward the Settlement.
On March 12, 2025, the Company entered into a Securities Purchase Agreement (the “2025 Securities Purchase Agreement”) with the purchasers named therein for the private placement (the “2025 Private Placement”) of (i) 4,843,750 shares of Class A common stock at a purchase price of $8.00 per share and (ii) pre-funded warrants (the “Pre-Funded Warrants”) to purchase 156,250 shares of Class A common stock at a purchase price of $7.9999 per Pre-Funded Warrant. The Pre-Funded Warrants had an exercise price of $0.0001 per share of Class A common stock, were exercisable immediately, and remained outstanding until fully exercised. The aggregate net proceeds for the 2025 Private Placement were $37,297, after deducting offering expenses. The 2025 Private Placement closed on March 14, 2025. As of June 30, 2025, all Pre-Funded Warrants had been exercised on a cashless basis.
2.
Summary of Significant Accounting Policies
Basis of Presentation
The condensed consolidated financial statements and accompanying notes are unaudited and have been prepared in accordance with accounting principles generally accepted in the United States of America (“GAAP”) and regulations of the U.S. Securities and Exchange Commission (the “SEC”) for interim financial reporting.
Certain information and footnote disclosures normally included in consolidated financial statements prepared in accordance with GAAP have been condensed or omitted pursuant to rules and regulations applicable to interim financial reporting. The
11
Spire Global, Inc.
Notes to Condensed Consolidated Financial Statements
(In thousands, except shares and per share data, unless otherwise noted)
(Unaudited)
unaudited condensed consolidated financial statements were prepared on the same basis as the audited consolidated financial statements and, in the opinion of management, contain all adjustments, consisting of normal recurring adjustments, necessary for a fair statement of its financial position, results of operations and cash flows for the periods indicated. These condensed consolidated financial statements should be read in conjunction with the consolidated financial statements included within the Company’s Annual Report on Form 10-K/A for the year ended December 31, 2024.
The information as of December 31, 2024, included on the condensed consolidated balance sheets was derived from the Company’s audited consolidated financial statements. All intercompany accounts and transactions have been eliminated in consolidation.
Results of operations for the three and six months ended June 30, 2025, are not necessarily indicative of the results that may be expected for any other interim period or for the year ending December 31, 2025.
Revision of Previously Issued Financial Statements
During the preparation of the condensed consolidated financial statements as of and for the three months ended June 30, 2025, the Company identified two immaterial errors in previously issued financial statements. The first error related to the understatement of general and administrative expenses in the three months ended March 31, 2025. Specifically, legal expenses of $1,840 related to the Transactions were incurred during the first quarter of 2025 but were not accrued as a component of other accrued expenses in current liabilities.
The second error related to the understatement of stock-based compensation expense affecting cost of revenue, research and development, and sales and marketing expenses. The Company failed to record a portion of accelerated stock-based compensation in the three months ended December 31, 2024 and the three months ended March 31, 2025, resulting in an aggregate understatement of $541 and $1,018, respectively. This also resulted in an understatement of additional paid-in capital.
The Company evaluated these errors and concluded that they were not material to the previously issued financial statements. However, the Company has elected to correct these errors by revising the annual financial statements as of and for the year ended December 31, 2024 and the interim financial statements as of and for the three months ended March 31, 2025 in its Annual Report on Form 10-K for the year ended December 31, 2025 and the Quarterly Report on Form 10-Q for the three months ended March 31, 2026, respectively.
The tables below provide information about the adjustments as of and for the year ended December 31, 2024 and as of and for the three months ended March 31, 2025.
December 31, 2024
Condensed Consolidated Balance Sheet
As Previously Reported
Adjustments
Revised
Additional paid-in capital
$
536,184
$
541
$
536,725
Accumulated deficit
$
(538,104
)
$
(541
)
$
(538,645
)
Total stockholders’ equity
$
(11,687
)
$
—
$
(11,687
)
Total liabilities and stockholders’ equity
$
193,575
$
—
$
193,575
Year Ended December 31, 2024
Unaudited Condensed Consolidated Statements of Operations
As Previously Reported
Adjustments
Revised
Cost of revenue
$
70,560
$
16
$
70,576
Gross profit
$
39,891
$
(16
)
$
39,875
Research and development
$
29,188
$
49
$
29,237
Sales and marketing
$
22,220
$
476
$
22,696
Total operating expenses
$
108,625
$
525
$
109,150
Loss from operations
$
(68,734
)
$
(541
)
$
(69,275
)
Loss before income taxes
$
(102,659
)
$
(541
)
$
(103,200
)
Net loss
$
(102,818
)
$
(541
)
$
(103,359
)
Basic and diluted net loss per share
$
(4.26
)
$
(0.02
)
$
(4.28
)
12
Spire Global, Inc.
Notes to Condensed Consolidated Financial Statements
(In thousands, except shares and per share data, unless otherwise noted)
(Unaudited)
March 31, 2025
Unaudited Condensed Consolidated Balance Sheet
As Previously Reported
Adjustments
Revised
Other accrued expenses
$
21,985
$
1,840
$
23,825
Total current liabilities
$
161,730
$
1,840
$
163,570
Total liabilities
$
203,291
$
1,840
$
205,131
Additional paid-in capital
$
576,758
$
1,559
$
578,317
Accumulated deficit
$
(558,761
)
$
(3,399
)
$
(562,160
)
Total stockholders’ equity
$
5,555
$
(1,840
)
$
3,715
Total liabilities and stockholders’ equity
$
208,846
$
—
$
208,846
Three Months Ended March 31, 2025
Unaudited Condensed Consolidated Statements of Operations
As Previously Reported
Adjustments
Revised
Cost of revenue
$
15,092
$
72
$
15,164
Gross profit
$
8,784
$
(72
)
$
8,712
Research and development
$
8,509
$
150
$
8,659
Sales and marketing
$
4,735
$
796
$
5,531
General and administrative
$
15,810
$
1,840
$
17,650
Total operating expenses
$
34,214
$
2,786
$
37,000
Loss from operations
$
(25,430
)
$
(2,858
)
$
(28,288
)
Loss before income taxes
$
(20,663
)
$
(2,858
)
$
(23,521
)
Net loss
$
(20,657
)
$
(2,858
)
$
(23,515
)
Basic and diluted net loss per share
$
(0.77
)
$
(0.11
)
$
(0.88
)
These errors had no impact on the condensed consolidated statement of changes in stockholders’ equity or statements of comprehensive loss for the year ended December 31, 2024 and the three months ended March 31, 2025, other than the impact to net loss for the period. The errors also had no impact on total cash flows from operating, investing, or financing activities for the year ended December 31, 2024 and the three months ended March 31, 2025.
Reclassifications
Certain prior year periods amounts have been reclassified to conform with the current year period's presentation. These reclassifications had no impact on previously reported net income (loss).
Liquidity Risks and Uncertainties
The Company has a history of operating losses and negative cash flows from operations since inception. During the six months ended June 30, 2025, the Company used $43,504 in cash for operating activities and fully repaid its outstanding long-term debt. In connection with the closing of the Transactions, the Company received net cash proceeds of $109,450 and an additional $37,297, net of offering expenses, from the 2025 Private Placement. These proceeds enhanced the Company's cash position and are expected to support its liquidity needs. As of June 30, 2025, the Company held cash and cash equivalents of $36,114, excluding restricted cash of $578, and investments in short-term marketable securities of $81,503.
On November 13, 2024, the Company entered into the Purchase Agreement with Buyer, pursuant to which the Company agreed to complete the Transactions. The maritime business sold pursuant to the Transactions did not include any part of the Company’s satellite network or operations. On April 25, 2025, the Company and L3Harris entered into the Settlement Agreement among the Company, exactEarth and L3Harris, pursuant to which, upon the closing of the Transactions, Buyer paid L3Harris $17,000 for full and complete resolution and release of all disputes asserted in connection with the A&R L3Harris Agreement between the Company and L3Harris. The Company and Buyer further agreed that the Company would contribute $7,000 toward the Settlement in the form of a reduction to the cash paid by Buyer to the Company at the closing of the Transactions.
13
Spire Global, Inc.
Notes to Condensed Consolidated Financial Statements
(In thousands, except shares and per share data, unless otherwise noted)
(Unaudited)
On April 25, 2025, the Company completed the sale of its maritime business to Buyer for approximately $238,948, which reflects an increase to the original purchase price to account for funds contributed by the Buyer toward the Settlement. On April 25, 2025, the Company repaid with a portion of the proceeds of the Transactions all obligations and all amounts borrowed, and all obligations terminated, under the Blue Torch Financing Agreement (as defined below) and SIF (as defined below) loan agreement.
The Company previously disclosed substantial doubt about its ability to continue as a going concern in its Annual Report Form 10-K/A for the year ended December 31, 2024; the Company has concluded that it has sufficient liquidity to continue as a going concern for at least twelve months from the issuance date of these condensed consolidated financial statements.
The Company expects that its available cash, cash equivalents, and investments in marketable securities will be sufficient to fund operations for at least one year from the issuance date of these unaudited condensed consolidated financial statements. As of June 30, 2025, the Company had cash and cash equivalents of $36,114 and investments in short-term marketable securities of $81,503, which, together with its expected future financial results, are anticipated to provide sufficient working capital to support ongoing operations over that period.
The Company continues to incur operating losses, excluding the gain on the Transaction, and negative cash flows; however, management has evaluated these factors and, considering recent liquidity improvements, including $109,450 in net cash proceeds from the Transactions, an additional $37,297, net of offering expenses, from the 2025 Private Placement, and full repayment of long-term debt, believes that current liquidity is sufficient for ongoing operations.
Use of Estimates
The preparation of financial statements in conformity with GAAP requires management to make estimates and assumptions that affect the reported amounts of assets and liabilities, disclosures of contingent assets and liabilities at the dates of the condensed consolidated financial statements, and the reported amounts of revenues and expenses during the reporting period. Management’s significant estimates include assumptions for revenue recognition, which requires estimates of total costs used in measuring the progress of completion for the cost-based input method, allowance for current expected credit losses, realizability of deferred income tax assets, and fair value of equity awards, contingent earnout liabilities, and warrant liabilities. Actual results could differ from those estimates.
Cash, Cash Equivalents, Marketable Securities, and Restricted Cash
The Company considers all highly liquid investments with an original maturity of three months or less to be cash equivalents. Restricted cash included in other long-term assets, including restricted cash on the condensed consolidated balance sheets, represents amounts pledged as guarantees or collateral for financing arrangements and lease agreements, as contractually required.
The Company invests in highly rated securities, with the primary objective of minimizing the potential risk of principal loss. The Company’s investment policy generally requires securities to be investment grade and limits the amount of credit exposure to any one issuer. The Company’s investments in marketable debt securities have been classified and accounted for as available-for-sale. The Company classifies its marketable debt securities as either short-term or long-term based on each instrument’s underlying contractual maturity date. Unrealized gains and losses on marketable debt securities classified as available-for-sale are recognized in accumulated other comprehensive loss. Interest on securities classified as available-for-sale is included in interest income on the condensed consolidated statements of operations.
The following table shows components of cash, cash equivalents, and restricted cash reported on the condensed consolidated balance sheets and in the condensed consolidated statements of cash flows as of the dates indicated:
14
Spire Global, Inc.
Notes to Condensed Consolidated Financial Statements
(In thousands, except shares and per share data, unless otherwise noted)
(Unaudited)
June 30,
December 31,
2025
2024
Cash and cash equivalents
$
36,114
$
19,206
Restricted cash included in other long-term assets
578
478
$
36,692
$
19,684
Concentrations of Credit Risk
Financial instruments that potentially subject the Company to concentrations of credit risk consist of cash, cash equivalents and restricted cash, marketable securities, notes receivable, and accounts receivable. The Company typically has cash accounts in excess of Federal Deposit Insurance Corporation insurance coverage limits. The Company has a $4,500 note receivable and a $744 accrued interest balance outstanding relating to one customer. Both the note and the accrued interest are on nonaccrual status as of June 30, 2025 and December 31, 2024. The Company has an allowance for current expected credit loss on the note receivable and accrued interest balance for the full amount as of each of June 30, 2025 and December 31, 2024 (see Note 10).
The Company’s policy is to place receivables on nonaccrual status when collection of principal or interest is no longer reasonably assured, typically when amounts are more than 90 days past due or earlier if indicators of credit deterioration exist. Interest income is not recognized on nonaccrual assets. A receivable is returned to accrual status only when all past-due amounts are repaid and collectability is reasonably assured.
The Company has a concentration of contractual revenue arrangements with various government agencies.
The following customers represented 10% or more of the Company’s total revenue and total accounts receivable for each of the following periods:
Three Months Ended June 30,
Six Months Ended June 30,
Revenue:
2025
2024
2025
2024
Customer A(1)
20
%
31
%
17
%
23
%
Customer B
10
%
0
%
*
*
Customer C
16
%
*
13
%
*
Customer D
*
*
*
16
%
* Revenue from customer was less than 10% of total revenue during the applicable period.
(1)Consists of multiple U.S. government agencies, of which one government agency represented greater than 10% of total revenue for the three and six months ended June 30, 2024.
Accounts Receivable:
June 30, 2025
December 31, 2024
Customer A(1)
22
%
*
Customer B
13
%
*
Customer C
*
13
%
Customer E
*
13
%
* Accounts receivable from customer was less than 10% of total accounts receivable during the applicable period.
(1)Consists of multiple U.S. government agencies, of which one government agency represented greater than 10% of total accounts receivable as of June 30, 2025.
Related Parties
In conjunction with the Company’s acquisition of exactEarth (the “Acquisition”) in November 2021, Myriota Pty Ltd (“Myriota”), an existing Spire customer, became a related party as a result of exactEarth’s approximately 13% ownership of Myriota at the time of acquisition. As of June 30, 2025, the Company had 7.7% ownership of Myriota. The investment in Myriota of $290 and $858 was included in other long-term assets, including restricted cash on the condensed consolidated balance sheets as of June 30, 2025, and December 31, 2024, respectively. The Company accounts for this investment using the equity method of accounting due to its representation on Myriota’s board of directors. The Company’s share of earnings or losses on the investment is recorded on a one month lag, due to the timing of receiving financial statements from Myriota, as a component of other expense, net in the condensed consolidated statements of operations. The Company generated immaterial revenue from Myriota for the three and six months ended June 30, 2025, and had no accounts receivable from Myriota as of
15
Spire Global, Inc.
Notes to Condensed Consolidated Financial Statements
(In thousands, except shares and per share data, unless otherwise noted)
(Unaudited)
June 30, 2025. The Company generated $226 and $443 in revenue from Myriota for the three and six months ended June 30, 2024, and had $52 of accounts receivable from Myriota as of December 31, 2024.
Accounting Pronouncements Not Yet Adopted
In December 2023, the Financial Accounting Standards Board (“FASB”) issued Accounting Standards Updated (“ASU”) 2023-09, Income Taxes (Topic 740) - Improvements to Income Tax Disclosures, which includes amendments that further enhance income tax disclosures, primarily through standardization and disaggregation of rate reconciliation categories and income taxes paid by jurisdiction. The guidance is effective for annual reporting periods beginning after December 15, 2024, with early adoption permitted, and should be applied prospectively or retrospectively. The Company is currently evaluating the impact that the adoption of ASU 2023-09 will have on its consolidated financial statements and disclosures.
In November 2024, the FASB issued ASU 2024-03, Income Statement-Reporting Comprehensive Income-Expense Disaggregation Disclosures (Subtopic 220-40). Additionally, in January 2025, the FASB issued ASU 2025-01 to clarify the effective date of ASU 2024-03. The standard provides guidance to expand disclosures related to the disaggregation of income statement expenses. The standard requires, in the notes to the financial statements, disclosure of specified information about certain costs and expenses, which includes purchases of inventory, employee compensation, depreciation and intangible asset amortization included in each relevant expense caption. This guidance is effective for fiscal years beginning after December 15, 2026, and interim periods within annual reporting periods beginning after December 15, 2027, on a retrospective or prospective basis, with early adoption permitted. The Company is assessing the guidance, noting the adoption impacts disclosure only.
3.
Revenue, Contract Assets, Contract Liabilities and Remaining Performance Obligations
Disaggregation of Revenue
Revenue from subscription-based contracts was $14,572 and $34,082, or 76% and 79% of total revenue, for the three and six months ended June 30, 2025, respectively, and was $19,703 and $37,759, or 78% and 63% of total revenue, for the three and six months ended June 30, 2024, respectively. Revenue from non-subscription-based contracts was $4,610 and $8,976, or 24% and 21% of total revenue, for the three and six months ended June 30, 2025, respectively, and was $5,696 and $22,465, or 22% and 37% of total revenue, for the three and six months ended June 30, 2024, respectively.
The following revenue disaggregated by geography, derived from billing addresses, was recognized:
Three Months Ended June 30, 2025
Six Months Ended June 30, 2025
Americas (1)
$
12,605
66
%
$
26,164
61
%
EMEA(2)
5,987
31
%
14,204
33
%
Asia Pacific
590
3
%
2,690
6
%
Total
$
19,182
100
%
$
43,058
100
%
Three Months Ended June 30, 2024
Six Months Ended June 30, 2024
Americas (1)
$
13,880
55
%
$
36,560
61
%
EMEA(2)
9,436
37
%
19,395
32
%
Asia Pacific
2,083
8
%
4,269
7
%
Total
$
25,399
100
%
$
60,224
100
%
Revenue from individual geographic regions that represent less than 10% of total revenue for the periods presented are not separately disclosed.
16
Spire Global, Inc.
Notes to Condensed Consolidated Financial Statements
(In thousands, except shares and per share data, unless otherwise noted)
(Unaudited)
(1)
U.S. represented 54% and 53% of total revenue for the three and six months ended June 30, 2025, respectively, and 49% and 41% of total revenue for the three and six months ended June 30, 2024, respectively. Canada represented 12% of total revenue for the three months ended June 30, 2025 and 20% of total revenue for the six months ended June 30, 2024.
(2)
United Kingdom represented 11% of total revenue for the six months ended June 30, 2025, and United Kingdom represented 15% and 11% of total revenue for the three and six months ended June 30, 2024.
Contract Assets
As of June 30, 2025, contract assets were $2,376, which was reported in contract assets on the Company’s condensed consolidated balance sheets. As of December 31, 2024, contract assets of $785 were reported in contract assets on the Company’s condensed consolidated balance sheets.
Changes in contract assets for the six months ended June 30, 2025 and 2024 were as follows:
2025
2024
Balance as of January 1
$
785
$
4,917
Contract assets recorded during the period
3,048
3,970
Reclassified to accounts receivable
(1,539
)
(4,685
)
Other
82
(41
)
Balance as of June 30
$
2,376
$
4,161
Contract Liabilities
As of June 30, 2025, contract liabilities were $49,110, of which $24,609 was reported in contract liabilities, current portion, and $24,501 was reported in other long-term liabilities on the Company’s condensed consolidated balance sheets. As of December 31, 2024, contract liabilities were $45,526, of which $22,037 was reported in contract liabilities, current portion, and $23,489 was reported in other long-term liabilities on the Company’s condensed consolidated balance sheets.
Changes in contract liabilities for the six months ended June 30, 2025 and 2024 were as follows:
2025
2024
Balance as of January 1
$
45,526
$
49,101
Contract liabilities recorded during the period
21,549
22,821
Revenue recognized during the period
(18,281
)
(29,037
)
Other
316
(390
)
Balance as of June 30
$
49,110
$
42,495
Remaining Performance Obligations
The Company has performance obligations associated with commitments in customer contracts for future services that have not yet been recognized as revenue. These commitments for future services exclude (i) contracts with an original term of one year or less, and (ii) cancellable contracts. As of June 30, 2025, the amount not yet recognized as revenue from these commitments was $208,880.
The Company expects to recognize its remaining performance obligations as of June 30, 2025, over the following periods:
June 30, 2025
1 to 12 months
$
66,213
31
%
13 to 24 months
51,387
25
%
25 to 36 months
35,307
17
%
37 to 48 months
20,016
10
%
Remaining
35,957
17
%
Total
$
208,880
100
%
17
Spire Global, Inc.
Notes to Condensed Consolidated Financial Statements
(In thousands, except shares and per share data, unless otherwise noted)
(Unaudited)
4.
Balance Sheet Components
Other current assets consisted of the following:
June 30,
December 31,
2025
2024
Technology and other prepaid contracts
$
1,787
$
838
Other receivables
2,223
648
Prepaid insurance
302
1,076
Deferred contract costs
221
297
Other
313
419
Other current assets
$
4,846
$
3,278
Property and equipment, net consisted of the following:
June 30,
December 31,
2025
2024
Satellites in-service
$
21,237
$
32,768
Internally developed software
2,377
1,760
Ground stations in-service
4,989
4,978
Leasehold improvements
6,225
5,707
Machinery and equipment
6,856
5,479
Computer equipment
1,524
1,327
Computer software and website development
99
99
Furniture and fixtures
1,496
1,335
44,803
53,453
Less: Accumulated depreciation and amortization
(19,645
)
(25,748
)
25,158
27,705
Satellite, launch, and ground station work in progress
34,371
27,624
Finished satellites not yet placed in-service
9,465
8,009
Property and equipment, net
$
68,994
$
63,338
Depreciation and amortization expense related to property and equipment was $2,135 and $6,173 for the three and six months ended June 30, 2025, respectively. Depreciation and amortization expense related to property and equipment was $5,447 and $11,404 for the three and six months ended June 30, 2024, respectively.
The Company recorded losses of $1,110 and $6,270 on decommissioned satellites for the three and six months ended June 30, 2025, respectively, and $529 and $707 on decommissioned satellites for the three and six months ended June 30, 2024, respectively. The loss on decommissioned satellites during the three and six months ended June 30, 2025 was primarily due to the Company’s decision to stop supporting three underperforming satellites and the deorbiting of an additional three satellites. The loss on decommissioned satellites during the three and six months ended June 30, 2024 was primarily due to failure to establish communications with multiple satellites. These satellites were written off at their net book value, as no recoverable value was expected upon disposal.
18
Spire Global, Inc.
Notes to Condensed Consolidated Financial Statements
(In thousands, except shares and per share data, unless otherwise noted)
(Unaudited)
Other accrued expenses consisted of the following:
June 30,
December 31,
2025
2024
Operating lease liabilities, current
$
4,313
$
3,260
Professional services
4,401
2,622
Accrued operating costs
1,460
1,829
Accrued wages and benefits
5,675
3,335
Accrued interest
—
1,709
Legal matters
—
1,479
Software
831
792
Corporate and sales tax
1,509
120
Other
2,708
1,215
Other accrued expenses
$
20,897
$
16,361
5.
Goodwill and Intangible Assets
The following table summarizes changes in goodwill balance:
Balance at December 31, 2024
$
14,735
Impact of foreign currency translation
750
Balance at June 30, 2025
$
15,485
Other intangible assets consisted of the following:
June 30, 2025
Gross Carrying Amount
Accumulated Amortization
Developed technology
$
12,895
$
(3,851
)
Trade names
2,186
(1,566
)
Patents
393
(359
)
FCC licenses
480
(298
)
$
15,954
$
(6,074
)
December 31, 2024
Gross Carrying Amount
Accumulated Amortization
Developed technology
12,270
(3,153
)
Trade names
2,080
(1,282
)
Patents
393
(345
)
FCC licenses
480
(282
)
$
15,223
$
(5,062
)
As of June 30, 2025, the weighted-average amortization period for developed technology was 8.4 years, for trade names was 1.4 years, and for patents and FCC licenses was 5.3 years. Amortization expense related to intangible assets was $389 and $764 for the three and six months ended June 30, 2025, respectively, and $868 and $1,748 for the three and six months ended June 30, 2024, respectively. No impairment charges were recognized for the three and six months ended June 30, 2025 and 2024.
19
Spire Global, Inc.
Notes to Condensed Consolidated Financial Statements
(In thousands, except shares and per share data, unless otherwise noted)
(Unaudited)
As of June 30, 2025, the expected future amortization expense of intangible assets is as follows:
Fiscal year ending December 31,
Future Amortization Expense
Remainder of 2025
$
790
2026
1,522
2027
1,114
2028
1,110
2029
1,107
Thereafter
4,237
$
9,880
6.
Assets Held for Sale
On November 13, 2024, the Company entered into the Purchase Agreement to sell its maritime business to Buyer. On April 25, 2025, the Company completed the sale of its maritime business to Buyer for approximately $238,948, which reflects an increase to the original purchase price to account for funds contributed by the Buyer toward the Settlement. The Company recognized a gain of $154,305 on the sale, which is included in gain on sale of a business in the condensed consolidated statement of operations for the three and six months ended June 30, 2025.
The maritime business generated income before income taxes of approximately $680 and $3,904 for the three and six months ended June 30, 2025, respectively, and $1,683 and $6,195 for the three and six months ended June 30, 2024, respectively.
As of June 30, 2025, the Company did not have any assets held for sale, as the Transactions were completed on April 25, 2025. The following table summarizes the carrying values of the assets and liabilities classified as held for sale in the Company’s condensed consolidated balance sheets as of the balance sheet date presented:
December 31, 2024
Assets:
Accounts receivable, net
$
2,591
Contract assets
927
Other current assets
1,002
Property and equipment, net
106
Goodwill
32,412
Customer relationships, net
16,281
Other non-current assets
3,644
Total assets classified as held for sale
$
56,963
Liabilities:
Accounts payable
$
787
Accrued wages and benefits
402
Other accrued expenses
1,014
Contract liabilities, current portion
5,444
Contract liabilities, non-current
20
Total liabilities associated with assets classified as held for sale
$
7,667
Net assets held for sale
$
49,296
The Company’s satellite and ground station networks, including operations, and maritime contracts associated with the U.S. federal government are not included in the held for sale amounts presented above. On April 25, 2025, the Company and L3Harris entered into the Settlement Agreement among the Company, exactEarth, and L3Harris, pursuant to which, upon the closing of the Transactions, Buyer paid L3Harris $17,000 for full and complete resolution and release of all disputes asserted in connection with the A&R L3Harris Agreement between the Company and L3Harris. The Company and Buyer further agreed
20
Spire Global, Inc.
Notes to Condensed Consolidated Financial Statements
(In thousands, except shares and per share data, unless otherwise noted)
(Unaudited)
that the Company would contribute $7,000 toward the Settlement in the form of a reduction to the cash paid by Buyer to the Company at the closing of the Transactions.
7.
Long-Term Debt
As of June 30, 2025, the Company did not have any long-term debt, as the Transactions were completed on April 25, 2025. Long-term debt consisted of the following as of the balance sheet date presented:
December 31,
2024
Blue Torch term loan
$
98,446
Other
4,618
Total long-term debt
103,064
Less: Debt issuance costs
(4,510
)
Less: Current portion of long-term debt
(93,936
)
Non-current portion of long-term debt
$
4,618
The Company recorded interest expense, including amortization of deferred issuance costs from long-term debt, of $1,683 and $7,410 and for the three and six months ended June 30, 2025, respectively, and $4,772 and $9,825 for the three and six months ended June 30, 2024, respectively.
Blue Torch Credit Agreement
On June 13, 2022, the Company, as borrower, and Spire Global Subsidiary, Inc. and Austin Satellite Design, LLC, as guarantors, entered into a financing agreement (the “Blue Torch Financing Agreement”) with Blue Torch Finance LLC, a Delaware limited liability company (“Blue Torch”), as administrative agent and collateral agent, and certain lenders (the “Lenders”). The Blue Torch Financing Agreement provided for, among other things, a term loan facility in an aggregate principal amount of up to $120,000 (the “Blue Torch Credit Facility”).
The $120,000 term loan was available and drawn at closing, of which $19,735 was placed in an escrow account by Blue Torch with such amount released upon the Company achieving certain metrics related to annualized recurring revenue and a total annualized recurring revenue leverage ratio. These metrics were achieved and the $19,735 was released from the escrow account and delivered to the Company in February 2023. The term loan accrued interest at a floating rate based, at the Company’s election, on either a reference rate or a 3-month Term Secured Overnight Financing Rate (“SOFR”) (subject to a 1.0% floor), plus an interest rate margin of 7.0% for reference rate borrowings and 8.0% for 3-month Term SOFR borrowings, plus an incremental Term SOFR margin of 0.26161%. The Company elected the Term SOFR rate. Principal on the term loan was only payable at maturity and interest on the term loan was due and payable quarterly for Term SOFR borrowings.
On April 25, 2025, the Company repaid with a portion of the proceeds of the Transactions all obligations and all amounts borrowed, and all obligations terminated, under the Blue Torch Financing Agreement. The outstanding principal, exit fees, termination penalties, applicable premium and accrued interest under the Blue Torch Financing Agreement that the Company paid to Blue Torch amounted to, in the aggregate, approximately $108,557. The Company recognized $10,541 as a loss on extinguishment of debt on the condensed consolidated statements of operations during each of the three and six months ended June 30, 2025 upon the repayment of the Blue Torch Credit Facility.
Government Loan
The Company assumed an interest free loan agreement with the Strategic Innovation Fund (“SIF”) upon the Acquisition which was recorded at an amount equal to the proceeds received. Any amount outstanding under this loan would have been repayable in 15 annual payments beginning February 28, 2026, and would have had a stated interest rate of zero. On April 25, 2025, the Company repaid all obligations under the SIF loan agreement. The Company recognized $1,467 as a loss on extinguishment of debt on the condensed consolidated statements of operations during each of the three and six months ended June 30, 2025 upon the repayment of the SIF loan. The SIF loan agreement balance was $0 and $4,618, which was included in other long-term liabilities on the condensed consolidated balance sheets as of June 30, 2025 and December 31, 2024, respectively.
21
Spire Global, Inc.
Notes to Condensed Consolidated Financial Statements
(In thousands, except shares and per share data, unless otherwise noted)
(Unaudited)
8.
Leases
Operating lease expenses were $1,036 and $2,024 for the three and six months ended June 30, 2025, respectively, and were $1,168 and $2,325 for the three and six months ended June 30, 2024, respectively. Aggregate variable lease expenses and short-term lease expenses were $380 and $721 for the three and six months ended June 30, 2025, respectively, and $363 and $601 for the three and six months ended June 30, 2024, respectively.
The following table provides the required information regarding the Company’s leases for which the Company is the lessee:
June 30,
December 31,
2025
2024
Assets
ROU assets
$
11,300
$
11,074
Liabilities
Current
$
4,313
$
3,260
Non-current
9,178
9,598
Total lease liabilities
$
13,491
$
12,858
Weighted-average remaining lease term (years)
4.6
4.8
Weighted-average discount rate
9
%
9
%
Approximately 86% of the Company’s right-of-use (“ROU”) assets and lease liabilities relate to office facilities leases, with the remaining amounts representing primarily ground station leases.
As of June 30, 2025, the maturity of operating lease liabilities are as follows:
Fiscal year ending December 31,
Remainder of 2025
$
3,031
2026
4,165
2027
2,867
2028
2,068
2029
1,793
Thereafter
2,231
Total lease payments
16,155
Less: Interest on lease payments
(2,664
)
Present value of lease liabilities
$
13,491
Operating cash payments included in the measurement of operating lease liabilities were $676 and $1,255 for the three and six months ended June 30, 2025, respectively, and were $820 and $1,692 for the three and six months ended June 30, 2024, respectively, all of which were included in net cash used in operating activities in the condensed consolidated statements of cash flows. Amortization of ROU assets was $773 and $1,519 for the three and six months ended June 30, 2025, respectively, and $989 and $1,798 for the three and six months ended June 30, 2024, respectively.
9.
Fair Value Measurement
The Company follows the guidance in Accounting Standards Codification (“ASC”) 820, “Fair Value Measurement” for its assets and liabilities that are re-measured and reported at fair value at the end of each reporting period.
The fair value of the Company’s common stock warrant liabilities reflects management’s estimate of amounts that the Company would have received in connection with the sale of the assets or paid in connection with the transfer of the liabilities in an orderly transaction between market participants at the measurement date. The following fair value hierarchy is used to classify assets and liabilities based on the observable inputs and unobservable inputs used in order to value the assets and liabilities:
Level 1:
Quoted prices in active markets for identical assets or liabilities.
22
Spire Global, Inc.
Notes to Condensed Consolidated Financial Statements
(In thousands, except shares and per share data, unless otherwise noted)
(Unaudited)
Level 2:
Significant other observable inputs other than quoted prices included in Level 1, such as quoted prices for similar assets and liabilities in active markets, quoted prices for identical or similar assets and liabilities in markets that are not active, or other inputs that are observable or can be corroborated by observable market data.
Level 3:
Unobservable inputs reflecting management’s assumptions, consistent with reasonably available assumptions made by other market participants. These valuations require significant judgment.
The Company classifies financial instruments in Level 3 of the fair value hierarchy when there is reliance on at least one significant unobservable input to the valuation model. In addition to these unobservable inputs, the valuation models for Level 3 financial instruments typically also rely on a number of inputs that are readily observable, either directly or indirectly. The Company’s assessment of a particular input to the fair value measurement requires management to make judgments and consider factors specific to the asset or liability. The fair value hierarchy requires the use of observable market data when available in determining fair value. The Company recognizes transfers between levels within the fair value hierarchy, if any, at the end of each period.
Assets and Liabilities Measured at Fair Value on a Recurring Basis
The following tables present the Company’s fair value hierarchy for its financial instruments that are measured at fair value on a recurring basis.
June 30, 2025
Level 1
Level 2
Level 3
Total
Assets:
Cash and cash equivalents:
Money market funds
$
10,194
$
—
$
—
$
10,194
U.S. treasury bills and bonds
11,959
—
—
11,959
$
22,153
$
—
$
—
$
22,153
Marketable securities:
Commercial paper
$
—
$
63,640
$
—
$
63,640
U.S. treasury bills and bonds
17,863
—
—
17,863
$
17,863
$
63,640
$
—
$
81,503
Liabilities:
Long-term liabilities:
Credit Agreement Warrants
$
—
$
252
$
—
$
252
Contingent earnout liability
—
—
644
644
$
—
$
252
$
644
$
896
December 31, 2024
Level 1
Level 2
Level 3
Total
Assets:
Cash and cash equivalents:
Money market funds
$
3,157
$
—
$
—
$
3,157
$
3,157
$
—
$
—
$
3,157
Liabilities:
Long-term liabilities:
Credit Agreement Warrants
$
—
$
13,641
$
—
$
13,641
Contingent earnout liability
—
—
1,455
1,455
$
—
$
13,641
$
1,455
$
15,096
23
Spire Global, Inc.
Notes to Condensed Consolidated Financial Statements
(In thousands, except shares and per share data, unless otherwise noted)
(Unaudited)
Financial Assets
The Company values its Level 1 assets, consisting of money market funds and U.S. treasury bills and bonds using quoted prices in active markets for identical instruments.
Financial assets whose fair values are measured on a recurring basis using Level 2 inputs consist of commercial paper. The Company measures the fair values of these assets with the help of a pricing service that either provides quoted market prices in active markets for identical or similar securities or uses observable inputs for their pricing without applying significant adjustments.
Credit Agreement Warrants
On June 13, 2022, in connection with the Blue Torch Financing Agreement, the Company issued warrants to Blue Torch, which were exercisable for an aggregate of 437,024 shares of the Company’s Class A common stock with a per share exercise price of $16.08 (the “2022 Blue Torch Warrants”). In addition, in connection with the closing of the financing, the Company paid Urgent Capital LLC, a Delaware limited liability company, $600 in cash and issued a warrant to purchase 24,834 shares of the Company’s Class A common stock with a per share exercise price of $16.08 (the “Urgent Warrants”).
On September 27, 2023, in connection with the Waiver and Amendment No. 2 to Financing Agreement, which amended the Blue Torch Financing Agreement, the Company and certain affiliates of Blue Torch amended and restated the 2022 Blue Torch Warrants to reduce the per share exercise price from $16.08 to $5.44. The Company also concurrently issued new warrants to certain Blue Torch affiliates that were exercisable for an additional 597,082 shares of the Company’s Class A common stock at a per share exercise price of $5.44 (the “2023 Blue Torch Warrants” and together with the 2022 Blue Torch Warrants and the Urgent Warrants, the “Credit Agreement Warrants”).
On May 30, 2025, Blue Torch exercised 825,623 warrants to purchase shares of the Company’s Class A common stock on a cashless basis, in accordance with the applicable warrant agreement. Based on the exercise price of $5.44 and the Company’s Class A common stock price of $10.66 on the date of exercise, the Company issued 404,286 shares of Class A common stock. On June 11, 2025, Blue Torch exercised its remaining 208,483 warrants, excluding the Urgent Warrants, also on a cashless basis. Using the exercise price of $5.44 and the Company’s Class A common stock price of $11.83 on the date of exercise, the Company issued 112,611 shares of Class A common stock. No cash was received in connection with either exercise.
As of June 30, 2025, Urgent Warrants exercisable for 24,834 shares of Class A common stock remained outstanding.
The fair value of the Credit Agreement Warrants is estimated using the Black-Scholes model with inputs that include the Company’s Class A common stock price in an actively traded market, making this fair value classified as a Level 2 financial instrument. The other significant assumptions used in the model are the exercise price, expected term, volatility, interest rate, and expected dividend yield.
The table below quantifies the significant inputs used for the Credit Agreement Warrants:
June 30,
December 31,
2025
2024
Fair value of the Company’s Class A common stock
$
11.90
$
14.07
Exercise price
$
16.08
$
5.44 - 16.08
Risk-free interest rate
3.98
%
4.48
%
Expected volatility factor
110.0
%
96.0
%
Expected dividend yield
—
%
—
%
Remaining contractual term (in years)
7.0
7.4 - 8.7
Securities Purchase Agreement Warrants
On March 12, 2025, the Company entered into the 2025 Securities Purchase Agreement with the purchasers named therein for the 2025 Private Placement of (i) 4,843,750 shares of Class A common stock at a purchase price of $8.00 per share and (ii)
24
Spire Global, Inc.
Notes to Condensed Consolidated Financial Statements
(In thousands, except shares and per share data, unless otherwise noted)
(Unaudited)
Pre-Funded Warrants to purchase 156,250 shares of Class A common stock at a purchase price of $7.9999 per Pre-Funded Warrant. The Pre-Funded Warrants had an exercise price of $0.0001 per share of Class A common stock, were exercisable immediately and remained outstanding until fully exercised. The Pre-Funded Warrants were initially recorded at fair value at issuance which equal to the proceeds received on March 14, 2025. The Pre-Funded Warrants were classified as liabilities because they contain provisions that could require settlement in cash under certain circumstances, resulting in the instruments not being considered indexed to the Company’s own stock. These Pre-Funded Warrants were measured at fair value at each reporting date, with changes in fair value recognized in the condensed consolidated statements of operations.
On June 10, 2025, 156,250 Pre-Funded Warrants were exercised to purchase shares of the Company’s Class A common stock on a cashless basis, in accordance with the Pre-Funded Warrant agreement. Based on the exercise price of $0.0001 per share, the Company issued 156,249 shares of Class A common stock.
Contingent Earnout Liability
In connection with the Merger, eligible Spire equity holders are entitled to receive additional shares of the Company’s Class A common stock upon the achievement of certain earnout triggering events. The estimated fair value of the contingent earnout liability is determined using a Monte Carlo simulation using a distribution of potential outcomes on a monthly basis over the earnout period, which is a period up to five years post-closing of the Merger, prioritizing the most reliable information available, making this fair value classified as a Level 3 liability. The assumptions utilized in the calculation are based on the achievement of certain stock price milestones, including the current price of the Company’s Class A common stock, expected volatility, risk-free interest rate, expected term and expected dividend yield.
The table below quantifies the significant inputs used for the contingent earnout liability:
June 30,
December 31,
2025
2024
Fair value of the Company’s Class A common stock
$
11.90
$
14.07
Risk-free interest rate
3.93
%
4.22
%
Expected volatility factor
110.0
%
96.0
%
Earnout expiration date
August 16, 2026
August 16, 2026
The following table presents a summary of the changes in the fair value of the Company’s Level 3 financial instruments that are measured at fair value on a recurring basis:
Contingent Earnout Liability
Fair value as of December 31, 2024
$
1,455
Change in fair value of contingent earnout liability
(811
)
Fair value as of June 30, 2025
$
644
25
Spire Global, Inc.
Notes to Condensed Consolidated Financial Statements
(In thousands, except shares and per share data, unless otherwise noted)
(Unaudited)
Cash, Cash Equivalents, and Marketable Securities
The following tables summarize the Company’s cash, cash equivalents, and marketable securities by significant category:
June 30, 2025
Amortized Cost
Unrealized Gains
Unrealized Losses
Fair Value
Cash and cash equivalents:
Cash
$
13,961
$
—
$
—
$
13,961
Cash equivalents:
Money market funds
10,194
—
—
10,194
U.S. treasury bills and bonds
11,959
—
—
11,959
$
36,114
$
—
$
—
$
36,114
Marketable Securities:
Commercial paper
$
63,642
$
—
$
(2
)
$
63,640
U.S. treasury bills and bonds
17,863
—
—
17,863
$
81,505
$
—
$
(2
)
$
81,503
December 31, 2024
Amortized Cost
Unrealized Gains
Unrealized Losses
Fair Value
Cash and cash equivalents:
Cash
$
16,049
$
—
$
—
$
16,049
Cash equivalents:
Money market funds
3,157
—
—
3,157
$
19,206
$
—
$
—
$
19,206
The following table represents amortized cost and estimated fair value of marketable securities, by contractual maturity:
June 30, 2025
Amortized Cost
Fair Value
Due in one year or less
$
81,505
$
81,503
In accordance with the Company's investment policy, investments are placed in investment grade securities with high credit quality issuers, and generally limit the amount of credit exposure to any one issuer. The Company evaluates securities for impairment at the end of each reporting period. The Company did not record any impairment charges related to its available-for-sale securities during the three and six months ended June 30, 2025 and 2024.
10.
Commitments and Contingencies
L3Harris Commitment
In conjunction with the Acquisition, the Company acquired the agreement (the “L3Harris Agreement) with L3Harris to receive satellite automatic identification system (“S-AIS”) data from the L3Harris AppStar payloads on-board Iridium NEXT Constellation, Iridium’s Real-Time, Second-Generation satellite constellation with 58 AppStar payloads. Under the A&R L3Harris Agreement, the Company incurs a fixed fee of $358 per month. The A&R L3Harris Agreement expires on August 7, 2031.
Under the A&R L3Harris Agreement, the Company was required to pay a 30% share of S-AIS data revenues for the portion of exactEarth annual S-AIS data revenue which is in excess of $16,000. No revenue share was owed to L3Harris under the A&R
26
Spire Global, Inc.
Notes to Condensed Consolidated Financial Statements
(In thousands, except shares and per share data, unless otherwise noted)
(Unaudited)
L3Harris Agreement, with respect to AIS Analytics sales, as of or for the three and six months ended June 30, 2025 and 2024. The Company recognized $403 and $1,627 in cost of revenue on the condensed consolidated statements of operations for costs incurred to acquire exclusive access rights to data generated from satellites for the three and six months ended June 30, 2025, respectively, and $1,245 and $2,483 for the three and six months ended June 30, 2024, respectively.
In connection with the closing of the Transactions, on April 25, 2025, the Company and L3Harris entered into the Settlement Agreement, pursuant to which, upon the closing of the Transactions, Buyer paid L3Harris $17,000 for full and complete resolution and release of all disputes asserted in connection with the A&R L3Harris Agreement between exactEarth and L3Harris. The Company and Buyer further agreed that the Company would contribute $7,000 toward the Settlement in the form of a reduction to the cash paid by Buyer to the Company at the closing of the Transactions.
Litigation
In July 2025, the Company received a subpoena from the SEC seeking records relating to, among other matters, (i) the restatement of its consolidated financial statements as of and for the fiscal years ended December 31, 2023 and December 31, 2022, the unaudited condensed consolidated financial information as of the quarter ends and for the interim periods in the fiscal years ended December 31, 2023 and 2022, and the unaudited condensed consolidated financial statements as of and for the quarter ended March 31, 2024; (ii) its historical accounting policies and practices; (iii) its internal control over financing reporting, disclosure controls and procedures, and material weaknesses therein; and (iv) the premature filing of its Annual Report on Form 10-K for the year ended December 31, 2024. The Company is in the process of producing records responsive to the subpoena and intends to continue cooperating with the SEC’s investigation; however, it cannot predict the ultimate outcome or timing of the investigation.
From time to time, the Company is party to various claims and legal actions arising in the normal course of business. Although the ultimate outcome of these matters is not presently determinable, management believes that the resolution of all such pending matters, based on an assessment of the current facts and circumstances, will not have a material adverse effect on the Company’s business, results of operations, financial condition or cash flows; however, there can be no assurance that the ultimate resolution of these matters will not have a material impact on the Company’s condensed consolidated financial statements in any period.
Note Receivable
The Company has outstanding a $4,500 note receivable plus accrued interest of $744 issued to a Space Services customer as of June 30, 2025. The note and accrued interest were due in October 2024. The Company is aware that the customer has been using cash in its operations and its available cash is low. The customer did not pay the note and accrued interest when it was due. Due to the customer's nonpayment and financial condition, the Company ceased accruing additional interest on the note as of November 1, 2024. The Company has an allowance for current expected credit loss on the note receivable and accrued interest balance for the full amount of $5,244 as of June 30, 2025.
11.
Stock-Based Compensation
In connection with the Merger, the Company adopted the 2021 Equity Incentive Plan (the “2021 Plan”) and the 2021 Employee Stock Purchase Plan (the “2021 ESPP”). The number of shares available for issuance under the 2021 Plan is increased on the first day of each fiscal year, beginning on January 1, 2022, in an amount as provided in the 2021 Plan. Pursuant to this automatic increase feature of the 2021 Plan, 1,285,558 shares were added as available for issuance thereunder on January 1, 2025. As of June 30, 2025, 1,247,439 shares were available for issuance under the 2021 Plan.
The number of shares available for issuance under the 2021 ESPP is increased on the first day of each fiscal year, beginning on January 1, 2022, in an amount as provided in the 2021 ESPP. Pursuant to this automatic increase feature of the 2021 ESPP, 257,111 shares were added as available for issuance thereunder on January 1, 2025. As of June 30, 2025, 803,675 shares were available for issuance under the 2021 ESPP.
27
Spire Global, Inc.
Notes to Condensed Consolidated Financial Statements
(In thousands, except shares and per share data, unless otherwise noted)
(Unaudited)
The following table summarizes stock option activity under our equity compensation plans:
Number of Options
Weighted- Average Exercise Price
Weighted- Average Remaining Contractual Term
Aggregate Intrinsic Value ('000)
(in years)
Options outstanding as of December 31, 2024
1,978,557
$
16.72
4.5
Granted
21,650
$
11.00
Exercised
(105,541
)
$
8.24
Forfeited, canceled, or expired
(105,747
)
$
18.08
Options outstanding as of June 30, 2025
1,788,919
$
17.08
4.1
$
1,378
Vested and expected to vest at June 30, 2025
1,788,919
$
17.08
4.1
$
1,378
Exercisable at June 30, 2025
1,766,518
$
17.13
4.0
$
1,359
The aggregate intrinsic value of options exercised was $155 and $493 during the three and six months ended June 30, 2025, respectively, and was $0 and $189 during the three and six months ended June 30, 2024, respectively. The cash proceeds from the options exercised was $230 and $870 during the three and six months ended June 30, 2025, respectively, and $2 and $269 during the three and six months ended June 30, 2024, respectively. The aggregate fair value of options vested was $243 and $371 during the three and six months ended June 30, 2025, respectively, and $922 and $1,686 during the three and six months ended June 30, 2024, respectively. There were 21,650 and 33,901 options granted during the three and six months ended June 30, 2025 and 2024, respectively.
The following table summarizes restricted stock unit (“RSU”) activity under the 2021 Plan:
Number of RSUs
Weighted Average Grant Date Fair Value per Share
Outstanding as of December 31, 2024
2,777,156
$
10.32
RSUs granted
1,251,385
$
12.10
RSUs and PSUs vested
(852,136
)
$
11.42
RSUs forfeited
(557,131
)
$
9.98
Outstanding as of June 30, 2025
2,619,274
$
10.88
For RSUs with service-based vesting conditions, the fair value is calculated based upon the Company’s closing stock price on the date of grant, and the stock-based compensation expense is recognized over the applicable grant vesting term, generally three to four years. For performance stock units (“PSUs”), the awards vest based on the achievement of certain performance goals over a specified period, generally ranging from four to five years. The fair value of PSUs is calculated based on the Company’s closing stock price on the grant date. Stock-based compensation expense is recognized over the applicable vesting period based on the number of units expected to vest. The aggregate fair value of RSUs and PSUs vested was $5,164 and $8,905 during the three and six months ended June 30, 2025, respectively, and $1,847 and $4,343 during the three and six months ended June 30, 2024, respectively.
As of June 30, 2025, there was $24,845 of total unrecognized compensation expense related to options, RSUs, and PSUs expected to be recognized over a weighted average period of 2.2 years.
28
Spire Global, Inc.
Notes to Condensed Consolidated Financial Statements
(In thousands, except shares and per share data, unless otherwise noted)
(Unaudited)
The following table summarizes the components of total stock-based compensation expense based on roles and responsibilities of the employees within the condensed consolidated statements of operations:
Three Months Ended June 30,
Six Months Ended June 30,
2025
2024
2025
2024
Cost of revenue
$
79
$
63
$
192
$
124
Research and development
837
1,210
1,662
2,228
Sales and marketing
490
944
1,968
1,619
General and administrative
4,816
2,578
7,305
4,452
$
6,222
$
4,795
$
11,127
$
8,423
12.
Equity Transactions
On September 14, 2022, the Company entered into an Equity Distribution Agreement (the “Equity Distribution Agreement”) with Canaccord Genuity LLC, as sales agent (the “Agent”). In accordance with the terms of the Equity Distribution Agreement, the Company may offer and sell its Class A common stock, having an aggregate offering price of up to $85,000 from time to time through the Agent pursuant to a registration statement on Form S-3, which became effective on September 26, 2022. In June 2023, the Company sold approximately 2.2 million shares of its Class A common stock through this arrangement, resulting in net proceeds of $7.9 million. As of June 30, 2025, approximately $76.8 million of shares were remaining, but had not yet been sold, under the Equity Distribution Agreement. Because of the late filings of the Company’s Quarterly Reports on Form 10-Q for the quarters ended June 30, 2024 and September 30, 2024 and this Quarterly Report on Form 10-Q, the Company is unable to make sales pursuant to the Equity Distribution Agreement until the Company regains its eligibility to use Form S-3.
On February 4, 2024, the Company and Signal Ocean Ltd (“Signal Ocean”) entered into a securities purchase agreement for the issuance and sale of 833,333 shares of the Company’s Class A common stock to Signal Ocean at a price of $12.00 per share (the “2024 Private Placement”). The 2024 Private Placement closed on February 8, 2024, resulting in net proceeds to the Company of $9,825, after deducting offering expenses.
On March 21, 2024, the Company entered into a Securities Purchase Agreement (the “2024 Securities Purchase Agreement”) with institutional investors (the “Investors”), pursuant to which the Company issued and sold in a registered direct offering (the “Offering”), (i) an aggregate of 2,142,858 shares of Class A common stock and (ii) warrants exercisable for an aggregate of 2,142,858 shares of Class A common stock (“Securities Purchase Agreement Warrants”) to the Investors. Each share of Class A common stock and accompanying Securities Purchase Agreement Warrant to purchase one share of Class A common stock was sold at an offering price of $14.00. The aggregate net proceeds to the Company from the Offering totaled $28,056, after deducting offering expenses. The Securities Purchase Agreement Warrants had an exercise price equal to $14.50 per share of Class A common stock, were exercisable for a term beginning on March 25, 2024, and expired on July 3, 2024, with no warrants exercised.
On March 21, 2024, the Company entered into a placement agency agreement with Alliance Global Partners (“A.G.P” or the “Placement Agent”), pursuant to which the Company engaged A.G.P as the exclusive placement agent in connection with the Offering. The Company paid A.G.P a cash fee equal to 6% of the gross proceeds from the sale of shares and Securities Purchase Agreement Warrants to the Investors, or $1,800, in March 2024. The Company agreed to pay a cash fee equal to 4% of the gross exercise price paid in cash with respect to the exercise of the Securities Purchase Agreement Warrants, which are now expired.
On March 12, 2025, the Company entered into the 2025 Securities Purchase Agreement with the purchasers named therein for the 2025 Private Placement of (i) 4,843,750 shares of Class A common stock at a purchase price of $8.00 per share and (ii) Pre-Funded Warrants to purchase 156,250 shares of Class A common stock at a purchase price of $7.9999 per Pre-Funded Warrant. The Pre-Funded Warrants had an exercise price of $0.0001 per share of Class A common stock, were exercisable immediately, and remained outstanding until fully exercised. The aggregate net proceeds for the 2025 Private Placement were $37,297, after deducting offering expenses. The 2025 Private Placement closed on March 14, 2025.
29
Spire Global, Inc.
Notes to Condensed Consolidated Financial Statements
(In thousands, except shares and per share data, unless otherwise noted)
(Unaudited)
13.
Net Earnings (Loss) per Share
The Company has two classes of common stock, Class A and Class B. Class B common stock has no economic rights, and therefore, has been excluded from the computation of basic and diluted net earnings (loss) per share. The Pre-Funded Warrants are participating securities because they are entitled to participate in dividends with Class A common stock. As a result, a portion of net income is allocated to these warrants in the computation of basic earnings per share, in accordance with the two-class method.
The computation of net earnings (loss) per share and weighted average Class A common stock outstanding for the period presented is as follows:
Three Months Ended June 30,
Six Months Ended June 30,
2025
2024
2025
2024
Numerator:
Net income (loss)
$
119,590
$
(16,559
)
$
96,075
$
(42,103
)
Income allocated to participating Securities Purchase Agreement Warrants
(430
)
—
(239
)
—
Basic net income (loss) attributable to common stockholders
119,160
(16,559
)
95,836
(42,103
)
Removal of mark-to-market adjustment for 2022 Blue Torch Warrants
—
—
(1,472
)
—
Removal of mark-to-market adjustment for 2023 Blue Torch Warrants
85
—
(2,136
)
—
Adjustment to income allocated to participating Securities Purchase Agreement Warrants
9
—
11
—
Dilutive net income (loss) attributable to common stockholders
$
119,254
$
(16,559
)
$
92,239
$
(42,103
)
Denominator:
Weighted-average Class A common stock outstanding - basic
31,398,176
24,487,484
29,105,374
23,150,265
Effect of dilutive securities:
Stock Options
99,734
—
130,663
—
RSUs
552,466
740,111
—
2022 Blue Torch Warrants
—
—
196,678
—
2023 Blue Torch Warrants
43,270
—
268,710
—
Weighted-average Class A common stock outstanding - diluted
32,093,646
24,487,484
30,441,536
23,150,265
Class A common stock:
Net earnings (loss) per share - basic
$
3.80
$
(0.68
)
$
3.29
$
(1.82
)
Net earnings (loss) per share - diluted
$
3.72
$
(0.68
)
$
3.03
$
(1.82
)
The Company applies the treasury stock method to stock options, RSUs, and shares issuable under the 2021 ESPP. Shares subject to contingent issuance, such as the contingent earnout shares and PSUs, are included in the calculation of diluted earnings per share only when the relevant performance or market conditions are met, assuming the end of the reporting period coincides with the end of the measurement period. When calculating diluted earnings per share, the Company applies the more dilutive method between the two-class method and the treasury stock method.
The following securities were not included in the computation of diluted net earnings (loss) per share because the effect would be anti-dilutive or the issuance of such shares is contingent upon the satisfaction of certain conditions which were not satisfied by the end of the period:
Three Months Ended June 30,
Six Months Ended June 30,
2025
2024
2025
2024
Stock options
1,538,241
2,001,787
1,504,340
2,001,787
RSUs and PSUs
1,608,610
2,889,872
1,359,071
2,889,872
Credit Agreement Warrants
—
1,058,940
—
1,058,940
Contingent Earnout Shares
912,600
—
912,600
—
Securities Purchase Agreement Warrants
24,834
—
24,834
—
4,084,285
5,950,599
3,800,845
5,950,599
30
14.
Information on Segment Reporting
The Company operates as one reportable and operating segment, which derives revenue from the sale of subscription-based data, insights, predictive analytics and related project-based services to global customers across a range of industries. All of the segment’s activities are interrelated, and each activity is dependent upon and supportive of the other. Accordingly, all significant operating decisions are based upon analysis of the Company at the consolidated level. The accounting policies of the segment are the same as those described in Note 2.
The Company’s chief operating decision maker (“CODM”), who is the Company's chief executive officer, regularly reviews consolidated net income (loss) as reported on the consolidated statements of operations, along with other financial information presented on a consolidated basis, for purposes of making operating decisions, assessing financial performance and allocating resources. The CODM measures performance and how to allocate resources for the segment primarily based on net income (loss), revenue, and gross margin. The CODM's objective is to make resource allocation decisions that optimize the Company's consolidated financial results by monitoring actual results compared to forecasted results.
The measure of segment assets is reported as total assets on the condensed consolidated balance sheets and total capital expenditures for additions to long-lived assets, which were $3,606 and $12,507, for the three and six months ended June 30, 2025, respectively, and $5,526 and $12,585 for the three and six months ended June 30, 2024, respectively.
The following table includes segment revenue and significant segment expenses:
Three Months Ended June 30,
Six Months Ended June 30,
2025
2024
2025
2024
Revenue
$
19,182
$
25,399
$
43,058
$
60,224
Less:
Employee expense (a)
24,561
18,955
44,857
37,089
Equipment and software expenses (b)
6,574
6,980
16,893
23,018
Depreciation and amortization
2,524
5,652
6,937
12,489
Professional services
4,508
2,268
13,380
4,703
Facilities expense (b)
1,097
1,017
2,146
1,988
Contactor expense
400
482
778
1,118
Other operating and marketing expenses
1,502
1,447
2,781
2,564
Loss on decommissioned satellites and disposal of assets
1,110
501
6,239
924
Allowance for current credit loss on notes receivable
—
40
—
81
Interest expense
1,686
4,772
7,416
9,825
Change in fair value of contingent liability and warrant liabilities
3,016
(1,052
)
(3,858
)
3,195
Gain on sale of a business
(154,305
)
—
(154,305
)
—
Loss on extinguishment of debt
12,008
—
12,008
—
Issuance of stock warrants
—
—
—
2,399
Other segment items(c)
(5,089
)
896
(8,289
)
2,934
Segment net income (loss)
$
119,590
$
(16,559
)
$
96,075
$
(42,103
)
(a) Employee expense included stock-based compensation expense of $6,222 and $11,127 for the three and six months ended June 30, 2025, respectively, and $4,795 and $8,423 for the three and six months ended June 30, 2024, respectively.
(b) In the second quarter of 2025, the Company reclassified certain expenses from Facilities expense to Equipment and software expenses within its segment reporting to better reflect the nature of the costs. Prior period amounts have been recast to conform to the current year period presentation. This reclassification impacted only the composition of the expense categories regularly provided to the Company’s CODM and had no impact on total segment expenses, the condensed consolidated statements of operations, or earnings (loss) per share.
(c) Other segment items included in segment net income (loss) include foreign exchange gain (loss), income tax provision, equity investment loss, income tax benefit, travel and meals expenses, and interest income.
31
Item 2. Management’s Discussion and Analysis of Financial Condition and Results of Operations.
The following discussion and analysis of our financial condition and results of operations should be read in conjunction with the condensed consolidated financial statements and related notes thereto included in this Quarterly Report on Form 10-Q and the audited consolidated financial statements included in the Annual Report on Form 10-K/A for the year ended December 31, 2024 (the “2024 Form 10-K/A”). This Quarterly Report on Form 10-Q also includes revisions to previously issued financial statements as of and for the periods ended December 31, 2024 and March 31, 2025, as discussed in Note 2 to the condensed consolidated financial statements. All relevant amounts presented in this section have been revised, as applicable, to reflect these adjustments. This discussion contains forward-looking statements that involve risks and uncertainties. Our actual results could differ materially from those anticipated by these forward-looking statements as a result of many factors. Factors that could cause or contribute to such differences include those identified below and those discussed in the section titled “Risk Factors” in the 2024 Form 10-K/A and in this Quarterly Report on Form 10-Q. Our historical results are not necessarily indicative of the results that may be expected for any period in the future.
Overview
Spire is a global provider of space-based data, analytics and space services, offering unique datasets and powerful insights about Earth so that organizations can make decisions with confidence in a rapidly changing world. Spire builds, owns, and operates a fully deployed satellite constellation. We believe our constellation is one of the world’s largest “listening” constellations, observing the Earth in real time using radio frequency technology.
The data acquired by our multipurpose satellites provide global weather intelligence, ship and plane movements, and spoofing and jamming detection to better predict how their patterns impact economies, global security, business operations, and the environment. We also offer Space Services solutions that empower customers to leverage our established infrastructure to put their business in space. We provide customers these solutions through an application programming interface (“API”) infrastructure.
Spire also offers research and development services (“R&D Services”) to third parties, for the advancement of contracted satellite technologies. In addition to providing R&D Services, we grant the counterparty a license to the developed intellectual property.
Our platform applies our value-add insights and predictive analytics to this proprietary data to create commercially valuable datasets. We offer four data solutions to our customers, which vary in complexity and price and can be delivered in near real-time via our API that can be easily integrated into our customers’ business operations:
•
Aviation: Precise space-based aviation insights, analytics and flight tracking data to power applications, drive decision making, and improve cost efficiencies.
•
Weather and Climate: Precise space-based data used for highly accurate weather forecasting.
•
Space Reconnaissance: Precise space-data used to detect and geolocate signals of interest, including GNSS jamming, spoofing, and other forms of disruption.
•
Maritime: Precise space-based data used for highly accurate ship monitoring, ship safety, and route optimization.
For each data solution, we have the capability to offer customers a variety of features and additional value. The four forms of data we monetize are:
•
Clean data: Clean and structured data directly from our proprietary nanosatellites;
•
Smart data: Clean data fused with third-party datasets and proprietary analysis to enhance value and provide insights;
•
Predictive solutions: Big data, AI, and ML algorithms applied to fused data sets to create predictive analytics and insights; and
•
Solutions: Data-driven actionable recommendations to solve specific business problems, utilizing the full spectrum of our data analytics suite.
32
These value-add data features allow customers to solve various use cases and provide a path to expand throughout the customer’s relationship.
As our fifth solution, we are also pioneering an innovative business model through our Space Services solution. We leverage our fully deployed infrastructure and large-scale operations to enable our customers to obtain customized data through our API. Our Space Services offering aims to provide our customers with fast, scalable, and reliable access to space.
Our solutions are offered to customers across numerous industries and we not only have the opportunity to upsell within each one, but we also have the opportunity to cross-sell among all our solutions.
We provide our solutions to global customers either through a subscription or based on a specific project. We currently sell directly to end customers and utilize reseller partners when beneficial.
Recent Developments
On November 13, 2024, we entered into a Share Purchase Agreement (the “Purchase Agreement”) with Kpler Holding SA, a Belgian corporation (“Buyer”), pursuant to which we agreed to sell our maritime business to Buyer and enter into certain ancillary agreements (the “Transactions”). The maritime business sold pursuant to the Transactions did not include any part of our satellite network or operations. On April 25, 2025, we and L3Harris Technologies, Inc. (“L3Harris”), entered into the Confidential Settlement Agreement and Mutual Release (the “Settlement Agreement”) among us, exactEarth Ltd. (“exactEarth”) and L3Harris, pursuant to which, upon the closing of the Transactions, Buyer paid L3Harris $17.0 million (the “Settlement”) for full and complete resolution and release of all disputes asserted in connection with the Amended and Restated L3Harris Agreement dated January 21, 2020 (the “A&R L3Harris Agreement”) between us and L3Harris. We and Buyer further agreed that we would contribute $7.0 million of the Settlement in the form of a reduction to the cash paid by Buyer to us at the closing of the Transactions.
On April 25, 2025, we completed the sale of our maritime business to Buyer for approximately $238.9 million, which reflects an increase to the original purchase price to account for funds contributed by the Buyer toward the Settlement.
On April 25, 2025, we repaid with a portion of the proceeds of the Transactions all obligations and all amounts borrowed, and all obligations terminated, under our financing agreement (the “Blue Torch Financing Agreement”) with Blue Torch Finance LLC (“Blue Torch”) and SIF loan agreement.
33
Highlights from the Six Months Ended June 30, 2025
•
We were awarded a Can$72 Million contract from the Canadian Space Agency to design WildFireSat mission.
•
We announced the successful two-way laser communication between our satellites in space.
•
We announced the launch of breakthrough AI weather models built on NVIDIA Omniverse Blueprint for Earth-2.
•
We completed the sale of our maritime business.
•
We announced that Myriota expanded its agreement with us to scale its IoT constellation with 16 more satellites.
•
We were selected as one of 12 vendors eligible to compete for task orders under the U.S. Space Force’s $237 million STEP 2.0 contract vehicle. The award reflects our positioning in the national security space market and has the potential to create a long-term pipeline for future defense-related opportunities.
Macroeconomic and Geopolitical Impact
Over the past two years, we have been impacted by the macroeconomic environment, such as fluctuations in foreign currencies, elevated interest rates, and geopolitical conflicts like the Russian invasion of Ukraine, Israel's wars with Hamas and Iran, the increased tensions between China and the United States, and the increased tensions between Iran and the United States.
Our reporting currency is the U.S. Dollar. The U.S. Dollar exhibited a decrease in strength against the local functional currencies of our foreign subsidiaries for the three and six months ended June 30, 2025, as compared to the three and six months ended June 30, 2024. The U.S. Dollar's decrease had a positive impact on our revenue, as approximately one-third of our sales are conducted in foreign currencies. Conversely, the decrease in the value of the U.S. Dollar had an unfavorable impact on our expenses, given that a majority of our workforce resides in countries other than the United States. The financial statements of these subsidiaries are translated into U.S. dollars using exchange rates in effect at each balance sheet date for assets and liabilities and average exchange rates during the period for revenues and expenses. To the extent we experience significant currency fluctuations, our results of operations may be impacted.
The macroeconomic environment has caused existing or potential customers to re-evaluate their decision to purchase our offerings, at times resulting in additional customer discounts, extended payment terms, and longer sales cycles. Particularly, government agency delays in approving appropriations bills negatively impacted the timeliness of some of our U.S. federal government orders. Additionally, recent changes to tariffs could cause interruptions in our supply chain and increase spending to meet our obligations. Tariff changes could also cause greater volatility in the Company’s cash flows, as the Company may have to cover expenses related to importing materials into the United States from other affiliated entities, even if it recovers some or all of those costs at a later date.
If any of these factors continue or worsen, and/or if new macroeconomic or geopolitical issues arise, our results and financial condition could be negatively impacted. We cannot predict the timing, strength, or duration of any economic slowdown, downturn, instability, or recovery, generally or within any particular industry or geography. Any downturn of the general economy or industries in which we operate would adversely affect our business, financial condition, and results of operations.
Key Factors Affecting Our Performance
We believe that our current and future performance depends on many factors, including, but not limited to, those described below. While these areas present significant opportunity, they also present risks that we must manage to achieve successful results. For additional information about these risks, see the section titled “Risk Factors” in the 2024 Form 10-K/A and in this Quarterly Report on Form 10-Q. If we are unable to address these risks, our business and results of operations could be adversely affected.
Expansion of and Further Penetration of Our Customer Base
We employ a “land and expand” business model that focuses on efficiently acquiring new customers (“land”) and then growing our relationships with these customers over time (“expand”). We have the capability to offer customers additional data sets and a variety of enhanced features that potentially grow the value of the services for which our customers contract with us. Our
34
future revenue growth and our path to profitability are dependent upon our ability to continue to land new customers and then expand adoption of our solutions within their organizations.
Expansion into New Industries and Geographies
As our solutions have grown, we continue to focus on further penetration of our initial industries including aviation, logistics, and government (civil and defense/intelligence). We believe our technology and solutions give us the ability to expand into additional industries, including energy, financial services, agriculture, transportation, and insurance, and also into additional geographies, including Latin America, Africa, and the Middle East. Our revenue growth is dependent upon our ability to continue to expand into new industries and geographies. The costs associated with these expansions may adversely affect our results of operations.
Impact of the Solar Cycle on our Assets’ Remaining Life
A strong solar cycle has the potential to impact some of our satellites, accelerating their deorbiting and shortening their useful lives. The solar cycle is the cycle that the sun’s magnetic field goes through approximately every 11 years. In 2019, the National Oceanic and Atmospheric Administration (“NOAA”), National Aeronautics and Space Administration, and the International Space Environment Services panel forecasted that Solar Cycle 25 (December 2019 to approximately 2030) would be relatively weak after a relatively weak Solar Cycle 24 (December 2008 to December 2019). Solar Cycle 25 has proven more intense and has progressed more rapidly than initially projected by NOAA in 2023. While the cycle was originally forecast to peak by late 2024, current data indicates the cycle is peaking around mid-2025, with sunspot activity exceeding that of Solar Cycle 24 and approaching the upper range of 125 smoothed sunspots from earlier predictions. This elevated solar activity has contributed to increased atmospheric drag in low-Earth orbit, leading to accelerated satellite deorbiting and unplanned impacts to orbital operations. Our ability to mitigate these solar cycle effects and maintain timely replenishment of our constellation may adversely affect our results of operations.
Investment in Growth
We continue investing in growing our business and capitalizing on our market opportunities while balancing the uncertainties from the macroeconomic environment and geopolitical factors. We intend to continue to add headcount to our global sales and marketing teams to acquire new customers and to increase sales to existing customers. We also intend to continue to add headcount as needed to our research and development teams and otherwise invest to improve and innovate our nanosatellite, ground station, and data analytics technologies. Our total headcount across all functions decreased to 370 employees as of June 30, 2025, from 431 employees as of June 30, 2024 primarily due to the sale of the maritime business. We expect headcount will grow, as stated above, from the new post-Transactions baseline. The costs of these investments may adversely affect our results of operations, but we believe that these investments will contribute to our long-term growth.
Acquisitions
Our business strategy may include acquiring other complementary solutions, technologies, or businesses that we believe will allow us to continue on our path to profitability, reduce the time or costs required to develop new technologies, incorporate enhanced functionality into and complement our existing solution offerings, augment our engineering workforce, and enhance our technological capabilities.
Key Business Metrics
We review the following key business metrics to evaluate our business, measure our performance, identify trends affecting our business, formulate business plans, and make strategic decisions:
•
Annual Recurring Revenue (“ARR”)
•
Number of ARR Customers
•
Number of ARR Solution Customers
•
ARR Net Retention Rate
35
Annual Recurring Revenue
We define ARR as our expected annualized revenue from customers that are under contracts with us at the end of the reporting period with a binding and renewable agreement for our subscription solutions or customers that are under a binding multi-year contract that can range from components of our Space Services solution to a project-based customer solution, regardless of remaining term. Customers with Space Services contracts are considered recurring when there is a multi-year binding agreement that has a renewable component in the contract. Customers are also considered recurring when they have multiple contracts over multiple years. Customer contracts for data trials and one-time transactions are excluded from the calculation of ARR.
The decrease in our ARR as of June 30, 2025 was primarily due to the sale of the maritime business. Our ARR is a leading indicator, and accordingly, will tend to outpace the impact on our revenue as we recognize the contract value of various agreements over time.
The following table summarizes our ARR as of each period end indicated:
As of June 30,
(dollars in thousands)
2025
2024
% Change
ARR
$
77,397
$
111,893
(31
)%
ARR Customers and ARR Solution Customers
We define an ARR Customer as an entity that has a contract with us or through our reseller partners’ contracts, that is either a binding and renewable agreement for our subscription solutions, or a binding multi-year contract as of the measurement date independent of the number of solutions the entity has under contract. A single organization with separate subsidiaries, segments, or divisions may represent multiple customers, as we treat each entity that is invoiced separately as an individual customer. In cases where customers subscribe to our platform through our reseller partners, each end customer that meets the above definition is counted separately as an ARR Customer. All entities that have contracts for data trials and one-time transactions are excluded from the calculation of ARR Customers.
We define an ARR Solution Customer similarly to an ARR Customer, but we count every solution the customer has with us separately. As a result, the count of ARR Solution Customers exceeds the count of ARR Customers at each period end, as some customers contract with us for multiple solutions. Our multiple solutions customers are those that are under contract for at least two of our solutions: Aviation, Weather and Climate, Space Reconnaissance, Maritime, and Space Services. All entities that have contracts for data trials and one-time transactions are excluded from the calculation of ARR Solution Customers.
The decrease in our ARR Customers and ARR Solution Customers was primarily driven by the sale of the maritime business and our move to de-emphasize sales to customers with very low ARR or revenue. We expect our strategy to de-emphasize sales to customers with very low ARR or revenue to increase our ARR and revenue per customer, increase our ARR in total, and reduce our customer count as we drive towards the most efficient use of our resources.
The following table summarizes the number of our ARR Customers and ARR Solution Customers as of each period end indicated:
As of June 30,
2025
2024
% Change
ARR Customers
160
663
(76
)%
ARR Solution Customers
170
702
(76
)%
ARR Net Retention Rate
We calculate our ARR Net Retention Rate for a particular fiscal period end by dividing (i) our ARR from those customers at that period end that were also customers as of the last day of the prior fiscal period end by (ii) the ARR from all customers as of the last day of the prior fiscal period. This calculation measures the overall impact from increases in customer contract value (upsells), the decreases in customer contract value (downsells) and the decreases in customer value resulting from customers that have chosen not to renew their contracts with us (lost customers).
36
The following table summarizes our ARR Net Retention Rate for the three and six months ended June 30, 2025 and 2024:
Three Months Ended June 30,
Six Months Ended June 30,
2025(1)
2024
% Change
2025(1)
2024
% Change
ARR Net Retention Rate
83
%
85
%
(2
)%
92
%
93
%
(1
)%
(1) ARR Net Retention Rate does not include the impact of customers who separated from the Company upon the closing of the Transactions.
Our ARR Net Retention Rate can be impacted from period to period by large increases or decreases in customer contract value and large decreases in contract value from customers that have not renewed their contracts with us. An ARR Net Retention Rate greater than 100% is an indication that we are growing the value of the solutions our customers are purchasing from us at a fiscal period end versus the prior fiscal period end. An ARR Net Retention Rate less than 100% is an indication that the value of the solutions our customers are purchasing from us declined at a fiscal period end versus the prior fiscal period end. Our ARR Net Retention Rate decreased by 2% and 1% for the three and six months ended June 30, 2025, respectively, primarily driven by the decreased value of NOAA’s radio occultation technology (“RO”) weather award in the three and six months ended June 30, 2025, compared to the value of the corresponding award in the same periods in 2024.
Components of Results of Operations
Revenue
We derive revenue from providing data, insights and access to our cloud-based technology platform sold on a subscription basis. Some of our customer arrangements include additional performance obligations that encompass the delivery of specific goods, services or intellectual property apart from the ongoing services provided on a subscription basis, which may impact the timing of revenue recognition. Additionally, some of our customer arrangements include material rights to receive discounted subscription services in the future, which impacts the timing of revenue recognition.
Subscription periods for our solutions generally range from one to two years and are typically non-cancelable, with customers having the right to terminate their agreements only if we materially breach our obligations under the agreement. Our subscription fees are typically billed either monthly or quarterly in advance.
Cost of Revenue
Cost of revenue consists primarily of personnel costs, depreciation, hosted infrastructure costs, high-power computing costs, third-party operating and royalty costs associated with delivering our data and services to our customers, and costs associated with R&D Services contracts. In addition, cost of revenue includes the amortization of purchased intangibles associated with our acquisition of exactEarth in November 2021 (the “Acquisition”). Personnel costs are primarily related to the cost of our employees supporting and managing our constellation operations including satellite operations, ground station control, and launch management. Personnel costs also include the cost of our employees supporting and managing projects for our R&D Services contracts. Costs associated with the manufacture and launch of our satellites, including personnel costs, are capitalized and depreciated upon placement in service, typically over a four-year expected useful life. As satellites reach the end of their expected useful life, they are generally replaced with replenishment satellites to maintain our constellation at optimal performance. Costs associated with the acquisition and development of new ground stations, including the bill of materials and labor to install the ground station, are capitalized and depreciated upon placement in service typically over a four-year to ten-year expected useful life. We anticipate ongoing capital spending to repair and replenish ground stations as they reach the end of their expected useful life to keep our ground station network at optimal performance. Our proprietary ground station network is primarily located in third-party locations where we incur lease and other operational charges. Cost of revenue also includes royalties associated with third-party data sets that we integrate into our data solutions.
Operating Expenses
Research and Development. Research and development expenses consist primarily of employee-related expenses, third-party consulting fees, and computing costs. Our research and development efforts are focused on improving our satellite technology, developing new data sets, developing new algorithms, enhancing our smart and predictive analytics, and enhancing the ease of use and utility of our space-based data solutions.
37
Sales and Marketing. Sales and marketing expenses consist primarily of employee-related expenses, sales commissions, marketing and advertising costs, costs incurred in the development of customer relationships, brand development costs, travel-related expenses, allowance for current expected credit losses, and amortization of purchased intangible backlog associated with the Acquisition. Commission costs on new customer contract bookings are considered costs of obtaining customer contracts. Commission costs for multi-year deals are considered contract acquisition costs and are deferred and then amortized over the period of the contract. Commission costs on contracts completed with a term of twelve months or less are expensed in the period incurred.
General and Administrative. General and administrative expenses consist of employee-related expenses for personnel in our executive, finance and accounting, facilities, legal, human resources, and management information systems functions, as well as other administrative employees. In addition, general and administrative expenses include fees related to third-party legal counsel, corporate insurance, fees related to accounting, tax and audit costs, office facilities costs, software subscription costs, and other corporate costs.
Loss on Decommissioned Satellites. Loss on decommissioned satellites consists of the write-off of the net book value associated with the manufacture and launch of our satellites prior to the end of the satellite’s useful life. We contract with third-party companies to launch, carry, and deploy our satellites into space. A loss could result from a third-party launch or deployer failure, a technical failure of the satellite, or the deorbit or decommissioning of a satellite before the end of the satellite’s useful life. A technical failure could include a satellite that is not able to communicate with our network of ground stations or fulfill its intended technical mission for a duration greater than one month. The loss amount is presented net of any insurance proceeds received. Due to the nature of these events, we cannot predict the magnitude or frequency of future satellite deorbit and launch failure losses. We sometimes purchase launch insurance when financially practical; however, the proceeds from these insurance policies will typically only cover a portion of our launch loss.
Allowance for Current Expected Credit Loss on Notes Receivable. Allowance for current expected credit loss on notes receivable consists of allowance for current expected credit loss recorded on a note receivable and accrued interest issued to a Space Services customer.
Other Income (Expense)
Interest Income. Interest income includes interest earned on our cash balances and short-term marketable securities.
Interest Expense. Interest expense primarily includes interest costs associated with our debt and amortization of deferred financing costs.
Gain on Sale of a Business. The gain on the sale of our maritime business primarily reflects the excess of the sale proceeds over the net book value of the assets sold, net of transaction costs and other related adjustments.
Loss on Extinguishment of Debt. Loss on extinguishment of debt includes applicable premium, exit fee, legal fees, and other fees associated with the payoff of existing debt.
Change in Fair Value of Contingent Earnout Liability. Change in fair value of contingent earnout liability includes mark-to-market adjustments to reflect changes in the fair value of the contingent earnout liability.
Change in Fair Value of Warrant Liabilities. Change in fair value of warrant liabilities includes mark-to-market adjustments to reflect changes in fair value of warrant liabilities.
Issuance of Stock Warrants. Issuance of stock warrants includes expense related to the value of the right to purchase company shares.
Foreign Exchange Gain (Loss). Foreign exchange gain (loss) consists of the net effect of realized and unrealized foreign currency gains and losses resulting from changes in the currency exchange rates for transactions denominated in a non-functional currency relative to each subsidiary’s functional currency. We use the local currency as our functional currency for our subsidiaries in Luxembourg, the United Kingdom, Singapore, Germany, and Canada.
38
Other Expense, Net. Other expense, net consists primarily of tax credits, grant income, share of equity investment loss, and write-off of certain prepaid assets.
Income Tax Provision
Provision for income taxes consists of federal income taxes in the United States and income taxes in certain foreign jurisdictions. We do not provide for income taxes on undistributed earnings of our foreign subsidiaries since we intend to invest these earnings outside of the United States permanently. We account for income taxes using the asset and liability method, whereby deferred tax assets and liabilities are recognized based on differences between the financial reporting and tax bases of assets and liabilities and are measured using the enacted rates and laws that will be in effect when the differences are expected to reverse.
Results of Operations
Three and Six Months Ended June 30, 2025, Compared to Three and Six Months Ended June 30, 2024
The following tables set forth selected condensed consolidated statements of operations data for each of the periods indicated:
Three Months Ended June 30,
Six Months Ended June 30,
(in thousands)
2025
2024
2025
2024
Revenue
$
19,182
$
25,399
$
43,058
$
60,224
Cost of revenue(1)
9,806
14,488
24,970
40,084
Gross profit
9,376
10,911
18,088
20,140
Operating expenses:
Research and development(1)
10,195
7,517
18,854
13,554
Sales and marketing(1)
4,412
5,168
9,943
10,286
General and administrative(1)
17,186
10,009
34,836
19,853
Loss on decommissioned satellites
1,110
529
6,270
707
Allowance for current expected credit loss on notes receivable
—
40
—
80
Total operating expenses
32,903
23,263
69,903
44,480
Loss from operations
(23,527
)
(12,352
)
(51,815
)
(24,340
)
Other income (expense):
Interest income
646
571
666
1,025
Interest expense
(1,686
)
(4,773
)
(7,416
)
(9,826
)
Gain on sale of a business
154,305
—
154,305
—
Loss on extinguishment of debt
(12,008
)
—
(12,008
)
—
Change in fair value of contingent earnout liability
(227
)
(1,187
)
811
(1,232
)
Change in fair value of warrant liabilities
(2,790
)
2,239
3,047
(1,963
)
Issuance of stock warrants
—
—
—
(2,399
)
Foreign exchange gain (loss)
6,965
(513
)
10,791
(2,299
)
Other expense, net
(287
)
(477
)
(511
)
(1,011
)
Total other income (expense), net
144,918
(4,140
)
149,685
(17,705
)
Income (loss) before income taxes
121,391
(16,492
)
97,870
(42,045
)
Income tax provision
1,801
67
1,795
58
Net income (loss)
$
119,590
$
(16,559
)
$
96,075
$
(42,103
)
(1) Includes stock-based compensation as follows:
Three Months Ended June 30,
Six Months Ended June 30,
(in thousands)
2025
2024
2025
2024
Cost of revenue
$
79
$
63
$
192
$
124
Research and development
837
1,210
1,662
2,228
Sales and marketing
490
944
1,968
1,619
General and administrative
4,816
2,578
7,305
4,452
Total stock-based compensation
$
6,222
$
4,795
$
11,127
$
8,423
39
Revenue
Three Months Ended June 30,
Six Months Ended June 30,
(dollars in thousands)
2025
2024
% Change
2025
2024
% Change
Revenue
$
19,182
$
25,399
(24
)%
$
43,058
$
60,224
(29
)%
Three Months Ended June 30, 2025, Compared to Three Months Ended June 30, 2024
Total revenue decreased $6.2 million, or 24%, for the three months ended June 30, 2025, primarily due to the sale of the maritime business which occurred on April 25, 2025. Additional drivers include a reduction in year-over-year RO-based revenue primarily from the reduced value of NOAA’s RO weather award during the three months ended June 30, 2025, as compared to the prior year period, partially offset by increased ARR from our existing customers and growth in revenue recognized for both Space Services contracts and R&D Services contracts. Our ARR Customers decreased to 160 as of June 30, 2025 down from 663 as of June 30, 2024, or 76%. The decrease in ARR Customers was primarily driven by the sale of the maritime business and our move to de-emphasize sales to customers with very low ARR or revenue. Our ARR Net Retention Rate was 83% and 85% for the three months ended June 30, 2025 and 2024, respectively. The decrease in ARR Net Retention Rate was driven primarily by the decreased value of NOAA’s radio occultation technology (“RO”) weather award, compared to the value of the corresponding award in the same period in 2024.
We derived 66% of our revenue from the Americas, 31% of our revenue from Europe, the Middle East and Africa (“EMEA”), and 3% of our revenue from Asia Pacific (“APAC”) for the three months ended June 30, 2025. We derived 55% of our revenue from the Americas, 37% of our revenue from EMEA, and 8% of our revenue from APAC for the three months ended June 30, 2024. We derived 76% of our revenue from subscription arrangements for the three months ended June 30, 2025, compared to 78% for the three months ended June 30, 2024. The distribution of our revenue can fluctuate significantly from period to period driven primarily by the timing of the non-subscription revenue recognition in our contracts. Revenue from subscription-based contracts was $14.6 million, or 76%, of total revenue, for the three months ended June 30, 2025, and was $19.7 million, or 78%, of total revenue, for the three months ended June 30, 2024. The proportional decrease in revenue from subscription arrangements was driven by the sale of the maritime business.
Six Months Ended June 30, 2025, Compared to Six Months Ended June 30, 2024
Total revenue decreased $17.2 million, or 29%, for the six months ended June 30, 2025, primarily due to the sale of the maritime business which occurred on April 25, 2025. The decrease was also attributable to items that occurred in the six months ended June 30, 2024 that did not repeat in the six months ended June 30, 2025, including a one-time recognition of $9.6 million of revenue upon satisfaction of a performance obligation for a Space Services customer. Additional drivers include a reduction in year-over-year RO-based revenue primarily from the reduced value of NOAA’s RO weather award during the six months ended June 30, 2025 as compared to the prior year period, partially offset by increased ARR from our existing customers and growth in revenue recognized for both Space Services contracts, excluding the impact of the aforementioned 2024 performance obligation, and R&D Services contracts.
We derived 61% of our revenue from the Americas, 33% of our revenue from EMEA, and 6% of our revenue from APAC for the six months ended June 30, 2025. We derived 61% of our revenue from the Americas, 32% of our revenue from EMEA, and 7% of our revenue from APAC for the six months ended June 30, 2024. We derived 79% of our revenue from subscription arrangements for the six months ended June 30, 2025, compared to 63% for the six months ended June 30, 2024. The distribution of our revenue can fluctuate significantly from period to period driven primarily by the timing of the non-subscription revenue recognition in our contracts. Revenue from subscription-based contracts was $34.1 million, or 79%, of total revenue, for the six months ended June 30, 2025, and was $37.8 million, or 63%, of total revenue, for the six months ended June 30, 2024. The decrease in total subscription revenue was driven by the sale of the maritime business. The proportional increase in subscription revenue was primarily due to higher revenue from Space Services contracts in the prior-year period.
40
Cost of Revenue
Three Months Ended June 30,
Six Months Ended June 30,
(dollars in thousands)
2025
2024
% Change
2025
2024
% Change
Total cost of revenue
$
9,806
$
14,488
(32
)%
$
24,970
$
40,084
(38
)%
Gross profit
9,376
10,911
(14
)%
18,088
20,140
(10
)%
Gross margin
49
%
43
%
6
%
42
%
33
%
9
%
Headcount (at end of period) (1)
40
35
14
%
40
35
14
%
(1) Excludes headcount relating to R&D Services contracts. R&D Services contracts headcount is included in research and development.
Three Months Ended June 30, 2025, Compared to Three Months Ended June 30, 2024
Cost of revenue decreased $4.7 million, or 32%, primarily driven by a decrease in depreciation expense of $2.7 million, a decrease in personnel expenses of $1.9 million and a decrease in other miscellaneous expenses of $0.1 million. The decrease in depreciation expense was primarily driven by the acceleration of depreciation in the prior year period to account for the impact of increased solar activity related to the current solar cycle, which resulted in a number of satellites becoming fully depreciated. The decrease in personnel costs was driven by decreased work related to R&D Services contracts during the period, which resulted in a smaller proportion of costs being allocated to cost of revenue.
Gross margin was 49% and 43% for the three months ended June 30, 2025 and 2024, respectively. The increase was driven primarily by the decrease in cost of revenue described above. Our gross margin can fluctuate significantly from period to period driven primarily by the timing of revenue recognition as well as the timing of our technology investments to support future growth.
Six Months Ended June 30, 2025, Compared to Six Months Ended June 30, 2024
Cost of revenue decreased $15.1 million, or 38%, primarily driven by a decrease in satellite operation expense of $8.2 million, a decrease in depreciation expense of $4.5 million, a decrease in personnel expenses of $4.4 million, and a decrease in other miscellaneous expenses of $0.1 million, partially offset by an increase in downlink data service expenses of $2.1 million. The decrease in satellite operation expense was driven by the recognition of increased launch costs associated with a Space Services contract in the prior year period that did not recur during the three months ended June 30, 2025. The decrease in depreciation expense was primarily driven by the acceleration of depreciation in the prior year period to account for the impact of increased solar activity related to the current solar cycle, which resulted in a number of satellites becoming fully depreciated. The decrease in personnel costs was driven by decreased work related to R&D Services contracts during the period, which resulted in a smaller proportion of costs being allocated to cost of revenue. The increase in downlink data service expenses was primarily driven by the purchase of supplemental data to support a radio frequency geolocation contract.
Gross margin was 42% and 33% for the six months ended June 30, 2025 and 2024, respectively. The increase was driven primarily by the decrease in cost of revenue described above. Our gross margin can fluctuate significantly from period to period driven primarily by the timing of revenue recognition as well as the timing of our technology investments to support future growth.
Operating Expenses
Operating expenses consist of our research and development, our sales and marketing, and our general and administrative expenses, as well as loss on decommissioned satellites in some periods. As we continue to invest in our growth, we expect our operating expenses to increase in absolute dollars as revenue grows. However, we expect our operating expenses as a percentage of revenue to decrease over time.
41
Research and Development
Three Months Ended June 30,
Six Months Ended June 30,
(dollars in thousands)
2025
2024
% Change
2025
2024
% Change
Research and development
$
10,195
$
7,517
36
%
$
18,854
$
13,554
39
%
Percentage of total revenue
53
%
30
%
44
%
23
%
Headcount (at end of period) (1)
208
240
(13
)%
208
240
(13
)%
(1) Includes headcount relating to R&D Services contracts. R&D Services contracts expenses are included in cost of revenue.
Three Months Ended June 30, 2025, Compared to Three Months Ended June 30, 2024
Research and development expenses increased $2.7 million, or 36%, primarily driven by an increase in personnel expenses of $1.9 million, an increase in severance expense of $0.4 million, and an increase in other miscellaneous operating expenses of $0.4 million. The increase in personnel costs was driven by decreased work related to R&D Services contracts during the period, which caused a lower proportion of costs to be allocated to cost of revenue.
Six Months Ended June 30, 2025, Compared to Six Months Ended June 30, 2024
Research and development expenses increased $5.3 million, or 39%, primarily driven by an increase in personnel expenses of $4.1 million, an increase in other miscellaneous operating expenses of $0.7 million, and an increase in severance expense of $0.5 million. The increase in personnel costs was driven by decreased work related to R&D Services contracts during the period, which caused a lower proportion of costs to be allocated to cost of revenue.
We expect research and development expenses to increase in absolute dollars in future periods primarily due to higher headcount as we continue to invest in the development of our solutions offerings and new technologies. However, we expect research and development expenses to decrease as a percentage of revenue in future periods as our revenue growth exceeds our increase in research and development spend.
Sales and Marketing
Three Months Ended June 30,
Six Months Ended June 30,
(dollars in thousands)
2025
2024
% Change
2025
2024
% Change
Sales and marketing
$
4,412
$
5,168
(15
)%
$
9,943
$
10,286
(3
)%
Percentage of total revenue
23
%
20
%
23
%
17
%
Headcount (at end of period)
37
67
(45
)%
37
67
(45
)%
Three Months Ended June 30, 2025, Compared to Three Months Ended June 30, 2024
Sales and marketing expenses decreased $0.8 million, or 15%, primarily driven by a decrease in personnel costs. The decrease in personnel costs was driven by an overall reduction in headcount.
Six Months Ended June 30, 2025, Compared to Six Months Ended June 30, 2024
Sales and marketing expenses decreased $0.3 million, or 3%, primarily driven by a $1.0 million reduction in personnel costs related to the sale of the Transactions, partially offset by higher bonus payouts related to the Transactions.
We expect sales and marketing expenses to generally grow in absolute dollars in the future primarily due to increased employee-related expenses to support our sales and marketing efforts and our continued expansion of our sales capacity across our solutions. However, we expect sales and marketing expenses as a percentage of revenue to decrease in future periods as our revenue growth exceeds our increases in sales and marketing spend.
42
General and Administrative
Three Months Ended June 30,
Six Months Ended June 30,
(dollars in thousands)
2025
2024
% Change
2025
2024
% Change
General and administrative
$
17,186
$
10,009
72
%
$
34,836
$
19,853
75
%
Percentage of total revenues
90
%
39
%
81
%
33
%
Headcount (at end of period)
85
89
(4
)%
85
89
(4
)%
Three Months Ended June 30, 2025, Compared to Three Months Ended June 30, 2024
General and administrative expenses increased $7.2 million, or 72%, primarily driven by an increase in stock-based compensation expense of $2.3 million, an increase in professional services expenses of $1.9 million, an increase in bonus expenses of $1.8 million, an increase in severance expense of $0.8 million, and an increase in other miscellaneous operating expenses of $0.4 million. The increase in stock-based compensation expense was driven by higher equity grants, which resulted in a higher total value of stock-based awards recognized in the current year period. The increase in professional services fees was primarily driven by higher third-party legal and accounting services relating to the Transactions. The increase in bonus expenses was driven by bonus payouts related to the Transactions.
Six Months Ended June 30, 2025, Compared to Six Months Ended June 30, 2024
General and administrative expenses increased $15.0 million, or 75%, primarily driven by an increase in professional services expenses of $8.4 million, an increase in stock-based compensation expense of $2.9 million, an increase in bonus expenses of $2.0 million, an increase in severance expense of $0.9 million, and an increase in other miscellaneous operating expenses of $0.8 million. The increase in professional services fees was primarily driven by higher third-party accounting, legal and other consulting services relating to the restatement of our previously issued financial statements and the Transactions. The increase in stock-based compensation expense was driven by higher equity grants, which resulted in a higher total value of stock-based awards recognized in the current year period. The increase in bonus expenses was driven by bonus payouts related to the Transactions.
We expect our general and administrative expenses to generally grow in absolute dollars in future periods as our employee-related expenses increase to support our revenue growth. However, we expect our general and administrative expenses as a percentage of revenue to decrease as revenue growth exceeds our increases in general and administrative spend.
Loss on Decommissioned Satellites
Three Months Ended June 30,
Six Months Ended June 30,
(dollars in thousands)
2025
2024
% Change
2025
2024
% Change
Loss on decommissioned satellites
$
1,110
$
529
110
%
$
6,270
$
707
787
%
Percentage of total revenues
6
%
2
%
15
%
1
%
Three Months Ended June 30, 2025, Compared to Three Months Ended June 30, 2024
We recognized a non-cash expense of $1.1 million and $0.5 million in the three months ended June 30, 2025 and 2024, respectively. The increase in loss on decommissioned satellites is primarily a result of the deorbiting of three satellites during the three months ended June 30, 2025.
Six Months Ended June 30, 2025, Compared to Six Months Ended June 30, 2024
We recognized a non-cash expense of $6.3 million and $0.7 million in the six months ended June 30, 2025 and 2024, respectively. The increase in loss on decommissioned satellites is a result of our decision during the current year period to stop supporting three underperforming satellites during the three months ended March 31, 2025 and the deorbiting of three satellites during the three months ended June 30, 2025.
43
Due to the nature of these events, we cannot predict the magnitude or frequency of future decommissioning losses. While we sometimes purchase launch insurance when financially practical, the proceeds from these policies will typically only cover a portion of our loss in the event of an unplanned satellite deorbit or launch failure.
Allowance for Current Expected Credit Loss on Notes Receivable
Three Months Ended June 30,
Six Months Ended June 30,
(dollars in thousands)
2025
2024
% Change
2025
2024
% Change
Allowance for current expected credit loss on notes receivable
$
—
$
40
-100%
$
—
$
80
-100%
Percentage of total revenues
—
%
—
%
—
%
0
%
Allowance for current expected credit loss on notes receivable decreased for the three and six months ended June 30, 2025, as compared to the three and six months ended June 30, 2024, due to the related note receivable that had been fully reserved as of December 31, 2024.
Other Income (Expense)
Three Months Ended June 30,
Six Months Ended June 30,
(dollars in thousands)
2025
2024
% Change
2025
2024
% Change
Interest income
$
646
$
571
13
%
$
666
$
1,025
(35
)%
Interest expense
$
(1,686
)
$
(4,773
)
(65
)%
$
(7,416
)
$
(9,826
)
(25
)%
Gain on sale of a business
$
154,305
$
—
*
$
154,305
$
—
*
Loss on extinguishment of debt
$
(12,008
)
$
—
*
$
(12,008
)
$
—
*
Change in fair value of contingent earnout liability
$
(227
)
$
(1,187
)
(81
)%
$
811
$
(1,232
)
166
%
Change in fair value of warrant liabilities
$
(2,790
)
$
2,239
225
%
$
3,047
$
(1,963
)
255
%
Issuance of stock warrants
$
—
$
—
*
$
—
$
(2,399
)
(100
)%
Foreign exchange gain (loss)
$
6,965
$
(513
)
1,458
%
$
10,791
$
(2,299
)
569
%
Other expense, net
$
(287
)
$
(477
)
(40
)%
$
(511
)
$
(1,011
)
(49
)%
*Not Meaningful
Three Months Ended June 30, 2025, Compared to Three Months Ended June 30, 2024
Interest income increased by $0.1 million, or 13%, for the three months ended June 30, 2025, primarily due to higher average balances held in marketable securities as a result of the proceeds received via the close of the Transactions on April 25, 2025.
Interest expense decreased by $3.1 million, or 65%, for the three months ended June 30, 2025, primarily due to the payoff of our Blue Torch loan on April 25, 2025.
Gain on sale of a business was $154.3 million for the three months ended June 30, 2025, with no comparable amount for the three months ended June 30, 2024. The gain was driven by the excess of proceeds from the sale of the maritime business over the net book value of the assets sold, net of transaction costs and other related adjustments.
Loss on extinguishment of debt was $12.0 million for the three months ended June 30, 2025, with no comparable amount for the three months ended June 30, 2024. The loss was primarily related to the payoff of existing debts, most significantly our Blue Torch loan, and includes applicable premium, exit fees, legal fees, and other fees.
Change in fair value of contingent earnout liability was a loss of $0.2 million for the three months ended June 30, 2025, compared to a loss of $1.2 million for the three months ended June 30, 2024. The loss in the three months ended June 30, 2025, was primarily due to an increase in the fair value of the liability driven by an increase in the price for the underlying Class A common stock of the Company. For additional information, see Notes 2 and 9 to our unaudited condensed consolidated financial statements included in this Quarterly Report on Form 10-Q.
44
Change in fair value of warrant liabilities was a loss of $2.8 million for the three months ended June 30, 2025, compared to a gain of $2.2 million for the three months ended June 30, 2024, a change of 225%. The $2.8 million loss for the three months ended June 30, 2025, was primarily due to an increase in the fair value of the warrant liabilities driven by an increase in the price for the Company's Class A common stock, a key input to the fair value estimation model. The $2.2 million gain for the three months ended June 30, 2024, was primarily due to a decline in the price for the Company's Class A common stock.
There was no issuance of stock warrant expense for the three months ended June 30, 2025 and 2024.
We recognized a foreign exchange gain of $7.0 million for the three months ended June 30, 2025, compared to a foreign exchange loss of $0.5 million for the three months ended June 30, 2024. The $7.0 million gain for the three months ended June 30, 2025, was primarily due to the remeasurement of intercompany balances denominated in U.S. dollars held by our Luxembourg and U.K. entities and owed to our U.S. entity. The weakening of the U.S. Dollar for the period ended June 30, 2025, relative to the Euro and British Pound Sterling at March 31, 2025, triggered the remeasurement and unrealized gain. The loss of $0.5 million for the three months ended June 30, 2024, was primarily due to the remeasurement of intercompany balances denominated in U.S. dollars between our Luxembourg entity and our U.S. entity denominated in U.S. dollars. The strengthening of the U.S. Dollar for the period ended June 30, 2024, relative to the Euro at March 31, 2024, triggered the remeasurement and unrealized losses.
Other expense, net was a loss of $0.3 million for the three months ended June 30, 2025, compared to a loss of $0.5 million for the same period in 2024, primarily due to losses on an equity investment for each of the three months ended June 30, 2025 and 2024.
Six Months Ended June 30, 2025, Compared to Six Months Ended June 30, 2024
Interest income decreased by $0.4 million, or 35%, for the six months ended June 30, 2025, primarily due to a significantly lower average balance of marketable securities during the six months ended June 30, 2025 as compared to the six months ended June 30, 2024. We held no marketable securities for the duration of the six months ended June 30, 2025 prior to the closing of the Transactions on April 25, 2025 as compared to an average balance of $17.0 million of marketable securities for the six months ended June 30, 2024.
Interest expense decreased by $2.4 million, or 25%, for the six months ended June 30, 2025, primarily due to the payoff of our Blue Torch loan on April 25, 2025.
Gain on sale of a business was $154.3 million for the six months ended June 30, 2025, with no comparable amount for the six months ended June 30, 2024. The gain was driven by the excess of proceeds from the sale of the maritime business over the net book value of the assets sold, net of transaction costs and other related adjustments.
Loss on extinguishment of debt was $12.0 million for the six months ended June 30, 2025, with no comparable amount for the six months ended June 30, 2024. The loss was primarily related to the payoff of existing debts, most significantly our Blue Torch loan, and includes applicable premium, exit fees, legal fees, and other fees.
Change in fair value of contingent earnout liability was a gain of $0.8 million for the six months ended June 30, 2025, compared to a loss of $1.2 million for the six months ended June 30, 2024, a change of 166%. The gain for the six months ended June 30, 2025, was primarily due to a decrease in the fair value of the liability driven by the decline of the price for the underlying Class A common stock of the Company. The loss for the six months ended June 30, 2024, was primarily driven by an increase in the fair value of the liability driven by an increase in the price of the underlying Class A common stock of the Company and a higher volatility rate of the Company's Class A common stock, each key inputs of the fair value estimation model for the period. For additional information, see Notes 2 and 9 to our unaudited condensed consolidated financial statements included in this Quarterly Report on Form 10-Q.
Change in fair value of warrant liabilities was a gain of $3.0 million for the six months ended June 30, 2025, compared to a loss of $2.0 million for the six months ended June 30, 2024, a change of 255%. The $3.0 million gain for the six months ended June 30, 2025, was primarily due to a decrease in the fair value of the warrant liabilities driven by the decline of the underlying Class A common stock price. The $2.0 million loss for the six months ended June 30, 2024, was primarily due to the appreciation of the underlying Class A common stock valuation for the warrants issued to Blue Torch.
45
There was no issuance of stock warrant expense for the six months ended June 30, 2025. During the six months ended June 30, 2024, issuance of stock warrants was a net loss of $2.4 million, relating to a definitive Securities Purchase Agreement with institutional investors.
We recognized a foreign exchange gain of $10.8 million for the six months ended June 30, 2025, compared to a foreign exchange loss of $2.3 million for the six months ended June 30, 2024, a change of 569%. The $10.8 million gain for the six months ended June 30, 2025, was primarily due to the remeasurement of intercompany balances denominated in U.S. dollars held by our Luxembourg and U.K. entities and owed to our U.S. entity. The weakening of the U.S. Dollar for the period ended June 30, 2025, relative to the Euro and British Pound Sterling at December 31, 2024, triggered the remeasurement and unrealized gain. The loss of $2.3 million for the six months ended June 30, 2024, was primarily due to the remeasurement of intercompany balances denominated in U.S. dollars held by our Luxembourg entity and owed to our U.S. entity.
Other expense, net was a loss of $0.5 million for the three months ended June 30, 2025, a decrease of 50% compared to a loss of $1.0 million for the six months ended June 30, 2024, primarily due to a higher value for disposed of assets in the six months ended June 30, 2024.
Income Tax Provision
Three Months Ended June 30,
Six Months Ended June 30,
(dollars in thousands)
2025
2024
% Change
2025
2024
% Change
Income tax provision
$
1,801
$
67
2,588
%
$
1,795
$
58
2,995
%
The income tax provision increased for the three and six months ended June 30, 2025, as compared to the three and six months ended June 30, 2024, due to taxable income recognized from the gain on the sale of the maritime business.
On July 4, 2025, the One Big Beautiful Bill Act ("OBBBA") was enacted in the United States. The OBBBA includes significant provisions, such as the permanent extension of certain expiring provisions of the Tax Cuts and Jobs Act, modifications to the international tax framework and the restoration of favorable tax treatment for certain business provisions. The legislation has multiple effective dates, with certain provisions effective in 2025 and others implemented through 2027. We are currently assessing the impact of the OBBBA on our consolidated financial statements.
Non-GAAP Financial Measures
We believe that in addition to our results determined in accordance with GAAP, non-GAAP Adjusted EBITDA is useful in evaluating our business, results of operations and financial condition. We believe that this non-GAAP financial measure may be helpful to investors because it provides consistency and comparability with past financial performance and facilitates period to period comparisons of operations, as this eliminates the effects of certain variables from period to period for reasons that we do not believe reflect our underlying business performance. In addition to our GAAP measures, we use this non-GAAP financial measure internally for budgeting and resource allocation purposes and in analyzing our financial results.
We define EBITDA as net income (loss), plus depreciation and amortization expense, plus interest, net, and plus income tax provision.
We define Adjusted EBITDA as earnings before interest, taxes, depreciation and amortization, further adjusted for any gain on sale of division, loss on extinguishment of debt, change in fair value of contingent earnout liability, change in fair value of warrant liabilities, issuance of stock warrants, foreign exchange (gain) loss, other expense, net, stock-based compensation, loss on decommissioned satellites, other unusual and infrequent costs, and other acquisition accounting amortization. We believe Adjusted EBITDA can be useful in providing an understanding of the underlying results of operations and trends, an enhanced overall understanding of our financial performance and prospects for the future. While Adjusted EBITDA is not a recognized measure under GAAP, management uses this financial measure to evaluate and forecast business performance. Adjusted EBITDA is not intended to be a measure of liquidity or cash flows from operations or a measure comparable to net income (loss) as it does not take into account certain requirements, such as capital expenditures and related depreciation, interest payments, tax benefits, stock-based compensation, other unusual and infrequent costs, and other acquisition accounting amortization.
46
Adjusted EBITDA is not a presentation made in accordance with GAAP, and our use of the term Adjusted EBITDA may vary from the use of similarly titled measures by others in our industry due to the potential inconsistencies in the method of calculation and differences due to items subject to interpretation.
The presentation of non-GAAP financial information should not be considered in isolation or as a substitute for, or superior to, the financial information prepared and presented in accordance with GAAP. Investors should note that the excluded items may have had, and may in the future have, a material impact on our reported financial results. Investors should read this discussion and analysis of our financial condition and results of operations together with the condensed consolidated financial statements and the related notes thereto also included within.
For the reasons set forth below, we believe that excluding the following items provides information that is helpful in understanding our results of operations, evaluating our future prospects, comparing our financial results across accounting periods, and comparing our financial results to our peers, many of which provide similar non-GAAP financial measures.
•
Gain on sale of a business. We exclude this as a material unusual item that does not reflect the ongoing operational results of our business.
•
Loss on extinguishment of debt. We exclude this as the fees associated with this line are not typical of the ongoing servicing of our debt and do not reflect the operational results of our business.
•
Change in fair value of contingent earnout liabilities and warrant liabilities. We exclude this as it does not reflect the underlying cash flows or operational results of the business.
•
Issuance of stock warrants. We exclude this as it does not reflect the underlying cash flows or operational results of the business.
•
Foreign exchange gain (loss). We are exposed to foreign currency gains or losses on outstanding foreign currency denominated receivables and payables related to certain customer sales agreements, product costs and other operating expenses. As we do not actively hedge these currency exposures, changes in the underlying currency rates relative to the U.S. Dollar may result in realized and unrealized foreign currency gains and losses between the time these receivables and payables arise and the time that they are settled in cash. Since such realized and unrealized foreign currency gains and losses are the result of macro-economic factors and can vary significantly from one period to the next, we believe that exclusion of such realized and unrealized gains and losses is useful to management and investors in evaluating the performance of our ongoing operations on a period-to-period basis.
•
Other expense, net. We exclude other expense, net because it includes items that do not reflect the underlying cash flows or operational results of our business. Examples of such expenses include equity investment loss and disposal of assets.
•
Stock-based compensation. We exclude stock-based compensation expenses primarily because they are non-cash expenses that we exclude from our internal management reporting processes. We also find it useful to exclude these expenses when we assess the appropriate level of various operating expenses and resource allocations when budgeting, planning, and forecasting future periods. Moreover, because of varying available valuation methodologies, subjective assumptions and the variety of award types that companies can use under Financial Accounting Standards Board ASC Topic 718, Stock Compensation, we believe excluding stock-based compensation expenses allows investors to make meaningful comparisons between our recurring core business results of operations and those of other companies.
•
Loss on decommissioned satellites. We exclude loss on decommissioned satellites because if there was no loss, the expense would be accounted for as depreciation and would also be excluded as part of our EBITDA calculation.
•
Other unusual and infrequent costs. We exclude these as they are unusual items that do not reflect the ongoing operational results of our business. Examples of these types of expenses include accounting, legal and other professional fees associated with the financial restatement.
•
Other acquisition accounting amortization. We amortize prepaid expense for purchased data rights in connection with the acquisition of exactEarth and certain technologies. The prepaid amortization of this asset is a non-cash expense that can be significantly affected by the inherent subjective nature of the assigned value and useful life. We exclude this amortized prepaid expense for our internal management reporting processes because it has already been incurred and is a non-cash expense. Our management also finds it useful to exclude this charge when assessing the appropriate level of various operating expenses and resource allocations when budgeting, planning and forecasting future periods. It is important to
47
note that while this expense is excluded for purposes of non-GAAP presentation, the revenue of the acquired companies is reflected in the non-GAAP measures and that the assets contribute to revenue generation.
The following table outlines the reconciliation from net income (loss) to Adjusted EBITDA for the periods indicated:
Three Months Ended June 30,
Six Months Ended June 30,
(in thousands)
2025
2024
2025
2024
Net income (loss)
$
119,590
$
(16,559
)
$
96,075
$
(42,103
)
Depreciation & amortization
2,524
5,652
6,937
12,489
Interest, net
1,040
4,202
6,750
8,801
Income tax provision
1,801
67
1,795
58
EBITDA
124,955
(6,638
)
111,557
(20,755
)
Adjustments to EBITDA:
Gain on sale of a business
(154,305
)
—
(154,305
)
—
Loss on extinguishment of debt
12,008
—
12,008
—
Change in fair value of contingent earnout liability
227
1,187
(811
)
1,232
Change in fair value of warrant liabilities
2,790
(2,239
)
(3,047
)
1,963
Issuance of stock warrants
—
—
—
2,399
Foreign exchange (gain) loss
(6,965
)
513
(10,791
)
2,299
Other expense, net
287
477
511
1,011
Stock-based compensation
6,222
4,795
11,127
8,423
Loss on decommissioned satellites
1,110
529
6,270
707
Other unusual and infrequent costs
3,388
—
9,125
—
Other acquisition accounting amortization
54
170
219
338
Adjusted EBITDA
$
(10,229
)
$
(1,206
)
$
(18,137
)
$
(2,383
)
Limitations on the Use of Non-GAAP Financial Measures
There are limitations to using non-GAAP financial measures because non-GAAP financial measures are not prepared in accordance with GAAP and may be different from non-GAAP financial measures provided by other companies.
The non-GAAP financial measures are limited in value because they exclude certain items that may have a material impact upon our reported financial results. In addition, they are subject to inherent limitations as they reflect the exercise of judgments by management about which items are adjusted to calculate our non-GAAP financial measures. We compensate for these limitations by analyzing current and future results on a GAAP basis as well as a non-GAAP basis and also by providing GAAP measures in our public disclosures. Some of these limitations are:
•
Although depreciation and amortization are non-cash charges, the assets being depreciated and amortized may have to be replaced in the future, and Adjusted EBITDA does not reflect cash capital expenditure requirements for such replacements or for new capital expenditure requirements;
•
Adjusted EBITDA does not reflect the significant interest expense, or the cash requirements necessary to service interest or principal payments, on our debt;
•
Adjusted EBITDA does not reflect income tax payments that may represent a reduction in cash available to us; and
•
Adjusted EBITDA does not reflect decommissioned satellites and does not reflect the cash capital expenditure requirements for the replacements of lost satellites. While these expenses could occur in a given year, the existence and magnitude of these costs could vary greatly and are unpredictable.
Non-GAAP financial measures should not be considered in isolation from, or as a substitute for, financial information prepared in accordance with GAAP. We encourage investors and others to review our financial information in its entirety, not to rely on any single financial measure to evaluate our business, and to view our non-GAAP financial measures in conjunction with the most directly comparable GAAP financial measures.
48
Liquidity and Capital Resources
Our principal sources of liquidity to fund our operations are from cash and cash equivalents and marketable securities, which totaled $117.6 million as of June 30, 2025, primarily attributable to proceeds from the sale of our maritime business and the 2025 Private Placement (as defined below). Approximately $10.2 million of our cash and cash equivalents as of June 30, 2025 was held outside of the United States. The remaining $81.5 million was held in short-term marketable securities, all of which was held in the United States and can be converted to cash with minimal transaction costs. These amounts compare to zero dollars in investments in short-term marketable securities and cash and cash equivalents of $19.2 million as of December 31, 2024, of which $14.4 million was held outside of the United States. The cash and cash equivalent amounts are exclusive of restricted cash, which totaled $0.5 million as of June 30, 2025 and December 31, 2024. Since our inception, we have been in an operating cash flow deficit as we have made significant investments in our technology infrastructure, built out our research and development foundation, grown sales and marketing resources to drive revenue, and scaled general and administrative functions to enable operating effectiveness.
On November 13, 2024, we entered into the Purchase Agreement with Buyer, pursuant to which we agreed to complete the Transactions. The maritime business sold pursuant to the Transactions did not include any part of our satellite network or operations. On April 25, 2025, we and L3Harris, entered into the Settlement Agreement among us, exactEarth and L3Harris, pursuant to which, upon the closing of the Transactions, Buyer paid L3Harris $17.0 million for full and complete resolution and release of all disputes asserted in connection with the A&R L3Harris Agreement between us and L3Harris. We and Buyer further agreed that we would contribute $7.0 million of the Settlement in the form of a reduction to the cash paid by Buyer to us at the closing of the Transactions.
On March 12, 2025, we entered into a Securities Purchase Agreement (the “2025 Securities Purchase Agreement”) with the purchasers named therein for the private placement (the “2025 Private Placement”) of (i) 4,843,750 shares of Class A common stock at a purchase price of $8.00 per share and (ii) pre-funded warrants (the “Pre-Funded Warrants”) to purchase 156,250 shares of Class A common stock at a purchase price of $7.9999 per Pre-Funded Warrant. The Pre-Funded Warrants had an exercise price of $0.0001 per share of Class A common stock, were exercisable immediately, and remained outstanding until fully exercised. The aggregate net proceeds for the 2025 Private Placement were $37.3 million, after deducting offering expenses. The 2025 Private Placement closed on March 14, 2025. As of June 30, 2025, all Pre-Funded Warrants had been exercised on a cashless basis.
On April 25, 2025, we completed the sale of our maritime business to Buyer for approximately $238.9 million, which reflects an increase to the original purchase price to account for additional funds contributed by the Buyer toward the Settlement Agreement.
On April 25, 2025, we repaid with a portion of the proceeds of the Transactions all obligations and all amounts borrowed, and all obligations terminated, under the Blue Torch Financing Agreement and the Strategic Innovation Fund (“SIF”) loan agreement. Following the closing of the Transactions, we believe that we will have sufficient working capital to operate for a period of at least one year from the issuance of the June 30, 2025 condensed consolidated financial statements based on our current cash and cash equivalents balance of $36.1 million, investments in short-term marketable securities of $81.5 million, and expected future financial results.
Blue Torch Credit Agreement
On June 13, 2022, we, as borrower, and certain of our subsidiaries, as guarantors, entered into the Blue Torch Financing Agreement with Blue Torch, as administrative agent and collateral agent, and certain lenders (the “Lenders”). The Blue Torch Financing Agreement provided for, among other things, a term loan facility in an aggregate principal amount of up to $120.0 million (the “Blue Torch Credit Facility”).
The $120.0 million term loan was available and drawn at closing, of which $19.7 million was placed in an escrow account by Blue Torch with such amount released upon us achieving certain metrics related to annualized recurring revenue and a total annualized recurring revenue leverage ratio. These metrics were achieved and the $19.7 million was released from the escrow account and delivered to us in February 2023. The term loan accrued interest at a floating rate based, at our election, on either a reference rate or a 3-month Term Secured Overnight Financing Rate (“SOFR”) (subject to a 1.0% floor), plus an interest rate margin of 7.0% for reference rate borrowings and 8.0% for 3-month Term SOFR borrowings, plus an incremental Term SOFR
49
margin of 0.26161%. We elected the Term SOFR rate. Principal on the term loan was only payable at maturity and interest on the term loan was due and payable quarterly for Term SOFR borrowings.
On April 25, 2025, we repaid with a portion of the proceeds of the Transactions all obligations and all amounts borrowed, and all obligations terminated, under the Blue Torch Financing Agreement. The outstanding principal, exit fees, termination penalties, applicable premium and accrued interest under the Blue Torch Financing Agreement that we paid to Blue Torch amounted to, in the aggregate, approximately $108.6 million. We recognized $10.5 million as a loss on extinguishment of debt on the condensed consolidated statements of operations during each of the three and six months ended June 30, 2025 upon the repayment of the Blue Torch Credit Facility.
Government Loan
As part of the Acquisition in November 2021, we assumed a loan agreement with the SIF which was recorded at fair value of the debt. On April 25, 2025, we repaid all obligations under the SIF loan agreement using a portion of the proceeds of the Transactions. We recognized $1.5 million as a loss on extinguishment of debt on the condensed consolidated statements of operations during each of the three and six months ended June 30, 2025 upon the repayment of the SIF loan.
For additional information, see Note 7 to our unaudited condensed consolidated financial statements included in this Quarterly Report on Form 10-Q.
Equity Distribution Agreement
On September 14, 2022, we entered into an Equity Distribution Agreement (the “Equity Distribution Agreement”) with Canaccord Genuity LLC, as sales agent (the “Agent”). In accordance with the terms of the Equity Distribution Agreement, we may offer and sell shares of our Class A common stock having an aggregate offering price of up to $85.0 million from time to time through the Agent pursuant to a registration statement on Form S-3, which became effective on September 26, 2022. In June 2023, we sold approximately 2.2 million shares of our Class A common stock through this arrangement, resulting in net proceeds of $7.9 million. As of June 30, 2025, approximately $76.8 million of shares were remaining, but had not yet been sold, under the Equity Distribution Agreement. Because of the late filings of our Quarterly Reports on Form 10-Q for the quarters ended June 30, 2024 and September 30, 2024 and this Quarterly Report on Form 10-Q, we are unable to make sales pursuant to the Equity Distribution Agreement until we regain our eligibility to use Form S-3.
Cash Flows
The following table summarizes our net cash used in operating activities, net cash provided by (used in) investing activities, and net cash (used in) provided by financing activities for the periods indicated:
Six Months Ended June 30,
(in thousands)
2025
2024
Net cash used in operating activities
$
(43,504
)
$
(13,239
)
Net cash provided by (used in) investing activities
$
145,323
$
(22,732
)
Net cash (used in) provided by financing activities
$
(76,223
)
$
28,407
Cash Flows from Operating Activities
Our largest source of operating cash inflows is cash collections from our customers. Our primary uses of cash from operating activities are for employee-related expenditures, expenses related to our technology infrastructure, expenses related to our computing infrastructure (including computing power, database storage and content delivery costs), building infrastructure costs (including leases for office space), fees for third-party services, and marketing program costs.
Net cash used in operating activities was $43.5 million for the six months ended June 30, 2025. The net cash used in operating activities reflected our net income of $96.1 million, adjustments for non-cash items of $141.5 million and a net decrease of $2.8 million in net operating assets. Non-cash items primarily consisted of a $154.3 million gain on sale of a business, a $23.7 million on cost on sale of a business, a $3.0 million change in fair value of warrant liabilities, and a $0.8 million change in fair value of contingent earnout liability, partially offset by a $12.0 million on loss on extinguishment of debt, $11.1 million of
50
stock-based compensation expense, $6.9 million of depreciation and amortization expense, a $6.3 million loss on decommissioned satellites and disposal of assets, $1.5 million of amortization of operating lease right-of-use assets, and $2.5 million of other, net. Changes in operating assets and liabilities included a $5.6 million decrease in accounts receivable, net primarily due to the sale of the maritime business, a $2.5 million increase in contract liabilities primarily due to the sale of the maritime business, a $2.7 million increase in accrued wages and benefits primarily due to bonus and severance accruals, and $2.2 million in other accrued expenses, partially offset by a $4.9 million decrease in accounts payable primarily driven by improved vendor payment timeliness, a $1.8 million increase in other current assets, a $1.3 million increase in contract assets, a $1.2 million decrease in operating lease liabilities, and a $1.0 million increase in other long-term assets.
Net cash used in operating activities was $13.2 million for the six months ended June 30, 2024. The net cash used in operating activities reflected our net loss of $42.1 million, adjustments for non-cash items of $30.9 million and a net increase of $2.0 million in net operating assets. Non-cash items primarily consisted of $12.5 million of depreciation and amortization expense, $8.4 million of stock-based compensation expense, $2.4 million of issuance of stock warrants expense, a $2.0 million change in fair value of warrant liabilities, $1.8 million of amortization of operating lease right-of-use assets, a $1.2 million change in fair value of contingent earnout liability, and a $0.9 million loss on decommissioned satellites and impairment of assets, partially offset by $1.7 million of other, net. Changes in operating assets and liabilities included a $6.2 million decrease in contract liabilities, a $2.7 million increase in accounts receivable, net, a $1.7 million decrease in operating lease liabilities, a $1.0 million decrease in accounts payable, and a $0.1 million decrease in accrued wages and benefits, partially offset by a $7.7 million decrease in other current assets, a $1.0 million decrease in other long-term assets, a $0.7 million decrease in contract assets and a $0.3 million increase in other accrued expenses.
Cash Flows from Investing Activities
Cash flows from investing activities primarily relate to cash used for business acquisitions, the procurement, development, and deployment of capital assets, including satellites and related launch costs, ground stations, machinery and equipment, furniture, computer equipment and software, and leasehold improvements.
The following table summarizes our net cash used in investing activities relating to capital expenditures by source of spend:
Three Months Ended June 30,
%
Six Months Ended June 30,
%
(dollars in thousands)
2025
2024
Change
2025
2024
Change
Spire platform / Infrastructure
$
452
$
1,229
(63
)%
$
2,266
$
1,838
23
%
Customer funded (Space Services)
3,154
4,297
(27
)%
10,241
10,747
(5
)%
Total CapEx
$
3,606
$
5,526
(35
)%
$
12,507
$
12,585
(1
)%
Net cash provided by investing activities was $145.3 million for the six months ended June 30, 2025. The net cash provided by investing activities was driven by proceeds from the sale of the maritime business, net of cash of $238.9 million, partially offset by purchases of short-term investments of $81.1 million, and purchases of property and equipment of $12.5 million.
Net cash used in investing activities was $22.7 million for the six months ended June 30, 2024. The net cash used in investing activities was driven by purchases of short-term investments of $30.1 million and purchases of property and equipment of $12.6 million, partially offset by maturities of short-term investments of $20.0 million.
Cash Flows from Financing Activities
Cash flows from financing activities relate primarily to proceeds from and payments on our long-term debt and proceeds from sales of our common stock and warrants.
Net cash used in financing activities was $76.2 million for the six months ended June 30, 2025. The net cash used in financing activities was driven by payments on long-term debt of $105.7 million and applicable premium, exit fees, legal and other fees of $9.1 million, partially offset by $37.3 million of proceeds from the 2025 Private Placement, proceeds from our employee stock purchase plan of $0.4 million, and proceeds from the exercise of stock options of $0.9 million.
Net cash provided by financing activities was $28.4 million for the six months ended June 30, 2024. The net cash provided by financing activities was driven by proceeds from the securities purchase agreements with Signal Ocean Ltd. and certain
51
institutional investors of $37.9 million, proceeds from our employee stock purchase plan of $0.4 million, and proceeds from exercise of stock options of $0.3 million, partially offset by payments on long-term debt of $10.1 million.
Critical Accounting Policies and Estimates
Our condensed consolidated financial statements are prepared in accordance with GAAP. In the preparation of these condensed consolidated financial statements, we are required to make certain estimates and assumptions that affect the reported amounts of assets, liabilities, revenue, costs and expenses and related disclosures. On an ongoing basis, we evaluate our estimates and assumptions. Our actual results may differ from these estimates under different assumptions or conditions.
There have been no material changes to our critical accounting policies and estimates as compared to those disclosed in Part II, Item 7, “Management’s Discussion and Analysis of Financial Condition and Results of Operations - Critical Accounting Policies and Estimates” in our 2024 Form 10-K/A.
Accounting Pronouncements Recently Adopted and Not Yet Adopted
See Note 2 to our unaudited condensed consolidated financial statements included in this Quarterly Report on Form 10-Q.
Emerging Growth Company and Smaller Reporting Company Status
We currently qualify as an “emerging growth company,” as defined in Section 2(a)(19) of the Securities Act of 1933, as amended, as modified by the Jumpstart our Business Startups Act, and a “smaller reporting company” as defined in Item 10(f)(1) of Regulation S-K. However, based on our fiscal year 2024 revenue, our non-affiliate float as of June 30, 2025 and the passage of five years since NavSight Holdings, Inc. completed its initial public offering, we will lose both statuses shortly. As a result, beginning with our Annual Report on Form 10-K for the year ending December 31, 2025 (the “2025 10-K”), we will no longer be an emerging growth company, and beginning with our Quarterly Report on Form 10-Q for the quarter ended March 31, 2026 (the “Q1 10-Q”), we will no longer be a smaller reporting company and will no longer be permitted to provide scaled disclosure beginning with our Q1 10-Q.
Item 3. Quantitative and Qualitative Disclosures about Market Risk
Foreign Currency Exchange Risk
Our results of operations and cash flows are subject to fluctuations due to changes in foreign currency exchange rates, particularly changes in the Euro, British Pound Sterling, Singapore Dollar, and Canadian Dollar, and may be adversely affected in the future due to changes in foreign currency exchange rates. We continue to experience foreign currency fluctuations primarily due to the periodic re-measurement of our foreign currency monetary account balances that are denominated in currencies other than the functional currency of the entities in which they are recorded. Changes in exchange rates may negatively affect our revenue and other results of operations as expressed in U.S. dollars. We do not currently engage in foreign exchange hedging contracts. As we continue to expand our international presence, we will assess options for mitigating foreign exchange risk.
We have experienced and will continue to experience fluctuations in our net income (loss) as a result of gains or losses related to revaluing certain asset and current liability balances that are denominated in currencies other than the functional currency of the entities in which they are recorded. We had gains of $7.0 million and $10.8 million for the three and six months ended June 30, 2025, respectively, and losses of $0.5 million and $2.3 million for the three and six months ended June 30, 2024, respectively. A hypothetical 10% strengthening or weakening of the U.S. Dollar relative to the currencies in which our revenue and expenses are denominated would have resulted in an increase or decrease in our pre-tax income of approximately $1.9 million for the six months ended June 30, 2025.
52
Interest Rate Sensitivity
As of June 30, 2025, we had no outstanding debt and held only short-term marketable securities with minimal interest rate sensitivity. We do not consider our market risk exposures to be material.
Inflation Risk
We are exposed to inflation risk. Inflationary factors, such as increases in component parts, labor and other overhead expenses, could impair our operating results. Although there has been an increase in inflation in recent periods, it has not had a substantial impact on our results of operations for the three and six months ended June 30, 2025 or 2024. However, a higher rate of inflation in the future may have a negative impact on our operational and capital expenditures, which we may not be able to pass along as cost increases to our customers.
Item 4. Controls and Procedures
Evaluation of Disclosure Controls and Procedures
Disclosure controls and procedures are controls and other procedures that are designed to ensure that information required to be disclosed in our reports filed or submitted under the Securities Exchange Act of 1934, as amended (“Exchange Act”), is recorded, processed, summarized, and reported within the time periods specified in the SEC’s rules and forms. Disclosure controls and procedures include, without limitation, controls and procedures designed to ensure that information required to be disclosed in company reports filed or submitted under the Exchange Act is accumulated and communicated to management, including our principal executive officer and principal financial officer, to allow timely decisions regarding required disclosure.
We performed an evaluation under the supervision and with the participation of management, including our principal executive officer and principal financial officer, of the effectiveness of our disclosure controls and procedures (as such term is defined in Rules 13a-15(e) and 15d-15(e) under the Exchange Act) as of June 30, 2025. Based upon that evaluation, our principal executive officer and principal financial officer concluded that our disclosure controls and procedures were not effective as of June 30, 2025 because of a material weakness in our disclosure controls and procedures and the material weaknesses in internal control over financial reporting described below. Specifically, we did not design and maintain effective policies and procedures related to the communication between the finance and accounting teams regarding the status of the review and approval of documents to be filed with the SEC.
Notwithstanding the material weaknesses described below, our management has concluded that our condensed consolidated financial statements for the periods covered by and included in this Quarterly Report are prepared in accordance with accounting principles generally accepted in the United States (“GAAP”) and fairly present, in all material respects, our financial position, results of operations and cash flows for each of the periods presented herein.
Material Weaknesses in Internal Control over Financial Reporting
We have identified material weaknesses in our internal control over financial reporting. A material weakness is a deficiency, or a combination of deficiencies, in internal control over financial reporting such that there is a reasonable possibility that a material misstatement of our annual or interim financial statements will not be prevented or detected on a timely basis. The following material weaknesses were identified:
i.
We did not design and maintain an effective control environment commensurate with the financial reporting requirements of a public company. Specifically, we lacked a sufficient number of professionals with an appropriate level of internal controls and accounting knowledge, training, and experience to appropriately analyze, record and disclose accounting matters timely and accurately. Additionally, the lack of a sufficient number of professionals resulted in an inability to consistently establish appropriate authorities and responsibilities in pursuit of our financial reporting objectives, as demonstrated by, among other things, insufficient segregation of duties in our finance and accounting functions. This material weakness contributed to the following additional material weaknesses.
53
ii.
We did not design and maintain an effective risk assessment process at a precise enough level to identify new and evolving risks of material misstatement in our financial statements. Specifically, changes to existing controls or the implementation of new controls have not been sufficient to respond to changes to the risks of material misstatement in the financial statements.
iii.
We did not design and maintain effective controls over the segregation of duties related to journal entries and account reconciliations. Specifically, certain personnel have the ability to both (a) create and post journal entries within our general ledger system, and (b) prepare and review account reconciliations.
The material weaknesses above resulted in certain audit adjustments, which were recorded prior to the issuance of the consolidated financial statements as of and for the year ended December 31, 2020 and as of and for the three months ended June 30, 2025.
iv.
We did not design and maintain effective controls over the accounting for our Space Services and R&D Services solutions contracts with customers. Specifically, we did not design and maintain effective controls over the identification of and allocation of transaction price and costs to performance obligations to ensure revenue is recognized at the time performance obligations are satisfied, the identification and accounting for embedded leases, the classification and accounting for costs incurred in connection with performing services, the recognition of allowances for current expected credit losses, and the identification and accounting for uninstalled materials. This material weakness resulted in (a) the restatement of our previously filed consolidated financial statements as of and for the fiscal years ended December 31, 2023 and December 31, 2022, our unaudited condensed consolidated financial statements as of the quarter ends and for the interim periods in the fiscal years ended December 31, 2023 and 2022, and our unaudited condensed consolidated financial statements as of and for the quarter ended March 31, 2024, and (b) immaterial audit adjustments to revenue and contract liabilities, current portion as of and for the three months ended June 30, 2025.
v.
We did not design and maintain effective controls related to the identification of and accounting for certain non-routine, unusual or complex transactions, including the proper application of GAAP to such transactions. Specifically, we did not design and maintain:
a.
controls to timely identify and account for warrant instruments, which resulted in the restatement of the previously issued financial statements of NavSight related to adjustments to warrant liabilities and equity as of and for the year ended December 31, 2020;
b.
controls to account for business combinations, including the associated valuation estimates and the completeness and accuracy of the opening balance sheet, which did not result in a misstatement to our consolidated financial statements;
c.
controls to timely identify and account for the fair value of the contingent earnout liability, which resulted in an error in the fair value of the contingent earnout liability in, and the restatement of, our previously issued unaudited condensed consolidated financial statements as of and for each of the interim periods ended September 30, 2021, March 31, 2022 and June 30, 2022 and our consolidated financial statements as of and for the year ended December 31, 2021; and
d.
controls to appropriately identify and account for participating securities under the two-class method of determining and presenting net earnings (loss) per share, which resulted in a material audit adjustment to basic and diluted earnings (loss) per share for three months ended June 30, 2025.
Additionally, each of the material weaknesses described above could result in a misstatement of substantially all of our accounts or disclosures that would result in a material misstatement to the annual or interim consolidated financial statements that would not be prevented or detected.
Remediation Efforts on Material Weaknesses in Internal Control over Financial Reporting
In response to the material weaknesses identified, we have implemented several changes to our internal control over financial reporting and will continue performing remedial actions in 2025, as described below.
54
The remediation and ultimate resolution of each of the material weaknesses will be reviewed with the Audit Committee of the Company’s Board of Directors.
We have made progress to address the material weaknesses related to the control environment, as described below:
Key Professionals
In fiscal 2022 and 2023 and continuing to date, we identified and hired a number of professionals with appropriate levels of internal controls and accounting knowledge to improve the overall domestic and international financial accounting and reporting departments. The positions hired include chief accounting officer, director of accounting and Americas controller, director of technical accounting, accounting manager, internal auditor and SOX compliance manager, senior and staff accountants, and senior financial systems manager. In addition, we engaged with external consultants and experts to provide technical accounting and financial systems services. The Company continues to monitor personnel requirements and expertise needed to have an effective control environment, including providing necessary ongoing training to its finance and accounting personnel.
Risk Assessment
We engaged a third-party consulting firm to assist in designing and implementing a risk assessment process to identify and evaluate changes in the Company’s business and the impact on its internal controls. During fiscal 2023, we conducted a financial risk assessment to identify key business processes and establish internal materiality thresholds. We performed walkthroughs of all key processes, identified key controls, and developed narratives describing risk points, processes, and corresponding controls. A Risk and Control Matrix (“RCM”) was created to serve as the basis for a testing program. During the first six months of fiscal year 2025, we updated our process narratives to reflect improvements we have made to our processes, tested the design of key controls, implemented remediation actions for deficiencies noted during our tests of design, and began our testing of effectiveness of internal controls. We continue to utilize the expertise of a third-party consulting firm, although we expect to place greater reliance on our internal resources as our organization matures.
We engaged a third-party consulting firm to complete an initial Enterprise Risk Assessment (“ERA”). During fiscal 2023, with the assistance of the consulting firm, we identified key risks for technology-based organizations and interviewed management team members and the Chair of the Audit Committee to discuss key risk areas. We reviewed responses received, compiled a list of identified risks, and developed heat maps to depict the likelihood, impact, and preparedness of the Company to respond to the identified risks. Action and testing plans were developed to address the risks. During the three months ended June 30, 2024, we began our annual ERA following the same process implemented during fiscal 2023. We have completed our interviews of management team members, identified and discussed the various risks faced by our business, prioritized five key risks that will be management’s focus, and assigned executive leaders to develop a mitigation response for each key risk.
Segregation of Duties
During fiscal year 2022, we completed our initial assessment on segregation of duties with assistance from a third-party consulting firm and our analysis across all processes and locations, including establishing appropriate authorities and responsibilities. During 2022, we designed controls over the segregation of duties related to journal entries and account reconciliations, by designing automated controls that prevent the same person from creating and posting journal entries in our general ledger system. With the hiring of additional personnel including a senior financial system manager in late 2022, and an accounts receivable specialist and a senior accountant in 2023, we were able to implement additional controls to segregate the preparation and review of account reconciliations during fiscal year 2023. During the first three months of fiscal year 2024, we hired another senior accountant and have implemented accounting software to automate the segregation between the preparation and review of account reconciliations. Additionally, we have reviewed segregation of duties within our key accounting processes and developed a plan to remediate segregation of duties issues.
We expect to remediate the material weakness after we complete our testing of design, implementation, and operating effectiveness of internal controls.
55
Non-routine, Unusual or Complex Transactions
Over the course of 2022, we hired key accounting personnel and engaged with third-party technical accounting experts to improve our controls related to the identification of and proper application of GAAP accounting for non-routine, unusual, or complex transactions. Since the Merger that occurred in August 2021, warrant instruments have been accounted for in accordance with our accounting policies based on GAAP. During the fourth quarter of 2022, we trained our accounting team and designed new controls to identify and account for the fair value of the contingent earnout liability, and hired a third-party technical accounting firm to assist with the proper application of GAAP for non-routine, unusual, or complex transactions, including any business combinations that may arise in the future. With the addition of the director of technical accounting in fiscal year 2023 and the addition of a chief accounting officer in fiscal year 2024, we have placed greater reliance on our internal resources to address non-routine, unusual, or complex transactions. For the six months ended June 30, 2025, we continued to rely on the expertise of third-party valuation consultants to assist with estimating the fair value of our contingent earnout liability. We will consider engaging third-party accounting consultants for non-routine, unusual or complex transactions in the future to augment our internal resources if the circumstances warrant it.
We continue to design and implement controls related to non-routine, unusual or complex transactions and are in the process of testing the operating effectiveness of some of those controls. We expect to remediate this material weakness once controls have been fully designed, implemented, and tested, and our policy for business combinations has been finalized.
Space Services and R&D Services Contracts
We are implementing measures designed to improve our internal control over financial reporting to remediate the material weakness over the accounting for our Space Services and R&D Services contracts with customers. In our remediation plan, we are including enhanced training, updating our revenue recognition procedures and engaging external experts to assist with complex revenue contract arrangements.
While the above actions and planned actions are subject to ongoing management evaluation and will require validation and testing of the design and operating effectiveness of internal controls over a sustained period, we are committed to continuous improvement and will continue to diligently review our internal control over financial reporting. The material weaknesses will not be considered remediated until management completes the design and implementation of the measures described above, until the controls operate for a sufficient period of time, and until management has concluded, through testing, that the controls are effective.
Limitations on Effectiveness of Controls and Procedures
Our management, including our principal executive officer and principal financial officer, do not expect that our disclosure controls and procedures or our internal control over financial reporting will prevent all errors and all fraud. A control system, no matter how well designed and operated, can provide only reasonable, not absolute, assurance that the objectives of the control system are met. Further, the design of a control system must reflect the fact that there are resource constraints, and the benefits of controls must be considered relative to their costs. Because of the inherent limitations in all control systems, no evaluation of controls can provide absolute assurance that all control issues and instances of fraud, if any, have been detected. These inherent limitations include the realities that judgments in decision-making can be faulty, and that breakdowns can occur because of a simple error or mistake. Additionally, controls can be circumvented by the individual acts of some persons, by collusion of two or more people, or by management override of the controls. The design of any system of controls is also based in part upon certain assumptions about the likelihood of future events, and there can be no assurance that any design will succeed in achieving its stated goals under all potential future conditions; over time, controls may become inadequate because of changes in conditions, or the degree of compliance with policies or procedures may deteriorate. Due to inherent limitations in a cost-effective control system, misstatements due to error or fraud may occur and not be detected.
Changes in Internal Control over Financial Reporting
There have been no changes (other than those described above) in our internal control over financial reporting during the three months ended June 30, 2025 that have materially affected, or are reasonably likely to materially affect, our internal control over financial reporting.
56
PART II—OTHER INFORMATION
Item 1. Legal Proceedings.
From time to time, we are involved in various legal proceedings arising from the normal course of business activities.
Stockholder Litigation
On August 20, 2024, we and two of our executive officers were named as defendants in a purported federal securities law class action filed in the United States District Court for the Eastern District of Virginia, captioned Michal Bousso v. Spire Global, Inc. et al., Court File No. 1:24-cv-1458 (the “Bousso Lawsuit”). On October 14, 2024, a second plaintiff filed a similar lawsuit against us and three current or former executive officers, also in the United States District Court for the Eastern District of Virginia, captioned Kohei Tagawa v. Spire Global, Inc. et al., Court File No. 1:24-cv-1810 (the “Tagawa Lawsuit”). On November 22, 2024, the court consolidated the Bousso Lawsuit and the Tagawa Lawsuit, appointed Michal Bousso as lead plaintiff, and renamed the case to “In re Spire Global, Inc. Securities Litigation,” Master File No. 1:24-cv-1458-MSN-WEF (the “Master Securities Lawsuit”). On December 23, 2024, the plaintiff filed an amended complaint in the Master Securities Lawsuit, which alleges violations of Sections 10(b) and 20(a) of the Exchange Act (and Rule 10b-5 thereunder), arising from or relating to our announcements in August 2024 that certain of our previously issued audited and unaudited financial statements should not be relied upon. Plaintiff alleged that we and the individual defendants made false or misleading statements relating to (1) how revenue was recognized for pre-space services for certain space contracts, and (2) how costs for certain contracts were characterized. The plaintiff sought to represent a class of shareholders who purchased or otherwise acquired our Class A common stock between May 11, 2022 and August 14, 2024. The plaintiff sought damages and other relief, including attorneys’ fees and costs. On January 22, 2025, the defendants moved to dismiss the amended complaint in its entirety. The court in the Master Securities Lawsuit held argument on our motion to dismiss on March 14, 2025. After hearing argument from both sides, the court issued its order on the record dismissing the Master Securities Lawsuit without prejudice. The court granted the plaintiff 30 days to consider whether to amend, which deadline expired on April 13, 2025. The plaintiff did not file any amended complaint or any other paper after the court’s March 14, 2025 dismissal order.
On September 5, 2024, a stockholder derivative lawsuit was filed in the United States District Court for the Eastern District of Virginia, purportedly on behalf of us against certain of our officers and directors and us (as a nominal defendant), captioned Lawrence Hollin v. Platzer et al., Court File No. 1:24-cv-01558 (the “Hollin Lawsuit”). On September 10, 2024, a second stockholder derivative lawsuit was filed in the United States District Court for the Eastern District of Virginia, also purportedly on behalf of us against certain of our officers and directors and us (as a nominal defendant), captioned Richard Cobb v. Platzer et al., Court File No. 1:24-cv-01596 (the “Cobb Lawsuit”). On November 12, 2024, a third stockholder derivative lawsuit was filed in the United States District Court for the Eastern District of Virginia, also purportedly on behalf of us against certain of our officers and directors and us (as a nominal defendant) captioned L. Robert Oros v. Platzer et al., 1:24-cv-02020 (the “Oros Lawsuit”). On November 14, 2024, the Court consolidated the Hollin Lawsuit and the Cobb Lawsuit and renamed the case to In re Spire Global, Inc. Stockholder Derivative Litigation, No. 1:24-cv-01596 (the “Master Derivative Case”). On December 2, 2024, the Court consolidated the Oros Lawsuit into the Master Derivative Case. The lawsuits in the Master Derivative Case arise out of the same subject matter as the Master Securities Lawsuit, and they allege some or all of the following claims: (1) breach of fiduciary duty; (2) gross mismanagement; (3) waste of corporate assets; (4) unjust enrichment; (5) as against the director defendants, violations of Section 14(a) of the Exchange Act and Rule 14a-9 promulgated thereunder; (6) as against the officer defendants, contribution under Sections 10(b) and 21D of the Exchange Act; and (7) aiding and abetting. Each of the lawsuits in the Master Derivative Case seeks damages and other relief, including attorneys’ fees and costs. Following the dismissal of the Master Securities Lawsuit, on April 24, 2025, each of the parties to the Master Derivative Case agreed, and filed, a stipulation for voluntary dismissal of the Master Derivative Case.
Share Purchase Agreement Litigation
As previously disclosed, on November 13, 2024, we entered into a Share Purchase Agreement (the “Purchase Agreement”) with Kpler Holding SA, a Belgian corporation (“Buyer”), pursuant to which we agreed to sell our maritime business to Buyer and enter into certain ancillary agreements (the “Transactions”). The maritime business sold pursuant to the Transactions did not include any part of our satellite network or operations. The purchase price agreed to be paid by Buyer to us at the closing of the
57
Transactions was a cash payment based upon an enterprise value of $233.5 million, subject to certain adjustments. The Transactions also included a twelve-month transition service and data provision agreement for $7.5 million.
On February 10, 2025, we filed a complaint in the Delaware Court of Chancery against Buyer seeking a grant of specific performance ordering Buyer to satisfy its obligations under the Purchase Agreement and consummate the closing in accordance with the terms of the Purchase Agreement. In the complaint, we also requested a declaratory judgment declaring that Buyer has breached its obligations under the Purchase Agreement and is not excused from performing its obligations under the Purchase Agreement, including proceeding with the closing.
Buyer removed the matter to the District of Delaware, pursuant to a contract term in the Purchase Agreement promising not to contest removal to that court. The District of Delaware initially selected a March 4, 2025 trial date, but on February 26, 2025, the court set a trial date of May 28-30, 2025.
On April 6, 2025, we and Buyer reached an agreement to resolve the foregoing litigation and mutually release claims if closing in accordance with the terms of the Purchase Agreement occurred by April 25, 2025. On April 25, 2025, we dismissed the foregoing litigation following the completion of the Transactions.
We are not currently a party to any legal proceedings that, if determined adversely to us, would, in our opinion, have a material adverse effect on our business, results of operations, financial condition, or cash flows. Future litigation may be necessary to defend ourselves, our partners, and our customers by determining the scope, enforceability, and validity of third-party proprietary rights, or to establish our proprietary rights. The results of any current or future litigation cannot be predicted with certainty, and regardless of the outcome, litigation can have an adverse impact on us because of defense and settlement costs, diversion of management resources, and other factors.
SEC Investigation
In July 2025, we received a subpoena from the SEC seeking records relating to, among other matters, (i) the restatement of our consolidated financial statements as of and for the fiscal years ended December 31, 2023 and December 31, 2022, the unaudited condensed consolidated financial information as of the quarter ends and for the interim periods in the fiscal years ended December 31, 2023 and 2022, and the unaudited condensed consolidated financial statements as of and for the quarter ended March 31, 2024; (ii) our historical accounting policies and practices; (iii) our internal control over financing reporting, disclosure controls and procedures, and material weaknesses therein; and (iv) the premature filing of our Annual Report on Form 10-K for the year ended December 31, 2024. We are in the process of producing records responsive to the subpoena and intend to continue cooperating with the SEC’s investigation; however, we cannot predict the ultimate outcome or timing of the investigation.
Item 1A. Risk Factors.
Our operations and financial results are subject to various risks and uncertainties. You should carefully consider the factors described in Part I, Item 1A, “Risk Factors” in the 2024 Form 10-K/A, and as described below, which could adversely affect our business, financial condition, results of operations, cash flows, and the trading price of our stock. Except as set forth below, there have been no material changes to our risk factors included in our 2024 Form 10-K/A. Our business, financial condition, results of operations, or prospects could also be harmed by risks and uncertainties not currently known to us or that we currently do not believe are material.
58
Our marketable securities portfolio is subject to credit, liquidity, market, and interest rate risks that could cause its value to decline significantly and materially adversely affect our business, financial condition, results of operations, and prospects.
We maintain a portfolio of marketable securities that was valued at $81.5 million as of June 30, 2025. The investments in our portfolio are subject to credit, liquidity, market-price, and interest-rate risks that could materially and adversely affect our business, financial condition, results of operations, and prospects. Under our corporate investment policy, we seek to preserve principal, maintain liquidity, avoid excessive credit concentrations, and capture a market rate of return. However, the portfolio’s value may decline due to changes in interest rates, instability in the global financial markets that reduces the liquidity of securities in our portfolio, and other factors, including unexpected or unprecedented global or domestic events. Even with diversification and ongoing risk-profile monitoring, we could experience significant losses or reduced liquidity. If we increase our holdings in these securities, our exposure to such risks would grow, potentially exacerbating any adverse impact.
Significant political, trade, regulatory developments, and other circumstances beyond our control, including as a result of recently announced tariffs, could have a material adverse effect on our financial condition or results of operations.
We operate globally and sell our products in countries throughout the world. Significant political, trade, or regulatory developments in the jurisdictions in which we sell our products, such as those stemming from the change in the U.S. federal administration, are difficult to predict and may have a material adverse effect on us. Similarly, changes in U.S. federal policy that affect the geopolitical landscape could give rise to circumstances outside our control that could have negative impacts on our business operations. For example, in April 2025, the United States imposed broad tariffs on imports from virtually all countries, with particularly high tariffs on imports from China. Since this announcement, the U.S. has suspended and reimposed tariffs on a number of different countries and products. In addition, the U.S. has announced a series of trade agreements with a few countries and is reported to be in negotiations with a number of other countries. In response to tariffs, some countries have implemented retaliatory tariffs on U.S. goods, while others seek to negotiate agreements regarding U.S.-imposed tariffs. Historically, tariffs have led to increased trade and political tensions and, to date, the outcome of the negotiations between the United States and most countries is not yet clear. Political tensions as a result of trade policies could reduce trade volume, investment, technological exchange and other economic activities between major international economies, resulting in a material adverse effect on global economic conditions and the stability of global financial markets. Any changes in political, trade, regulatory, and economic conditions, including U.S. trade policies and any further increases in existing tariff rates, could have a material adverse effect on our financial condition or results of operations.
Our independent registered public accounting firm recently resigned, which could adversely affect our financial reporting and investor confidence.
On July 15, 2025, our independent registered public accounting firm, PricewaterhouseCoopers LLP, notified us of its resignation as our independent registered public accounting firm. The resignation became effective upon the filing of this Quarterly Report on Form 10-Q with the SEC. For additional information see the Company’s Current Report on Form 8-K filed on July 21, 2025. An independent auditor's resignation may negatively affect investor and market confidence in our financial reporting and our internal control environment.
As of the date of this Quarterly Report on Form 10-Q, we have engaged KPMG LLP as our new independent registered public accounting firm. However, KPMG LLP’s engagement at this point in the year may delay the filing of future periodic reports with the SEC, including our Quarterly Report on Form 10-Q for the quarter ended September 30, 2025, and our Annual Report on Form 10-K for the year ended December 31, 2025.
59
Item 2. Unregistered Sales of Equity Securities and Use of Proceeds
None.
Item 3. Defaults Upon Senior Securities
Not applicable.
Item 4. Mine Safety Disclosures
Not applicable.
Item 5. Other Information
During the three months ended June 30, 2025, none of our directors or officers (as defined in Rule 16a-1(f) of the Exchange Act) adopted or terminated any contract, instruction or written plan for the purchase or sale of our securities that was intended to satisfy the affirmative defense conditions of Rule 10b5-1(c) of the Exchange Act or any non-Rule 10b5-1 trading arrangement (as defined in the SEC’s rules).
Item 6. Exhibits
The exhibits listed below are filed as part of this Quarterly Report on Form 10-Q, or are incorporated herein by reference, in each case as indicated below.
Exhibit Number
Incorporated by Reference
Description
Form
File No.
Exhibit
Filing Date
2.1
Share Purchase Agreement, dated November 13, 2024, between Kpler Holding SA and Spire Global, Inc.
Inline XBRL Instance Document - the instance document does not appear in the Interactive Data File because XBRL tags are embedded within the Inline XBRL document.
101.SCH
Inline XBRL Taxonomy Extension Schema With Embedded Linkbase Documents.
104
The cover page from the Company’s Quarterly Report on Form 10-Q for the quarter ended June 30, 2025 has been formatted in Inline XBRL
* The certifications attached as Exhibit 32.1 that accompany this Quarterly Report on Form 10-Q are deemed furnished and not filed with the Securities and Exchange Commission and are not to be incorporated by reference into any filing of Spire Global,
60
Inc. under the Securities Act of 1933, as amended, or the Securities Exchange Act of 1934, as amended, whether made before or after the date of this Quarterly Report on Form 10-Q, irrespective of any general incorporation language contained in such filing.
SIGNATURES
Pursuant to the requirements of the Securities Exchange Act of 1934, the registrant has duly caused this report to be signed on its behalf by the undersigned thereunto duly authorized.
SPIRE GLOBAL, INC.
Date: November 3, 2025
By:
/s/ Theresa Condor
Theresa Condor
President, Chief Executive Officer and Director
(Duly Authorized Officer and Principal Executive Officer)