Please wait
| | | | | |
| |
|
|
SHAREHOLDER LETTER Q3 2025 |
|
| |
| |
| | | | | | | | | | | |
| Q3 | |
| (in millions, except percentages) | 2024 | 2025 | YoY Change |
| | | |
| Revenue | $259.1 | $306.5 | 18% |
Transaction Value 1 | $451.8 | $589.3 | 30% |
| | | | |
| | | | |
| Gross Profit | $39.2 | $43.4 | 11% |
Contribution 1 | $41.5 | $45.6 | 10% |
| | | |
| | | | |
Net Income | $11.9 | $17.6 | 48% |
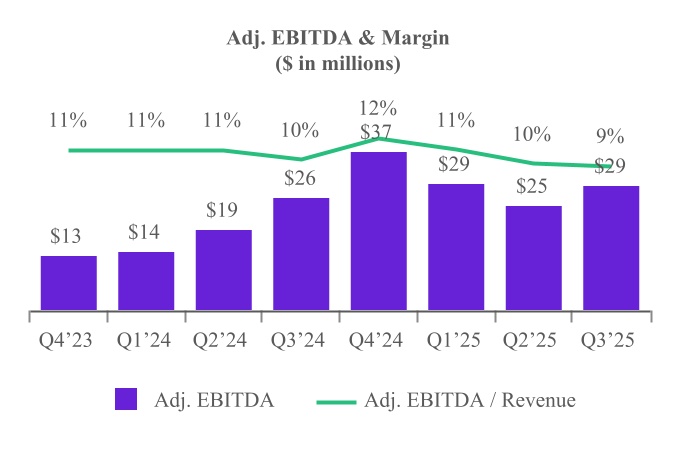
Adjusted EBITDA 1 | $26.3 | $29.1 | 11% |
| | | |
| | | |
1.See “Key Business and Operating Metrics and Non-GAAP Financial Measures” for additional information regarding non-GAAP metrics and operating metrics used in this shareholder letter.
MediaAlpha is the strongest it has ever been. With the personal auto market becoming increasingly competitive, our core mission—connecting insurance carriers with high-intent consumers through our leading technology platform—has never been more relevant. We operate at the center of a massive and growing opportunity: the digital transformation of insurance distribution. In 2024, auto insurance premiums were $432 billion, or 3% of total consumer spending. Industry advertising spend was $12 billion, of which more than two-thirds remained offline, demonstrating the vast opportunity ahead of us as we help drive the industry's digital transformation. As this seismic shift continues, our scale, data advantages, and deep carrier relationships uniquely position us to capture and compound that growth. Today, we are in the early stages of a soft market cycle in auto insurance—a period when carriers compete more aggressively for policy growth and invest heavily in customer acquisition. With our technology, insights, and scale, we are poised to benefit disproportionately from both the near-term recovery in the auto insurance advertising market and the long-term secular migration of insurance shopping to digital channels.
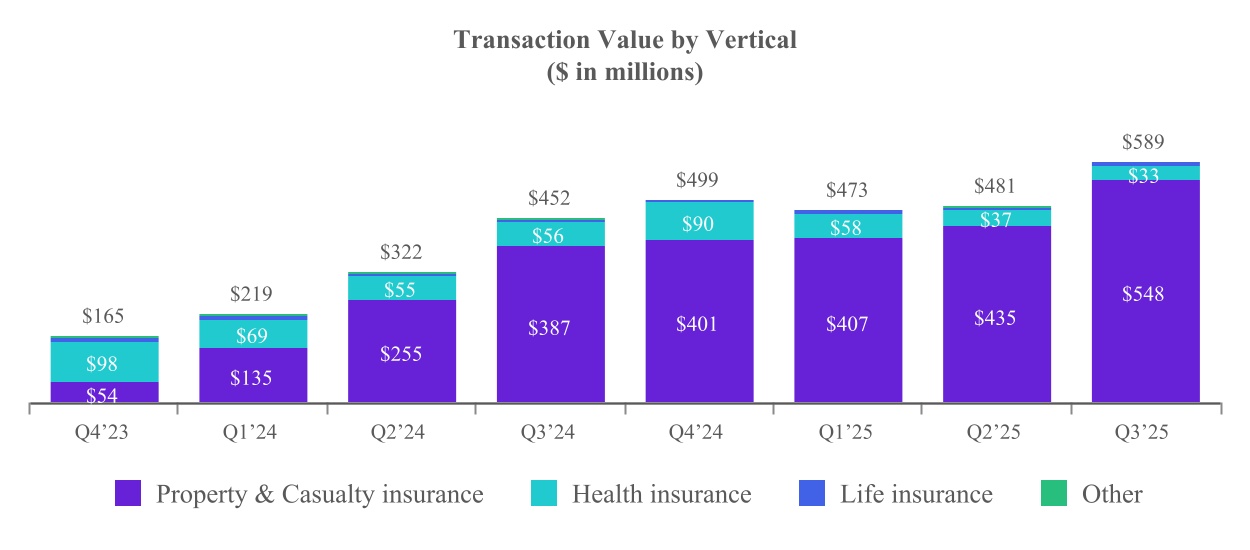
We delivered record third quarter results that exceeded the high end of our guidance across all key financial metrics as continued strength in our Property & Casualty (P&C) insurance vertical more than offset expected declines in our under-65 Health insurance business. Transaction Value grew 30% year over year to a record $589.3 million, while Adjusted EBITDA grew 11% year over year to $29.1 million. Excluding the impact of a lower baseline in our under-65 Health business, year-over-year Transaction Value and Adjusted EBITDA growth were 38% and 31%, respectively1.
Our P&C insurance vertical, which represented 93% of total Transaction Value, continues to demonstrate strong momentum. Transaction Value increased 41% year over year to $548.2 million, driven primarily by increased investment by our largest carrier partners. With underwriting profitability restored, competition is increasing in the personal auto market and more carriers are investing in advertising to drive policy growth. However, despite a broadening of demand, most carriers are still investing well below their full potential. Notably, five of the ten largest P&C carriers spent less in total on advertising in 2024 than in 2019, even as auto industry direct written premiums grew 44% over the same period. We have seen this trend result in a top-heavy mix of carrier spend relative to historical levels, increasing our Private Marketplace mix. We believe this trend is temporary and continue to expect our carrier mix to normalize as more carriers ramp up spend, with a positive effect on our profitability. We believe there continues to be substantial runway for growth in our P&C vertical moving forward, driven by strong carrier profitability, intensifying market share competition, and the ongoing secular shift to digital direct-to-consumer distribution channels.
Our Health insurance vertical, which represented 6% of total Transaction Value, performed in line with our expectations. Transaction Value decreased 40% year over year to $33.5 million, driven primarily by an expected decline in under-65 health, which is stabilizing at a lower baseline. The fourth quarter is our seasonally strongest quarter in this vertical due to the timing of annual enrollment periods. However, the impact of this on our overall results will not be as meaningful as it has been in past years.
We expect Contribution in the under-65 health sub-vertical to be $1 million to $2 million in the fourth quarter, representing a year-over-year decline of 80% to 90%. The good news is that the business appears
1 Year-over-year growth figures exclude under-65 Health Transaction Value and Contribution, respectively. The Transaction Value and Contribution from under-65 Health are shown on pages 5 and 7, respectively.
to have stabilized and the year-over-year comparisons will improve in the back half of 2026. In 2026, we expect our under-65 health sub-vertical to represent a low single digit percentage of our total Contribution.
Our balance sheet remains strong, and we continue to generate strong free cash flow. Our net debt-to-Adjusted EBITDA ratio was below 1.0x and we had cash of $38.8 million (plus restricted cash2 of $33.5 million) at the end of the third quarter. We generated $23.6 million of free cash flow3, representing 81% of Adjusted EBITDA, driven by our capital-efficient operating model.
Given our confidence in our strategy and long-term growth opportunities, we believe our stock is an attractive investment and share buybacks are an accretive use of excess cash, particularly at current price levels. In September, we repurchased the remaining shares owned by Insignia Capital (approximately 5% of our outstanding shares) for $32.9 million (at $10.17 per share). Additionally, today we announced a program to repurchase up to $50 million of our Class A common stock. Details regarding the new repurchase program are available in our press release and Form 8-K filed today.
Looking ahead, we expect to continue to deliver strong growth as auto insurance industry marketing spend increases from current levels. We believe the auto insurance industry is in the early stages of a soft market, a period when strong carrier profitability and manageable loss trends lead carriers to compete more aggressively for policy growth. During these cycles, which typically last several years or more, elevated competition for new policy holders drives increased customer acquisition investments, even as carriers’ profit margins tighten over time. Our industry-leading scale, along with our advanced data analytics and optimization capabilities, make us the most efficient and effective platform for carriers to deploy their advertising dollars, positioning us to grow faster than overall carrier marketing spend due to continued competitive gains and our position in a high-growth, direct-to-consumer segment of the market.
2 Represents the portion of the FTC settlement paid in the fourth quarter of 2025; the remaining $11.5 million will be paid in the first quarter of 2026.
3 Free cash flow is the Company's Q3 2025 cash flow from operating activities of $23.6 million, less capital expenditures of $0.1 million.
| | |
| Financial Discussion - Transaction Value and Revenue Metrics |
Transaction Value increased 30% year over year to $589.3 million in Q3 2025, driven primarily by a 41% increase in the P&C insurance vertical. Transaction Value represents the total gross investment in customer acquisition executed by our partners on our platform, and is one of the key metrics that reflects our ability to drive value for our partners and increase our share of wallet as budgets increasingly migrate online.
Transaction Value from our P&C insurance vertical increased 41% year over year to $548.2 million, driven by significant year-over-year increases in marketing budgets and customer acquisition spending by our Demand Partners as well as new Supply Partner wins.
Transaction Value from our Health insurance vertical declined 40% year over year to $33.5 million, driven by declines in both under-65 health and Medicare, due to lower spend from advertisers resulting from industry-wide high medical loss ratios. Transaction Value from the under-65 component of our Health vertical over the past seven quarters is noted below.
| | | | | | | | | | | | | | | | | | | | | | | |
| ($ in millions) | Q1’24 | Q2’24 | Q3’24 | Q4’24 | Q1’25 | Q2’25 | Q3’25 |
| Total Transaction Value | $219 | $322 | $452 | $499 | $473 | $481 | $589 |
| Under-65 Transaction Value | $45 | $39 | $39 | $56 | $36 | $23 | $19 |
| Under-65 % of Total | 20% | 12% | 9% | 11% | 8% | 5% | 3% |
Transaction Value from our Life insurance vertical increased 17% year over year to $7.3 million, driven by higher customer acquisition spending from our Demand Partners.
Transaction Value from our Other vertical, which includes travel and consumer finance, declined 89% year over year to $0.3 million. Travel has been fully wound down as of the end of the second quarter.
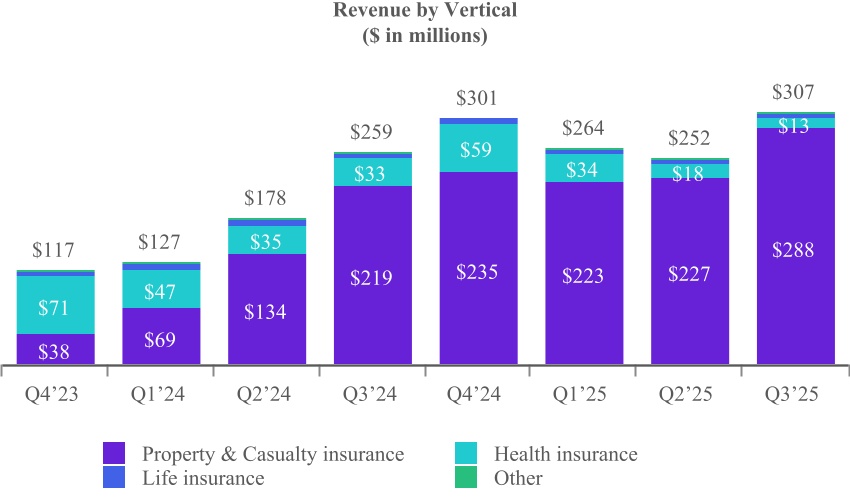
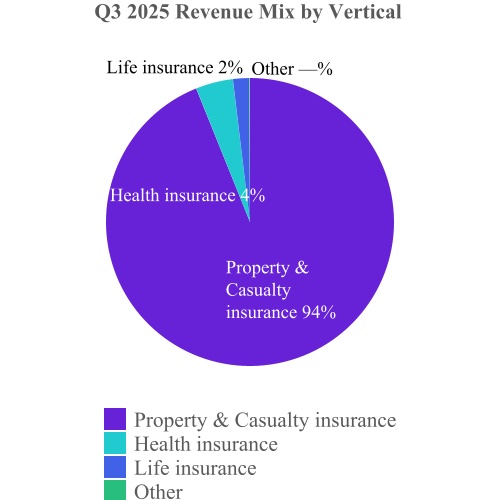
We generated $306.5 million of total revenue in Q3 2025, up 18% year over year, driven primarily by higher revenue from our P&C insurance vertical.
Revenue from our P&C insurance vertical increased 31% year over year to $287.8 million in Q3 2025, driven largely by the increase in Transaction Value.
Revenue from our Health insurance vertical declined 61% year over year to $12.9 million in Q3 2025. Health revenue declined more than Transaction Value due to a higher mix of transactions from our Private Marketplace. Under-65 health has typically had a lower mix of Private Marketplace transactions than Medicare, and is now a meaningfully smaller percentage of the total Health vertical.
Revenue from our Life insurance vertical increased 7% year over year to $5.6 million in Q3 2025, driven by higher customer acquisition spending by our Demand Partners.
Revenue from our Other vertical, which consists of travel and consumer finance, declined 87% year over year to $0.3 million in Q3 2025.
| | |
Financial Discussion - Profitability |
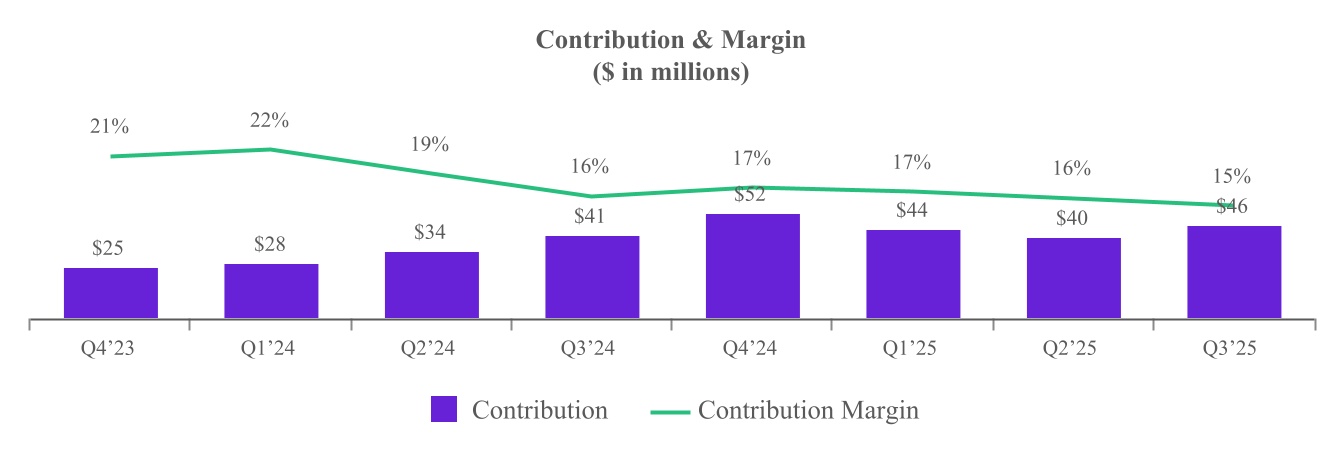
Gross profit was $43.4 million in Q3 2025, a year-over-year increase of 11%. Contribution, which generally represents revenue less revenue share payments and online advertising costs, was $45.6 million in Q3 2025, a year-over-year increase of 10%. The year-over-year increases in gross profit and Contribution were driven primarily by the higher revenue, offset in part by lower take rates due to reductions in Transaction Value from our Health vertical and a higher mix of Private Marketplace transactions within our P&C vertical. Contribution Margin was 14.9% in Q3 2025, compared with 16.0% in Q3 2024. Contribution from the under-65 component of our Health vertical over the past seven quarters is noted below.
| | | | | | | | | | | | | | | | | | | | | | | |
| ($ in millions) | Q1’24 | Q2’24 | Q3’24 | Q4’24 | Q1’25 | Q2’25 | Q3’25 |
| Total Contribution | $28 | $34 | $41 | $52 | $44 | $40 | $46 |
| Under-65 Contribution | $8 | $6 | $5 | $10 | $6 | $2 | $1 |
| Under-65 % of Total | 29% | 19% | 13% | 19% | 13% | 6% | 3% |
Net income was $17.6 million in Q3 2025, compared with net income of $11.9 million in Q3 2024. The increase was driven primarily by an increase in gross profit of $4.2 million and an increase in interest income due to higher cash balances and lower interest expense resulting from lower outstanding debt balances and declining interest rates.
Adjusted EBITDA was $29.1 million in Q3 2025, a year-over-year increase of 11%. The increase was driven primarily by higher gross profit, offset slightly by a moderate increase in personnel costs. Adjusted EBITDA margin was 9.5% in Q3 2025, compared with 10.1% in Q3 2024.
Financial Impact of the FTC Settlement for Under-65 Health
As previously disclosed, in early 2025 following a comprehensive strategic review, we began implementing enhanced compliance measures and scaling back certain areas within under-65 health. As a result of these actions, under-65 health’s top and bottom lines declined significantly in the first three quarters of 2025.
On a year-over-year basis, we expect these additional compliance procedures agreed to in connection with
the FTC settlement, together with actions implemented in the first three quarters of the year, to reduce under-65 Transaction Value by $78 million to $82 million and under-65 Contribution by $18 million to $19 million in 2025. Relative to our 2024 consolidated results, these declines represent 5% of Transaction Value and 12% of Contribution at the midpoints of these ranges. Specifically, for under-65:
| | | | | | | | | | | | | | |
| Transaction Value ($ in millions) | Q1 2025 | Q2 2025 | Q3 2025 | Q4 2025 |
$ Change year over year | $(9) | $(16) | $(19) | $(34)-$(38) |
| % Change year over year — at the midpoint | (20)% | (41)% | (50)% | (61)%-(68)% |
| | | | |
| Contribution ($ in millions) | Q1 2025 | Q2 2025 | Q3 2025 | Q4 2025 |
$ Change year over year | $(3) | $(4) | $(4) | $(8)-$(9) |
| % Change year over year — at the midpoint | (32)% | (63)% | (71)% | (80)%-(90)% |
Financial highlights (excluding Under-65 Health)4
| | | | | | | | | | | | | | | |
| | YoY |
| $ in millions | | Q3 2024 | Q3 2025 | $ | % |
| Transaction Value | | $413 | $570 | $157 | 38% |
| Revenue | | $232 | $297 | $65 | 28% |
| Contribution | | $36 | $44 | $8 | 22% |
Adjusted EBITDA (excluding Under-65 Health Contribution) | | $21 | $28 | $7 | 31% |
In 2026, we expect our under-65 health sub-vertical to represent a low single digit percentage of our total Contribution.
4 Year-over-year growth figures exclude under-65 Health Transaction Value and Contribution, respectively. The Transaction Value and Contribution from under-65 Health are shown on pages 5 and 7, respectively.
Financial Discussion - Q4 2025 Outlook5 | | | | | | | | | | | | | | |
| | Q4 2025 |
Transaction Value 6 | | $620 million | - | $645 million |
| Y/Y Growth | | 24% | | 29% |
| | | | |
| | | | |
| Revenue | | $280 million | - | $300 million |
| Y/Y Growth | | (7)% | | 0% |
| | | | |
| | | | |
Adjusted EBITDA 6 | | $27.5 million | - | $29.5 million |
| Y/Y Growth | | (25)% | | (20)% |
Our guidance for Q4 2025 reflects continued positive momentum. We expect Transaction Value in our P&C insurance vertical to grow approximately 45% year over year in the fourth quarter, driven by strong carrier growth investment and continued share gains. We expect fourth quarter Transaction Value in our Health insurance vertical, which includes both Medicare and under-65 health, to decline approximately 45% year over year, driven primarily by under-65 health, which is stabilizing at a lower baseline.
On a year-over-year basis, we expect fourth quarter Transaction Value and Contribution from under-65 health to decline by $34 million - $38 million (61% - 68%) and $8 million - $9 million (80% - 90%), respectively.
Transaction Value: For Q4 2025, we expect Transaction Value to be in the range of $620 million - $645 million, a year-over-year increase of 27% at the midpoint. Excluding under-65 health, we expect Transaction Value to be up 38% year over year at the midpoint.
Revenue: For Q4 2025, we expect revenue to be in the range of $280 million - $300 million, a year-over-year decrease of 4% at the midpoint.
Adjusted EBITDA: For Q4 2025, we expect Adjusted EBITDA to be in the range of $27.5 million - $29.5 million, a year-over-year decrease of 22% at the midpoint, including an $8 million - $9 million year-over-year decline in Contribution from under-65. Excluding under-65 health, we expect Contribution to increase by high single digits and Adjusted EBITDA to be roughly flat year over year. We expect Contribution less Adjusted EBITDA to be approximately the same as the Q3 2025 level.
Thank you, | | | | | | | | |
| Steve Yi | | Patrick Thompson |
| Chief Executive Officer, President and Co-Founder | | Chief Financial Officer & Treasurer |
5 With respect to the Company’s projections of Adjusted EBITDA and Contribution under “Financial Discussion – Q4 2025 Outlook”, MediaAlpha is not providing a reconciliation of Adjusted EBITDA to net income (loss), or of Contribution to gross profit, because the Company is unable to predict with reasonable certainty the reconciling items that may affect the corresponding GAAP measures without unreasonable effort. These reconciling items are uncertain, depend on various factors and could significantly impact, either individually or in the aggregate, the GAAP measures for the applicable period.
6 See “Key Business and Operating Metrics and Non-GAAP Financial Measures” for additional information regarding non-GAAP metrics and operating metrics used in this shareholder letter.
| | |
Key Business and Operating Metrics and Non-GAAP Financial Measures |
In addition to traditional financial metrics, we rely upon certain business and operating metrics that are not presented in accordance with GAAP to estimate the volume of spending on our platform, estimate and recognize revenue, evaluate our business performance and facilitate our operations. Such business and operating metrics should not be considered in isolation from, or as an alternative to, measures presented in accordance with GAAP and should be considered together with other operating and financial performance measures presented in accordance with GAAP. Also, such business and operating metrics may not necessarily be comparable to similarly titled measures presented by other companies.
Transaction Value
We define “Transaction Value” as the total gross dollars transacted by our partners on our platform. Transaction Value is an operating metric not presented in accordance with GAAP, and is a driver of revenue based on the economic relationships we have with our partners. Our partners use our platform to transact via Open and Private Marketplace transactions. In our Open Marketplace model, revenue recognized represents the fees paid by our Demand Partners for Consumer Referrals sold and is equal to the Transaction Value and revenue share payments to our Supply Partners represent costs of revenue. In our Private Marketplace model, revenue recognized represents a platform fee billed to the Demand Partner or Supply Partner based on an agreed-upon percentage of the Transaction Value for the Consumer Referrals transacted, and accordingly there are no associated costs of revenue. We utilize Transaction Value to assess the overall level of transaction activity through our platform. We believe it is useful to investors to assess the overall level of activity on our platform and to better understand the sources of our revenue across our different transaction models and verticals.
The following table presents Transaction Value by platform model for the three and nine months ended September 30, 2025 and 2024:
| | | | | | | | | | | | | | | | | | | | | | | |
| Three Months Ended September 30, | | Nine Months Ended September 30, |
| (in thousands) | 2025 | | 2024 | | 2025 | | 2024 |
| Open Marketplace transactions | $ | 299,815 | | | $ | 253,016 | | | $ | 803,514 | | | $ | 546,949 | |
| Percentage of total Transaction Value | 50.9 | % | | 56.0 | % | | 52.1 | % | | 55.1 | % |
| Private Marketplace transactions | 289,488 | | | 198,759 | | | 739,669 | | | 445,742 | |
| Percentage of total Transaction Value | 49.1 | % | | 44.0 | % | | 47.9 | % | | 44.9 | % |
| Total Transaction Value | $ | 589,303 | | | $ | 451,775 | | | $ | 1,543,183 | | | $ | 992,691 | |
The following table presents Transaction Value by vertical for the three and nine months ended September 30, 2025 and 2024:
| | | | | | | | | | | | | | | | | | | | | | | |
| Three Months Ended September 30, | | Nine Months Ended September 30, |
| (in thousands) | 2025 | | 2024 | | 2025 | | 2024 |
| Property & Casualty insurance | $ | 548,225 | | | $ | 387,451 | | | $ | 1,390,423 | | | $ | 777,521 | |
| Percentage of total Transaction Value | 93.0 | % | | 85.8 | % | | 90.1 | % | | 78.3 | % |
| Health insurance | 33,480 | | | 55,615 | | | 128,572 | | | 179,980 | |
| Percentage of total Transaction Value | 5.7 | % | | 12.3 | % | | 8.3 | % | | 18.1 | % |
| Life insurance | 7,320 | | | 6,261 | | | 21,095 | | | 24,384 | |
| Percentage of total Transaction Value | 1.2 | % | | 1.4 | % | | 1.4 | % | | 2.5 | % |
| Other | 278 | | | 2,448 | | | 3,093 | | | 10,806 | |
| Percentage of total Transaction Value | 0.1 | % | | 0.5 | % | | 0.2 | % | | 1.1 | % |
| Total Transaction Value | $ | 589,303 | | | $ | 451,775 | | | $ | 1,543,183 | | | $ | 992,691 | |
Contribution and Contribution Margin
We define “Contribution” as revenue less revenue share payments and online advertising costs, or, as reported in our consolidated statements of operations, revenue less cost of revenue (i.e., gross profit), as adjusted to exclude the following items from cost of revenue: equity-based compensation; salaries, wages, and related costs; internet and hosting costs; amortization; depreciation; other services; and merchant-related fees. We define “Contribution Margin” as Contribution expressed as a percentage of revenue for the same period. Contribution and Contribution Margin are non-GAAP financial measures that we present to supplement the financial information we present on a GAAP basis. We use Contribution and Contribution Margin to measure the return on our relationships with our Supply Partners (excluding certain fixed costs), the financial return on and efficacy of our online advertising costs to drive consumers to our proprietary websites, and our operating leverage. We do not use Contribution and Contribution Margin as measures of overall profitability. We present Contribution and Contribution Margin because they are used by our management and board of directors to manage our operating performance, including evaluating our operational performance against budget and assessing our overall operating efficiency and operating leverage. For example, if Contribution increases and our headcount costs and other operating expenses remain steady, our Adjusted EBITDA and operating leverage increase. If Contribution Margin decreases, we may choose to re-evaluate and re-negotiate our revenue share agreements with our Supply Partners, to make optimization and pricing changes with respect to our bids for keywords from primary traffic acquisition sources, or to change our overall cost structure with respect to headcount, fixed costs and other costs. Other companies may calculate Contribution and Contribution Margin differently than we do. Contribution and Contribution Margin have their limitations as analytical tools, and you should not consider them in isolation or as substitutes for analysis of our results presented in accordance with GAAP.
The following table reconciles Contribution with gross profit, the most directly comparable financial measure calculated and presented in accordance with GAAP, for the three and nine months ended September 30, 2025 and 2024:
| | | | | | | | | | | | | | | | | | | | | | | |
| Three Months Ended September 30, | | Nine Months Ended September 30, |
| (in thousands) | 2025 | | 2024 | | 2025 | | 2024 |
| Revenue | $ | 306,514 | | | $ | 259,133 | | | $ | 822,445 | | | $ | 564,056 | |
| Less cost of revenue | (263,108) | | | (219,907) | | | (699,713) | | | (469,465) | |
| Gross profit | $ | 43,406 | | | $ | 39,226 | | | $ | 122,732 | | | $ | 94,591 | |
| Adjusted to exclude the following (as related to cost of revenue): | | | | | | | |
| Equity-based compensation | 265 | | | 405 | | | 836 | | | 2,654 | |
| Salaries, wages, and related | 707 | | | 907 | | | 2,308 | | | 2,474 | |
| Internet and hosting | 199 | | | 145 | | | 570 | | | 402 | |
| Other expenses | 213 | | | 170 | | | 580 | | | 539 | |
| Depreciation | 5 | | | 5 | | | 17 | | | 15 | |
| Other services | 616 | | | 549 | | | 1,856 | | | 2,008 | |
| Merchant-related fees | 204 | | | 75 | | | 534 | | | 217 | |
| Contribution | $ | 45,615 | | | $ | 41,482 | | | $ | 129,433 | | | $ | 102,900 | |
| Gross margin | 14.2 | % | | 15.1 | % | | 14.9 | % | | 16.8 | % |
| Contribution Margin | 14.9 | % | | 16.0 | % | | 15.7 | % | | 18.2 | % |
Consumer Referrals
We define “Consumer Referral” as any consumer click, call or lead purchased by a buyer on our platform. Click revenue is recognized on a pay-per-click basis and revenue is earned and recognized when a consumer clicks on a listed buyer’s advertisement that is presented subsequent to the consumer’s search (e.g., auto insurance quote search or health insurance quote search). Call revenue is earned and recognized when a consumer transfers to a buyer and remains engaged for a requisite duration of time, as specified by each buyer. Lead revenue is recognized when we deliver data leads to buyers. Data leads are generated either through insurance carriers, insurance-focused research destination websites or other financial websites that make the data leads available for purchase through our platform, or when consumers complete a full quote request on our proprietary websites. Delivery occurs at the time of lead transfer. The data we generate from each Consumer Referral feeds into our analytics model to generate conversion probabilities for each unique consumer, enabling discovery of predicted return and cost per sale across the platform and helping us to improve our platform technology. We monitor the number of Consumer Referrals on our platform in order to measure Transaction Value, revenue and overall business performance across our verticals and platform models.
The following table presents the percentages of total Transaction Value generated from clicks, calls and leads for the three and nine months ended September 30, 2025 and 2024:
| | | | | | | | | | | | | | | | | | | | | | | |
| Three Months Ended September 30, | | Nine Months Ended September 30, |
| 2025 | | 2024 | | 2025 | | 2024 |
| Clicks | 92.2 | % | | 88.6 | % | | 90.0 | % | | 84.2 | % |
| Calls | 2.8 | % | | 6.6 | % | | 4.2 | % | | 9.4 | % |
| Leads | 5.0 | % | | 4.8 | % | | 5.8 | % | | 6.4 | % |
Adjusted EBITDA
We define “Adjusted EBITDA” as net income (loss) excluding interest expense, income tax expense (benefit), depreciation expense on property and equipment, amortization of intangible assets, as well as equity-based compensation expense and certain other adjustments as listed in the table below. We define “Adjusted EBITDA Margin” as Adjusted EBITDA as a percentage of revenue. Adjusted EBITDA is a non-GAAP financial measure that we present to supplement the financial information we present on a GAAP basis. We monitor and present Adjusted EBITDA because it is a key measure used by our management to understand and evaluate our operating performance, to establish budgets and to develop operational goals for managing our business. We believe that Adjusted EBITDA helps identify underlying trends in our business that could otherwise be masked by the effect of the expenses that we exclude in the calculations of Adjusted EBITDA. Accordingly, we believe that Adjusted EBITDA provides useful information to investors and others in understanding and evaluating our operating results, enhancing the overall understanding of our past performance and future prospects. In addition, presenting Adjusted EBITDA provides investors with a metric to evaluate the capital efficiency of our business.
Adjusted EBITDA is not presented in accordance with GAAP and should not be considered in isolation of, or as an alternative to, measures presented in accordance with GAAP. There are a number of limitations related to the use of Adjusted EBITDA rather than net income, which is the most directly comparable financial measure calculated and presented in accordance with GAAP. These limitations include the fact that Adjusted EBITDA excludes interest expense on debt, income tax expense (benefit), equity-based compensation expense, depreciation and amortization, and certain other adjustments that we consider to be useful to investors and others in understanding and evaluating our operating results. In addition, other companies may use other measures to evaluate their performance, including different definitions of “Adjusted EBITDA,” which could reduce the usefulness of our Adjusted EBITDA as a tool for comparison.
The following table reconciles Adjusted EBITDA with net income (loss), the most directly comparable financial measure calculated and presented in accordance with GAAP, for the three and nine months ended September 30, 2025 and 2024:
| | | | | | | | | | | | | | | | | | | | | | | |
| Three Months Ended September 30, | | Nine Months Ended September 30, |
| (in thousands) | 2025 | | 2024 | | 2025 | | 2024 |
| Net income (loss) | $ | 17,643 | | | $ | 11,888 | | | $ | (7,224) | | | $ | 14,817 | |
| Equity-based compensation expense | 7,662 | | | 8,597 | | | 22,798 | | | 26,452 | |
| Interest expense | 2,808 | | | 3,562 | | | 8,633 | | | 11,158 | |
| Income tax expense | 54 | | | 312 | | | 321 | | | 469 | |
| Depreciation expense on property and equipment | 71 | | | 65 | | | 201 | | | 191 | |
| Amortization of intangible assets | 511 | | | 1,609 | | | 2,467 | | | 4,827 | |
Transaction expenses(1) | 303 | | | (45) | | | 303 | | | 1,172 | |
| | | | | | | |
Write-off of intangible assets(2) | — | | | — | | | 13,416 | | | — | |
| | | | | | | |
| | | | | | | |
Contract settlement(3) | — | | | — | | | — | | | (1,725) | |
| Changes in TRA related liability | (159) | | | — | | | (80) | | | — | |
| Changes in Tax Indemnification Receivable | (5) | | | (84) | | | (211) | | | (86) | |
| | | | | | | |
Legal expenses(4) | 191 | | | 367 | | | 42,333 | | | 2,155 | |
| | | | | | | |
| Adjusted EBITDA | $ | 29,079 | | | $ | 26,271 | | | $ | 82,957 | | | $ | 59,430 | |
(1)Transaction expenses consist of $0.3 million of legal and accounting fees incurred for the three and nine months ended September 30, 2025, respectively, in connection with an amendment to the 2021 Credit Facilities. Transaction expenses consist of immaterial expenses and $1.2 million of legal and accounting fees incurred by us for the three and nine months ended September 30, 2024, respectively, in connection with resale registration statements filed with the SEC.
(2)Write-off of intangible assets for the nine months ended September 30, 2025 consist of a charge of $13.4 million related to the write-off of customer relationships and trademarks, trade names, and domain names intangible assets acquired as part of the acquisition of Customer Helper Team, LLC.
(3)Contract settlement consists of $1.7 million of income for the nine months ended September 30, 2024 recorded in connection with a one-time contract termination fee receivable from one of our partners in the Health vertical that ceased operations during the nine months ended September 30, 2024.
(4)Legal expenses of $0.2 million and $42.3 million for the three and nine months ended September 30, 2025, respectively, consist of increases of $0.0 million and $38.0 million, respectively, to the loss reserve established in connection with the FTC Matter and legal fees and costs incurred in connection with such matter. Legal expenses of $0.4 million and $2.2 million for the three and nine months ended September 30, 2024, consist of legal fees and costs incurred in connection with the FTC Matter.
Forward-Looking Statements
This shareholder letter contains forward-looking statements within the meaning of the Private Securities Litigation Reform Act of 1995, including without limitation statements regarding our belief that that the insurance industry's digital transformation represents a vast opportunity for the Company; that we are poised to benefit disproportionately from both the near-term recovery in the auto market and the long-term secular migration of insurance marketing to digital channels; that most P&C carriers are still investing well below their full potential; our expectation that our carrier mix will normalize, with a positive effect on our profitability; our belief that there continues to be substantial runway for growth in our P&C vertical; our expectation that under-65 health is stabilizing at a lower baseline; our expectations regarding our share repurchase plan; our expectation of continued growth as auto insurance industry marketing spend increases from current levels; our belief that the auto insurance industry is in the early stages of a soft market, and the potential duration of that soft market; our belief that we are positioned to grow faster than overall carrier marketing spend; the expected impact of the FTC settlement on Transaction Value, revenue and Contribution from our under-65 health sub-vertical; and our financial outlook for the fourth quarter of 2025. These forward-looking statements reflect our current views with respect to, among other things, future events and our financial performance. These statements are often, but not always, made through the use of words or phrases such as “may,” “should,” “could,” “predict,” “potential,” “believe,” “will likely result,” “expect,” “continue,” “will,” “anticipate,” “seek,” “estimate,” “intend,” “plan,” “projection,” “would,” and “outlook,” or the negative version of those words or other comparable words or phrases of a future or forward-looking nature. These forward-looking statements are not historical facts, and are based on current expectations, estimates and projections about our industry, management’s beliefs and certain assumptions made by management, many of which, by their nature, are inherently uncertain and beyond our control. Accordingly, we caution you that any such forward-looking statements are not guarantees of future performance and are subject to risks, assumptions and uncertainties that are difficult to predict. Although we believe that the expectations reflected in these forward-looking statements are reasonable as of the date made, actual results may prove to be materially different from the results expressed or implied by the forward-looking statements.
There are or will be important factors that could cause our actual results to differ materially from those indicated in these forward-looking statements, including those more fully described in MediaAlpha’s filings with the Securities and Exchange Commission (“SEC”), including the Form 10-K filed on February 24, 2025 and the Forms 10-Q filed on April 30, 2025, August 6, 2025, and to be filed on October 29, 2025. These factors should not be construed as exhaustive. MediaAlpha disclaims any obligation to update any forward-looking statements to reflect events or circumstances that occur after the date of this shareholder letter.