
nerdy Q3 | 2024 Earnings Release We Found Your Best March My Tutor rebecca Martin Request tutor Finding the best match Confirming availability Tutor matched Versity Tutors Select Draw Erase Type Arrows Shapes y x (2x)o 30o z m<xyz = 50o x = 10
nerdy Q3 | 2024 Earnings Release We Found Your Best March My Tutor rebecca Martin Request tutor Finding the best match Confirming availability Tutor matched Versity Tutors Select Draw Erase Type Arrows Shapes y x (2x)o 30o z m<xyz = 50o x = 10
A Note to Our
Shareholders
In the third quarter, we continued to make progress against the primary goals we laid out for the year, including:
Scaling the winning product for every Learner: As we have shared in the past, we have historically seen that getting new customers on our platform and into tutoring sessions seamlessly and with little friction involved is highly predictive of customer satisfaction, retention, and ultimately lifetime value. We identified the first 30 day onboarding experience as one of the high impact areas where we could drive durable improvements to retention and lifetime value.
A significant portion of our product and engineering efforts have been focused toward this area, including improving the digital experience and the fundamentals of a great customer experience. These efforts have resulted in multiple key enhancements being shipped recently that will benefit both Consumer and Institutional customers, including the scheduling experience, improving schedule reliability, tutor match quality, and providing better self-serve tools.
Consistent with the early trends we shared last quarter, the shift in our product mix toward memberships oriented around weekly tutoring habits, including the four and eight hour Learning Memberships, coupled with digital experience improvements, is positively affecting newly acquired cohorts. Among new customers that now are joining on higher frequency Learning memberships this back-to-school season, we are seeing higher levels of tutoring sessions per week, higher levels of non-tutoring engagement due to improved discoverability across the platform, higher average revenue per member per month (ARPM), and improved levels of retention in their first month. These trends benefitted from further in-quarter improvements to the digital experience, which we believe will drive more consistent customer usage and lead to improvements in lifetime value and unit level economics. The positive trends in new customer cohorts were partially offset by lower retention in older customer cohorts that included a higher proportion of lower frequency learning memberships, which was a trend we spoke to last quarter and one that we expect to continue through year-end and then subsequently subside.
Expanding the number of Learners we can impact: As we have discussed throughout the year, we made substantial investments in the Varsity Tutors for Schools go-to-market organization and platform infrastructure. These investments primarily focused on three areas:
| • | The first was on converging the Consumer and Institutional platforms into a unified digital experience, which required significant product and engineering resources, and was an initiative we completed last quarter that will allow us to move faster in the future. |
| • | The second area of investment was enabling access to the Varsity Tutors platform for entire school districts in order to serve millions of students and to establish a high volume of school district relationships with the aim of building trust and credibility. As we roll out access to our platform in a new school district, we are laying the foundation to become their preferred tutoring platform when they look to implement paid high-dosage tutoring programs in the future. |
| • | The third area of investment for Varsity Tutors for Schools was in the expansion of the Institutional go-to- market sales organization to drive further market penetration and bookings growth. |
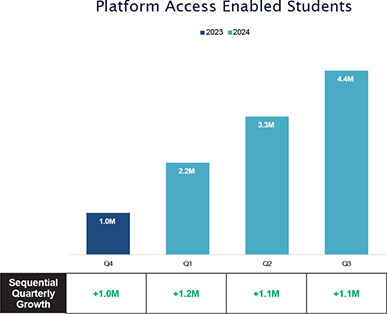
In the third quarter, we continued to see strong interest in districts signing up for access to our platform, an offering made possible by the convergence into a unified platform earlier this year. We successfully enabled access to the Varsity Tutors for Schools platform for an additional 1.1 million students, bringing the total to 4.4 million students at nearly 900 school districts during the third quarter. Student engagement with our platform was stronger than expected as students returned to school, demonstrating the relevance of our offering and the growing need for student support beyond the traditional classroom.

|
Q3 Earnings Release 2024 | 2 |
We believe our strategy to offer free access to the Varsity Tutors platform is yielding early positive results by driving brand awareness and introducing our products to school district partners at a larger scale than ever before. In the third quarter, 32% of paid contracts and 22% of total bookings value came from school district partners who initially partnered with Varsity Tutors for Schools via free access to our platform and subsequently converted to our paid offerings. This strategy of providing access to our low marginal cost products on our platform that have high perceived value is allowing us to build a large number of relationships with school districts, and positions us to drive sustainable long-term growth within the K-12 market.
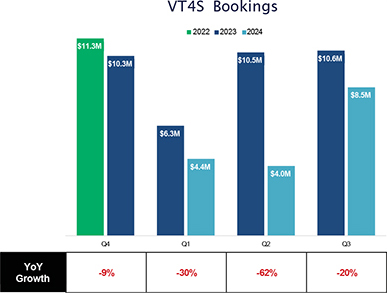
The investments in the go-to-market function and Institutional sales organization in particular were made in anticipation of a higher level of bookings. Our thesis was supported by the prior two years of Institutional bookings growth, combined by the upcoming end of Elementary and Secondary School Emergency Relief Fund (ESSER) funding on September 30, 2024, which we believed could deliver a substantial amount of bookings with K-12 school districts. While we successfully executed 117 contracts during the third quarter (representing an increase of 46% year-over-year) those contracts only yielded $8.5 million of bookings, which was below expectations.
We attribute the lower deal size to several factors, including: entering back to school with a newly hired sales team, being overly focused on the ESSER deadline vs. other funding sources, and the complexity involving onboarding free platform access school district partners. As school started, significant effort was placed on trying to capture ESSER related bookings and to launch platform access at hundreds of school districts, which required us to expend significant internal resources to support these efforts in a short period of time. We believe this was a good long-term investment, however, in the short-term it resulted in a trade off of resources and focus, which impacted execution in the Consumer business.
The Institutional opportunity within K-12 schools still represents a significant market opportunity and one for which we believe we are uniquely qualified. To better reflect a more normalized sales cycle in a post-ESSER environment that encompasses multiple different student populations and recurring funding sources within schools we’ll be moderating our level of spend to a level that we believe will support durable and profitable growth.
Laying the foundation to deliver profitable growth: As discussed last quarter, we have been working to modernize several components of our marketplace infrastructure. We are in the final stages of fully delivering several improvements to our underlying marketplace infrastructure systems, including session scheduling enhancements, and invoice and tutor substitution automation improvements that we believe will allow us to provide best-in-class logistical reliability.
Due to the resourcing required to support Varsity Tutors for Schools in the third quarter, certain marketplace infrastructure initiatives are taking longer than anticipated to fully implement. Once delivered, we believe that these initiatives will allow us to deliver meaningful gross margin improvements and operating leverage on a go-forward basis, while simultaneously improving the customer experience due to the higher reliability level of our marketplace infrastructure systems.
In Closing
Taking a step back, we believe that the growing awareness and recognition by parents, educators and policymakers that high-dosage tutoring is the most effective way to accelerate learning provides us with confidence in the demand for live tutoring in the years ahead. We continue to deliver product enhancements that drive high levels of engagement with our platform, expand our customers’ lifetime value, and provide durable competitive advantages, which we believe will enable strengthening financial performance in the coming quarters.
We appreciate your continued interest in our Company, and look forward to meeting the evolving needs of Learners in any subject, anywhere, and at any time.

CHUCK COHN
Founder, Chairman & CEO
|
|
Q3 Earnings Release 2024 | 3 |
Third Quarter in Review
In the third quarter:
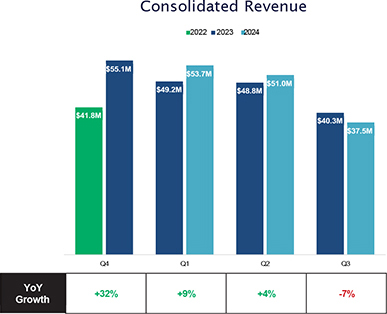
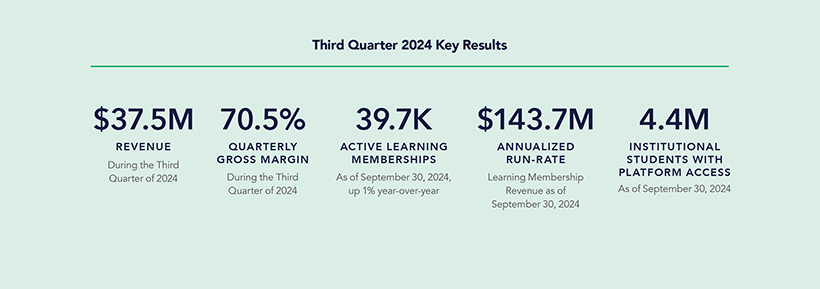
| • | We delivered revenue of $37.5 million, a decrease of 7% year-over-year from $40.3 million during the same period in 2023. Revenue declined primarily due to lower ARPM in our Consumer business. ARPM was lower due to a higher mix of lower frequency Learning Memberships when compared to the prior year period. |
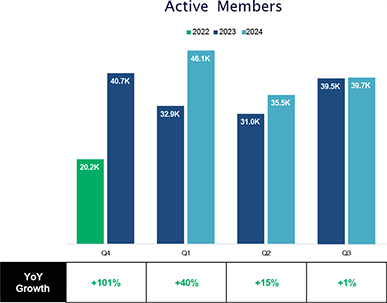
| • | Active Members of 39.7K as of September 30, 2024 were up 1% year-over-year. ARPM of $302 as of September 30, 2024 (compared to $346 last year) was lower year-over-year due to a higher mix of lower frequency Learning Memberships. Revenue recognized in the third quarter from Learning Memberships was $31.4 million and represented 84% of total Company revenue. |
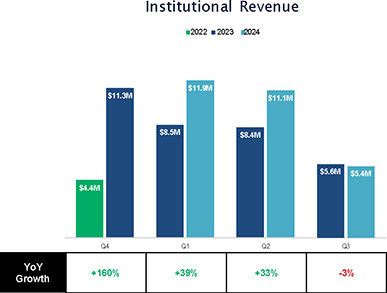
| • | Our Institutional business delivered revenue of $5.4 million, a decrease of 3% year-over-year, and represented 14% of total revenue. Varsity Tutors for Schools executed 117 contracts, yielding $8.5 million of bookings. |
| • | Our platform access strategy in our Institutional business is allowing us to introduce our products to school districts at a larger scale than ever before. During the quarter, we successfully enabled access to the Varsity Tutors platform for an additional 1.1 million students, bringing the total to 4.4 million students at nearly 900 school districts. |
| • | We reported a net loss of $25.0 million and non-GAAP adjusted EBITDA of negative $14.0 million, which was above our guidance of negative $17.0 million to negative $19.0 million of non-GAAP adjusted EBITDA. Non-GAAP adjusted EBITDA improvements relative to guidance were primarily driven by lower sales and marketing spend, operating efficiency gains, and diligent cost control. |
| • | We ended the quarter with $65.0 million of cash on our balance sheet and no debt, which we believe provides ample liquidity to fund the business and pursue growth initiatives. |
|
|
Q3 Earnings Release 2024 | 4 |
Consumer Business
Learning Memberships offer a personalized approach to reaching a Learner’s goals, and inspiring new ones. With Learning Memberships, consumers can discover the perfect learning solution for every age and subject, tailored to an individual’s needs. Our comprehensive platform offers support across a vast array of both academic and enrichment subjects, weaving the application of AI for HI®, or Artificial Intelligence for Human Interaction, throughout the user experience. The depth and breadth of our learning tools included within Learning Memberships, including 1-on-1 tutoring, live and recorded classes, self-study tools, college & career readiness resources, and adaptive assessments, are robust, incredibly valuable to Learners, and are allowing us to deliver personalized learning that is tailored to the specific needs of Learners.
During the third quarter, we continued to focus on enhancing the Learning Membership experience by further streamlining the new customer process via onboarding assistant and the launch of tutor match tracker. Onboarding assistant enables a customer’s tutor placement request to get into our systems with greater efficiency and accuracy, resulting in students being matched to a tutor faster, providing a shorter time to the first tutoring session, which we believe will result in higher customer retention. Tutor match tracker (shown below) provides a host of onboarding improvements including providing greater transparency into the matching process, making it easier for customers to manage their tutoring relationships, confirming scheduling availability, introducing new members to the full breadth of our learning tools available to them, and reducing the amount of new client inbound service requests prior to being matched with their tutor.

These user experience changes are delivering improvements in time to the first tutoring session, first session client no-show rates, non-tutoring engagement, and a reduction in tutor replacements. Collectively, these improvements are leading to higher customer retention in new Consumer cohorts.
|
|
Q3 Earnings Release 2024 | 5 |
Varsity Tutors for Schools
The Varsity Tutors for Schools platform comes with access to a range of powerful academic resources for an entire district, with the ability to choose between three simple delivery models for high-dosage tutoring at a competitive unified pricing model. Institutional customers can choose to administer tutoring centrally at the school district level, empower teachers to manage tutoring interventions, or provide parents with Learning Memberships and oversee tutoring outside of schools for their own students. We also provide a robust set of academic resources, including 24/7 on-demand chat-based tutoring, essay editing and review, and 100+ live large group classes per week in enrichment, test prep, and academic subjects.
During the third quarter, we continued to focus on enhancing our product offerings to provide support to even more Learners and drive higher levels of engagement. While English and Spanish are the most popular chat-based tutoring languages we support, many of our large school district partners have diverse student populations. In order to serve these students, we expanded chat-based tutoring with the introduction of auto-translate to English, which enables our Experts to provide chat-based tutoring in 75 languages, allowing us to support Learners in their native language. We also significantly expanded our catalog of live stream classes during the quarter. Previously, small group classes would often “max out” availability due to student capacity constraints. With the introduction of live stream classes we can now provide professional learning experiences to thousands of students at once in an engaging and interactive manner.

|
|
Q3 Earnings Release 2024 | 6 |
Financial Highlights
| • | Revenue In Line with Expectations – In the third quarter, Nerdy delivered revenue of $37.5 million, near the top of our guidance range of $35-38 million, and represented a decrease of 7% year-over-year from $40.3 million during the same period in 2023. Revenue declined primarily due to lower ARPM in our Consumer business. ARPM was lower due to a higher mix of lower frequency Learning Memberships when compared to the prior year period. |
| • | Learning Memberships – Revenue recognized in the third quarter from Learning Memberships was $31.4 million and represented 84% of total Company revenue. There were 39.7K Active Members as of September 30, 2024. |
| • | Institutional – In the third quarter, Institutional delivered revenue of $5.4 million and represented 14% of total revenue. Varsity Tutors for Schools executed 117 contracts, yielding $8.5 million of bookings. Our strategy to introduce school districts to the platform and ultimately convert them to our fee-based offerings, started to bear fruit in the third quarter with 32% of paid contracts and 22% of total bookings value coming from school district partners who initially partnered with Varsity Tutors for Schools via free access to our platform and subsequently converted to our paid offerings. |
| • | Gross Margin – Gross margin was 70.5% for the three months ended September 30, 2024, compared to a gross margin of 72.4% during the comparable period in 2023. The decrease in gross margin was primarily due to lower ARPM coupled with higher utilization of tutoring sessions across Learning Memberships in our Consumer business, partially offset by lower seasonal utilization of our access-based products in our Institutional business. |
| • | Adjusted EBITDA Loss Beats Guidance Range – Net loss was $25.0 million in the third quarter versus a net loss of $20.6 million during the same period in 2023. Excluding non-cash stock compensation expenses, transaction costs, restructuring costs, and mark-to-market derivative adjustments, which were treated as adjustments for non-GAAP measures, non-GAAP adjusted net loss was $15.1 million for the third quarter of 2024 compared to a non-GAAP adjusted net loss of $9.1 million in the third quarter of 2023. We reported a non-GAAP adjusted EBITDA loss of $14.0 million, above our guidance of negative $17.0 million to negative $19.0 million in non-GAAP adjusted EBITDA. This compares to a non-GAAP adjusted EBITDA loss of $8.2 million in the same period one year ago. Non-GAAP adjusted EBITDA improvements relative to guidance were primarily driven by lower sales and marketing spend, operating efficiency gains, and diligent cost control. Compared to last year, Non-GAAP adjusted EBITDA was lower primarily due to investments in the Varsity Tutors for Schools sales organization and product development to drive innovation and support our growth. |
| • | Operating Cash Flow and Liquidity – Negative operating cash flow was $3.1 million in the third quarter of 2024 compared to negative operating cash flow of $4.8 million in the same period last year. Investments in our Institutional sales organization and product development to drive innovation and support our continued growth were offset by favorable changes in working capital. With no debt and $65.0 million of cash on our balance sheet, we believe we have ample liquidity to fund the business and pursue growth initiatives. |
See page 15 for reconciliations of non-GAAP measures to the most directly comparable GAAP financial measure.
|
|
Q3 Earnings Release 2024 | 7 |
Fourth Quarter and Full Year 2024 Outlook
We are providing fourth quarter and updating full year revenue and adjusted EBITDA guidance.
Fourth quarter revenue guidance reflects higher sequential quarterly revenues from Learning Memberships and Varsity Tutors for Schools when K-12 schools and universities are in session.
For the fourth quarter, we expect year-over-year Consumer revenue will be impacted by a decline in the number of Learning Membership subscribers due primarily to a higher level of cancellations from older cohorts who purchased lower frequency learning memberships, coupled with lower average revenue per member per month.
In our Institutional business we expect that the lower bookings year-to-date will result in the flow through of lower revenues during the fourth quarter vs. the prior year.
We expect to deliver a sequential improvement in adjusted EBITDA from the third to the fourth quarter, which we would expect to continue into 2025. Fourth quarter adjusted EBITDA guidance primarily reflects the flow through of lower revenue year-over-year, coupled with investments in the institutional sales organization and in product development focused on continued innovation and growth.
We believe we have ample liquidity to fund the business and pursue growth initiatives.
Revenue Guidance
| • | For the fourth quarter of 2024, we expect revenue in a range of $44-47 million. |
| • | For the full year, we expect revenue in a range of $186-189 million. |
Adjusted EBITDA Guidance
| • | For the fourth quarter of 2024, we expect adjusted EBITDA in a range of negative $7 million to negative $10 million. |
| • | For the full year, we expect adjusted EBITDA in a range of negative $23 million to negative $26 million. |
|
|
Q3 Earnings Release 2024 | 8 |
Financial Discussion
Revenue
Revenue for the three months ended September 30, 2024 was $37.5 million, a decrease of 7% from $40.3 million during the same period in 2023. Revenue for the nine months ended September 30, 2024 was $142.2 million, an increase of 3% from $138.3 million during the same period in 2023. Revenue for the three months ended September 30, 2024 declined primarily due to lower ARPM in our Consumer business. Revenue growth for the nine months ended September 30, 2024 was driven by the continued scaling of our Institutional business, partially offset by lower ARPM in our Consumer business. ARPM was lower in both current year periods due to a higher mix of lower frequency Learning Memberships when compared to the prior year periods. Additionally, revenue for the nine months ended September 30, 2023 included legacy Package revenue of $15.8 million that did not recur in the current year period due to the completion of the transition to Learning Memberships in our Consumer business.
Gross Profit and Gross Margin
Gross profit of $26.5 million for the three months ended September 30, 2024 decreased by $2.7 million or 9% compared to the same period in 2023. Gross profit of $96.5 million for the nine months ended September 30, 2024 decreased by $0.7 million or 1% compared to the same period in 2023. Gross margin was 70.5% and 72.4% for the three months ended September 30, 2024 and 2023, respectively. Gross margin was 67.8% and 70.2% for the nine months ended September 30, 2024 and 2023, respectively.
The decrease in gross margin for the three months ended September 30, 2024 was primarily due to lower ARPM coupled with higher utilization of tutoring sessions across Learning Memberships in our Consumer business, partially offset by lower seasonal utilization of our access-based products in our Institutional business. The decrease in gross margin for the nine months ended September 30, 2024 was primarily due to lower ARPM coupled with higher utilization of tutoring sessions across Learning Memberships in our Consumer business and higher substitution costs in our Institutional business. Recently introduced improvements to our marketplace infrastructure systems, including session scheduling enhancements, invoice automation improvements, and changes to the tutor substitution program logic, collectively are expected to drive gross margin improvement on a go-forward basis, while simultaneously improving the customer experience due to the higher reliability level of our marketplace infrastructure systems.
Sales and Marketing
Sales and marketing expenses for the three months ended September 30, 2024 on a GAAP basis were $20.3 million, an increase of $1.0 million from $19.3 million in the same period in 2023. Excluding non-cash stock compensation, sales and marketing expenses for the three months ended September 30, 2024 were $19.7 million, an increase of $1.2 million compared to $18.5 million in the same period in 2023. Sales and marketing expenses for the nine months ended September 30, 2024 on a GAAP basis were $53.2 million, an increase of $3.5 million from $49.7 million in the same period in 2023. Excluding non-cash stock compensation, sales and marketing expenses for the nine months ended September 30, 2024 were $51.5 million, an increase of $4.1 million compared to $47.4 million in the same period in 2023.
Sales and marketing increases were driven by investments in our Institutional sales organization which were made to drive customer acquisition, brand awareness, and reach, including through signing up school districts with free access to the Varsity Tutors platform, which is a strategy to introduce school districts to the platform and ultimately convert them to our fee-based offerings. These investments were partially offset by Consumer marketing efficiency gains.
Sales and marketing expenses as a percentage of revenue may fluctuate from quarter to quarter based on Learning Membership sales, the size and volume of Institutional contracts, bookings, seasonality, and the timing of our investments in marketing activities.
|
|
Q3 Earnings Release 2024 | 9 |
General and Administrative
General and administrative expenses include compensation for certain employees, support services, product and development expenses intended to support innovation, and other operating expenses. Product and development costs were $11.3 million and $10.1 million during the three months ended September 30, 2024 and 2023, respectively. Product and development costs were $33.5 million and $26.9 million during the nine months ended September 30, 2024 and 2023, respectively. Product and development costs include compensation for employees on our product and engineering teams who are responsible for developing new and improving existing offerings, maintaining our website, improving efficiencies across our organization, and third-party expenses.
General and administrative expenses for the three months ended September 30, 2024 on a GAAP basis were $31.8 million, a decrease of $3.7 million from $35.5 million in the same period in 2023. Excluding non-cash stock compensation expenses, transaction costs, restructuring costs, and a provision for legal settlement, general and administrative expenses for the three months ended September 30, 2024 were $22.6 million, an increase of $2.1 million compared to $20.5 million in the same period in 2023. General and administrative expenses for the nine months ended September 30, 2024 on a GAAP basis were $97.0 million, an increase of $2.1 million from $94.9 million in the same period in 2023. Excluding non-cash stock compensation expenses. transaction costs, restructuring costs, and a provision for legal settlement, general and administrative expenses for the nine months ended September 30, 2024 were $66.5 million, an increase of $6.2 million compared to $60.3 million in the same period in 2023.
We believe our investments in product development and our platform-oriented approach to growth have allowed us to launch and continuously improve our suite of subscription products, including Learning Memberships for Consumers, and our District, Teacher, and Parent Assigned offerings for Institutional customers. We believe these subscription and access-based offerings simplify our operating model needed to support the organization, which allows us to maximize our investment in our unified platform.
Net Loss, Non-GAAP Adjusted Net Loss, and Non-GAAP Adjusted EBITDA Loss
Net loss on a GAAP basis was $25.0 million for the three months ended September 30, 2024 versus a net loss of $20.6 million in the same period in 2023. Excluding non-cash stock compensation expenses, transaction costs, restructuring costs, and mark-to-market derivative adjustments, non-GAAP adjusted net loss was $15.1 million for the three months ended September 30, 2024, compared to a non-GAAP adjusted net loss of $9.1 million in the same period in 2023. Net loss on a GAAP basis was $51.4 million for the nine months ended September 30, 2024 versus a net loss of $58.4 million in the same period in 2023. Excluding non-cash stock compensation expenses, transaction costs, restructuring costs, and mark-to-market derivative adjustments, non-GAAP adjusted net loss was $19.1 million for the nine months ended September 30, 2024, compared to a non-GAAP adjusted net loss of $8.2 million in the same period in 2023.
Non-GAAP adjusted EBITDA loss was $14.0 million for the three months ended September 30, 2024, above our guidance of negative $17.0 million to negative $19.0 million, and compared to a non-GAAP adjusted EBITDA loss of $8.2 million in the same period in 2023. Non-GAAP adjusted EBITDA loss was $16.0 million for the nine months ended September 30, 2024, compared to a non-GAAP adjusted EBITDA loss of $5.5 million in the same period in 2023.
Non-GAAP adjusted EBITDA improvements relative to guidance were primarily driven by lower sales and marketing spend, operating efficiency gains, and diligent cost control. Compared to last year, the Non-GAAP adjusted EBITDA loss was higher primarily due to investments in the Varsity Tutors for Schools sales organization and product development to drive innovation and support our growth.
See page 15 for reconciliations of non-GAAP measures to the most directly comparable GAAP financial measure.
Liquidity and Capital Resources
As of September 30, 2024, the Company’s principal sources of liquidity were cash and cash equivalents of $65.0 million. We believe our strong balance sheet provides us with ample liquidity to operate against our plan and pursue growth initiatives.
|
|
Q3 Earnings Release 2024 | 10 |
| Conference Call Details |
| Nerdy’s management will host a conference call to discuss its financial results on Thursday, November 7, 2024 at 5:00 p.m. Eastern Time. Interested parties in the U.S. may listen to the call by dialing 1-833-470-1428. International callers can dial 1-404-975-4839.. The Access Code is 292021. |
| A live webcast of the call will also be available on Nerdy’s investor relations website at nerdy.com/investors. |
| A replay of the webcast will be available on Nerdy’s website for one year following the event and a telephonic replay of the call will be available until November 14, 2024 by dialing 1-866-813-9403 from the U.S. or 1-929-458-6194 from all other locations, and entering the Access Code: 587079. |
| Contact
Investor Relations investors@nerdy.com
|
|
|
Q3 Earnings Release 2024 | 11 |
CONDENSED CONSOLIDATED STATEMENTS
OF OPERATIONS (Unaudited)
(in thousands, except per share data)
| Three Months Ended September 30, |
Nine Months Ended September 30, |
|||||||||||||||
| 2024 | 2023 | 2024 | 2023 | |||||||||||||
| Revenue |
$ | 37,530 | $ | 40,296 | $ | 142,241 | $ | 138,315 | ||||||||
| Cost of revenue |
11,077 | 11,108 | 45,786 | 41,138 | ||||||||||||
|
|
|
|
|
|
|
|
|
|||||||||
| Gross Profit |
26,453 | 29,188 | 96,455 | 97,177 | ||||||||||||
| Sales and marketing expenses |
20,315 | 19,233 | 53,244 | 49,652 | ||||||||||||
| General and administrative expenses |
31,862 | 35,508 | 97,017 | 94,921 | ||||||||||||
|
|
|
|
|
|
|
|
|
|||||||||
| Operating Loss |
(25,724 | ) | (25,553 | ) | (53,806 | ) | (47,396 | ) | ||||||||
| Unrealized (gain) loss on derivatives, net |
— | (4,099 | ) | — | 13,385 | |||||||||||
| Interest income |
(768 | ) | (844 | ) | (2,533 | ) | (2,460 | ) | ||||||||
| Other (income) expense, net |
(27 | ) | (5 | ) | 8 | 11 | ||||||||||
|
|
|
|
|
|
|
|
|
|||||||||
| Loss before Income Taxes |
(24,929 | ) | (20,605 | ) | (51,281 | ) | (58,332 | ) | ||||||||
| Income tax expense |
29 | 21 | 90 | 97 | ||||||||||||
|
|
|
|
|
|
|
|
|
|||||||||
| Net Loss |
(24,958 | ) | (20,626 | ) | (51,371 | ) | (58,429 | ) | ||||||||
| Net loss attributable to noncontrolling interests |
(9,058 | ) | (8,336 | ) | (18,932 | ) | (23,910 | ) | ||||||||
|
|
|
|
|
|
|
|
|
|||||||||
| Net Loss Attributable to Class A Common Stockholders |
$ | (15,900 | ) | $ | (12,290 | ) | $ | (32,439 | ) | $ | (34,519 | ) | ||||
|
|
|
|
|
|
|
|
|
|||||||||
| Loss per share of Class A Common Stock: |
||||||||||||||||
| Basic and Diluted |
$ | (0.14 | ) | $ | (0.13 | ) | $ | (0.29 | ) | $ | (0.37 | ) | ||||
| Weighted-Average Shares of Class A Common Stock Outstanding: |
||||||||||||||||
| Basic and Diluted |
113,287 | 97,077 | 110,267 | 94,453 | ||||||||||||
REVENUE (Unaudited)
(in thousands)
| Three Months Ended September 30, |
Change | |||||||||||||||||||||||
| dollars in thousands | 2024 | % | 2023 | % | $ | % | ||||||||||||||||||
| Consumer |
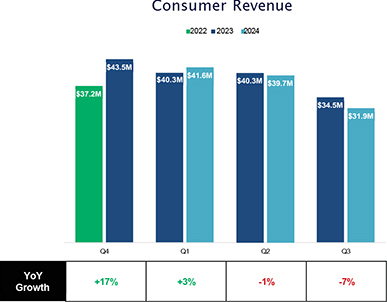
$ | 31,919 | 85 | % | $ | 34,494 | 85 | % | $ | (2,575 | ) | (7 | )% | |||||||||||
| Institutional |
5,429 | 14 | % | 5,580 | 14 | % | (151 | ) | (3 | )% | ||||||||||||||
| Other (a) |
182 | 1 | % | 222 | 1 | % | (40 | ) | (18 | )% | ||||||||||||||
|
|
|
|
|
|
|
|
|
|
|
|
|
|||||||||||||
| Revenue |
$ | 37,530 | 100 | % | $ | 40,296 | 100 | % | $ | (2,766 | ) | (7 | )% | |||||||||||
|
|
|
|
|
|
|
|
|
|
|
|
|
|||||||||||||
| Nine Months Ended September 30, |
Change | |||||||||||||||||||||||
| 2024 | % | 2023 | % | $ | % | |||||||||||||||||||
| Consumer |
$ | 113,237 | 79 | % | $ | 115,125 | 83 | % | $ | (1,888 | ) | (2 | )% | |||||||||||
| Institutional |
28,451 | 20 | % | 22,474 | 16 | % | 5,977 | 27 | % | |||||||||||||||
| Other (a) |
553 | 1 | % | 716 | 1 | % | (163 | ) | (23 | )% | ||||||||||||||
|
|
|
|
|
|
|
|
|
|
|
|
|
|||||||||||||
| Revenue |
$ | 142,241 | 100 | % | $ | 138,315 | 100 | % | $ | 3,926 | 3 | % | ||||||||||||
|
|
|
|
|
|
|
|
|
|
|
|
|
|||||||||||||
| (a) | Other consists of EduNation Limited, a company incorporated in England and Wales (“First Tutors UK”) and other services. |
|
|
Q3 Earnings Release 2024 | 12 |
CONDENSED CONSOLIDATED
BALANCE SHEETS (Unaudited)
(in thousands)
| September 30, 2024 |
December 31, 2023 |
|||||||
| ASSETS |
| |||||||
| Current Assets |
||||||||
| Cash and cash equivalents |
$ | 65,002 | $ | 74,824 | ||||
| Accounts receivable, net |
7,424 | 15,398 | ||||||
| Other current assets |
5,653 | 4,815 | ||||||
|
|
|
|
|
|||||
| Total Current Assets |
78,079 | 95,037 | ||||||
| Fixed assets, net |
17,498 | 16,388 | ||||||
| Goodwill |
5,717 | 5,717 | ||||||
| Intangible assets, net |
2,676 | 3,061 | ||||||
| Other assets |
2,789 | 4,541 | ||||||
|
|
|
|
|
|||||
| Total Assets |
$ | 106,759 | $ | 124,744 | ||||
|
|
|
|
|
|||||
| LIABILITIES AND STOCKHOLDERS’ EQUITY |
| |||||||
| Current Liabilities |
||||||||
| Accounts payable |
$ | 5,808 | $ | 3,443 | ||||
| Deferred revenue |
15,687 | 20,480 | ||||||
| Other current liabilities |
14,347 | 11,682 | ||||||
|
|
|
|
|
|||||
| Total Current Liabilities |
35,842 | 35,605 | ||||||
| Other liabilities |
3,111 | 3,533 | ||||||
|
|
|
|
|
|||||
| Total Liabilities |
38,953 | 39,138 | ||||||
| Stockholders’ Equity |
||||||||
| Class A common stock |
11 | 11 | ||||||
| Class B common stock |
7 | 7 | ||||||
| Additional paid-in capital |
590,962 | 567,709 | ||||||
| Accumulated deficit |
(547,720 | ) | (515,281 | ) | ||||
| Accumulated other comprehensive income |
68 | 31 | ||||||
|
|
|
|
|
|||||
| Total Stockholders’ Equity Excluding Noncontrolling Interests |
43,328 | 52,477 | ||||||
| Noncontrolling interests |
24,478 | 33,129 | ||||||
|
|
|
|
|
|||||
| Total Stockholders’ Equity |
67,806 | 85,606 | ||||||
|
|
|
|
|
|||||
| Total Liabilities and Stockholders’ Equity |
$ | 106,759 | $ | 124,744 | ||||
|
|
|
|
|
|||||
|
|
Q3 Earnings Release 2024 | 13 |
CONDENSED CONSOLIDATED STATEMENTS
OF CASH FLOWS (Unaudited)
(in thousands)
| Nine Months Ended September 30, |
||||||||
| 2024 | 2023 | |||||||
| Cash Flows From Operating Activities |
||||||||
| Net Loss |
$ | (51,371 | ) | $ | (58,429 | ) | ||
| Adjustments to reconcile net loss to net cash used in operating activities: |
||||||||
| Depreciation & amortization |
5,137 | 4,609 | ||||||
| Amortization of intangibles |
460 | 454 | ||||||
| Unrealized loss on derivatives, net |
— | 13,385 | ||||||
| Non-cash stock-based compensation expense |
32,238 | 32,802 | ||||||
| Warrant and earnout transaction costs paid |
— | 567 | ||||||
| Other changes in operating assets and liabilities: |
||||||||
| Decrease in accounts receivable, net |
7,974 | 3,359 | ||||||
| Increase in other current assets |
(893 | ) | (646 | ) | ||||
| Decrease in other assets |
1,598 | 28 | ||||||
| Increase in accounts payable |
3,084 | 4,195 | ||||||
| Decrease in deferred revenue |
(4,793 | ) | (6,890 | ) | ||||
| Increase in other current liabilities |
2,577 | 5,485 | ||||||
| Decrease in other liabilities |
(299 | ) | (1,434 | ) | ||||
|
|
|
|
|
|||||
| Net Cash Provided By Operating Activities |
(4,288 | ) | (2,515 | ) | ||||
| Cash Flows From Investing Activities |
||||||||
| Capital expenditures |
(5,700 | ) | (3,923 | ) | ||||
|
|
|
|
|
|||||
| Net Cash Used In Investing Activities |
(5,700 | ) | (3,923 | ) | ||||
| Cash Flows From Financing Activities |
||||||||
| Payments of warrant and earnout transaction costs |
— | (567 | ) | |||||
|
|
|
|
|
|||||
| Net Cash Used In Financing Activities |
— | (567 | ) | |||||
| Effect of Exchange Rate Change on Cash, Cash Equivalents, and Restricted Cash |
(18 | ) | 5 | |||||
|
|
|
|
|
|||||
| Net Decrease in Cash, Cash Equivalents, and Restricted Cash |
(10,006 | ) | (7,000 | ) | ||||
| Cash, Cash equivalents, and Restricted Cash, Beginning of Year |
75,140 | 91,547 | ||||||
|
|
|
|
|
|||||
| Cash, Cash Equivalents, and Restricted Cash, End of Period |
$ | 65,134 | $ | 84,547 | ||||
|
|
|
|
|
|||||
| Supplemental Cash Flow Information |
||||||||
| Non-cash stock-based compensation included in capitalized internal use software |
$ | 1,275 | $ | 1,815 | ||||
| Purchase of fixed assets included in accounts payable |
— | 22 | ||||||
|
|
Q3 Earnings Release 2024 | 14 |
RECONCILIATION OF GAAP TO
NON-GAAP SALES AND MARKETING EXPENSES (Unaudited)
(in thousands)
| Three Months Ended September 30, |
Nine Months Ended September 30, |
|||||||||||||||
| 2024 | 2023 | 2024 | 2023 | |||||||||||||
| Sales and marketing expenses |
$ | 20,315 | $ | 19,233 | $ | 53,244 | $ | 49,652 | ||||||||
| Less: |
||||||||||||||||
| Non-cash stock-based compensation expense |
556 | 695 | 1,729 | 2,224 | ||||||||||||
|
|
|
|
|
|
|
|
|
|||||||||
| Non-GAAP sales and marketing expenses |
$ | 19,759 | $ | 18,538 | $ | 51,515 | $ | 47,428 | ||||||||
|
|
|
|
|
|
|
|
|
|||||||||
RECONCILIATION OF GAAP TO
NON-GAAP GENERAL AND ADMINISTRATIVE EXPENSES (Unaudited)
(in thousands)
| Three Months Ended September 30, |
Nine Months Ended September 30, |
|||||||||||||||
| 2024 | 2023 | 2024 | 2023 | |||||||||||||
| General and administrative expenses |
$ | 31,862 | $ | 35,508 | $ | 97,017 | $ | 94,921 | ||||||||
| Less: |
||||||||||||||||
| Non-cash stock-based compensation expense |
9,256 | 10,927 | 30,509 | 30,578 | ||||||||||||
| Transaction costs |
— | 1,940 | — | 1,940 | ||||||||||||
| Restructuring costs |
— | 841 | — | 841 | ||||||||||||
| Provision for legal settlement |
— | 1,250 | — | 1,250 | ||||||||||||
|
|
|
|
|
|
|
|
|
|||||||||
| Non-GAAP general and administrative expenses |
$ | 22,606 | $ | 20,550 | $ | 66,508 | $ | 60,312 | ||||||||
|
|
|
|
|
|
|
|
|
|||||||||
RECONCILIATION OF GAAP NET LOSS TO
NON-GAAP ADJUSTED EBITDA (LOSS) (Unaudited)
(in thousands)
| Three Months Ended September 30, |
Nine Months Ended September 30, |
|||||||||||||||
| 2024 | 2023 | 2024 | 2023 | |||||||||||||
| Net Loss |
$ | (24,958 | ) | $ | (20,626 | ) | $ | (51,371 | ) | $ | (58,429 | ) | ||||
| Add: |
||||||||||||||||
| Interest income |
(768 | ) | (844 | ) | (2,533 | ) | (2,460 | ) | ||||||||
| Income taxes |
29 | 21 | 90 | 97 | ||||||||||||
| Depreciation and amortization |
1,934 | 1,670 | 5,597 | 5,063 | ||||||||||||
| Non-cash stock-based compensation expense |
9,812 | 11,622 | 32,238 | 32,802 | ||||||||||||
| Unrealized (gain) loss on derivatives, net |
— | (4,099 | ) | — | 13,385 | |||||||||||
| Transaction costs |
— | 1,940 | — | 1,940 | ||||||||||||
| Restructuring costs |
— | 841 | — | 841 | ||||||||||||
| Provision for legal settlement |
— | 1,250 | — | 1,250 | ||||||||||||
|
|
|
|
|
|
|
|
|
|||||||||
| Adjusted EBITDA Loss |
$ | (13,951 | ) | $ | (8,225 | ) | $ | (15,979 | ) | $ | (5,511 | ) | ||||
|
|
|
|
|
|
|
|
|
|||||||||
RECONCILIATION OF GAAP NET LOSS TO
NON-GAAP ADJUSTED NET LOSS (Unaudited)
(in thousands)
| Three Months Ended September 30, |
Nine Months Ended September 30, |
|||||||||||||||
| 2024 | 2023 | 2024 | 2023 | |||||||||||||
| Net Loss |
$ | (24,958 | ) | $ | (20,626 | ) | $ | (51,371 | ) | $ | (58,429 | ) | ||||
| Add: |
||||||||||||||||
| Non-cash stock-based compensation expense |
9,812 | 11,622 | 32,238 | 32,802 | ||||||||||||
| Unrealized (gain) loss on derivatives, net |
— | (4,099 | ) | — | 13,385 | |||||||||||
| Transaction costs |
— | 1,940 | — | 1,940 | ||||||||||||
| Restructuring costs |
— | 841 | — | 841 | ||||||||||||
| Provision for legal settlement |
— | 1,250 | — | 1,250 | ||||||||||||
|
|
|
|
|
|
|
|
|
|||||||||
| Adjusted Net Loss |
$ | (15,146 | ) | $ | (9,072 | ) | $ | (19,133 | ) | $ | (8,211 | ) | ||||
|
|
|
|
|
|
|
|
|
|||||||||
|
|
Q3 Earnings Release 2024 | 15 |
CAPITALIZATION RECONCILIATION (Unaudited)
(in thousands)
| September 30, 2024 |
||||
| Class A Common Stock |
114,972 | |||
| Combined Interests that can be converted into shares of Class A Common Stock |
64,943 | |||
|
|
|
|||
| Total outstanding share count |
179,915 | |||
|
|
|
|||
|
|
Q3 Earnings Release 2024 | 16 |
We monitor the following key operating metrics to evaluate the growth of our business, measure our performance, identify trends affecting our business, formulate business plans, and make strategic decisions.
Active Members is defined as the number of Learners with a paid active Learning Membership as of the date presented. Variations in the number of Active Members are due to changes in demand for our solutions, seasonality, testing schedules, and the launch of new Learning Membership options. As a result, Active Members is a key indicator of our ability to attract, engage and retain Learners. Active Members exclude EduNation Limited, a company incorporated in England and Wales (“First Tutors UK”) and our Institutional business. Active Experts include our Institutional offerings, but excludes First Tutors UK.
Active Experts is defined as the number of Experts who have instructed one or more sessions in a given period. Our Active Expert count for the three and nine months ended September 30, 2024 was primarily driven by higher Institutional active experts when compared to the prior year period, which reflects the continued scaling of our Institutional business.
KEY OPERATING METRICS
| Active Members in thousands | September 30, 2024 |
June 30, 2024 |
March 31, 2024 |
December 31, 2023 |
September 30, 2023 |
June 30, 2023 |
||||||||||||||||||
| Active Members |
39.7 | 35.5 | 46.1 | 40.7 | 39.5 | 31.0 | ||||||||||||||||||
| YoY change |
1 | % | 15 | % | 40 | % | 101 | % | 250 | % | 1,450 | % | ||||||||||||
| Three Months Ended September 30, |
Change | Nine Months Ended September 30, |
Change | |||||||||||||||||||||
| Active Experts in thousands | 2024 | 2023 | % | 2024 | 2023 | % | ||||||||||||||||||
| Active Experts |
9.5 | 9.0 | 6 | % | 17.3 | 14.1 | 23 | % | ||||||||||||||||
|
|
Q3 Earnings Release 2024 | 17 |
Key Performance Metrics and Non-GAAP Financial Measures
This earnings release includes non-GAAP financial measures for non-GAAP sales and marketing expenses, non-GAAP general and administrative expenses, non-GAAP adjusted net earnings (loss) and non-GAAP adjusted EBITDA (loss).
Non-GAAP sales and marketing expenses exclude non-cash stock compensation expenses.
Non-GAAP general and administrative expenses exclude non-cash stock compensation expenses, transaction costs, restructuring costs, and a provision for legal settlement.
Non-GAAP adjusted net earnings (loss) is defined as net income or net loss, as applicable, excluding non-cash stock- based compensation expenses, transaction costs, restructuring costs, a provision for legal settlement, and unrealized (loss) gain on mark-to-market derivative financial instruments.
Non-GAAP adjusted EBITDA (loss) is defined as net income or net loss, as applicable, before net interest income (expense), taxes, depreciation and amortization expense, non-cash stock-based compensation expenses, transaction costs, restructuring costs, a provision for legal settlement, and unrealized (loss) gain on mark-to-market derivative financial instruments.
Sales and marketing expenses consist of salaries and benefits for our employees engaged in our consultative sales process. General and administrative expenses are recorded in the period in which they are incurred and include salaries, benefits, and non-cash stock-based compensation expense for certain employees as well as support services, product development, finance, legal, human resources, other administrative employees, information technology expenses, outside services, legal and accounting services, depreciation expense, and other costs required to support our operations.
Net loss per share is computed by dividing net loss by the weighted average number of shares outstanding during the period as calculated using the treasury stock method.
Non-GAAP measures are in addition, and not a substitute for or superior to measures of financial performance prepared in accordance with GAAP and should not be considered as an alternative to sales, net income, operating income, cash flows from operations, or any other performance measures derived in accordance with GAAP. Other companies may calculate these non-GAAP financial measures differently, and therefore such financial measures may not be directly comparable to similarly titled measures of other companies. The Company believes that these non-GAAP measures of financial results provide useful supplemental information. The Company’s management uses these non-GAAP measures to evaluate the Company’s operating performance, trends, and to compare it against the performance of other companies. There are, however, a number of limitations related to the use of these non-GAAP measures and their nearest GAAP equivalents. See the tables above regarding reconciliation of non-GAAP measures to the most directly comparable GAAP measures.
Active Members is defined as the number of Learners with an active paid Learning Membership as of the date presented. Variations in the number of Active Members are due to changes in demand for our solutions, seasonality, testing schedules, the extension of Learning Memberships to additional Consumer audiences, and the launch of new Learning Membership options. As a result, Active Members is a key indicator of our ability to attract, engage and retain Learners. Active Members exclude EduNation Limited, a company incorporated in England and Wales (“First Tutors UK”) and our Institutional offerings. Active Experts include our Institutional offerings, but exclude First Tutors UK.
Annualized run-rate is defined as the number of Active Members at the end of the period multiplied by average revenue per Learning Membership per month multiplied by twelve months. This recurring revenue customer base provides us with increased forecasting visibility into future periods.
Active Experts is defined as the number of Experts who have instructed one or more sessions in a given period.
Bookings represent contracted amounts during the period for Varsity Tutors for Schools.
|
|
Q3 Earnings Release 2024 | 18 |
Management and our board of directors use these metrics as supplemental measures of our performance that are not required by or presented in accordance with GAAP because they assist us in comparing our operating performance on a consistent basis, as they remove the impact of items not directly resulting from our core operations. We also use these metrics for planning purposes, including the preparation of our internal annual operating budget and financial projections, to evaluate the performance and effectiveness of our strategic initiatives and to evaluate our capacity to expand our business and the capital expenditures required for that expansion.
Non-GAAP sales and marketing expenses, non-GAAP general and administrative expenses, non-GAAP adjusted EBITDA (loss), and non-GAAP adjusted net income or loss should not be considered in isolation, as an alternative to, or superior to net earnings (loss), revenue, cash flows or other performance measure derived in accordance with GAAP. We believe these metrics are frequently used by analysts, investors, and other interested parties to evaluate companies in our industry. Management believes that the presentation of non-GAAP metrics is an appropriate measure of operating performance because they eliminate the impact of expenses that do not relate directly to the performance of our underlying business. These non-GAAP metrics should not be construed as an implication that our future results will be unaffected by unusual or other items. We are not able to provide a reconciliation of non-GAAP adjusted EBITDA (loss) guidance for future periods to net loss, the comparable GAAP measure, because certain items that are excluded from non-GAAP adjusted EBITDA (loss) cannot be reasonably predicted or are not in our control. In particular, we are unable to forecast the timing or magnitude for gains or losses on mark-to-market derivative financial instruments, or stock-based compensation without unreasonable efforts, and these items could significantly impact, either individually or in the aggregate, net income or loss in the future. See the tables above regarding reconciliations of these non-GAAP measures to the most directly comparable GAAP measures for historical periods.
Forward-Looking Statements
All statements contained herein that do not relate to matters of historical fact should be considered forward-looking statements, including, without limitation, statements regarding our strategic priorities, including those related to enhancing the Learning Membership experience; continued improvements in sales and marketing leverage; gross margin and operating leverage; the growth of our Institutional business; changes to our marketplace infrastructure systems; simplifying our operations model while growing our business; the sufficiency of our cash to fund future operations; and our anticipated fourth quarter and full year 2024 outlook; as well as statements that include the words “expect,” “plan,” “believe,” “project,” and “may,” and similar statements of a future or forward-looking nature.
The forward-looking statements made herein relate only to events as of the date on which the statements are made. We undertake no obligation to update any forward-looking statements to reflect events or circumstances after the date of this press release or to reflect new information or the occurrence of unanticipated events, except as required by law. We may not actually achieve the plans, intentions, or expectations disclosed in our forward-looking statements, and you should not place undue reliance on our forward-looking statements.
There are a significant number of factors that could cause actual results to differ materially from statements made herein or in connection herewith, including but not limited to, our limited operating history, which makes it difficult to predict our future financial and operating results; our history of net losses; risks associated with our ability to acquire and retain customers, operate, and scale up our Consumer and Institutional businesses; risks associated with our intellectual property, including claims that we infringe on a third-party’s intellectual property rights; risks associated with our classification of some individuals and entities we contract with as independent contractors; risks associated with the liquidity and trading of our securities; risks associated with payments that we may be required to make under the tax receivable agreement; litigation, regulatory and reputational risks arising from the fact that many of our Learners are minors; changes in applicable law or regulation; the possibility of cyber-related incidents and their related impacts on our business and results of operations; risks associated with the development and use of artificial intelligence and related regulatory uncertainty; the possibility that we may be adversely affected by other economic, business, and/or competitive factors; and risks associated with managing our rapid growth.
Our actual results could differ materially from those stated or implied in forward-looking statements due to a number of factors, including but not limited to, risks detailed in our filings with the SEC, including our Annual Report on Form 10-K filed on February 27, 2024, as well as other filings that we may make from time to time with the SEC.
|
|
Q3 Earnings Release 2024 | 19 |