
Q3 | 2025 Earnings Release LIVE + AItm Live Learning Platform 2.0
Q3 | 2025 Earnings Release LIVE + AItm Live Learning Platform 2.0
A Note to
Our Shareholders
Dear Shareholders,
As we close out the third quarter of 2025, I want to start by acknowledging the challenges we’ve faced this back-to-school season. Our starting point heading into the fourth quarter was behind what we were targeting, with delays in key product launches delaying our anticipated inflection in growth and profitability by a quarter. These setbacks and operational challenges, stemmed from the growing strain on our underlying systems, which were built over years to support an expanding array of products, from live scheduled video tutoring to instant on-demand video tutoring, to AI tools and diagnostics, spanning both Consumer and Institutional offerings. As we’ve scaled, the sprawl of these systems created technical debt that slowed our product velocity, leading to slower timelines and launches. This new school year, several key initiatives were impacted as product launches were delayed, which culminated in us not fully capitalizing on back-to-school peak. These disparate technology systems led to a disconnected experience across product modalities, including tutoring, livestream classes, AI tools, and practice tests and diagnostics, each in a different user interface.
This slowdown year-to-date, and product delays in the back-to-school period in particular, prompted a period of deep introspection for me. This summer, we started a few new vendor relationships with early stage enterprise software startups. Their ability to build new features was 10x faster than what I had witnessed before. With brand new codebases, defaulting to AI coding vs just AI assisted coding, and no preconceived notions of what was possible or how to develop software, they were able to build at 10x the pace of what I’d seen before. That experience inspired me to rethink every aspect of how we build products and software. I dove into the root technical issues myself, working closely with a small group to rethink our platform from the ground up in this AI-native era. In effect, it required replatforming my own skill set and learning to build software natively with AI. It was a transition from a nontechnical founder to a technical founder, made possible with and thanks to extensive AI augmentation. Our platform is now undergoing that same replatforming and metamorphosis.
What I realized is that to truly harness AI’s potential, enhancing every aspect of live human tutoring, we needed to shed legacy constraints entirely. I’ve personally led a small group that worked day and night to rebuild key aspects of our core infrastructure from scratch using AI-assisted software development, preserving essential business logic and data while migrating to modern, decoupled systems. As we proved out this new way of working and building, we enlisted our entire product and engineering organization and have made significant progress. We are now targeting having nearly 100% of our traffic on new codebases written with AI by the end of November, and what is really exciting is that it is already unlocking customer-facing innovation at a pace we haven’t seen before. And by year-end, we anticipate our back end legacy systems will be fully decoupled, allowing us to integrate AI more deeply across the platform and launch new interactive, context-aware experiences with a fraction of the effort.
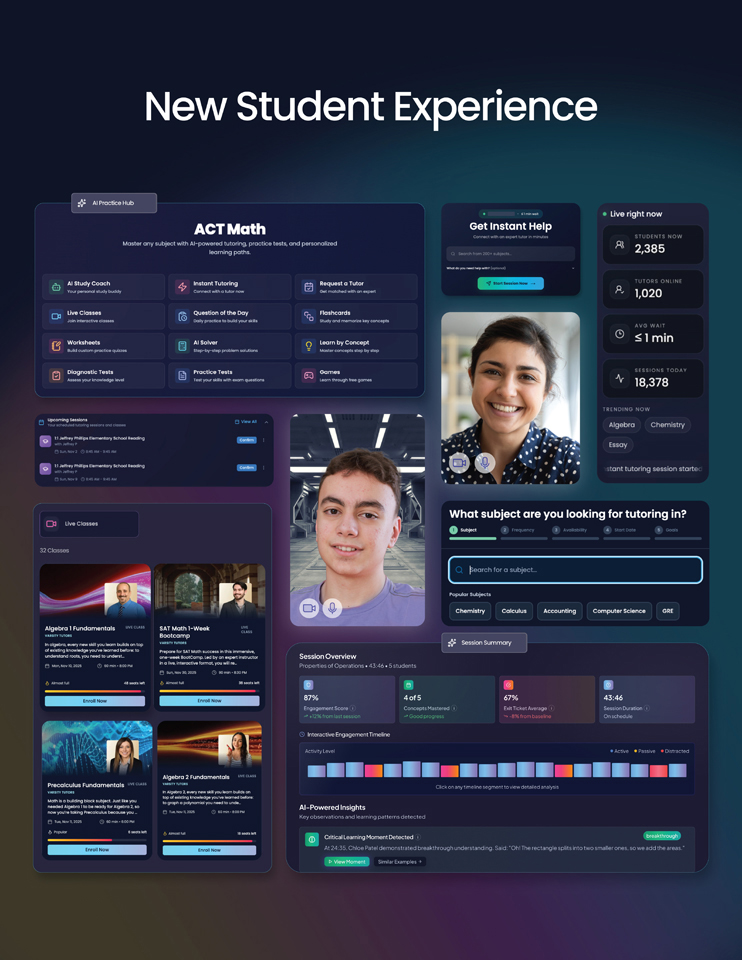
This reinvention isn’t abstract; it’s already delivering tangible progress. For instance, a 2.0 version of our flagship Live Learning Platform video tutoring product launched with a rollout from September to October 2025, achieving a reduction of approximately 50% in audio/video error rates and nearly 40% cost savings per session, along with positive tutor feedback on usability and quality. We’re also rolling out brand new student and tutor experiences, with October 2025 launches of entirely new and unified experiences that bring all products together into a cohesive interface. Products like the integrated Practice Hub and 250+ subjects’ worth of content and tools, which we shared in the last Shareholder Letter, are now integrated into both the student experience and our Live Learning Platform. This enables content and AI tools to enhance the entire customer journey and fully leverage the personalization and enhancements that AI makes possible. Other AI-driven wins included better site conversion on our new homepage and a significant drop in tutor replacement rate via new AI vetting of tutors with interactive conversational AI interviews that have automated 80% of tutor applicant review, boosting new-tutor quality and the quality of matches which we believe will lead to meaningful retention improvements.

|
Q3 Earnings Release 2025 | 2 |
We’re collapsing disparate experiences into a unified, cohesive platform that supports discovery across multiple subjects, modalities, and academic years. For example, our new consumer dashboard integrates AI Practice Hub directly into the core experience, making it easier for learners to explore live classes, diagnostics, and self-study tools. We’ve seen early indicators that this drives higher engagement; historically, when users adopt multi-subject or multimodal learning, retention improves meaningfully. Since launch, we’ve seen more than 50% growth in the consumption of practice content, with emerging positive trends on repeat user engagement. With the new multi-format, multi-subject, integrated experience, we believe we can extend the retention improvements we are seeing in the first month for new customers, which is up meaningfully year-over-year, into later stages of the customer lifecycle.
In the fourth quarter, our focus will extend beyond first month activation and onboarding, and will focus extensively on new product and new subject discovery for customers. As one small example of an improvement that is easy now that was hard in the past, we look forward to launching our first version of gamification, which we believe will add a level of user delight we have not had before.
Our Live+AI™ approach remains central to how we are enhancing the overall experience, where human tutors augmented by AI create outcomes neither could achieve alone. This was underscored by a July 2025 Carnegie Mellon study showing that human-AI tutoring drives 0.36 grade levels more growth over one school year than AI-only, with benefits amplifying as time on task increases. That insight is a key reason why the idea of AI-enhanced tutoring was elevated to the highest levels of educational policy with the White House’s AI Education efforts, an effort that kicked off in September at a White House event I was fortunate to attend.
Our partnership with Carnegie Mellon University Master of Educational Technology and Applied Learning Sciences (METALS) - program has been transformative, yielding cutting-edge research and AI innovations poised to redefine online tutoring. By applying advanced discourse analysis, large language models (LLMs), and other AI techniques to session transcripts and video feeds, we’ve uncovered key insights into effective tutoring dynamics - demonstrating the clear advantages of one-on-one interactions over traditional methods. That has allowed us to identify actionable strategies to enhance session quality and mitigate issues like inconsistent human performance. We’re now operationalizing these findings to optimize experiences before, during, and after sessions: delivering tailored insights to students and tutors post-session, paired with suggested agentic actions to maximize their impact. We anticipate these enhancements will drive substantial gains in retention over the coming months and years.
To execute this vision, we’ve strengthened our operational foundation. In August, we appointed a new Chief Operating Officer with proven experience scaling operations and concurrently hired 13 director- and senior-director-level leaders across key functions. This has centralized control, up-leveled our talent across all operational leadership roles in the top several layers of the company, and accelerated process improvements, from software-driven efficiencies to better demand forecasting. As one such example, newly enabled AI capabilities in sales are playing a key role here: with real-time AI heads-up displays, agent prompting, and call scoring having lifted conversion by more than 10%. These improvements have the potential to decrease overall sales and customer acquisition costs in the near future.
On the Institutional side, our efforts to align our products with established intervention frameworks that schools rely upon like MTSS and RTI, is resonating. We believe our new end-to-end Varsity Tutors for Schools experience that launches toward the end of the quarter will better align to how schools operate, make it easier for school leaders to prescribe interventions and act upon data, and ultimately be a more sellable product for district wide sales.
|
|
Q3 Earnings Release 2025 | 3 |
In the third quarter, we continued on our path to profitability, delivering a 960 basis point improvement in non-GAAP adjusted EBITDA margin year-over-year, driven by improved operating efficiency and cost reductions across every P&L line item. AI-enabled productivity improvements, coupled with new software-driven processes, are substantially improving our operations and allowing us to do more with less. For example, our headcount was reduced by approximately 27% year-over-year as compared to September 30, 2024. Recent advances in our application of AI made possible by a new and more flexible platform provide us with the opportunity to move faster and drive further levels of productivity and operating leverage, while improving the customer experience as we scale our business.
Thank you for your continued support. We look forward to showing you in the quarters ahead what we’ll be able to do with a new modern tech stack, an evolved approach to product development, and liberated from tech debt.

CHUCK COHN
Founder, Chairman & CEO
|
|
Q3 Earnings Release 2025 | 4 |

Live Learning Platform 2.0
|
|
Q3 Earnings Release 2025 | 5 |
New Student Experience
|
|
Q3 Earnings Release 2025 | 6 |
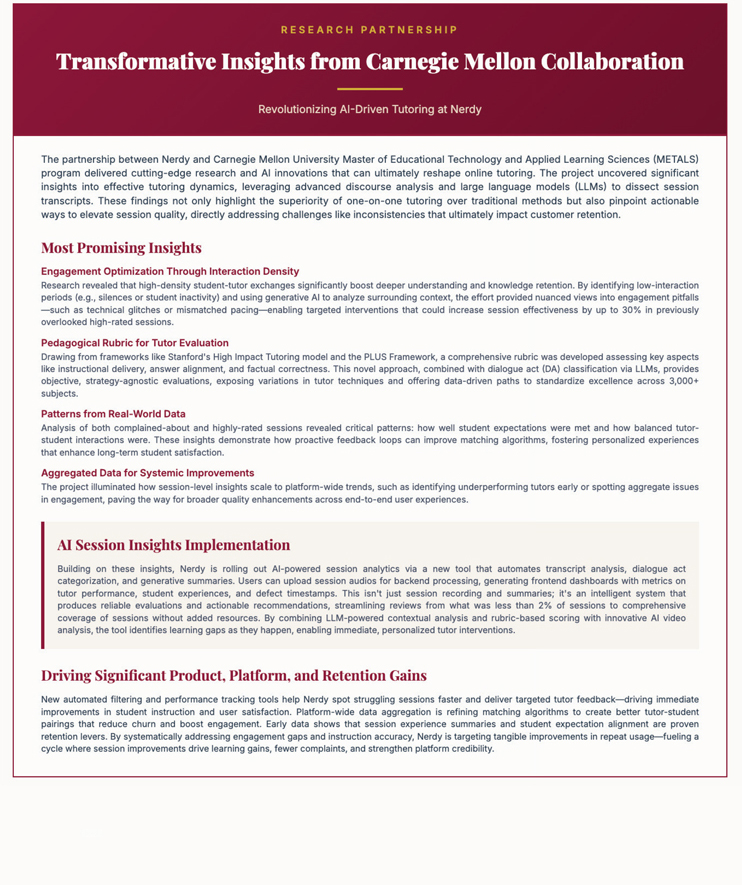
RESEARCH PARTNERSHIP Transformative Insights from Carnegie Mellon Collaboration Revolutionizing Al-Driven Tutoring at Nerdy The partnership between Nerdy and Carnegie Mellon University Master of Educational Technology and Applied Learning Sciences (METALS) program delivered cutting-edge research and Al innovations that can ultimately reshape online tutoring. The project uncovered significant insights into effective tutoring dynamics, leveraging advanced discourse analysis and large language models (LLMs) to dissect session transcripts. These findings not only highlight the superiority of one-on-one tutoring over traditional methods but also pinpoint actionable ways to elevate session quality, directly addressing challenges like inconsistencies that ultimately impact customer retention. Most Promising Insights Engagement Optimization Through Interaction Density Research revealed that high-density student-tutor exchanges significantly boost deeper understanding and knowledge retention. By identifying low-interaction periods (e.g., silences or student inactivity) and using generative Al to analyze surrounding context, the effort provided nuanced views into engagement pitfalls -such as technical glitches or mismatched pacing-enabling targeted interventions that could increase session effectiveness by up to 30% in previously overlooked high-rated sessions. Pedagogical Rubric for Tutor Evaluation Drawing from frameworks like Stanford’s High Impact Tutoring model and the PLUS Framework, a comprehensive rubric was developed assessing key aspects like instructional delivery, answer alignment, and factual correctness. This novel approach, combined with dialogue act (DA) classification via LLMs, provides objective, strategy-agnostic evaluations, exposing variations in tutor techniques and offering data-driven paths to standardize excellence across 3,000+ subjects. Patterns from Real-World Data Analysis of both complained-about and highly-rated sessions revealed critical patterns: how well student expectations were met and how balanced tutor student interactions were. These insights demonstrate how proactive feedback loops can improve matching algorithms, fostering personalized experiences that enhance long-term student satisfaction. Aggregated Data for Systemic Improvements The project illuminated how session-level insights scale to platform-wide trends, such as identifying underperforming tutors early or spotting aggregate issues in engagement, paving the way for broader quality enhancements across end-to-end user experiences. AI Session Insights Implementation Building on these insights, Nerdy is rolling out Al-powered session analytics via a new tool that automates transcript analysis, dialogue act categorization, and generative summaries. Users can upload session audios for backend processing, generating frontend dashboards with metrics on tutor performance, student experiences, and defect timestamps. This isn’t just session recording and summaries; it’s an intelligent system that produces reliable evaluations and actionable recommendations, streamlining reviews from what was less than 2% of sessions to comprehensive coverage of sessions without added resources. By combining LLM-powered contextual analysis and rubric-based scoring with innovative Al video analysis, the tool identifies learning gaps as they happen, enabling immediate, personalized tutor interventions. Driving Significant Product, Platform, and Retention Gains New automated filtering and performance tracking tools help Nerdy spot struggling sessions faster and deliver targeted tutor feedback-driving immediate improvements in student instruction and user satisfaction. Platform-wide data aggregation is refining matching algorithms to create better tutor-student pairings that reduce churn and boost engagement. Early data shows that session experience summaries and student expectation alignment are proven retention levers. By systematically addressing engagement gaps and instruction accuracy, Nerdy is targeting tangible improvements in repeat usage-fueling a cycle where session improvements drive learning gains, fewer complaints, and strengthen platform credibility.
|
|
Q3 Earnings Release 2025 | 7 |
Third Quarter Financial Highlights
| • | Revenue In Line with Expectations – In the third quarter, Nerdy delivered revenue of $37.0 million, within our guidance range of $37 to $40 million, which represented a decrease of 1% year-over-year from $37.5 million during the same period in 2024. Revenue decreased slightly when compared to the prior year period due to lower Institutional revenue, partially offset by higher Consumer revenue. Within Consumer Revenue, Learning Membership revenue increased 5% year-over-year, which was partially offset by a specific state-funded Consumer revenue program ($0.9 million for the three months ended September 30, 2024) that did not recur in 2025. The current year period was positively impacted by higher ARPM in our Consumer business as a result of a mix shift to higher frequency Learning Memberships and price increases enacted during the first quarter of 2025, coupled with higher retention in newer cohorts due primarily to improvements in the user experience and new Expert incentives. |
| • | Consumer Learning Memberships – Third quarter Learning Membership revenue increased 5% year-over-year. Revenue recognized in the third quarter from Learning Memberships was $33.0 million and represented 89% of total Company revenue. As of September 30, 2025, there were 34.3 thousand Active Members, and ARPM was $374, which represented a 24% increase year-over-year. Our Active Member count as of September 30, 2025 was lower when compared to September 30, 2024 primarily due to operational challenges that we are actively addressing in part through the appointment of a new Chief Operating Officer to drive enhanced operational execution and systematic process improvements. We are also rolling out new student and Expert platform user experiences in the fourth quarter that we believe will re-accelerate growth. |
| • | Institutional Strategy – Institutional delivered revenue of $3.7 million and represented 10% of total Company revenue during the third quarter. Varsity Tutors for Schools executed 44 contracts, yielding quarterly bookings of $6.8 million, and represented a decrease of 20% year-over-year. In our Institutional business, revenues and bookings continue to be impacted by federal and state funding delays and the related impact to high-dosage tutoring contracting and program start dates. We believe our new end-to-end Varsity Tutors for Schools experience that launches toward the end of the quarter will better align to how schools operate, make it easier for school leaders to prescribe interventions and act upon data, and ultimately be a more sellable product for district wide sales. |
| • | Gross Margin Continues to Expand – Gross margin was 62.9% for the three months ended September 30, 2025, compared to a gross margin of 70.5% during the comparable period in 2024. The decrease in gross margin was primarily due to investments in Expert pay and incentives. Following the adoption of these investments, we continue to see faster time to the first session, more sessions in the first 30 days, lower tutor replacement rates, and higher retention – all of which should continue to strengthen our business over the long-term. For the second consecutive quarter, gross margin improved sequentially quarter-over-quarter as margins increased approximately 140 basis points when compared to the second quarter of 2025. This gross margin expansion was primarily a result of price increases for new Consumer customers enacted during the first quarter of 2025. We expect sequential quarterly gross margin improvement to continue into the fourth quarter of 2025 as the mix of our Consumer revenue continues to shift into higher frequency and higher priced Learning Memberships, and as we are able to better optimize tutoring incentives now made possible due to improvements in the new tutor experience platform. |
| • | Adjusted EBITDA Loss Beats Guidance Range – Net loss was $18.7 million in the third quarter versus a net loss of $25.0 million during the same period in 2024. Excluding non-cash stock compensation expenses, which were treated as an adjustment for non-GAAP measures, non-GAAP adjusted net loss was $11.9 million for the third quarter of 2025 compared to a non-GAAP adjusted net loss of $15.1 million in the third quarter of 2024. We reported a non-GAAP adjusted EBITDA loss of $10.2 million for the third quarter of 2025, beating our guidance of negative $11.0 million to negative $13.0 million. This compares to a non-GAAP adjusted EBITDA loss of $14.0 million in the same period one year ago. Non-GAAP adjusted EBITDA outperformance relative to guidance and prior year was driven by across the board P&L improvements via lower marketing spend, variable staffing costs, and strong G&A cost control. |
|
|
Q3 Earnings Release 2025 | 8 |
| • | Term Loan Provides Enhanced Liquidity – As of September 30, 2025, we had $32.7 million of cash on our balance sheet. On November 3, 2025, we entered into a loan agreement that provides for up to two tranches of term loans in an aggregate principal amount of up to $50 million (the “Term Loan”), which enhances our financial flexibility as we work to become profitable on a non-GAAP adjusted EBITDA basis in the near-term while avoiding equity dilution. Also on November 3, 2025, we borrowed $20 million under the Term Loan. The Term Loan matures in 2029. For the first 36 months, monthly payments under the Term Loan will be interest only. For the remaining 12 months, monthly payments under the Term Loan will consist of equal payments of principal and interest until maturity. The Term Loan contains affirmative and negative covenants customary for agreements of this type and the delayed-draw feature lets us access funds as needed, while minimizing carrying costs. These proceeds may be used for working capital and other general corporate purposes as permitted by the Term Loan. With our cash on hand and the funding available under our Term Loan, we believe we have ample liquidity to fund the business and pursue growth initiatives. |
See page 17 for reconciliations of non-GAAP measures to the most directly comparable GAAP financial measure.
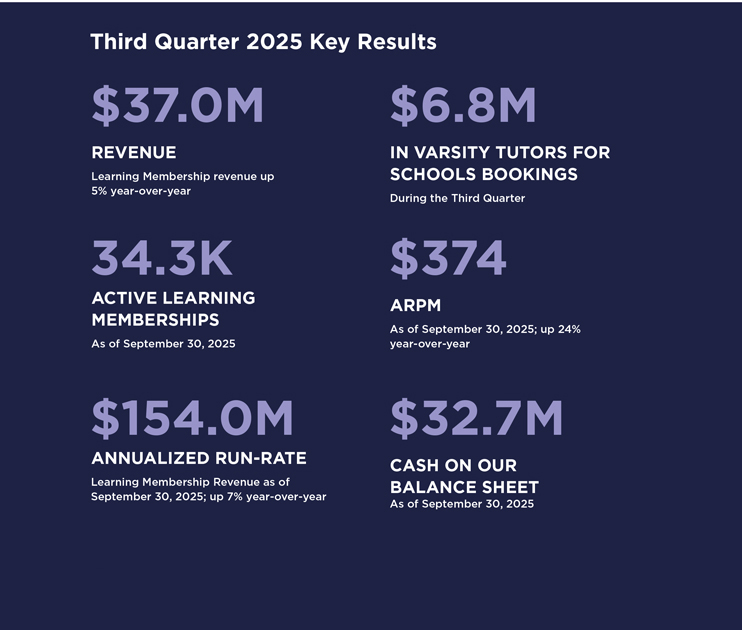
Normal;Third Quarter 2025 Key Results $37.0M $6.8M 34.3K REVENUE IN VARSITY TUTORS FOR SCHOOLS BOOKINGS ACTIVE LEARNING MEMBERSHIPS Learning Membership revenue up 5% year-over-year During the Third Quarter As of September 30, 2025 $374 $154.0M ARPM ANNUALIZED RUN-RATE As of September 30, 2025; up 24% year-over-year Learning Membership Revenue as of September 30, 2025; up 7% year-over-year $32.7M CASH ON OUR BALANCE SHEET As of September 30, 2025
|
|
Q3 Earnings Release 2025 | 9 |
Fourth Quarter and Full Year 2025 Outlook
Fourth quarter revenue guidance reflects higher sequential quarterly revenues in both our Consumer and Institutional businesses when K-12 schools and universities are in session.
For the fourth quarter and full year, we expect Consumer revenue will be impacted by the decline in the number of Active Members, partially offset by year-over-year improvements in ARPM (due to the mix shift to higher frequency learning memberships coupled with price increases) and retention (due to improvements to the user experience and investments in tutor pay rates and incentives). In our Institutional business, revenues are impacted by federal and state funding delays and the related impact to high-dosage tutoring contracting and program start dates.
For the fourth quarter and full year, non-GAAP adjusted EBITDA improvements year-over-year reflect Consumer and Institutional marketing efficiency improvements coupled with the benefits from AI-enabled productivity and operating leverage improvements, and diligent G&A cost control. Offsetting these improvements are investments in Expert pay rates and incentives, which are leading to higher engagement and retention.
We expect to end the year with $45-48 million in cash, inclusive of $20 million funded under the new Term Loan. We believe we have ample liquidity to fund the business and pursue growth initiatives.
Revenue Guidance
| • | For the fourth quarter of 2025, we expect revenue in the range of $45-47 million. |
| • | For the full year, we expect revenue in the range of $175-177 million. |
Adjusted EBITDA Guidance
| • | For the fourth quarter of 2025, we expect a non-GAAP adjusted EBITDA loss in the range of $2 million to breakeven. |
| • | For the full year, we expect a non-GAAP adjusted EBITDA loss in the range of $19-21 million. |
|
|
Q3 Earnings Release 2025 | 10 |
Financial Discussion
Revenue
Revenue for the three months ended September 30, 2025 was $37.0 million, a decrease of 1% from $37.5 million during the same period in 2024. Revenue for the nine months ended September 30, 2025 was $129.9 million, a decrease of 9% from $142.2 million during the same period in 2024.
Revenue for the three months ended September 30, 2025 decreased slightly when compared to the prior year period due to lower Institutional revenue, partially offset by higher Consumer revenue. Within Consumer revenue, Learning Membership revenue in the third quarter of 2025 increased 5% year-over-year, which was partially offset by a specific state-funded program ($0.9 million for the three months ended September 30, 2024) that did not recur in 2025.
Revenue for the nine months ended September 30, 2025 decreased when compared to the prior year periods primarily due to lower Institutional revenue and a specific state-funded program ($5.4 million for the nine months ended September 30, 2024) within Consumer revenue that did not recur in 2025. Within Consumer Revenue, Learning Membership revenue for the nine months ended September 30, 2025 increased 1% year-over-year.
Both current year periods were positively impacted by higher ARPM in our Consumer business as a result of a mix shift to higher frequency Learning Memberships and price increases enacted during the first quarter of 2025, coupled with higher retention in newer cohorts primarily due to improvements in the user experience and investments in Expert pay and incentives.
Gross Profit and Gross Margin
Gross profit of $23.3 million for the three months ended September 30, 2025 decreased by $3.2 million or 12% compared to the same period in 2024. Gross profit of $78.8 million for the nine months ended September 30, 2025 decreased by $17.7 million or 18% compared to the same period in 2024. Gross margin was 62.9% and 70.5% for the three months ended September 30, 2025 and 2024, respectively. Gross margin was 60.6% and 67.8% for the nine months ended September 30, 2025 and 2024, respectively.
These decreases in gross margin were primarily due to investments in Expert pay and incentives. Following the adoption of the new incentives, we are seeing faster time to the first session, more sessions in the first 30 days, lower tutor replacement rates, and higher retention. For the second consecutive quarter, gross margin improved sequentially quarter-over-quarter as margins increased approximately 140 basis points when compared to the second quarter of 2025. This gross margin expansion was primarily a result of price increases for new Consumer customers enacted during the first quarter of 2025. We expect sequential quarterly gross margin improvement to continue into the fourth quarter of 2025 as the mix of our Consumer revenue continues to shift into higher frequency and higher priced Learning Memberships, and as we are able to better optimize tutoring incentives now made possible due to improvements in the new tutor experience platform.
Sales and Marketing
Sales and marketing expenses for the three months ended September 30, 2025 on a GAAP basis were $16.6 million, a decrease of $3.7 million from $20.3 million in the same period in 2024. Excluding non-cash stock compensation, sales and marketing expenses for the three months ended September 30, 2025 were $16.2 million, a decrease of $3.5 million compared to $19.7 million in the same period in 2024. Sales and marketing expenses for the nine months ended September 30, 2025 on a GAAP basis were $45.9 million, a decrease of $7.3 million from $53.2 million in the same period in 2024. Excluding non-cash stock compensation and restructuring costs, sales and marketing expenses for the nine months ended September 30, 2025 were $44.7 million, a decrease of $6.8 million compared to $51.5 million in the same period in 2024.
|
|
Q3 Earnings Release 2025 | 11 |
These decreases in sales and marketing expenses were driven by Consumer marketing efficiency gains coupled with the moderation of our investment in the Institutional business. We believe our new end-to-end Varsity Tutors for Schools experience that launches toward the end of the quarter will better align to how schools operate, make it easier for school leaders to prescribe interventions and act upon data, and ultimately be a more sellable product for district wide sales.
Sales and marketing expenses as a percentage of revenue may fluctuate from quarter to quarter based on Learning Membership sales, the size and volume of Institutional contracts, bookings, seasonality, and the timing of our investments in marketing activities.
General and Administrative
General and administrative expenses include compensation for certain employees, support services, product and development expenses intended to support innovation, and other operating expenses. Product and development costs were $10.3 million and $11.3 million during the three months ended September 30, 2025 and 2024, respectively. Product and development costs were $31.7 million and $33.5 million during the nine months ended September 30, 2025 and 2024, respectively. Product and development costs include compensation for employees on our product and engineering teams who are responsible for developing new and improving existing offerings, maintaining our website, improving efficiencies across our organization, and third-party expenses.
General and administrative expenses for the three months ended September 30, 2025 on a GAAP basis were $25.8 million, a decrease of $6.0 million from $31.8 million in the same period in 2024. Excluding non-cash stock compensation expenses, general and administrative expenses for the three months ended September 30, 2025 were $19.3 million, a decrease of $3.3 million compared to $22.6 million in the same period in 2024. General and administrative expenses for the nine months ended September 30, 2025 on a GAAP basis were $80.8 million, a decrease of $16.2 million from $97.0 million in the same period in 2024. Excluding non-cash stock compensation expenses and restructuring costs, general and administrative expenses for the nine months ended September 30, 2025 were $59.4 million, a decrease of $7.1 million compared to $66.5 million in the same period in 2024.
AI-enabled productivity improvements, coupled with new software-driven processes and system implementations, headcount reductions, and other cost reduction efforts, have enabled us to generate operating efficiencies and remove significant costs from the business. Recent advances in our application of AI across the entire tech stack provide us with the opportunity to move faster and drive further levels of productivity and operating leverage, while improving both the customer experience and operational consistency as we scale our business.
Net Loss, Non-GAAP Adjusted Net Loss, and Non-GAAP Adjusted EBITDA (Loss)
Net loss on a GAAP basis was $18.7 million for the three months ended September 30, 2025 versus a net loss of $25.0 million in the same period in 2024. Excluding non-cash stock compensation expenses, non-GAAP adjusted net loss was $11.9 million for the three months ended September 30, 2025, compared to a non-GAAP adjusted net loss of $15.1 million in the same period in 2024. Net loss on a GAAP basis was $46.9 million for the nine months ended September 30, 2025 versus a net loss of $51.4 million in the same period in 2024. Excluding non-cash stock compensation expenses and restructuring costs, non-GAAP adjusted net loss was $24.3 million for the nine months ended September 30, 2025, compared to a non-GAAP adjusted net loss of $19.1 million in the same period in 2024.
Non-GAAP adjusted EBITDA loss was $10.2 million for the three months ended September 30, 2025, beating our guidance of negative $11.0 million to negative $13.0 million, and compared to a non-GAAP adjusted EBITDA loss of $14.0 million in the same period in 2024. Non-GAAP adjusted EBITDA loss was $19.3 million for the nine months ended September 30, 2025, compared to a non-GAAP adjusted EBITDA loss of $16.0 million in the same period in 2024.
Non-GAAP adjusted EBITDA outperformance relative to guidance and the prior year third quarter period was primarily driven by across the board P&L improvements via lower marketing spend, variable staffing costs, and strong G&A cost control. Compared to last year, our year-to-date non-GAAP adjusted EBITDA loss was worse primarily due to lower revenues and gross margin, partially offset by lower marketing spend, headcount restructuring, and lower G&A spend.
See page 17 for reconciliations of non-GAAP measures to the most directly comparable GAAP financial measure.
|
|
Q3 Earnings Release 2025 | 12 |
Liquidity and Capital Resources
As of September 30, 2025, the Company’s principal sources of liquidity were cash and cash equivalents of $32.7 million. On November 3, 2025, we entered into a loan agreement that provides for up to two tranches of term loans in an aggregate principal amount of $50 million, and we borrowed $20 million under the Term Loan. These proceeds may be used for working capital and other general corporate purposes as permitted by the Term Loan. With our cash on hand and the funding available under our Term Loan, we believe we have ample liquidity to fund the business and pursue growth initiatives.
| Conference Call Details |
| Nerdy’s management will host a conference call to discuss its financial results on Thursday, November 6, 2025 at 5:00 p.m. Eastern Time. Interested parties in the U.S. may listen to the call by dialing 1-833-470-1428. International callers can dial 1-404-975-4839. The Access Code is 192454. |
| A live webcast of the call will also be available on Nerdy’s investor relations website at https://www.nerdy.com/investors. |
| A replay of the webcast will be available on Nerdy’s website for one year following the event and a telephonic replay of the call will be available until November 13, 2025 by dialing 1-866-813-9403 from the U.S. or 1-929-458-6194 from all other locations, and entering the Access Code: 354807. |
| Contact
Investor Relations investors@nerdy.com
|
|
|
Q3 Earnings Release 2025 | 13 |
CONDENSED CONSOLIDATED STATEMENTS
OF OPERATIONS (Unaudited)
(in thousands, except per share data)
| Three Months Ended September 30, |
Nine Months Ended September 30, |
|||||||||||||||
| 2025 | 2024 | 2025 | 2024 | |||||||||||||
| Revenue |
$ | 37,019 | $ | 37,530 | $ | 129,877 | $ | 142,241 | ||||||||
| Cost of revenue |
13,723 | 11,077 | 51,128 | 45,786 | ||||||||||||
|
|
|
|
|
|
|
|
|
|||||||||
| Gross Profit |
23,296 | 26,453 | 78,749 | 96,455 | ||||||||||||
| Sales and marketing expenses |
16,563 | 20,315 | 45,906 | 53,244 | ||||||||||||
| General and administrative expenses |
25,815 | 31,862 | 80,798 | 97,017 | ||||||||||||
|
|
|
|
|
|
|
|
|
|||||||||
| Operating Loss |
(19,082 | ) | (25,724 | ) | (47,955 | ) | (53,806 | ) | ||||||||
| Interest income |
(357 | ) | (768 | ) | (1,184 | ) | (2,533 | ) | ||||||||
| Other expense, net |
(4 | ) | (27 | ) | — | 8 | ||||||||||
|
|
|
|
|
|
|
|
|
|||||||||
| Loss before Income Taxes |
(18,721 | ) | (24,929 | ) | (46,771 | ) | (51,281 | ) | ||||||||
| Income tax expense |
35 | 29 | 137 | 90 | ||||||||||||
|
|
|
|
|
|
|
|
|
|||||||||
| Net Loss |
(18,756 | ) | (24,958 | ) | (46,908 | ) | (51,371 | ) | ||||||||
| Net loss attributable to noncontrolling interests |
(6,469 | ) | (9,058 | ) | (16,228 | ) | (18,932 | ) | ||||||||
|
|
|
|
|
|
|
|
|
|||||||||
| Net Loss Attributable to Class A Common Stockholders |
$ | (12,287 | ) | $ | (15,900 | ) | $ | (30,680 | ) | $ | (32,439 | ) | ||||
|
|
|
|
|
|
|
|
|
|||||||||
| Loss per share of Class A Common Stock: |
||||||||||||||||
| Basic and Diluted |
$ | (0.10 | ) | $ | (0.14 | ) | $ | (0.26 | ) | $ | (0.29 | ) | ||||
| Weighted-Average Shares of Class A Common Stock Outstanding: |
||||||||||||||||
| Basic and Diluted |
121,666 | 113,287 | 120,091 | 110,267 | ||||||||||||
REVENUE (Unaudited)
(in thousands)
| Three Months Ended September 30, |
Change | |||||||||||||||||||||||
| dollars in thousands | 2025 | % | 2024 | % | $ | % | ||||||||||||||||||
| Consumer |
$ | 33,166 | 89 | % | $ | 31,919 | 85 | % | $ | 1,247 | 4 | % | ||||||||||||
| Institutional |
3,688 | 10 | % | 5,429 | 14 | % | (1,741 | ) | (32 | )% | ||||||||||||||
| Other |
165 | 1 | % | 182 | 1 | % | (17 | ) | (9 | )% | ||||||||||||||
|
|
|
|
|
|
|
|
|
|
|
|
|
|||||||||||||
| Revenue |
$ | 37,019 | 100 | % | $ | 37,530 | 100 | % | $ | (511 | ) | (1 | )% | |||||||||||
|
|
|
|
|
|
|
|
|
|
|
|
|
|||||||||||||
| Nine Months Ended September 30, |
Change | |||||||||||||||||||||||
| 2025 | % | 2024 | % | $ | % | |||||||||||||||||||
| Consumer |
$ | 109,003 | 84 | % | $ | 113,237 | 79 | % | $ | (4,234 | ) | (4 | )% | |||||||||||
| Institutional |
20,376 | 15 | % | 28,451 | 20 | % | (8,075 | ) | (28 | )% | ||||||||||||||
| Other |
498 | 1 | % | 553 | 1 | % | (55 | ) | (10 | )% | ||||||||||||||
|
|
|
|
|
|
|
|
|
|
|
|
|
|||||||||||||
| Revenue |
$ | 129,877 | 100 | % | $ | 142,241 | 100 | % | $ | (12,364 | ) | (9 | )% | |||||||||||
|
|
|
|
|
|
|
|
|
|
|
|
|
|||||||||||||
|
|
Q3 Earnings Release 2025 | 14 |
CONDENSED CONSOLIDATED
BALANCE SHEETS (Unaudited)
(in thousands)
| September 30, 2025 |
December 31, 2024 |
|||||||
| ASSETS |
| |||||||
| Current Assets |
||||||||
| Cash and cash equivalents |
$ | 32,710 | $ | 52,541 | ||||
| Accounts receivable, net |
6,496 | 7,335 | ||||||
| Other current assets |
5,284 | 4,838 | ||||||
|
|
|
|
|
|||||
| Total Current Assets |
44,490 | 64,714 | ||||||
| Fixed assets, net |
16,404 | 17,148 | ||||||
| Goodwill |
5,717 | 5,717 | ||||||
| Intangible assets, net |
2,051 | 2,430 | ||||||
| Other assets |
1,750 | 2,498 | ||||||
|
|
|
|
|
|||||
| Total Assets |
$ | 70,412 | $ | 92,507 | ||||
|
|
|
|
|
|||||
| LIABILITIES AND STOCKHOLDERS’ EQUITY |
| |||||||
| Current Liabilities |
||||||||
| Accounts payable |
$ | 5,624 | $ | 2,555 | ||||
| Deferred revenue |
15,916 | 15,263 | ||||||
| Other current liabilities |
9,476 | 10,509 | ||||||
|
|
|
|
|
|||||
| Total Current Liabilities |
31,016 | 28,327 | ||||||
| Other liabilities |
2,339 | 3,067 | ||||||
|
|
|
|
|
|||||
| Total Liabilities |
33,355 | 31,394 | ||||||
| Stockholders’ Equity |
||||||||
| Class A common stock |
12 | 12 | ||||||
| Class B common stock |
6 | 6 | ||||||
| Additional paid-in capital |
612,723 | 597,308 | ||||||
| Accumulated deficit |
(588,546 | ) | (557,866 | ) | ||||
| Accumulated other comprehensive income |
77 | 19 | ||||||
|
|
|
|
|
|||||
| Total Stockholders’ Equity Excluding Noncontrolling Interests |
24,272 | 39,479 | ||||||
| Noncontrolling interests |
12,785 | 21,634 | ||||||
|
|
|
|
|
|||||
| Total Stockholders’ Equity |
37,057 | 61,113 | ||||||
|
|
|
|
|
|||||
| Total Liabilities and Stockholders’ Equity |
$ | 70,412 | $ | 92,507 | ||||
|
|
|
|
|
|||||
|
|
Q3 Earnings Release 2025 | 15 |
CONDENSED CONSOLIDATED STATEMENTS
OF CASH FLOWS (Unaudited)
(in thousands)
| Nine Months Ended September 30, |
||||||||
| 2025 | 2024 | |||||||
| Cash Flows From Operating Activities |
||||||||
| Net Loss |
$ | (46,908 | ) | $ | (51,371 | ) | ||
| Adjustments to reconcile net loss to net cash used in operating activities: |
||||||||
| Depreciation & amortization |
5,540 | 5,137 | ||||||
| Amortization of intangibles |
468 | 460 | ||||||
| Non-cash stock-based compensation expense |
21,973 | 32,238 | ||||||
| Other |
69 | — | ||||||
| Other changes in operating assets and liabilities: |
||||||||
| Decrease in accounts receivable, net |
839 | 7,974 | ||||||
| Increase in other current assets |
(578 | ) | (893 | ) | ||||
| Decrease in other assets |
748 | 1,598 | ||||||
| Increase in accounts payable |
3,041 | 3,084 | ||||||
| Increase (decrease) in deferred revenue |
171 | (4,793 | ) | |||||
| (Decrease) increase in other current liabilities |
(239 | ) | 2,577 | |||||
| Decrease in other liabilities |
(1,037 | ) | (299 | ) | ||||
|
|
|
|
|
|||||
| Net Cash Used in Operating Activities |
(15,913 | ) | (4,288 | ) | ||||
| Cash Flows From Investing Activities |
||||||||
| Capital expenditures |
(4,051 | ) | (5,700 | ) | ||||
|
|
|
|
|
|||||
| Net Cash Used In Investing Activities |
(4,051 | ) | (5,700 | ) | ||||
| Cash Flows From Financing Activities |
||||||||
|
|
|
|
|
|||||
| Net Cash Used In Financing Activities |
— | — | ||||||
| Effect of Exchange Rate Change on Cash, Cash Equivalents, and Restricted Cash |
1 | (18 | ) | |||||
|
|
|
|
|
|||||
| Net Decrease in Cash, Cash Equivalents, and Restricted Cash |
(19,963 | ) | (10,006 | ) | ||||
| Cash, Cash equivalents, and Restricted Cash, Beginning of Year |
52,673 | 75,140 | ||||||
|
|
|
|
|
|||||
| Cash, Cash Equivalents, and Restricted Cash, End of Period |
$ | 32,710 | $ | 65,134 | ||||
|
|
|
|
|
|||||
| Supplemental Cash Flow Information |
||||||||
| Non-cash stock-based compensation included in capitalized internal use software |
$ | 789 | $ | 1,275 | ||||
|
|
Q3 Earnings Release 2025 | 16 |
RECONCILIATION OF GAAP TO
NON-GAAP SALES AND MARKETING EXPENSES (Unaudited)
(in thousands)
| Three Months Ended September 30, |
Nine Months Ended September 30, |
|||||||||||||||
| 2025 | 2024 | 2025 | 2024 | |||||||||||||
| Sales and marketing expenses |
$ | 16,563 | $ | 20,315 | $ | 45,906 | $ | 53,244 | ||||||||
| Less: |
||||||||||||||||
| Non-cash stock-based compensation expense |
336 | 556 | 1,010 | 1,729 | ||||||||||||
| Restructuring costs |
— | — | 193 | — | ||||||||||||
|
|
|
|
|
|
|
|
|
|||||||||
| Non-GAAP sales and marketing expenses |
$ | 16,227 | $ | 19,759 | $ | 44,703 | $ | 51,515 | ||||||||
|
|
|
|
|
|
|
|
|
|||||||||
RECONCILIATION OF GAAP TO
NON-GAAP GENERAL AND ADMINISTRATIVE EXPENSES (Unaudited)
(in thousands)
| Three Months Ended September 30, |
Nine Months Ended September 30, |
|||||||||||||||
| 2025 | 2024 | 2025 | 2024 | |||||||||||||
| General and administrative expenses |
$ | 25,815 | $ | 31,862 | $ | 80,798 | $ | 97,017 | ||||||||
| Less: |
||||||||||||||||
| Non-cash stock-based compensation expense |
6,511 | 9,256 | 20,963 | 30,509 | ||||||||||||
| Restructuring costs |
— | — | 455 | — | ||||||||||||
|
|
|
|
|
|
|
|
|
|||||||||
| Non-GAAP general and administrative expenses |
$ | 19,304 | $ | 22,606 | $ | 59,380 | $ | 66,508 | ||||||||
|
|
|
|
|
|
|
|
|
|||||||||
RECONCILIATION OF GAAP NET LOSS TO
NON-GAAP ADJUSTED EBITDA (LOSS) (Unaudited)
(in thousands)
| Three Months Ended September 30, |
Nine Months Ended September 30, |
|||||||||||||||
| 2025 | 2024 | 2025 | 2024 | |||||||||||||
| Net Loss |
$ | (18,756 | ) | $ | (24,958 | ) | $ | (46,908 | ) | $ | (51,371 | ) | ||||
| Add: |
||||||||||||||||
| Interest income |
(357 | ) | (768 | ) | (1,184 | ) | (2,533 | ) | ||||||||
| Income taxes |
35 | 29 | 137 | 90 | ||||||||||||
| Depreciation and amortization |
2,027 | 1,934 | 6,008 | 5,597 | ||||||||||||
| Non-cash stock-based compensation expense |
6,847 | 9,812 | 21,973 | 32,238 | ||||||||||||
| Restructuring costs |
— | — | 648 | — | ||||||||||||
|
|
|
|
|
|
|
|
|
|||||||||
| Adjusted EBITDA (Loss) |
$ | (10,204 | ) | $ | (13,951 | ) | $ | (19,326 | ) | $ | (15,979 | ) | ||||
|
|
|
|
|
|
|
|
|
|||||||||
RECONCILIATION OF GAAP NET LOSS TO
NON-GAAP ADJUSTED NET LOSS (Unaudited)
(in thousands)
| Three Months Ended September 30, |
Nine Months Ended September 30, |
|||||||||||||||
| 2025 | 2024 | 2025 | 2024 | |||||||||||||
| Net Loss |
$ | (18,756 | ) | $ | (24,958 | ) | $ | (46,908 | ) | $ | (51,371 | ) | ||||
| Add: |
||||||||||||||||
| Non-cash stock-based compensation expense |
6,847 | 9,812 | 21,973 | 32,238 | ||||||||||||
| Restructuring costs |
— | — | 648 | — | ||||||||||||
|
|
|
|
|
|
|
|
|
|||||||||
| Adjusted Net Loss |
$ | (11,909 | ) | $ | (15,146 | ) | $ | (24,287 | ) | $ | (19,133 | ) | ||||
|
|
|
|
|
|
|
|
|
|||||||||
|
|
Q3 Earnings Release 2025 | 17 |
CAPITALIZATION RECONCILIATION (Unaudited)
(in thousands)
| September 30, 2025 |
||||
| Class A Common Stock |
122,373 | |||
| Combined Interests that can be converted into shares of Class A Common Stock |
64,395 | |||
|
|
|
|||
| Total outstanding share count |
186,768 | |||
|
|
|
|||
|
|
Q3 Earnings Release 2025 | 18 |
We monitor the following key operating metrics, among others, to evaluate the performance of our business.
Active Members is defined as the number of Learners with a paid active Learning Membership as of the date presented. Variations in the number of Active Members are due to changes in demand for our solutions, seasonality, testing schedules, and the launch of new Learning Membership options. As a result, Active Members is a key indicator of our ability to attract, engage and retain Learners. Active Members exclude our Institutional business. Our Active Member count as of September 30, 2025 was lower when compared to September 30, 2024 primarily due to operational challenges that we are actively addressing in part through the appointment of a new Chief Operating Officer to drive enhanced operational execution and systematic process improvements. We are also rolling out new student and Expert platform user experiences in the fourth quarter that we believe will re-accelerate growth.
ARPM is defined as the average Consumer Learning Membership subscription revenue per member per month as of the date presented. Variations in ARPM are primarily due to changes in the mix of Learning Memberships sold and pricing changes. We believe ARPM is a key indicator of the value we provide to our customers. ARPM excludes our Institutional business. ARPM as of September 30, 2025 was higher when compared to September 30, 2024 due to the mix shift to higher frequency Learning Memberships coupled with price increases enacted during the first quarter of 2025.
Active Experts is defined as the number of Experts who have instructed one or more sessions in a given period. Active Experts include our Institutional business. Our Active Expert count during the three and nine months ended September 30, 2025 decreased when compared to the prior year periods. These decreases were primarily due to lower Consumer Active Experts as a result of our Expert incentives, which has promoted utilization of the highest quality Experts by encouraging them to work with more Learners and develop deeper relationships that allow for increased revenue-generating opportunities, coupled with lower utilization of tutoring sessions in our Institutional business as a result of lower bookings.
KEY OPERATING METRICS
| Active Members in thousands | September 30, 2025 |
June 30, 2025 |
March 31, 2025 |
December 31, 2024 |
September 30, 2024 |
June 30, 2024 |
||||||||||||||||||
| Active Members |
34.3 | 30.6 | 40.5 | 37.5 | 39.7 | 35.5 | ||||||||||||||||||
| YoY change |
(14 | )% | (14 | )% | (12 | )% | (8 | )% | 1 | % | 15 | % | ||||||||||||
| ARPM in ones | September 30, 2025 |
June 30, 2025 |
March 31, 2025 |
December 31, 2024 |
September 30, 2024 |
June 30, 2024 |
||||||||||||||||||
| ARPM |
$ | 374 | $ | 348 | $ | 335 | $ | 302 | $ | 302 | $ | 281 | ||||||||||||
| YoY change |
24 | % | 24 | % | 14 | % | (2 | )% | (13 | )% | (20 | )% | ||||||||||||
| Three Months Ended September 30, |
Change | Nine Months Ended September 30, |
Change | |||||||||||||||||||||
| Active Experts in thousands | 2025 | 2024 | % | 2025 | 2024 | % | ||||||||||||||||||
| Active Experts |
8.1 | 9.5 | (15 | )% | 13.8 | 17.3 | (20 | )% | ||||||||||||||||
|
|
Q3 Earnings Release 2025 | 19 |
Key Performance Metrics and Non-GAAP Financial Measures
This earnings release includes non-GAAP financial measures for non-GAAP sales and marketing expenses, non-GAAP general and administrative expenses, non-GAAP adjusted net earnings (loss) and non-GAAP adjusted EBITDA (loss).
Non-GAAP sales and marketing expenses exclude non-cash stock compensation expenses and restructuring costs. Non-GAAP general and administrative expenses exclude non-cash stock compensation expenses and restructuring costs.
Non-GAAP adjusted net earnings (loss) is defined as net income or net loss, as applicable, excluding non-cash stock-based compensation expenses and restructuring costs.
Non-GAAP adjusted EBITDA (loss) is defined as net income or net loss, as applicable, before net interest income (expense), taxes, depreciation and amortization expense, non-cash stock-based compensation expenses and restructuring costs.
Sales and marketing expenses consist of salaries and benefits for our employees engaged in our consultative sales process. General and administrative expenses are recorded in the period in which they are incurred and include salaries, benefits, and non-cash stock-based compensation expense for certain employees as well as support services, product development, finance, legal, human resources, other administrative employees, information technology expenses, outside services, legal and accounting services, depreciation expense, and other costs required to support our operations.
Net loss per share is computed by dividing net loss by the weighted average number of shares outstanding during the period as calculated using the treasury stock and “if-converted” methods, as applicable.
Non-GAAP measures are in addition, and not a substitute for or superior to measures of financial performance prepared in accordance with GAAP and should not be considered as an alternative to sales, net income, operating income, cash flows from operations, or any other performance measures derived in accordance with GAAP. Other companies may calculate these non-GAAP financial measures differently, and therefore such financial measures may not be directly comparable to similarly titled measures of other companies. The Company believes that these non-GAAP measures of financial results provide useful supplemental information. The Company’s management uses these non-GAAP measures to evaluate the Company’s operating performance, trends, and to compare it against the performance of other companies. There are, however, a number of limitations related to the use of these non-GAAP measures and their nearest GAAP equivalents. See the tables above regarding reconciliation of non-GAAP measures to the most directly comparable GAAP measures.
Annualized run-rate is defined as the number of Active Members at the end of the period multiplied by average revenue per Learning Membership per month multiplied by twelve months. This recurring revenue customer base provides us with increased forecasting visibility into future periods.
Bookings represent contracted amounts during the period for Varsity Tutors for Schools.
Management and our board of directors use these metrics as supplemental measures of our performance that are not required by or presented in accordance with GAAP because they assist us in comparing our operating performance on a consistent basis, as they remove the impact of items not directly resulting from our core operations. We also use these metrics for planning purposes, including the preparation of our internal annual operating budget and financial projections, to evaluate the performance and effectiveness of our strategic initiatives and to evaluate our capacity to expand our business and the capital expenditures required for that expansion.
|
|
Q3 Earnings Release 2025 | 20 |
Non-GAAP sales and marketing expenses, non-GAAP general and administrative expenses, non-GAAP adjusted EBITDA (loss), and non-GAAP adjusted net income or loss should not be considered in isolation, as an alternative to, or superior to net earnings (loss), revenue, cash flows or other performance measure derived in accordance with GAAP. We believe these metrics are frequently used by analysts, investors, and other interested parties to evaluate companies in our industry. Management believes that the presentation of non-GAAP metrics is an appropriate measure of operating performance because they eliminate the impact of expenses that do not relate directly to the performance of our underlying business. These non-GAAP metrics should not be construed as an implication that our future results will be unaffected by unusual or other items. We are not able to provide a reconciliation of non-GAAP adjusted EBITDA (loss) guidance for future periods to net loss, the comparable GAAP measure, because certain items that are excluded from non-GAAP adjusted EBITDA (loss) cannot be reasonably predicted or are not in our control. In particular, we are unable to forecast the timing or magnitude for gains or losses on mark-to-market derivative financial instruments, or stock-based compensation without unreasonable efforts, and these items could significantly impact, either individually or in the aggregate, net income or loss in the future. See the tables above regarding reconciliations of these non-GAAP measures to the most directly comparable GAAP measures for historical periods.
Forward-Looking Statements
All statements contained herein that do not relate to matters of historical fact should be considered forward-looking statements, including, without limitation, statements regarding our strategic priorities, including those related to revenue growth; enhancing the Learning Membership experience; AI-enabled productivity and operating leverage; the growth of our Institutional business; the sufficiency of our cash to fund future operations; and our anticipated quarterly and full year 2025 outlook; as well as statements that include the words “expect,” “plan,” “believe,” “project,” “will” and “may,” and similar statements of a future or forward-looking nature.
The forward-looking statements made herein relate only to events as of the date on which the statements are made. We undertake no obligation to update any forward-looking statements to reflect events or circumstances after the date of this press release or to reflect new information or the occurrence of unanticipated events, except as required by law. We may not actually achieve the plans, intentions, or expectations disclosed in our forward-looking statements, and you should not place undue reliance on our forward-looking statements.
There are a significant number of factors that could cause actual results to differ materially from statements made herein or in connection herewith, including but not limited to, our offerings continue to evolve, which makes it difficult to predict our future financial and operating results; our level of indebtedness, which could adversely affect our financial condition; our operating activities may be restricted as a result of covenants related to our Term Loan and failure to comply with these covenants could have a material adverse effect on us; our history of net losses and negative operating cash flows, which could require us to need other sources of liquidity; risks associated with our ability to acquire and retain customers, operate, and scale up our Consumer and Institutional businesses; risks associated with our intellectual property, including claims that we infringe on a third-party’s intellectual property rights; risks associated with our classification of some individuals and entities we contract with as independent contractors; risks associated with the liquidity and trading of our securities; risks associated with payments that we may be required to make under the tax receivable agreement; litigation, regulatory and reputational risks arising from the fact that many of our Learners are minors; changes in applicable law or regulation; the possibility of cyber-related incidents and their related impacts on our business and results of operations; risks associated with the development and use of artificial intelligence and related regulatory uncertainty; the possibility that we may be adversely affected by other economic, business, and/or competitive factors; and risks associated with managing our growth.
Our actual results could differ materially from those stated or implied in forward-looking statements due to a number of factors, including but not limited to, risks detailed in our filings with the SEC, including our Annual Report on Form 10-K filed on February 27, 2025 and our Quarterly Report on Form 10-Q filed on November 6, 2025, as well as other filings that we may make from time to time with the SEC.
|
|
Q3 Earnings Release 2025 | 21 |