1 Amalgamated Financial Corp. Third Quarter 2026 Earnings Presentation October 22, 2026
2 Safe Harbor Statements FORWARD-LOOKING STATEMENTS Statements included in this presentation that are not historical in nature are intended to be, and are hereby identified as, forward-looking statements within the meaning of the Private Securities Litigation Reform Act, Section 21E of the Securities Exchange Act of 1934, as amended. Forward- looking statements generally can be identified through the use of forward-looking terminology such as “may,” “will,” “anticipate,” “aspire,” “should,” “would,” “believe,” “contemplate,” “expect,” “estimate,” “continue,” “in the future,” “may” and “intend,” as well as other similar words and expressions of the future. Forward-looking statements are subject to known and unknown risks, uncertainties and other factors, any or all of which could cause actual results to differ materially from the results expressed or implied by such forward-looking statements. These risks and uncertainties include, but are not limited to: 1. uncertain conditions in the banking industry and in national, regional and local economies in core markets, which may have an adverse impact on business, operations and financial performance; 2. deterioration in the financial condition of borrowers, as well as deterioration in the reputational profile of borrowers, resulting in significant increases in credit losses and provisions for those losses; 3. deposit outflows and subsequent declines in liquidity caused by factors that could include lack of confidence in the banking system, a deterioration in market conditions or the financial condition of depositors; 4. changes in deposits, including an increase in uninsured deposits; 5. ability to maintain sufficient liquidity to meet deposit and debt obligations as they come due, which may require that the Company sell investment securities at a loss, negatively impacting net income, earnings and capital; 6. unfavorable conditions in the capital markets, which may cause declines in stock price and the value of investments; 7. negative economic and political conditions that adversely affect the general economy, housing prices, the real estate market, the job market, consumer confidence, the financial condition of borrowers and consumer spending habits, which may affect, among other things, the level of non- performing assets, charge-offs and provision expense; 8. fluctuations or unanticipated changes in the interest rate environment including changes in net interest margin or changes in the yield curve that affect investments, loans or deposits; 9. the general decline in the real estate and lending markets, particularly in commercial real estate in the Company’s market areas, and the effects of the enactment of or changes to rent-control and other similar regulations on multi-family housing; 10. implementation by the current presidential administration of a regulatory reform agenda that is significantly different from that of the prior presidential administration, impacting the rule making, supervision, examination and enforcement of the banking regulation agencies; 11. changes in U.S. trade policies and other global political factors beyond the Company’s control, including the imposition of tariffs, which raise economic uncertainty, potentially leading to slower growth and a decrease in loan demand; 12. the outcome of legal or regulatory proceedings that may be instituted against us; 13. inability to achieve organic loan and deposit growth and the composition of that growth; 14. composition of the Company’s loan portfolio, including any concentration in industries or sectors that may experience unanticipated or anticipated adverse conditions greater than other industries or sectors in the national or local economies in which the Company operates; 15. inaccuracy of the assumptions and estimates the Company makes and policies that the Company implements in establishing the allowance for credit losses; 16. changes in loan underwriting, credit review or loss reserve policies associated with economic conditions, examination conclusions, or regulatory developments; 17. any matter that would cause the Company to conclude that there was impairment of any asset, including intangible assets; 18. limitations on the ability to declare and pay dividends; 19. the impact of competition with other financial institutions, including pricing pressures and the resulting impact on results, including as a result of compression to net interest margin; 20. increased competition for experienced members of the workforce including executives in the banking industry; 21. a failure in or breach of operational or security systems or infrastructure, or those of third party vendors or other service providers, including as a result of unauthorized access, computer viruses, phishing schemes, spam attacks, human error, natural disasters, power loss and other security breaches; 22. increased regulatory scrutiny, privacy concerns, and cyber risk and other exposure from the potential use of “big data” techniques, machine learning, and artificial intelligence in a wide range of applications including for fraud detection, credit underwriting, customer service, marketing, transaction execution, automated compliance and internal operations; 23. a downgrade in the Company’s credit rating; 24. “greenwashing claims” against the Company and environmental, social, and governance ("ESG") products and increased scrutiny and political opposition to ESG and diversity, equity, and inclusion ("DEI") practices; 25. any unanticipated or greater than anticipated adverse conditions (including the possibility of earthquakes, wildfires, and other natural disasters) affecting the markets in which the Company operates; 26. physical and transitional risks related to climate change as they impact the business and the businesses that the Company finances; 27. future repurchase of the Company’s shares through the Company’s common stock repurchase program; and 28. descriptions of assumptions underlying or relating to any of the foregoing. Additional factors which could affect the forward-looking statements can be found in the Company’s Annual Reports on Form 10-K, Quarterly Reports on Form 10-Q, and Current Reports on Form 8-K filed with the SEC and available on the SEC's website at https://www.sec.gov/. The Company disclaims any obligation to update or revise any forward-looking statements contained in this release, which speak only as of the date hereof, whether as a result of new information, future events or otherwise, except as required by law. NON-GAAP FINANCIAL MEASURES This presentation contains certain non-GAAP financial measures including, without limitation, “Core Operating Revenue,” “Core Non-interest Expense,” “Tangible Common Equity,” “Average Tangible Common Equity,” “Core Efficiency Ratio,” “Core Net Income,” “Core ROAA,” and “Core ROATCE.” We believe these non-GAAP financial measures provide useful information to management and investors that is supplementary to our financial condition, results of operations and cash flows computed in accordance with GAAP. Specifically, we believe these non-GAAP financial measures (a) allow management and investors to better assess our performance by removing volatility that is associated with discrete items that are unrelated to our core business, and (b) enable a more complete understanding of factors and trends affecting our business. Non-GAAP financial measures, however, have inherent limitations, are not required to be uniformly applied, and are not audited. Accordingly, these non-GAAP financial measures should not be considered as substitutes for GAAP financial measures, and we strongly encourage investors to review the GAAP financial measures included in this presentation and not to place undue reliance on any single financial measure. In addition, because non-GAAP financial measures are not standardized, it may not be possible to compare the non-GAAP financial measures presented in this presentation with other companies’ non-GAAP financial measures having the same or similar names. As such, you should not view these disclosures as a substitute for results determined in accordance with GAAP, and they are not necessarily comparable to non-GAAP financial measures that other companies use. Reconciliations of non-GAAP financial disclosures to what we believe to be the most directly comparable GAAP measures found in this presentation are set forth in the final pages of this presentation and also may be viewed on the bank’s website, amalgamatedbank.com. You should assume that all numbers presented are unaudited unless otherwise noted.
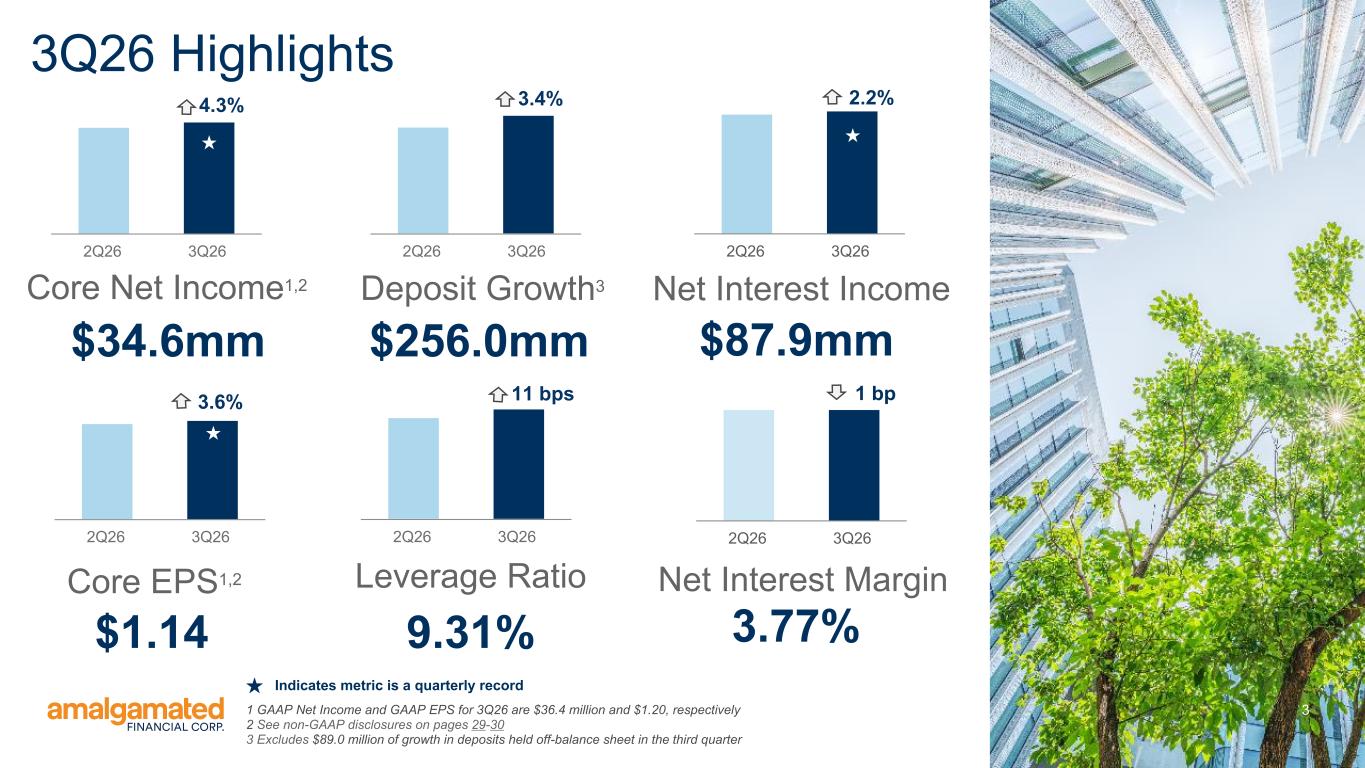
3 $34.6mm Core Net Income1,2 $1.14 Core EPS1,2 $256.0mm Deposit Growth3 9.31% Leverage Ratio $87.9mm Net Interest Income 3.77% Net Interest Margin 3Q26 Highlights 2Q26 3Q26 2Q26 3Q26 3.4% 2Q26 3Q262Q26 3Q26 2Q26 3Q26 4.3% 2Q26 3Q26 1 bp11 bps 2.2% 1 GAAP Net Income and GAAP EPS for 3Q26 are $36.4 million and $1.20, respectively 2 See non-GAAP disclosures on pages 29-30 3 Excludes $89.0 million of growth in deposits held off-balance sheet in the third quarter 3.6% Indicates metric is a quarterly record
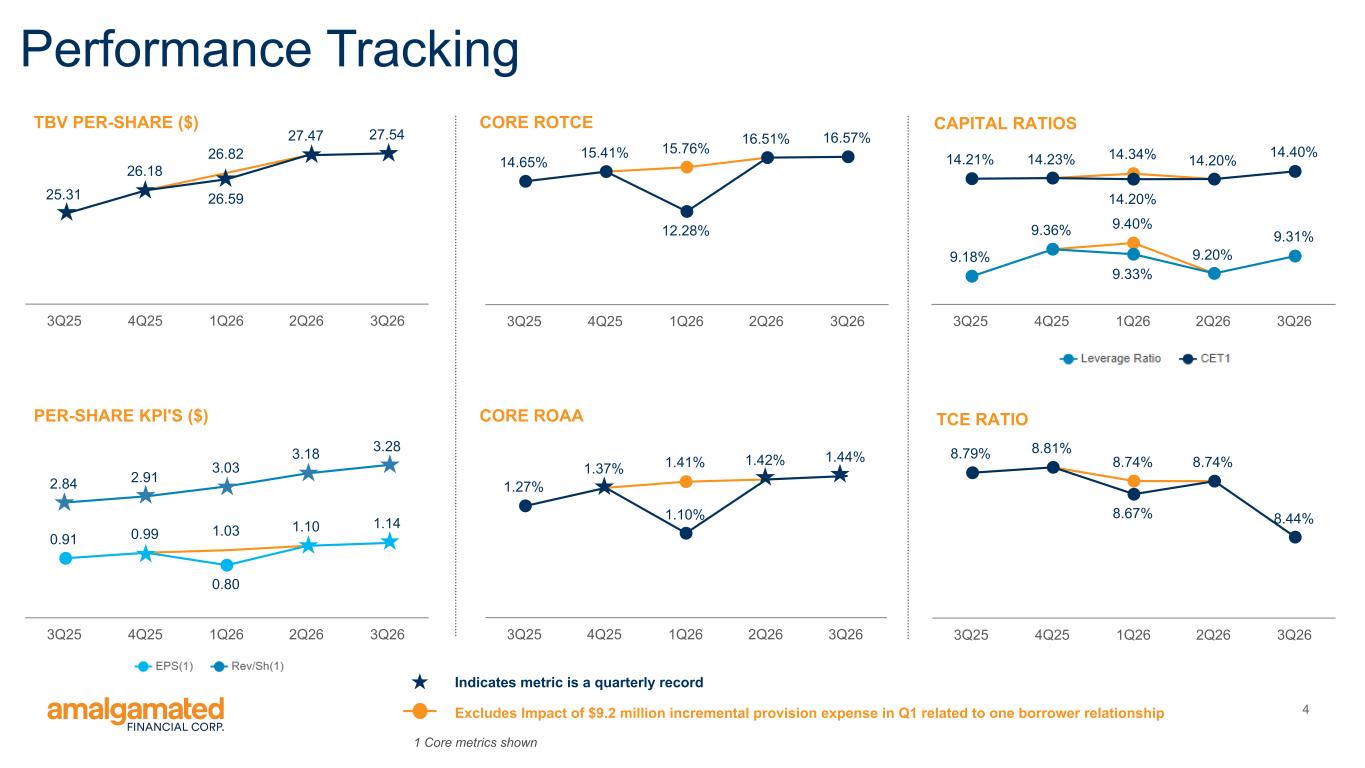
4 1.41% 1.42% 1.27% 1.37% 1.10% 1.44% 3Q25 4Q25 1Q26 2Q26 3Q26 9.40% 9.18% 9.36% 9.33% 9.20% 9.31% 14.34%14.21% 14.23% 14.20% 14.20% 14.40% 3Q25 4Q25 1Q26 2Q26 3Q26 26.82 25.31 26.18 26.59 27.47 27.54 3Q25 4Q25 1Q26 2Q26 3Q26 15.76% 16.51% 14.65% 15.41% 12.28% 16.57% 3Q25 4Q25 1Q26 2Q26 3Q26 CORE ROAAPER-SHARE KPI'S ($) TBV PER-SHARE ($) CORE ROTCE Performance Tracking 1 Core metrics shown 1.030.91 0.99 0.80 1.10 1.14 2.84 2.91 3.03 3.18 3.28 3Q25 4Q25 1Q26 2Q26 3Q26 CAPITAL RATIOS 8.74%8.79% 8.81% 8.67% 8.74% 8.44% 3Q25 4Q25 1Q26 2Q26 3Q26 TCE RATIO Excludes Impact of $9.2 million incremental provision expense in Q1 related to one borrower relationship Indicates metric is a quarterly record
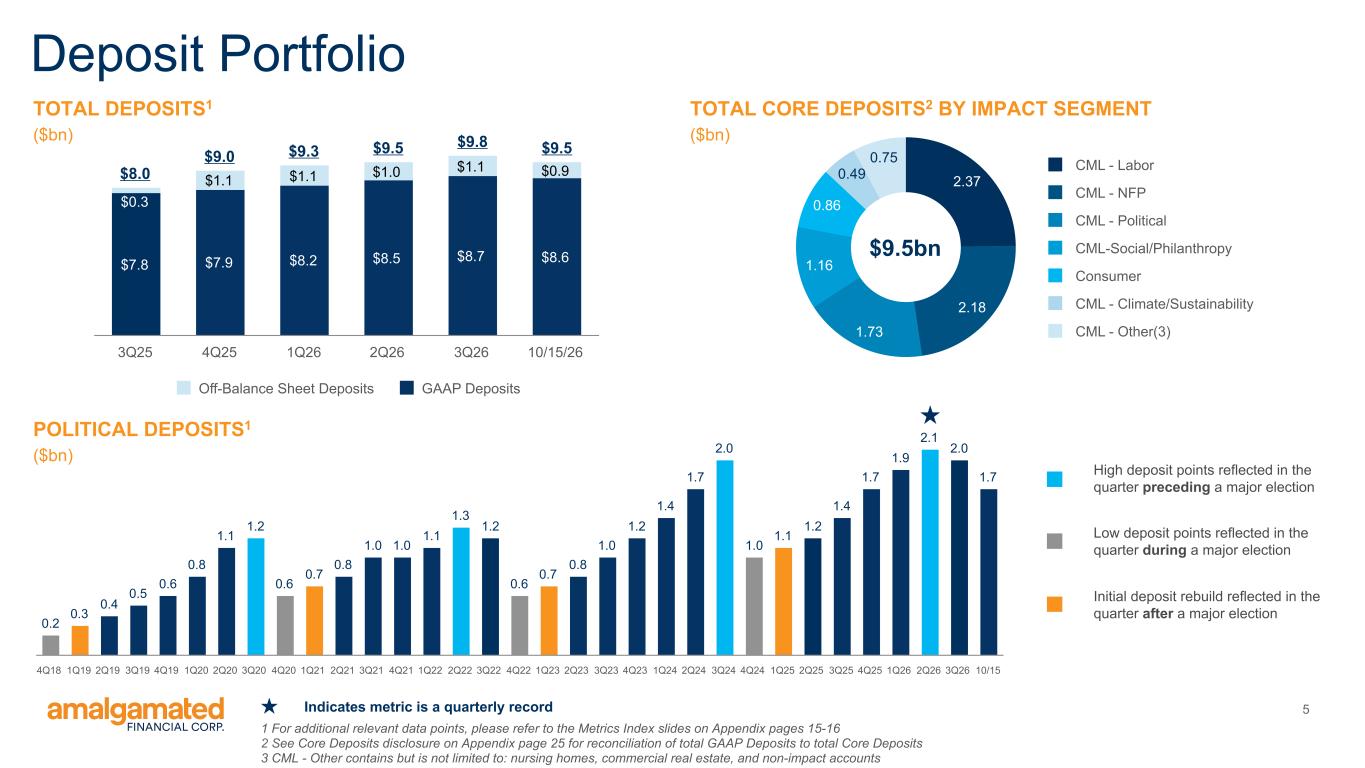
5 TOTAL DEPOSITS1 ($bn) Deposit Portfolio $8.0 $9.0 $9.3 $9.5 $9.8 $9.5 $7.8 $7.9 $8.2 $8.5 $8.7 $8.6 $0.3 $1.1 $1.1 $1.0 $1.1 $0.9 Off-Balance Sheet Deposits GAAP Deposits 3Q25 4Q25 1Q26 2Q26 3Q26 10/15/26 2.37 2.18 1.73 1.16 0.86 0.49 0.75 CML - Labor CML - NFP CML - Political CML-Social/Philanthropy Consumer CML - Climate/Sustainability CML - Other(3) 1 For additional relevant data points, please refer to the Metrics Index slides on Appendix pages 15-16 2 See Core Deposits disclosure on Appendix page 25 for reconciliation of total GAAP Deposits to total Core Deposits 3 CML - Other contains but is not limited to: nursing homes, commercial real estate, and non-impact accounts TOTAL CORE DEPOSITS2 BY IMPACT SEGMENT ($bn) POLITICAL DEPOSITS1 ($bn) 0.2 0.3 0.4 0.5 0.6 0.8 1.1 1.2 0.6 0.7 0.8 1.0 1.0 1.1 1.3 1.2 0.6 0.7 0.8 1.0 1.2 1.4 1.7 2.0 1.0 1.1 1.2 1.4 1.7 1.9 2.1 2.0 1.7 4Q18 1Q19 2Q19 3Q19 4Q19 1Q20 2Q20 3Q20 4Q20 1Q21 2Q21 3Q21 4Q21 1Q22 2Q22 3Q22 4Q22 1Q23 2Q23 3Q23 4Q23 1Q24 2Q24 3Q24 4Q24 1Q25 2Q25 3Q25 4Q25 1Q26 2Q26 3Q26 10/15 $9.5bn High deposit points reflected in the quarter preceding a major election Low deposit points reflected in the quarter during a major election Initial deposit rebuild reflected in the quarter after a major election Indicates metric is a quarterly record
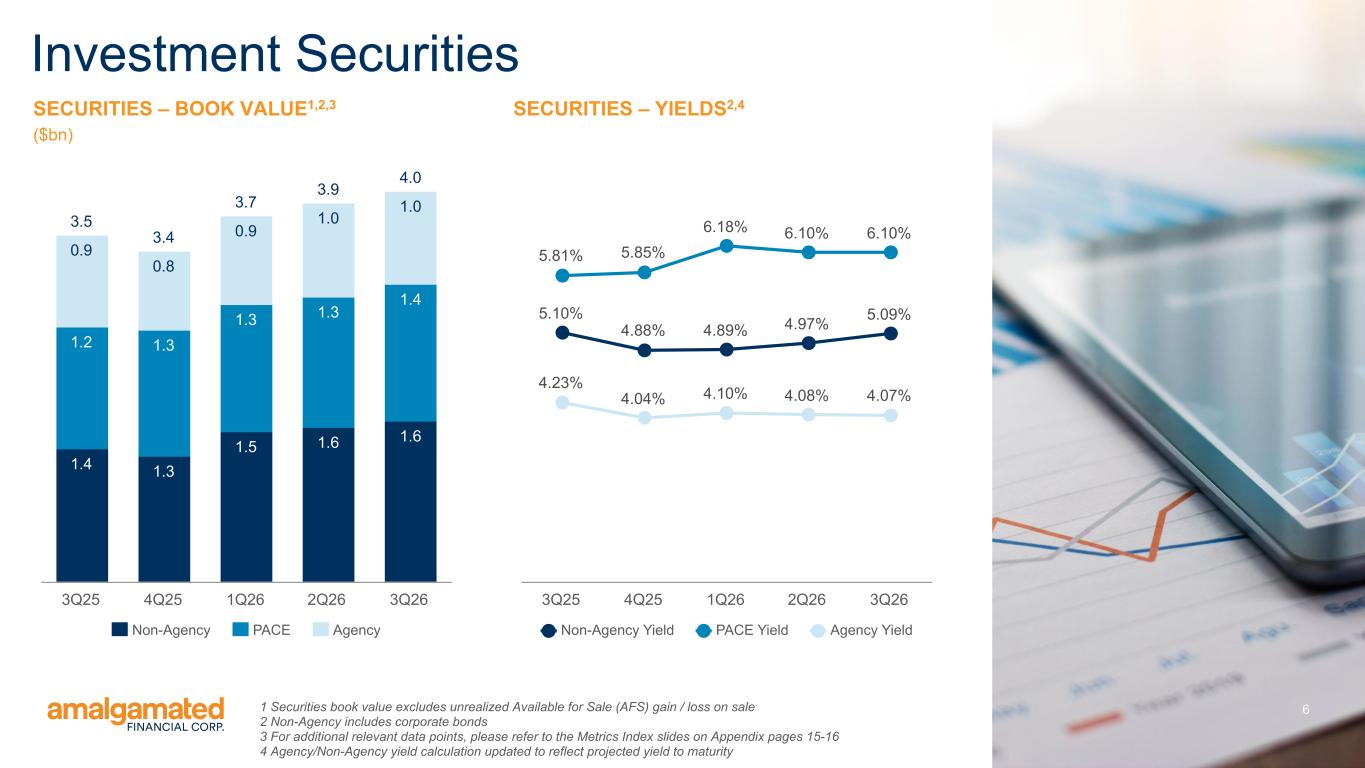
6 SECURITIES – BOOK VALUE1,2,3 ($bn) Investment Securities 3.5 3.4 3.7 3.9 4.0 1.4 1.3 1.5 1.6 1.6 1.2 1.3 1.3 1.3 1.4 0.9 0.8 0.9 1.0 1.0 Non-Agency PACE Agency 3Q25 4Q25 1Q26 2Q26 3Q26 1 Securities book value excludes unrealized Available for Sale (AFS) gain / loss on sale 2 Non-Agency includes corporate bonds 3 For additional relevant data points, please refer to the Metrics Index slides on Appendix pages 15-16 4 Agency/Non-Agency yield calculation updated to reflect projected yield to maturity SECURITIES – YIELDS2,4 5.10% 4.88% 4.89% 4.97% 5.09% 5.81% 5.85% 6.18% 6.10% 6.10% 4.23% 4.04% 4.10% 4.08% 4.07% Non-Agency Yield PACE Yield Agency Yield 3Q25 4Q25 1Q26 2Q26 3Q26
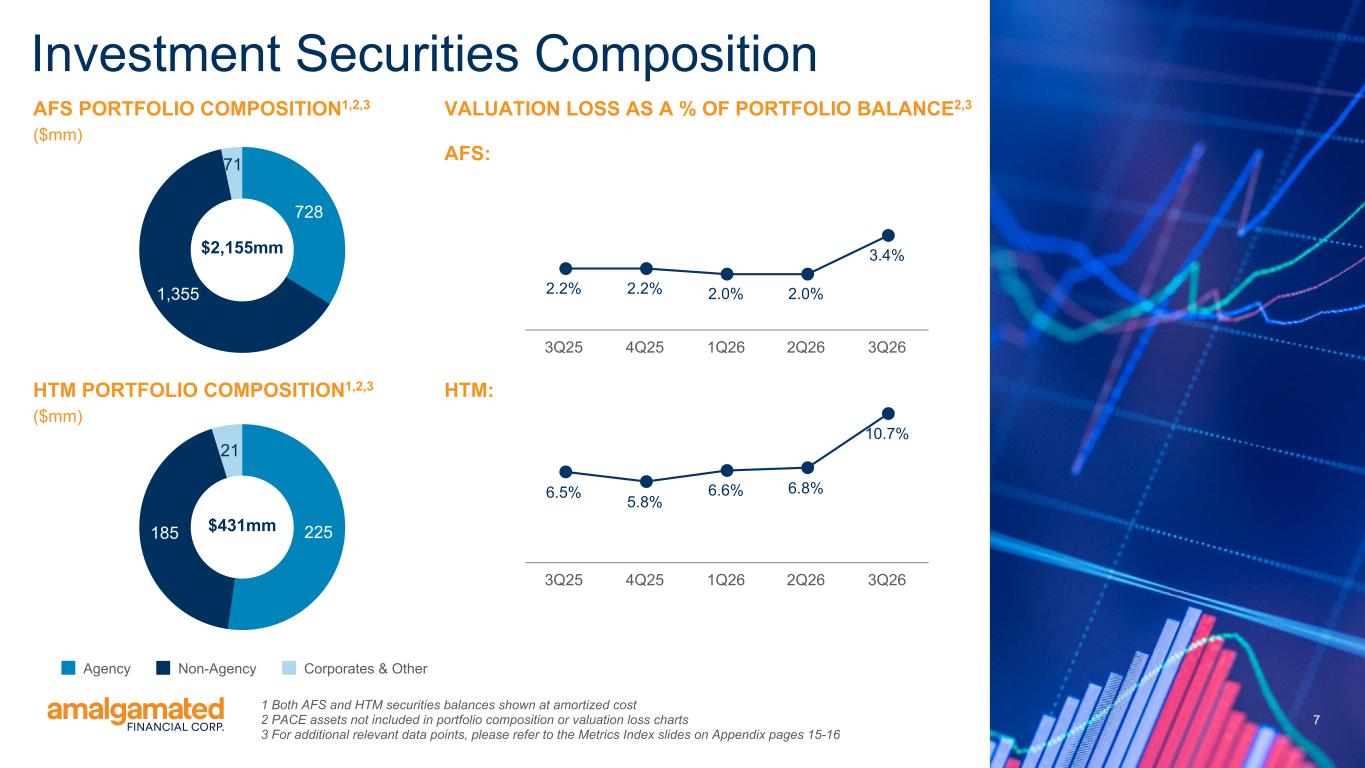
7 7 728 1,355 71 Investment Securities Composition HTM PORTFOLIO COMPOSITION1,2,3 ($mm) 225185 21 Agency Non-Agency Corporates & Other $2,155mm $431mm VALUATION LOSS AS A % OF PORTFOLIO BALANCE2,3 AFS: AFS PORTFOLIO COMPOSITION1,2,3 ($mm) 1 Both AFS and HTM securities balances shown at amortized cost 2 PACE assets not included in portfolio composition or valuation loss charts 3 For additional relevant data points, please refer to the Metrics Index slides on Appendix pages 15-16 2.2% 2.2% 2.0% 2.0% 3.4% 3Q25 4Q25 1Q26 2Q26 3Q26 6.5% 5.8% 6.6% 6.8% 10.7% 3Q25 4Q25 1Q26 2Q26 3Q26 HTM:
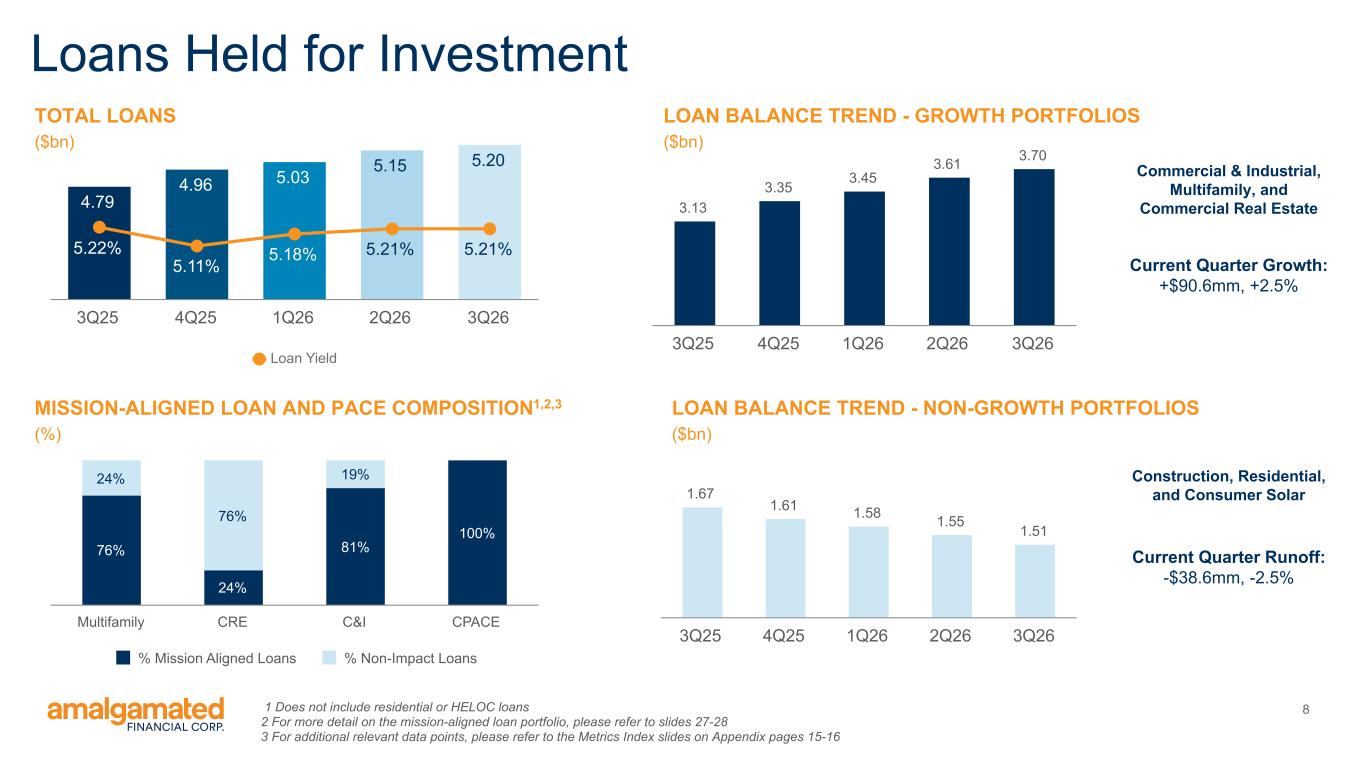
8 Loans Held for Investment TOTAL LOANS ($bn) 4.79 4.96 5.03 5.15 5.20 5.22% 5.11% 5.18% 5.21% 5.21% Loan Yield 3Q25 4Q25 1Q26 2Q26 3Q26 3.13 3.35 3.45 3.61 3.70 3Q25 4Q25 1Q26 2Q26 3Q26 LOAN BALANCE TREND - GROWTH PORTFOLIOS ($bn) 76% 24% 81% 100% 24% 76% 19% % Mission Aligned Loans % Non-Impact Loans Multifamily CRE C&I CPACE MISSION-ALIGNED LOAN AND PACE COMPOSITION1,2,3 (%) 1 Does not include residential or HELOC loans 2 For more detail on the mission-aligned loan portfolio, please refer to slides 27-28 3 For additional relevant data points, please refer to the Metrics Index slides on Appendix pages 15-16 1.67 1.61 1.58 1.55 1.51 3Q25 4Q25 1Q26 2Q26 3Q26 LOAN BALANCE TREND - NON-GROWTH PORTFOLIOS ($bn) Current Quarter Growth: +$90.6mm, +2.5% Current Quarter Runoff: -$38.6mm, -2.5% Commercial & Industrial, Multifamily, and Commercial Real Estate Construction, Residential, and Consumer Solar
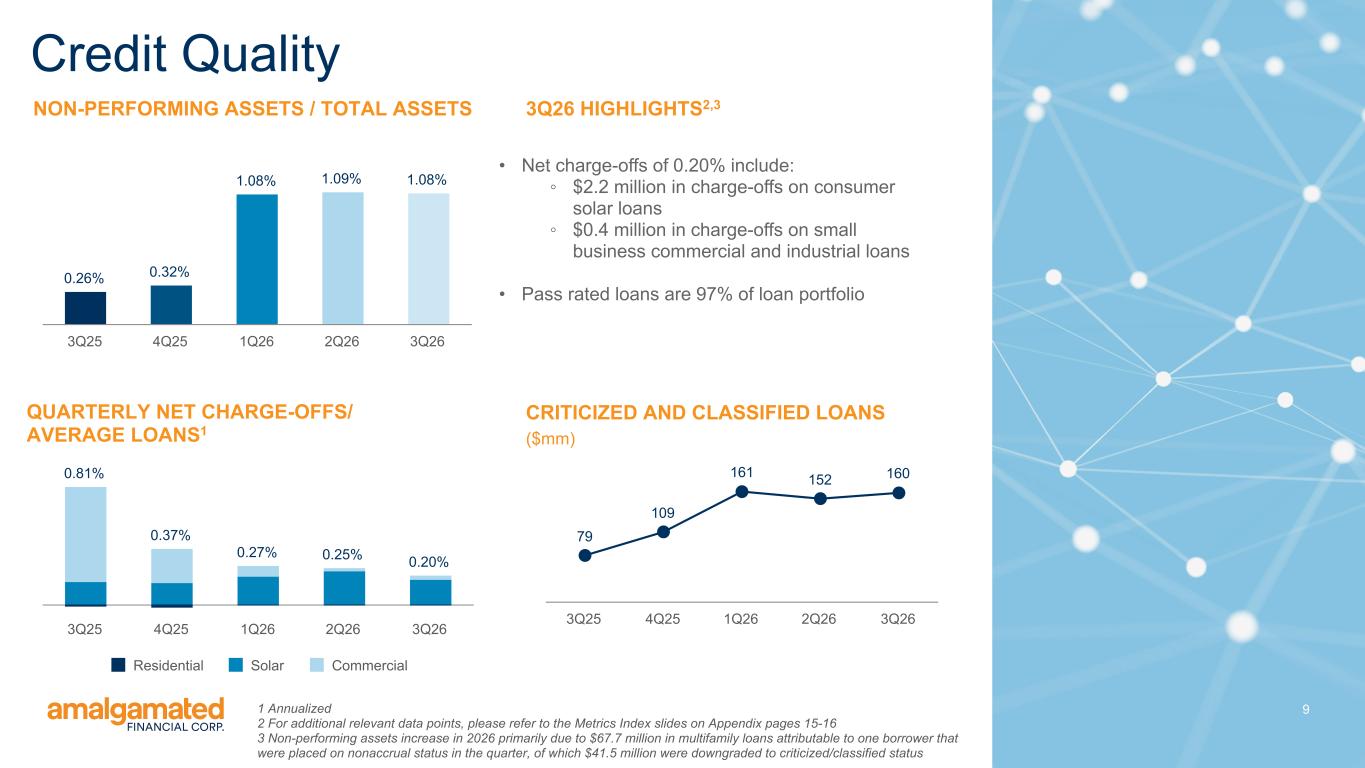
9 NON-PERFORMING ASSETS / TOTAL ASSETS Credit Quality QUARTERLY NET CHARGE-OFFS/ AVERAGE LOANS1 3Q26 HIGHLIGHTS2,3 • Net charge-offs of 0.20% include: ◦ $2.2 million in charge-offs on consumer solar loans ◦ $0.4 million in charge-offs on small business commercial and industrial loans • Pass rated loans are 97% of loan portfolio CRITICIZED AND CLASSIFIED LOANS ($mm) 0.26% 0.32% 1.08% 1.09% 1.08% 3Q25 4Q25 1Q26 2Q26 3Q26 0.81% 0.37% 0.27% 0.25% 0.20% Residential Solar Commercial 3Q25 4Q25 1Q26 2Q26 3Q26 79 109 161 152 160 3Q25 4Q25 1Q26 2Q26 3Q26 1 Annualized 2 For additional relevant data points, please refer to the Metrics Index slides on Appendix pages 15-16 3 Non-performing assets increase in 2026 primarily due to $67.7 million in multifamily loans attributable to one borrower that were placed on nonaccrual status in the quarter, of which $41.5 million were downgraded to criticized/classified status
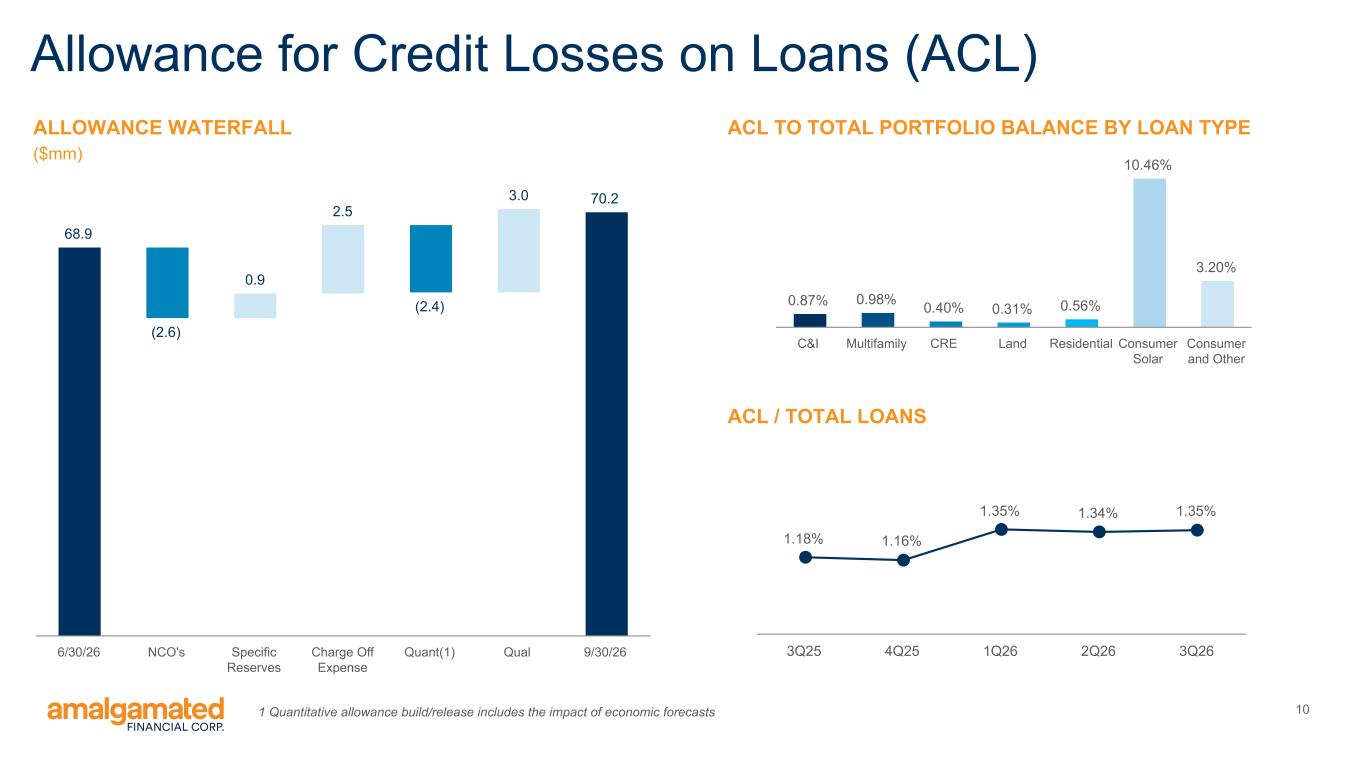
10 Allowance for Credit Losses on Loans (ACL) ACL / TOTAL LOANS 1.18% 1.16% 1.35% 1.34% 1.35% 3Q25 4Q25 1Q26 2Q26 3Q26 68.9 (2.6) 0.9 2.5 (2.4) 3.0 70.2 6/30/26 NCO's Specific Reserves Charge Off Expense Quant(1) Qual 9/30/26 ALLOWANCE WATERFALL ($mm) 0.87% 0.98% 0.40% 0.31% 0.56% 10.46% 3.20% C&I Multifamily CRE Land Residential Consumer Solar Consumer and Other ACL TO TOTAL PORTFOLIO BALANCE BY LOAN TYPE 1 Quantitative allowance build/release includes the impact of economic forecasts
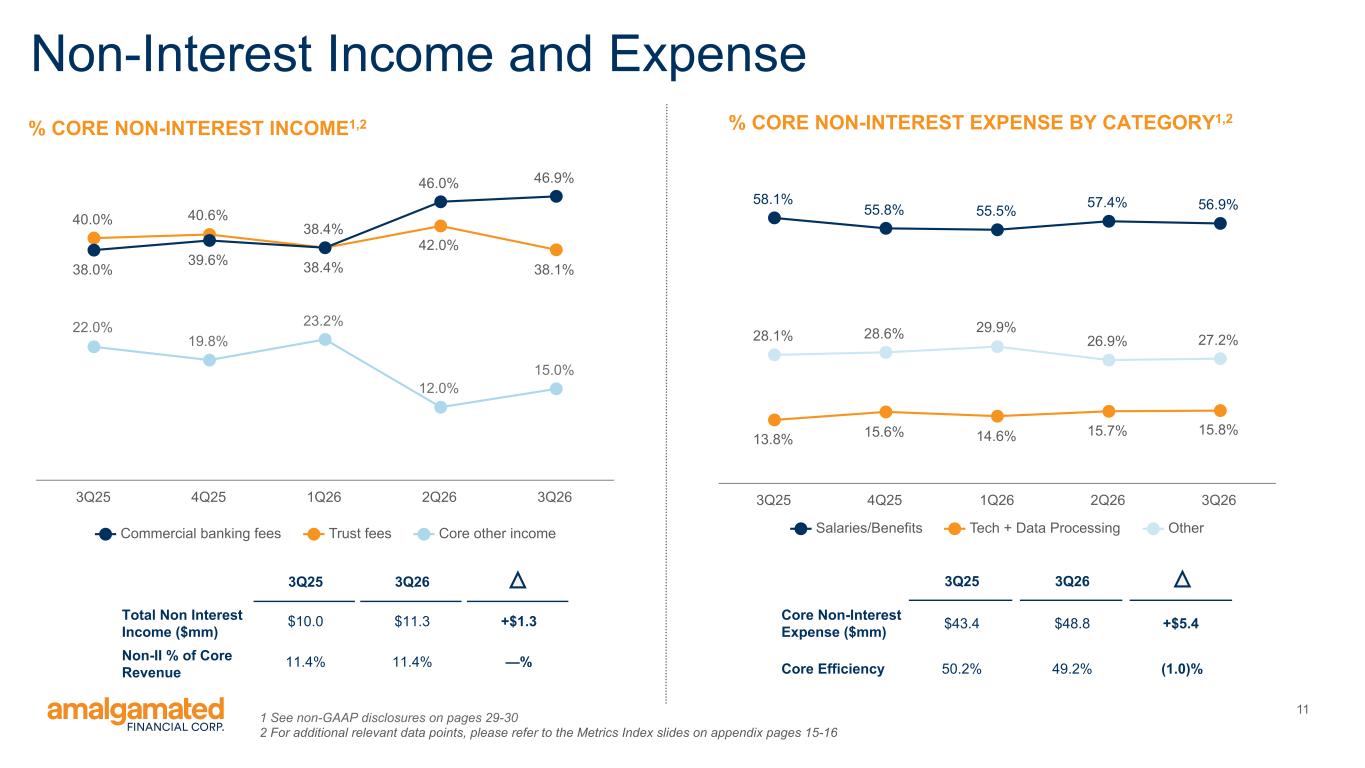
11 Non-Interest Income and Expense 22.0% 19.8% 23.2% 12.0% 15.0% 40.0% 40.6% 38.4% 42.0% 38.1%38.0% 39.6% 38.4% 46.0% 46.9% Commercial banking fees Trust fees Core other income 3Q25 4Q25 1Q26 2Q26 3Q26 % CORE NON-INTEREST INCOME1,2 1 See non-GAAP disclosures on pages 29-30 2 For additional relevant data points, please refer to the Metrics Index slides on appendix pages 15-16 58.1% 55.8% 55.5% 57.4% 56.9% 13.8% 15.6% 14.6% 15.7% 15.8% 28.1% 28.6% 29.9% 26.9% 27.2% Salaries/Benefits Tech + Data Processing Other 3Q25 4Q25 1Q26 2Q26 3Q26 % CORE NON-INTEREST EXPENSE BY CATEGORY1,2 3Q25 3Q26 Core Non-Interest Expense ($mm) $43.4 $48.8 +$5.4 Core Efficiency 50.2% 49.2% (1.0)% 3Q25 3Q26 Total Non Interest Income ($mm) $10.0 $11.3 +$1.3 Non-II % of Core Revenue 11.4% 11.4% —%
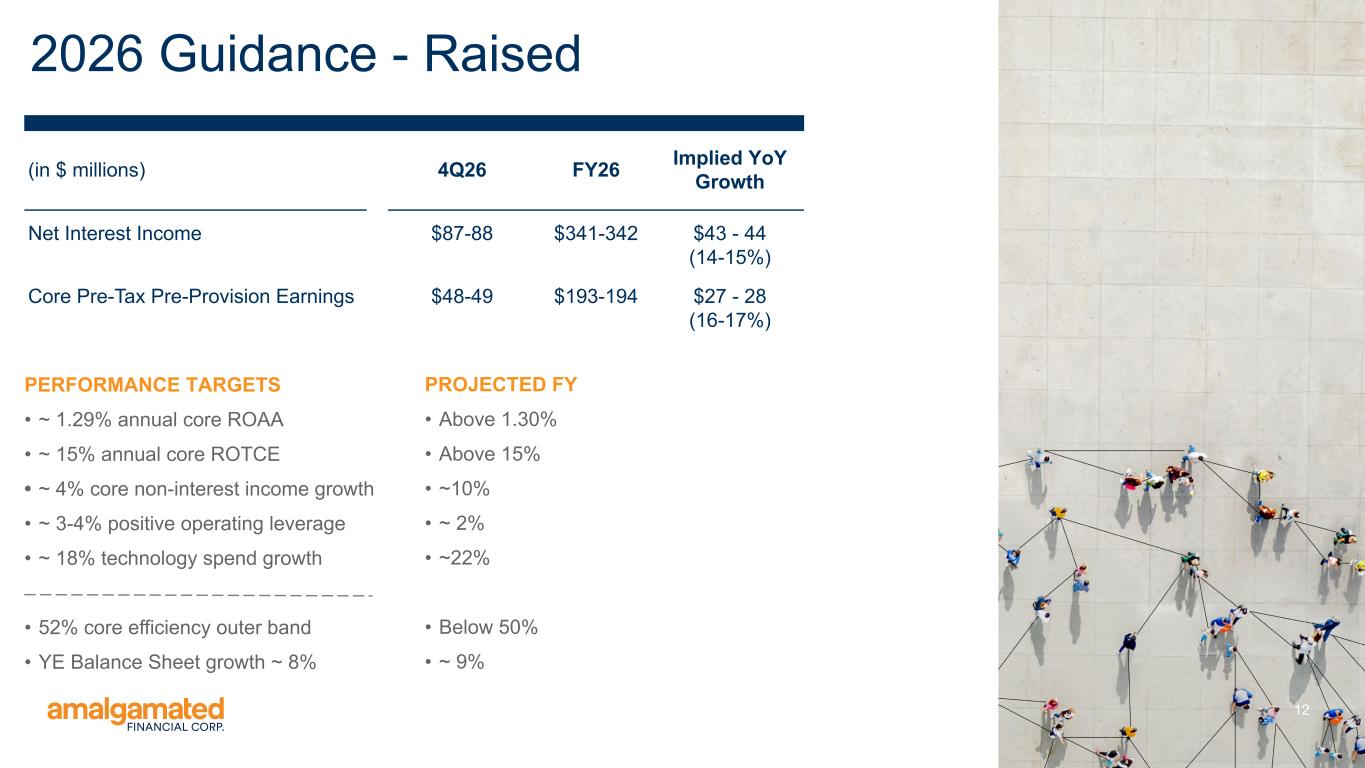
12 2026 Guidance - Raised PERFORMANCE TARGETS • ~ 1.29% annual core ROAA • ~ 15% annual core ROTCE • ~ 4% core non-interest income growth • ~ 3-4% positive operating leverage • ~ 18% technology spend growth • 52% core efficiency outer band • YE Balance Sheet growth ~ 8% (in $ millions) 4Q26 FY26 Implied YoY Growth Net Interest Income $87-88 $341-342 $43 - 44 (14-15%) Core Pre-Tax Pre-Provision Earnings $48-49 $193-194 $27 - 28 (16-17%) PROJECTED FY • Above 1.30% • Above 15% • ~10% • ~ 2% • ~22% • Below 50% • ~ 9%
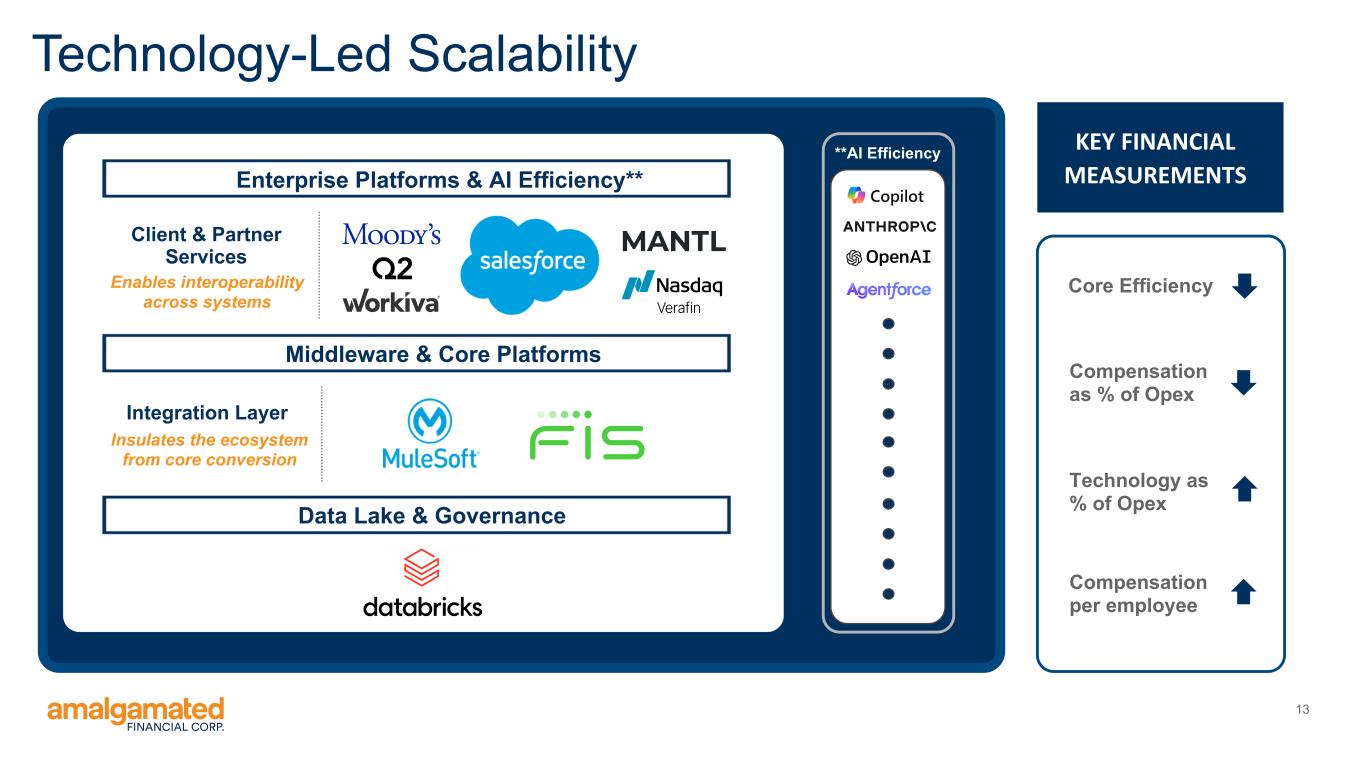
13 Enterprise Platforms & AI Efficiency** Middleware & Core Platforms Integration Layer Data Lake & Governance Technology-Led Scalability **AI Efficiency Insulates the ecosystem from core conversion Core Efficiency Compensation as % of Opex Technology as % of Opex Compensation per employee KEY FINANCIAL MEASUREMENTS Client & Partner Services Enables interoperability across systems
Appendix
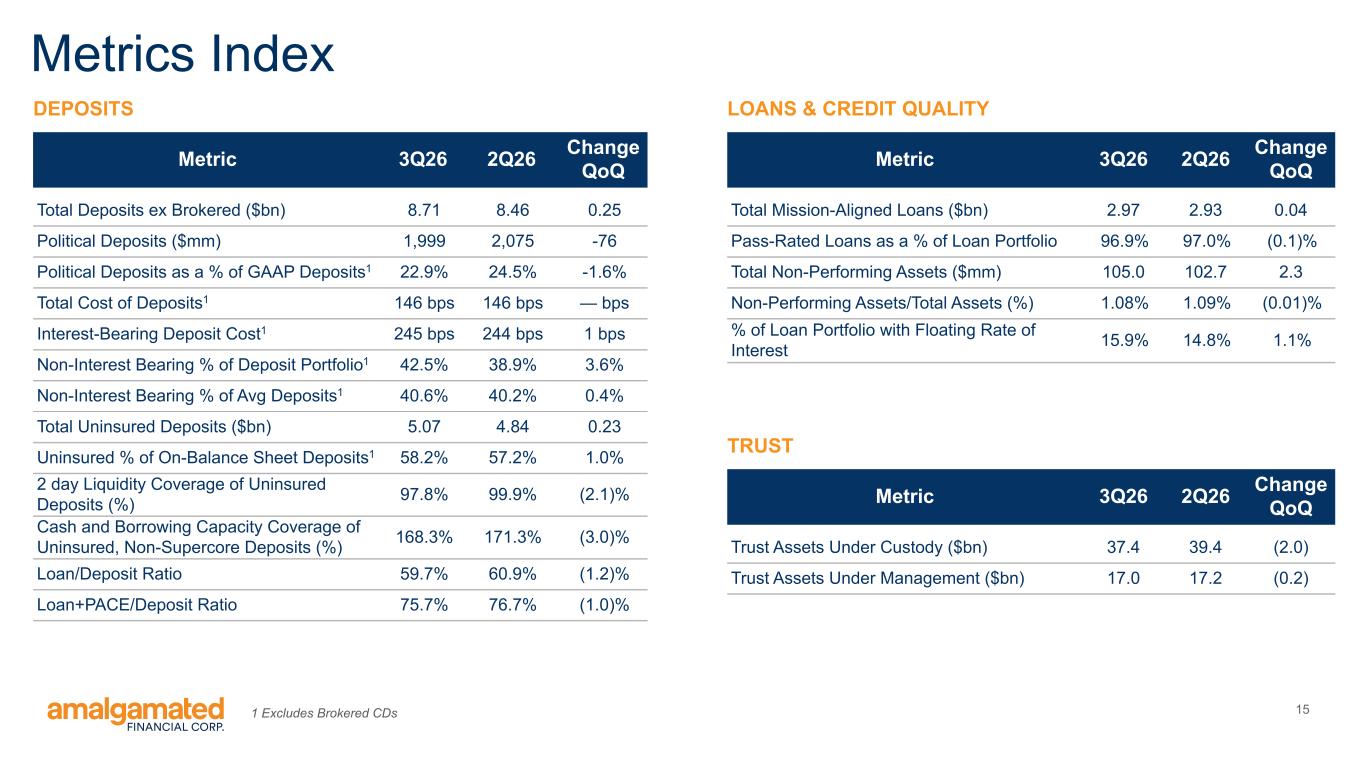
15 Metrics Index DEPOSITS Metric 3Q26 2Q26 Change QoQ Total Deposits ex Brokered ($bn) 8.71 8.46 0.25 Political Deposits ($mm) 1,999 2,075 -76 Political Deposits as a % of GAAP Deposits1 22.9% 24.5% -1.6% Total Cost of Deposits1 146 bps 146 bps — bps Interest-Bearing Deposit Cost1 245 bps 244 bps 1 bps Non-Interest Bearing % of Deposit Portfolio1 42.5% 38.9% 3.6% Non-Interest Bearing % of Avg Deposits1 40.6% 40.2% 0.4% Total Uninsured Deposits ($bn) 5.07 4.84 0.23 Uninsured % of On-Balance Sheet Deposits1 58.2% 57.2% 1.0% 2 day Liquidity Coverage of Uninsured Deposits (%) 97.8% 99.9% (2.1)% Cash and Borrowing Capacity Coverage of Uninsured, Non-Supercore Deposits (%) 168.3% 171.3% (3.0)% Loan/Deposit Ratio 59.7% 60.9% (1.2)% Loan+PACE/Deposit Ratio 75.7% 76.7% (1.0)% Metric 3Q26 2Q26 Change QoQ Total Mission-Aligned Loans ($bn) 2.97 2.93 0.04 Pass-Rated Loans as a % of Loan Portfolio 96.9% 97.0% (0.1)% Total Non-Performing Assets ($mm) 105.0 102.7 2.3 Non-Performing Assets/Total Assets (%) 1.08% 1.09% (0.01)% % of Loan Portfolio with Floating Rate of Interest 15.9% 14.8% 1.1% LOANS & CREDIT QUALITY Metric 3Q26 2Q26 Change QoQ Trust Assets Under Custody ($bn) 37.4 39.4 (2.0) Trust Assets Under Management ($bn) 17.0 17.2 (0.2) TRUST 1 Excludes Brokered CDs
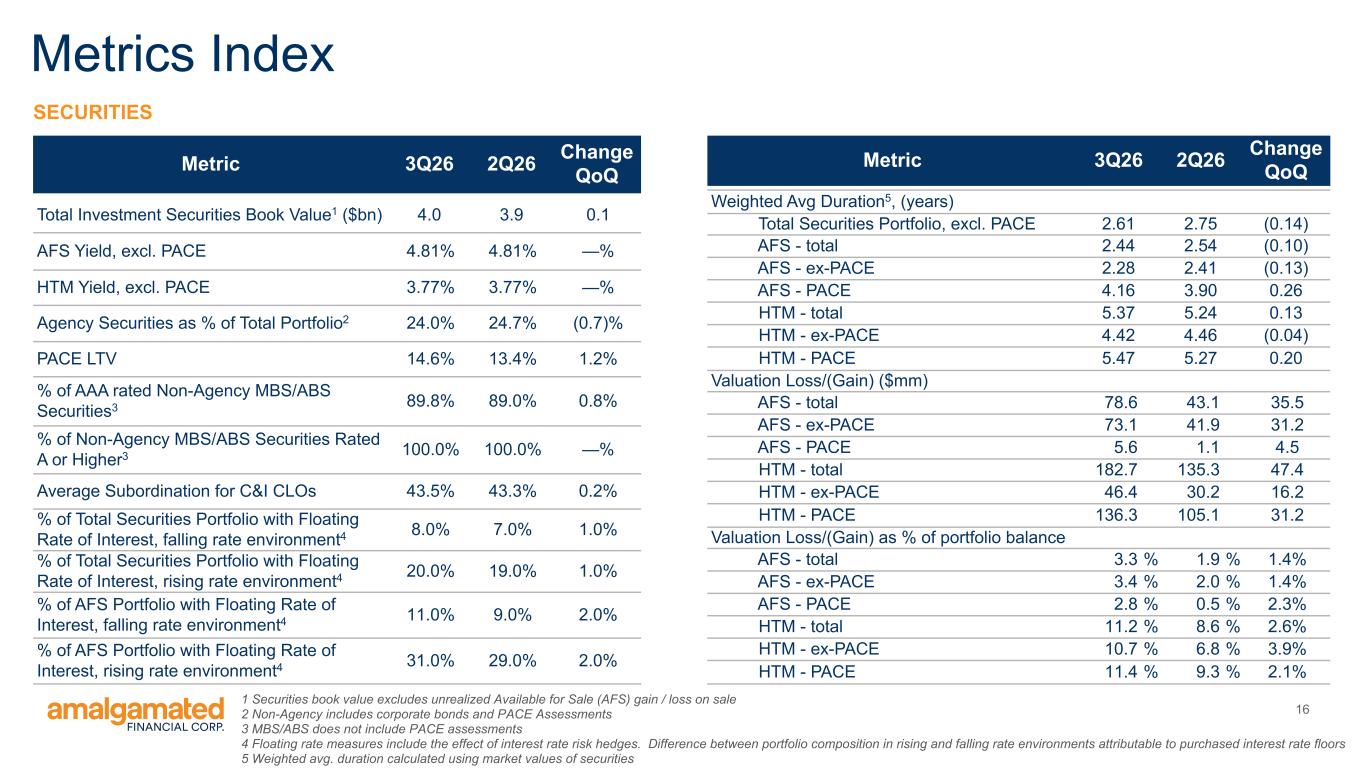
16 Metrics Index Metric 3Q26 2Q26 Change QoQ Total Investment Securities Book Value1 ($bn) 4.0 3.9 0.1 AFS Yield, excl. PACE 4.81% 4.81% —% HTM Yield, excl. PACE 3.77% 3.77% —% Agency Securities as % of Total Portfolio2 24.0% 24.7% (0.7)% PACE LTV 14.6% 13.4% 1.2% % of AAA rated Non-Agency MBS/ABS Securities3 89.8% 89.0% 0.8% % of Non-Agency MBS/ABS Securities Rated A or Higher3 100.0% 100.0% —% Average Subordination for C&I CLOs 43.5% 43.3% 0.2% % of Total Securities Portfolio with Floating Rate of Interest, falling rate environment4 8.0% 7.0% 1.0% % of Total Securities Portfolio with Floating Rate of Interest, rising rate environment4 20.0% 19.0% 1.0% % of AFS Portfolio with Floating Rate of Interest, falling rate environment4 11.0% 9.0% 2.0% % of AFS Portfolio with Floating Rate of Interest, rising rate environment4 31.0% 29.0% 2.0% SECURITIES Metric 3Q26 2Q26 Change QoQ Weighted Avg Duration5, (years) Total Securities Portfolio, excl. PACE 2.61 2.75 (0.14) AFS - total 2.44 2.54 (0.10) AFS - ex-PACE 2.28 2.41 (0.13) AFS - PACE 4.16 3.90 0.26 HTM - total 5.37 5.24 0.13 HTM - ex-PACE 4.42 4.46 (0.04) HTM - PACE 5.47 5.27 0.20 Valuation Loss/(Gain) ($mm) AFS - total 78.6 43.1 35.5 AFS - ex-PACE 73.1 41.9 31.2 AFS - PACE 5.6 1.1 4.5 HTM - total 182.7 135.3 47.4 HTM - ex-PACE 46.4 30.2 16.2 HTM - PACE 136.3 105.1 31.2 Valuation Loss/(Gain) as % of portfolio balance AFS - total 3.3 % 1.9 % 1.4% AFS - ex-PACE 3.4 % 2.0 % 1.4% AFS - PACE 2.8 % 0.5 % 2.3% HTM - total 11.2 % 8.6 % 2.6% HTM - ex-PACE 10.7 % 6.8 % 3.9% HTM - PACE 11.4 % 9.3 % 2.1% 1 Securities book value excludes unrealized Available for Sale (AFS) gain / loss on sale 2 Non-Agency includes corporate bonds and PACE Assessments 3 MBS/ABS does not include PACE assessments 4 Floating rate measures include the effect of interest rate risk hedges. Difference between portfolio composition in rising and falling rate environments attributable to purchased interest rate floors 5 Weighted avg. duration calculated using market values of securities
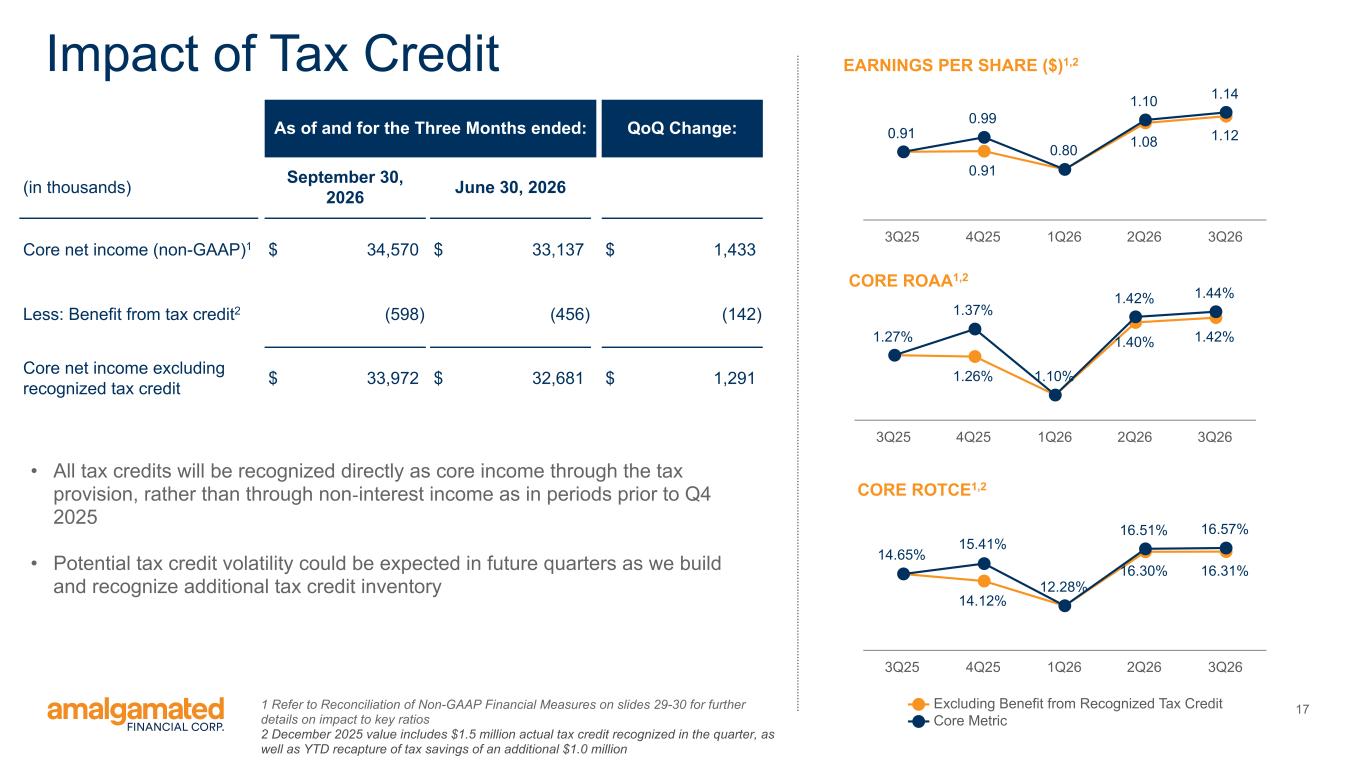
17 1.26% 1.40% 1.42%1.27% 1.37% 1.10% 1.42% 1.44% 3Q25 4Q25 1Q26 2Q26 3Q26 14.12% 16.30% 16.31% 14.65% 15.41% 12.28% 16.51% 16.57% Excluding Benefit from Recognized Tax Credit Core Metric 3Q25 4Q25 1Q26 2Q26 3Q26 CORE ROAA1,2 EARNINGS PER SHARE ($)1,2Impact of Tax Credit 1 Refer to Reconciliation of Non-GAAP Financial Measures on slides 29-30 for further details on impact to key ratios 2 December 2025 value includes $1.5 million actual tax credit recognized in the quarter, as well as YTD recapture of tax savings of an additional $1.0 million CORE ROTCE1,2 0.91 0.91 1.08 1.12 0.99 0.80 1.10 1.14 3Q25 4Q25 1Q26 2Q26 3Q26 As of and for the Three Months ended: QoQ Change: (in thousands) September 30, 2026 June 30, 2026 Core net income (non-GAAP)1 $ 34,570 $ 33,137 $ 1,433 Less: Benefit from tax credit2 (598) (456) (142) Core net income excluding recognized tax credit $ 33,972 $ 32,681 $ 1,291 • All tax credits will be recognized directly as core income through the tax provision, rather than through non‑interest income as in periods prior to Q4 2025 • Potential tax credit volatility could be expected in future quarters as we build and recognize additional tax credit inventory
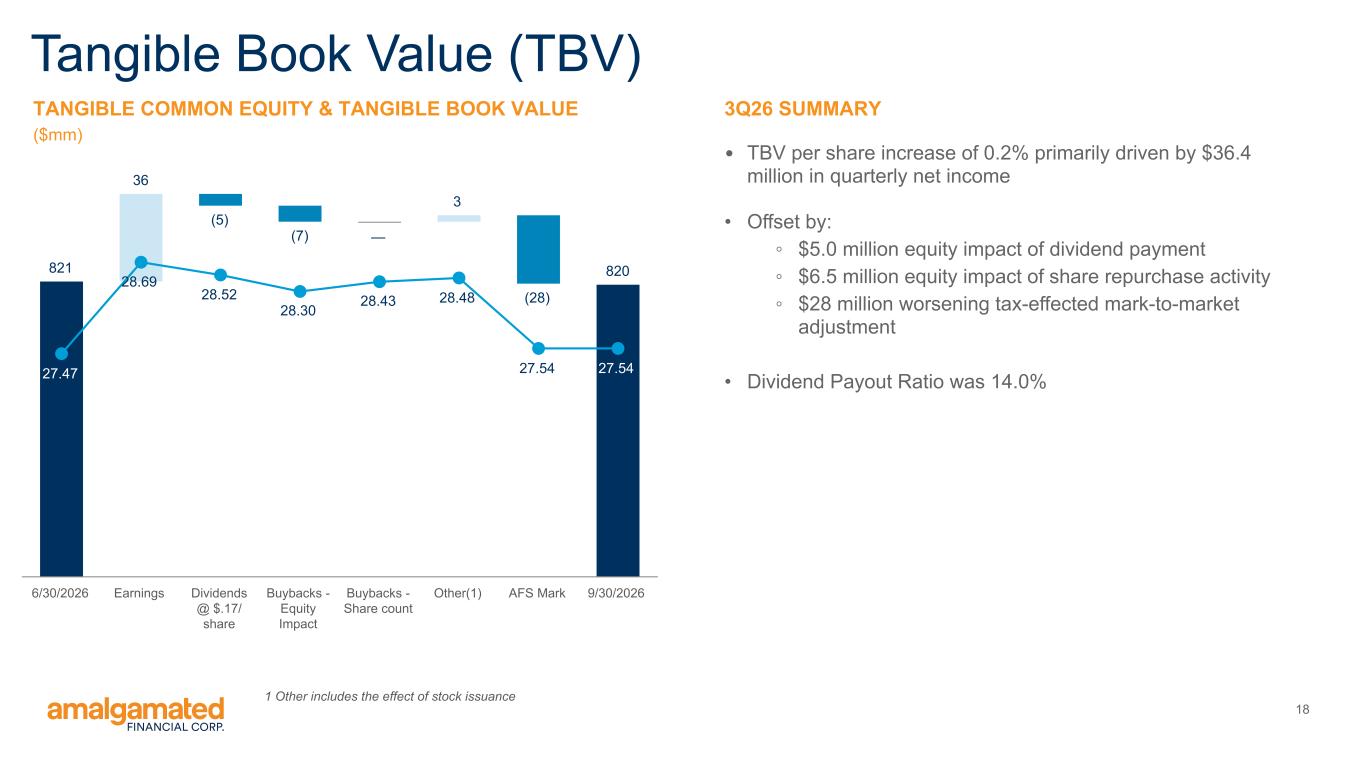
18 821 36 (5) (7) — 3 (28) 820 27.47 28.69 28.52 28.30 28.43 28.48 27.54 27.54 6/30/2026 Earnings Dividends @ $.17/ share Buybacks - Equity Impact Buybacks - Share count Other(1) AFS Mark 9/30/2026 3Q26 SUMMARY • TBV per share increase of 0.2% primarily driven by $36.4 million in quarterly net income • Offset by: ◦ $5.0 million equity impact of dividend payment ◦ $6.5 million equity impact of share repurchase activity ◦ $28 million worsening tax-effected mark-to-market adjustment • Dividend Payout Ratio was 14.0% Tangible Book Value (TBV) TANGIBLE COMMON EQUITY & TANGIBLE BOOK VALUE ($mm) 1 Other includes the effect of stock issuance
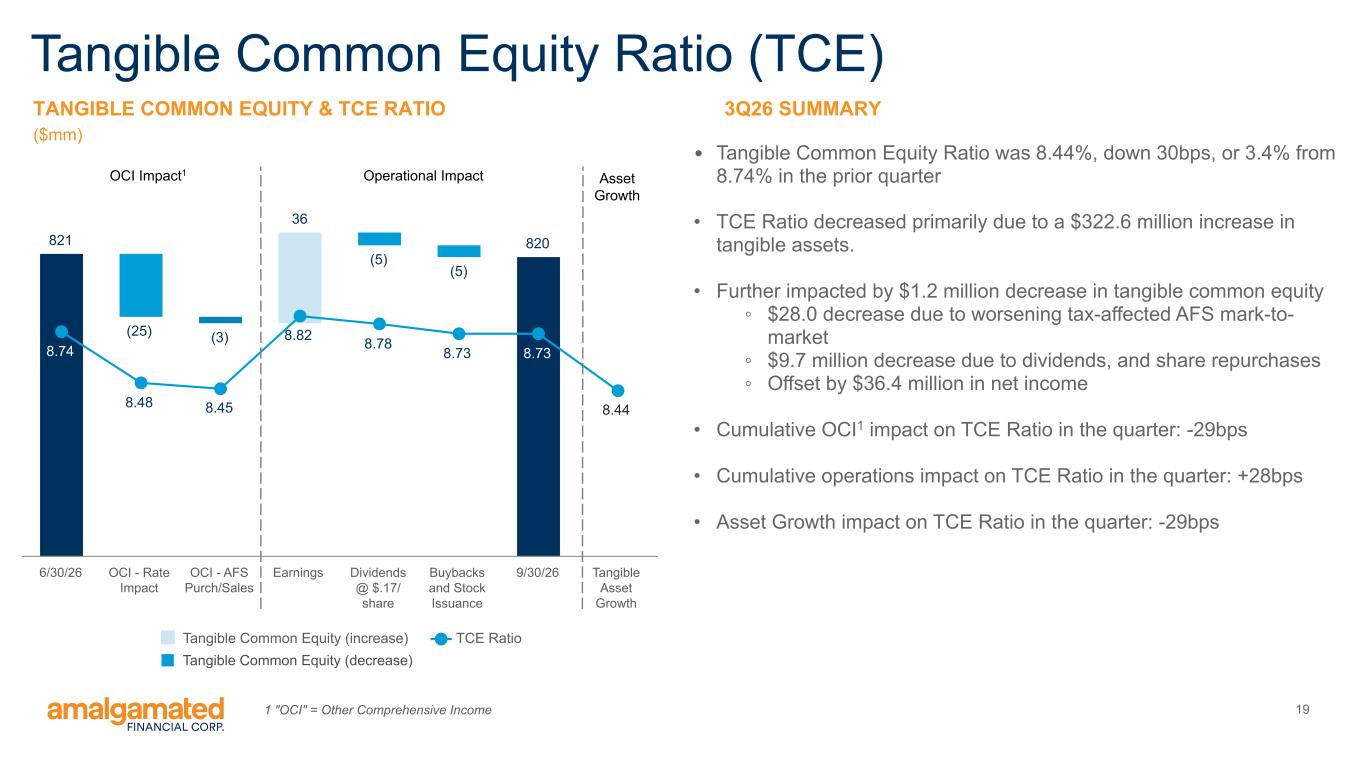
19 821 (25) (3) 36 (5) (5) 820 8.74 8.48 8.45 8.82 8.78 8.73 8.73 8.44 Tangible Common Equity (increase) TCE Ratio 6/30/26 OCI - Rate Impact OCI - AFS Purch/Sales Earnings Dividends @ $.17/ share Buybacks and Stock Issuance 9/30/26 Tangible Asset Growth 3Q26 SUMMARY • Tangible Common Equity Ratio was 8.44%, down 30bps, or 3.4% from 8.74% in the prior quarter • TCE Ratio decreased primarily due to a $322.6 million increase in tangible assets. • Further impacted by $1.2 million decrease in tangible common equity ◦ $28.0 decrease due to worsening tax-affected AFS mark-to- market ◦ $9.7 million decrease due to dividends, and share repurchases ◦ Offset by $36.4 million in net income • Cumulative OCI1 impact on TCE Ratio in the quarter: -29bps • Cumulative operations impact on TCE Ratio in the quarter: +28bps • Asset Growth impact on TCE Ratio in the quarter: -29bps Tangible Common Equity Ratio (TCE) TANGIBLE COMMON EQUITY & TCE RATIO ($mm) Operational ImpactOCI Impact1 Asset Growth 1 "OCI" = Other Comprehensive Income Tangible Common Equity (decrease)
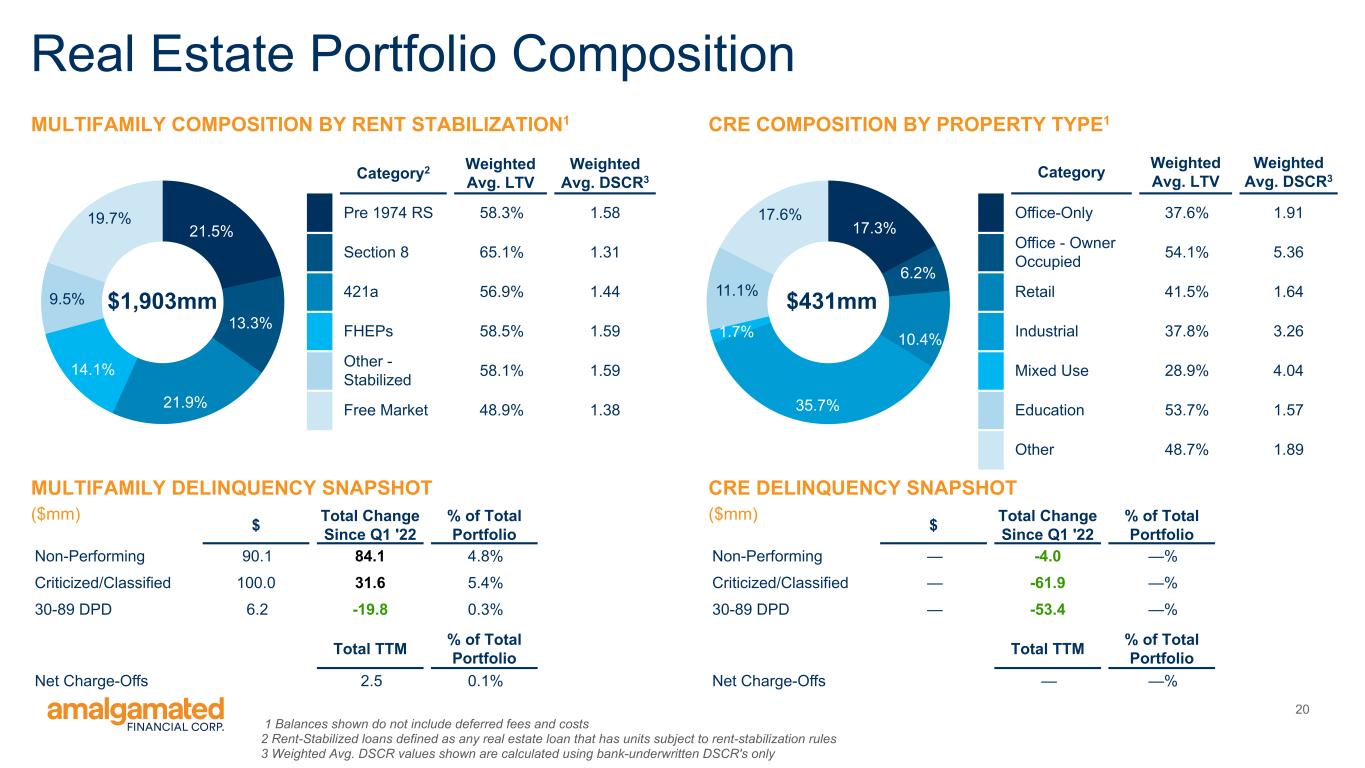
20 21.5% 13.3% 21.9% 14.1% 9.5% 19.7% Real Estate Portfolio Composition 17.3% 6.2% 10.4% 35.7% 1.7% 11.1% 17.6% CRE COMPOSITION BY PROPERTY TYPE1MULTIFAMILY COMPOSITION BY RENT STABILIZATION1 Category2 Weighted Avg. LTV Weighted Avg. DSCR3 Pre 1974 RS 58.3% 1.58 Section 8 65.1% 1.31 421a 56.9% 1.44 FHEPs 58.5% 1.59 Other - Stabilized 58.1% 1.59 Free Market 48.9% 1.38 Category Weighted Avg. LTV Weighted Avg. DSCR3 Office-Only 37.6% 1.91 Office - Owner Occupied 54.1% 5.36 Retail 41.5% 1.64 Industrial 37.8% 3.26 Mixed Use 28.9% 4.04 Education 53.7% 1.57 Other 48.7% 1.89 $431mm$1,903mm MULTIFAMILY DELINQUENCY SNAPSHOT ($mm) CRE DELINQUENCY SNAPSHOT ($mm)$ Total Change Since Q1 '22 % of Total Portfolio Non-Performing 90.1 84.1 4.8% Criticized/Classified 100.0 31.6 5.4% 30-89 DPD 6.2 -19.8 0.3% Total TTM % of Total Portfolio Net Charge-Offs 2.5 0.1% $ Total Change Since Q1 '22 % of Total Portfolio Non-Performing — -4.0 —% Criticized/Classified — -61.9 —% 30-89 DPD — -53.4 —% Total TTM % of Total Portfolio Net Charge-Offs — —% 1 Balances shown do not include deferred fees and costs 2 Rent-Stabilized loans defined as any real estate loan that has units subject to rent-stabilization rules 3 Weighted Avg. DSCR values shown are calculated using bank-underwritten DSCR's only
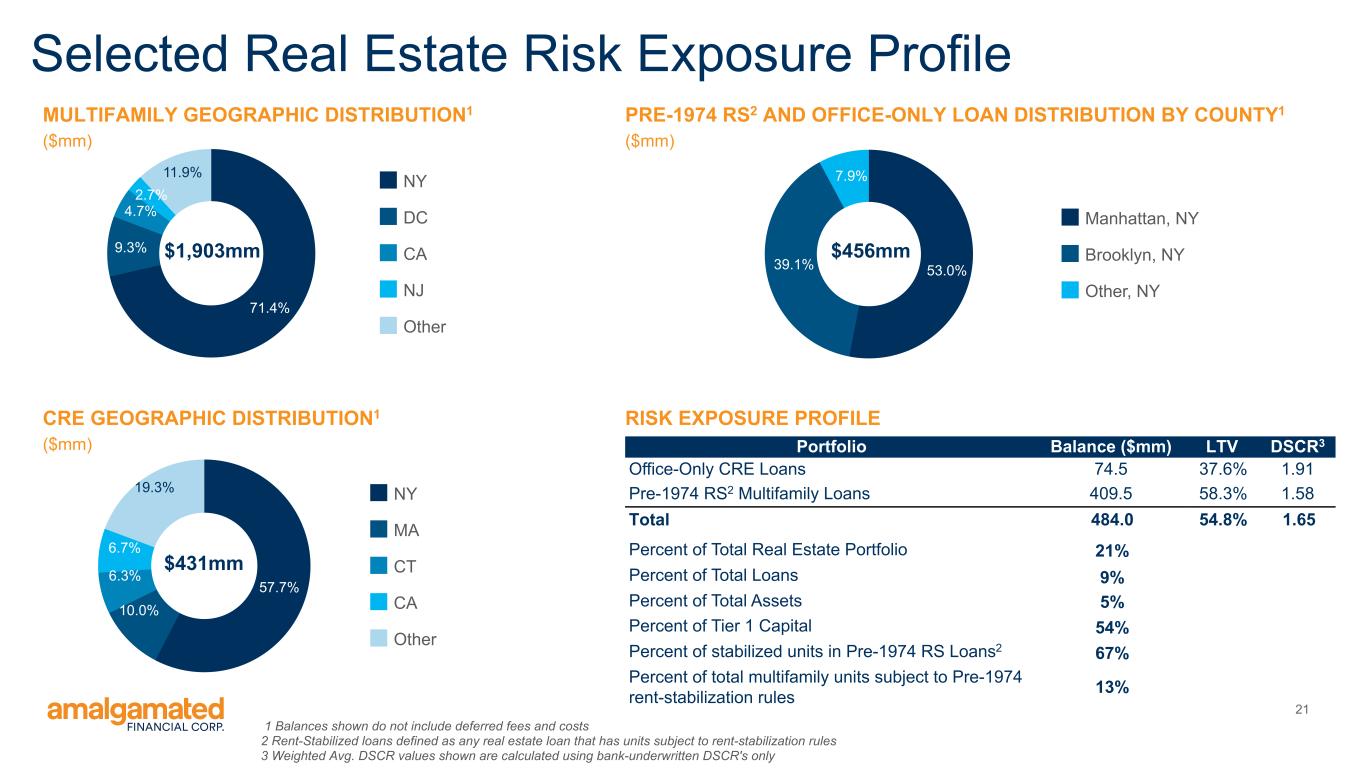
21 Selected Real Estate Risk Exposure Profile RISK EXPOSURE PROFILE PRE-1974 RS2 AND OFFICE-ONLY LOAN DISTRIBUTION BY COUNTY1 ($mm) 53.0%39.1% 7.9% Manhattan, NY Brooklyn, NY Other, NY $456mm Portfolio Balance ($mm) LTV DSCR3 Office-Only CRE Loans 74.5 37.6% 1.91 Pre-1974 RS2 Multifamily Loans 409.5 58.3% 1.58 Total 484.0 54.8% 1.65 Percent of Total Real Estate Portfolio 21% Percent of Total Loans 9% Percent of Total Assets 5% Percent of Tier 1 Capital 54% Percent of stabilized units in Pre-1974 RS Loans2 67% Percent of total multifamily units subject to Pre-1974 rent-stabilization rules 13% 1 Balances shown do not include deferred fees and costs 2 Rent-Stabilized loans defined as any real estate loan that has units subject to rent-stabilization rules 3 Weighted Avg. DSCR values shown are calculated using bank-underwritten DSCR's only MULTIFAMILY GEOGRAPHIC DISTRIBUTION1 ($mm) 71.4% 9.3% 4.7% 2.7% 11.9% NY DC CA NJ Other $1,903mm CRE GEOGRAPHIC DISTRIBUTION1 ($mm) 57.7% 10.0% 6.3% 6.7% 19.3% NY MA CT CA Other $431mm
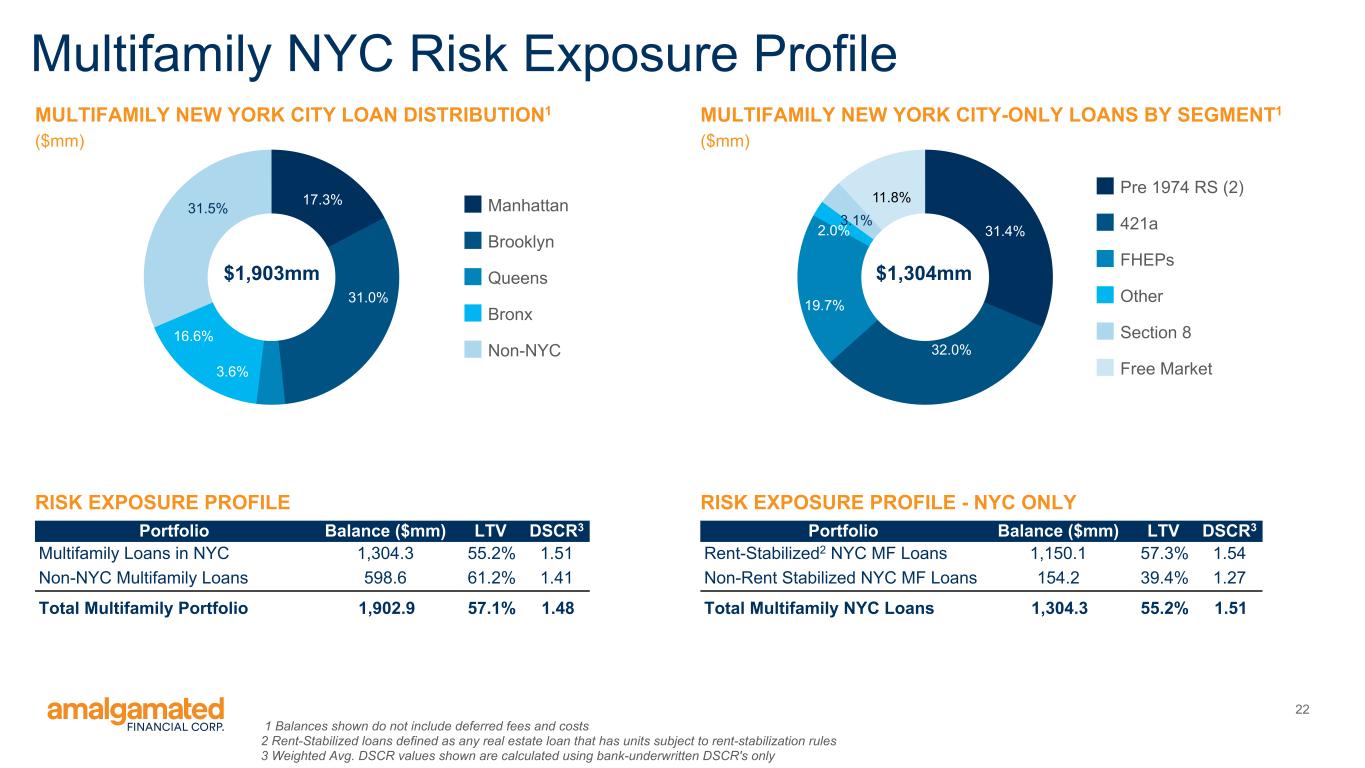
22 Multifamily NYC Risk Exposure Profile 1 Balances shown do not include deferred fees and costs 2 Rent-Stabilized loans defined as any real estate loan that has units subject to rent-stabilization rules 3 Weighted Avg. DSCR values shown are calculated using bank-underwritten DSCR's only RISK EXPOSURE PROFILE MULTIFAMILY NEW YORK CITY LOAN DISTRIBUTION1 ($mm) 17.3% 31.0% 3.6% 16.6% 31.5% Manhattan Brooklyn Queens Bronx Non-NYC $1,903mm Portfolio Balance ($mm) LTV DSCR3 Multifamily Loans in NYC 1,304.3 55.2% 1.51 Non-NYC Multifamily Loans 598.6 61.2% 1.41 Total Multifamily Portfolio 1,902.9 57.1% 1.48 RISK EXPOSURE PROFILE - NYC ONLY MULTIFAMILY NEW YORK CITY-ONLY LOANS BY SEGMENT1 ($mm) 31.4% 32.0% 19.7% 2.0% 3.1% 11.8% Pre 1974 RS (2) 421a FHEPs Other Section 8 Free Market $1,304mm Portfolio Balance ($mm) LTV DSCR3 Rent-Stabilized2 NYC MF Loans 1,150.1 57.3% 1.54 Non-Rent Stabilized NYC MF Loans 154.2 39.4% 1.27 Total Multifamily NYC Loans 1,304.3 55.2% 1.51
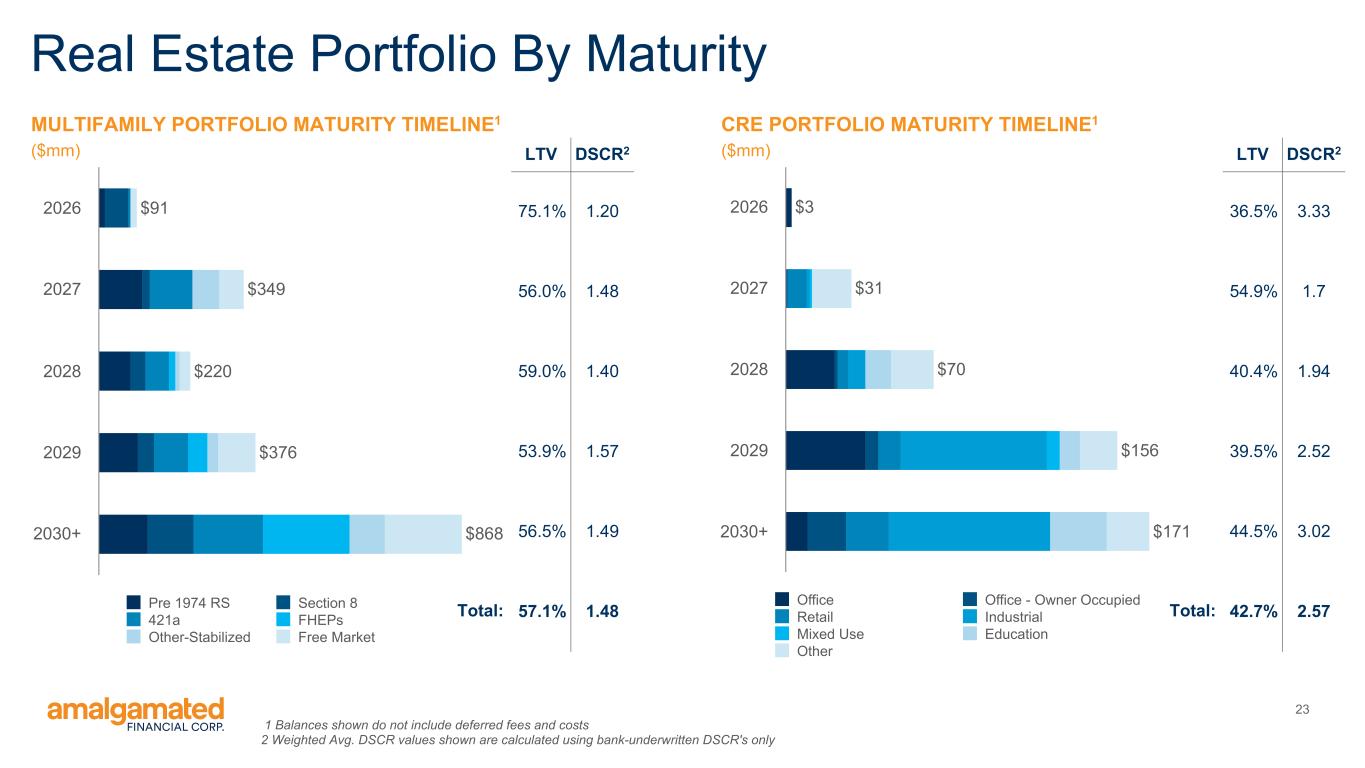
23 Real Estate Portfolio By Maturity MULTIFAMILY PORTFOLIO MATURITY TIMELINE1 ($mm) $91 $349 $220 $376 $868 Pre 1974 RS Section 8 421a FHEPs Other-Stabilized Free Market 2026 2027 2028 2029 2030+ CRE PORTFOLIO MATURITY TIMELINE1 ($mm) $3 $31 $70 $156 $171 Office Office - Owner Occupied Retail Industrial Mixed Use Education Other 2026 2027 2028 2029 2030+ LTV DSCR2 75.1% 1.20 56.0% 1.48 59.0% 1.40 53.9% 1.57 56.5% 1.49 57.1% 1.48 LTV DSCR2 36.5% 3.33 54.9% 1.7 40.4% 1.94 39.5% 2.52 44.5% 3.02 42.7% 2.57Total:Total: 1 Balances shown do not include deferred fees and costs 2 Weighted Avg. DSCR values shown are calculated using bank-underwritten DSCR's only
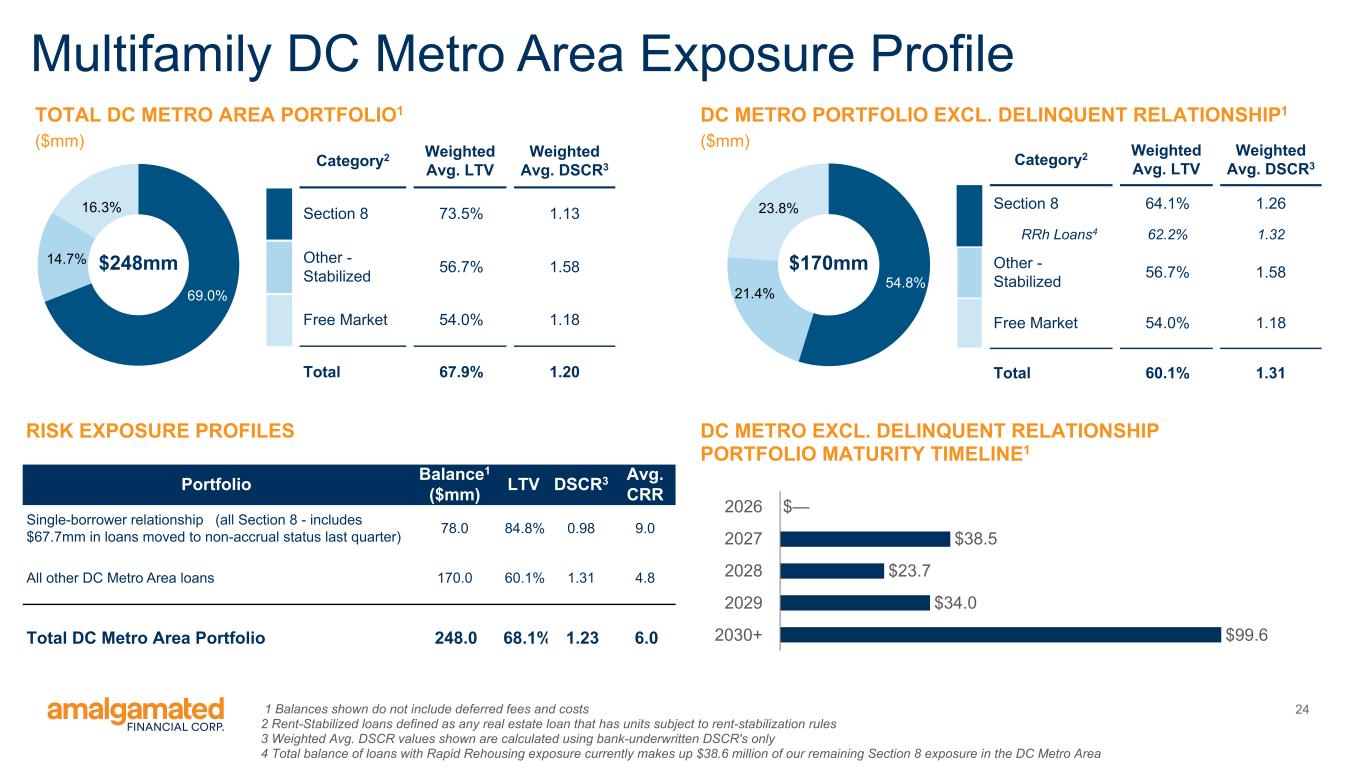
24 Multifamily DC Metro Area Exposure Profile 1 Balances shown do not include deferred fees and costs 2 Rent-Stabilized loans defined as any real estate loan that has units subject to rent-stabilization rules 3 Weighted Avg. DSCR values shown are calculated using bank-underwritten DSCR's only 4 Total balance of loans with Rapid Rehousing exposure currently makes up $38.6 million of our remaining Section 8 exposure in the DC Metro Area RISK EXPOSURE PROFILES TOTAL DC METRO AREA PORTFOLIO1 ($mm) Portfolio Balance1 ($mm) LTV DSCR3 Avg. CRR Single-borrower relationship (all Section 8 - includes $67.7mm in loans moved to non-accrual status last quarter) 78.0 84.8% 0.98 9.0 All other DC Metro Area loans 170.0 60.1% 1.31 4.8 Total DC Metro Area Portfolio 248.0 68.1% 1.23 6.0 DC METRO PORTFOLIO EXCL. DELINQUENT RELATIONSHIP1 ($mm) 69.0% 14.7% 16.3% $248mm Category2 Weighted Avg. LTV Weighted Avg. DSCR3 Section 8 73.5% 1.13 Other - Stabilized 56.7% 1.58 Free Market 54.0% 1.18 Total 67.9% 1.20 54.8% 21.4% 23.8% Category2 Weighted Avg. LTV Weighted Avg. DSCR3 Section 8 64.1% 1.26 RRh Loans4 62.2% 1.32 Other - Stabilized 56.7% 1.58 Free Market 54.0% 1.18 Total 60.1% 1.31 $170mm $— $38.5 $23.7 $34.0 $99.6 2026 2027 2028 2029 2030+ DC METRO EXCL. DELINQUENT RELATIONSHIP PORTFOLIO MATURITY TIMELINE1
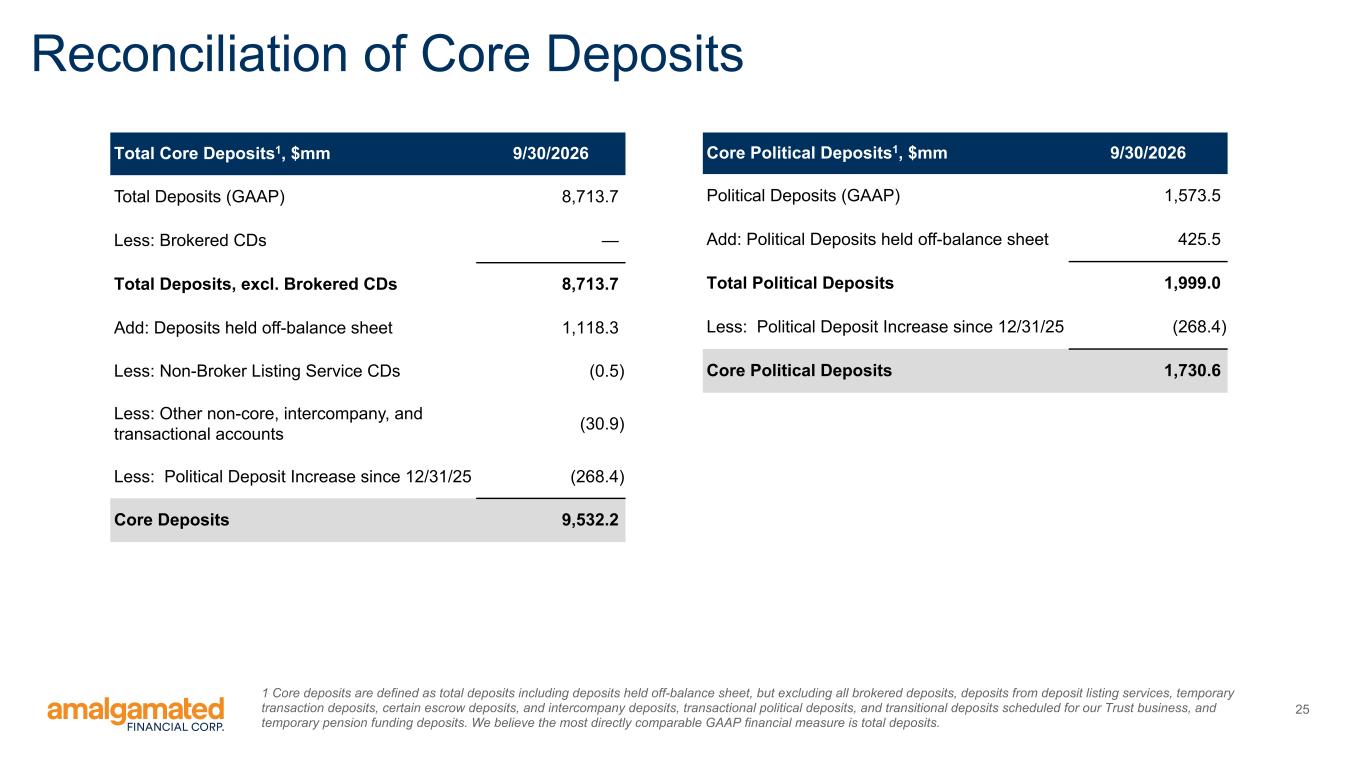
25 Reconciliation of Core Deposits Total Core Deposits1, $mm 9/30/2026 Total Deposits (GAAP) 8,713.7 Less: Brokered CDs — Total Deposits, excl. Brokered CDs 8,713.7 Add: Deposits held off-balance sheet 1,118.3 Less: Non-Broker Listing Service CDs (0.5) Less: Other non-core, intercompany, and transactional accounts (30.9) Less: Political Deposit Increase since 12/31/25 (268.4) Core Deposits 9,532.2 Core Political Deposits1, $mm 9/30/2026 Political Deposits (GAAP) 1,573.5 Add: Political Deposits held off-balance sheet 425.5 Total Political Deposits 1,999.0 Less: Political Deposit Increase since 12/31/25 (268.4) Core Political Deposits 1,730.6 1 Core deposits are defined as total deposits including deposits held off-balance sheet, but excluding all brokered deposits, deposits from deposit listing services, temporary transaction deposits, certain escrow deposits, and intercompany deposits, transactional political deposits, and transitional deposits scheduled for our Trust business, and temporary pension funding deposits. We believe the most directly comparable GAAP financial measure is total deposits.
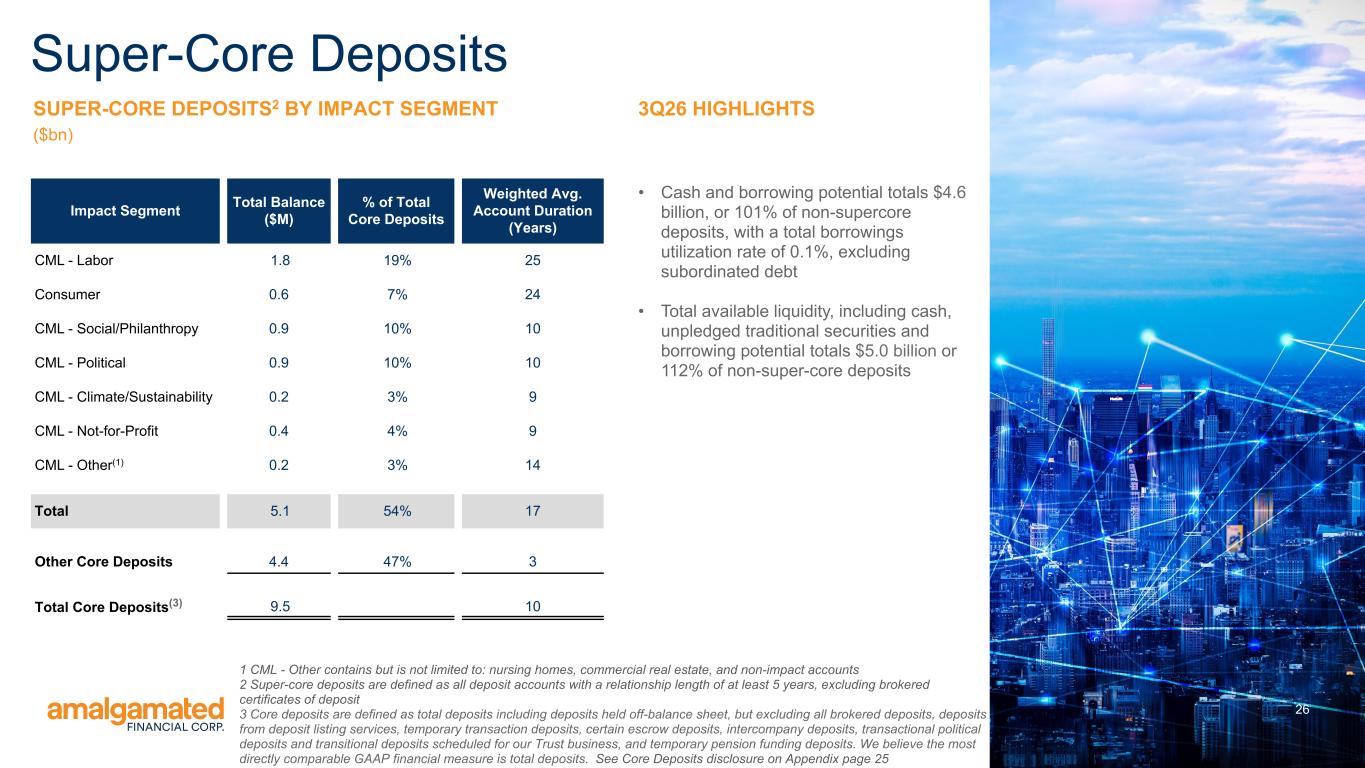
26 SUPER-CORE DEPOSITS2 BY IMPACT SEGMENT ($bn) 3Q26 HIGHLIGHTS • Cash and borrowing potential totals $4.6 billion, or 101% of non-supercore deposits, with a total borrowings utilization rate of 0.1%, excluding subordinated debt • Total available liquidity, including cash, unpledged traditional securities and borrowing potential totals $5.0 billion or 112% of non-super-core deposits Impact Segment Total Balance ($M) % of Total Core Deposits Weighted Avg. Account Duration (Years) CML - Labor 1.8 19% 25 Consumer 0.6 7% 24 CML - Social/Philanthropy 0.9 10% 10 CML - Political 0.9 10% 10 CML - Climate/Sustainability 0.2 3% 9 CML - Not-for-Profit 0.4 4% 9 CML - Other(1) 0.2 3% 14 Total 5.1 54% 17 Other Core Deposits 4.4 47% 3 Total Core Deposits(3) 9.5 10 Super-Core Deposits 1 CML - Other contains but is not limited to: nursing homes, commercial real estate, and non-impact accounts 2 Super-core deposits are defined as all deposit accounts with a relationship length of at least 5 years, excluding brokered certificates of deposit 3 Core deposits are defined as total deposits including deposits held off-balance sheet, but excluding all brokered deposits, deposits from deposit listing services, temporary transaction deposits, certain escrow deposits, intercompany deposits, transactional political deposits and transitional deposits scheduled for our Trust business, and temporary pension funding deposits. We believe the most directly comparable GAAP financial measure is total deposits. See Core Deposits disclosure on Appendix page 25
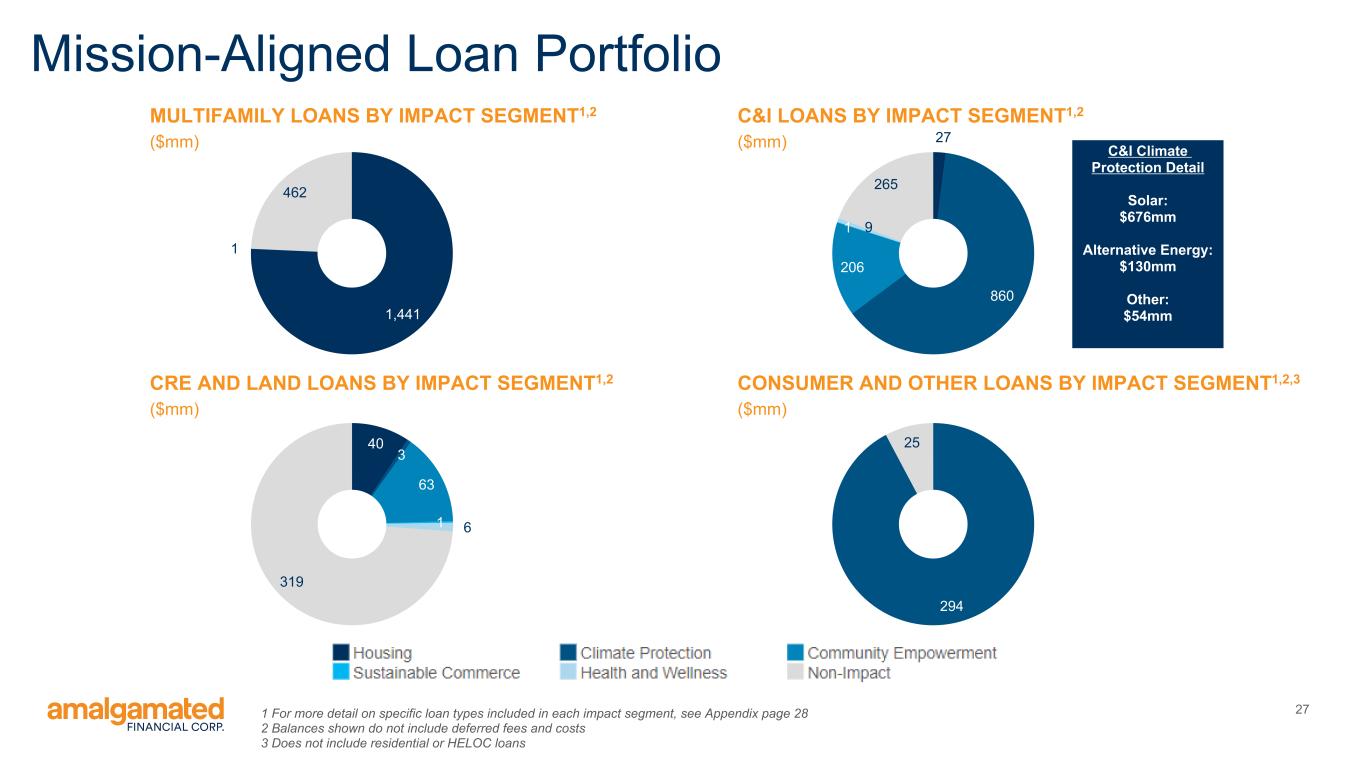
271 For more detail on specific loan types included in each impact segment, see Appendix page 28 2 Balances shown do not include deferred fees and costs 3 Does not include residential or HELOC loans Mission-Aligned Loan Portfolio 1,441 1 462 CRE AND LAND LOANS BY IMPACT SEGMENT1,2 ($mm) 40 3 63 1 6 319 C&I LOANS BY IMPACT SEGMENT1,2 ($mm) 27 860 206 1 9 265 CONSUMER AND OTHER LOANS BY IMPACT SEGMENT1,2,3 ($mm) 294 25 C&I Climate Protection Detail Solar: $676mm Alternative Energy: $130mm Other: $54mm MULTIFAMILY LOANS BY IMPACT SEGMENT1,2 ($mm)
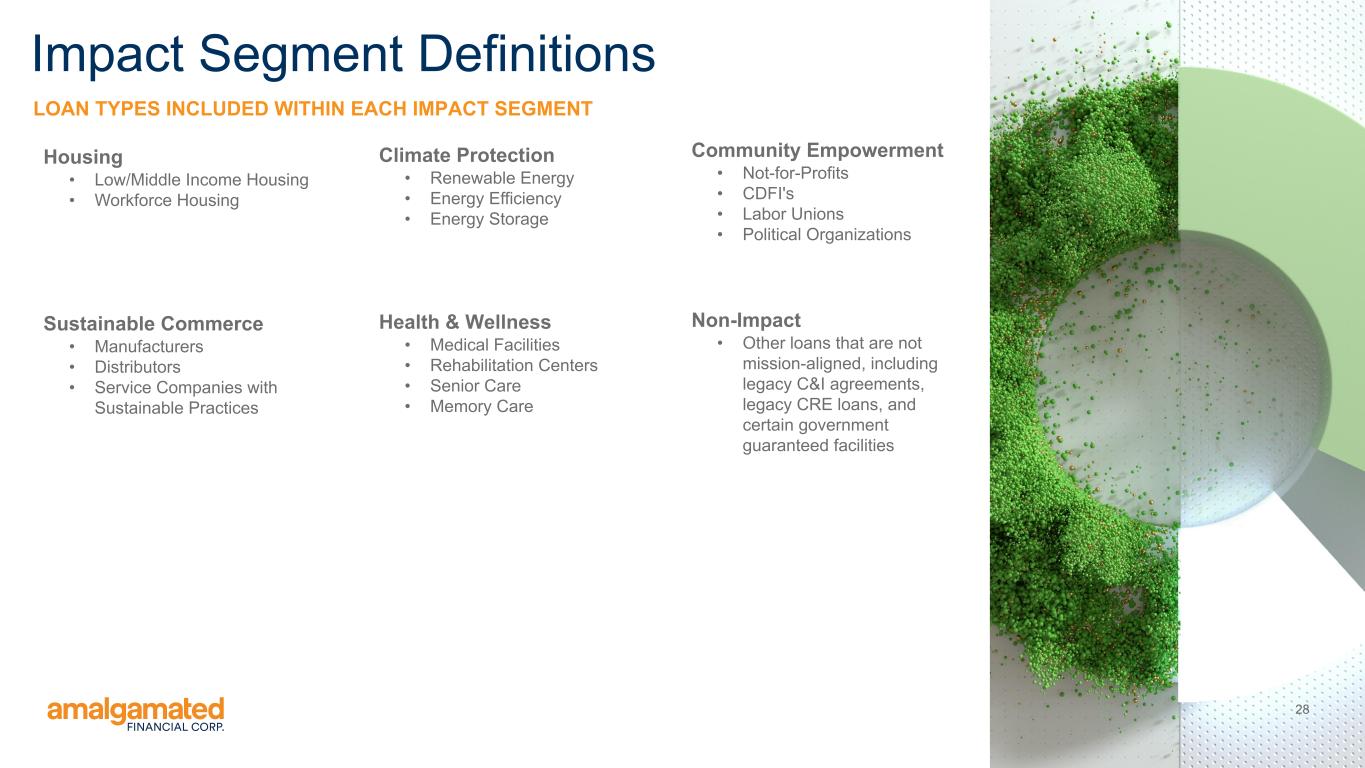
28 LOAN TYPES INCLUDED WITHIN EACH IMPACT SEGMENT Impact Segment Definitions Climate Protection • Renewable Energy • Energy Efficiency • Energy Storage Community Empowerment • Not-for-Profits • CDFI's • Labor Unions • Political Organizations Health & Wellness • Medical Facilities • Rehabilitation Centers • Senior Care • Memory Care Housing • Low/Middle Income Housing • Workforce Housing Sustainable Commerce • Manufacturers • Distributors • Service Companies with Sustainable Practices Non-Impact • Other loans that are not mission-aligned, including legacy C&I agreements, legacy CRE loans, and certain government guaranteed facilities
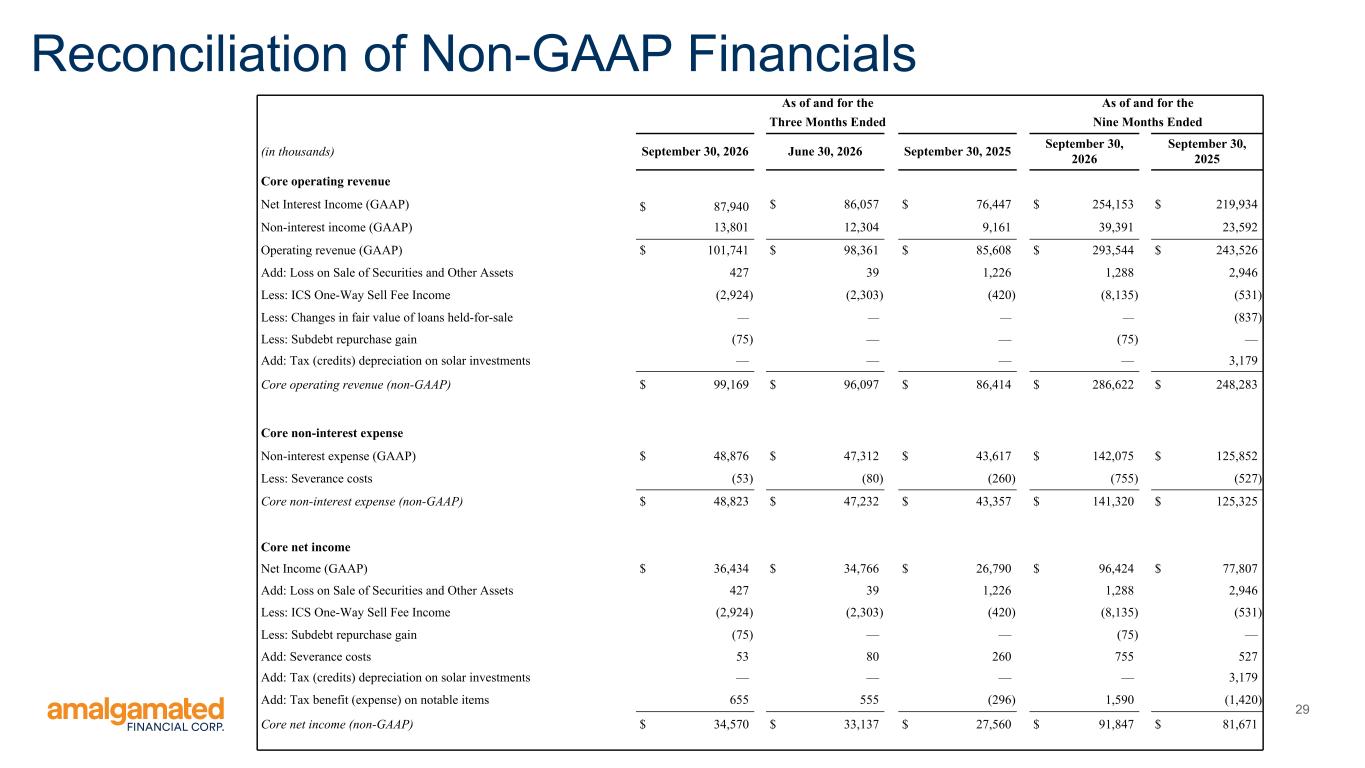
29 Reconciliation of Non-GAAP Financials As of and for the As of and for the Three Months Ended Nine Months Ended (in thousands) September 30, 2026 June 30, 2026 September 30, 2025 September 30, 2026 September 30, 2025 Core operating revenue Net Interest Income (GAAP) $ 87,940 $ 86,057 $ 76,447 $ 254,153 $ 219,934 Non-interest income (GAAP) 13,801 12,304 9,161 39,391 23,592 Operating revenue (GAAP) $ 101,741 $ 98,361 $ 85,608 $ 293,544 $ 243,526 Add: Loss on Sale of Securities and Other Assets 427 39 1,226 1,288 2,946 Less: ICS One-Way Sell Fee Income (2,924) (2,303) (420) (8,135) (531) Less: Changes in fair value of loans held-for-sale — — — — (837) Less: Subdebt repurchase gain (75) — — (75) — Add: Tax (credits) depreciation on solar investments — — — — 3,179 Core operating revenue (non-GAAP) $ 99,169 $ 96,097 $ 86,414 $ 286,622 $ 248,283 Core non-interest expense Non-interest expense (GAAP) $ 48,876 $ 47,312 $ 43,617 $ 142,075 $ 125,852 Less: Severance costs (53) (80) (260) (755) (527) Core non-interest expense (non-GAAP) $ 48,823 $ 47,232 $ 43,357 $ 141,320 $ 125,325 Core net income Net Income (GAAP) $ 36,434 $ 34,766 $ 26,790 $ 96,424 $ 77,807 Add: Loss on Sale of Securities and Other Assets 427 39 1,226 1,288 2,946 Less: ICS One-Way Sell Fee Income (2,924) (2,303) (420) (8,135) (531) Less: Subdebt repurchase gain (75) — — (75) — Add: Severance costs 53 80 260 755 527 Add: Tax (credits) depreciation on solar investments — — — — 3,179 Add: Tax benefit (expense) on notable items 655 555 (296) 1,590 (1,420) Core net income (non-GAAP) $ 34,570 $ 33,137 $ 27,560 $ 91,847 $ 81,671
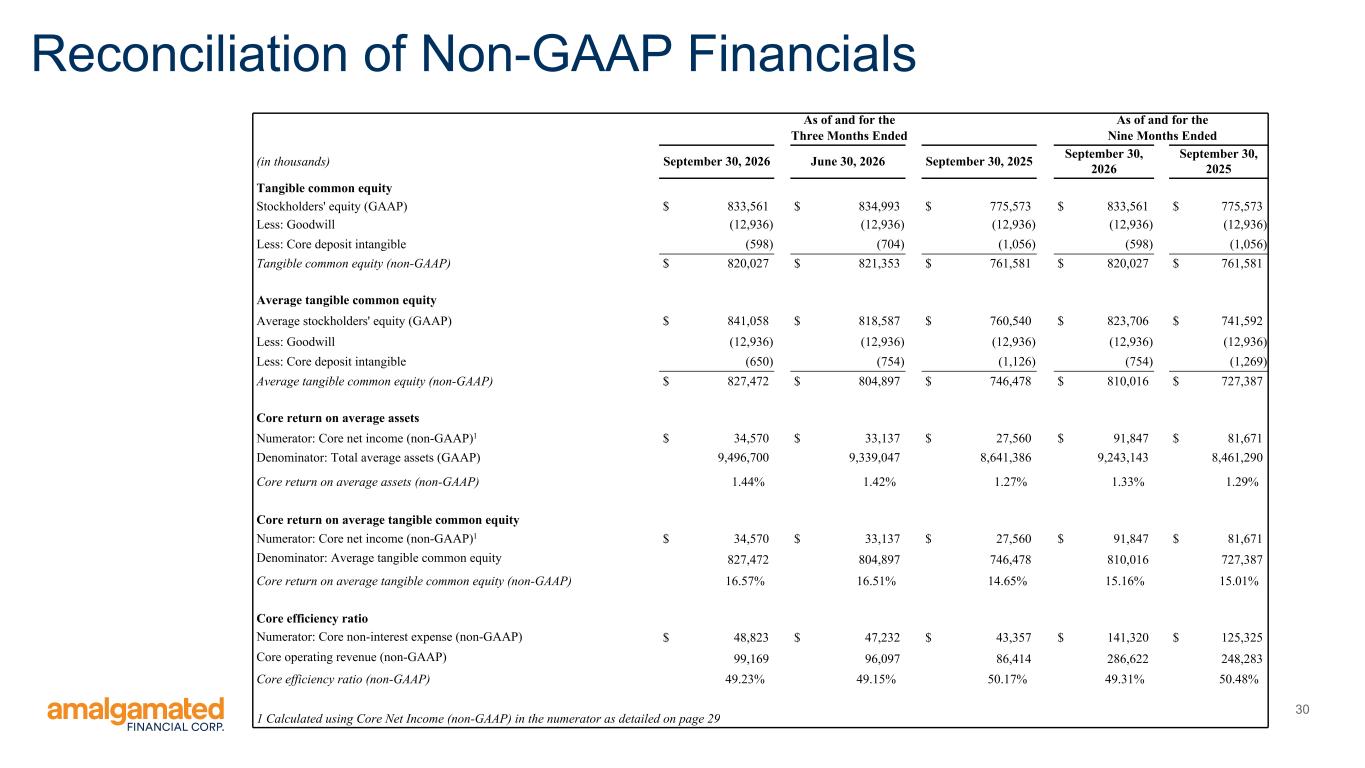
30 Reconciliation of Non-GAAP Financials As of and for the As of and for the Three Months Ended Nine Months Ended (in thousands) September 30, 2026 June 30, 2026 September 30, 2025 September 30, 2026 September 30, 2025 Tangible common equity Stockholders' equity (GAAP) $ 833,561 $ 834,993 $ 775,573 $ 833,561 $ 775,573 Less: Goodwill (12,936) (12,936) (12,936) (12,936) (12,936) Less: Core deposit intangible (598) (704) (1,056) (598) (1,056) Tangible common equity (non-GAAP) $ 820,027 $ 821,353 $ 761,581 $ 820,027 $ 761,581 Average tangible common equity Average stockholders' equity (GAAP) $ 841,058 $ 818,587 $ 760,540 $ 823,706 $ 741,592 Less: Goodwill (12,936) (12,936) (12,936) (12,936) (12,936) Less: Core deposit intangible (650) (754) (1,126) (754) (1,269) Average tangible common equity (non-GAAP) $ 827,472 $ 804,897 $ 746,478 $ 810,016 $ 727,387 Core return on average assets Numerator: Core net income (non-GAAP)1 $ 34,570 $ 33,137 $ 27,560 $ 91,847 $ 81,671 Denominator: Total average assets (GAAP) 9,496,700 9,339,047 8,641,386 9,243,143 8,461,290 Core return on average assets (non-GAAP) 1.44% 1.42% 1.27% 1.33% 1.29% Core return on average tangible common equity Numerator: Core net income (non-GAAP)1 $ 34,570 $ 33,137 $ 27,560 $ 91,847 $ 81,671 Denominator: Average tangible common equity 827,472 804,897 746,478 810,016 727,387 Core return on average tangible common equity (non-GAAP) 16.57% 16.51% 14.65% 15.16% 15.01% Core efficiency ratio Numerator: Core non-interest expense (non-GAAP) $ 48,823 $ 47,232 $ 43,357 $ 141,320 $ 125,325 Core operating revenue (non-GAAP) 99,169 96,097 86,414 286,622 248,283 Core efficiency ratio (non-GAAP) 49.23% 49.15% 50.17% 49.31% 50.48% 1 Calculated using Core Net Income (non-GAAP) in the numerator as detailed on page 29

Thank You amalgamatedbank.com Member FDIC