
.2
3Q’25 Earnings Release
ir.vincicompass.com
November 13th, 2025
Vinci Compass Reports Third Quarter 2025 Results
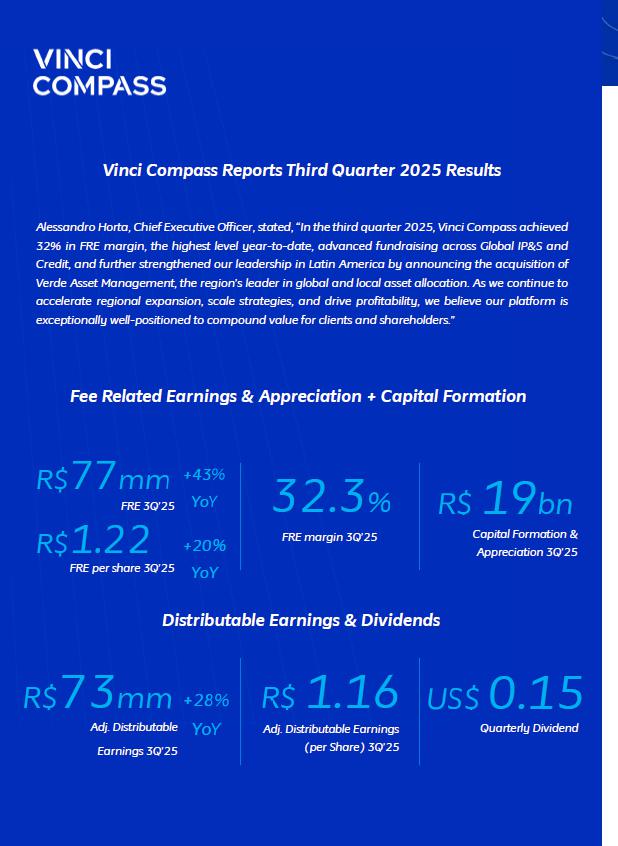
Vinci Compass Reports Third Quarter 2025 Results Alessandro Horta, Chief Executive Officer, stated, “In the third quarter 2025, Vinci Compass achieved 32% in FRE margin, the highest level year-to-date, advanced fundraising across Global IP&S and Credit, and further strengthened our leadership in Latin America by announcing the acquisition of Verde Asset Management, the region’s leader in global and local asset allocation. As we continue to accelerate regional expansion, scale strategies, and drive profitability, we believe our platform is exceptionally well-positioned to compound value for clients and shareholders.” Fee Related Earnings & Appreciation + Capital Formation
Fee Related Earnings & Appreciation + Capital Formation
R$77mm+43% YoY FRE 3Q'25
R$1.22 +20% FRE per share 3Q'25 YoY
32.3% FRE margin 3Q'25
R$19bn Capital Formation & Appreciation 3Q'25
Distributable Earnings & Dividends
R$73mm 28% YoY Adj. Distributable Earnings 3Q’25
R$1.16 Adj. Distributable Earnings (per Share) 3Q’25
US$0.15 Quarterly Dividend
 |  |
About Vinci Compass
Vinci Compass stands as the premier partner for alternative investments and global solutions in Latin America. With nearly three decades of experience and local operations from eleven offices in Latin America and the US, our expertise spans: Private Equity, Credit, Real Estate, Infrastructure, Forestry, Equities, Global Investment Products & Solutions, and Corporate Advisory. Each segment is managed by specialized teams dedicated to investment and advisory excellence. As of September 2025, Vinci Compass had R$316 billion in assets under management and advisory.
Webcast and Earnings Conference Call
Vinci Compass will host a conference call at 5:00pm ET on Thursday, November 13, 2025, to announce its third quarter 2025 results.
To access the webcast please visit the Events & Presentations' section of the Company's website at:
https://ir.vincicompass.com/news-and-events/events.
For those unable to listen to the live broadcast, there will be a webcast replay on the same section of the website.
Investor Contact
ShareholderRelations@vincicompass.com
NY: +1 (646) 559-8040
RJ: +55 (21) 2159-6240
USA Media Contact
Joele Frank, Wilkinson Brimmer Katcher
Kate Thompson
+1 (212) 355-4449
Brazil Media Contact
Danthi Comunicações
Carla Azevedo (carla@danthicomunicacoes.com.br)
+55 (21) 3114-0779
| Earnings Release | Vinci Compass | 3 |
| |
Segment Earnings
| (R$ thousands, unless mentioned) | 3Q'24 | 2Q'25 | 3Q'25 | ∆ YoY(%) | 3Q'24 YTD | 3Q'25 YTD | ∆ YoY(%) |
| Net revenue from management fees | 106,750 | 195,569 | 201,539 | 89% | 317,339 | 592,637 | 87% |
| Net revenue from advisory fees | 5,966 | 26,220 | 25,384 | 325% | 27,806 | 76,457 | 175% |
| Other revenues | – | 10,944 | 11,404 | N/A | – | 33,610 | N/A |
| Total Fee Related Revenuesi | 112,716 | 232,733 | 238,327 | 111% | 345,145 | 702,704 | 104% |
| Segment personnel expenses | (8,239) | (20,682) | (18,135) | 120% | (23,132) | (58,942) | 155% |
| Other G&A expenses | (6,110) | (17,423) | (14,185) | 132% | (18,140) | (47,039) | 159% |
| Placement fee amortization and rebates | (503) | (17,792) | (19,461) | 3,769% | (1,494) | (58,268) | 3,800% |
| Corporate center expenses | (24,817) | (78,484) | (73,083) | 194% | (71,654) | (229,219) | 220% |
| Bonus compensation related to management and advisory | (19,228) | (33,127) | (36,407) | 89% | (61,356) | (101,278) | 65% |
| Total Fee Related Expenses | (58,897) | (167,509) | (161,271) | 174% | (175,776) | (494,747) | 181% |
| FEE RELATED EARNINGS (FRE)ii | 53,819 | 65,224 | 77,056 | 43% | 169,369 | 207,957 | 23% |
| FRE Marginiii (%) | 47.7% | 28.0% | 32.3% | 49.1% | 29.6% | ||
| FRE per shareiv (R$/share) | 1.02 | 1.03 | 1.22 | 20% | 3.19 | 3.29 | 3% |
| Net revenue from performance fees | 1,890 | 8,342 | 2,986 | 58% | 9,776 | 14,405 | 47% |
| Performance based compensation | (907) | (3,683) | (1,282) | 41% | (4,419) | (6,315) | 43% |
| PERFORMANCE RELATED EARNINGS (PRE)v | 984 | 4,660 | 1,704 | 73% | 5,358 | 8,091 | 51% |
| PRE Marginvi (%) | 52.1% | 55.9% | 57.1% | 54.8% | 56.2% | ||
| (+) Realized GP investment income | 4,539 | 13,576 | 4,362 | (4)% | 21,324 | 22,223 | 4% |
| (+) Unrealized GP investment income | (11,149) | (2,512) | 686 | N/A | (10,174) | (2,105) | (79)% |
| INVESTMENT RELATED EARNINGS (IRE) | (6,610) | 11,064 | 5,048 | N/A | 11,150 | 20,118 | 80% |
| (-) Unrealized performance fees | – | 8,711 | – | N/A | 3,483 | 8,711 | 150% |
| (+) Unrealized performance compensation | – | (3,083) | – | N/A | (1,233) | (3,083) | 150% |
| (-) Unrealized GP investment income | 11,149 | 2,512 | (686) | N/A | 10,174 | 2,105 | (79)% |
| SEGMENT DISTRIBUTABLE EARNINGSvii | 59,342 | 89,088 | 83,122 | 40% | 198,301 | 243,899 | 23% |
| Segment DE Margin (%) | 49.8% | 33.8% | 33.8% | 52.2% | 32.6% | ||
| (+) Depreciation and amortization | 2,272 | 2,779 | 3,761 | 66% | 6,036 | 9,901 | 64% |
| (+) Realized financial income | 15,178 | 21,804 | 14,878 | (2)% | 38,961 | 51,105 | 31% |
| (-) Leasing expenses | (1,931) | (3,722) | (3,373) | 75% | (6,223) | (10,853) | 74% |
| (-) Other itemsviii | (6,858) | (20,758) | (9,984) | 46% | (33,611) | (44,746) | 33% |
| (-) Non-operational expensesix | (3,728) | (618) | (133) | (96)% | (16,735) | (1,006) | (94)% |
| (-) Income taxes (excluding related to unrealized fees and income) | (10,899) | (13,236) | (15,312) | 40% | (38,258) | (37,926) | (1)% |
| DISTRIBUTABLE EARNINGS (DE)x | 53,377 | 75,337 | 72,959 | 37% | 148,471 | 210,374 | 42% |
| DE Marginxi (%) | 39.7% | 26.4% | 28.0% | 35.5% | 26.3% | ||
| DE per share (R$/share) | 1.01 | 1.19 | 1.15 | 14% | 2.80 | 3.32 | 19% |
| (+) Nonrecurring expenses (including Income Tax effect) | 3,727 | 422 | 133 | (96)% | 16,639 | 783 | (95)% |
| ADJUSTED DISTRIBUTABLE EARNINGSxii | 57,104 | 75,759 | 73,092 | 28% | 165,110 | 211,157 | 28% |
| Adjusted DE Marginxiii (%) | 42.5% | 26.6% | 28.1% | 39.4% | 26.4% | ||
| Adjusted DE per sharexiv (R$/share) | 1.08 | 1.20 | 1.16 | 7% | 3.11 | 3.34 | 7% |
Total Fee Related Revenues of R$238.3 million for the quarter ended September 30, 2025, compared to R$112.7 million for the quarter ended September 29, 2024, an increase of 111% year-over year. This increase was pushed by growth in management fees and higher advisory fees, driven mostly by the contribution from the Compass combination, combined with organic fundraising from the Private Equity, Real Assets and Credit segments. In the quarter, management fees accounted for R$201.5 million, an increase of 89% year-over-year. Advisory fees totaled R$25.4 million, up 325% year-over-year. Other revenues, which comprise of advisory & execution fees and fund services fees, totaled R$11.4 million in the quarter. Fee Related Revenues were R$702.7 million for the year-to-date period ended September 30, 2025, up 104% when compared to the year-to-date period ended September 29, 2024, driven by strong fundraising across Private Equity, Credit and Real Assets products additional to the fees coming from transactions with Compass, MAV and Lacan.
| Earnings Release | Vinci Compass | 4 |
| |
Fee Related Earnings (“FRE”) of R$77.1 million (R$1.22/share) for the quarter ended September 30, 2025, up 43% year-over-year on an absolute basis and 20% year-over-year on a per share basis. This quarter delivered record fee related revenues and the highest FRE margin since the business combination with Compass, as efficiencies from the merger start to benefit results. FRE of R$208.0 million (R$3.29/share) for the year-to-date period ended September 30, 2025, up 23% when compared to the year-to-date period ended September 29, 2024.
Performance Related Earnings (“PRE”) of R$1.7 million for the quarter ended September 30, 2025, up 73% year-over-year. This growth was driven by net performance fees recognized mainly across Credit and Equities segments. PRE was R$8.1 million for the year-to-date period ended September 30, 2025, an increase of 51% when compared to the year-to-date period ended September 29, 2024.
Investment Related Earnings (“IRE”) of R$5.0 million for the quarter ended September 30, 2025, compared to negative R$6.6 million for the quarter ended September 30, 2024. IRE was R$20.1 million for the year-to-date period ended September 30, 2025, up 80% when compared to the year-to-date period ended September 30, 2024. This increase was driven by the recognition of realized GP investment income from FIP Transmissão Fund in 2Q’25.
Segment Distributable Earnings of R$83.1 million for the quarter ended September 30, 2025, up 40% year-over-year. Segment Distributable Earnings were R$243.9 million for the year-to-date period ended September 30, 2025, up 23% year-over-year.
Adjusted Distributable Earnings (“DE”) of R$73.1 million (R$1.16/share) for the quarter ended September 30, 2025, up 28% year-over-year on an absolute basis and 7% year-over-year on a per share basis. The increase reflects the combined effect of inorganic growth and organic fundraising. Adjusted DE was R$211.2 million (R$3.34/share) for the year-to-date period ended September 30, 2025, up 28% when compared to the year-to-date period ended September 29, 2024, on an absolute basis, and up 7% on a per share basis.
| Earnings Release | Vinci Compass | 5 |
| |
Segment Highlights
Global IP&S
| (R$ thousands, unless mentioned) | 3Q'24 | 2Q'25 | 3Q'25 | ∆ YoY (%) | 3Q'24 YTD | 3Q'25 YTD | ∆ YoY (%) |
| Net revenue from management fees | 18,982 | 59,691 | 63,956 | 237% | 58,088 | 189,272 | 226% |
| Net revenue from advisory fees | 525 | 17,527 | 17,886 | 3,307% | 1,057 | 57,960 | 5,383% |
| Other revenues | – | 10,748 | 11,216 | N/A | – | 33,049 | N/A |
| Total Fee Related Revenues | 19,508 | 87,966 | 93,058 | 377% | 59,147 | 280,281 | 374% |
| Segment personnel expenses | (2,386) | (5,841) | (5,265) | 121% | (6,762) | (17,404) | 157% |
| Other G&A expenses | (3,029) | (8,383) | (7,759) | 156% | (8,537) | (23,185) | 172% |
| Placement fee amortization and rebates | – | (9,683) | (9,964) | N/A | – | (29,086) | N/A |
| Corporate center expenses | (4,363) | (39,995) | (38,349) | 779% | (13,321) | (120,366) | 804% |
| Bonus compensation related to management and advisory | (4,659) | (11,598) | (16,101) | 246% | (15,668) | (41,118) | 162% |
| Total Fee Related Expenses | (14,437) | (75,501) | (77,438) | 436% | (44,288) | (231,159) | 422% |
| FEE RELATED EARNINGS (FRE) | 5,071 | 12,466 | 15,620 | 208% | 14,858 | 49,121 | 231% |
| FRE Margin (%) | 26.0% | 14.2% | 16.8% | 25.1% | 17.5% | ||
| Net revenue from performance fees | 147 | 536 | 211 | 44% | 370 | 2,041 | 452% |
| Realized performance fees | 147 | 536 | 211 | 44% | 370 | 2,041 | 452% |
| Unrealized performance fees | – | – | – | N/A | – | – | N/A |
| Performance based compensation | (108) | (265) | (60) | (44)% | (219) | (887) | 305% |
| PERFORMANCE RELATED EARNINGS (PRE) | 40 | 270 | 151 | 278% | 152 | 1,154 | 659% |
| PRE Margin (%) | 27.2% | 50.5% | 71.6% | 41.1% | 56.5% | ||
| (+) Realized GP investment income | 257 | 397 | – | (100)% | 484 | 692 | 43% |
| (+) Unrealized GP investment income | 1,026 | (123) | 565 | (45)% | 3,442 | (124) | N/A |
| INVESTMENT RELATED EARNINGS (IRE) | 1,283 | 274 | 565 | (56)% | 3,926 | 568 | (86)% |
| (-) Unrealized GP investment income | (1,026) | 123 | (565) | (45)% | (3,442) | 124 | N/A |
| (-) Unrealized performance fees | – | – | – | N/A | – | – | N/A |
| (+) Unrealized performance compensation | – | – | – | N/A | – | – | N/A |
| SEGMENT DISTRIBUTABLE EARNINGS | 5,368 | 13,133 | 15,771 | 194% | 15,495 | 50,968 | 229% |
| Segment DE Margin (%) | 27.0% | 14.8% | 16.9% | 25.8% | 18.0% | ||
| FEE EARNING ASSETS UNDER MANAGEMENT (FEAUM R$millions) | 24,043 | 228,773 | 239,978 | 898% | 24,845 | 228,773 | 821% |
| AVERAGE FEE RATE (%) | 0.34% | 0.13% | 0.13% | 0.34% | 0.13% | ||
| FEE EARNING ASSETS UNDER MANAGEMENT (FEAUM R$millions) EX-UPFRONTS4 | 24,043 | 182,317 | 191,957 | 698% | 24,845 | 182,317 | 634% |
| AVERAGE FEE RATE (%) EX-UPFRONTS | 0.34% | 0.16% | 0.16% | 0.34% | 0.16% |
Fee Related Earnings (FRE) of R$15.6 million for the quarter ended September 30, 2025, up 208% year-over-year. This growth was driven by management and advisory fees from third-party distribution (TPD) across liquid and alternative strategies coming from the combination with Compass. Global IP&S advisory fees consist of upfront fees charged for TPD alternative commitments. FRE was R$49.1 million for the year-to-date period ended September 30, 2025, up 231% when compared to the 3Q’24 year-to-date period ended September 29, 2024.
Performance Related Earnings (PRE) of R$0.2 million for the third quarter 2025, up 278% year-over-year.
Segment Distributable Earnings of R$15.8 million for the quarter ended September 30, 2025, up 194% year-over-year, driven by higher Fee Related Earnings in the quarter. Segment DE was R$51.0 million for the year-to-date period ended September 30, 2025, up 229%.
AUMxv reached R$241.2 billion, representing an 891% year-over-year increase. This growth was driven by both inorganic expansion and appreciation within the portfolio.
| Earnings Release | Vinci Compass | 6 |
| |
Credit
| (R$ thousands, unless mentioned) | 3Q'24 | 2Q'25 | 3Q'25 | ∆ YoY (%) | 3Q'24 YTD | 3Q'25 YTD | ∆ YoY (%) |
| Net revenue from management fees | 16,900 | 54,518 | 60,464 | 258% | 44,566 | 167,800 | 277% |
| Net revenue from advisory fees | – | – | – | N/A | 280 | – | (100)% |
| Other revenues | – | – | – | N/A | – | – | N/A |
| Total Fee Related Revenues | 16,900 | 54,518 | 60,464 | 258% | 44,845 | 167,800 | 274% |
| Segment personnel expenses | (1,851) | (6,928) | (6,195) | 235% | (4,524) | (19,974) | 342% |
| Other G&A expenses | (861) | (3,191) | (2,968) | 245% | (2,313) | (8,719) | 277% |
| Placement fee amortization and rebates | – | (7,525) | (7,744) | N/A | – | (23,334) | N/A |
| Corporate center expenses | (3,840) | (17,207) | (16,200) | 322% | (10,177) | (50,531) | 397% |
| Bonus compensation related to management and advisory | (3,600) | (8,196) | (6,798) | 89% | (9,145) | (23,011) | 152% |
| Total Fee Related Expenses | (10,152) | (43,047) | (39,905) | 293% | (26,159) | (125,568) | 380% |
| FEE RELATED EARNINGS (FRE) | 6,748 | 11,471 | 20,559 | 205% | 18,687 | 42,232 | 126% |
| FRE Margin (%) | 39.9% | 21.0% | 34.0% | 41.7% | 25.2% | ||
| Net revenue from performance fees | 11 | 4,507 | 362 | 3,189% | 3,423 | 4,884 | 43% |
| Realized performance fees | 11 | 4,507 | 362 | 3,189% | 3,423 | 4,884 | 43% |
| Unrealized performance fees | – | – | – | N/A | – | – | N/A |
| Performance based compensation | (5) | (1,959) | (152) | 2,945% | (1,517) | (2,114) | 39% |
| PERFORMANCE RELATED EARNINGS (PRE) | 6 | 2,548 | 210 | 3,392% | 1,908 | 2,771 | 45% |
| PRE Margin (%) | 54.5% | 56.5% | 57.9% | 55.7% | 56.7% | ||
| (+) Realized GP investment income | 1,647 | 1,816 | 1,647 | 0% | 5,629 | 4,940 | (12)% |
| (+) Unrealized GP investment income | (2,627) | 4,703 | 642 | N/A | 1,118 | 9,378 | 738% |
| INVESTMENT RELATED EARNINGS (IRE) | (980) | 6,519 | 2,289 | N/A | 6,747 | 14,318 | 112% |
| (-) Unrealized GP investment income | 2,627 | (4,703) | (642) | N/A | (1,118) | (9,378) | 738% |
| (-) Unrealized performance fees | – | – | – | N/A | – | – | N/A |
| (+) Unrealized performance compensation | – | – | – | N/A | – | – | N/A |
| SEGMENT DISTRIBUTABLE EARNINGS | 8,402 | 15,835 | 22,416 | 167% | 26,225 | 49,943 | 90% |
| Segment DE Margin (%) | 45.3% | 26.0% | 35.9% | 48.7% | 28.1% | ||
| FEE EARNING ASSETS UNDER MANAGEMENT (FEAUM) | 8,866 | 29,908 | 32,445 | 266% | 8,866 | 32,445 | 266% |
| AVERAGE MANAGEMENT FEE RATE (%) | 0.84% | 0.76% | 0.80% | 0.78% | 0.77% |
Fee Related Earnings (FRE) of R$20.6 million for the quarter ended September 30, 2025, up 205% year-over-year, driven by higher management fees from both inorganic and organic growth. Fundraising, capital deployment and portfolio appreciation across different strategies and countries show sustained traction. FRE was R$42.2 million for the year-to-date period ended September 30, 2025, up 126% when compared to the year-to-date period ended September 30, 2024.
Segment Distributable Earnings of R$22.4 million for the quarter ended September 30, 2025, up 167% year-over-year, driven by higher Fee Related Earnings in the quarter. Segment DE was R$49.9 million for the year-to-date period ended September 30, 2025.
Investment Related Earnings (IRE) of R$2.3 million for the quarter ended September 30, 2025, driven by quarterly dividends of listed REITs for the realized portion and closed-end funds mark-ups drove the unrealized.
AUM of R$32.9 billion in the quarter, up 263% year-over-year. Our one-stop-shop credit platform is accelerating both local-to-local and cross-border, delivering R$3.1 billion in capital formation and appreciation during the 3Q’25 across private credit and liquid strategies, backed by diversified funding geographies.
| Earnings Release | Vinci Compass | 7 |
| |
Private Equity
| (R$ thousands, unless mentioned) | 3Q'24 | 2Q'25 | 3Q'25 | ∆ YoY (%) | 3Q'24 YTD | 3Q'25 YTD | ∆ YoY (%) |
| Net revenue from management fees | 31,172 | 30,710 | 31,087 | (0)% | 100,936 | 93,092 | (8)% |
| Net revenue from advisory fees | – | – | – | N/A | – | – | N/A |
| Other revenues | – | – | – | N/A | – | – | N/A |
| Total Fee Related Revenues | 31,172 | 30,710 | 31,087 | (0)% | 100,936 | 93,092 | (8)% |
| Segment personnel expenses | (1,153) | (1,178) | (1,276) | 11% | (3,299) | (3,622) | 10% |
| Other G&A expenses | (633) | (1,393) | (703) | 11% | (2,349) | (2,894) | 23% |
| Placement fee amortization and rebates | (311) | (363) | (359) | 15% | (918) | (1,089) | 19% |
| Corporate center expenses | (6,653) | (6,518) | (6,023) | (9)% | (18,987) | (18,573) | (2)% |
| Bonus compensation related to management and advisory | (3,449) | (3,636) | (3,743) | 9% | (11,126) | (10,877) | (2)% |
| Total Fee Related Expenses | (12,199) | (13,088) | (12,104) | (1)% | (36,680) | (37,054) | 1% |
| FEE RELATED EARNINGS (FRE) | 18,973 | 17,622 | 18,983 | 0% | 64,257 | 56,038 | (13)% |
| FRE Margin (%) | 60.9% | 57.4% | 61.1% | 63.7% | 60.2% | ||
| Net revenue from performance fees | – | – | – | N/A | – | – | N/A |
| Realized performance fees | – | – | – | N/A | – | – | N/A |
| Unrealized performance fees | – | – | – | N/A | – | – | N/A |
| Performance based compensation | – | – | – | N/A | – | – | N/A |
| PERFORMANCE RELATED EARNINGS (PRE) | – | – | – | N/A | – | – | N/A |
| PRE Margin (%) | N/A | N/A | N/A | N/A | N/A | ||
| (+) Realized GP investment income | 31 | 1,692 | 61 | 97% | 31 | 1,753 | 5,554% |
| (+) Unrealized GP investment income | (317) | (5,316) | (1,943) | 512% | 7,940 | (13,485) | N/A |
| INVESTMENT RELATED EARNINGS (IRE) | (286) | (3,624) | (1,882) | 557% | 7,971 | (11,732) | N/A |
| (-) Unrealized GP investment income | 317 | 5,316 | 1,943 | 512% | (7,940) | 13,485 | N/A |
| (-) Unrealized performance fees | – | – | – | N/A | – | – | N/A |
| (+) Unrealized performance compensation | – | – | – | N/A | – | – | N/A |
| SEGMENT DISTRIBUTABLE EARNINGS | 19,004 | 19,314 | 19,044 | 0% | 64,288 | 57,791 | (10)% |
| Segment DE Margin (%) | 60.9% | 59.6% | 61.1% | 63.7% | 60.9% | ||
| FEE EARNING ASSETS UNDER MANAGEMENT (FEAUM) | 12,690 | 12,710 | 12,607 | (1)% | 12,690 | 12,607 | (1)% |
| AVERAGE MANAGEMENT FEE RATE (%) | 1.07% | 1.01% | 1.05% | 1.21% | 1.02% |
Fee Related Earnings (FRE) of R$19.0 million for the quarter ended September 30, 2025, flat year-over-year. This is due solely to the catch-up fees recognized in the 3Q’24 from the strong fundraising of the VCP IV strategy in that quarter, which ended in the 4Q’24, thus not occurring again in 2025. Excluding this effect and considering only recurring management fees, FRE would be up 6% year-over-year.
Segment Distributable Earnings of R$19.0 million for the quarter ended September 30, 2025, flat year-over-year, in line with the trend in Fee Related Earnings. Segment DE was R$57.8 million for the year-to-date period ended September 30, 2025.
AUM of R$15.5 billion at the end of the third quarter, down 2% year-over-year. VCP team continues sourcing new investment opportunities for Fund IV and pursuing exits across Funds II and III, as VIR team concentrates on structuring the next impact investing vintage, VIR V.
| Earnings Release | Vinci Compass | 8 |
| |
Equities
| (R$ thousands, unless mentioned) | 3Q'24 | 2Q'25 | 3Q'25 | ∆ YoY (%) | 3Q'24 YTD | 3Q'25 YTD | ∆ YoY (%) |
| Net revenue from management fees | 14,392 | 18,686 | 17,098 | 19% | 42,118 | 54,578 | 30% |
| Net revenue from advisory fees | – | – | – | N/A | – | – | N/A |
| Other revenues | – | – | – | N/A | – | – | N/A |
| Total Fee Related Revenues | 14,392 | 18,686 | 17,098 | 19% | 42,118 | 54,578 | 30% |
| Segment personnel expenses | (744) | (2,969) | (1,662) | 123% | (2,467) | (6,900) | 180% |
| Other G&A expenses | (488) | (1,497) | (1,349) | 177% | (1,307) | (4,968) | 280% |
| Placement fee amortization and rebates | – | (1,402) | (1,187) | N/A | – | (4,140) | N/A |
| Corporate center expenses | (3,260) | (5,991) | (4,931) | 51% | (9,532) | (16,622) | 74% |
| Bonus compensation related to management and advisory | (2,122) | (2,601) | (2,771) | 31% | (6,393) | (7,934) | 24% |
| Total Fee Related Expenses | (6,615) | (14,460) | (11,900) | 80% | (19,699) | (40,564) | 106% |
| FEE RELATED EARNINGS (FRE) | 7,777 | 4,226 | 5,197 | (33)% | 22,419 | 14,014 | (37)% |
| FRE Margin (%) | 54.0% | 22.6% | 30.4% | 53.2% | 25.7% | ||
| Net revenue from performance fees | 1,730 | 3,299 | 2,412 | 39% | 5,666 | 7,478 | 32% |
| Realized performance fees | 1,730 | 3,299 | 2,412 | 39% | 5,666 | 7,478 | 32% |
| Unrealized performance fees | – | – | – | N/A | – | – | N/A |
| Performance based compensation | (794) | (1,426) | (1,069) | 35% | (2,544) | (3,281) | 29% |
| PERFORMANCE RELATED EARNINGS (PRE) | 936 | 1,873 | 1,343 | 43% | 3,120 | 4,197 | 35% |
| PRE Margin (%) | 54.1% | 56.8% | 55.7% | 55.1% | 56.1% | ||
| (+) Realized GP investment income | – | – | – | N/A | – | – | N/A |
| (+) Unrealized GP investment income | 426 | 1,997 | 1,285 | 201% | (2,759) | 5,075 | N/A |
| INVESTMENT RELATED EARNINGS (IRE) | 426 | 1,997 | 1,285 | 201% | (2,759) | 5,075 | N/A |
| (-) Unrealized GP investment income | (426) | (1,997) | (1,285) | 201% | 2,759 | (5,075) | N/A |
| (-) Unrealized performance fees | – | – | – | N/A | – | – | N/A |
| (+) Unrealized performance compensation | – | – | – | N/A | – | – | N/A |
| SEGMENT DISTRIBUTABLE EARNINGS | 8,713 | 6,099 | 6,540 | (25)% | 25,539 | 18,212 | (29)% |
| Segment DE Margin (%) | 54.0% | 27.7% | 33.5% | 53.4% | 29.3% | ||
| FEE EARNING ASSETS UNDER MANAGEMENT (FEAUM) | 10,823 | 15,502 | 14,494 | 34% | 10,823 | 14,494 | 34% |
| AVERAGE MANAGEMENT FEE RATE (%) | 0.61% | 0.51% | 0.48% | 0.61% | 0.51% |
Fee Related Revenues of R$17.1 million for the quarter ended September 30, 2025, up 19% year-over-year. This increase was driven primarily by the consolidation of Compass’ regional Equities platform, which contributed to growth in management fees.
Fee Related Earnings (FRE) of R$5.2 million for the quarter ended September 30, 2025, down 33% year-over-year due to higher expenses following the combination with Compass. FRE was R$14.0 million for the year-to-date period ended September 30, 2025, down 37% when compared to the same period in 2024.
Performance Related Earnings (PRE) of R$1.3 million for the quarter ended September 30, 2025, up 43% year-over-year, driven by higher realized performance fees in the period.
Segment Distributable Earnings of R$6.5 million for the quarter ended September 30, 2025, down 25% year-over-year, reflecting lower FRE despite the increase in performance fees. Segment DE was R$18.2 million for the year-to-date period ended September 30, 2025.
AUM of R$14.5 billion at the end of the third quarter, up 34% year-over-year, following the combination with Compass and appreciation in the portfolio.
| Earnings Release | Vinci Compass | 9 |
| |
Real Assets
| (R$ thousands, unless mentioned) | 3Q'24 | 2Q'25 | 3Q'25 | ∆ YoY (%) | 3Q'24 YTD | 3Q'25 YTD | ∆ YoY (%) |
| Net revenue from management fees | 25,304 | 31,963 | 28,934 | 14% | 71,631 | 87,895 | 23% |
| Net revenue from advisory fees | 492 | 473 | 2,167 | 340% | 2,963 | 4,489 | 51% |
| Other revenues | – | 197 | 188 | N/A | – | 561 | N/A |
| Total Fee Related Revenues | 25,795 | 32,633 | 31,288 | 21% | 74,593 | 92,945 | 25% |
| Segment personnel expenses | (1,504) | (3,054) | (2,944) | 96% | (4,317) | (8,985) | 108% |
| Other G&A expenses | (1,024) | (2,676) | (1,312) | 28% | (3,104) | (6,762) | 118% |
| Placement fee amortization and rebates | (192) | 1,181 | (207) | 8% | (576) | (620) | 8% |
| Corporate center expenses | (5,460) | (7,712) | (6,518) | 19% | (16,053) | (20,160) | 26% |
| Bonus compensation related to management and advisory | (3,708) | (4,829) | (5,415) | 46% | (11,472) | (14,328) | 25% |
| Total Fee Related Expenses | (11,887) | (17,089) | (16,396) | 38% | (35,523) | (50,854) | 43% |
| FEE RELATED EARNINGS (FRE) | 13,908 | 15,543 | 14,892 | 7% | 39,069 | 42,091 | 8% |
| FRE Margin (%) | 53.9% | 47.6% | 47.6% | 52.4% | 45.3% | ||
| Net revenue from performance fees | 2 | 1 | 1 | (38)% | 317 | 2 | (99)% |
| Realized performance fees | 2 | 8,713 | 1 | (38)% | 3,800 | 8,714 | 129% |
| Unrealized performance fees | – | (8,711) | – | N/A | (3,483) | (8,711) | 150% |
| Performance based compensation | – | (32) | (1) | N/A | (139) | (33) | (77)% |
| PERFORMANCE RELATED EARNINGS (PRE) | 2 | (31) | 1 | (65)% | 178 | (30) | N/A |
| PRE Margin (%) | 100.0% | N/A | 55.8% | 56.2% | N/A | ||
| (+) Realized GP investment income | 2,604 | 9,672 | 2,654 | 2% | 15,180 | 14,838 | (2)% |
| (+) Unrealized GP investment income | (9,657) | (3,773) | 137 | N/A | (19,916) | (2,949) | (85)% |
| INVESTMENT RELATED EARNINGS (IRE) | (7,053) | 5,899 | 2,791 | N/A | (4,736) | 11,889 | N/A |
| (-) Unrealized GP investment income | 9,657 | 3,773 | (137) | N/A | 19,916 | 2,949 | (85)% |
| (-) Unrealized performance fees | – | 8,711 | – | N/A | 3,483 | 8,711 | 150% |
| (+) Unrealized performance compensation | – | (3,083) | – | N/A | (1,233) | (3,083) | 150% |
| SEGMENT DISTRIBUTABLE EARNINGS | 16,513 | 30,813 | 17,547 | 6% | 56,675 | 62,528 | 10% |
| Segment DE Margin (%) | 58.1% | 60.4% | 51.7% | 60.6% | 53.7% | ||
| FEE EARNING ASSETS UNDER MANAGEMENT (FEAUM) | 10,294 | 12,026 | 11,976 | 16% | 10,294 | 11,976 | 16% |
| AVERAGE MANAGEMENT FEE RATE (%) | 1.03% | 1.13% | 1.01% | 0.94% | 1.04% |
Fee Related Revenues of R$31.3 million for the quarter ended September 30, 2025, up 21% year-over-year. The increase was supported by strong business momentum driven by success fees in our Real Estate advisory business and inorganic growth. Fee Related Revenues were R$92.9 million for the year-to-date period ended September 30, 2025, up 25%.
Fee Related Earnings (FRE) of R$14.9 million for the quarter ended September 30, 2025, up 7% year-over-year. FRE was R$42.1 million for the year-to-date period ended September 30, 2025, up 8% year-over-year.
Investment Related Earnings (IRE) of R$2.8 million for the quarter ended September 30, 2025, driven mostly by quarterly dividends of listed REITs for the realized portion, while closed-end funds mark-ups drove the unrealized.
Segment Distributable Earnings of R$17.5 million for the quarter ended September 30, 2025, up 6% year-over-year. Segment DE was R$62.5 million for the year-to-date period ended September 30, 2025, up 10% year-over-year.
AUM of R$12.1 billion at the end of the third quarter, a 17% increase year-over-year. This segment encompasses Infrastructure, Real Estate, and Forestry strategies.
| Earnings Release | Vinci Compass | 10 |
| |
Corporate Advisory
| (R$ thousands, unless mentioned) | 3Q'24 | 2Q'25 | 3Q'25 | ∆ YoY (%) | 3Q'24 YTD | 3Q'25 YTD | ∆ YoY (%) |
| Net revenue from management fees | – | – | – | N/A | – | – | N/A |
| Net revenue from advisory fees | 4,949 | 8,220 | 5,332 | 8% | 23,506 | 14,009 | (40)% |
| Other revenues | – | – | – | N/A | – | – | N/A |
| Total Fee Related Revenues | 4,949 | 8,220 | 5,332 | 8% | 23,506 | 14,009 | (40)% |
| Segment personnel expenses | (601) | (712) | (793) | 32% | (1,763) | (2,057) | 17% |
| Other G&A expenses | (75) | (284) | (94) | 24% | (530) | (511) | (4)% |
| Placement fee amortization and rebates | – | – | – | N/A | – | – | N/A |
| Corporate center expenses | (1,241) | (1,061) | (1,063) | (14)% | (3,583) | (2,967) | (17)% |
| Bonus compensation related to management and advisory | (1,690) | (2,267) | (1,578) | (7)% | (7,551) | (4,012) | (47)% |
| Total Fee Related Expenses | (3,607) | (4,323) | (3,528) | (2)% | (13,427) | (9,548) | (29)% |
| FEE RELATED EARNINGS (FRE) | 1,342 | 3,897 | 1,804 | 34% | 10,079 | 4,461 | (56)% |
| FRE Margin (%) | 27.1% | 47.4% | 33.8% | 42.9% | 31.8% | ||
| SEGMENT DISTRIBUTABLE EARNINGS | 1,342 | 3,897 | 1,804 | 34% | 10,079 | 4,461 | (56)% |
| Segment DE Margin (%) | 27.1% | 47.4% | 33.8% | 42.9% | 31.8% |
Fee Related Earnings (FRE) of R$1.8 million for the quarter ended September 30, 2025, up 34% year-over-year. Deal activity has been quieter than expected amidst the persistent high-interest rate environment. FRE was R$4.5 million for the year-to-date period ended September 30, 2025.
Segment Distributable Earnings of R$1.8 million for the quarter ended September 30, 2025, up 34% year-over-year.
| Earnings Release | Vinci Compass | 11 |
| |
Income Statement
| (R$ thousands, unless mentioned) | 3Q'24 | 2Q'25 | 3Q'25 | ∆ YoY (%) | 3Q'24 YTD | 3Q'25 YTD | ∆ YoY (%) |
| REVENUES | |||||||
| Net revenue from management fees | 106,750 | 195,569 | 201,539 | 89% | 317,339 | 592,637 | 87% |
| Net revenue from performance fees | 1,890 | 8,342 | 2,986 | 58% | 9,776 | 14,405 | 47% |
| Realized performance fees | 1,890 | 17,054 | 2,986 | 58% | 13,259 | 23,117 | 74% |
| Unrealized performance fees | – | (8,711) | – | N/A | (3,483) | (8,711) | 150% |
| Net revenue from advisory | 5,966 | 26,220 | 25,384 | 325% | 27,806 | 76,457 | 175% |
| Other revenues | – | 10,944 | 11,404 | N/A | – | 33,610 | N/A |
| Total net revenues from services rendered | 114,606 | 241,075 | 241,313 | 111% | 354,921 | 717,109 | 102% |
| OPERATING EXPENSES | |||||||
| Bonus related to management and advisory | (19,228) | (33,127) | (36,407) | 89% | (61,356) | (101,278) | 65% |
| Performance based compensation | (907) | (3,683) | (1,282) | 41% | (4,419) | (6,315) | 43% |
| Realized | (907) | (6,766) | (1,282) | 41% | (5,652) | (9,398) | 66% |
| Unrealized | – | 3,083 | – | N/A | 1,233 | 3,083 | 150% |
| Total compensation and benefits | (20,135) | (36,810) | (37,689) | 87% | (65,775) | (107,593) | 64% |
| Segment personnel expenses | (8,238) | (20,682) | (18,135) | 120% | (23,131) | (58,942) | 155% |
| Other general and administrative expenses | (6,110) | (17,423) | (14,185) | 132% | (18,140) | (47,039) | 159% |
| Placement fee amortization and rebates | (503) | (17,792) | (19,461) | 3,769% | (1,494) | (58,268) | 3,800% |
| Corporate center expenses | (24,817) | (78,484) | (73,083) | 194% | (71,654) | (229,219) | 220% |
| Total expenses | (59,803) | (171,191) | (162,553) | 172% | (180,194) | (501,061) | 178% |
| Operating profit | 54,803 | 69,884 | 78,760 | 44% | 174,727 | 216,048 | 24% |
| OTHER GP AND FINANCIAM INCOME AND EXPENSES | |||||||
| Investment Related Earnings (IRE) | (6,609) | 11,064 | 5,048 | N/A | 11,150 | 20,118 | 80% |
| Realized gain from GP investment income | 4,539 | 13,576 | 4,362 | (4)% | 21,324 | 22,223 | 4% |
| Unrealized gain from GP investment income | (11,149) | (2,512) | 686 | N/A | (10,174) | (2,105) | (79)% |
| Financial income | 15,178 | 21,804 | 14,878 | (2)% | 38,961 | 51,105 | 31% |
| Realized gain from financial income | 15,178 | 21,804 | 14,878 | (2)% | 38,961 | 51,105 | 31% |
| Unrealized gain from financial income | – | – | – | N/A | – | – | N/A |
| Leasing expenses | (1,931) | (3,722) | (3,373) | 75% | (6,223) | (10,853) | 74% |
| Other items | 1,496 | (5,165) | (25,839) | N/A | (34,745) | (35,462) | 2% |
| Equity gain (loss) | – | (3,996) | 3,609 | N/A | – | (2,588) | N/A |
| Share based plan | (4,147) | (6,994) | (8,101) | 95% | (15,955) | (20,098) | 26% |
| Management contract amortization | – | (3,471) | (3,692) | N/A | – | (10,033) | N/A |
| Extraordinary expenses | (3,728) | (618) | (133) | (96)% | (16,735) | (1,006) | (94)% |
| Total Other items | 259 | 8,902 | (17,603) | N/A | (23,547) | (8,817) | (63)% |
| Profit before income taxes | 55,062 | 78,785 | 61,157 | 11% | 151,180 | 207,230 | 37% |
| (-) Income taxes | (13,693) | (12,012) | (12,598) | (8)% | (35,756) | (35,970) | 1% |
| NET INCOME | 41,369 | 66,773 | 48,559 | 17% | 115,424 | 171,260 | 48% |
| (+) Nonrecurring expenses (including Income Tax effect) | 3,727 | 422 | 133 | (96)% | 16,639 | 783 | (95)% |
| (-) Earn-out Adjust | (5,444) | (10,851) | 10,753 | N/A | 2,225 | (8,239) | N/A |
| ADJUSTED NET INCOME | 39,652 | 56,345 | 59,445 | 50% | 134,288 | 163,805 | 22% |
Total net revenues from services rendered R$241.3 million for the quarter ended September 30, 2025, up 111% year-over-year. This growth was driven by stronger management and advisory fees in the period, primarily from the combination with Compass, additional to the acquisition of Lacan, combined with organic fundraising for SPS IV. Net revenues for the year-to-date period ended September 30, 2025, were R$717.1 million, up 102% when compared to the same period in 2024.
| · | Management fee revenues of R$201.5 million for the quarter ended September 30, 2025, up 89% year-over-year. Management fees for the year-to-date period ended September 30, 2025, were R$592.6 million, up 87% when compared to the same period in 2024. |
| Earnings Release | Vinci Compass | 12 |
| |
| · | Performance fee revenues R$3.0 million for the quarter ended September 30, 2025, up 58% year-over-year. Performance fee revenues for the year-to-date period ended September 30, 2025, were R$14.4 million, up 47% when compared to the same period in 2024. |
| · | Advisory fee revenues of R$25.4 million for the quarter ended September 30, 2025, compared to R$6.0 million for the quarter ended September 30, 2024, an increase of 325% year-over-year, driven by the contribution from the Compass combination in the Global IP&S segment. Advisory revenues for the year-to-date period ended September 30, 2025, were R$76.5 million, up 175% when compared to the same period in 2024. |
Total expenses for the quarter ended September 30, 2025, of R$162.6 million, compared to R$59.8 million for the quarter ended September 30, 2024, an increase of 172% year-over-year. Total expenses for the year-to-date period ended September 30, 2025, were R$501.1 million, up 178% when compared to the same period in 2024. This increase is primarily attributed to the combination with Compass, with the additional management team brought with the transaction. Additionally, after the combination with Compass, our expenses were impacted by a new line of costs for amortization of placement fees and rebates, which were not meaningful before the transaction and started to have a bigger contribution to our expenses, as it reflects fees paid to distributors that, due to accounting procedures, are not deducted directly from management fees.
| · | Bonus related to management and advisory fees of R$36.4 million for the quarter ended September 30, 2025, compared to R$19.3 million for the quarter ended September 30, 2024, an 89% increase year-over-year. Bonus related to management and advisory fees for the year-to-date period ended September 30, 2025, was R$101.3 million, up 65%. |
| · | Performance based compensation of R$1.3 million for the quarter ended September 30, 2025, compared to R$0.9 million for the quarter ended September 30, 2024, an increase of 41% year-over-year. Performance based compensation for the year-to-date period ended September 30, 2025, was R$6.3 million, up 43%. |
| · | Segment personnel expensesxvi of R$18.1 million for the quarter ended September 30, 2025, compared to R$8.2 million for the quarter ended September 30, 2024, an increase of 120% year-over-year. Segment personnel expenses for the year-to-date period ended September 30, 2025, were R$58.9 million, up 155%. |
| · | Corporate center expensesxvii of R$73.1 million for the quarter ended September 30, 2025, compared to R$24.8 million for the quarter ended September 30, 2024, an increase of 194% year-over-year. Corporate center expenses for the year-to-date period ended September 30, 2025, were R$229.2 million, up 220%. |
| Earnings Release | Vinci Compass | 13 |
| |
| · | Other general and administrative expensesxviii of R$14.2 million for the quarter ended September 30, 2025, compared to R$6.1 million for the quarter ended September 30, 2024, an increase of 132% year-over-year. Other G&A expenses for the year-to-date period ended September 30, 2025, were R$47.0 million, up 159%. |
| · | Placement fee amortization and rebatesxix of R$19.5 million for the quarter ended September 30, 2025, up 3,769% year-over-year. This line was introduced following the combination with Compass and was not meaningful before the transaction, and it started to have a bigger contribution to our expenses, particularly in the Credit and IP&S segments, as it reflects fees paid to distributors that, due to accounting procedures, are not deducted directly from management fees. Placement fee amortization and rebates for the year-to-date period ended September 30, 2025, totaled R$58.3 million. |
Operating profit of R$78.8 million for the quarter ended September 30, 2025, compared to R$54.8 million for the quarter ended September 30, 2024, an increase of 44% year-over-year. Operating profit for the year-to-date period ended September 30, 2025, was R$216.0 million, up 24% compared to the same period in 2024.
Investment Related Earnings (IRE)xx, a result of the company’s GP investments in its proprietary private market funds, was R$5.0 million for the quarter ended September 30, 2025, compared to negative R$6.6 million for the quarter ended September 30, 2024. IRE for the year-to-date period ended September 30, 2025, totaled R$20.1 million, up 80% year-over-year.
Financial incomexxi of R$14.9 million for the quarter ended September 30, 2025, down 2% year-over-year. Financial income for the year-to-date period ended September 30, 2025, was R$51.1 million, up 31% year-over-year.
Leasing expensesxxii of R$3.4 million for the quarter ended September 30, 2025, compared to R$1.9 million for the quarter ended September 30, 2024, an increase of 75% year-over-year. Leasing expenses for the year-to-date period ended September 30, 2025, were R$10.9 million, up 74% year-over-year.
Other items of negative R$25.8 million for the quarter ended September 30, 2025, compared to R$1.5 million for the quarter ended September 30, 2024. This line comprises the income/(loss) generated by contingent consideration adjustment, financial income/(expenses) related to SPS and Compass acquisitions, Ares Convertible Preferred Shares, and other financial expenses.
Share-based compensationxxiii of R$8.1 million for the quarter ended September 30, 2025, compared to R$4.1 million for the quarter ended September 30, 2024, an increase of 95% year-over-year. Share-based compensation for the year-to-date period ended September 30, 2025, was R$20.1 million, up 26% year-over-year.
| Earnings Release | Vinci Compass | 14 |
| |
Profit before income taxes of R$61.2 million for the quarter ended September 30, 2025, compared to R$55.1 million in the same period of 2024, an increase of 11% year-over-year. Profit before income taxes for the year-to-date period ended September 30, 2025, was R$207.2 million, up 37% year-over-year.
Income taxesxxiv of R$12.6 million for the quarter ended September 30, 2025, which represented an effective tax rate of approximately 21%, compared to R$13.7 million for the quarter ended September 30, 2024. Income taxes for the year-to-date period ended September 30, 2025, were R$36.0 million, up 1% year-over-year.
Non-operational expenses of R$0.1 million for the quarter ended June 30, 2025. Non-operational expenses are comprised of expenses related to professional services rendered in connection with acquisitions.
Contingent consideration adjustment related to acquisitions, after tax, of positive R$10.8 million for the quarter ended September 30, 2025. Contingent consideration adjustment related to Vinci SPS and Compass’ acquisitions reflects the change in earn out’s fair value to be paid. On September 30, 2025, Vinci Compass re-evaluated the fair value of those obligations based on the economic conditions at the date, resulting in a decrease of the contingent consideration fair value. The variation was recognized as a gain in the financial result.
Adjusted net income of R$59.4 million for the quarter ended September 30, 2025, compared to R$41.4 million for the quarter ended September 30, 2024, an increase of 50% year-over-year. Adjusted net income for the year-to-date period ended September 30, 2025, was R$163.8 million, up 22% year-over-year.
| Earnings Release | Vinci Compass | 15 |
| |
Supplemental Details
Assets Under Management (AUM) Rollforward
| For the Three Months Ended September 30, 2025 | ||||||
In R$ millions |
Global IP&S | Credit | Private Equity | Equities | Real Assets | Total |
| Beginning balance | 230,155 | 30,459 | 15,769 | 15,552 | 12,123 | 304,057 |
| (+/-) Capital Subscription / (capital return) | – | 191 | (27) | – | (399) | (235) |
| (+) Capital Subscription | – | 344 | 1 | – | 49 | 394 |
| (-) Capital Return | – | (153) | (29) | – | (447) | (629) |
| (+) Acquisitions | – | – | – | – | – | – |
| (+/-) Net Inflow / (outflow) | 7,560 | 2,087 | – | (1,671) | (3) | 7,973 |
| (+/-) FX Variation | (5,278) | (511) | (55) | (120) | (31) | (5,995) |
| (+/-) Appreciation / (depreciation) | 8,781 | 657 | (139) | 780 | 380 | 10,458 |
| Ending balance | 241,217 | 32,882 | 15,548 | 14,542 | 12,071 | 316,259 |
| For the Twelve Months Ended September 30, 2025 | ||||||
In R$ millions |
Global IP&S | Credit | Private Equity | Equities | Real Assets | Total |
| Beginning balance | 24,330 | 9,067 | 15,803 | 10,856 | 10,338 | 70,395 |
| (+/-) Capital Subscription / (capital return) | (6) | 2,021 | 182 | – | (636) | 1,562 |
| (+) Capital Subscription | 0 | 2,548 | 408 | – | 296 | 3,253 |
| (-) Capital Return | (6) | (527) | (226) | – | (932) | (1,690) |
| (+) Acquisitions | 216,007 | 18,780 | – | 4,355 | 2,006 | 241,147 |
| (+/-) Net Inflow / (outflow) | 524 | 2,547 | – | (2,481) | (35) | 555 |
| (+/-) FX Variation | (16,855) | (1,506) | (66) | (360) | (38) | (18,826) |
| (+/-) Appreciation / (depreciation) | 17,216 | 1,972 | (371) | 2,172 | 436 | 21,425 |
| Ending balance | 241,217 | 32,882 | 15,548 | 14,542 | 12,071 | 316,259 |
| Earnings Release | Vinci Compass | 16 |
| |
Fee-Earning Assets Under Management (FEAUM) Rollforward
| For the Three Months Ended September 30, 2025 | ||||||
In R$ millions |
Global IP&S | Credit | Private Equity | Equities | Real Assets | Total |
| Beginning balance | 228,773 | 29,908 | 12,710 | 15,502 | 12,026 | 298,920 |
| (+/-) Capital Subscription / (capital return) | – | 181 | (27) | – | (399) | (244) |
| (+) Capital Subscription | – | 335 | – | – | 49 | 384 |
| (-) Capital Return | – | (153) | (27) | – | (447) | (628) |
| (+) Acquisitions | – | – | – | – | – | – |
| (+/-) Net Inflow / (outflow) | 7,588 | 2,081 | – | (1,662) | (3) | 8,004 |
| (+/-) FX Variation | (5,265) | (502) | (55) | (119) | (31) | (5,971) |
| (+/-) Appreciation / (depreciation) | 8,882 | 776 | (21) | 773 | 381 | 10,790 |
| Ending balance | 239,978 | 32,445 | 12,607 | 14,494 | 11,976 | 311,499 |
| For the Twelve Months Ended September 30, 2025 | ||||||
In R$ millions |
Global IP&S | Credit | Private Equity | Equities | Real Assets | Total |
| Beginning balance | 24,043 | 8,866 | 12,690 | 10,823 | 10,294 | 66,717 |
| (+/-) Capital Subscription / (capital return) | (6) | 2,014 | 201 | – | (606) | 1,603 |
| (+) Capital Subscription | – | 2,538 | 407 | – | 296 | 3,241 |
| (-) Capital Return | (6) | (525) | (206) | – | (902) | (1,639) |
| (+) Acquisitions | 215,477 | 18,340 | – | 4,316 | 2,006 | 240,138 |
| (+/-) Net Inflow / (outflow) | 521 | 2,608 | – | (2,443) | (35) | 651 |
| (+/-) FX Variation | (16,814) | (1,476) | (66) | (359) | (38) | (18,753) |
| (+/-) Appreciation / (depreciation) | 16,757 | 2,092 | (218) | 2,156 | 355 | 21,143 |
| Ending balance | 239,978 | 32,445 | 12,607 | 14,494 | 11,976 | 311,499 |
| Earnings Release | Vinci Compass | 17 |
| |
Investment Records – IP&S, Public Equities, Private Credit and Listed Funds
| Fund | Segment | NAVxxv (R$ millions) |
3Q'25 | YTD | 12 M | 24 M | Market Comparison |
Index Rate |
| Vinci Total Return | Equities | 268.9 | 6.1% | 30.0% | 16.9% | 28.5% | IPCA + Yield IMA-B | IPCA + Yield IMA-B |
| Mosaico Strategy | Equities | 906.5 | 6.8% | 27.4% | 11.8% | 22.7% | IBOV | IBOV |
| Vinci Gas Dividendos FIA | Equities | 324.8 | 5.6% | 24.0% | 12.9% | 26.4% | IBOV | IBOV |
| Compass CRECE+ | Equities | 157.2 | 8.9% | 30.4% | 27.8% | 39.6% | S&P/BMV IPC | N/A |
| Compass Crecimiento | Equities | 219.8 | (9.9)% | (30.2)% | 5.1% | 206.4% | S&P MERVAL | N/A |
| Compass Small Cap Chile | Equities | 1,491.2 | 11.3% | 45.0% | 45.9% | 60.4% | N/A | N/A |
| Vinci Crédito Imobiliário II | Credit | 700.6 | 0.8% | 9.3% | 8.2% | 16.8% | IPCA | IPCA + 6% |
| Vinci Energia Sustentável | Credit | 519.5 | 3.0% | 10.6% | 9.3% | 18.7% | IPCA | IPCA + 6% |
| Vinci Crédito Multiestratégia | Credit | 313.3 | 1.8% | 10.3% | 10.6% | 24.2% | CDI | IPCA + 5% |
| Compass Latam Corporate Debt Fund | Credit | 5,223.0 | 3.3% | 8.4% | 7.3% | 24.2% | CEMBI Broad Div | N/A |
| Compass Latam High Yield USD | Credit | 1,748.2 | 1.6% | 5.6% | 6.4% | 24.7% | CEMBI Broad Div HY | N/A |
| Compass I+LIQG | Credit | 2,007.0 | 2.1% | 7.0% | 9.9% | 22.8% | PIP Cetes 28D | N/A |
| Compass Credit Selection | Credit | 1,005.3 | 4.0% | 11.4% | 13.9% | 28.9% | CDI | N/A |
| Compass Yield 30 | Credit | 2,129.5 | 3.2% | 10.7% | 13.2% | 29.6% | CDI | CDI |
| Compass Deuda Plus | Credit | 308.5 | 2.6% | 6.9% | 6.7% | 23.6% | N/A | N/A |
| Compass Renta Fija-B | Credit | 756.1 | 1.4% | 4.5% | 4.9% | 10.2% | CEMBI Broad Div | N/A |
| Vinci Multiestratégia FIM | Global IP&S | 73.1 | 3.2% | 9.1% | 11.7% | 21.8% | CDI | CDI |
| Atlas Strategy | Global IP&S | 212.5 | 2.7% | 4.4% | 12.1% | 18.0% | CDI | CDI |
| Vinci Valorem FIM | Global IP&S | 763.8 | 3.2% | 7.8% | 10.4% | 19.0% | IMA-B | IMA-B |
| Equilibrio Strategy | Global IP&S | 731.9 | 2.7% | 5.7% | 8.2% | 15.1% | IPCA | N/A |
| Vinci Retorno Real FIM | Global IP&S | 86.4 | 3.3% | 4.8% | 7.2% | 15.9% | IMA-B | IMA-B |
| VISC11 | Real Assets (listed REIT) | 3,188.7 | 9.3% | 22.4% | 11.8% | 13.5% | IFIX | IPCA + 6% |
| VILG11 | Real Assets (listed REIT) | 1,329.5 | 6.0% | 28.2% | 15.7% | (1.0)% | IFIX | IPCA + 6% |
| VINO11 | Real Assets (listed REIT) | 421.6 | 3.9% | 13.4% | 14.4% | (24.4)% | IFIX | IPCA + 6% |
| VIUR11 | Real Assets (listed REIT) | 153.1 | 2.6% | 6.5% | 2.4% | (9.0)% | IFIX | IPCA + 6% |
| VCRI11 | Real Assets (listed REIT) | 128.7 | 0.7% | 21.0% | 3.1% | 16.0% | IFIX | IPCA + X% |
| VICA11 | Real Assets (REIT) | 391.8 | 1.0% | 3.3% | 3.8% | 4.4% | IFIX | CDI + 1% |
| VINCI FOF IMOBILIARIO FIM CP | Real Assets (REIT) | 46.9 | 2.5% | 11.8% | 8.9% | - | IFIX | IFIX |
| VIGT11 | Real Assets (listed REIT) | 324.4 | 4.3% | 32.5% | (32.9)% | (42.0)% | N/A | N/A |
| Benchmark | 3Q'25 | YTD | 12 M | 24 M | ||
| CDI[xxvi] | 3.7% | 10.4% | 13.3% | 25.8% | ||
| IMA-B 5xxvii | 2.1% | 8.3% | 9.2% | 18.4% | ||
| IPCAxxviii | 0.6% | 3.6% | 5.2% | 9.8% | ||
| IFIXxxix | 3.0% | 15.2% | 8.6% | 11.5% | ||
| IPCA + Yield IMA-B | 2.5% | 9.6% | 13.0% | 25.1% | ||
| IBOVxxx | 5.3% | 21.6% | 10.9% | 25.5% | ||
| S&P/BMV IPCxxxi | 10.1% | 30.6% | 24.5% | 32.7% | ||
| S&P MERVALxxxii | (11.1)% | (30.0)% | 4.5% | 214.3% | ||
| CEMBI Broad Divxxxiii | 3.1% | 7.6% | 6.4% | 24.4% | ||
| CEMBI Broad Div HYxxxiv | 2.7% | 6.8% | 6.7% | 26.9% | ||
| PIP Cetes 28Dxxxv | 1.9% | 6.6% | 9.3% | 22.1% |
| Earnings Release | Vinci Compass | 18 |
| |
Investment Records – Closed End Private Markets fundsxxxvi
| Fund |
Segment
|
Vintage year |
Committed Capital (R$mm) |
Invested Capital (R$mm) |
Realized or Partially Realized (R$mm) |
Unrealized (R$mm)
|
Total Value (R$mm) |
Gross MOICxxxvii (BRL) |
Gross MOIC (USD |
Gross IRRxxxviii (BRL) |
Gross IRR (USD)
|
| Fund 1 | Private Equity | 2004 | 1,415 | 1,206 | 5,131 | 103 | 5,234 | 4.3x | 4.0x | 71.5% | 77.2% |
| VCP II | Private Equity | 2011 | 2,200 | 2,683 | 1,893 | 2,007 | 3,900 | 1.5x | 0.7x | 4.8% | (3.5)% |
| VCP III | Private Equity | 2018 | 4,000 | 2,548 | 301 | 5,249 | 5,549 | 2.2x | 2.1x | 24.0% | 24.0% |
| VCP IV | Private Equity | 2022 | 3,879 | 1,118 | – | 1,352 | 1,352 | 1.2x | 1.2x | NM | NM |
| VCP Strategyxxxix | Private Equity | 11,494 | 7,555 | 7,325 | 8,711 | 16,035 | 2.1x | 1.8x | 61.4% | 67.3% | |
| NE Empreendedorxl | Private Equity | 2003 | 36 | 13 | 26 | – | 26 | 2.1x | 2.6x | 22.0% | 30.5% |
| Nordeste III | Private Equity | 2017 | 240 | 135 | 227 | 81 | 309 | 2.3x | 1.8x | 20.3% | 13.3% |
| VIR IV | Private Equity | 2020 | 1,000 | 735 | 170 | 787 | 957 | 1.3x | 1.4x | 19.7% | 20.3% |
| VIR Strategyxli | Private Equity | 1,276 | 882 | 423 | 869 | 1,292 | 1.5x | 1.5x | 20.7% | 26.0% | |
| SPS I | Credit | 2018 | 128 | 206 | 298 | 52 | 350 | 2.3x | 1.8x | 24.8% | 18.4% |
| SPS II | Credit | 2020 | 671 | 1,062 | 1,095 | 555 | 1,650 | 2.2x | 2.2x | 22.4% | 22.7% |
| SPS III | Credit | 2021 | 1,071 | 1,635 | 457 | 1,407 | 1,864 | 2.3x | 2.4x | 24.0% | 23.1% |
| SPS IV | Credit | 2025 | 1,299 | 85 | 6 | 80 | 86 | NM | NM | NM | NM |
| SPS Strategyxlii | Credit | 3,169 | 2,987 | 1,856 | 2,095 | 3,951 | 2.3x | 2.3x | 23.3% | 22.1% | |
| MAV I | Credit | 2022 | 165 | 165 | 156 | 87 | 243 | 1.5x | 1.4x | 18.9% | 21.0% |
| MAV II | Credit | 2023 | 205 | 205 | 40 | 206 | 246 | 1.2x | 1.3x | 19.0% | 14.0% |
| MAV III | Credit | 2025 | 220 | 96 | 5 | 63 | 68 | NM | NM | NM | NM |
| MAV Strategyxliii | Credit | 590 | 467 | 201 | 356 | 557 | 1.3x | 1.4x | 19.0% | 17.1% | |
| Lacan Florestal I | Real Assets | 2012 | 253 | 253 | 255 | 323 | 578 | 2.3x | 1.3x | 11.2% | 2.9% |
| Lacan Florestal II | Real Assets | 2016 | 356 | 356 | 125 | 591 | 716 | 2.0x | 1.5x | 12.1% | 6.9% |
| Lacan Florestal III | Real Assets | 2020 | 501 | 390 | – | 528 | 528 | 1.4x | 1.3x | 11.2% | 9.3% |
| Lacan Florestal IV | Real Assets | 2023 | 172 | 109 | – | 126 | 126 | 1.2x | 1.2x | 14.9% | 18.4% |
| Lacan Strategyxliv | Real Assets | 1,282 | 1,108 | 380 | 1,567 | 1,948 | 1.8x | 1.4x | 11.6% | 5.3% | |
| FIP Transmissãoxlv | Real Assets | 2017 | 211 | 104 | 367 | – | 367 | 3.5x | 2.6x | 55.3% | 40.1% |
| VIASxlvi | Real Assets | 2021 | 386 | 350 | – | 516 | 516 | 1.5x | 1.4x | 17.6% | 14.8% |
| VICCxlvii | Real Assets | 2022 | 1,784 | 151 | – | 155 | 155 | 1.0x | 1.0x | NM | NM |
| VFDLxlviii | Real Assets | 2021 | 422 | 334 | 16 | 376 | 392 | 1.2x | 1.2x | 8.9% | 7.5% |
| Vinci Credit Infraxlix | Credit | 2022 | 1,848 | 1,256 | 59 | 1,409 | 1,468 | 1.2x | 1.2x | NM | NM |
| Earnings Release | Vinci Compass | 19 |
| |
Shareholder Dividends & Share Summary
| ($ in thousands) | 4Q'23 | 1Q'24 | 2Q'24 | 3Q'24 | 4Q'24 | 1Q'25 | 2Q'25 | 3Q'25 |
| Adjusted Distributable Earnings (R$) | 63,641 | 49,605 | 58,401 | 57,104 | 73,946 | 62,306 | 75,760 | 73,092 |
| Adjusted Distributable Earnings (US$)l | 12,829 | 9,801 | 10,331 | 9,872 | 12,804 | 11,027 | 13,964 | 13,645 |
| Adjusted DE per Common Share (US$)li | 0.24 | 0.18 | 0.19 | 0.19 | 0.20 | 0.17 | 0.22 | 0.22 |
| Actual Dividend per Common Sharelii | 0.20 | 0.17 | 0.17 | 0.16 | 0.15 | 0.15 | 0.15 | 0.15 |
| VINP Shares | 4Q'23 | 1Q'24 | 2Q'24 | 3Q'24 | 4Q'24 | 1Q'25 | 2Q'25 | 3Q'25 |
| Shares Repurchased | ||||||||
| # of Shares | 93,249 | 533,981 | 220,135 | 374,834 | 607,643 | 683,148 | 173,762 | – |
| Average Cost (US$/share) | 10.50 | 10.64 | 10.82 | 10.38 | 10.28 | 10.07 | 9.47 | – |
| Capital Deployed (US$) | 979,137 | 5,681,558 | 2,382,251 | 3,890,849 | 6,246,577 | 6,879,698 | 1,645,210 | – |
| Class B | 14,466,239 | 14,466,239 | 14,466,239 | 14,466,239 | 14,466,239 | 14,466,239 | 14,466,239 | 14,466,239 |
| Class Aliii | 39,312,578 | 38,778,597 | 38,779,209 | 38,404,375 | 49,580,116 | 48,896,968 | 48,778,420 | 48,778,420 |
| Common Shares | 53,778,817 | 53,244,836 | 53,245,448 | 52,870,614 | 64,046,355 | 63,363,207 | 63,244,659 | 63,244,659 |
Vinci Compass generated R$1.16 or US$0.22 of Adjusted Distributable Earnings per common share for the third quarter of 2025. The company declared a quarterly dividend of US$0.15 per common share to record holders as of November 24, 2025; payable on December 09, 2025.
Common Shares Outstanding as of quarter end of 63,244,659 shares.
There were no common shares repurchased in the quarter and as of September 30, 2025, there was no remaining authorization for the share repurchase plan.
| Earnings Release | Vinci Compass | 20 |
| |
Reconciliation and Disclosures
Non-GAAP Reconciliation
| (R$ thousands, unless mentioned) | 3Q'24 | 2Q'25 | 3Q'25 | 3Q'24 YTD | 3Q'25 YTD |
| OPERATING PROFIT | 54,803 | 69,884 | 78,760 | 174,727 | 216,048 |
| (-) Net revenue from realized performance fees | (1,890) | (17,054) | (2,986) | (13,259) | (23,117) |
| (-) Net revenue from unrealized performance fees | – | 8,711 | – | 3,483 | 8,711 |
| (+) Compensation allocated in relation to performance fees | 907 | 3,683 | 1,282 | 4,419 | 6,315 |
| FEE RELATED EARNINGS (FRE) | 53,819 | 65,224 | 77,056 | 169,369 | 207,957 |
| OPERATING PROFIT | 54,803 | 69,884 | 78,760 | 174,727 | 216,048 |
| (-) Net revenue from management fees | (106,750) | (195,569) | (201,539) | (317,339) | (592,637) |
| (-) Net revenue from advisory | (5,966) | (26,220) | (25,384) | (27,806) | (76,457) |
| (-) Other revenues | – | (10,944) | (11,404) | – | (33,610) |
| (+) Bonus related to management and advisory | 19,228 | 33,127 | 36,407 | 61,356 | 101,278 |
| (+) Personnel expenses | 8,238 | 20,682 | 18,135 | 23,131 | 58,942 |
| (+) Other general and administrative expenses | 6,110 | 17,423 | 14,185 | 18,140 | 47,039 |
| (+) Placement fee amortization and rebates | 503 | 17,792 | 19,461 | 1,494 | 58,268 |
| (+) Corporate center expenses | 24,817 | 78,484 | 73,083 | 71,654 | 229,219 |
| PERFORMANCE RELATED EARNINGS (PRE) | 984 | 4,660 | 1,704 | 5,358 | 8,091 |
| OPERATING PROFIT | 54,803 | 69,884 | 78,760 | 174,727 | 216,048 |
| (-) Net revenue from unrealized performance fees | – | 8,711 | – | 3,483 | 8,711 |
| (+) Compensation allocated in relation to unrealized performance fees | – | (3,083) | – | (1,233) | (3,083) |
| (+) Realized gain from GP investment income | 4,539 | 13,576 | 4,362 | 21,324 | 22,223 |
| SEGMENT DISTRIBUTABLE EARNINGS | 59,342 | 89,088 | 83,122 | 198,301 | 243,899 |
| NET INCOME | 41,369 | 66,773 | 48,559 | 115,424 | 171,260 |
| (-) Net revenue from unrealized performance fees | – | 8,711 | – | 3,483 | 8,711 |
| (+) Income tax from unrealized performance fees | – | (1,004) | – | (401) | (1,004) |
| (+) Compensation allocated in relation to unrealized performance fees | – | (3,083) | – | (1,233) | (3,083) |
| (-) Unrealized gain from GP investment income | 11,149 | 2,512 | (686) | 10,174 | 2,105 |
| (+) Income tax on unrealized gain from GP investment income | 180 | (2,672) | 193 | (524) | (1,785) |
| (-) Unrealized gain from financial income | – | – | – | 0 | – |
| (+) Income tax on unrealized gain from financial income | – | – | – | – | – |
| (-) Contingent consideration (earn-out) gain (loss)liv | (8,248) | (12,932) | 13,398 | 3,371 | (9,080) |
| (+) Income tax on contingent consideration | 2,804 | 2,081 | (2,645) | (1,146) | 841 |
| (+) Depreciation and amortization | 2,272 | 6,250 | 7,453 | 6,036 | 19,934 |
| (+) Equity-based compensation | 4,041 | 4,333 | 8,101 | 13,718 | 17,437 |
| (-) Income Taxes on Equity-based compensation | (190) | 371 | (262) | (431) | (8) |
| (+) Equity gain (loss) | – | 3,996 | (3,609) | – | 2,588 |
| (+) Dividends received | – | – | 2,457 | – | 2,457 |
| (+) Non-operational expenses including income tax related to realized expenselv | 3,727 | 422 | 133 | 16,639 | 783 |
| ADJUSTED DISTRIBUTABLE EARNINGS | 57,104 | 75,759 | 73,092 | 165,110 | 211,157 |
| TOTAL NET REVENUE FROM SERVICES RENDERED | 114,606 | 241,075 | 241,313 | 354,921 | 717,109 |
| (-) Net revenue from realized performance fees | (1,890) | (17,054) | (2,986) | (13,259) | (23,117) |
| (-) Net revenue from unrealized performance fees | – | 8,711 | – | 3,483 | 8,711 |
| NET REVENUE FROM MANAGEMENT FEES AND ADVISORY | 112,716 | 232,733 | 238,327 | 345,146 | 702,704 |
| Earnings Release | Vinci Compass | 21 |
| |
Balance Sheet Results
| Assets | 6/30/2025 | 9/30/2025 |
| Current assets | ||
| Cash and cash equivalents | 189,190 | 215,934 |
| Cash and bank deposits | 100,449 | 103,176 |
| Financial instruments at fair value through profit or loss | 58,148 | 96,994 |
| Financial instruments at amortized cost | 30,593 | 15,764 |
| Financial instruments at fair value through profit or loss | 1,449,809 | 1,449,485 |
| Trade receivables | 189,754 | 197,409 |
| Sub-leases receivable | 645 | - |
| Taxes recoverable | 11,614 | 14,062 |
| Other assets | 57,596 | 53,575 |
| Total current assets | 1,898,608 | 1,930,465 |
| Non-current assets | ||
| Financial instruments at fair value through profit or loss | 135,644 | 134,809 |
| Financial instruments at amortized cost | 6,036 | 5,866 |
| Trade receivables | 6,024 | 14,923 |
| Sub-leases receivable | 3,749 | 3,500 |
| Taxes recoverable | 3,887 | 3,478 |
| Deferred taxes | 29,254 | 33,104 |
| Other receivables | 39,323 | 44,261 |
| 223,917 | 239,941 | |
| Investments accounted for using the equity method | 55,455 | 59,636 |
| Property and equipment | 65,274 | 67,368 |
| Right of use - Leases | 126,571 | 127,911 |
| Intangible assets | 1,052,105 | 1,050,534 |
| Total non-current assets | 1,523,322 | 1,545,390 |
| Total Assets | 3,421,930 | 3,475,855 |
| Earnings Release | Vinci Compass | 22 |
| |
| Liabilities and equity | 6/30/2025 | 9/30/2025 |
| Current liabilities | ||
| Trade payables | 9,366 | 9,081 |
| Financial instruments at fair value through profit or loss | 16,106 | 11,217 |
| Deferred Revenue | – | 15,002 |
| Leases | 31,804 | 28,882 |
| Accounts payable | 35,231 | 38,024 |
| Labor and social security obligations | 100,640 | 128,508 |
| Loans and Financing | 25,786 | 32,384 |
| Taxes and contributions payable | 23,255 | 26,054 |
| Total current liabilities | 242,188 | 289,152 |
| Non-current liabilities | ||
| Leases | 110,631 | 114,521 |
| Labor and social security obligations | 6,319 | 6,693 |
| Loans and Financing | 722,617 | 705,900 |
| Deferred taxes | 2,839 | 3,300 |
| Retirement plans liabilities | 454,387 | 478,007 |
| 1,296,793 | 1,308,421 | |
| Total liabilities | 1,538,981 | 1,597,573 |
| Equity | ||
| Share capital | 18 | 18 |
| Additional paid-in capital | 2,094,601 | 2,094,601 |
| Treasury shares | (306,608) | (306,608) |
| Retained Earnings | 101,177 | 98,952 |
| Other reserves | (4,443) | (6,198) |
| 1,884,745 | 1,880,765 | |
| Non-controlling interests in the equity of subsidiaries | (1,796) | (2,483) |
| Total equity | 1,882,949 | 1,878,282 |
| Total liabilities and equity | 3,421,930 | 3,475,855 |
| Earnings Release | Vinci Compass | 23 |
| |
Forward-Looking Statements
This earnings release contains forward-looking statements that can be identified by the use of words such as “anticipate,” “believe,” “could,” “expect,” “should,” “plan,” “intend,” “estimate” and “potential,” among others. By their nature, forward-looking statements are necessarily subject to a high degree of uncertainty and involve known and unknown risks, uncertainties, assumptions and other factors because they relate to events and depend on circumstances that will occur in the future whether or not outside of our control. Such factors may cause actual results, performance or developments to differ materially from those expressed or implied by such forward-looking statements and there can be no assurance that such forward-looking statements will prove to be correct. The forward-looking statements included herein speak only as at the date of this press release and we do not undertake any obligation to update these forward-looking statements. Past performance does not guarantee or predict future performance. Moreover, neither we nor our affiliates, officers, employees and agents undertake any obligation to review, update or confirm expectations or estimates or to release any revisions to any forward-looking statements to reflect events that occur or circumstances that arise in relation to the content of this press release. Further information on these and other factors that could affect our financial results is included in filings we have made and will make with the U.S. Securities and Exchange Commission from time to time.
i “Fee Related Revenues” is a measure that we use to assess our ability to generate profits from our fund management and advisory business without measuring for the outcomes from funds above their respective benchmarks. We calculate Net Revenue from Fund Management and Advisory as net revenue from services rendered less (a) net revenue from realized performance fees and less (b) net revenue from unrealized performance fees.
ii “Fee related earnings”, or “FRE”, is a metric to monitor the baseline performance of, and trends in, our business, in a manner that does not include performance fees, investment income and expenses that do not arise from our normal course of operations. FRE is calculated as operating profit, less (a) net revenue from realized performance fees, less (b) net revenue from unrealized performance fees, plus (c) share-based payments plus (d) compensation allocated in relation to performance fees plus (e) non-operational expenses, which are comprised of expenses relating to professional services rendered in connection with acquisitions and our international corporate organization.
iii “FRE Margin” is calculated as FRE divided by the sum of net revenue from fund management and net revenue from advisory services.
iv “FRE per share” is calculated considering the number of outstanding shares at the end of the current quarter. Last twelve months values are calculated as the sum of the last four quarters.
v “Performance Related Earnings”, or “PRE”, is a performance measure that we use to assess our ability to generate profits from revenue that relies on outcomes from funds above their respective benchmarks. We calculate PRE as operating profit less (a) net revenue from fund management, less (b) net revenue from advisory services, plus (c) personnel and profit-sharing expenses, plus (d) other general and administrative expenses, less (e) compensation in relation to performance fees.
| Earnings Release | Vinci Compass | 24 |
| |
vi “PRE Margin” is calculated as PRE divided by net revenue from performance fees.
vii “Segment Distributable Earnings” is Vinci Partners’ segment profitability measure used to make operating decisions and assess performance across the company’s five segments (Private Markets, Public Equities, Investment Products and Solutions, Retirement Services and Corporate Advisory). Segment Distributable Earnings is calculated as operating profit less (a) net revenue from unrealized performance fees, plus (b) compensation allocated in relation to unrealized performance fees, plus (c) realized gain from GP investment income.
viii “Other items” comprise the income/(loss) generated by financial income/(expenses) related to acquisitions, Ares Convertible Preferred Shares and other financial expenses.
ix “Non-operational expenses” are composed by expenses related to professional services to matters related to acquisitions.
x “Distributable Earnings”, or “DE”, is used as a reference point by our board of directors to assess our performance and capabilities to distribute dividends to our shareholders. Distributable Earnings is calculated as profit for the year, less (a) net revenue from unrealized performance fees, plus (b) income taxes from unrealized performance fees, plus (c) compensation allocated in relation to unrealized performance fees, less (d) unrealized gain from investment income, plus (e) income taxes on unrealized gain from investment income, plus (f) share-based payments, plus (g) income taxes on share-based payments, plus (h) depreciation and amortization, except for depreciation and amortization relating to each segment’s investments, less (i) contingent consideration (earn-out) gain (loss) (after tax).
xi “DE Margin” is calculated as Distributable Earnings divided by sum of net revenue from fund management, net revenue from performance fees, net revenue from advisory services, net revenue from other revenues and realized gain from investment income.
xii “Adjusted Distributable Earnings”, or “Adjusted DE”, is used as a reference point by our board of directors for determining the amount of earnings available to distribute to shareholders as dividends. Adjusted Distributable Earnings is calculated as Distributable Earnings, plus expenses relating to professional services rendered in connection with acquisitions, our business combination with Compass and our international corporate organization (including income tax related to realized expense).
xiii “Adjusted DE Margin” is calculated as Adjusted Distributable Earnings divided by the sum of net revenue from fund management, net revenue from performance fees, net revenue from advisory services, net revenue from other revenues and realized gain from investment income.
xiv “Adjusted DE per share” is calculated considering the number of outstanding shares at the end of the current quarter. Last twelve months values are calculated as the sum of the last four quarters.
xv “AUM” refers to assets under management and advisory. Our AUM equals the sum of: (1) the fair market value of all funds and accounts under management and advisory by Vinci Compass, across Global IP&S, Credit, Private Equity, Equities, and Real Assets; (2) the capital that we are entitled to call from investors in funds pursuant to the terms of their capital commitments to those funds; and (3) the fair market value of co-investments arranged by us that were made, or could be made, by limited partners of our corporate private equity funds and portfolio companies of such funds. As a significant portion of our AUM is denominated in currencies other than Brazilian Reais, fluctuations in foreign exchange rates may cause our reported AUM to vary over time, independently of underlying asset or commitment changes. AUM includes double counting related to funds from one segment that invest in funds from another segment. Those cases occur mainly due to (a) fund, of funds of investment products and solutions segment, and (b) investment funds in general that invest part of their cash in credit segment and hedge fund segment funds in order to maintain liquidity and provide for returns on cash. Such amounts are eliminated on consolidation. The bylaws of the relevant funds prohibit double-charging fees on AUM across segments. Therefore, while our AUM by segment may double-count funds from one segment that invest in funds from another segment, the revenues for any given segment do not include revenue in respect of assets managed by another segment, which means there are no intercompany eliminations on revenues in our results of operations.
| Earnings Release | Vinci Compass | 25 |
| |
xvi “Segment personnel expenses” are composed of the salary-part compensation paid to employees and partners of our funds’ management teams.
xvii “Corporate center expenses” are composed by the salary-compensation paid to employees and partners of our support teams and other expenses, such as research, risk, legal & compliance, investor relations, operations and ESG.
xviii “Other general and administrative expenses” is made up of third-party expenses, depreciation and amortization, travel and representation, marketing expenses, administrative fees, non-operating taxes, third-party consultants’ fees, such as legal and accounting, and office consumables.
xix “Placement fee amortization and rebates” reflects fees paid to distributors that, due to accounting procedures, are not deducted from net management fees, unlike certain other distributor fees that directly impact that line.
xx “Investment Related Earnings” or “IRE” is income from proprietary investments made by us in our own Private Markets’ funds, used as GP Commitments.
xxi “Financial income” is income generated through the investments made with our cash and cash equivalents in cash and bank deposits, certificate of deposits and proprietary investments in our Liquid Funds from our public equities and hedge funds’ segments.
xxii “Leasing expenses” include costs from the company’s sub-leasing activities.
xxiii “Share Based Plan” is the composition of two benefit programs: SOP (Stock Option Plan) and RSU (Restricted Stock Units). In Stock Option Plan the company concedes to an employee the option to buy stock in the company with stated fixed price. The Restricted Stock Units concedes company shares to an employee through a vesting plan in which RSUs are assigned a fair market value.
xxiv Income taxes is comprised of taxes on our corporate income tax and social contribution taxes. We are taxed on an actual taxable profit regime, while part of our subsidiaries is taxed based on deemed profit.
xxv NAV is the net asset value of each fund. For listed vehicles, the NAV represents the Market valuation of the fund ex-dividends.
xxvi CDI is an average of interbank overnight rates in Brazil (daily average for the period).
| Earnings Release | Vinci Compass | 26 |
| |
xxvii IMAB is composed by government bonds indexed to IPCA. IMAB 5 also includes government bonds indexed to IPCA with up to 5 Years in duration.
xxviii IPCA is a broad consumer price index measured by the IBGE.
xxix IFIX is an index composed by listed REITs in the Brazilian stock Market.
xxx Brazil stock market most relevant index.
xxxi S&P/BMV IPC seeks to measure the performance of the largest and most liquid stocks listed on the Mexican Stock Market.
xxxii S&P MERVAL Index, Argentina’s flagship index, seeks to measure the performance of the largest, most liquid stocks trading on the Argentinian Stock Market.
xxxiii CEMBI Broad Div tracks the performance of US dollar-denominated bonds issued by emerging market corporate entities.
xxxiv The J.P. Morgan CEMBI Broad Diversified HY index tracks liquid, US Dollar emerging market fixed and floating-rate debt instruments issued by corporate, sovereign, and quasi-sovereign entities.
xxxv PiP Cetes 28d is an index that invests in Cetes 28-day securities. Cetes are Treasury Certificates issued by the Mexican government.
xxxvi Track record information is presented throughout this release on a pro forma basis and in local currency, excluding PIPE investments, a strategy that will be discontinued in VCP III.
xxxvii “MOIC” means multiple on invested capital, a ratio intended to represent how much value an investment has returned, and is calculated as realized value plus unrealized value, divided by the total amount invested, gross of expenses and fees.
xxxviii “IRR” means the internal rate of return, which is a discount rate that makes the net present value of all cash flows equal to zero in a discounted cash flow analysis.
xxxix Total commitments for VCP III include R$1.3 billion in co-investments. Track record presented for the VCP strategy as of 2Q’25, due to fund’s administrator timeline to disclose the quarterly markup of the fund.
xl Performance information for Nordeste Empreendedor (“NE I”) comprises only the four (out of seven) investments invested, managed and divested by a team led by Jose Pano (collectively, the ”Participating Investments”) while they were employed by NE I’s manager (the “NE I Manager”), an entity not affiliated with the manager or Vinci Partners. Information herein pertaining to any investments made by NE I manager has not been prepared by NE I manager and NE I manager assumes no responsibility for the accuracy or completeness of any such information.
xli Track record for VIR strategy is presented as of 2Q’25, due to fund’s administrator timeline to disclose the quarterly markup of the fund.
xlii Track record for Vinci SPS strategy is presented as of 3Q’25.
| Earnings Release | Vinci Compass | 27 |
| |
xliii Track record for MAV strategy is presented as of 3Q’25.
xliv Track record for Lacan strategy is presented as of 3Q’25.
xlv Track record for FIP Infra is presented as of 2Q’25.
xlvi Track record for VIAS is presented as of 2Q’25.
xlvii Total commitments for VICC are presented as of 2Q’25.
xlviii Track record for VFDL is presented as of 3Q’25.
xlix Track record for Vinci Credit Infra is presented as of 3Q’25.
l US$ Distributable Earnings was calculated considering the exchange rate from USD to BRL of 5.3567, as of November 07, 2025, when dividends were approved by our Board of Directors.
li Per Share calculations are based on end of period Participating Common Shares.
lii Actual dividends per common share are calculated considering the share count as of the applicable record date.
liii As of September 30, 2025, Public Float was comprised of 13,767,359 Class A common shares.
liv Contingent consideration adjustment (after-tax) related to acquisitions and combination with Compass reflects the change in the earn out’s fair value to be paid in the future. On September 30, 2025, Vinci Compass revaluated the fair value of the obligation based on the economic conditions at the date, resulting in a decrease of the contingent consideration fair value. The variation was recognized as a gain in the financial result.
lv Non-operational expenses are comprised of expenses related to professional services rendered in connection with acquisitions.
| Earnings Release | Vinci Compass | 28 |

VinciCompass;