REGISTRATION STATEMENT PURSUANT TO SECTION 12(b) OR 12(g) OF THE SECURITIES EXCHANGE ACT OF 1934 |
ANNUAL REPORT PURSUANT TO SECTION 13 OR 15(d) OF THE SECURITIES EXCHANGE ACT OF 1934 |
TRANSITION REPORT PURSUANT TO SECTION 13 OR 15(d) OF THE SECURITIES EXCHANGE ACT OF 1934 |
SHELL COMPANY REPORT PURSUANT TO SECTION 13 OR 15(d) OF THE SECURITIES EXCHANGE ACT OF 1934 |
Title of each class |
Trading Symbol(s) |
Name of each exchange on which registered | ||
(The Nasdaq Global Select Market) | ||||
US$0.0001 per share* |
(The Nasdaq Global Select Market) |
| * |
| Large accelerated filer ☐ | ☒ |
Non-accelerated filer ☐ |
Emerging growth company |
| † | The term “new or revised financial accounting standard” refers to any update issued by the Financial Accounting Standards Board to its Accounting Standards Codification after April 5, 2012. |
☒ |
International Financial Reporting Standards as issued by the International Accounting Standards Board ☐ |
Other ☐ |
Page |
||||
| 1 | ||||
| 3 | ||||
| 5 | ||||
| 5 | ||||
| 5 | ||||
| 5 | ||||
| 108 | ||||
| 169 | ||||
| 169 | ||||
| 182 | ||||
| 194 | ||||
| 196 | ||||
| 197 | ||||
| 197 | ||||
| 213 | ||||
| 214 | ||||
| 215 | ||||
| 215 | ||||
| 216 | ||||
| 216 | ||||
| 217 | ||||
| 217 | ||||
| 217 | ||||
| 218 | ||||
| 218 | ||||
| 218 | ||||
| 218 | ||||
| 219 | ||||
| 219 | ||||
| 220 | ||||
| 220 | ||||
| 220 | ||||
| 220 | ||||
| • | “ADSs” are to the American depositary shares, each of which represents five of our ordinary shares; |
| • | “CAR” are to chimeric antigen receptor; |
| • | “ADRs” are to the American depositary receipts that evidence the ADSs; |
| • | “CDE” are to the Center for Drug Evaluation of the National Medical Products Administration in China; |
| • | “China” and “PRC” are to the People’s Republic of China, excluding, for the purpose of this annual report only, the Hong Kong Special Administrative Region, the Macau Special Administrative Region and Taiwan; “Greater China” does not exclude Hong Kong Special Administrative Region, the Macau Special Administrative Region and Taiwan; |
| • | “CR” are to complete response, which generally means the disappearance of all signs of cancer in response to treatment, with the exact criteria varying from indication to indication; |
| • | “CRi” are to complete response with incomplete hematologic recovery; |
| • | “CRS” are to cytokine release syndrome, a symptom complex and an expected adverse event associated with CAR-T cell therapies and measured by Lee grading system or ASBMT grading system. Grade 1 CRS is generally associated with non-life threatening symptoms and requires symptomatic treatment only, Grade 2 or Grade 3 CRS requires moderate to more aggressive intervention, and Grade 4 or higher CRS is associated with life-threatening symptoms that require ventilation support, or death; |
| • | “FDA” are to U.S. Food and Drug Administration; |
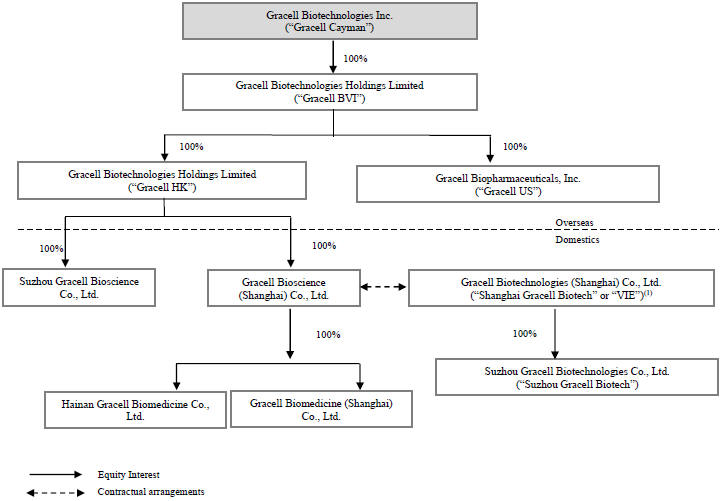
| • | “Gracell,” “we,” “us,” “our company,” or “our” are to Gracell Biotechnologies Inc. and its subsidiaries and, in the context of describing our operations and consolidated financial information, also include the VIE and its subsidiary; |
| • | “GvHD” are to graft versus host disease, where donor cells recognize the patient’s normal tissues as foreign and cause potentially lethal tissue damage; |
| • | “HvG” are to host versus graft rejection, where a patient’s immune cells recognize infused non-HLA-matched |
| • | “ICANS” are to immune effector cell-associated neurotoxicity syndrome, a common adverse event and treatment-related toxicity observed after CAR-T cell therapies and measured by ASBMT grading system. Grade 1 ICANS is generally associated with low depressed level of consciousness where patients awaken spontaneously, Grade 2 or Grade 3 ICANS is generally associated with moderate depressed level of consciousness where patients still awaken to voice or tactile stimulus, and clinical seizure that resolves rapidly, and Grade 4 ICANS is generally associated more serious symptoms such as stupor, coma, prolonged seizure and deep focal motor weakness; |
| • | “MRD” are to minimal residual disease, the small number of cancer cells in the body after cancer treatment. An MRD positive or MRD+ test result means that disease was still detected after treatment; an MRD negative or MRD- result means that no disease was detected after treatment; |
| • | “NMPA” are to the National Medical Products Administration in China; |
| • | “Onset” are to the first appearance of any sign or symptom of an illness; |
| • | “ordinary shares” are to ordinary shares of our company, par value US$0.0001 per share; |
| • | “ORR” are to overall response rate, percentage of patients achieving a response to therapy; |
| • | “Renminbi” and “RMB” are to the legal currency of the PRC; |
| • | “PFS” are to progression-free survival, the length of time during and after the treatment of a disease, such as cancer, that a patient lives without the disease getting worse; |
| • | “PR” are to partial response; |
| • | “Preferred Shares” are to the series A, series B-1, series B-2 and series C preferred shares, par value $0.0001 per share; |
| • | “sCR” are to stringent complete response, a deeper response category than CR used in multiple myeloma; |
| • | “SOC” are to standard of care; |
| • | “TME” are to tumor microenvironment; |
| • | “US$,” “U.S. dollars,” “$,” and “dollars” are to the legal currency of the United States; |
| • | “we,” “us,” “our company” and “our” are to Gracell Biotechnologies Inc., a Cayman Islands exempted company and its subsidiaries and, in the context of describing our operations and consolidated financial information, also include its consolidated PRC affiliated entities; and |
| • | “VGPR” are to very good partial response. |
| • | the ability of our investigator-initiated trials and clinical trials to demonstrate acceptable safety and efficacy of our product candidates, and other positive results; |
| • | the timing, progress and results of preclinical studies, investigator-initiated trials and clinical trials for product candidates we may develop, including statements regarding the timing of initiation and completion of studies or trials and related preparatory work, the period during which the results of the trials will become available, and our research and development programs; |
| • | the timing, scope and likelihood of regulatory filings and approvals, including final regulatory approval of our product candidates; |
| • | our ability to develop and advance our current product candidates and programs into, and successfully complete, clinical trials; |
| • | our manufacturing, commercialization, and marketing capabilities and strategy; |
| • | our plans relating to commercializing our product candidates, if approved, including the geographic areas of focus and sales strategy; |
| • | the need to hire additional personnel and our ability to attract and retain such personnel; |
| • | the size of the market opportunity for our product candidates, including our estimates of the number of patients who suffer from the diseases we are targeting; |
| • | our expectations regarding the approval and use of our product candidates as first, second or subsequent lines of therapy or in combination with other drugs; |
| • | our ability to consistently maintain effective internal control over financial reporting; |
| • | our competitive position and the success of competing therapies that are or may become available; |
| • | our estimates of the number of patients that we will enroll in our clinical trials; |
| • | the beneficial characteristics, safety, efficacy and therapeutic effects of our product candidates; |
| • | our ability to obtain and maintain regulatory approval of our product candidates; |
| • | our plans relating to the further development of our product candidates, including additional indications we may pursue; |
| • | our intellectual property position, including our ability to obtain, maintain, expand, protect and enforce our intellectual property rights covering product candidates we may develop, including the extensions of existing patent terms where available, the validity of intellectual property rights held by third parties, and our ability not to infringe, misappropriate or otherwise violate any third-party intellectual property rights; |
| • | our continued reliance on third parties to conduct additional clinical trials of our product candidates, and for the manufacture of our product candidates for preclinical studies and clinical trials; |
| • | our ability to obtain, and negotiate favorable terms of, any collaboration, licensing or other arrangements that may be necessary or desirable to develop, manufacture or commercialize our product candidates; |
| • | the pricing and reimbursement of our product candidates we may develop, if approved; |
| • | the rate and degree of market acceptance and clinical utility of our product candidates we may develop; |
| • | our estimates regarding expenses, future revenue, capital requirements and needs for additional financing; |
| • | our financial performance; |
| • | the period over which we estimate our existing cash and cash equivalents will be sufficient to fund our future operating expenses and capital expenditure requirements; |
| • | the impact of laws and regulations; |
| • | our expectations regarding the period during which we will qualify as an emerging growth company under the JOBS Act; |
| • | the effect of epidemics and pandemics, such as the COVID-19 pandemic, or other business disruptions on our business; and |
| • | our anticipated use of our existing resources and the proceeds from our initial public offering. |
Item 1. |
Identity of Directors, Senior Management and Advisers |
Item 2. |
Offer Statistics and Expected Timetable |
Item 3. |
Key Information |
| • | The PRC government has significant authority to regulate or intervene in the China operations of an offshore holding company, such as us, at any time. Therefore, investors in the ADSs and our business face potential uncertainty from the PRC government’s policy. The Chinese government may intervene or influence our operations at any time, or may exert more control over offerings conducted overseas and/or foreign investment in China-based issuers, which could result in a material change in our operations and/or the value of our ADSs. Any actions by the Chinese government to exert more oversight and control over offerings that are conducted overseas and/or foreign investment in China-based issuers could significantly limit or completely hinder our ability to offer or continue to offer securities to investors and cause the value of such securities to significantly decline. See “Item 3. Key Information—D. Risk Factors—Risks Related to Doing Business in China—The PRC government has significant authority to regulate or intervene in the China operations of an offshore holding company, such as us, at any time. Therefore, investors in the ADSs and our business face potential uncertainty from the PRC government’s policy”; |
| • | We believe that our corporate structure and contractual arrangements with the VIE comply with the current applicable PRC laws and regulations. As of the date of this annual report, we believe that our PRC subsidiaries and the VIE are not required to obtain permission or approval from the Chinese Securities Regulatory Commission, or the CSRC, or the Cyberspace Administration of China, or the CAC, to operate their respective business in China or to approve our contractual arrangements with the VIE and its shareholders. |
| • | Recently, the PRC government initiated a series of regulatory actions and released guidelines to regulate business operations in China with little advance notice, including those related to data security or anti-monopoly concerns, which may have an impact on our ability to conduct certain business in China, accept foreign investments, or list on a U.S. or other foreign exchange. For a detailed description of risks and regulations related to doing business in China, see “Item 3. Key Information—D. Risk Factors—Risks Related to Doing Business in China.” |
For the years ended December 31, |
||||||||||||||||
2019 |
2020 |
2021 |
||||||||||||||
RMB |
RMB |
RMB |
US$ |
|||||||||||||
| |
|
|
|
|
|
|
|
|||||||||
(in thousands) |
||||||||||||||||
| Fees paid for services to the VIE and its subsidiaries |
6,604 | 16,906 | 16,226 | 2,546 | ||||||||||||
| Hypothetical pre-tax earnings in the VIE(1) |
100 | % | ||
| Tax on earnings at statutory rate of 25% at WFOE level |
(25 | )% | ||
| |
|
|||
| Amount to be distributed as dividend from WFOE to Gracell HK (2) |
75 | % | ||
| Withholding tax at tax treaty rate of 5% |
(3.75 | )% | ||
| |
|
|||
| Amount to be distributed as dividend at Gracell HK level and net distribution to Gracell Cayman (3) |
71.25 | % | ||
| |
|
| (1) | For purposes of this example, the tax calculation has been simplified. The hypothetical book pre-tax earnings amount is assumed to equal Chinese taxable income. |
| (2) | China’s Enterprise Income Tax Law imposes a withholding income tax of 10% on dividends distributed by a Foreign Invested Enterprise to its immediate holding company outside of Mainland China. A lower withholding income tax rate of 5% is applied if the Foreign Invested Enterprise’s immediate holding company is registered in Hong Kong or other jurisdictions that have a tax treaty arrangement with Mainland China, subject to a qualification review at the time of the distribution. There is no incremental tax at Gracell HK level for any dividend distribution to Gracell Cayman. |
| (3) | If a 10% withholding income tax rate is imposed, the withholding tax will be 7.5 and the amount to be distributed as dividend at Gracell HK level and net distribution to Gracell Cayman will be 67.5. |
As of December 31, 2020 |
||||||||||||||||||||||||
Parent Only |
Other Equity Subsidiaries |
WFOE |
VIE and VIE’s Subsidiary |
Eliminating adjustments |
Consolidated Totals |
|||||||||||||||||||
RMB |
RMB |
RMB |
RMB |
RMB |
RMB |
|||||||||||||||||||
| ASSETS |
||||||||||||||||||||||||
| Current assets: |
||||||||||||||||||||||||
| Cash and cash equivalents |
683,565 | 448 | 20,546 | 49,749 | — | 754,308 | ||||||||||||||||||
| Short-term investments |
— | — | — | 18,743 | — | 18,743 | ||||||||||||||||||
| Amounts due from Group companies |
— | — | 270,885 | 48,505 | (319,390 | ) | — | |||||||||||||||||
| Prepayments and other current assets |
— | 7 | 13,259 | 29,152 | — | 42,418 | ||||||||||||||||||
| |
|
|
|
|
|
|
|
|
|
|
|
|||||||||||||
| Total current assets |
683,565 |
455 |
304,690 |
146,149 |
(319,390 |
) |
815,469 |
|||||||||||||||||
| Investment in subsidiaries |
148,654 | 149,678 | — | — | (298,332 | ) | — | |||||||||||||||||
| Amounts due from Group companies-long-term |
29,915 | — | — | — | (29,915 | ) | — | |||||||||||||||||
| Property, equipment and software |
— | — | 40,682 | 78,401 | — | 119,083 | ||||||||||||||||||
| Other non-current assets |
17,568 | — | 3,086 | 9,744 | — | 30,398 | ||||||||||||||||||
| |
|
|
|
|
|
|
|
|
|
|
|
|||||||||||||
| TOTAL ASSETS |
879,702 |
150,133 |
348,458 |
234,294 |
(647,637 |
) |
964,950 |
|||||||||||||||||
| |
|
|
|
|
|
|
|
|
|
|
|
|||||||||||||
| LIABILITIES, MEZZANINE EQUITY AND SHAREHOLDERS’ EQUITY (DEFICIT) |
||||||||||||||||||||||||
| Current liabilities: |
||||||||||||||||||||||||
| Amounts due to Group companies |
45,586 | — | 3,800 | 270,004 | (319,390 | ) | — | |||||||||||||||||
| Accruals and other current liabilities |
14,453 | 1,479 | 15,312 | 11,157 | — | 42,401 | ||||||||||||||||||
| Short-term borrowings |
— | — | — | 49,990 | — | 49,990 | ||||||||||||||||||
| Current portion of long-term borrowings |
— | — | — | 970 | — | 970 | ||||||||||||||||||
| |
|
|
|
|
|
|
|
|
|
|
|
|||||||||||||
| Total current liabilities |
60,039 |
1,479 |
19,112 |
332,121 |
(319,390 |
) |
93,361 |
|||||||||||||||||
| Deficit in subsidiaries |
— | — | — | — | — | — | ||||||||||||||||||
| Deficit in VIEs |
— | — | 179,668 | — | (179,668 | ) | — | |||||||||||||||||
| Amounts due to Group companies-long-term |
— | — | — | 29,915 | (29,915 | ) | — | |||||||||||||||||
| Long-term borrowings |
— | — | — | 51,926 | — | 51,926 | ||||||||||||||||||
| |
|
|
|
|
|
|
|
|
|
|
|
|||||||||||||
| TOTAL LIABILITIES |
60,039 |
1,479 |
198,780 |
413,962 |
(528,973 |
) |
145,287 |
|||||||||||||||||
| |
|
|
|
|
|
|
|
|
|
|
|
|||||||||||||
| Mezzanine equity |
1,407,536 |
— |
— |
— |
— |
1,407,536 |
||||||||||||||||||
| |
|
|
|
|
|
|
|
|
|
|
|
|||||||||||||
| Shareholders’ equity (deficit): |
||||||||||||||||||||||||
| Ordinary shares |
68 | 336 | 469,813 | 6,016 | (476,165 | ) | 68 | |||||||||||||||||
| Additional paid-in capital |
— | 552,447 | 72,150 | 66,134 | (690,731 | ) | — | |||||||||||||||||
| Accumulated other comprehensive income |
(23,912 | ) | (1,408 | ) | — | — | 1,408 | (23,912 | ) | |||||||||||||||
| Accumulated deficit |
(564,029 | ) | (402,721 | ) | (392,285 | ) | (251,818 | ) | 1,046,824 | (564,029 | ) | |||||||||||||
| |
|
|
|
|
|
|
|
|
|
|
|
|||||||||||||
| Total shareholders’ equity (deficit) |
(587,873 |
) |
148,654 |
149,678 |
(179,668 |
) |
(118,664 |
) |
(587,873 |
) | ||||||||||||||
| |
|
|
|
|
|
|
|
|
|
|
|
|||||||||||||
| TOTAL LIABILITIES, MEZZANINE EQUITY AND SHAREHOLDERS’ EQUITY (DEFICIT) |
879,702 |
150,133 |
348,458 |
234,294 |
(647,637 |
) |
964,950 |
|||||||||||||||||
| |
|
|
|
|
|
|
|
|
|
|
|
|||||||||||||
As of December 31, 2021 |
||||||||||||||||||||||||
Parent Only |
Other Equity Subsidiaries |
WFOE |
VIE and VIE’s Subsidiary |
Eliminating adjustments |
Consolidated Totals |
|||||||||||||||||||
RMB |
RMB |
RMB |
RMB |
RMB |
RMB |
|||||||||||||||||||
| ASSETS |
||||||||||||||||||||||||
| Current assets: |
||||||||||||||||||||||||
| Cash and cash equivalents |
1,517,362 | 106,790 | 82,634 | 122,220 | — | 1,829,006 | ||||||||||||||||||
| Short-term investments |
— | — | — | 3,615 | — | 3,615 | ||||||||||||||||||
| Amounts due from Group companies |
— | 50,000 | 487,676 | 65,705 | (603,381 | ) | — | |||||||||||||||||
| Prepayments and other current assets |
26 | 11 | 11,454 | 40,968 | — | 52,459 | ||||||||||||||||||
| |
|
|
|
|
|
|
|
|
|
|
|
|||||||||||||
| Total current assets |
1,517,388 |
156,801 |
581,764 |
232,508 |
(603,381 |
) |
1,885,080 |
|||||||||||||||||
| Investment in subsidiaries |
— | 159,818 | — | — | (159,818 | ) | — | |||||||||||||||||
| Investment in VIEs |
— | — | — | — | — | — | ||||||||||||||||||
| Amounts due from Group companies-long-term |
372,092 | — | — | — | (372,092 | ) | — | |||||||||||||||||
| Property, equipment and software |
— | — | 62,874 | 60,944 | — | 123,818 | ||||||||||||||||||
| Operating lease right-of-use |
— | — | 24,825 | 4,827 | — | 29,652 | ||||||||||||||||||
| Other non-current assets |
— | — | 13,604 | 7,983 | — | 21,587 | ||||||||||||||||||
| |
|
|
|
|
|
|
|
|
|
|
|
|||||||||||||
| TOTAL ASSETS |
1,889,480 |
316,619 |
683,067 |
306,262 |
(1,135,291 |
) |
2,060,137 |
|||||||||||||||||
| |
|
|
|
|
|
|
|
|
|
|
|
|||||||||||||
| LIABILITIES AND SHAREHOLDERS’ EQUITY (DEFICIT) |
||||||||||||||||||||||||
Current liabilities: |
||||||||||||||||||||||||
| Amounts due to Group companies |
45,587 | — | 71,000 | 486,794 | (603,381 | ) | — | |||||||||||||||||
| Accruals and other current liabilities |
6,989 | 5,096 | 21,350 | 35,685 | — | 69,120 | ||||||||||||||||||
| Short-term borrowings |
— | — | — | 66,100 | — | 66,100 | ||||||||||||||||||
| Operating lease liabilities, current |
— | — | 13,160 | 4,367 | — | 17,527 | ||||||||||||||||||
| Current portion of long-term borrowings |
— | — | — | 2,376 | — | 2,376 | ||||||||||||||||||
| |
|
|
|
|
|
|
|
|
|
|
|
|||||||||||||
| Total current liabilities |
52,576 |
5,096 |
105,510 |
595,322 |
(603,381 |
) |
155,123 |
|||||||||||||||||
| Deficit in subsidiaries |
1,069 | — | — | — | (1,069 | ) | — | |||||||||||||||||
| Deficit in VIEs |
— | — | 403,639 | — | (403,639 | ) | — | |||||||||||||||||
| Amounts due to Group companies-long-term |
— | 312,592 | — | 59,500 | (372,092 | ) | — | |||||||||||||||||
| Operating lease liabilities, non-current |
— | — | 14,100 | 730 | — | 14,830 | ||||||||||||||||||
| Long-term borrowings |
— | — | — | 54,349 | — | 54,349 | ||||||||||||||||||
| Other non-current liabilities |
8,464 | — | — | — | — | 8,464 | ||||||||||||||||||
| |
|
|
|
|
|
|
|
|
|
|
|
|||||||||||||
| TOTAL LIABILITIES |
62,109 |
317,688 |
523,249 |
709,901 |
(1,380,181 |
) |
232,766 |
|||||||||||||||||
| |
|
|
|
|
|
|
|
|
|
|
|
|||||||||||||
| Shareholders’ equity (deficit): |
||||||||||||||||||||||||
| Ordinary shares |
223 | 336 | 820,452 | 6,016 | (826,804 | ) | 223 | |||||||||||||||||
| Additional paid-in capital |
2,902,856 | 787,791 | 80,034 | 67,812 | (935,637 | ) | 2,902,856 | |||||||||||||||||
| Accumulated other comprehensive income |
(57,936 | ) | (321 | ) | — | — | 321 | (57,936 | ) | |||||||||||||||
| Accumulated deficit |
(1,017,772 | ) | (788,875 | ) | (740,668 | ) | (477,467 | ) | 2,007,010 | (1,017,772 | ) | |||||||||||||
| |
|
|
|
|
|
|
|
|
|
|
|
|||||||||||||
| Total shareholders’ equity (deficit) |
1,827,371 |
(1,069 |
) |
159,818 |
(403,639 |
) |
244,890 |
1,827,371 |
||||||||||||||||
| |
|
|
|
|
|
|
|
|
|
|
|
|||||||||||||
| TOTAL LIABILITIES, AND SHAREHOLDERS’ EQUITY (DEFICIT) |
1,889,480 |
316,619 |
683,067 |
306,262 |
(1,135,291 |
) |
2,060,137 |
|||||||||||||||||
| |
|
|
|
|
|
|
|
|
|
|
|
|||||||||||||
For the year ended December 31, 2019 |
||||||||||||||||||||||||
Parent Only |
Other Equity Subsidiaries |
WFOE |
VIE and VIE’s Subsidiary |
Eliminating adjustments |
Consolidated Totals |
|||||||||||||||||||
RMB |
RMB |
RMB |
RMB |
RMB |
RMB |
|||||||||||||||||||
| Revenues |
||||||||||||||||||||||||
| Other-intercompany(a) |
— | — | — | 6,604 | (6,604 | ) | — | |||||||||||||||||
| |
|
|
|
|
|
|
|
|
|
|
|
|||||||||||||
| Total revenues |
— | — | — | 6,604 | (6,604 | ) | — | |||||||||||||||||
| Expenses |
||||||||||||||||||||||||
| Research and development expenses |
(2,289 | ) | — | (34,073 | ) | (82,856 | ) | (119,218 | ) | |||||||||||||||
| Administrative expenses |
(3,334 | ) | (2,812 | ) | (11,986 | ) | (9,230 | ) | — | (27,362 | ) | |||||||||||||
| Other - intercompany(a) |
(6,604 | ) | — | 6,604 | — | |||||||||||||||||||
| |
|
|
|
|
|
|
|
|
|
|
|
|||||||||||||
| Loss from operations |
(5,623 |
) |
(2,812 |
) |
(52,663 |
) |
(85,482 |
) |
— |
(146,580 |
) | |||||||||||||
| Interest income(d) |
2,904 | — | 61 | 991 | (24 | ) | 3,932 | |||||||||||||||||
| Interest expense(d) |
— | — | — | (24 | ) | 24 | — | |||||||||||||||||
| Other income |
— | — | — | 1,449 | — | 1,449 | ||||||||||||||||||
| Foreign exchange gain (loss), net |
— | — | 2,556 | — | — | 2,556 | ||||||||||||||||||
| Equity in losses of subsidiaries and VIE(c) |
(135,924 | ) | (133,112 | ) | (83,066 | ) | — | 352,102 | — | |||||||||||||||
| Others, net |
(21 | ) | — | — | — | — | (21 | ) | ||||||||||||||||
| |
|
|
|
|
|
|
|
|
|
|
|
|||||||||||||
| Loss before income taxes |
(138,664 |
) |
(135,924 |
) |
(133,112 |
) |
(83,066 |
) |
352,102 |
(138,664 |
) | |||||||||||||
| Income tax expense |
— | — | — | — | — | — | ||||||||||||||||||
| |
|
|
|
|
|
|
|
|
|
|
|
|||||||||||||
| Net loss |
(138,664 |
) |
(135,924 |
) |
(133,112 |
) |
(83,066 |
) |
352,102 |
(138,664 |
) | |||||||||||||
| Deemed contribution from convertible redeemable preferred shareholders |
(25,390 | ) | — | — | — | — | (25,390 | ) | ||||||||||||||||
| Accretion of convertible redeemable preferred shares to redemption value |
(36,802 | ) | — | — | — | — | (36,802 | ) | ||||||||||||||||
| |
|
|
|
|
|
|
|
|
|
|
|
|||||||||||||
| Net loss attributable to Gracell Biotechnologies Inc.’s ordinary shareholders |
(200,856 |
) |
(135,924 |
) |
(133,112 |
) |
(83,066 |
) |
352,102 |
(200,856 |
) | |||||||||||||
| Other comprehensive income (loss) |
||||||||||||||||||||||||
| Foreign currency translation adjustments, net of nil tax |
(3,159 | ) | (159 | ) | — | — | 159 | (3,159 | ) | |||||||||||||||
| |
|
|
|
|
|
|
|
|
|
|
|
|||||||||||||
| Total comprehensive loss attributable to Gracell Biotechnologies Inc.’s ordinary shareholders |
(204,015 |
) |
(136,083 |
) |
(133,112 |
) |
(83,066 |
) |
352,261 |
(204,015 |
) | |||||||||||||
| |
|
|
|
|
|
|
|
|
|
|
|
|||||||||||||
For the year ended December 31, 2020 |
||||||||||||||||||||||||
Parent Only |
Other Equity Subsidiaries |
WFOE |
VIE and VIE’s Subsidiary |
Eliminating adjustments |
Consolidated Totals |
|||||||||||||||||||
RMB |
RMB |
RMB |
RMB |
RMB |
RMB |
|||||||||||||||||||
| Revenues |
||||||||||||||||||||||||
| Other-intercompany(a) |
— | — | — | 16,906 | (16,906 | ) | — | |||||||||||||||||
| |
|
|
|
|
|
|
|
|
|
|
|
|||||||||||||
| Total revenues |
— | — | — | 16,906 | (16,906 | ) | — | |||||||||||||||||
| Expenses |
||||||||||||||||||||||||
| Research and development expenses |
(1,753 | ) | (1,185 | ) | (53,356 | ) | (112,536 | ) | (168,830 | ) | ||||||||||||||
| Administrative expenses |
(13,745 | ) | (6,439 | ) | (18,463 | ) | (6,919 | ) | — | (45,566 | ) | |||||||||||||
| Other - intercompany(a) |
(16,906 | ) | — | 16,906 | — | |||||||||||||||||||
| |
|
|
|
|
|
|
|
|
|
|
|
|||||||||||||
| Loss from operations |
(15,498 |
) |
(7,624 |
) |
(88,725 |
) |
(102,549 |
) |
— |
(214,396 |
) | |||||||||||||
| Interest income(d) |
2,179 | — | 822 | 554 | (685 | ) | 2,870 | |||||||||||||||||
| Interest expense(d) |
— | — | — | (2,840 | ) | 685 | (2,155 | ) | ||||||||||||||||
| Other income |
— | — | 54 | 4,653 | — | 4,707 | ||||||||||||||||||
| Foreign exchange gain (loss), net |
(1,551 | ) | — | (1,362 | ) | (1 | ) | — | (2,914 | ) | ||||||||||||||
| Equity in losses of subsidiaries and VIE(c) |
(197,030 | ) | (189,406 | ) | (100,195 | ) | — | 486,631 | — | |||||||||||||||
| Others, net |
— | — | — | (12 | ) | — | (12 | ) | ||||||||||||||||
| |
|
|
|
|
|
|
|
|
|
|
|
|||||||||||||
| Loss before income taxes |
(211,900 |
) |
(197,030 |
) |
(189,406 |
) |
(100,195 |
) |
486,631 |
(211,900 |
) | |||||||||||||
| Income tax expense |
— | — | — | — | — | — | ||||||||||||||||||
| |
|
|
|
|
|
|
|
|
|
|
|
|||||||||||||
| Net loss |
(211,900 |
) |
(197,030 |
) |
(189,406 |
) |
(100,195 |
) |
486,631 |
(211,900 |
) | |||||||||||||
| Accretion of convertible redeemable preferred shares to redemption value |
(62,733 | ) | — | — | — | — | (62,733 | ) | ||||||||||||||||
| |
|
|
|
|
|
|
|
|
|
|
|
|||||||||||||
| Net loss attributable to Gracell Biotechnologies Inc.’s ordinary shareholders |
(274,633 |
) |
(197,030 |
) |
(189,406 |
) |
(100,195 |
) |
486,631 |
(274,633 |
) | |||||||||||||
| Other comprehensive income (loss) |
||||||||||||||||||||||||
| Foreign currency translation adjustments, net of nil tax |
(20,754 | ) | (1,249 | ) | — | — | 1,249 | (20,754 | ) | |||||||||||||||
| |
|
|
|
|
|
|
|
|
|
|
|
|||||||||||||
| Total comprehensive loss attributable to Gracell Biotechnologies Inc.’s ordinary shareholders |
(295,387 |
) |
(198,279 |
) |
(189,406 |
) |
(100,195 |
) |
487,880 |
(295,387 |
) | |||||||||||||
| |
|
|
|
|
|
|
|
|
|
|
|
|||||||||||||
For the year ended December 31, 2021 |
||||||||||||||||||||||||
Parent Only |
Other Equity Subsidiaries |
WFOE |
VIE and VIE’s Subsidiary |
Eliminating adjustments |
Consolidated Totals |
|||||||||||||||||||
RMB |
RMB |
RMB |
RMB |
RMB |
RMB |
|||||||||||||||||||
| Revenues |
||||||||||||||||||||||||
| Licensing and collaboration revenue |
— | — | — | 366 | — | 366 | ||||||||||||||||||
| Other-intercompany(a)(b) |
— | — | 22,958 | 16,226 | (39,184 | ) | — | |||||||||||||||||
| |
|
|
|
|
|
|
|
|
|
|
|
|||||||||||||
| Total revenues |
— | — | 22,958 | 16,592 | (39,184 | ) | 366 | |||||||||||||||||
| Expenses |
||||||||||||||||||||||||
| Research and development expenses |
(15,245 | ) | (24,296 | ) | (82,651 | ) | (204,707 | ) | — | (326,899 | ) | |||||||||||||
| Administrative expenses |
(58,594 | ) | (14,202 | ) | (46,337 | ) | (17,907 | ) | — | (137,040 | ) | |||||||||||||
| Other-intercompany(a)(b) |
(16,226 | ) | (22,958 | ) | 39,184 | — | ||||||||||||||||||
| |
|
|
|
|
|
|
|
|
|
|
|
|||||||||||||
| Loss from operations |
(73,839 |
) |
(38,498 |
) |
(122,256 |
) |
(228,980 |
) |
— |
(463,573 |
) | |||||||||||||
| Interest income(d) |
8,292 | 36 | 1,413 | 630 | (1,255 | ) | 9,116 | |||||||||||||||||
| Interest expense(d) |
— | — | — | (6,318 | ) | 1,255 | (5,063 | ) | ||||||||||||||||
| Other income |
— | — | 45 | 9,075 | — | 9,120 | ||||||||||||||||||
| Foreign exchange gain (loss), net |
(55 | ) | 691 | (1,933 | ) | — | — | (1,297 | ) | |||||||||||||||
| Equity in losses of subsidiaries and VIE(c) |
(386,152 | ) | (348,381 | ) | (225,650 | ) | — | 960,183 | — | |||||||||||||||
| Others, net |
— | — | — | (57 | ) | — | (57 | ) | ||||||||||||||||
| |
|
|
|
|
|
|
|
|
|
|
|
|||||||||||||
| Loss before income taxes |
(451,754 |
) |
(386,152 |
) |
(348,381 |
) |
(225,650 |
) |
960,183 |
(451,754 |
) | |||||||||||||
| Income tax expense |
— | — | — | — | — | — | ||||||||||||||||||
| |
|
|
|
|
|
|
|
|
|
|
|
|||||||||||||
| Net loss |
(451,754 |
) |
(386,152 |
) |
(348,381 |
) |
(225,650 |
) |
960,183 |
(451,754 |
) | |||||||||||||
| Accretion of convertible redeemable preferred shares to redemption value |
(1,989 | ) | — | — | — | — | (1,989 | ) | ||||||||||||||||
| |
|
|
|
|
|
|
|
|
|
|
|
|||||||||||||
| Net loss attributable to Gracell Biotechnologies Inc.’s ordinary shareholders |
(453,743 |
) |
(386,152 |
) |
(348,381 |
) |
(225,650 |
) |
960,183 |
(453,743 |
) | |||||||||||||
| Other comprehensive income (loss) |
||||||||||||||||||||||||
| Foreign currency translation adjustments, net of nil tax |
(34,024 | ) | 1,087 | — | — | (1,087 | ) | (34,024 | ) | |||||||||||||||
| |
|
|
|
|
|
|
|
|
|
|
|
|||||||||||||
| Total comprehensive loss attributable to Gracell Biotechnologies Inc.’s ordinary shareholders |
(487,767 |
) |
(385,065 |
) |
(348,381 |
) |
(225,650 |
) |
959,096 |
(487,767 |
) | |||||||||||||
| |
|
|
|
|
|
|
|
|
|
|
|
|||||||||||||
| (a) | Reflects elimination of inter-company technical service fees charged by VIE to the WFOE subsidiaries. The VIE provided research and development related service to the WFOE and recognized revenue of RMB6.6 million, RMB16.9 million and RMB16.2 million in the years ended December 31, 2019, 2020 and 2021, respectively. |
| (b) | Reflects the elimination of the inter-company administrative expenses charged by WFOE to the VIE subsidiaries. The VIE received the business cooperation support from the WFOE and recognized the administrative expenses of RMB23.0 million in total in the year ended December 31, 2021. |
| (c) | Reflects the equity in loss of subsidiaries and VIEs which is eliminated in consolidation. |
| (d) | Reflects the elimination of the inter-company interest income and expenses. |
For the year ended December 31, 2019 |
||||||||||||||||||||||||
Parent Only |
Other Equity Subsidiaries |
WFOE |
VIE and VIE’s Subsidiary |
Eliminating adjustments |
Consolidated Totals |
|||||||||||||||||||
RMB |
RMB |
RMB |
RMB |
RMB |
RMB |
|||||||||||||||||||
| Net cash (used in) generated from operating activities |
(5,499 |
) |
(2,012 |
) |
(40,605 |
) |
(87,277 |
) |
— |
(135,393 |
) | |||||||||||||
| |
|
|
|
|
|
|
|
|
|
|
|
|||||||||||||
| Cash flows from investing activities: |
||||||||||||||||||||||||
| Purchase of property, equipment and software |
— | — | (17,913 | ) | (38,519 | ) | (56,432 | ) | ||||||||||||||||
| Investment in subsidiaries |
(174,739 | ) | (171,274 | ) | — | — | 346,013 | — | ||||||||||||||||
| Loans to Group companies and VIEs(e)(f) |
(23,000 | ) | — | (80,024 | ) | — | 103,024 | — | ||||||||||||||||
| Investments in short-term investments |
— | — | — | (80,200 | ) | (80,200 | ) | |||||||||||||||||
| Proceeds from disposal of short-term investments |
— | — | — | 178,000 | 178,000 | |||||||||||||||||||
| |
|
|
|
|
|
|
|
|
|
|
|
|||||||||||||
| Net cash (used in) generated from investing activities |
(197,739 |
) |
(171,274 |
) |
(97,937 |
) |
59,281 |
449,037 |
41,368 |
|||||||||||||||
| |
|
|
|
|
|
|
|
|
|
|
|
|||||||||||||
| Cash flow from financing activities |
||||||||||||||||||||||||
| Repurchase of ordinary shares and preferred shares |
— | — | — | (44,705 | ) | — | (44,705 | ) | ||||||||||||||||
| Proceeds from issuance of convertible redeemable preferred shares, net of issuance costs |
439,501 | — | — | — | — | 439,501 | ||||||||||||||||||
| Borrowings under loans from Group companies(e)(f) |
— | — | 60 | 102,964 | (103,024 | ) | — | |||||||||||||||||
| Capital contribution from parent |
— | 174,739 | 171,274 | — | (346,013 | ) | — | |||||||||||||||||
| |
|
|
|
|
|
|
|
|
|
|
|
|||||||||||||
| Net cash (used in) generated from financing activities |
439,501 |
174,739 |
171,334 |
58,259 |
(449,037 |
) |
394,796 |
|||||||||||||||||
| |
|
|
|
|
|
|
|
|
|
|
|
|||||||||||||
| Effect of exchange rate on cash and cash equivalents |
— | — | (603 | ) | — | — | (603 | ) | ||||||||||||||||
| Net increase (decrease) in cash and cash equivalents |
236,263 |
1,453 |
32,189 |
30,263 |
— |
300,168 |
||||||||||||||||||
| |
|
|
|
|
|
|
|
|
|
|
|
|||||||||||||
| Cash and cash equivalents at the beginning of year |
— | — | — | 11,890 | — | 11,890 | ||||||||||||||||||
| |
|
|
|
|
|
|
|
|
|
|
|
|||||||||||||
| Cash and cash equivalents at the end of year |
236,263 |
1,453 |
32,189 |
42,153 |
— |
312,058 |
||||||||||||||||||
| |
|
|
|
|
|
|
|
|
|
|
|
|||||||||||||
For the year ended December 31, 2020 |
||||||||||||||||||||||||
Parent Only |
Other Equity Subsidiaries |
WFOE |
VIE and VIE’s Subsidiary |
Eliminating adjustments |
Consolidated Totals |
|||||||||||||||||||
RMB |
RMB |
RMB |
RMB |
RMB |
RMB |
|||||||||||||||||||
| Net cash (used in) generated from operating activities |
(13,309 |
) |
(6,952 |
) |
(93,026 |
) |
(84,862 |
) |
— |
(198,149 |
) | |||||||||||||
| |
|
|
|
|
|
|
|
|
|
|
|
|||||||||||||
| Cash flows from investing activities: |
||||||||||||||||||||||||
| Purchase of property, equipment and software |
— | — | (25,313 | ) | (54,087 | ) | (79,400 | ) | ||||||||||||||||
| Investment in subsidiaries |
(305,734 | ) | (298,538 | ) | — | — | 604,272 | — | ||||||||||||||||
| Loans to Group companies and VIEs(e)(f) |
(6,915 | ) | — | (189,980 | ) | — | 196,895 | — | ||||||||||||||||
| Investments in short-term investments |
— | — | — | (28,055 | ) | (28,055 | ) | |||||||||||||||||
| Proceeds from disposal of short-term investments |
— | — | — | 13,514 | — | 13,514 | ||||||||||||||||||
| |
|
|
|
|
|
|
|
|
|
|
|
|||||||||||||
| Net cash (used in) generated from investing activities |
(312,649 |
) |
(298,538 |
) |
(215,293 |
) |
(68,628 |
) |
801,167 |
(93,941 |
) | |||||||||||||
| |
|
|
|
|
|
|
|
|
|
|
|
|||||||||||||
| Cash flow from financing activities |
||||||||||||||||||||||||
| Repayment of convertible loans |
(138,695 | ) | (138,695 | ) | ||||||||||||||||||||
| Proceeds from issuance of convertible redeemable preferred shares, net of issuance costs |
795,420 | — | — | — | — | 795,420 | ||||||||||||||||||
| Borrowings under loans from Group companies(e)(f) |
— | — | — | 196,895 | (196,895 | ) | — | |||||||||||||||||
| Capital contribution from parent |
305,734 | 298,538 | (604,272 | ) | — | |||||||||||||||||||
| Proceeds from bank borrowings |
— | — | — | 103,008 | — | 103,008 | ||||||||||||||||||
| Repayments of bank borrowings |
— | — | (122 | ) | — | (122 | ) | |||||||||||||||||
| Payment of initial public offering costs |
(2,645 | ) | — | (499 | ) | — | — | (3,144 | ) | |||||||||||||||
| |
|
|
|
|
|
|
|
|
|
|
|
|||||||||||||
| Net cash (used in) generated from financing activities |
792,775 |
305,734 |
298,039 |
161,086 |
(801,167 |
) |
756,467 |
|||||||||||||||||
| |
|
|
|
|
|
|
|
|
|
|
|
|||||||||||||
| Effect of exchange rate on cash and cash equivalents |
(19,515 | ) | (1,249 | ) | (1,363 | ) | — | — | (22,127 | ) | ||||||||||||||
| Net increase (decrease) in cash and cash equivalents |
447,302 |
(1,005 |
) |
(11,643 |
) |
7,596 |
— |
442,250 |
||||||||||||||||
| |
|
|
|
|
|
|
|
|
|
|
|
|||||||||||||
| Cash and cash equivalents at the beginning of year |
236,263 | 1,453 | 32,189 | 42,153 | — | 312,058 | ||||||||||||||||||
| |
|
|
|
|
|
|
|
|
|
|
|
|||||||||||||
| Cash and cash equivalents at the end of year |
683,565 |
448 |
20,546 |
49,749 |
— |
754,308 |
||||||||||||||||||
| |
|
|
|
|
|
|
|
|
|
|
|
|||||||||||||
For the year ended December 31, 2021 |
||||||||||||||||||||||||
Parent Only |
Other Equity Subsidiaries |
WFOE |
VIE and VIE’s Subsidiary |
Eliminating adjustments |
Consolidated Totals |
|||||||||||||||||||
RMB |
RMB |
RMB |
RMB |
RMB |
RMB |
|||||||||||||||||||
| Net cash (used in) generated from operating activities |
2,039 |
(34,535 |
) |
(105,277 |
) |
(166,777 |
) |
— |
(304,550 |
) | ||||||||||||||
| |
|
|
|
|
|
|
|
|
|
|
|
|||||||||||||
| Cash flows from investing activities: |
||||||||||||||||||||||||
| Purchase of property, equipment and software |
— | — | (38,886 | ) | (17,857 | ) | (56,743 | ) | ||||||||||||||||
| Investment in subsidiaries |
(227,146 | ) | (350,638 | ) | — | — | 577,784 | — | ||||||||||||||||
| Loans to Group companies and VIEs(e)(f) |
(342,177 | ) | (50,000 | ) | (192,454 | ) | — | 584,631 | — | |||||||||||||||
| Investments in short-term investments |
— | — | — | (10,000 | ) | (10,000 | ) | |||||||||||||||||
| Proceeds from disposal of short-term investments |
— | — | — | 25,127 | 25,127 | |||||||||||||||||||
| |
|
|
|
|
|
|
|
|
|
|
|
|||||||||||||
| Net cash (used in) generated from investing activities |
(569,323 |
) |
(400,638 |
) |
(231,340 |
) |
(2,730 |
) |
1,162,415 |
(41,616 |
) | |||||||||||||
| |
|
|
|
|
|
|
|
|
|
|
|
|||||||||||||
| Cash flow from financing activities |
||||||||||||||||||||||||
| Proceeds from initial public offering and over-allotment, net of underwriting discounts and commissions |
1,448,959 | — | — | — | — | 1,448,959 | ||||||||||||||||||
| Proceeds from exercise of options and restricted share units |
1,745 | — | — | — | — | 1,745 | ||||||||||||||||||
| Borrowings under loans from Group companies(e)(f) |
— | 312,592 | 50,000 | 222,039 | (584,631 | ) | — | |||||||||||||||||
| Capital contribution from parent |
— | 227,146 | 350,638 | (577,784 | ) | |||||||||||||||||||
| Proceeds from bank borrowings |
— | — | — | 71,233 | — | 71,233 | ||||||||||||||||||
| Repayments of bank borrowings |
— | — | — | (51,294 | ) | — | (51,294 | ) | ||||||||||||||||
| Payment of initial public offering costs |
(14,458 | ) | — | — | — | — | (14,458 | ) | ||||||||||||||||
| |
|
|
|
|
|
|
|
|
|
|
|
|||||||||||||
| Net cash (used in) generated from financing activities |
1,436,246 |
539,738 |
400,638 |
241,978 |
(1,162,415 |
) |
1,456,185 |
|||||||||||||||||
| |
|
|
|
|
|
|
|
|
|
|
|
|||||||||||||
| Effect of exchange rate on cash and cash equivalents |
(35,165 | ) | 1,777 | (1,933 | ) | — | — | (35,321 | ) | |||||||||||||||
| Net increase (decrease) in cash and cash equivalents |
833,797 |
106,342 |
62,088 |
72,471 |
— |
1,074,698 |
||||||||||||||||||
| |
|
|
|
|
|
|
|
|
|
|
|
|||||||||||||
| Cash and cash equivalents at the beginning of year |
683,565 | 448 | 20,546 | 49,749 | — | 754,308 | ||||||||||||||||||
| |
|
|
|
|
|
|
|
|
|
|
|
|||||||||||||
| Cash and cash equivalents at the end of year |
1,517,362 |
106,790 |
82,634 |
122,220 |
— |
1,829,006 |
||||||||||||||||||
| |
|
|
|
|
|
|
|
|
|
|
|
|||||||||||||
| (e) | The VIE received the loans from the parent company of RMB23.0 million, RMB6.9 million and RMB29.6 million in total in the years ended December 31, 2019, 2020 and 2021, respectively. |
| (f) | The VIE received the loans from the WFOE of RMB80.0 million, RMB190.0 million and RMB192.5 million in total in the years ended December 31, 2019, 2020 and 2021, respectively. |
| • | We are a clinical-stage biopharmaceutical company with limited operating history, which may make it difficult for you to evaluate the success of our business to date and to assess our future viability. |
| • | We have incurred significant losses in every year since our inception. We expect to continue to incur losses over the next several years and may never achieve or maintain profitability. |
| • | We will need to obtain funding from time to time to complete the development and any commercialization of our product candidates, which may not be available on acceptable terms, or at all. If we are unable to raise capital when needed, we may be forced to delay, reduce or eliminate our product development programs or other operations. |
| • | Raising additional capital may cause dilution to holders of the ADSs or other securities of our company, restrict our operations or require us to relinquish rights to our technologies or product candidates. |
| • | Our product candidates are based on novel technologies, which make it difficult to predict the timing, results and cost of product candidate development and likelihood of obtaining regulatory approval. |
| • | Our future success is highly dependent on the regulatory approval of GC012F, GC027, GC502 and our other pipeline programs. All of our product candidates will require significant preclinical study and clinical trial before we can seek regulatory approval for and launch a product commercially. |
| • | We may not be successful in our efforts to extend our pipeline of product candidates, including identifying or discovering additional product candidates in the future. |
| • | Our preclinical programs may experience delays or may never advance to clinical trials, which would adversely affect our ability to obtain regulatory approvals or commercialize these product candidates on a timely basis or at all, which would have an adverse effect on our business. |
| • | Adverse effects or other safety risks associated with our product candidates could delay or preclude approval, cause us to suspend or discontinue clinical trials, cause us to abandon product candidates, limit the commercial profile of an approved label or result in significant negative consequences following any potential marketing approval. |
| • | We have derived and plan to continue to derive results from investigator-initiated trials of our product candidates to expedite our global clinical development activities. Investigator-initiated trials are sponsored and conducted by principal investigators. As a result, our role and access to the clinical results and data are limited and there is no assurance that the clinical data from these trials will be accepted or considered by the FDA, the NMPA, or other comparable regulatory authorities. |
| • | All of our product candidates are in early stages of development. If we are unable to advance our product candidates through clinical development, obtain regulatory approval and ultimately commercialize our product candidates, or experience significant delays in doing so, our business will be materially harmed. |
| • | Our product candidates are based on novel technologies, which make it difficult to predict the timing, results and cost of product candidate development and likelihood of obtaining regulatory approval. |
| • | As a company currently with substantial operations outside of the United States, our business is subject to economic, political, regulatory and other risks associated with international operations. |
| • | We are a fast-growing emerging company and may experience difficulties in managing this growth. |
| • | Even if we complete the necessary preclinical studies and clinical trials, the regulatory approval process is expensive, time-consuming and uncertain and may prevent us from obtaining approvals for the commercialization of some or all of our product candidates. As a result, we cannot predict when or if, and in which territories, we will obtain marketing approval to commercialize a product candidate. |
| • | Obtaining and maintaining regulatory approval of our product candidates in one jurisdiction does not mean that we will be successful in obtaining regulatory approval of our product candidates in other jurisdictions. |
| • | If we are unable to establish sales, marketing and distribution capabilities for our product candidates, or enter into sales, marketing and distribution agreements with third parties, we may not be successful in commercializing our product candidates, if and when they are approved. |
| • | We operate in a rapidly changing industry and face significant competition, which may result in others discovering, developing or commercializing products before or more successfully than we do. |
| • | If we are unable to obtain, maintain, defend and enforce patent and other intellectual property rights for our technologies and product candidates, or if the scope of the patent and other intellectual property rights obtained is not sufficiently broad, our competitors and other third parties could develop and commercialize technology and biologics similar or identical to ours, and our ability to successfully commercialize our technology and product candidates may be impaired. |
| • | The intellectual property landscape around technology involving cellular therapies, including CAR-T cell therapies, is highly dynamic, and third parties may initiate legal proceedings alleging that we are infringing, misappropriating or otherwise violating their intellectual property rights, the outcome of which would be uncertain and could significantly harm our business. |
| • | The uncertainties in the PRC legal system may subject our contractual arrangements to different interpretations or enforcement challenges, or subject us to severe penalties or force us to relinquish our interests in our operations. |
| • | We rely on contractual arrangements with the VIE and its shareholders to exercise control over our business, which may not be as effective as direct ownership in providing operational control. |
| • | The PRC government has significant authority to regulate or intervene in the China operations of an offshore holding company, such as us, at any time. Therefore, investors in the ADSs and our business face potential uncertainty from the PRC government’s policy. |
| • | The pharmaceutical industry in China is highly regulated and such regulations are subject to change which may affect approval and commercialization of our drugs. |
| • | Changes in U.S. and international trade policies, particularly with regard to China, may adversely impact our business and operating results. |
| • | If we are classified as a “resident enterprise” of China under the PRC Enterprise Income Tax Law, we and our non-PRC shareholders could be subject to unfavorable tax consequences, and our business, financial condition and results of operations could be materially and adversely affected. |
| • | The approval, filing or other requirements of the CSRC, the CAC or other PRC government authorities may be required under PRC law in connection with our issuance of securities overseas. |
| • | We and our shareholders face uncertainty with respect to indirect transfers of equity interests in PRC resident enterprises, assets attributed to a PRC establishment of a non-PRC company or immovable properties located in China owned by non-PRC companies. |
| • | The PCAOB is currently unable to inspect our auditor in relation to their audit work performed for our financial statements and the inability of the PCAOB to conduct inspections over our auditor deprives our investors with the benefits of such inspections. |
| • | Our ADSs will be prohibited from trading in the United States under the Holding Foreign Companies Accountable Act, or the HFCAA, in 2024 if the PCAOB is unable to inspect or fully investigate auditors located in China, or 2023 if proposed changes to the law are enacted. The delisting of our ADSs, or the threat of their being delisted, may materially and adversely affect the value of your investment. |
| • | Various proceedings and legislative and regulatory developments due to political tensions between the U.S. and China may have an adverse impact on our listing and trading in the U.S., including adverse impact on the market prices of the ADSs. |
| • | Proceedings instituted by the SEC against the “big four” PRC-based accounting firms, including our independent registered public accounting firm, could result in financial statements being determined to not be in compliance with the requirements of the Exchange Act, adverse impact on the trading prices of the ADSs, or possible delisting. |
| • | If we fail to maintain effective internal controls over financial reporting, our ability to produce accurate financial statements on a timely basis could be impaired. |
| • | Holders of the ADSs have fewer rights than our shareholders and must act through the depositary to exercise their rights. |
| • | continue our ongoing and planned research and development of our pipeline product candidates; |
| • | conduct preclinical studies and clinical trials for any additional product candidates that we may pursue in the future, including ongoing and planned development of additional therapies for the treatment of hematologic malignancies and solid tumors; |
| • | seek to discover and develop additional product candidates and further expand our clinical product pipeline; |
| • | seek regulatory approvals for any product candidates that successfully complete clinical trials; |
| • | continue to scale up manufacturing capacity with the aim of securing sufficient quantities to meet our capacity requirements for clinical trials and potential commercialization; |
| • | establish sales, marketing and distribution infrastructure to commercialize any product candidate for which we may obtain regulatory approval; |
| • | develop, maintain, expand and protect our intellectual property portfolio; acquire or in-license other product candidates and technologies; |
| • | hire additional clinical, quality control and manufacturing personnel; |
| • | add clinical, operational, financial and management information systems and personnel, including personnel to support our product development and planned future commercialization efforts; |
| • | expand our operations in China and establish our operations in the United States and other geographic regions; and |
| • | incur additional legal, accounting and other expenses associated with operating as a public company. |
| • | the progress, results and costs of laboratory testing, manufacturing, and preclinical and clinical development for our current product candidates; |
| • | the scope, progress, results and costs of preclinical development, laboratory testing and clinical trials of other product candidates that we may pursue; |
| • | the development requirements of other product candidates that we may pursue; |
| • | the timing and amounts of any milestone or royalty payments we may be required to make under future license agreements, if we enter into such agreements; |
| • | the costs of expanding our research and development capacities and manufacturing infrastructure into the United States, including hiring additional research and development, clinical, quality control and manufacturing personnel; |
| • | the costs, timing and outcome of regulatory review of our product candidates; |
| • | the costs and timing of future commercialization activities, including product manufacturing, marketing, sales and distribution, for any of our product candidates for which we receive marketing approval; |
| • | the amount of revenue, if any, received from commercial sales of our product candidates for which we receive marketing approval; |
| • | the costs and timing of preparing, filing and prosecuting patent applications, obtaining, maintaining, protecting and enforcing our intellectual property rights and defending against any intellectual property-related claims; |
| • | the costs of operating as a public company; and |
| • | the extent to which we acquire or in-license other product candidates and technologies. |
| • | completing preclinical studies and receiving regulatory approvals or clearance for conducting clinical trials for our preclinical-stage programs; |
| • | obtaining positive results in our clinical trials demonstrating efficacy, safety and durability of effect of our product candidates; |
| • | receiving approvals for commercialization of our product candidates from regulatory authorities; |
| • | manufacturing our product candidates at an acceptable quality and cost; and |
| • | maintaining and growing an organization of scientists, medical professionals and business people who can develop and commercialize our products and technology. |
| • | obtaining regulatory approval for our product candidates, as the FDA, the NMPA and other regulatory authorities have limited experience with CAR-T therapies for cancer; |
| • | in the case of autologous CAR-T cell therapies, developing and deploying consistent and reliable processes for engineering a patient’s T cells ex vivo and infusing the engineered T cells back into the patient; |
| • | conditioning patients with chemotherapy in conjunction with delivering each of our products, which may increase the risk of adverse effects of our product candidates; |
| • | sourcing clinical and, if approved, commercial supplies of the materials used to manufacture our product candidates; |
| • | developing programming modules with the desired properties, while avoiding adverse reactions; |
| • | creating viral vectors capable of delivering multiple programming modules; |
| • | developing a reliable and consistent ex vivo gene modification and manufacturing process; |
| • | establishing manufacturing capacity suitable for the manufacture of our product candidates in line with expanding enrollment in our clinical studies and our projected commercial requirements; |
| • | achieving cost efficiencies in the scale-up of our manufacturing capacity; |
| • | minimizing and avoiding infection and contamination during production of product candidates; |
| • | developing protocols for the safe administration of our product candidates; |
| • | educating medical personnel regarding our CAR-T technologies and the potential side effect profile of each of our product candidates, such as potential adverse effects related to cytokine release syndrome, or CRS, neurotoxicity, including immune effector cell-associated neurotoxicity syndrome, or ICANS, and/or graft versus host disease, or GvHD; |
| • | establishing integrated solutions in collaboration with specialty treatment centers in order to reduce the burdens and complex logistics commonly associated with the administration of T cell therapies; |
| • | establishing sales and marketing capabilities or partnerships to successfully launch and commercialize our product candidates if and when we obtain any required regulatory approvals, and risks associated with gaining market acceptance of a novel therapy if we receive approval; and |
| • | the availability of coverage and adequate reimbursement from third-party payors for our novel and personalized therapies in connection with commercialization of any approved product candidates. |
| • | regulatory requirements governing gene and cell therapy products have changed frequently and may continue to change in the future. To date, only a few CAR-T cell therapy products that involve the genetic modification of patient cells have been approved in the United States and/or the European Union, and two CAR-T cell therapy products have been approved in China; |
| • | genetically modified products in the event of improper insertion of a gene sequence into a patient’s chromosome could lead to lymphoma, leukemia or other cancers, or other aberrantly functioning cells; |
| • | although our viral vectors are not able to replicate, there is a risk with the use of retroviral or lentiviral vectors that they could lead to new or reactivated pathogenic strains of virus or other infectious diseases; and |
| • | the FDA recommends a 15-year follow-up observation period for all patients who receive treatment using gene therapies and a trial guidance promulgated by NMPA requires a similar follow-up observation period for patients who receive cell therapeutic products, which has to be sufficient and could be as long as life-time, and we may need to adopt an observation period for our product candidates. |
| • | disagreement with the design, protocol or conduct of our clinical trials; |
| • | failure to demonstrate that a product candidate is safe and effective for its proposed indication; |
| • | failure of clinical trials to meet the level of statistical significance required for approval; |
| • | failure to demonstrate that a product candidate’s clinical and other benefits outweigh its risks; |
| • | disagreement with our interpretation of data from preclinical studies or clinical trials; |
| • | insufficiency of data collected from clinical trials of our product candidates to support the submission and filing of a biologics license application, or BLA, or other submission or to obtain regulatory approval; |
| • | a delay in or the ability of health authorities to complete regulatory inspections of our development activities, regulatory filings or manufacturing operations, whether as a result of the COVID-19 pandemic or other reasons, or our satisfactorily complete such inspections; |
| • | failure to obtain approval of the manufacturing processes of our facilities; |
| • | changes in the approval policies or regulations that render our preclinical and clinical data insufficient for approval; or |
| • | lack of adequate funding to complete a clinical trial in a manner that is satisfactory to the applicable regulatory authority. |
| • | we may not be successful in identifying additional product candidates; |
| • | we may not be able or willing to assemble sufficient resources to acquire or discover additional product candidates; |
| • | our product candidates may not succeed in preclinical or clinical testing; |
| • | a product candidate may on further study be shown to have harmful side effects or other characteristics that indicate it is unlikely to be effective or otherwise does not meet applicable regulatory criteria; |
| • | competitors may develop alternatives that render our product candidates obsolete or less attractive; |
| • | product candidates we develop may nevertheless be covered by third parties’ patents or other exclusive rights; |
| • | the market for a product candidate may change during our development program so that the continued development of that product candidate is no longer reasonable; |
| • | a product candidate may not be capable of being produced in commercial quantities at an acceptable cost, or at all; and |
| • | a product candidate may not be accepted as safe and effective by patients, the medical community or third-party payors, if applicable. |
| • | the patient eligibility criteria defined in the protocol; |
| • | the number of patients with the disease or condition being studied; |
| • | the understanding of risks and benefits of the product candidate in the trial; |
| • | clinicians’ and patients’ perceptions as to the potential advantages of the product candidate being studied in relation to other available therapies, including any new drugs that may be approved for the indications we are investigating or drugs that may be used off-label for these indications; |
| • | the size and nature of the patient population who meet inclusion criteria; |
| • | the proximity of patients to study sites; |
| • | the design of the clinical trial; |
| • | our ability to recruit clinical trial investigators with the appropriate competencies and experience; |
| • | competing clinical trials for similar therapies or other new therapeutics not involving T cell-based immunotherapy; |
| • | our ability to obtain and maintain patient consents; and |
| • | the risk that patients enrolled in clinical trials will drop out of the clinical trials before completion of their treatment. |
| • | regulatory authorities may withdraw approvals of such product; |
| • | regulatory authorities may require additional warnings on the label; |
| • | we may be required to create a Risk Management Plan, or RMP, or similar risk management plan, which could include a medication guide outlining the risks of such side effects for distribution to patients, a communication plan for healthcare providers and/or other elements to assure safe use; |
| • | we could be sued and held liable for harm caused to patients; and |
| • | our reputation may suffer. |
| • | the FDA, the NMPA or other comparable regulatory authority may disagree as to the number, design or implementation of our clinical trials, or may not interpret the results from clinical trials as we do; |
| • | regulators or institutional review boards may not authorize us or our investigators to commence a clinical trial or conduct a clinical trial at a prospective trial site; |
| • | we may not reach agreement on acceptable terms with prospective clinical trial sites, the terms of which can be subject to extensive negotiation and may vary significantly among different clinical trial sites; |
| • | clinical trials of our product candidates may produce negative or inconclusive results; |
| • | we may decide, or regulators may require us, to conduct additional clinical trials or abandon product development programs; |
| • | the number of patients required for clinical trials of our product candidates may be larger than we anticipate, enrollment in these clinical trials may be slower than we anticipate, participants may drop out of these clinical trials at a higher rate than we anticipate or we may fail to recruit eligible patients to participate in a trial; |
| • | our third-party contractors may fail to comply with regulatory requirements or meet their contractual obligations to us in a timely manner, or at all; |
| • | regulators may issue a clinical hold, and regulators or institutional review boards may require that we or our investigators suspend or terminate clinical research for various reasons, including noncompliance with regulatory requirements or a finding that the participants are being exposed to unacceptable health risks; |
| • | the cost of clinical trials of our product candidates may be greater than we anticipate; |
| • | the FDA, the NMPA or other comparable regulatory authorities may fail to approve our manufacturing processes or facilities; |
| • | the supply or quality of our product candidates or other materials necessary to conduct clinical trials of our product candidates may be insufficient or inadequate; |
| • | our product candidates may have undesirable side effects or other unexpected characteristics, particularly given their novel, first-in-human |
| • | the approval policies or regulations of the FDA, the NMPA or other comparable regulatory authorities may significantly change in a manner rendering our clinical data insufficient for approval. |
| • | an inability to initiate or continue clinical trials of our product candidates under development; |
| • | delay in submitting regulatory applications, or receiving marketing approvals, for our product candidates; |
| • | loss of the cooperation of future collaborators; |
| • | subjecting third-party manufacturing facilities or our manufacturing facilities to additional inspections by regulatory authorities; |
| • | requirements to cease development or to recall batches of our product candidates; and |
| • | in the event of approval to market and commercialize our product candidates, an inability to meet commercial demands for our product or any other future product candidates. |
| • | economic weakness, including inflation, or political instability in particular non-U.S. economies and markets; |
| • | differing and changing regulatory requirements for product approvals; |
| • | differing jurisdictions could present different issues for securing, maintaining or obtaining freedom to operate in such jurisdictions; |
| • | potentially reduced protection for intellectual property rights; |
| • | difficulties in compliance with different, complex and changing laws, regulations and court systems of multiple jurisdictions and compliance with a wide variety of foreign laws, treaties and regulations; |
| • | changes in non-U.S. regulations and customs, tariffs and trade barriers; |
| • | foreign exchange risks and currency controls; |
| • | changes in a specific country’s or region’s political or economic environment; |
| • | trade protection measures, import or export licensing requirements or other restrictive actions by governments; |
| • | differing reimbursement regimes and price controls in certain non-U.S. markets; |
| • | negative consequences from changes in tax laws; |
| • | compliance with tax, employment, immigration and labor laws for employees living or traveling abroad, including, for example, the variable tax treatment in different jurisdictions of options granted under our share incentive plans; |
| • | workforce uncertainty in countries where labor unrest is more common than in the United States; |
| • | litigation or administrative actions resulting from claims against us by current or former employees or consultants individually or as part of class actions, including claims of wrongful terminations, discrimination, misclassification or other violations of labor law or other alleged conduct; |
| • | difficulties associated with staffing and managing international operations, including differing labor relations; |
| • | production shortages resulting from any events affecting raw material supply or manufacturing capabilities abroad; and |
| • | business interruptions resulting from geo-political actions, including war and terrorism, health epidemics, or natural disasters including earthquakes, typhoons, floods and fires. |
| • | identifying, recruiting, integrating, maintaining and motivating additional employees; |
| • | managing our internal development efforts effectively, including the clinical, NMPA, FDA review processes for our product candidates; and |
| • | improving our operational, financial and management controls, reporting systems and procedures. |
| • | increased operating expenses and cash requirements; |
| • | the assumption of additional indebtedness or contingent liabilities; |
| • | assimilation of operations, intellectual property and products of an acquired company, including difficulties associated with integrating new personnel; |
| • | the diversion of our management’s attention from our existing programs and initiatives in pursuing such a strategic partnership, merger or acquisition; |
| • | retention of key employees, the loss of key personnel and uncertainties in our ability to maintain key business relationships; |
| • | risks and uncertainties associated with the other party to such a transaction, including the prospects of that party and their existing products or product candidates and regulatory approvals; and |
| • | our inability to generate revenue from acquired technology sufficient to meet our objectives in undertaking the acquisition or even to offset the associated acquisition and maintenance costs. |
| • | limitation in patient enrollment, disruptions to patient follow-up during the lockdown periods, and curtailed screening visits; |
| • | delays or difficulties in enrolling patients in our clinical trials; |
| • | delays or difficulties in clinical site initiation, including difficulties in recruiting clinical site investigators and clinical site staff; |
| • | delays in clinical sites receiving the supplies and materials needed to conduct our clinical trials; |
| • | diversion of healthcare resources away from the conduct of clinical trials, including the diversion of hospitals serving as our clinical trial sites and hospital staff supporting the conduct of our clinical trials; |
| • | interruption of key clinical trial activities, such as clinical trial site monitoring, due to limitations on travel imposed or recommended by governments, employers and others; |
| • | limitations in employee resources that would otherwise be focused on the conduct of our clinical trials, including because of sickness of employees or their families or the desire of employees to avoid contact with large groups of people; |
| • | delays in receiving approval from local regulatory authorities to initiate our planned clinical trials; |
| • | interruption in global shipping that may affect the transport of clinical trial materials; |
| • | changes in local regulations as part of a response to the COVID-19 coronavirus outbreak which may require us to change the ways in which our clinical trials are conducted, which may result in unexpected costs, or to discontinue the clinical trials altogether; |
| • | delays in necessary interactions with local regulators, ethics committees and other important agencies and contractors due to limitations in employee resources or forced furlough of government employees; and |
| • | refusal of the relevant regulatory authorities to accept data from clinical trials in these affected geographic regions. |
| • | litigation involving patients taking our products; |
| • | restrictions on such products, manufacturers or manufacturing processes; |
| • | restrictions on the labeling or marketing of a product; |
| • | restrictions on product distribution or use; |
| • | requirements to conduct post-marketing studies or clinical trials; |
| • | warning or untitled letters; |
| • | withdrawal of the products from the market; |
| • | refusal to approve pending applications or supplements to approved applications that we submit; |
| • | recall of products; |
| • | fines, restitution or disgorgement of profits or revenue; |
| • | suspension or withdrawal of marketing approvals; |
| • | suspension of any ongoing clinical trials; |
| • | damage to relationships with any potential collaborators; |
| • | unfavorable press coverage and damage to our reputation; |
| • | refusal to permit the import or export of our products; |
| • | product seizure; or |
| • | injunctions or the imposition of civil or criminal penalties. |
| • | the U.S. federal Anti-Kickback Statute, which prohibits, among other things, persons from knowingly and willfully soliciting, offering, receiving or providing remuneration, directly or indirectly, in cash or in kind, to induce or reward, or in return for, either the referral of an individual for, or the purchase, lease, order or recommendation of, any good, facility, item or service, for which payment may be made, in whole or in part, under federal and state healthcare programs such as Medicare and Medicaid. The term “remuneration” has been broadly interpreted to include anything of value. This statute has been interpreted to apply to arrangements between pharmaceutical manufacturers on the one hand and prescribers, purchasers and formulary managers on the other hand. Although there are a number of statutory exceptions and regulatory safe harbors protecting certain common activities from prosecution or other regulatory sanctions, the exceptions and safe harbors are drawn narrowly, and practices that involve remuneration that are alleged to be intended to induce prescribing, purchases or recommendations may be subject to scrutiny if they do not qualify for an exception or safe harbor. Failure to meet all of the requirements of a particular applicable statutory exception or regulatory safe harbor does not make the conduct per se illegal under the federal Anti-Kickback Statute. Instead, the legality of the arrangement will be evaluated on a case-by-case |
| • | U.S. federal civil and criminal false claims laws, including the federal False Claims Act, which can be enforced through civil whistleblower or qui tam actions, and civil monetary penalty laws, which, among other things, impose criminal and civil penalties, against individuals or entities for, among other things, knowingly presenting, or causing to be presented, to the federal government, including the Medicare and Medicaid programs, claims for payment that are false or fraudulent or making a false statement to avoid, decrease or conceal an obligation to pay money to the federal government. Pharmaceutical and other healthcare companies have been prosecuted under these laws for, among other things, allegedly inflating drug prices they report to pricing services, which in turn were used by the government to set Medicare and Medicaid reimbursement rates, and for allegedly providing free product to customers with the expectation that the customers would bill federal programs for the product. In addition, certain marketing practices, including off-label promotion, may also violate false claims laws. Further, pharmaceutical manufacturers can be held liable under the False Claims Act even when they do not submit claims directly to government payors if they are deemed to “cause” the submission of false or fraudulent claims. Criminal prosecution is also possible for making or presenting a false, fictitious or fraudulent claim to the federal government; |
| • | HIPAA, which contains new federal criminal statutes that prohibit knowingly and willfully executing, or attempting to execute, a scheme to defraud any healthcare benefit program or obtain, by means of false or fraudulent pretenses, representations or promises, any of the money or property owned by, or under the custody or control of, any healthcare benefit program, regardless of whether the payor is public or private, knowingly and willfully embezzling or stealing from a healthcare benefit program, willfully obstructing a criminal investigation of a healthcare offense and knowingly and willfully falsifying, concealing or covering up by any trick or device a material fact or making any materially false statements in connection with the delivery of, or payment for, healthcare benefits, items or services relating to healthcare matters; |
| • | HIPAA, as amended by the Health Information Technology for Economic and Clinical Health Act of 2009, or HITECH, and their respective implementing regulations, which impose obligations on “covered entities,” including certain healthcare providers, health plans, and healthcare clearinghouses, as well as their respective “business associates” that create, receive, maintain or transmit individually identifiable health information for or on behalf of a covered entity, with respect to safeguarding the privacy, security and transmission of individually identifiable health information. Additionally, HITECH also contains four new tiers of civil monetary penalties; amends HIPAA to make civil and criminal penalties directly applicable to business associates and gave state attorneys general new authority to file civil actions for damages or injunctions in U.S. federal courts to enforce the federal HIPAA laws and to seek attorneys’ fees and costs associated with pursuing federal civil actions; |
| • | the U.S. federal Food, Drug and Cosmetic Act, which prohibits, among other things, the adulteration or misbranding of drugs, biologics and medical devices; |
| • | the U.S. federal Physician Payments Sunshine Act, created under Section 6002 of the Patient Protection and Affordable Care Act, as amended by the Health Care and Education Reconciliation Act, or collectively, the ACA, and its implementing regulations, created annual reporting requirements for certain manufacturers of drugs, devices, biologicals and medical supplies for which payment is available under Medicare, Medicaid or the Children’s Health Insurance Program (with certain exceptions), to report information related for certain payments and “transfers of value” provided to physicians (defined to include doctors, dentists, optometrists, podiatrists and chiropractors) and teaching hospitals, as well as ownership and investment interests held by physicians and their immediate family members; and analogous state laws and regulations and foreign laws, such as state anti-kickback and false claims laws, which may apply to sales or marketing arrangements and claims involving healthcare items or services reimbursed by non-governmental third-party payors, including private insurers; state and foreign laws that require pharmaceutical companies to comply with the pharmaceutical industry’s voluntary compliance guidelines and the relevant compliance guidance promulgated by the federal government or to adopt compliance programs as prescribed by state laws and regulations, or that otherwise restrict payments that may be made to healthcare providers; state and foreign laws that require drug manufacturers to report information related to payments and other transfers of value to physicians and other healthcare providers, marketing expenditures or drug pricing; state and local laws that require the registration of pharmaceutical sales representatives; and state and foreign laws governing the privacy and security of health information in certain circumstances, many of which differ from each other in significant ways and often are not preempted by HIPAA, thus complicating compliance efforts. |
| • | the negotiation and execution of these agreements is a long process that may not result in an agreement being signed or that can delay the development or commercialization of the product candidate concerned; |
| • | these agreements are subject to cancellation or nonrenewal by our collaborators, or may not be fully complied with by our collaborators; |
| • | in the case of a license granted by us, we lose control of the development of the product candidate licensed; |
| • | in such cases we would have only limited control over the means and resources allocated by our partner for the commercialization of our product; and |
| • | collaborators may not properly obtain, maintain, enforce, or defend our intellectual property or proprietary rights or may use our proprietary information in such a way as to invite litigation that could jeopardize or invalidate our proprietary information or expose us to potential litigation. |
| • | the clinical indications for which our product candidates are approved; |
| • | physicians, hospitals, cancer treatment centers, and patients considering our product candidates as a safe and effective treatment; |
| • | hospitals and cancer treatment centers establishing the infrastructure required for the administration of redirected CAR-T cell therapies; |
| • | the potential and perceived advantages of our product candidates over alternative treatments; |
| • | the prevalence and severity of any side effects; |
| • | product labeling or product insert requirements of the FDA, the NMPA or other comparable regulatory authorities; |
| • | limitations or warnings contained in the labeling approved by the FDA, the NMPA or other comparable regulatory authorities; |
| • | the timing of market introduction of our product candidates as well as competitive products; |
| • | the cost of treatment in relation to alternative treatments; |
| • | the amount of upfront costs or training required for physicians to administer our product candidates; |
| • | the availability of coverage, adequate reimbursement, and pricing by third-party payors and government authorities; |
| • | the willingness of patients to pay out-of-pocket |
| • | relative convenience and ease of administration, including as compared to alternative treatments and competitive therapies; and |
| • | the effectiveness of our sales and marketing efforts and distribution support. |
| • | reduced resources of our management to pursue our business strategy; |
| • | decreased demand for any product candidates or products that we may develop; |
| • | injury to our reputation and significant negative media attention; |
| • | withdrawal of clinical trial participants; |
| • | initiation of investigations by regulators; |
| • | product recalls, withdrawals or labeling, marketing or promotional restrictions; |
| • | significant costs to defend the resulting litigation; |
| • | substantial monetary awards paid to clinical trial participants or patients; |
| • | loss of revenue; and |
| • | the inability to commercialize any products that we may develop. |
| • | partners may not have sufficient resources or decide not to devote the necessary resources due to internal constraints such as budget limitations, lack of human resources or a change in strategic focus; |
| • | partners may believe our intellectual property is not valid or is unenforceable or the product candidate infringes on the intellectual property rights of others; |
| • | partners may dispute their responsibility to conduct development and commercialization activities pursuant to the applicable collaboration, including the payment of related costs or the division of any revenue; |
| • | partners may decide to pursue a competitive product developed outside of the collaboration arrangement; |
| • | partners may not be able to obtain, or believe they cannot obtain, the necessary regulatory approvals; or |
| • | partners may delay the development or commercialization of our product candidates in favor of developing or commercializing another party’s product candidate. |
| • | the scope of rights granted under the license agreement and other interpretation-related issues; |
| • | the extent to which our technology and processes infringe, misappropriate or violate the intellectual property of the licensor that is not subject to the license agreement; |
| • | our diligence obligations under the license agreement and what activities satisfy those diligence obligations; |
| • | the sublicensing of patent and other rights to third parties under any such agreement or collaborative relationships; |
| • | the inventorship and ownership of inventions and know-how resulting from the joint creation or use of intellectual property by our licensors and us and our partners; and |
| • | the priority of invention of patented technology. |
| • | any product candidates we may develop will eventually become commercially available in generic or biosimilar product forms; |
| • | others may be able to make products that are similar to any product candidates we may develop or utilize similar technology but that are not covered by the claims of the patents that we may own or license now or in the future; |
| • | we, or any future license partners or collaborators, might not have been the first to make the inventions covered by the issued patent or pending patent application that we own or license now or in the future; |
| • | we, or any future license partners or collaborators, might not have been the first to file patent applications covering certain of our or their inventions; |
| • | others may independently develop similar or alternative technologies or duplicate any of our technologies without infringing our intellectual property rights; |
| • | it is possible that our pending patent applications or those that we may own in the future will not lead to issued patents; |
| • | it is possible that there are prior public disclosures that could invalidate our issued patents, or parts of our issued patents; |
| • | it is possible that there are unpublished applications or patent applications maintained in secrecy that may later issue with claims covering our product candidates or technology similar to ours; |
| • | issued patents that we hold rights to may be held invalid or unenforceable, including as a result of legal challenges by our competitors; |
| • | the claims of our patent applications, if and when issued, may not cover our product candidates; |
| • | our competitors might conduct research and development activities in countries where we do not have patent rights and then use the information learned from such activities to develop competitive products for sale in our major commercial markets; |
| • | the laws of foreign countries may not protect our proprietary rights or the proprietary rights of license partners or current or future collaborators to the same extent as the laws of the United States; |
| • | the inventors of our patent applications may become involved with competitors, develop products or processes that design around our patents, or become hostile to us or the patents or patent applications on which they are named as inventors; |
| • | we engage in scientific collaborations and will continue to do so in the future, and our collaborators may develop adjacent or competing products that are outside the scope of our patents; |
| • | any product candidates we develop may be covered by third parties’ patents or other exclusive rights; |
| • | the patents of others may harm our business; |
| • | we may not develop additional proprietary technologies that are patentable; and |
| • | we may choose not to file a patent in order to maintain certain trade secrets or know-how, and a third-party may subsequently file a patent covering such intellectual property. |
| • | revoking the business licenses and/or operating licenses of such entities; |
| • | discontinuing or placing restrictions or onerous conditions on our operation through any transactions between the WFOE and the VIE; |
| • | imposing fines, confiscating the income from the WFOE or the VIE, or imposing other requirements with which we or the VIE may not be able to comply; |
| • | requiring us to restructure our ownership structure or operations, including terminating the contractual arrangements with the VIE and deregistering the equity pledges of the VIE, which in turn would affect our ability to consolidate, derive economic interests from, or exert effective control over the VIE; |
| • | restricting or prohibiting use of any of our offering proceeds to finance our business and operations in China, and taking other regulatory or enforcement actions that could be harmful to our business; |
| • | confiscating any of our income deemed to be obtained through illegal operations; |
| • | discontinuing or placing restrictions or onerous conditions on our operations; |
| • | imposing additional conditions or requirements with which we may not be able to comply; or |
| • | taking other regulatory or enforcement actions against us that could be harmful to our business. |
| • | only one of our three classes of directors will be elected each year; |
| • | shareholders will be entitled to remove directors only for cause; |
| • | shareholders will not be permitted to take actions by written consent; |
| • | shareholders must give advance notice to nominate directors or submit proposals for consideration at annual general meetings. |
| • | the commencement, enrollment or results of our planned and future clinical trials; |
| • | positive or negative results from, or delays in, testing and clinical trials by us, collaborators or competitors; |
| • | the loss of any of our key scientific or management personnel; |
| • | regulatory or legal developments in the United States, China and other countries; |
| • | the success of competitive products or technologies; |
| • | adverse actions taken by regulatory agencies with respect to our clinical trials or manufacturers; |
| • | changes or developments in laws or regulations applicable to our product candidates and preclinical program; |
| • | changes in the structure of healthcare payment systems; |
| • | changes to our relationships with collaborators, manufacturers or suppliers; |
| • | concerns regarding the safety of our product candidates or CAR-T cells in general; |
| • | announcements concerning our competitors or the pharmaceutical industry in general; |
| • | actual or anticipated fluctuations in our operating results; |
| • | changes in financial estimates or recommendations by securities analysts; |
| • | potential acquisitions, financing, collaborations or other corporate transactions; |
| • | the results of our efforts to discover, develop, acquire or in-license additional product candidates; |
| • | the trading volume of the ADSs on Nasdaq; |
| • | sales of the ADSs or ordinary shares by us, members of our senior management and directors or our shareholders or the anticipation that such sales may occur in the future; |
| • | general economic, political, and market conditions and overall fluctuations in the financial markets in the United States or China; |
| • | stock market price and volume fluctuations of comparable companies and, in particular, those that operate in the biopharmaceutical industry; |
| • | investors’ general perception of us and our business; and |
| • | other events and factors, many of which are beyond our control. |
Item 4. |
Information on the Company |
| • | With FasTCAR, we are able to deliver younger, less exhausted T cells for autologous cell therapies with enhanced activities and next-day manufacturing versus the industry norm of two to six weeks. Our lead FasTCAR-enabled autologous product candidate, GC012F, has achieved high percentage of negative minimal residual disease, or MRD-, stringent complete responses, or sCR, in relapsed or refractory multiple myeloma, or r/r MM, patients in an ongoing investigator-initiated Phase 1 trial in China. |
| • | With TruUCAR, we are able to derive T cells from non-HLA-matched CAR-T cell therapies that are readily available off-the-shelf CAR-T cell therapies. Our lead TruUCAR-enabled allogeneic product candidate, GC027, has achieved high percentage of complete responses, or CR, in relapsed or refractory T cell acute lymphoblastic leukemia, or r/r T-ALL, patients in an ongoing investigator-initiated Phase 1 trial in China. |
| • | FasTCAR. in vivo . In addition, FasTCAR manufactured CAR-T cells are younger, less exhausted and show enhanced proliferation, tissue migration and tumor cell clearance activities as demonstrated in preclinical studies, eliminating the need for the ex vivo expansion phase in the conventional process. This streamlined process significantly shortens the production time from an industry norm of two to six weeks and achieves next-day manufacturing. Shorter manufacturing time is of particular importance to increasing the widespread utility of CAR-T cell therapies, particularly in the case of rapidly progressing cancers. We established fully-closed capability designed to produce FasTCAR product candidates while reducing the risk of contamination and optimizing cost-efficiency. Our significantly shorter manufacturing time and highly efficient manufacturing process may result in meaningful cost savings, increasing the accessibility of cell therapies for cancer patients. We are developing our lead autologous product candidate, GC012F, on our FasTCAR platform. |
| • | TruUCAR. CAR-T cell therapies that can be administered “off-the-shelf” CAR-T approaches. TruUCAR is designed to specifically target a patient’s T cells and natural killer, or NK, cells that would otherwise be directed against the foreign, or allogeneic, cells resulting in rejection by the patients. This feature allows our allogeneic cell therapies to expand in the patient without the need for combination treatment with immunosuppressive agents like anti-CD52 antibodies that may leave a patient at increased risk for infection. TruUCAR is designed to avoid HvG and GvHD, severe adverse events of allogeneic CAR-T cell therapies, and rapidly eliminate cancer cells. As a result, TruUCAR’s approach has the potential to significantly reduce the cost and length of treatment by achieving fast remission and avoiding anti-CD52 treatment and potentially HSCT. We believe that TruUCAR could potentially result in meaningful cost savings, further increasing the accessibility of cell therapies for cancer patients. We are developing our lead allogeneic product candidates, GC027 and GC502, as well as multiple allogeneic pipeline candidates based on our TruUCAR platform. |


| • | GC012F. CAR-T product candidate being studied in investigator-initiated Phase 1 trials across multiple centers in China, for two indications, MM and B-NHL. Data was presented at ASCO 2021 where 19 r/r MM patients had been enrolled and treated. 18 out of 19 patients (94.7%) were classified as high-risk according to mSMART 3.0 criteria, a subgroup of MM patients with less favorable treatment outcomes for SOC treatment. As of the January 12, 2021 data cutoff date, 18 of 19 patients responded to therapy, resulting in an overall response rate, or ORR, of 94.7%. Based on these results, we expect to submit IND applications for GC012F in r/r MM to the FDA and the NMPA in the second half of 2022. We have extended our timeline for IND submission in the U.S. for GC012F for r/r MM to the second half of 2022. While we have made significant progress with our tech transfer from our Suzhou GMP manufacturing facility to the U.S. CDMO, this revised timeline reflects the impact to the industry-wide high demand for cell therapy manufacturing capacity. |
| • | GC019F. CAR-T product candidate that has been studied for the treatment of adult B-ALL in an investigator-initiated Phase 1 trial across multiple centers in China. We have obtained IND approval from the NMPA to study GC019F in adult B-ALL and have initiated the Phase 1 trial for GC019F in r/r B-ALL. |
| • | GC027. CD7-directed allogeneic CAR-T product candidate being studied for the treatment of adult T-ALL in an investigator-initiated Phase 1 trial across multiple centers in China. As of February 2021, six adult r/r T-ALL patients were enrolled and treated on study. All six patients enrolled had relapsed from, or were refractory to, their prior line of therapy. All six evaluable patients achieved a CR or CRi, resulting in all patients obtaining a response, including five patients, or 83%, achieving MRD- CR on Day 28 after treatment. CRS was observed in all patients and was resolved with treatment. No patient developed ICANS or acute GvHD. We expect to initiate regulatory interactions for GC027 during the next 12 months. |
| • | GC502. off-the-shelf CAR-T product candidate being studied for the treatment of B-cell malignancies in an ongoing investigator-initiated Phase 1 trial in China. GC502 is manufactured using T cells from non-HLA matched healthy donors. An enhancer molecule is embedded in the basic construct of TruUCAR to enhance proliferation of TruUCAR T cells. Optimized for CD19/CD7 dual CAR functionality and in vivo |
| • | GC007g. CAR-T cell therapy that has been studied for the treatment of r/r B-ALL in a completed investigator-initiated Phase 1 trial, where CAR-T cells were manufactured using T cells from an HLA-matched healthy donor. We have obtained IND approval from the NMPA to study GC007g in B-ALL and were granted approval from the NMPA on December 24, 2020 for a seamless Phase 1/2 registrational trial. Following completion of enrollment of the first dosing cohort, we have advanced GC007g to the second dose cohort in the Phase 1/2 registrational trial. Our goal is to submit a biologics license application, or BLA, to the NMPA for GC007g upon completion of a registrational trial. |


Patient # |
Tumor Burden |
Dose Level |
Peak TruUCAR cells/ul blood |
Peak TruUCAR copies/ug DNA |
||||||||||||
Patient 1 |
38.20 | % | 3 | 9,716 | 872,170 | |||||||||||
Patient 3 |
4 | % | 2 | 69 | 308,303 | |||||||||||
Patient 4 |
80.2 | % | 2 | 0.06 | 205,963 | |||||||||||
Patient 5 |
6.7 | % | 2 | 613.44 | 98,460 | |||||||||||
Patient 2 |
45.84 | % | 1 | 2,179 | 1,241,762 | |||||||||||
Patient 6 |
6.57 | % | 1 | 648.26 | 525,508 | |||||||||||


Efficacy |
DL1 (n=3) |
DL2 (n=9) |
DL3 (n=1) |
Overall (n=13) | ||||
ORR (Day 28) |
3 (100%) | 7 (77.8%) | 1 (100%) | 11 (84.6%) | ||||
MRD- (Day 28) |
3 (100%) | 6 (66.7%) | 1 (100%) | 10 (76.9%) |
Safety |
DL1 (n=3) |
DL2 (n=9) |
DL3 (n=2) |
Overall (n=14) | ||||
CRS |
1 (33.3%) | 9 (100%) | 2 (100%) | 12 (85.7%) | ||||
Grade 3 or higher CRS |
0 | 1 (11.1%) | 0 | 1 (7.1%) | ||||
Neurotoxicity |
0 | 0 | 0 | 0 | ||||
Grade 3 or higher neurotoxicity |
0 | 0 | 0 | 0 | ||||
acute GvHD |
0 | 2 (22.2%) | 0 | 2 (14.3%) |
| • | GC202. CAR-T product candidate for the treatment of Peripheral T cell lymphoma, or PTCL, a subtype of non-Hodgkin lymphoma, or NHL. PTCL develops from mature T cells and is a subtype of NHL with a high unmet medical need. PTCL patients represent approximately 7-10% and 10-15% of the NHL patient populations in the United States and China, respectively. Patients with r/r PTCL usually have poor prognosis and high long-term mortality rates. |
| • | GC207. CAR-T product candidate for the treatment of T-ALL or T cell lymphoblastic leukemia/lymphoma. |
| • | GC212. CAR-T product candidate for the treatment of r/r MM. While autologous CAR-T cell therapies for MM have achieved significant success, there are still more than 10% of the MM patient population who are not suitable for autologous CAR-T cell therapy. We are developing this program with additional modifications designed to produce TruUCAR T cells that are more potent and capable to deliver safer and more durable responses. |
| • | GC503. TM -enabled CAR-T therapy targeting mesothelin for the treatment of mesothelin-positive solid tumors including ovarian cancer. |
| • | GC506. TM -enabled CAR-T therapy targeting Claudin 18.2 for the treatment of Claudin 18.2-positive solid tumors. |
| • | completion of preclinical laboratory tests and animal studies performed in accordance with the FDA’s good laboratory practices, or GLP, regulations; |
| • | submission to the FDA of an IND, which must become effective before clinical trials may begin and must be updated annually or when significant changes are made; |
| • | approval by an independent Institutional Review Board, or IRB, or ethics committee at each clinical site before the trial is commenced; |
| • | performance of adequate and well-controlled human clinical trials to establish the safety and effectiveness of the proposed biologic product candidate for its intended indications; |
| • | preparation of and submission to the FDA of a BLA when adequate data are obtained from pivotal clinical trials; |
| • | a determination by the FDA within 60 days of its receipt of a BLA to accept the application for review; |
| • | satisfactory completion of an FDA Advisory Committee review, if applicable; |
| • | satisfactory completion of an FDA pre-approval inspection of the manufacturing facility or facilities at which the proposed product is produced to assess compliance with cGMP and to assure that the facilities, methods and controls are adequate to preserve the biological product’s continued safety, purity and potency, and of selected clinical investigation sites to assess compliance with Good Clinical Practices, or GCP regulations; and |
| • | FDA review and approval of the BLA to permit commercial marketing of the product for particular indications for use in the United States. |
| • | Phase 1. |
| • | Phase 2. |
| • | Phase 3. |
| • | restrictions on the marketing or manufacturing of a product, complete withdrawal of the product from the market or product recalls; |
| • | fines, warning letters or holds on post-approval clinical studies; |
| • | refusal of the FDA to approve pending applications or supplements to approved applications, or suspension or revocation of existing product approvals; and |
| • | product seizure or detention, or refusal of the FDA to permit the import or export of products. |
| • | The centralized MA, which is issued by the European Commission through the Centralised Procedure, based on the opinion of the Committee for Medicinal Products for Human Use of the European Medicines Agency, or EMA, and which is valid throughout the entirety of the EEA. The Centralised Procedure is mandatory for certain types of products, such as biotechnology medicinal products, orphan medicinal products, and medicinal products indicated for the treatment of AIDS, cancer, neurodegenerative disorders, diabetes, auto immune and viral diseases. The Centralised Procedure is optional for products containing an active substance not authorized in the EEA before May 20, 2004, for products that constitute a significant therapeutic, scientific or technical innovation or for which a centralized authorization would be in the interest of patients. |
| • | National MAs, which are issued by the competent authorities of the Member States of the EEA and only cover their respective territory, are available for products not falling within the mandatory scope of the Centralised Procedure. Where a product has already been authorized for marketing in a Member State of the EEA, this National MA can be recognized in another Member State through the Mutual Recognition Procedure. If the product has not received a National MA in any Member State at the time of application, it can be approved simultaneously in various Member States through the Decentralized Procedure. |
| • | the second applicant can establish that its product, although similar, is safer, more effective or otherwise clinically superior; |
| • | the applicant consents to a second orphan medicinal product application; or |
| • | the applicant cannot supply sufficient quantities of the orphan medicinal product. |

| (1) | Shareholders of Shanghai Gracell Biotech are Dr. William Wei Cao and Xiaomi Hua holding 99.9% and 0.1%, respectively, of the equity interest in the VIE. Dr. Cao is our Founder, Chairman of board of directors and Chief Executive Officer. |
| • | the ownership structures of the VIE and the WFOE do not and will not result in any violation of PRC laws or regulations currently in effect; and |
| • | the contractual arrangements among the WFOE, the VIE and the shareholders of the VIE governed by PRC law are valid, binding and enforceable, and will not result in any violation of PRC laws or regulations currently in effect. |
Item 4A. |
Unresolved Staff Comments |
Item 5. |
Operating and Financial Review and Prospects |
| • | continue our ongoing and planned research and development of our lead product candidates, GC012F for the treatment of relapsed or refractory multiple myeloma, or r/r MM and B-NHL, GC027 for the treatment of relapsed or refractory T cell acute lymphoblastic leukemia, or r/r T-ALL, and GC502 for the treatment of B-cell malignancies; |
| • | continue our ongoing and planned clinical activities for our other product candidates, including those we are developing for the treatment of B-cell acute lymphoblastic leukemia, or B-ALL, and B-cell non-Hodgkin’s lymphoma, or B-NHL; |
| • | continue our ongoing and planned research and development activities; |
| • | seek to discover and develop additional product candidates and further expand our clinical product pipeline; |
| • | seek regulatory approvals for any product candidates that successfully complete clinical trials; |
| • | continue to scale up manufacturing capacity with the aim of securing sufficient quantities to meet our capacity requirements for clinical trials and potential commercialization; |
| • | establish sales, marketing and distribution infrastructure to commercialize any product candidate for which we may obtain regulatory approval; |
| • | develop, maintain, expand and protect our intellectual property portfolio; |
| • | hire additional clinical, quality control, manufacturing and administrative personnel; and |
| • | expand our operations globally. |
| • | cost of personnel engaged in research and development activities, including salaries, benefits and share-based compensation expense, if any; |
| • | costs of funding research performed by third parties including laboratory, contract research organization, and other investigator and vendor expenses related to the execution of preclinical and clinical trials; |
| • | costs related to production of preclinical and clinical materials; |
| • | facilities and other expenses, which include expenses for rent and maintenance of facilities, depreciation and amortization expense and other supplies; |
| • | expenses related to regulatory activities, including filing fees paid to regulatory agencies; and |
| • | fees for maintaining licenses under our third-party licensing agreements. |
| • | per patient trial costs; |
| • | the number of patients that participate in the trials; |
| • | the number of sites included in the trials; |
| • | the countries in which the trials are conducted; |
| • | the length of time required to enroll eligible patients; |
| • | the number of doses that patients receive; |
| • | the drop-out or discontinuation rates of patients; |
| • | potential additional safety monitoring or other studies requested by regulatory agencies; |
| • | the duration of patient follow-up; |
| • | the efficacy and safety profile of the product candidates; |
| • | the cost and timing of manufacturing of our product candidates; |
| • | the number of trials required for regulatory approval; |
| • | the receipt of regulatory approvals from applicable regulatory authorities; |
| • | the timing, receipt and terms of any marketing approvals from applicable regulatory authorities; and |
| • | the extent to which we establish collaboration, licensing or similar arrangements and the performance of any related third parties. |
For the Years Ended December 31, |
||||||||||||||||||||
2020 |
2021 |
Year-Over-Year Change |
||||||||||||||||||
RMB |
RMB |
US$ |
RMB |
US$ |
||||||||||||||||
(in thousands) |
||||||||||||||||||||
Consolidated Statement of Operations Data: |
||||||||||||||||||||
Revenue: |
||||||||||||||||||||
Licensing and collaboration revenue |
— | 366 | 57 | 366 | 57 | |||||||||||||||
Operating expenses: |
||||||||||||||||||||
Research and development expenses |
(168,830 | ) | (326,899 | ) | (51,298 | ) | (158,069 | ) | (24,805 | ) | ||||||||||
Administrative expenses |
(45,566 | ) | (137,040 | ) | (21,505 | ) | (91,474 | ) | (14,354 | ) | ||||||||||
Loss from operation |
(214,396 | ) | (463,573 | ) | (72,746 | ) | (249,177 | ) | (39,101 | ) | ||||||||||
Interest income |
2,870 | 9,116 | 1,430 | 6,246 | 980 | |||||||||||||||
Interest expense |
(2,155 | ) | (5,063 | ) | (794 | ) | (2,908 | ) | (456 | ) | ||||||||||
Other income |
4,707 | 9,120 | 1,431 | 4,413 | 693 | |||||||||||||||
Foreign exchange gain (loss), net |
(2,914 | ) | (1,297 | ) | (204 | ) | 1,617 | 254 | ||||||||||||
Others, net |
(12 | ) | (57 | ) | (9 | ) | (45 | ) | (7 | ) | ||||||||||
Loss before income tax |
(211,900 | ) | (451,754 | ) | (70,892 | ) | (239,854 | ) | (37,638 | ) | ||||||||||
Income tax expense |
— | — | — | — | — | |||||||||||||||
Net loss |
(211,900 | ) | (451,754 | ) | (70,892 | ) | (239,854 | ) | (37,638 | ) | ||||||||||
For the Year Ended December 31, |
Year-Over-Year Change |
|||||||||||
2019 |
2020 |
|||||||||||
RMB |
RMB |
RMB |
||||||||||
(in thousands) |
||||||||||||
Consolidated Statement of Operations Data: |
||||||||||||
Operating expenses: |
||||||||||||
Research and development expenses |
(119,218 | ) | (168,830 | ) | (49,612 | ) | ||||||
Administrative expenses |
(27,362 | ) | (45,566 | ) | (18,204 | ) | ||||||
Loss from operation |
(146,580 | ) | (214,396 | ) | (67,816 | ) | ||||||
Interest income |
3,932 | 2,870 | (1,062 | ) | ||||||||
Interest expense |
— | (2,155 | ) | (2,155 | ) | |||||||
Other income |
1,449 | 4,707 | 3,258 | |||||||||
Foreign exchange gain, net |
2,556 | (2,914 | ) | (5,470 | ) | |||||||
Others, net |
(21 | ) | 12 | 9 | ||||||||
Loss before income tax |
(138,664 | ) | (211,900 | ) | (73,236 | ) | ||||||
Income tax expense |
— | — | — | |||||||||
Net loss |
(138,664 | ) | (211,900 | ) | (73,236 | ) | ||||||
For the Year Ended December 31, |
||||||||||||||||
2019 |
2020 |
2021 |
||||||||||||||
RMB |
RMB |
RMB |
US$ |
|||||||||||||
(in thousands, except for per share data) |
||||||||||||||||
| Net cash used in operating activities |
(135,393 | ) | (198,149 | ) | (304,550 | ) | (47,792 | ) | ||||||||
| Net cash (used in)/ generated from investing activities |
41,368 | (93,941 | ) | (41,616 | ) | (6,530 | ) | |||||||||
| Net cash generated from financing activities |
394,796 | 756,467 | 1,456,185 | 228,507 | ||||||||||||
| Net (decrease)/increase in cash and cash equivalents |
300,168 | 442,250 | 1,074,698 | 168,644 | ||||||||||||
| Cash and cash equivalents at the beginning of the period |
11,890 | 312,058 | 754,308 | 118,367 | ||||||||||||
| Cash and cash equivalents at the end of the period |
312,058 | 754,308 | 1,829,006 | 287,011 | ||||||||||||
| |
|
|
|
|
|
|
|
|||||||||
Less than 1 Year |
1 to 3 Years |
3 to 5 Years |
More than 5 Years |
Total |
||||||||||||||||
(in RMB thousands) |
||||||||||||||||||||
Operating Lease obligations |
20,230 | 13,657 | — | — | 33,887 | |||||||||||||||
| • | the timing, receipt and amount of sales of any future approved or cleared products, if any; |
| • | the scope, progress, results and costs of researching and developing our existing product candidates or any future product candidates, and conducting preclinical studies and clinical trials; |
| • | the timing of, and the costs involved in, obtaining regulatory approvals or clearances for our existing product candidates or any future product candidates; |
| • | the time and costs involved in obtaining regulatory approval for our product candidates and any delays we may encounter as a result of evolving regulatory requirements or adverse results with respect to any of these product candidates; |
| • | the number and characteristics of any additional product candidates we develop or acquire; |
| • | the cost of manufacturing our product candidates and any products we successfully commercialize, including costs associated with developing our manufacturing capabilities; |
| • | the costs of preparing, filing and prosecuting patent applications, maintaining and enforcing our intellectual property rights and defending intellectual property-related claims; |
| • | the extent to which we acquire or in-license other product candidates and technologies; |
| • | our ability to establish and maintain strategic collaborations, licensing or other arrangements and the financial terms of any such agreements that we may enter into; |
| • | the expenses needed to attract and retain skilled personnel and senior management; and |
| • | the costs associated with being a public company. |
Item 6. |
Directors, Senior Management and Employees |
| Directors and Executive Officers |
Age |
Position/Title | ||
| William Wei Cao, Ph.D. B.M. |
63 | Founder, Chairman of the Board and Chief Executive Officer | ||
| David Guowei Wang M.D., Ph.D. |
60 | Director | ||
| Guotong Xu M.D., Ph.D. |
64 | Director | ||
| Wendy Hayes |
52 | Director | ||
| Christophe Kin Ping Lee |
53 | Director | ||
| Martina Sersch, M.D., Ph.D. |
50 | Chief Medical Officer | ||
| Yili Kevin Xie, Ph.D. |
51 | Chief Financial Officer | ||
| Jenny Yajin Ni, M.D., Ph.D. |
59 | Chief Technology Officer |
| Name |
Ordinary Shares & RSUs Underlying Awards |
Exercise Price (US$/Share) |
Date of Grant |
Date of Expiration |
||||||||||||
| William Wei Cao |
303,030 | — | January 1, 2021 | January 30, 2031 | ||||||||||||
| 289,020 | — | February 24, 2022 | February 24, 2032 | |||||||||||||
| 606,060 | 1,65 | January 1, 2021 | January 1, 2031 | |||||||||||||
| 1,000,000 | 1.65 | January 13, 2021 | January 13, 2031 | |||||||||||||
| 1,302,415 | 0.692 | February 24, 2022 | February 24, 2032 | |||||||||||||
| David Guowei Wang |
— | — | — | — | ||||||||||||
| Guotong Xu |
* | 0.30 | September 1, 2017 | August 31, 2027 | ||||||||||||
| * | 4.36 | February 1, 2021 | February 1, 2031 | |||||||||||||
| Wendy Hayes |
* | — | January 8, 2021 | January 8, 2031 | ||||||||||||
| * | — | January 7, 2022 | January 7, 2023 | |||||||||||||
| Christophe Kin Ping Lee |
* | — | July 9, 2021 | July 9, 2031 | ||||||||||||
| * | — | February 24, 2022 | February 24, 2032 | |||||||||||||
| Martina Sersch |
1,000,000 | 1.06 | June 15, 2020 | June 15, 2030 | ||||||||||||
| 300,000 | 1.65 | January 13, 2021 | January 13, 2031 | |||||||||||||
| * | 4.64 | April 13, 2021 | April 13, 2031 | |||||||||||||
| * | 0.692 | February 24, 2022 | February 24, 2032 | |||||||||||||
| Yili Kevin Xie |
* | — | February 24, 2022 | February 24, 2032 | ||||||||||||
| 3,000,000 | 1.06 | July 16, 2020 | July 16, 2030 | |||||||||||||
| * | 1.65 | December 9, 2020 | December 8, 2030 | |||||||||||||
| * | 1.65 | January 13, 2021 | January 13, 2031 | |||||||||||||
| * | 4.64 | April 13, 2021 | April 13, 2031 | |||||||||||||
| Jenny Yajin Ni |
800,000 | 2.3 | May 6, 2021 | May 6, 2031 | ||||||||||||
| Other grantees |
8,257,520 | |
0.30 (August 8, 2017 through January 2, 2019) 1.06 (January 3, 2019 through November 3, 2020) 1.65 (November 4, 2020 through March 31, 2021) 4.64 (March 15, 2021 through April 13, 2021) |
|
From August 8, 2017 |
|
|
Ten years from date of award |
| |||||||
| Total |
17,538,060 |
|||||||||||||||
| * | Less than 1% of our total outstanding ordinary shares on an as-converted basis. |
| • | selecting the independent auditors; |
| • | reviewing and approving the independent auditors’ annual engagement letter; |
| • | review responsibilities, budget, compensation and staffing of our internal audit function; |
| • | reviewing with the independent auditor any audit problems or difficulties and management’s response; |
| • | reviewing and pre-approving related party transactions; |
| • | reviewing and discussing the annual audited financial statements with management and the independent auditor; |
| • | reviewing and discussing with management and the independent auditors about all critical accounting policies and practices to be used; |
| • | reviewing reports prepared by management and/or the independent auditors relating to significant financial reporting issues and judgments; |
| • | reviewing earnings press releases, as well as financial information and earnings guidance provided to analysts and rating agencies; |
| • | reviewing with management and the independent auditors the effect of regulatory and accounting initiatives, as well as off-balance sheet structures, on our financial statements; |
| • | discussing policies with respect to risk assessment and risk management with management and internal auditors; |
| • | timely reviewing reports from the independent auditors regarding all critical accounting policies and practices to be used by our company, and all other material written communications between the independent auditors and management; |
| • | establishing procedures for the receipt, retention and treatment of complaints received from our employees regarding accounting, internal accounting controls or auditing matters and the confidential, anonymous submission by our employees of concerns regarding questionable accounting or auditing matters; |
| • | such other matters that are specifically delegated to our audit committee by our board of directors from time to time; and |
| • | meeting separately, periodically, with management, internal auditors and the independent auditor. |
| • | reviewing, evaluating and, if necessary, revising our overall compensation plans; |
| • | reviewing and evaluating the performance of our directors and relevant executive officers and determining the compensation of relevant executive officers; |
| • | reviewing and approving any severance or termination agreements to be made with any executive officers; |
| • | reviewing our general compensation plans and other employee benefit plans, including our incentive compensation plan and equity-based compensation plans; |
| • | administering our equity-based compensation plans in accordance with the terms thereof; and |
| • | such other matters that are specifically delegated to the compensation committee by our board of directors from time to time. |
| • | selecting and recommending to our board of directors nominees for election by the shareholders or appointment by the board; |
| • | reviewing annually with our board of directors the current composition of our board of directors with regards to characteristics such as independence, knowledge, skills, experience and diversity; |
| • | making recommendations on the frequency and structure of our board of directors meetings and monitoring the functioning of the committees of our board of directors; and |
| • | advising our board of directors periodically with regards to significant developments in the law and practice of corporate governance as well as our compliance with applicable laws and regulations, and making recommendations to the board on all matters of corporate governance and on any remedial action to be taken. |
| • | conducting and managing the business of our company; |
| • | representing our company in contracts and deals; |
| • | appointing attorneys for our company; |
| • | selecting and removing senior management; |
| • | providing employee benefits and pensions; |
| • | managing our company’s finance and bank accounts; |
| • | evaluating the performance and determining the compensation level of chief executive officer; |
| • | exercising the borrowing powers of our company and mortgaging the property of our company; and |
| • | exercising any other powers conferred by the shareholders meetings or under our amended and restated memorandum and articles of association. |
| • | Class I, which will consist of Christophe Kin Ping Lee, whose term will expire at our annual meeting of shareholders in 2024; and |
| • | Class II, which will consist of Guotong Xu and David Guowei Wang, whose term will expire at our annual meeting of shareholders in 2022; |
| • | Class III, which will consist of William Wei Cao and Wendy Hayes, whose term will expire at our annual meeting of shareholders in 2023. |
| Country of Principal Executive Offices |
People’s Republic of China | |||||||
| Foreign Private Issuer |
Yes | |||||||
| Disclosure Prohibited under Home Country Law |
No | |||||||
| Total Number of Directors |
5 | |||||||
Female |
Male |
Non- Binary |
Did Not Disclose Gender |
|||||||||||||
| Part I: Gender Identity |
||||||||||||||||
| Directors |
1 | 4 | 0 | 0 | ||||||||||||
| Part II: Demographic Background |
||||||||||||||||
| Underrepresented Individual in Home Country Jurisdiction |
0 | |||||||||||||||
| LGBTQ+ |
0 | |||||||||||||||
| Did Not Disclose Demographic Background |
0 | |||||||||||||||
| • | each of our directors and executive officers; |
| • | all of our directors and executive officers as a group; and |
| • | each person known to us to beneficially own more than 5% of our ordinary shares. |
Ordinary Shares Beneficially Owned |
||||||||
Number |
% |
|||||||
| Directors and Executive Officers**: |
||||||||
| William Wei Cao (1) |
95,096,137 | 27.5 | ||||||
| David Guowei Wang |
— | — | ||||||
| Guotong Xu |
* | * | ||||||
| Wendy Hayes |
* | * | ||||||
| Christophe Kin Ping Lee |
* | * | ||||||
| Martina Sersch |
* | * | ||||||
| Yili Kevin Xie |
* | * | ||||||
| Jenny Yajin Ni |
* | * | ||||||
| All Directors and Executive Officers as a Group |
96,867,184 | 28.0 | ||||||
| Principal Shareholders: |
||||||||
| Gracell Venture Holdings Limited (1) |
92,347,450 | 26.7 | ||||||
| TLS Beta Pte. Ltd. (2) |
49,509,702 | 14.3 | ||||||
| Entities affiliated with LAV (3) |
25,406,680 | 7.3 | ||||||
| Entities affiliated with OrbiMed (4). |
66,220,230 | 19.1 | ||||||
| Entities affiliated with Wellington (5) |
21,460,705 | 6.2 | ||||||
| Capital International Investors (6) |
20,318,820 | 5.9 | ||||||
| * | Less than 1% of our total ordinary shares on an as-converted basis outstanding as of the date of this annual report. |
| ** | Business address of Dr. William Wei Cao, Dr. Martina Sersch and Dr. Yili Kevin Xie is Building 12, Block B, Phase ll, Biobay Industrial Park, 218 Sangtian St., Suzhou Industrial Park, Jiangsu Province, China. Dr. David Guowei Wang’s business address is Unit 4706, Raffles City Shanghai Office Tower, 268 Middle Xizang Road, Huangpu District, Shanghai, China. Ms. Lili Shen’s business address is 320 Wuyuan Road, Xuhui District, Shanghai, China. Dr. Guotong Xu’s business address is Room 102, No.18, Lane 29, Lingling Road, XuHui District, Shanghai, China. Ms. Wendy Hayes’s business address is 2370 Roanoke Trail, Reno, NV 89523. |
| (1) | Represents 92,090,000 ordinary shares and 257,450 ordinary shares (in the form of ADSs) held by Gracell Venture Holdings Limited, a company incorporated in the British Virgin Islands, and 2,748,687 ordinary shares that William Wei Cao has the rights to acquire within 60 days. Gracell Venture Holdings Limited is wholly owned by Land Blossom Limited, a company incorporated in the British Virgin Islands. Land Blossom Limited, under The Cao Family Trust, or the Trust, established under the law of Republic of Singapore and managed by VISTRA Trust (Singapore) Pte. Limited, or the Trustee, is wholly owned and managed by the Trustee. Dr. William Wei Cao is the Settlor of the Trust and Dr. Cao and his family members are the Trust’s beneficiaries. Under the terms of the Trust, Dr. Cao has the power to direct the Trustee with respect to the retention or disposal of, and the exercise of any voting and other rights attached to the shares held by Gracell Venture Holdings Limited in our company. The registered address of Gracell Venture Holdings Limited is Sertus Chambers, P.O. Box 905, Quastisky Building, Road Town, Tortola, British Virgin Islands. |
| (2) | Represents 49,509,702 ordinary shares held by TLS Beta Pte. Ltd., a company incorporated in Singapore. TLS Beta Pte. Ltd. is a direct wholly-owned subsidiary of Temasek Life Sciences Private Limited. Temasek Life Sciences Private Limited, is a direct wholly-owned subsidiary of Fullerton Management Pte Ltd, or FMPL, which in turn is a direct wholly-owned subsidiary of Temasek Holdings (Private) Limited, or Temasek. Temasek is wholly owned by the Singapore Minister for Finance. Under the Singapore Minister for Finance (Incorporation) Act (Chapter 183), the Minister for Finance is a body corporate. As a commercial investment company, Temasek has its own Board of Directors and a professional management team. Temasek owns and manages its portfolio with full commercial discretion and flexibility under the guidance of its Board. The Singapore Government is not involved in Temasek’s investment, divestment, or any other business or operational decisions. The principal business address of TLS Beta Pte. Ltd. is 60B Orchard Road #06-18 Tower 2, The Atrium@Orchard, Singapore 238891. |
| (3) | Represents (i) 10,049,125 ordinary shares (in the form of ADSs) held by LAV Biosciences Fund V, L.P., a Cayman Islands exempted limited partnership, (ii) 14,981,730 ordinary shares (in the form of ADSs) held by LAV Granite Limited, a British Virgin Island company, and (iii) 375,825 ordinary shares (in the form of ADSs) held by LAV Biosciences Fund V Sub A, L.P., a United States limited partnership, as reported on Schedule 13G filed by LAV Granite Limited, among others, on February 9, 2022. LAV Corporate V GP, Ltd. is the general partner of LAV GP V, L.P., which is the general partner of LAV Biosciences Fund V, L.P. Dr. Yi Shi is a Managing Partner of LAV Corporate V GP, Ltd and has voting power and investment discretion with regard to the shares held of record by LAV Biosciences Fund V, L.P. LAV Granite Limited is wholly owned by LAV Biosciences Fund IV, LP. Dr. Yi Shi is the managing partner of LAV Corporate IV GP, Ltd the general partner of LAV GP IV, L.P., which is the general partner of LAV Biosciences Fund IV, LP. The voting and investment power of shares held by LAV Granite Limited is exercised by Dr. Yi Shi. The registered address of LAV Biosciences Fund V, L.P. is 75 Fort Street, PO Box 1350, Grand Cayman KY1-1108, Cayman Islands. The registered address of LAV Granite Limited is PO Box 4301, Road Town, Tortola, British Virgin Islands. |
| (4) | Represents (i) 1,914,198ADSs held by OrbiMed Capital LLC, a Delaware corporation, (ii) 5,970,672 ADSs held by OrbiMed Advisors LLC, a Delaware corporation, and (iii) 5,359,176 ADSs held by OrbiMed Asia GP III, L.P., as reported on Schedule 13G filed by OrbiMed Capital LLP on February 11, 2022. OrbiMed Asia GP III, L.P. is the general partner of OrbiMed Asia Partners III, L.P., or OAP III. OrbiMed Advisors LLC, or Advisors, and OrbiMed Capital LLC, or Capital, are investment advisors in accordance with ss.240.13d-1(b)(1)(ii)(E). Advisors is the investment manager to OrbiMed Asia GP III, L.P.. The principal business address of OrbiMed Capital LLC and OrbiMed Advisors LLC is 601 Lexington Avenue, 54th Floor, New York, NY 10022. |
| (5) | Represents 21,460,705 ordinary shares held by Wellington Investment Advisors Holdings LLP, a Delaware limited partnership, as reported on Schedule 13G filed by Wellington Group Holdings LLP, among others, on February 4, 2022. Wellington Management Group LLP is the parent holding company of certain holding companies and the Wellington Investment Advisers. The securities are owned of record by clients of the Wellington Investment Advisers. Wellington Investment Advisors Holdings LLP controls directly, or indirectly through Wellington Management Global Holdings, Ltd., the Wellington Investment Advisers. Wellington Investment Advisors Holdings LLP is owned by Wellington Group Holdings LLP. Wellington Group Holdings LLP is owned by Wellington Management Group LLP. The principal business address is 280 Congress Street, Boston, MA 02210. |
| (6) | Represents 20,318,820 ordinary shares (in the form of ADSs) held by Capital International Investors, a Delaware corporation, as reported on Schedule 13G filed by Capital International Investors on February 11, 2022. Capital International Investors is a division of Capital Research and Management Company, as well as its investment management subsidiaries and affiliates Capital Bank and Trust Company, Capital International, Inc., Capital International Limited, Capital International Sarl, Capital International K.K., and Capital Group Private Client Services, Inc. Capital International Investors’ divisions of each of the aforementioned investment management entities collectively provide investment management services under the name “Capital International Investors.” Capital International Investors is deemed to be the beneficial owner of 20,318,820 shares. The principal business address is 333 South Hope Street, 55th Fl, Los Angeles, CA 90071. |
Item 7. |
Major Shareholders and Related Party Transactions |
Item 8. |
Financial Information |
Item 9. |
The Offer and Listing |
Item 10. |
Additional Information |
| • | the instrument of transfer is lodged with us, accompanied by the certificate for the ordinary shares to which it relates and such other evidence as our board of directors may reasonably require to show the right of the transferor to make the transfer; |
| • | the instrument of transfer is in respect of only one class of ordinary shares; |
| • | the instrument of transfer is properly stamped, if required; |
| • | in the case of a transfer to joint holders, the number of joint holders to whom the ordinary share is to be transferred does not exceed four; |
| • | the ordinary shares transferred are free of any lien in favor of our company; and |
| • | a fee of such maximum sum as The Nasdaq Global Select Market may determine to be payable or such lesser sum as our directors may from time to time require is paid to us in respect thereof. |
| • | the designation of the series; |
| • | the number of shares of the series; |
| • | the dividend rights, dividend rates, conversion rights, voting rights; |
| • | the rights and terms of redemption and liquidation preferences; and |
| • | any other powers, preferences and relative, participating, optional and other special rights. |
| • | authorize our board of directors to issue preferred shares in one or more series and to designate the price, rights, preferences, privileges and restrictions of such preferred shares without any further vote or action by our shareholders; and |
| • | limit the ability of shareholders to requisition and convene general meetings of shareholders. |
| • | does not have to file an annual return of its shareholders with the Registrar of Companies; |
| • | is not required to open its register of members for inspection; |
| • | does not have to hold an annual general meeting; |
| • | may issue negotiable or bearer shares or shares with no par value; |
| • | may obtain an undertaking against the imposition of any future taxation (such undertakings are usually given for 20 years in the first instance); |
| • | may register by way of continuation in another jurisdiction and be deregistered in the Cayman Islands; |
| • | may register as a limited duration company; and |
| • | may register as a segregated portfolio company. |
| • | the statutory provisions as to the required majority vote have been met; |
| • | the shareholders have been fairly represented at the meeting in question and the statutory majority are acting bona fide without coercion of the minority to promote interests adverse to those of the class; |
| • | the arrangement is such that may be reasonably approved by an intelligent and honest man of that class acting in respect of his interest; and |
| • | the arrangement is not one that would more properly be sanctioned under some other provision of the Companies Act. |
| • | a company acts or proposes to act illegally or ultra vires; |
| • | the act complained of, although not ultra vires, could only be effected duly if authorized by more than a simple majority vote that has not been obtained; and |
| • | those who control the company are perpetrating a “fraud on the minority.” |
| (i) | no law which is enacted in the Cayman Islands imposing any tax to be levied on profit or income or gains or appreciations shall apply to the Company or its operations; and |
| (ii) | no tax be levied on profits, income, gains or appreciations or which is in the nature of estate duty or inheritance tax shall be payable by the Company: |
| • | on or in respect of the shares, debenture, or other obligations of the Company; or |
| • | by way of withholding in whole or in party of any relevant payment as defined in section 6(3) of the Tax Concessions Law (as amended). |
| • | banks and other financial institutions; |
| • | insurance companies; |
| • | pension plans; |
| • | cooperatives; |
| • | regulated investment companies; |
| • | real estate investment trusts; |
| • | corporations that accumulate income to avoid U.S. federal income tax; |
| • | broker-dealers; |
| • | dealers or traders that elect to use a mark-to-market |
| • | certain former U.S. citizens or long-term residents; |
| • | tax-exempt entities (including private foundations); |
| • | governmental organizations; |
| • | investors who acquire their ADSs or ordinary shares pursuant to any employee share option or otherwise as compensation; |
| • | investors that will hold their ADSs or ordinary shares as part of a straddle, hedge, conversion, constructive sale or other integrated transaction for U.S. federal income tax purposes; |
| • | investors that have a functional currency other than the U.S. dollar for U.S. federal income tax purposes; |
| • | investors required to accelerate the recognition of any item of gross income with respect to their ADSs or ordinary shares as a result of such income being recognized on an applicable financial statement; |
| • | investors that actually or constructively own 10% or more of our stock (by vote or value); or |
| • | partnerships or other entities or arrangements taxable as partnerships for U.S. federal income tax purposes, or persons holding ADSs or ordinary shares through such entities, |
| • | an individual who is a citizen or resident of the United States; |
| • | a corporation (or other entity treated as a corporation for U.S. federal income tax purposes) created in, or organized under the law of the United States or any state thereof or the District of Columbia; |
| • | an estate, the income of which is includible in gross income for U.S. federal income tax purposes regardless of its source; or |
| • | a trust (A) the administration of which is subject to the primary supervision of a U.S. court and which has one or more U.S. persons who have the authority to control all substantial decisions of the trust or (B) that has otherwise validly elected to be treated as a U.S. person under the Code. |
| • | the excess distribution or gain will be allocated ratably over the U.S. Holder’s holding period for the ADSs or ordinary shares; |
| • | the amount allocated to the current taxable year and any taxable years in the U.S. Holder’s holding period prior to the first taxable year in which we are classified as a PFIC (each, a “pre-PFIC year”), will be taxable as ordinary income; |
| • | the amount allocated to each prior taxable year, other than a pre-PFIC year, will be subject to tax at the highest tax rate in effect for individuals or corporations, as appropriate, for that year; and |
| • | the interest charge generally applicable to underpayments of tax will be imposed on the tax attributable to each prior taxable year, other than a pre-PFIC year. |
Item 11. |
Quantitative and Qualitative Disclosures about Market Risk |
Item 12. |
Description of Securities Other than Equity Securities |
| Persons depositing or withdrawing Class A ordinary shares or ADS holders must pay: |
For: | |
| $5.00 (or less) per 100 ADSs (or portion of 100 ADSs) | • Issuance of ADSs, including issuances resulting from a distribution of shares or rights or other property | |
| • Cancellation of ADSs for the purpose of withdrawal, including if the deposit agreement terminates | ||
| $0.05 (or less) per ADS | • Any cash distribution to ADS holders | |
| A fee equivalent to the fee that would be payable if securities distributed to you had been shares and the shares had been deposited for issuance of ADSs | • Distribution of securities distributed to holders of deposited securities (including rights) that are distributed by the depositary to ADS holders | |
| $0.05 (or less) per ADS per calendar year | • Depositary services | |
| Registration or transfer fees | • Transfer and registration of shares on our share register to or from the name of the depositary or its agent when you deposit or withdraw shares | |
| Expenses of the depositary | • Cable (including SWIFT) and facsimile transmissions (when expressly provided in the deposit agreement) | |
| • Converting foreign currency to U.S. dollars | ||
| Taxes and other governmental charges the depositary or the custodian has to pay on any ADSs or shares underlying ADSs, such as stock transfer taxes, stamp duty or withholding taxes | • As necessary | |
| Any charges incurred by the depositary or its agents for servicing the deposited securities | • As necessary |
Item 13. |
Defaults, Dividend Arrearages and Delinquencies |
Item 14. |
Material Modifications to the Rights of Security Holders and Use of Proceeds |
Item 15. |
Controls and Procedures |
Item 16A. |
Audit Committee Financial Expert |
Item 16B. |
Code of Ethics |
Item 16C. |
Principal Accountant Fees and Services |
For the Year Ended December 31, |
||||||||
2020 |
2021 |
|||||||
| Audit fees (1) |
US$ | 530 | US$ | 1,018 | ||||
| All other fees (2) |
US$ | 50 | US$ | 23 | ||||
| (1) | “Audit fees” means the aggregate fees billed in each of the fiscal years listed for professional services rendered by our principal auditors for the audit of our annual financial statements and assistance with and review of documents filed with the SEC. In 2020 and 2021, the audit refers to financial audit. |
| (2) | “All other fees” means the aggregate fees billed in each of the fiscal years listed for professional services rendered by our principal auditors associated with certain permitted tax services, permissible services to review and comment on internal control design over financial reporting and other advisory services. |
Item 16D. |
Exemptions from the Listing Standards for Audit Committees |
Item 16E. |
Purchases of Equity Securities by the Issuer and Affiliated Purchasers |
Item 16F. |
Change in Registrant’s Certifying Accountant |
Item 16G. |
Corporate Governance |
| • | the requirement that each member of the compensation committee must be an independent director as set forth in Nasdaq Rule 5605(d)(2)(A); |
| • | the requirement that director nomination should be made by a vote in which only independent directors participate or by a nominations committee comprised solely of independent directors as set forth in Nasdaq Rule 5605(e)(1); |
| • | the requirement to obtain shareholder approval for certain issuances of securities, including shareholder approval of stock option plans; and |
| • | the requirement that the board of directors shall have regularly scheduled meetings at which only independent directors are present as set forth in Nasdaq Rule 5605(b)(2). |
Item 16H. |
Mine Safety Disclosure |
Item 16I. |
Disclosure Regarding Foreign Jurisdictions that Prevent Inspections |
Item 17. |
Financial Statements |
Item 18. |
Financial Statements |
Item 19. |
Exhibits |
| 101.INS* | Inline XBRL Instance Document — the instance document does not appear in the Interactive Data File because its XBRL tags are embedded within the Inline XBRL document |
| 101.SCH* | Inline XBRL Taxonomy Extension Schema Document |
| 101.CAL* | Inline XBRL Taxonomy Extension Calculation Linkbase Document |
| 101.DEF* | Inline XBRL Taxonomy Extension Definition Linkbase Document |
| 101.LAB* | Inline XBRL Taxonomy Extension Labels Linkbase Document |
| 101.PRE* | Inline XBRL Taxonomy Extension Presentation Linkbase Document |
| 104 | Cover Page Interactive Data File — the cover page XBRL tags are embedded within the Exhibit 101 Inline XBRL document set |
| * | Filed with this Annual Report on Form 20-F. |
| ** | Furnished with this Annual Report on Form 20-F. |
| ^ | Pursuant to Item 601(b)(10)(iv) of Regulation S-K promulgated by the Securities and Exchange Commission, certain portions of this exhibit have been redacted because they are both not material and the type that the Company treats as private or confidential. |
Gracell Biotechnologies Inc. | ||||||
| By: | /s/ William Wei Cao | |||||
| Name: William Wei Cao | ||||||
| Title: Chairman of the Board of Directors and Chief Executive Officer | ||||||
| Date: April 22, 2022 | ||||||
PAGES |
||||
F-2 |
||||
F-3 |
||||
F-5 |
||||
F-6 |
||||
F-7 |
||||
F-8 |
||||
As of December 31, |
||||||||||||||
Notes |
2020 |
2021 |
||||||||||||
RMB |
RMB |
US$ (Note 2) |
||||||||||||
ASSETS |
||||||||||||||
Current assets: |
||||||||||||||
Cash and cash equivalents |
||||||||||||||
Short-term investments |
||||||||||||||
Prepayments and other current assets |
3 | |||||||||||||
Total current assets |
||||||||||||||
Property, equipment and software, net |
4 | |||||||||||||
Operating lease right-of-use |
5 | |||||||||||||
Other non-current assets |
6 | |||||||||||||
TOTAL ASSETS |
||||||||||||||
LIABILITIES, MEZZANINE EQUITY AND SHAREHOLDERS’ EQUITY (DEFICIT) |
||||||||||||||
Current liabilities: |
||||||||||||||
Accruals and other current liabilities (including accruals and other current liabilities of the consolidated VIEs without recourse to the Company of RMB |
7 | |||||||||||||
Short-term borrowings (including short-term borrowings of the consolidated VIEs without recourse to the Company of RMB |
8 | |||||||||||||
Operating lease liabilities, current (including operating lease liabilities, current of the consolidated VIEs without recourse to the Company of |
5 | |||||||||||||
Current portion of long-term borrowings (including current portion of long-term borrowings of the consolidated VIEs without recourse to the Company of RMB |
8 | |||||||||||||
Total current liabilities |
||||||||||||||
Operating lease liabilities, non-current (including operating lease liabilities, non-current of the consolidated VIEs without recourse to the Company of |
5 | |||||||||||||
Long-term borrowings (including long-term borrowings of the consolidated VIEs without recourse to the Company of RMB |
8 | |||||||||||||
Other non-current liabilities |
||||||||||||||
TOTAL LIABILITIES |
||||||||||||||
Commitments and contingencies |
15 | |||||||||||||
Mezzanine equity: |
||||||||||||||
Series A convertible redeemable preferred shares (US$ 2 0 and 2021, respectively) |
10 | |||||||||||||
Series B-1 convertible redeemable preferred shares (US$ |
10 | |||||||||||||
Series B-2 convertible redeemable preferred shares (US$ |
10 | |||||||||||||
Series C convertible redeemable preferred shares (US$ |
10 | |||||||||||||||
Total mezzanine equity |
||||||||||||||||
Shareholders’ equity (deficit): |
||||||||||||||||
Ordinary shares (par value of US$ and |
9 | |||||||||||||||
Additional paid-in capital |
||||||||||||||||
Accumulated other comprehensive loss |
( |
) | ( |
) | ( |
) | ||||||||||
Accumulated deficit |
( |
) | ( |
) | ( |
) | ||||||||||
Total shareholders’ equity (deficit) |
( |
) |
||||||||||||||
TOTAL LIABILITIES, MEZZANINE EQUITY AND SHAREHOLDERS’ EQUITY(DEFICIT) |
||||||||||||||||
For the years ended December 31, |
||||||||||||||||||||
Notes |
2019 |
2020 |
2021 |
|||||||||||||||||
RMB |
RMB |
RMB |
US$ |
|||||||||||||||||
(Note 2) |
||||||||||||||||||||
| Revenues |
||||||||||||||||||||
| Licensing and collaboration revenue |
— | — | ||||||||||||||||||
| Expenses |
||||||||||||||||||||
| Research and development expenses |
( |
) | ( |
) | ( |
) | ( |
) | ||||||||||||
| Administrative expenses |
( |
) | ( |
) | ( |
) | ( |
) | ||||||||||||
| |
|
|
|
|
|
|
|
|||||||||||||
| Loss from operations |
( |
) |
( |
) |
( |
) |
( |
) | ||||||||||||
| Interest income |
||||||||||||||||||||
| Interest expense |
— | ( |
) | ( |
) | ( |
) | |||||||||||||
| Other income |
||||||||||||||||||||
| Foreign exchange gain (loss), net |
( |
) | ( |
) | ( |
) | ||||||||||||||
| Others, net |
( |
) | ( |
) | ( |
) | ( |
) | ||||||||||||
| |
|
|
|
|
|
|
|
|||||||||||||
| Loss before income tax |
( |
) |
( |
) |
( |
) |
( |
) | ||||||||||||
| Income tax expense |
12 | — | — | |||||||||||||||||
| |
|
|
|
|
|
|
|
|||||||||||||
| Net loss |
( |
) |
( |
) |
( |
) |
( |
) | ||||||||||||
| Deemed dividend to convertible redeemable preferred shareholders |
( |
) | — | — | — | |||||||||||||||
| Accretion of convertible redeemable preferred shares to redemption value |
10 | ( |
) | ( |
) | ( |
) | ( |
) | |||||||||||
| |
|
|
|
|
|
|
|
|||||||||||||
| Net loss attributable to Gracell Biotechnologies Inc.’s ordinary shareholders |
( |
) |
( |
) |
( |
) |
( |
) | ||||||||||||
| Other comprehensive loss |
||||||||||||||||||||
| Foreign currency translation adjustments, net of |
( |
) | ( |
) | ( |
) | ( |
) | ||||||||||||
| |
|
|
|
|
|
|
|
|||||||||||||
| Total comprehensive loss attributable to Gracell Biotechnologies Inc.’s ordinary shareholders |
( |
) |
( |
) |
( |
) |
( |
) | ||||||||||||
| |
|
|
|
|
|
|
|
|||||||||||||
| Weighted average number of ordinary shares used in per share calculation: |
||||||||||||||||||||
| —Basic |
13 | |||||||||||||||||||
| —Diluted |
13 | |||||||||||||||||||
| Net loss per share attributable to Gracell Biotechnologies Inc.’s ordinary shareholders |
||||||||||||||||||||
| —Basic |
13 | ( |
) | ( |
) | ( |
) | ( |
) | |||||||||||
| —Diluted |
13 | ( |
) | ( |
) | ( |
) | ( |
) | |||||||||||
Ordinary shares |
||||||||||||||||||||||||
Number of shares |
Amount |
Additional paid-in capital |
Accumulated other comprehensive loss |
Accumulated deficit |
Total shareholders’ equity/(deficit) |
|||||||||||||||||||
RMB |
RMB |
RMB |
RMB |
RMB |
||||||||||||||||||||
| Balance as of January 1, 2019 |
— |
( |
) |
( |
) | |||||||||||||||||||
| Net loss |
— | — | — | — | ( |
) | ( |
) | ||||||||||||||||
| Repurchase of ordinary shares (Note 9) |
( |
) | ( |
) | — | — | ( |
) | ( |
) | ||||||||||||||
| Repurchase of convertible redeemable preferred shares (Note 10) |
— | — | — | — | ( |
) | ( |
) | ||||||||||||||||
| Accretions of convertible redeemable preferred shares to redemption value |
— | — | — | — | ( |
) | ( |
) | ||||||||||||||||
| Foreign currency translation adjustment |
— | — | — | ( |
) | — | ( |
) | ||||||||||||||||
| |
|
|
|
|
|
|
|
|
|
|
|
|||||||||||||
| Balance as of December 31, 2019 |
( |
) |
( |
) |
( |
) | ||||||||||||||||||
| |
|
|
|
|
|
|
|
|
|
|
|
|||||||||||||
| Net loss |
— | — | — | — | ( |
) | ( |
) | ||||||||||||||||
| Accretions of convertible redeemable preferred shares to redemption value |
— | — | — | — | ( |
) | ( |
) | ||||||||||||||||
| Foreign currency translation adjustment |
— | — | — | ( |
) | — | ( |
) | ||||||||||||||||
| |
|
|
|
|
|
|
|
|
|
|
|
|||||||||||||
| Balance as of December 31, 2020 |
( |
) |
( |
) |
( |
) | ||||||||||||||||||
| |
|
|
|
|
|
|
|
|
|
|
|
|||||||||||||
| Net loss |
— | — | — | — | ( |
) | ( |
) | ||||||||||||||||
| Accretions of convertible redeemable preferred shares to redemption value |
— | — | — | — | ( |
) | ( |
) | ||||||||||||||||
| Share-based compensation |
— | — | — | — | ||||||||||||||||||||
| Conversion of preferred shares to ordinary shares upon the completion of initial public offering (“IPO”) |
— | — | ||||||||||||||||||||||
| Issuance of ordinary shares upon IPO and over-allotment, net of issuance cost |
— | — | ||||||||||||||||||||||
| Exercise of options and restricted share units |
— | — | ||||||||||||||||||||||
| Foreign currency translation adjustment |
— | — | — | ( |
) | — | ( |
) | ||||||||||||||||
| |
|
|
|
|
|
|
|
|
|
|
|
|||||||||||||
| Balance as of December 31, 2021 |
( |
) |
( |
) |
||||||||||||||||||||
| |
|
|
|
|
|
|
|
|
|
|
|
|||||||||||||
For the years ended December 31, |
||||||||||||||||
2019 |
2020 |
2021 |
||||||||||||||
RMB |
RMB |
RMB |
US$ |
|||||||||||||
(Note 2) |
||||||||||||||||
Cash flows from operating activities: |
||||||||||||||||
Net loss |
( |
) | ( |
) | ( |
) | ( |
) | ||||||||
Adjustments to reconcile net loss to net cash used in operating activities: |
||||||||||||||||
Depreciation of property, equipment and software |
||||||||||||||||
Share-based compensation |
— | — | ||||||||||||||
Amortization of right-of use assets and interest of lease liabilities |
— | — | ||||||||||||||
Foreign exchange (gain) loss, net |
( |
) | ||||||||||||||
Changes in operating assets and liabilities: |
||||||||||||||||
Prepayments and other current assets |
( |
) | ( |
) | ( |
) | ( |
) | ||||||||
Accrued liabilities and other current liabilities |
||||||||||||||||
Other non-current assets |
— | — | ( |
) | ( |
) | ||||||||||
Lease liabilities |
— | — | ( |
) | ( |
) | ||||||||||
Other non-current liabilities |
||||||||||||||||
Net cash (used in) operating activities |
( |
) |
( |
) |
( |
) | ( |
) | ||||||||
Cash flows from investing activities: |
||||||||||||||||
Purchase of property, equipment and software |
( |
) | ( |
) | ( |
) | ( |
) | ||||||||
Investments in short-term investments |
( |
) | ( |
) | ( |
) | ( |
) | ||||||||
Proceeds from disposal of short-term investments |
||||||||||||||||
Net cash (used in) generated from investing activities |
( |
) |
( |
) | ( |
) | ||||||||||
Cash flows from financing activities: |
||||||||||||||||
Proceeds from initial public offering and over-allotment, net of underwriting commissions |
— | — | ||||||||||||||
Proceeds from exercise of options and restricted share units |
— | — | ||||||||||||||
Repayment of convertible loans |
— | ( |
) | |||||||||||||
Proceeds from issuance of convertible redeemable preferred shares, net of issuance costs |
— | — | ||||||||||||||
Repurchase of ordinary shares and preferred shares |
( |
) | — | |||||||||||||
Proceeds from bank borrowings |
— | |||||||||||||||
Repayments of bank borrowings |
— | ( |
) | ( |
) | ( |
) | |||||||||
Payment of initial public offering costs |
— | ( |
) | ( |
) | ( |
) | |||||||||
Net cash generated from financing activities |
||||||||||||||||
Effect of exchange rate on cash and cash equivalents |
( |
) | ( |
) | ( |
) | ( |
) | ||||||||
Net increase in cash and cash equivalents |
||||||||||||||||
Cash and cash equivalents at the beginning of year |
||||||||||||||||
Cash and cash equivalents at the end of year |
||||||||||||||||
Supplemental cashflow disclosures: |
||||||||||||||||
Interest paid |
— | |||||||||||||||
Non-cash activities: |
||||||||||||||||
Deemed dividend to convertible redeemable preferred shareholders |
— | — | — | |||||||||||||
Accretion of convertible redeemable preferred shares to redemption value |
||||||||||||||||
Payables for deferred initial public offering cost |
— | — | — | |||||||||||||
| Date of incorporation |
Place of incorporation |
Percentage of legal ownership by the Company |
Principal activities | |||||||
| Subsidiaries |
||||||||||
| Gracell Biotechnologies Holdings Limited (“Gracell BVI”) |
British Virgin Islands | % | ||||||||
| Gracell Biotechnologies (HK) Limited (“Gracell HK”) |
Hong Kong | % | ||||||||
| Gracell Bioscience (Shanghai) Co., Ltd. |
The PRC | % | ||||||||
| Gracell Biopharmaceuticals, Inc. |
The United States of America | % | ||||||||
| Gracell Biomedicine (Shanghai) Co., Ltd. |
The PRC | % | ||||||||
| Hainan Gracell Biomedicine Co., Ltd. |
The PRC | % | ||||||||
| Suzhou Gracell Bioscience Co., Ltd. |
The PRC | % | ||||||||
| VIE |
||||||||||
| Gracell Biotechnologies (Shanghai) Co., Ltd. |
The PRC | — | ||||||||
| VIE’s subsidiary |
||||||||||
| Suzhou Gracell Biotechnologies Co., Ltd. (“Suzhou Gracell”) |
The PRC | — | ||||||||
| • | revoking the business licenses and/or operating licenses of such entities; |
| • | discontinuing or placing restrictions or onerous conditions on the Group’s operation through any transactions between the PRC subsidiary and the VIE; |
| • | imposing fines, confiscating the income from the PRC subsidiary or the VIE, or imposing other requirements with which the VIE may not be able to comply; |
| • | requiring the Group to restructure the ownership structure or operations, including terminating the contractual arrangements with the VIE and deregistering the equity pledges of the VIE, which in turn would affect the Group’s ability to consolidate, derive economic interests from, or exert effective control over the VIE; |
| • | restricting or prohibiting the Group’s use of the proceeds of the publ offering to finance the Group’s business and operations in China; or ic |
| • | taking other regulatory or enforcement actions that could be harmful to the Group’s business. |
As of December 31, |
||||||||||||
2020 |
2021 |
|||||||||||
RMB |
RMB |
US$ |
||||||||||
(Note 2) |
||||||||||||
ASSETS |
||||||||||||
Current assets: |
||||||||||||
Cash and cash equivalents |
||||||||||||
Short-term investments |
||||||||||||
Amounts due from Group c ompanies |
||||||||||||
Prepayments and other current assets |
||||||||||||
Total current assets |
||||||||||||
Property, equipment and software |
||||||||||||
Operating lease, right-of-use |
— |
|||||||||||
Other non-current assets |
||||||||||||
TOTAL ASSETS |
||||||||||||
LIABILITIES |
||||||||||||
Current liabilities: |
||||||||||||
Amounts due to related parties |
||||||||||||
Accruals and other current liabilities |
||||||||||||
Short-term borrowings |
||||||||||||
Operating lease liabilities, current |
||||||||||||
Current portion of long-term borrowings |
||||||||||||
Total current liabilities |
||||||||||||
Amounts due to Group c ompanies |
||||||||||||
Long-term borrowings |
||||||||||||
Operating lease liabilities, non-current |
||||||||||||
TOTAL LIABILITIES |
||||||||||||
For the years ended December 31, |
||||||||||||||||
2019 |
2020 |
2021 |
||||||||||||||
RMB |
RMB |
RMB |
US$ |
|||||||||||||
(Note 2) |
||||||||||||||||
Total revenue from Group c ompanies |
||||||||||||||||
Net loss |
( |
) |
( |
) |
( |
) |
( |
) | ||||||||
For the years ended December 31, |
||||||||||||||||
2019 |
2020 |
2021 |
||||||||||||||
RMB |
RMB |
RMB |
US$ |
|||||||||||||
(Note 2) |
||||||||||||||||
Net cash used in operating activities |
( |
) |
( |
) |
( |
) |
( |
) | ||||||||
Net cash generated from (used in) investing activities |
( |
) |
( |
) |
( |
) | ||||||||||
Net cash generated from financing activities |
||||||||||||||||
Category |
Estimated Useful Life | |
| Machinery and laboratory equipment | ||
| Vehicles | ||
| Furniture and tools | ||
| Electronic equipment | ||
| Computer software | ||
| Leasehold improvements |
As of December 31, |
||||||||||||
2020 |
2021 |
|||||||||||
RMB |
RMB |
US$ |
||||||||||
(Note 2) |
||||||||||||
Deductible value-added tax input |
||||||||||||
Prepayments for CRO and other services |
||||||||||||
Deposits |
||||||||||||
Others |
||||||||||||
As of December 31, |
||||||||||||
2020 |
2021 |
|||||||||||
RMB |
RMB |
US$ |
||||||||||
(Note 2) |
||||||||||||
Machinery and laboratory equipment |
||||||||||||
Leasehold improvements |
||||||||||||
Construction in Progress |
||||||||||||
Vehicles |
||||||||||||
Others |
||||||||||||
Total property, equipment and software |
||||||||||||
Less: accumulated depreciation and amortization |
( |
) | ( |
) | ( |
) | ||||||
Property, equipment and software, net |
||||||||||||
As of December 31, |
||||||||||||
2020 |
2021 |
|||||||||||
RMB |
RMB |
US$ |
||||||||||
(Note 2) |
||||||||||||
Assets |
||||||||||||
Operating lease right-of-use |
||||||||||||
Liabilities |
||||||||||||
Operating lease liabilities, current |
||||||||||||
Operating lease liabilities, non-current |
||||||||||||
RMB |
US$ |
|||||||
(Note 2) |
||||||||
For the years ending: |
||||||||
2022 |
||||||||
2023 |
||||||||
2024 |
||||||||
2025 |
||||||||
2026 and thereafter |
||||||||
Total undiscounted lease payments |
||||||||
Less: imputed interest |
( |
) | ( |
) | ||||
Total lease liabilities |
||||||||
As of December 31, |
||||||||
2021 |
||||||||
RMB |
US$ |
|||||||
Lease cost |
(Note 2) |
|||||||
Operating lease cost |
||||||||
Short-term lease cost |
||||||||
Total lease cost |
||||||||
Other information |
||||||||
Cash paid for amounts included in the measurement of lease liabilities |
||||||||
Right-of-use assets obtained in exchange for new operating lease liabilities |
||||||||
Weighted-average remaining lease term |
||||||||
Weighted-average discount rate |
% |
% | ||||||
RMB |
||||
For the years ending: |
||||
2021 |
||||
2022 |
||||
2023 |
||||
2024 |
||||
2025 and thereafter |
||||
Total |
||||
As of December 31, |
||||||||||||
2020 |
2021 |
|||||||||||
RMB |
RMB |
US$ |
||||||||||
(Note 2) |
||||||||||||
Prepayment for property, equipment and software |
||||||||||||
Long-term deposit |
||||||||||||
As of December 31, |
|||||||||||||
2020 |
2021 |
||||||||||||
RMB |
RMB |
US$ |
|||||||||||
(Note 2) |
|||||||||||||
Accrued external research and development related expenses |
|||||||||||||
Salary and welfare payables |
|||||||||||||
Professional service fees |
|||||||||||||
Deferred income for reimbursement of the expenses related to the establishment of the ADS facility |
|||||||||||||
Rental fees |
|||||||||||||
Others |
|||||||||||||
As of December 31, |
||||||||||||
2020 |
2021 |
|||||||||||
RMB |
RMB |
US$ |
||||||||||
(Note 2) |
||||||||||||
Current |
||||||||||||
Short-term borrowings: |
||||||||||||
Bank loans |
||||||||||||
Current portion of long-term borrowings |
||||||||||||
Total current borrowings |
||||||||||||
Non-Current |
||||||||||||
Long-term borrowings: |
||||||||||||
Bank loans |
||||||||||||
Total non-current borrowings |
||||||||||||
Total borrowings |
||||||||||||
| Mezzanine equity |
Series A |
Series B-1 |
Series B-2 |
Series C |
Total |
||||||||||||||||
RMB |
RMB |
RMB |
RMB |
RMB |
|||||||||||||||||
| Balance as of December 31, 2018 |
— | — | — | ||||||||||||||||||
| Issuance of Series B-2 Preferred Shares |
— | — | — | ||||||||||||||||||
| Repurchase of Series A Preferred Shares |
( |
) | — | — | — | ( |
) |
||||||||||||||
| Accretion of Series A Preferred Shares to redemption value |
— | — | — | ||||||||||||||||||
| Accretion of Series B-2 Preferred Shares to redemption value |
— | — | — | ||||||||||||||||||
| |
|
|
|
|
|
|
|
|
|
||||||||||||
| Balance as of December 31, 2019 |
— | — | |||||||||||||||||||
| Issuance of Series B-1 Preferred Shares |
— | — | — | ||||||||||||||||||
| Issuance of Series C Preferred Shares |
— | — | — | ||||||||||||||||||
| Accretion of Series A Preferred Shares to redemption value |
— | — | — | ||||||||||||||||||
| Accretion of Series B-1 Preferred Shares to redemption value |
— | — | — | ||||||||||||||||||
| Accretion of Series B-2 Preferred Shares to redemption value |
— | — | — | ||||||||||||||||||
| Accretion of Series C Preferred Shares to redemption value |
— | — | — | ||||||||||||||||||
| |
|
|
|
|
|
|
|
|
|
||||||||||||
| Balance as of December 31, 2020 |
|||||||||||||||||||||
| Accretion of Series A Preferred Shares to redemption value |
— | — | — | ||||||||||||||||||
| Accretion of Series B-1 Preferred Shares to redemption value |
— | — | — | ||||||||||||||||||
| Accretion of Series B-2 Preferred Shares to redemption value |
— | — | — | ||||||||||||||||||
| Accretion of Series C Preferred Shares to redemption value |
— | — | — | | |||||||||||||||||
| Conversion of preferred shares to ordinary shares upon the IPO |
( |
) |
( |
) |
( |
) |
( |
) |
( |
) |
|||||||||||
| |
|
|
|
|
|
|
|
|
|
||||||||||||
| Balance as of December 31, 2021 |
|||||||||||||||||||||
| |
|
|
|
|
|
|
|
|
|
||||||||||||
Number of Options |
Weighted–Average Exercise Price |
Weighted–Average Grant Date Fair Value |
Weighted–Average Remaining Contractual Term |
Aggregate Intrinsic Value |
|||||||||||||||||||
US$ per option |
US$ per option |
RMB per option |
Years |
RMB |
||||||||||||||||||||
| Outstanding at January 1, 2019 |
||||||||||||||||||||||||
| Granted |
— | — | ||||||||||||||||||||||
| Forfeited |
( |
) | — | |||||||||||||||||||||
| |
|
|
|
|
|
|
|
|
|
|
|
|||||||||||||
| Outstanding at January 1, 2020 |
||||||||||||||||||||||||
| Granted |
— | — | ||||||||||||||||||||||
| Forfeited |
( |
) | — | |||||||||||||||||||||
| |
|
|
|
|
|
|
|
|
|
|
|
|||||||||||||
| Outstanding at January 1, 2021 |
||||||||||||||||||||||||
| Granted |
— | — | ||||||||||||||||||||||
| Forfeited |
( |
) | — | — | ||||||||||||||||||||
| Exercised |
( |
) | — | — | ||||||||||||||||||||
| |
|
|
|
|
|
|
|
|
|
|
|
|||||||||||||
| Outstanding at December 31, 2021 |
||||||||||||||||||||||||
| |
|
|
|
|
|
|
|
|
|
|
|
|||||||||||||
| Vested and expected to vest at December 31, 2021 |
||||||||||||||||||||||||
| |
|
|
|
|
|
|
|
|
|
|
|
|||||||||||||
| Exercisable at December 31, 2021 |
||||||||||||||||||||||||
| |
|
|
|
|
|
|
|
|
|
|
|
|||||||||||||
For the year ended December 31, 2019 |
For the year ended December 31, 2020 |
For the year ended December 31, 2021 |
||||||||||
| Risk-free interest rate |
||||||||||||
| Dividend yield |
||||||||||||
| Expected volatility range |
||||||||||||
| Exercise multiple |
||||||||||||
| Contractual life |
||||||||||||
As of December 31, |
||||||||
2021 |
||||||||
RMB |
US$ (Note 2) |
|||||||
| Research and development expenses |
||||||||
| Administrative expenses |
||||||||
| |
|
|
|
|||||
| |
|
|
|
|||||
For the years ended December 31, |
||||||||||||||||
2019 |
2020 |
2021 |
||||||||||||||
RMB |
RMB |
RMB |
US$ |
|||||||||||||
(Note 2) |
||||||||||||||||
| Loss before income tax |
( |
) | ( |
) | ( |
) | ( |
) | ||||||||
| Income tax computed at respective applicable tax rate |
( |
) | ( |
) | ( |
) | ( |
) | ||||||||
| Research and development super-deduction |
( |
) | ( |
) | ( |
) | ( |
) | ||||||||
| Non-deductible expenses |
||||||||||||||||
| Changes in valuation allowance |
||||||||||||||||
| |
|
|
|
|
|
|
|
|||||||||
| Income tax expense |
||||||||||||||||
| |
|
|
|
|
|
|
|
|||||||||
For the years ended December 31, |
||||||||||||
2020 |
2021 |
|||||||||||
RMB |
RMB |
US$ |
||||||||||
(Note 2) |
||||||||||||
| Deferred tax assets: |
||||||||||||
| Net operating loss carry forward |
||||||||||||
| Capitalized Inventory |
— | |||||||||||
| Depreciation and amortization of property, equipment and software |
||||||||||||
| Share-based compensation expenses and others |
— | |||||||||||
| |
|
|
|
|
|
|||||||
| Gross deferred tax assets |
||||||||||||
| Less: valuation allowance |
( |
) | ( |
) | ( |
) | ||||||
| |
|
|
|
|
|
|||||||
| Total deferred tax assets, net |
||||||||||||
| |
|
|
|
|
|
|||||||
For the years ended December 31, |
||||||||||||
2020 |
2021 |
|||||||||||
RMB |
RMB |
US$ |
||||||||||
(Note 2) |
||||||||||||
| Balance as of January 1 |
||||||||||||
| Addition |
||||||||||||
| |
|
|
|
|
|
|||||||
| Balance as of December 31 |
||||||||||||
For the years ended December 31, |
||||||||||||||||
2019 |
2020 |
2021 |
||||||||||||||
RMB |
RMB |
RMB |
US$ |
|||||||||||||
(Note 2) |
||||||||||||||||
| Numerator: |
||||||||||||||||
| Net loss attributable to Gracell Biotechnologies Inc.’s shareholders |
( |
) | ( |
) | ( |
) | ( |
) | ||||||||
| Deemed dividend to convertible redeemable preferred shareholders |
( |
) | — | — | — | |||||||||||
| Accretion of convertible redeemable preferred shares to redemption value |
( |
) | ( |
) | ( |
) | ( |
) | ||||||||
| |
|
|
|
|
|
|
|
|||||||||
| Net loss attributable to Gracell Biotechnologies Inc.’s ordinary shareholders |
( |
) | ( |
) | ( |
) | ( |
) | ||||||||
| Denominator: |
||||||||||||||||
| Weighted-average number of ordinary shares outstanding—basic and diluted |
||||||||||||||||
| Net loss per share attributable to Gracell Biotechnologies Inc.’s ordinary shareholders—basic and diluted |
( |
) | ( |
) | ( |
) | ( |
) | ||||||||
For the years ended December 31, |
||||||||||||
2019 |
2020 |
2021 |
||||||||||
shares |
shares |
shares |
||||||||||
Convertible redeemable preferred shares |
||||||||||||
Share options and RSUs |
— |
— |
||||||||||
Name of related parties |
Relationship | |
William Wei Cao |
||
Unitex Capital Ltd. |
For the years ended December 31, |
||||||||||||||||
2019 |
2020 |
2021 |
||||||||||||||
RMB |
RMB |
RMB |
US$ |
|||||||||||||
(Note 2) |
||||||||||||||||
Payment for in-licensing arrangement |
||||||||||||||||
Unitex Capital Ltd (a) |
— | — | — | |||||||||||||
Payment for professional service fee |
||||||||||||||||
Unitex Capital Ltd (b) |
— | |||||||||||||||