Hippo Holdings (NYSE: HIPO) Consolidated Line of Business Reporting 1Q2024 to 3Q2025 1
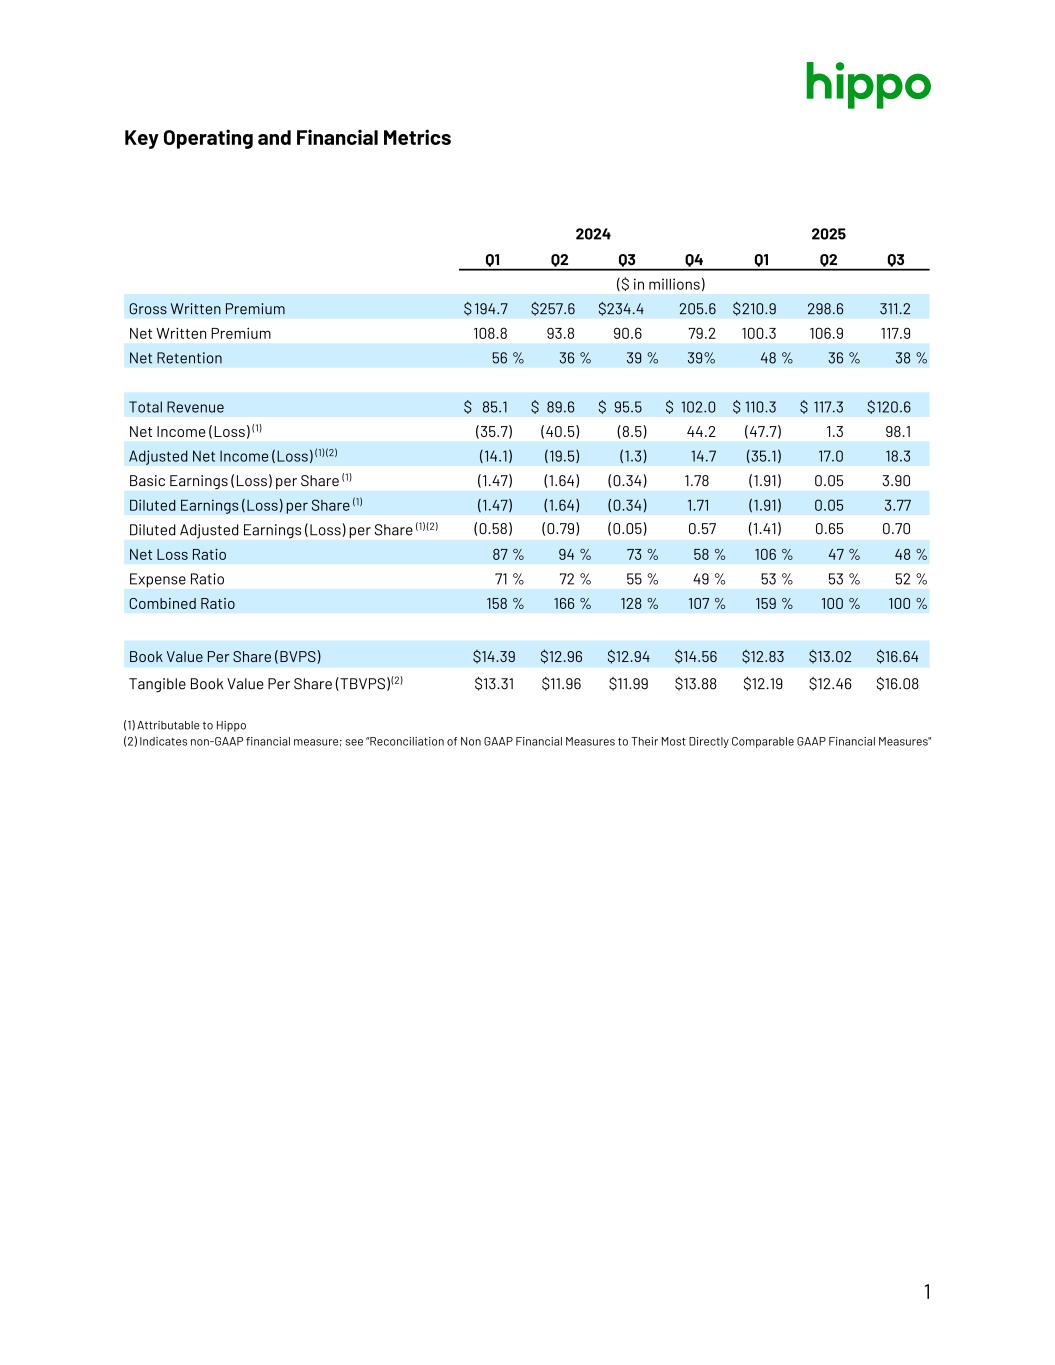
Key Operating and Financial Metrics 2024 2025 Q1 Q2 Q3 Q4 Q1 Q2 Q3 ($ in millions) Gross Written Premium $ 194.7 $ 257.6 $ 234.4 205.6 $ 210.9 298.6 311.2 Net Written Premium 108.8 93.8 90.6 79.2 100.3 106.9 117.9 Net Retention 56 % 36 % 39 % 39 % 48 % 36 % 38 % Total Revenue $ 85.1 $ 89.6 $ 95.5 $ 102.0 $ 110.3 $ 117.3 $ 120.6 Net Income (Loss) (1) (35.7) (40.5) (8.5) 44.2 (47.7) 1.3 98.1 Adjusted Net Income (Loss) (1) (2) (14.1) (19.5) (1.3) 14.7 (35.1) 17.0 18.3 Basic Earnings (Loss) per Share (1) (1.47) (1.64) (0.34) 1.78 (1.91) 0.05 3.90 Diluted Earnings (Loss) per Share (1) (1.47) (1.64) (0.34) 1.71 (1.91) 0.05 3.77 Diluted Adjusted Earnings (Loss) per Share (1) (2) (0.58) (0.79) (0.05) 0.57 (1.41) 0.65 0.70 Net Loss Ratio 87 % 94 % 73 % 58 % 106 % 47 % 48 % Expense Ratio 71 % 72 % 55 % 49 % 53 % 53 % 52 % Combined Ratio 158 % 166 % 128 % 107 % 159 % 100 % 100 % Book Value Per Share (BVPS) $14.39 $12.96 $12.94 $14.56 $12.83 $13.02 $16.64 Tangible Book Value Per Share (TBVPS) (2) $13.31 $11.96 $11.99 $13.88 $12.19 $12.46 $16.08 (1) Attributable to Hippo (2) Indicates non-GAAP financial measure; see “Reconciliation of Non GAAP Financial Measures to Their Most Directly Comparable GAAP Financial Measures" 1
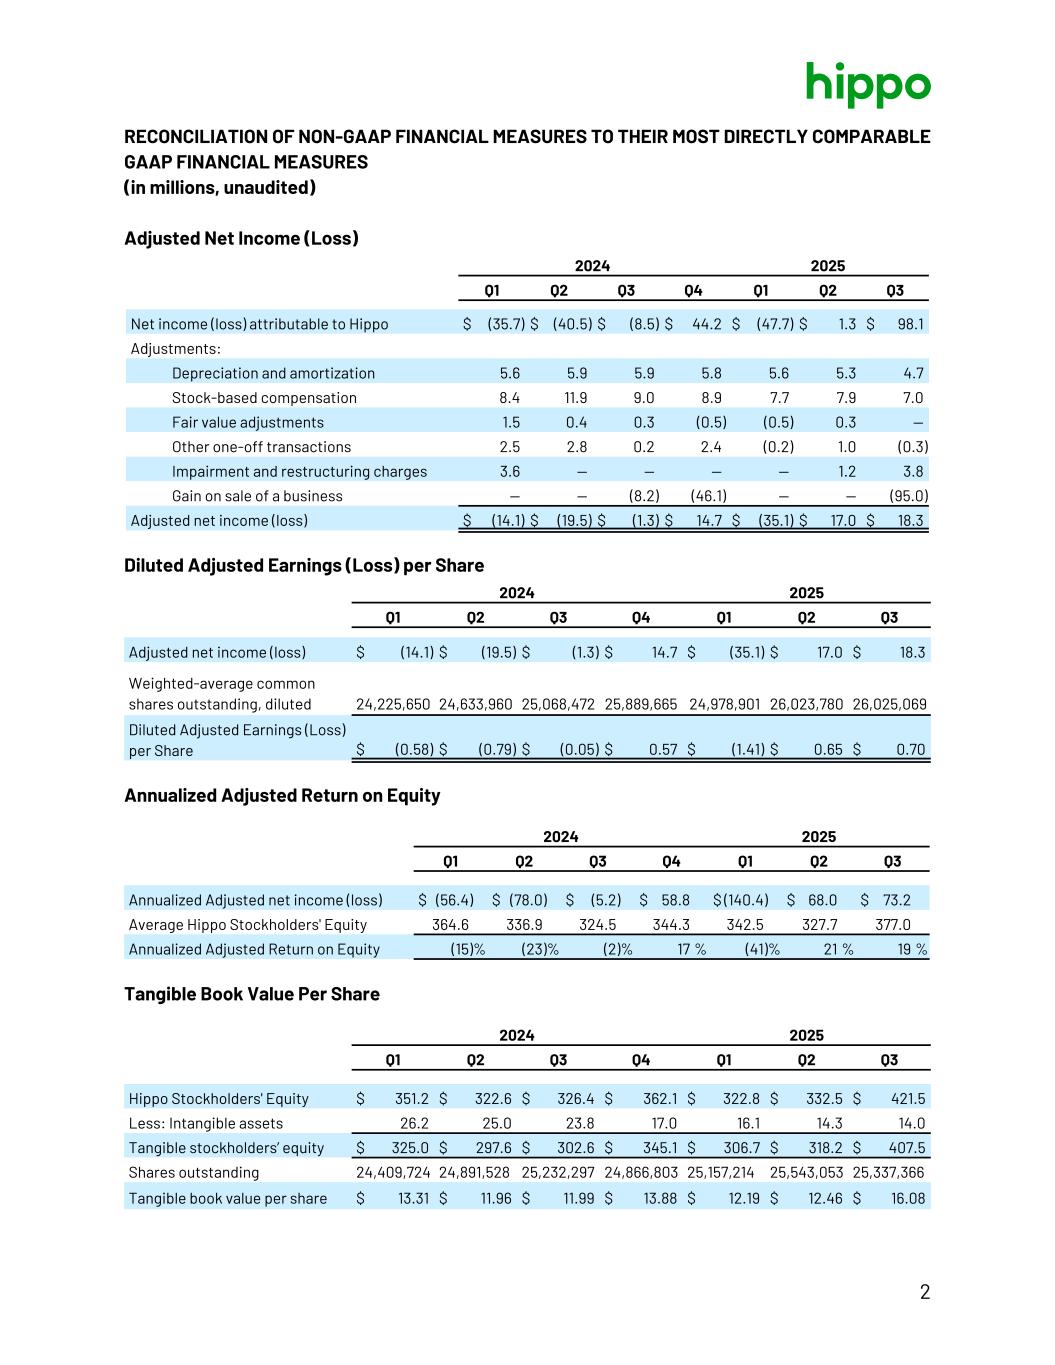
RECONCILIATION OF NON-GAAP FINANCIAL MEASURES TO THEIR MOST DIRECTLY COMPARABLE GAAP FINANCIAL MEASURES (in millions, unaudited) Adjusted Net Income (Loss) 2024 2025 Q1 Q2 Q3 Q4 Q1 Q2 Q3 Net income (loss) attributable to Hippo $ (35.7) $ (40.5) $ (8.5) $ 44.2 $ (47.7) $ 1.3 $ 98.1 Adjustments: Depreciation and amortization 5.6 5.9 5.9 5.8 5.6 5.3 4.7 Stock-based compensation 8.4 11.9 9.0 8.9 7.7 7.9 7.0 Fair value adjustments 1.5 0.4 0.3 (0.5) (0.5) 0.3 — Other one-off transactions 2.5 2.8 0.2 2.4 (0.2) 1.0 (0.3) Impairment and restructuring charges 3.6 — — — — 1.2 3.8 Gain on sale of a business — — (8.2) (46.1) — — (95.0) Adjusted net income (loss) $ (14.1) $ (19.5) $ (1.3) $ 14.7 $ (35.1) $ 17.0 $ 18.3 Diluted Adjusted Earnings (Loss) per Share 2024 2025 Q1 Q2 Q3 Q4 Q1 Q2 Q3 Adjusted net income (loss) $ (14.1) $ (19.5) $ (1.3) $ 14.7 $ (35.1) $ 17.0 $ 18.3 Weighted-average common shares outstanding, diluted 24,225,650 24,633,960 25,068,472 25,889,665 24,978,901 26,023,780 26,025,069 Diluted Adjusted Earnings (Loss) per Share $ (0.58) $ (0.79) $ (0.05) $ 0.57 $ (1.41) $ 0.65 $ 0.70 Annualized Adjusted Return on Equity 2024 2025 Q1 Q2 Q3 Q4 Q1 Q2 Q3 Annualized Adjusted net income (loss) $ (56.4) $ (78.0) $ (5.2) $ 58.8 $ (140.4) $ 68.0 $ 73.2 Average Hippo Stockholders' Equity 364.6 336.9 324.5 344.3 342.5 327.7 377.0 Annualized Adjusted Return on Equity (15) % (23) % (2) % 17 % (41) % 21 % 19 % Tangible Book Value Per Share 2024 2025 Q1 Q2 Q3 Q4 Q1 Q2 Q3 Hippo Stockholders' Equity $ 351.2 $ 322.6 $ 326.4 $ 362.1 $ 322.8 $ 332.5 $ 421.5 Less: Intangible assets 26.2 25.0 23.8 17.0 16.1 14.3 14.0 Tangible stockholders’ equity $ 325.0 $ 297.6 $ 302.6 $ 345.1 $ 306.7 $ 318.2 $ 407.5 Shares outstanding 24,409,724 24,891,528 25,232,297 24,866,803 25,157,214 25,543,053 25,337,366 Tangible book value per share $ 13.31 $ 11.96 $ 11.99 $ 13.88 $ 12.19 $ 12.46 $ 16.08 2
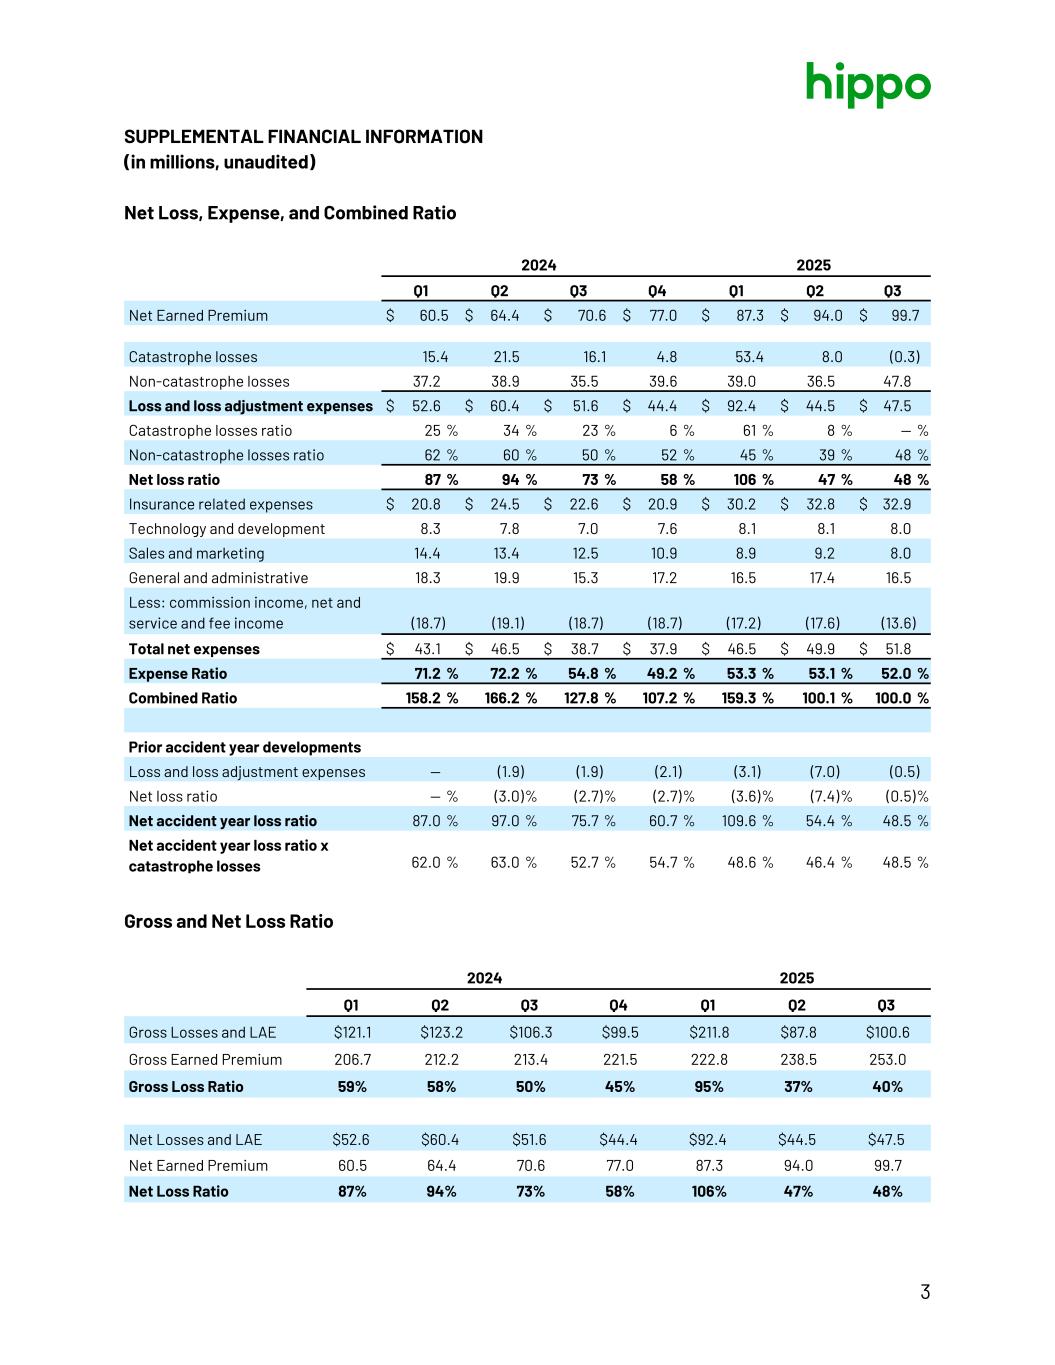
SUPPLEMENTAL FINANCIAL INFORMATION (in millions, unaudited) Net Loss, Expense, and Combined Ratio 2024 2025 Q1 Q2 Q3 Q4 Q1 Q2 Q3 Net Earned Premium $ 60.5 $ 64.4 $ 70.6 $ 77.0 $ 87.3 $ 94.0 $ 99.7 Catastrophe losses 15.4 21.5 16.1 4.8 53.4 8.0 (0.3) Non-catastrophe losses 37.2 38.9 35.5 39.6 39.0 36.5 47.8 Loss and loss adjustment expenses $ 52.6 $ 60.4 $ 51.6 $ 44.4 $ 92.4 $ 44.5 $ 47.5 Catastrophe losses ratio 25 % 34 % 23 % 6 % 61 % 8 % — % Non-catastrophe losses ratio 62 % 60 % 50 % 52 % 45 % 39 % 48 % Net loss ratio 87 % 94 % 73 % 58 % 106 % 47 % 48 % Insurance related expenses $ 20.8 $ 24.5 $ 22.6 $ 20.9 $ 30.2 $ 32.8 $ 32.9 Technology and development 8.3 7.8 7.0 7.6 8.1 8.1 8.0 Sales and marketing 14.4 13.4 12.5 10.9 8.9 9.2 8.0 General and administrative 18.3 19.9 15.3 17.2 16.5 17.4 16.5 Less: commission income, net and service and fee income (18.7) (19.1) (18.7) (18.7) (17.2) (17.6) (13.6) Total net expenses $ 43.1 $ 46.5 $ 38.7 $ 37.9 $ 46.5 $ 49.9 $ 51.8 Expense Ratio 71.2 % 72.2 % 54.8 % 49.2 % 53.3 % 53.1 % 52.0 % Combined Ratio 158.2 % 166.2 % 127.8 % 107.2 % 159.3 % 100.1 % 100.0 % Prior accident year developments Loss and loss adjustment expenses — (1.9) (1.9) (2.1) (3.1) (7.0) (0.5) Net loss ratio — % (3.0) % (2.7) % (2.7) % (3.6) % (7.4) % (0.5) % Net accident year loss ratio 87.0 % 97.0 % 75.7 % 60.7 % 109.6 % 54.4 % 48.5 % Net accident year loss ratio x catastrophe losses 62.0 % 63.0 % 52.7 % 54.7 % 48.6 % 46.4 % 48.5 % Gross and Net Loss Ratio 2024 2025 Q1 Q2 Q3 Q4 Q1 Q2 Q3 Gross Losses and LAE $121.1 $123.2 $106.3 $99.5 $211.8 $87.8 $100.6 Gross Earned Premium 206.7 212.2 213.4 221.5 222.8 238.5 253.0 Gross Loss Ratio 59% 58% 50% 45% 95% 37% 40% Net Losses and LAE $52.6 $60.4 $51.6 $44.4 $92.4 $44.5 $47.5 Net Earned Premium 60.5 64.4 70.6 77.0 87.3 94.0 99.7 Net Loss Ratio 87% 94% 73% 58% 106% 47% 48% 3
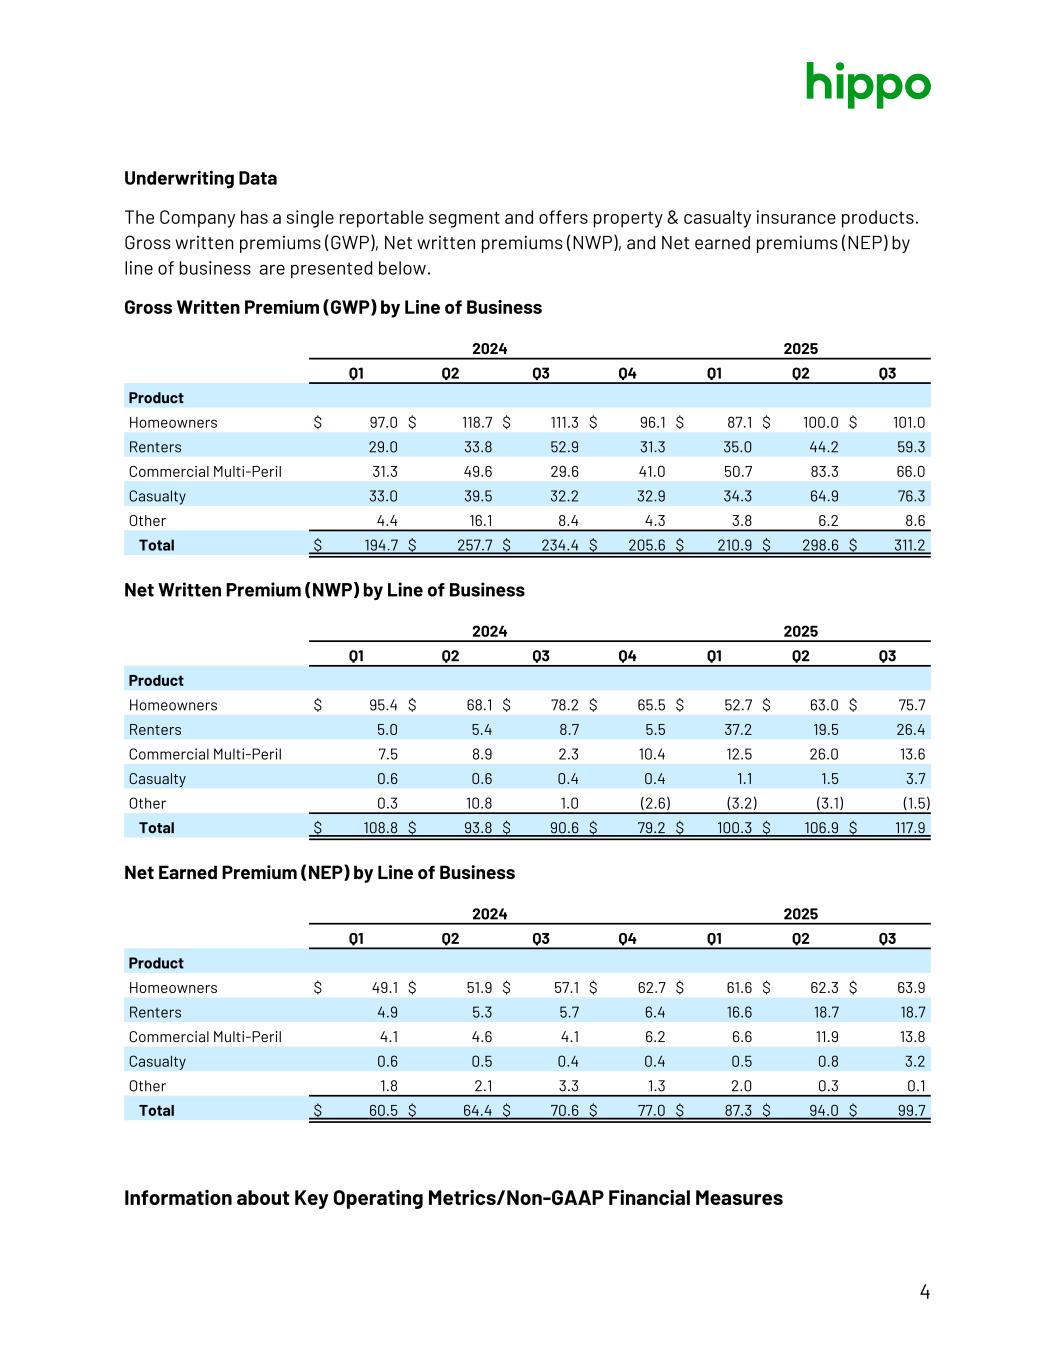
Underwriting Data The Company has a single reportable segment and offers property & casualty insurance products. Gross written premiums (GWP), Net written premiums (NWP), and Net earned premiums (NEP) by line of business are presented below. Gross Written Premium (GWP) by Line of Business 2024 2025 Q1 Q2 Q3 Q4 Q1 Q2 Q3 Product Homeowners $ 97.0 $ 118.7 $ 111.3 $ 96.1 $ 87.1 $ 100.0 $ 101.0 Renters 29.0 33.8 52.9 31.3 35.0 44.2 59.3 Commercial Multi-Peril 31.3 49.6 29.6 41.0 50.7 83.3 66.0 Casualty 33.0 39.5 32.2 32.9 34.3 64.9 76.3 Other 4.4 16.1 8.4 4.3 3.8 6.2 8.6 Total $ 194.7 $ 257.7 $ 234.4 $ 205.6 $ 210.9 $ 298.6 $ 311.2 Net Written Premium (NWP) by Line of Business 2024 2025 Q1 Q2 Q3 Q4 Q1 Q2 Q3 Product Homeowners $ 95.4 $ 68.1 $ 78.2 $ 65.5 $ 52.7 $ 63.0 $ 75.7 Renters 5.0 5.4 8.7 5.5 37.2 19.5 26.4 Commercial Multi-Peril 7.5 8.9 2.3 10.4 12.5 26.0 13.6 Casualty 0.6 0.6 0.4 0.4 1.1 1.5 3.7 Other 0.3 10.8 1.0 (2.6) (3.2) (3.1) (1.5) Total $ 108.8 $ 93.8 $ 90.6 $ 79.2 $ 100.3 $ 106.9 $ 117.9 Net Earned Premium (NEP) by Line of Business 2024 2025 Q1 Q2 Q3 Q4 Q1 Q2 Q3 Product Homeowners $ 49.1 $ 51.9 $ 57.1 $ 62.7 $ 61.6 $ 62.3 $ 63.9 Renters 4.9 5.3 5.7 6.4 16.6 18.7 18.7 Commercial Multi-Peril 4.1 4.6 4.1 6.2 6.6 11.9 13.8 Casualty 0.6 0.5 0.4 0.4 0.5 0.8 3.2 Other 1.8 2.1 3.3 1.3 2.0 0.3 0.1 Total $ 60.5 $ 64.4 $ 70.6 $ 77.0 $ 87.3 $ 94.0 $ 99.7 Information about Key Operating Metrics/Non-GAAP Financial Measures 4
We define adjusted net income, a Non-GAAP financial measure, as net income excluding the impact of certain items that may not be indicative of underlying business trends, operating results, or future outlook, net of tax impact. We calculate the tax impact only on adjustments which would be included in calculating our income tax expense using the estimated tax rate at which the company received a deduction for these adjustments. We use adjusted net income as an internal performance measure in the management of our operations because we believe it gives our management and financial statement users useful insight into our results of operations and our underlying business performance. Adjusted net income does not reflect the overall profitably of our business and should not be viewed as a substitute for net income calculated in accordance with GAAP. Other companies may define adjusted net income differently. We define diluted adjusted earnings (loss) per share, a Non-GAAP financial measure, as adjusted net income divided by the weighted-average common shares outstanding for the period, reflecting the dilution which could occur if equity-based awards are converted into common share equivalents as calculated using the treasury stock method. Diluted adjusted earnings (loss) per share should not be viewed as a substitute for diluted earnings (loss) per share calculated in accordance with GAAP. Other companies may define diluted adjusted earnings (loss) per share differently. We define annualized adjusted return on equity, a Non-GAAP financial measure, as adjusted net income (loss) expressed on an annualized basis as a percentage of average beginning and ending Hippo stockholders’ equity during the period. We use annualized adjusted return on equity as an internal performance measure in the management of our operations because we believe it gives our management and financial statement users useful insight into our results of operations and our underlying business performance. Annualized adjusted return on equity should not be viewed as a substitute for return on equity calculated in accordance with GAAP. Other companies may define annualized adjusted return on equity differently. We define tangible book value per share, a Non-GAAP financial measure, as total stockholders’ equity, less intangible assets, divided by the outstanding number of shares of our common stock at the end of the relevant period. Our definition of tangible book value per share may not be comparable to that of other companies, and it should not be viewed as a substitute for book value per share calculated in accordance with GAAP. We use tangible book value per share internally to evaluate changes from period to period in book value per share exclusive of changes in intangible assets. These Non-GAAP financial measures are in addition to, and not a substitute for, or superior to, measures of financial performance prepared in accordance with GAAP and should not be considered as an alternative to net income, operating income or any other performance measures derived in accordance with GAAP. Reconciliations of these Non- 5
GAAP financial measures to their most directly comparable GAAP counterpart is included above. We believe that these non-GAAP measures of financial results provide useful supplemental information to investors about Hippo. Forward-looking statements safe harbor Certain statements included in this press release that are not historical facts are forward- looking statements for purposes of the safe harbor provisions under the United States Private Securities Litigation Reform Act of 1995. Forward-looking statements generally are accompanied by words such as "believe," "may," "will," "estimate," "continue," "anticipate," "intend," "expect," "should," "would," "plan," "predict," "potential," "seem," "seek," "future," "outlook," and similar expressions that predict or indicate future events or trends or that are not statements of historical matters. These forward-looking statements include, but are not limited to, statements regarding estimates and forecasts of financial results and other operating and performance metrics, our business strategy, our cost reduction efforts, the quality of our products and services, and the potential growth of our business. These statements are based on the current expectations of Hippo's management and are not predictions of actual performance. Actual events and circumstances are difficult or impossible to predict and will differ from assumptions, and many actual events and circumstances are beyond the control of Hippo. These forward- looking statements are subject to a number of risks and uncertainties, including our ability to navigate extensive insurance industry regulations and the scrutiny of state insurance regulators, our ability to achieve or maintain profitability in the future; our ability to retain and expand our customer base and grow our business, including our builder network; our ability to manage growth effectively; risks relating to Hippo's brand and brand reputation; denial of claims or our failure to accurately and timely pay claims; the effects of intense competition in the segments of the insurance industry in which we operate; the availability and adequacy of reinsurance, including at current coverage, limits or pricing; our ability to underwrite risks accurately and charge competitive yet profitable rates to our customers, and the sufficiency of the analytical models we use to assess and predict exposure to catastrophe losses; risks related to our proprietary technology and our digital platform; outages or interruptions or delays in services provided by our third party providers, including our data vendors; risks related to our intellectual property; the seasonal and cyclical nature of our business; the effects of severe weather events and other natural or man-made catastrophes, including the effects of climate change, global pandemics, and terrorism; any overall decline in economic activity; regulators' identification of errors in the policy forms we use, the rates we charge, and our customer communications including, but not limited to, cancellations, non-renewals and reinstatements through market conducts, complaints, or other inquiries; the effects of existing or new legal or regulatory requirements on our business, including with respect to maintenance of risk- based capital and financial strength ratings, data privacy and cybersecurity, and the 6
insurance industry generally; and other risks set forth in the sections entitled "Risk Factors" in our Annual Report on Form 10-K and Quarterly Reports on Form 10-Q. If any of these risks materialize or our assumptions prove incorrect, actual results could differ materially from the results implied by these forward-looking statements. There may be additional risks that Hippo does not presently know, or that Hippo currently believes are immaterial, that could also cause actual results to differ from those contained in the forward-looking statements. In addition, forward-looking statements reflect Hippo's expectations, plans, or forecasts of future events and views as of the date of this press release. Hippo anticipates that subsequent events and developments will cause Hippo's assessments to change. However, while Hippo may elect to update these forward-looking statements at some point in the future, Hippo specifically disclaims any obligation to do so. These forward-looking statements should not be relied upon as representing Hippo's assessments of any date subsequent to the date of this press release. Accordingly, undue reliance should not be placed upon the forward-looking statements. Contacts Investors: Charles Sebaski Investors@hippo.com Press: Mark Olson press@hippo.com 7