.3
Management’s Discussion and Analysis of
Triple Flag Precious Metals Corp.
For the three months and year ended December 31, 2025
(Expressed in United States Dollars)
.3
Management’s Discussion and Analysis of
Triple Flag Precious Metals Corp.
For the three months and year ended December 31, 2025
(Expressed in United States Dollars)
MANAGEMENT’S DISCUSSION AND ANALYSIS OF
FINANCIAL CONDITION AND RESULTS OF OPERATIONS
This Management’s Discussion and Analysis (‘‘MD&A’’) is intended to help the reader understand Triple Flag Precious Metals Corp. (‘‘TF Precious Metals’’), its operations, financial performance and the present and anticipated future business environment. This MD&A, which has been prepared as of February 18, 2026, should be read in conjunction with the audited consolidated financial statements of TF Precious Metals for the years ended December 31, 2025 and 2024 (the “Annual Financial Statements”), which have been prepared in accordance with International Financial Reporting Standards as issued by the International Accounting Standards Board (“IFRS Accounting Standards”). Certain notes to the Annual Financial Statements are specifically referred to in this MD&A. All amounts in this MD&A are in U.S. dollars unless otherwise indicated. References to “US$”, “$” or “dollars” are to United States dollars, references to “C$” are to Canadian dollars and references to “A$” are to Australian dollars. In this MD&A, all references to “Triple Flag”, the “Company’’, ‘‘we’’, ‘‘us’’ or ‘‘our’’ refer to TF Precious Metals together with its subsidiaries, on a consolidated basis.
This MD&A contains forward-looking information. Forward-looking information is necessarily based on a number of opinions, estimates and assumptions that we considered appropriate and reasonable as of the date such statements were made, and are subject to known and unknown risks, uncertainties, assumptions and other factors that may cause the actual results, level of activity, performance or achievements to be materially different from those expressed or implied by such forward-looking information, including but not limited to the risk factors described in the ‘‘Risk Factors” section of the Company’s most recent annual information form available from time to time on SEDAR+ at www.sedarplus.ca and on EDGAR at www.sec.gov. There can be no assurance that such forward-looking information will prove to be accurate, as actual results and future events could differ materially from those anticipated in such information. Accordingly, users should not place undue reliance on forward-looking information, which speaks only as of the date made. See ‘‘Forward-Looking Information’’ in this MD&A.
2
4 | |
5 | |
7 | |
7 | |
8 | |
Portfolio of Streaming and Related Interests and Royalty Interests | 8 |
11 | |
13 | |
17 | |
18 | |
20 | |
27 | |
28 | |
29 | |
31 | |
33 | |
33 | |
IFRS Accounting Standards Critical Accounting Policies and Accounting Estimates | 34 |
36 | |
40 | |
41 | |
42 | |
42 |
3
Triple Flag is a precious metals streaming and royalty company. We offer investors exposure to gold and silver, primarily from the Americas and Australia. Our mission is to be a preferred funding partner to mining companies throughout the commodity cycle by providing customized streaming and royalty financing.
Since inception, we have invested in and systematically developed a long-life, high-margin, top-tier diversified portfolio of streams and royalties providing exposure primarily to gold and silver. As at February 18, 2026, our portfolio is comprised of 239 assets, consisting of 16 streams and 223 royalties.
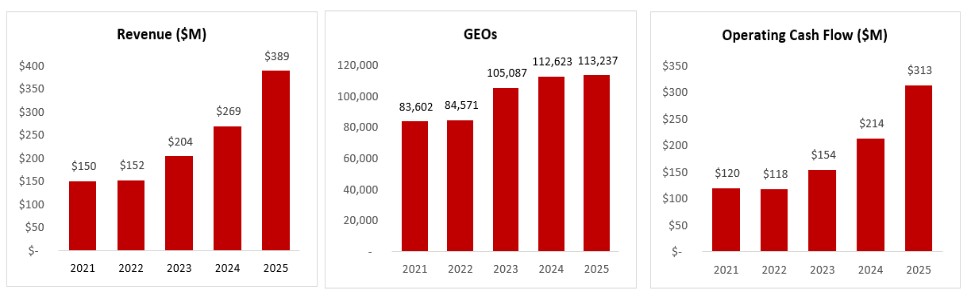
The following charts highlight the Company’s five-year performance:
Asset Count1 | | |
Producing |
| 34 |
Development & Exploration |
| 205 |
Total |
| 239 |
| 1. | Asset count as at February 18, 2026. |
Our portfolio is underpinned by a stable base of cash flow generating streams and royalties and is designed to grow intrinsically over time through exposure to potential mine life extensions, exploration success, new mine builds and throughput expansions. In addition, we are focused on further enhancing portfolio quality by executing accretive investments to grow the scale and enhance the quality of our portfolio of precious metals streams and royalties. We focus on ‘‘per share’’ metrics with the objective of pursuing accretive new investments while managing the capital structure to effectively compete for quality assets without incurring long-term financial leverage.
4
The market prices of gold and silver are primary drivers of our profitability and ability to generate free cash flow.
The following table sets forth the average gold and silver prices, and the average exchange rate between the Canadian and United States (“U.S.”) dollars, for the periods indicated.
| | Three months ended December 31 | | Year ended December 31 | ||||
Average Metal Prices/Exchange rate | | 2025 | | 2024 | | 2025 | | 2024 |
Gold (US$/oz)1 | | 4,135 | | 2,663 | | 3,432 | | 2,386 |
Silver (US$/oz)2 |
| 54.73 |
| 31.38 |
| 40.03 | | 28.27 |
Exchange rate (US$/C$)3 |
| 1.3947 |
| 1.3982 |
| 1.3978 | | 1.3698 |
| 1. | Based on the London Bullion Market Association (“LBMA”) PM fix. |
| 2. | Based on the LBMA fix. |
| 3. | Based on the Bank of Canada daily average exchange rate. |
Gold
The market price of gold is subject to significant volatility over short periods of time and can be affected by a range of macroeconomic and geopolitical factors, including, but not limited to, movements in the value of the U.S. dollar, real and nominal interest rates, inflation expectations, fiscal and monetary policy, central bank purchases and sales of gold, global and regional supply and demand dynamics, and broader political and economic conditions. In recent periods, gold prices have also been affected by heightened geopolitical tensions, increased trade and economic fragmentation, elevated sovereign debt levels and concerns regarding the long-term stability of major currencies. The market price of gold is a significant contributor to the performance of our gold streams and related interests and royalty portfolio.
During the three months ended December 31, 2025, the gold price experienced continued volatility and remained at historically elevated levels, supported by safe haven demand and uncertainty around global economic and policy conditions. For the quarter, the gold price ranged from approximately $3,872 to $4,449 per ounce, averaging $4,135 per ounce, representing an increase of approximately 55% compared to the same period in the prior year. During the year ended December 31, 2025, the gold price ranged from approximately $2,633 to $4,449 per ounce, averaging $3,432 per ounce, an increase of approximately 44% compared to the same period in the prior year. As at December 31, 2025, the gold price was $4,368 per ounce (based on the most recent LBMA PM fix), reflecting the strong pricing environment prevailing at year end. The average gold price also improved during the fourth quarter of 2025 compared to the prior quarter, consistent with the broader trend of strengthening prices over the second half of the year.
Subsequent to year end, the gold price has continued its upward trajectory. This strength has been supported by ongoing safe-haven demand amid continued geopolitical tensions, elevated fiscal and monetary policy uncertainty, sustained central bank demand for gold and the impact of renewed trade tensions and supply chain realignments. These factors, individually or in combination, may continue to contribute to elevated price volatility and could have a material impact, positive or negative, on the value and cash flows associated with our gold streams and related interests and royalty portfolio.
Silver
The market price of silver is subject to significant volatility over short periods of time and is influenced by its dual role as both an industrial metal and an investment asset. Demand for silver is closely linked to global industrial activity, including its use in electronics, photovoltaics, automotive applications and other technology-related end markets, and is also affected by broader macroeconomic conditions, investor sentiment, currency movements and monetary policy expectations. In recent periods, silver demand has been further supported by growth in renewable energy and electrification-related applications, while supply has been constrained by limited new mine development and declining production from certain primary and by-product sources. A sustained recovery or expansion in manufacturing activity and technology-related investment is generally expected to have a positive effect on silver demand and pricing.
5
The market price of silver is influenced by many of the same factors that affect the market price of gold, including real interest rate expectations, inflation trends, fiscal and monetary policy developments and geopolitical conditions. Silver prices may also be subject to amplified volatility due to their smaller market size and greater sensitivity to changes in industrial demand. The market price of silver is a significant contributor to the performance of our silver streams and royalty portfolio.
During the three months ended December 31, 2025, the silver price experienced pronounced volatility but remained at historically elevated levels, reflecting a combination of tight physical supply, strong investor interest and ongoing macroeconomic uncertainty. For the quarter, the silver price ranged from approximately $46.44 to $74.84 per ounce, averaging $54.73 per ounce, representing an increase of approximately 74% compared to the same period in the prior year. During the year ended December 31, 2025, the silver price ranged from approximately $29.41 to $74.84 per ounce, averaging $40.03 per ounce, an increase of approximately 42% compared to the same period in the prior year. As at December 31, 2025, the silver price was $71.99 per ounce (based on the most recent LBMA fix), capping a year in which silver significantly outperformed many other asset classes and recorded one of its strongest annual gains in recent decades.
Subsequent to year end, silver has continued to trade at elevated levels. This strength has been supported by ongoing safe-haven demand amid heightened geopolitical tensions, continued uncertainty regarding global economic and monetary conditions and persistent structural tightness in the silver market driven by energy transition-related demand. These factors, individually or in combination, may continue to contribute to elevated price volatility and could have a material impact, positive or negative, on the value and cash flows associated with our silver streams and royalty portfolio.
Currency Exchange Rates
We are subject to minimal currency fluctuations as the majority of our revenue and cost of sales are denominated in U.S. dollars, with the majority of general administration costs denominated in Canadian dollars. The Company monitors foreign currency risk as part of its risk management program. As at December 31, 2025, there were no hedging programs in place for non-U.S. denominated dollar expenses.
6
Financial and Operating Highlights
Three months and year ended December 31, 2025, compared to three months and year ended December 31, 2024
| Three months ended December 31, | | Year ended December 31, | ||||||||
($ thousands except GEOs, per share metrics, and asset margin) | 2025 | | 2024 | | | 2025 | | | 2024 | ||
Financial measures: | | | | | | | | | | | |
Revenue | $ | 118,916 | | $ | 74,213 | | $ | 388,704 | | $ | 268,991 |
Gross Profit |
| 86,589 | |
| 46,384 | |
| 262,918 | |
| 155,210 |
Depletion |
| 19,401 | |
| 19,186 | |
| 79,255 | |
| 75,554 |
General Administration Costs |
| 8,801 | |
| 4,626 | |
| 30,452 | |
| 21,755 |
Impairment (reversal) charges and expected credit losses1 | | — | | | — | | | (4,300) | | | 148,034 |
Net earnings (loss) |
| 76,832 | |
| 41,280 | |
| 240,005 | |
| (23,084) |
Net earnings (loss) per Share – basic and diluted |
| 0.37 | |
| 0.20 | |
| 1.18 | |
| (0.11) |
Operating Cash Flow |
| 89,497 | |
| 63,473 | |
| 312,832 | |
| 213,503 |
Operating Cash Flow per Share - basic |
| 0.43 | |
| 0.32 | |
| 1.54 | |
| 1.06 |
Operating Cash Flow per Share - diluted | | 0.43 | | | 0.32 | | | 1.53 | | | 1.06 |
GEOs |
| 28,757 | |
| 27,864 | |
| 113,237 | |
| 112,623 |
| | | | | | | | | | | |
Non-IFRS measures2: |
| | |
| | |
| | |
| |
Adjusted Net Earnings |
| 67,561 | |
| 36,252 | |
| 205,465 | |
| 109,607 |
Adjusted Net Earnings per Share - basic and diluted |
| 0.33 | |
| 0.18 | |
| 1.01 | |
| 0.54 |
Adjusted EBITDA |
| 101,000 | |
| 62,980 | |
| 325,014 | |
| 220,200 |
Free Cash Flow |
| 89,497 | |
| 63,473 | |
| 312,832 | |
| 213,503 |
Asset Margin |
| 94% | |
| 92% | |
| 93% | |
| 92% |
| 1. | Impairment reversals for the year ended December 31, 2025 are due to a reversal of impairment losses relating to previous impairments taken on the Elevation Gold Mining Corp. (“Elevation Gold”) loan receivables, following a recovery under a formal process under the Companies’ Creditors Arrangement Act (the “CCAA”). Impairment charges and expected credit losses for the year ended December 31, 2024, are largely due to impairments taken on the Nevada Copper Corp. (“Nevada Copper”) stream and related interests, as well as impairments taken on the Elevation Gold stream and related interests. Refer to the “IFRS Accounting Standards Critical Accounting Policies and Accounting Estimates - Critical Accounting Estimates and Judgments” section for more details. |
| 2. | Adjusted net earnings, adjusted net earnings per share, adjusted EBITDA, free cash flow and asset margin as presented above are non-IFRS financial performance measures with no standardized meaning under IFRS Accounting Standards and therefore may not be comparable to similar measures presented by other issuers. For further information and a detailed reconciliation of each non-IFRS measure to the most directly comparable IFRS Accounting Standards measure, see ‘‘Non-IFRS Financial Performance Measures’’ in this MD&A. |
The Company achieved 113,237 GEOs for the year ended December 31, 2025, which was within the upper half of 2025 guidance, representing a ninth consecutive annual GEOs sales record. Depletion in 2025 totaled $79.3 million, which was also within the upper end of the Company’s depletion guidance range, consistent with our GEOs sales. As expected, general administration costs of $30.5 million exceeded the top end of our guidance range of $25 million due to non-cash, mark-to-market adjustments relating to stock-based compensation as a result of Triple Flag’s strong share price performance in 2025. Cash taxes in Australia of 24% was in line with expectations.
| | 2025 Guidance | | 2025 Actual |
GEOs |
| 105,000 to 115,000 GEOs | | 113,237 GEOs |
Depletion | | $70 million to $80 million | | $79.3 million |
General administration costs | | $24 million to $25 million | | $30.5 million |
Australian Cash Tax rate1 | | ~25% | | 24% |
| 1. | Australian Cash Taxes are payable for Triple Flag’s Australian royalty interests, which include Beta Hunt, Fosterville, Stawell, and Henty. |
7
The following contains forward-looking information. Reference should be made to the “Forward-Looking Information” and “Technical and Third-Party Information” sections at the end of this MD&A.
In 2026, we expect stream sales and royalty revenue of 95,000 to 105,000 GEOs.
Our 2026 outlook on stream and royalty interests is based on publicly available forecasts of the owners or operators of the underlying properties and/or operations on which we have stream and royalty interests. When publicly available forecasts on properties are not available, we obtain internal forecasts from the owners or operators or use our own best estimate. We conduct our own independent analysis of this information to reflect our expectations based on an operator’s historical performance and track record of replenishing mineral reserves and their publicly disclosed guidance on future production, the conversion of mineral resources to mineral reserves, timing risk adjustments, drill results, our view on opportunities for mine plan optimization and other factors. We may also make allowances for the risk of uneven stream deliveries, timing differences in the deliveries under our streams or the payment of our royalties, and the attainment of public guidance ranges for our counterparties. Achievement of the GEOs and the other metrics set forth in the guidance above is subject to risks and uncertainties, including changes in commodity prices and the ability of operators to attain the results set out in their forecasts. Accordingly, we can provide no assurance that the actual GEOs and such other metrics for 2026 will be within the ranges set forth below. In addition, we may revise our guidance during the year to reflect more current information. If we are unable to achieve our anticipated guidance, or if we revise our guidance, our future results of operations may be adversely affected, and our share price may decline.
Key assumptions include:
| ● | The expected mine sequencing at Northparkes. High-grade gold production at the operation has transitioned from the E31 and E31N open pits to the E48 sub-level cave (“SLC”), which started production in the third quarter of 2025 and is expected to ramp-up through 2026. |
| ● | A step-down in the stream rate from 65% to 25% at Cerro Lindo starting in the second quarter, following the cumulative delivery of 19.5 million ounces of silver since we acquired the stream in 2016. |
| ● | The ramp-up of the Arcata silver and gold mine, which commenced production in the fourth quarter of 2025. |
The following table provides our full year 2026 guidance:
| | 2026 Guidance |
GEOs1 |
| 95,000 to 105,000 GEOs |
Depletion | | $65 million to $75 million |
General administration costs | | $30 million to $32 million |
Australian Cash Tax rate2 | | ~25% |
| 1. | A gold-to-silver price ratio assumption of 64x in the first quarter, 70x in the second quarter, 75x in the third quarter and 80x in the fourth quarter. We have not assumed any GEOs from Altan Tsagaan Ovoo (“ATO”) in 2026. |
| 2. | Australian Cash Taxes are payable for Triple Flag’s Australian royalty interests, which include Beta Hunt, Fosterville, Stawell and Henty. |
Portfolio of Streaming and Related Interests and Royalty Interests
The following tables present our revenue and GEOs sold by asset for the periods indicated. GEOs are based on stream and related interests as well as royalty interests and are calculated on a quarterly basis by dividing all revenue from such interests for the quarter by the average gold price during that quarter. The gold price is determined based on the LBMA PM fix. For periods greater than one quarter, GEOs are summed for each quarter in the period. Management uses this measure internally to evaluate our underlying operating performance across our stream and royalty portfolio for the reporting period presented and to assist with the planning and forecasting of future operating results.
8
Three months and year ended December 31, 2025, compared to three months and year ended December 31, 2024
| | Three months ended December 31, | | Year ended December 31, | ||||||||
Revenue ($000s) | | 2025 | | 2024 | | 2025 | | 2024 | ||||
Stream and Related Interests | | | | | | | | | | | | |
Northparkes | | $ | 15,989 | | $ | 19,477 | | $ | 109,653 | | $ | 64,636 |
Cerro Lindo | | | 38,534 | | | 18,879 | | | 92,601 | | | 69,876 |
Buriticá | |
| 7,508 | |
| 6,397 | |
| 21,808 | |
| 16,352 |
El Mochito | | | 19,636 | | | 189 | | | 19,727 | | | 274 |
Impala Bafokeng | |
| 4,530 | |
| 4,117 | |
| 18,583 | |
| 13,998 |
Auramet | | | 5,400 | | | 3,313 | | | 17,844 | | | 11,919 |
Bonikro | | | 1,201 | | | 2,297 | | | 10,759 | | | 7,335 |
Agbaou | | | 2,292 | | | 1,417 | | | 9,457 | | | 4,731 |
La Colorada | | | 903 | | | 522 | | | 4,516 | | | 3,344 |
ATO | |
| — | |
| 990 | |
| 2,690 | |
| 10,706 |
Other | |
| 339 | |
| 562 | |
| 1,471 | |
| 2,398 |
| | $ | 96,332 | | $ | 58,160 | | $ | 309,109 | | $ | 205,569 |
Royalty Interests | |
| | |
| | |
| | |
| |
Beta Hunt | | $ | 4,436 | | $ | 2,991 | | $ | 17,710 | | $ | 11,605 |
Fosterville | | | 3,338 | | | 2,522 | | | 11,411 | | | 9,907 |
Young-Davidson | |
| 2,237 | |
| 1,706 | |
| 8,384 | |
| 6,397 |
Camino Rojo | | | 2,272 | | | 2,371 | | | 7,706 | | | 6,732 |
Florida Canyon | | | 1,616 | | | 1,625 | | | 7,125 | | | 4,959 |
Agbaou | | | 2,410 | | | 963 | | | 6,750 | | | 2,975 |
Kensington | | | 1,458 | | | 864 | | | 4,484 | | | 6,715 |
Stawell | | | 1,154 | | | 995 | | | 4,062 | | | 3,337 |
Henty | | | 858 | | | 168 | | | 3,191 | | | 1,639 |
Eagle River | | | 496 | | | 287 | | | 1,868 | | | 997 |
Minera Florida | | | 551 | | | — | | | 999 | | | — |
Other | |
| 1,758 | |
| 1,561 | |
| 5,905 | |
| 6,787 |
| | $ | 22,584 | | $ | 16,053 | | $ | 79,595 | | $ | 62,050 |
Revenue from contracts with customers | | $ | 118,916 | | $ | 74,213 | | $ | 388,704 | | $ | 267,619 |
Revenue – Other | | $ | — | | $ | — | | $ | — | | $ | 1,372 |
Total | | $ | 118,916 | | $ | 74,213 | | $ | 388,704 | | $ | 268,991 |
| | Three months ended December 31, | | Year ended December 31, | ||||||||
Revenue ($000s) | | 2025 | | 2024 | | 2025 | | 2024 | ||||
Gold | | $ | 48,712 | | $ | 46,564 | | $ | 243,003 | | $ | 171,265 |
Silver | |
| 70,204 | |
| 27,649 | |
| 145,701 | |
| 97,726 |
Total | | $ | 118,916 | | $ | 74,213 | | $ | 388,704 | | $ | 268,991 |
The following tables reconciles Revenue with GEOs:
| | 2025 | ||||||||
($ thousands, except average gold price and GEOs information) | | Q4 | | Q3 | | Q2 | | Q1 | | Year ended December 31 |
Revenue |
| 118,916 |
| 93,456 | | 94,087 | | 82,245 |
| 388,704 |
Average gold price per ounce |
| 4,135 |
| 3,457 | | 3,280 | | 2,860 |
| |
GEOs1 |
| 28,757 |
| 27,037 | | 28,682 | | 28,761 |
| 113,237 |
| 1. | GEOs are calculated on a quarterly basis by dividing all revenue from such interests for the quarter by the average gold price during such quarter. The gold price is determined based on the LBMA PM fix. For periods longer than one quarter, GEOs are summed for each quarter in the period. |
9
| 2024 | ||||||||
($ thousands, except average gold price and GEOs information) | Q4 | | Q3 | | Q2 | | Q1 | | Year ended December 31 |
Revenue | 74,213 |
| 73,669 |
| 63,581 |
| 57,528 |
| 268,991 |
Average gold price per ounce | 2,663 |
| 2,474 |
| 2,338 |
| 2,070 |
| |
GEOs1 | 27,864 |
| 29,773 |
| 27,192 |
| 27,794 |
| 112,623 |
| 1. | GEOs are calculated on a quarterly basis by dividing all revenue from such interests for the quarter by the average gold price during such quarter. The gold price is determined based on the LBMA PM fix. For periods longer than one quarter, GEOs are summed for each quarter in the period. |
| | Three months ended December 31, | | Year ended December 31, | ||||
GEOs (ounces) | | 2025 | | 2024 | | 2025 | | 2024 |
Stream and Related Interests | | |
| |
| |
| |
Northparkes | | 3,867 |
| 7,313 |
| 32,996 |
| 26,957 |
Cerro Lindo | | 9,319 |
| 7,088 |
| 26,213 |
| 29,248 |
Impala Bafokeng | | 1,096 |
| 1,546 |
| 5,520 |
| 5,869 |
El Mochito | | 4,749 |
| 71 |
| 4,781 |
| 105 |
Buriticá | | 1,816 |
| 2,402 |
| 6,225 |
| 6,665 |
Auramet | | 1,306 | | 1,244 | | 5,190 | | 4,997 |
Bonikro | | 290 | | 862 | | 3,319 | | 2,898 |
Agbaou | | 554 | | 532 | | 2,845 | | 1,871 |
La Colorada | | 218 | | 196 | | 1,397 | | 1,448 |
ATO | | — |
| 372 |
| 941 |
| 4,593 |
Other | | 81 |
| 211 |
| 427 |
| 1,039 |
| | 23,296 |
| 21,837 |
| 89,854 |
| 85,690 |
Royalty Interests | | |
| |
| |
| |
Beta Hunt | | 1,073 | | 1,123 | | 5,267 | | 4,882 |
Fosterville | | 807 |
| 947 |
| 3,361 |
| 4,153 |
Young-Davidson | | 541 |
| 641 |
| 2,455 |
| 2,681 |
Camino Rojo | | 549 | | 890 | | 2,272 | | 2,794 |
Florida Canyon | | 391 | | 610 | | 2,105 | | 2,061 |
Agbaou | | 583 |
| 362 |
| 1,960 | | 1,251 |
Kensington | | 353 | | 324 | | 1,299 | | 3,065 |
Stawell | | 279 | | 374 | | 1,187 | | 1,396 |
Henty | | 207 | | 63 | | 931 | | 849 |
Eagle River | | 120 | | 108 | | 600 | | 395 |
Minera Florida | | 133 | | — | | 290 | | — |
Other | | 425 |
| 585 |
| 1,656 |
| 2,743 |
| | 5,461 |
| 6,027 |
| 23,383 |
| 26,270 |
GEOs – Other | | — |
| — |
| — |
| 663 |
Total | | 28,757 |
| 27,864 |
| 113,237 |
| 112,623 |
| | Three months ended December 31, | | Year ended December 31, | ||||
GEOs (ounces) | | 2025 | | 2024 | | 2025 | | 2024 |
Gold | | 11,780 | | 17,483 | | 72,766 | | 71,761 |
Silver |
| 16,977 |
| 10,381 |
| 40,471 |
| 40,862 |
Total |
| 28,757 |
| 27,864 |
| 113,237 |
| 112,623 |
10
For the three months ended December 31, 2025, we sold 28,757 GEOs, an increase of 3% from 27,864 GEOs sold for the same period in the prior year, largely due to higher GEOs from Cerro Lindo and El Mochito driven by higher deliveries. Refer to “Disposal of the 25% silver stream on El Mochito” in the Key Developments section below. This was partially offset by lower GEOs from Northparkes, Impala Bafokeng and Buriticá due to fewer ounces sold.
For the year ended December 31, 2025, we sold 113,237 GEOs, an annual record and an increase of 1% from 112,623 GEOs sold in the prior year, largely due to higher GEOs from Northparkes and El Mochito driven by higher deliveries. This was partially offset by lower GEOs from Cerro Lindo due to lower deliveries.
Subsequent to the year ended December 31, 2025
Investment in the Northparkes E44 deposit
On February 10, 2026, Triple Flag International Ltd. (“TFI”), a wholly owned subsidiary of Triple Flag Precious Metals Corp., and Evolution Mining Limited (“Evolution”), entered into an agreement whereby TFI will invest $83.4 million into the development of the high-grade E44 gold open pit at Northparkes, which includes a seven-year period of minimum guaranteed stream deliveries to Triple Flag. Under the terms of the agreement, TFI will be entitled to purchase 20% of payable gold and 30% of payable silver from the E44 deposit for an ongoing payment of 10% of the spot gold and silver price for each ounce delivered. TFI's existing gold and silver stream on Northparkes is unaffected, other than with respect to the E44 Gold Deposit. The transaction is expected to be funded during the fourth quarter of 2026.
For the year ended December 31, 2025
Disposal of the 25% silver stream on El Mochito
On October 30, 2025, Triple Flag entered into a binding settlement agreement with Kirungu Corporation (“Kirungu”) and Ocean Partners UK Limited in respect of the outstanding amounts and silver deliveries under the stream agreement relating to the El Mochito mine in Honduras (the “Settlement Agreement”). Under the Settlement Agreement, the Company received on closing 350,000 ounces of silver to settle overdue deliveries under the original stream agreement dated January 1, 2019 between Maverix Metals Inc., Kirungu and American Pacific Honduras SA de CV, and is entitled to receive 20 subsequent monthly deliveries of 25,000 ounces of silver, payable on or before the 15th day of each calendar month, with the first such monthly delivery received on December 15, 2025.
The contractual right to receive metal deliveries meets the definition of a financial asset and is classified as Fair value through Profit and Loss (“FVTPL”). As a result of the Settlement Agreement, the stream arrangement was terminated and the Company recognized a gain on disposal of the stream of $5.4 million in connection with this transaction.
Acquisition of Minera Florida Royalties (1.5% and 0.8% net smelter returns (“NSR”) royalties)
On August 27, 2025, Triple Flag acquired a portfolio of royalties on the Minera Florida gold mine in Chile, operated by Pan American Silver Corp., from unrelated third parties for total cash consideration of $23.0 million. The portfolio consists of a 0.8% NSR royalty on the Agua Fria concessions, a 1.5% NSR royalty on the Mila concessions, and a 1.5 % NSR royalty on the Los Moscos and Piche concessions.
11
Acquisition of Orogen Royalties Inc. (“Orogen”)
On July 9, 2025, Triple Flag completed the acquisition of all the issued and outstanding common shares of Orogen pursuant to a plan of arrangement (the “Transaction”). Triple Flag paid in aggregate C$171.5 million in cash and issued 5,633,629 Triple Flag common shares to Orogen shareholders. All of Orogen’s royalty assets, except for the 1.0% NSR royalty on the Arthur gold project (formerly the Expanded Silicon gold project) in Nevada, were spun off to a separate publicly traded company (“Orogen Spinco”) as part of the Transaction. In conjunction with the completion of the Transaction, Triple Flag invested C$10.0 million to acquire 6,756,757 common shares of Orogen Spinco (representing an approximate ownership interest of 11%). Subsequent to the acquisition, Orogen was renamed to “Triple Flag Nevada Inc.” and Orogen Spinco assumed the name of “Orogen Royalties Inc.”
On April 23, 2025, Triple Flag entered into foreign exchange forward contracts for the anticipated acquisition of Orogen. These foreign exchange forward contracts, designated as cash flow hedges, had a combined notional value to sell US$130.4 million and buy C$180.0 million, at a forward contract rate of approximately US$/C$ of 1.38 on July 8, 2025. The fair value of the foreign exchange forward contracts upon closing resulted in an, after-tax gain of $1.1 million, which was recorded within mineral interests.
Acquisition of an additional 1.5% gross revenue (“GR”) royalty on the Johnson Camp Mine
On June 26, 2025, Triple Flag acquired a 1.5% GR royalty from Greenstone Excelsior Holdings L.P. (“Greenstone”) on the Johnson Camp Mine in Arizona, United States, operated by Gunnison Copper Corp. (“Gunnison”) for total cash consideration of $4.0 million. This royalty was in addition to the pre-existing 1.5% GR royalty which Triple Flag already owned on the Johnson Camp Mine.
Acquisition of 0.5% GR royalty on the Tres Quebradas lithium project
On March 19, 2025, Triple Flag completed the acquisition of an existing 0.5% GR royalty from Lithium Royalty Corp. for total cash consideration of $28.0 million. The royalty covers all mineral properties comprising the Tres Quebradas lithium project. Tres Quebradas, located in Catamarca province, Argentina, is 100%-owned and operated by Zijin Mining Group Co., Ltd. through its subsidiary Liex SA.
Acquisition of 5% silver and gold streams on the Arcata and Azuca mines
On February 27, 2025, Triple Flag completed the acquisition of 5% silver and gold streams on each of the Arcata and Azuca mines (the “Sierra Sun Streams”) operated by Sierra Precious Metals S.A.C., for total cash consideration of $35.0 million. Triple Flag will make ongoing payments of 10% of the spot silver and gold price for each ounce delivered under the Sierra Sun Streams. The Sierra Sun Streams cover the existing mining and exploration licenses for the Arcata and Azuca mines, both located in Peru, for the life of the operations. There are no step-downs in stream rates.
For the year ended December 31, 2024
Acquisition of 3% gold streams on Agbaou and Bonikro
On August 14, 2024, Triple Flag completed the acquisition of 3% gold streams on each of the Agbaou and Bonikro mines (the “Allied Streams”) operated by Allied Gold Corp. (“Allied”) and also acquired the right to purchase metal based on production from January 1, 2024 to August 14, 2024 (“Allied Initial Ounces”), for a total cash consideration of $53.0 million. Triple Flag will make ongoing payments of 10% of the spot gold price for each ounce delivered under the streams. The streams cover the existing mining and exploration licenses for the Agbaou and Bonikro mines, both located in Cote d’Ivoire.
12
The Agbaou gold stream will step down to 2% payable gold after the delivery of 29,000 ounces of gold, and the Bonikro gold stream will step down to 2% payable gold after the delivery of 39,300 ounces of gold. From 2024 to 2027, both streams are subject to a period of annual minimum deliveries. Under the Agbaou stream, an annual minimum of 2,500 to 2,750 ounces will be delivered and under the Bonikro stream, an annual minimum of 3,500 to 4,200 ounces will be delivered. A parent guarantee is provided by Allied under the terms of the respective stream agreements.
The total cash consideration of $53.0 million was comprised of $46.1 million relating to the Allied Streams and $6.9 million to the Allied Initial Ounces.
Acquisition of additional Tamarack royalty
On July 5, 2024, Triple Flag acquired an additional 1.0% NSR royalty from Talon Nickel (USA) LLC (“Talon”), a wholly-owned subsidiary of Talon Metals Corp., a TSX-listed company, for total consideration of $8 million (“Additional Tamarack Royalty”). The royalty is on Talon’s participating interest in the Tamarack project. The royalty is subject to a buydown right to reduce the Additional Tamarack Royalty to 0.6% for $5.0 million, exercisable for a period of two years, subject to certain conditions. This Additional Tamarack Royalty is in addition to the 1.11% NSR royalty which Triple Flag already owns on the Tamarack project.
Kensington royalty litigation settlement
On March 28, 2024, Triple Flag and Coeur Mining, Inc. (“Coeur”) entered into a settlement agreement to resolve litigation regarding the terms of a royalty held by Triple Flag on Coeur’s Kensington gold mine.
As part of the settlement agreement, Triple Flag received $6.75 million in Coeur shares ($3.0 million received in April 2024, and $3.75 million received in March 2025). The Coeur share consideration is in settlement of royalties in arrears and litigation expenses incurred. As such, the settlement amounts were recognized as revenue and recoupment of costs in the consolidated statements of comprehensive income for the year ended December 31, 2024.
Operating Assets – Performance
Our business is organized into a single operating segment, consisting of acquiring and managing precious metals and other high-quality streams and royalties. Our chief operating decision-maker, the CEO, makes capital allocation decisions, reviews operating results and assesses performance.
Asset Performance — Streams and related assets (producing)
| 1. | Northparkes (Operator: Evolution) |
Under the stream agreement, we receive 54% of payable gold until an aggregate of 630,000 ounces have been delivered and 27% of payable gold thereafter. We also receive 80% of payable silver until an aggregate of 9 million ounces of silver have been delivered, and 40% of payable silver thereafter for the remainder of the life of mine. Typically, deliveries under the stream may lag production by approximately two months. As at December 31, 2025, 96,993 ounces of gold and 1,266,839 ounces of silver had been delivered under the stream agreement since inception.
For the three months ended December 31, 2025, we sold 2,908 ounces of gold and 69,737 ounces of silver delivered under the agreement. This compares to 6,488 ounces of gold and 71,481 ounces of silver delivered and sold for the same period in the prior year. GEOs sold were 3,867 for the three months ended December 31, 2025, compared to GEOs of 7,313 for the same period in the prior year, representing a decrease of 47% period over period, driven by lower sales.
For the year ended December 31, 2025, we sold 29,793 ounces of gold and 250,622 ounces of silver delivered under the agreement. This compares to 23,438 ounces of gold and 278,284 ounces of silver delivered and sold for the same period in the prior year. GEOs sold were 32,996 for the year ended December 31, 2025, compared to GEOs of 26,957 for the same period in the prior year, representing an increase of 22% period over period, driven by higher deliveries.
13
High-grade gold production at Northparkes has transitioned from the E31 and E31N open pits to the E48 SLC, which started production in the third quarter of 2025 and is expected to ramp-up through 2026. Subsequent to year end, TFI, a wholly-owned subsidiary of Triple Flag, and Evolution entered into an agreement whereby TFI will invest $83.4 million into the development of the high-grade E44 gold open pit at Northparkes, refer to the “Key Developments” section above for more details.
| 2. | Cerro Lindo (Operator: Nexa Resources S.A. (“Nexa”)) |
Under the stream agreement with Nexa, we receive 65% of payable silver produced from the Cerro Lindo mine until 19.5 million ounces have been delivered and 25% thereafter. Typically, deliveries under the stream lag production by up to four months. As at December 31, 2025, 18.9 million ounces of silver had been delivered under the stream agreement with Nexa since inception. We continue to expect a step-down in the stream rate from 65% to 25% to begin at Cerro Lindo in the second quarter of 2026.
For the three months ended December 31, 2025, we sold 703,682 ounces of silver delivered under the agreement, compared to 584,290 ounces of silver delivered for the same period in the prior year. GEOs sold were 9,319 for the three months ended December 31, 2025, compared to GEOs of 7,088 for the same period in the prior year due to higher deliveries as well as an improved ratio of gold to silver prices during the three months ended December 31, 2025.
For the year ended December 31, 2025, we sold 2,243,645 ounces of silver delivered under the agreement, compared to 2,430,133 ounces of silver delivered and sold for the same period in the prior year, driven by lower deliveries. GEOs sold were 26,213 for the year ended December 31, 2025, compared to GEOs of 29,248 for the same period in the prior year as a result of lower deliveries.
| 3. | Impala Bafokeng Operations (Operator: Impala Platinum Holdings Limited (“Implats”)) |
Under the stream agreement, we receive 70% of payable gold until 261,000 ounces are delivered and 42% of payable gold thereafter from the Impala Bafokeng Operations (“Impala Bafokeng”). Typically, deliveries under the stream may lag production by approximately five months. As at December 31, 2025, 40,150 ounces of gold had been delivered under the stream agreement since inception.
For the three months ended December 31, 2025, we sold 1,120 ounces of gold delivered under the stream agreement, compared to 1,536 ounces delivered and sold for the same period in the prior year. GEOs sold were 1,096 for the three months ended December 31, 2025, compared to GEOs of 1,546 for the same period in the prior year.
For the year ended December 31, 2025, we sold 5,502 ounces of gold delivered under the stream agreement, compared to 5,854 ounces delivered and sold for the same period in the prior year. GEOs sold were 5,520 for the year ended December 31, 2025, compared to GEOs of 5,869 for the same period in the prior year.
Development of the asset’s value driver, Styldrift, remains ongoing, with a steady ramp-up expected to deliver improved efficiencies.
| 4. | Buriticá (Operator: Zijin Mining Group Co. (“Zijin”)) |
Under the stream agreement, we receive 100% of payable silver based on a fixed silver-to-gold ratio of 1.84 over the life of the asset and there is no step-down in stream rates. As at December 31, 2025, 2.4 million ounces of silver had been delivered under the stream agreement since inception.
For the three months ended December 31, 2025, we sold 124,028 ounces of silver delivered to the Company under the agreement, compared to 202,353 ounces of silver delivered and sold for the same period in the prior year. GEOs sold were 1,816 for the three months ended December 31, 2025, compared to GEOs of 2,402 for the same period in the prior year.
14
For the year ended December 31, 2025, we sold 513,512 ounces of silver delivered to the Company under the agreement, compared to 559,466 ounces of silver delivered and sold for the same period in the prior year. GEOs sold were 6,225 for the year ended December 31, 2025, compared to GEOs of 6,665 for the same period in the prior year.
Despite the ongoing presence of illegal miners, Buriticá continues to maintain overall steady operations. The operator continues to engage closely with the surrounding community on illegal mining with support by national institutions, including the National Police of Colombia.
| 5. | Agbaou and Bonikro (Operator: Allied) |
On August 14, 2024, Triple Flag completed the acquisition of 3% gold streams on each of the Agbaou and Bonikro mines operated by Allied. Under the stream agreements, we receive 3% of payable gold on each of the Agbaou and Bonikro mines until an aggregate of 29,000 ounces and 39,300 ounces, respectively, have been delivered, and 2% of payable gold thereafter. As at December 31, 2025, 4,829 ounces and 6,494 ounces have been delivered under the Agbaou and Bonikro stream agreements, respectively, since inception.
We also own a separate 2.5% NSR royalty interest on all gold production from the Agbaou mine.
For the three months ended December 31, 2025, we sold 540 ounces of gold delivered under the Agbaou stream agreement and 291 ounces of gold delivered under the Bonikro stream agreement. In the prior year comparable period, 533 ounces of gold were sold under the Agbaou stream agreement and 862 ounces of gold were sold under the Bonikro stream agreement. GEOs sold were 554 and 290 under the Agbaou and Bonikro streams, respectively, for the three months ended December 31, 2025, compared to GEOs of 532 and 862 under the Agbaou and Bonikro streams, respectively, for the same period in the prior year. GEOs earned from the Agbaou royalty were 583 for the three months ended December 31, 2025, compared to GEOs of 362 for the prior year.
For the year ended December 31, 2025, we sold 2,834 ounces of gold delivered under the Agbaou stream agreement and 3,315 ounces of gold delivered under the Bonikro stream agreement. In the prior year comparable period, we sold 1,846 ounces of gold delivered under the Agbaou stream agreement and 2,862 ounces of gold delivered under the Bonikro stream agreement. GEOs sold were 2,845 and 3,319 under the Agbaou and Bonikro streams, respectively, for the year ended December 31, 2025 compared to GEOs of 1,871 and 2,898 under the Agbaou and Bonikro streams, respectively, for the same period in the prior year. GEOs earned from the Agbaou royalty were 1,960 for the year ended December 31, 2025, compared to GEOs of 1,251 for the prior year.
During the fourth quarter of 2025, Allied announced that a concept-level underground study of the Hiré target at Bonikro was completed and supported further work and drilling to assess the viability of underground mining as a long-term strategy to extend the mine life at Bonikro.
In January 2026, Allied announced that Zijin Gold International Company Limited had agreed to acquire Allied in an all-cash transaction that is expected to close in April 2026. The transaction is subject to the approval of 66.66% of votes cast by shareholders of Allied at a meeting of Allied shareholders and a simple majority of the votes cast at the meeting with members of management and the board not voting. The Transaction will not be subject to shareholder approval at Zijin Gold.
Asset Performance — Royalties (Producing)
| 1. | Beta Hunt (Operator: Westgold Resources Limited (“Westgold”), effective August 1, 2024) |
We own a 3.25% gross revenue return (“GRR”) and 1.5% NSR royalties on all gold production, as well as a 1.0% GRR and 0.5% NSR royalties on all nickel production, from the Beta Hunt mine, located in Australia.
15
GEOs earned were 1,073 for the three months ended December 31, 2025, compared to GEOs of 1,123 for the prior year comparable period. GEOs earned were 5,267 for the year ended December 31, 2025, compared to GEOs of 4,882 for the prior year.
The expansion project to achieve consistent mine throughput at Beta Hunt of 2 million tonnes per annum is expected to be completed by the end of the first half of 2026. Recent capital investment on upgrades to primary ventilation, mine pumping and water supply has enabled increased mining development and improved operational flexibility.
Following the declaration of a maiden resource for the Fletcher Zone in June 2025, which effectively doubled the previous Beta Hunt resource, exploration and definition drilling to determine its potential scale is ongoing before its integration into a life of mine plan. The Fletcher Zone is a significant discovery at Beta Hunt that is interpreted to represent a new gold mineralized structure parallel to the Western Flanks deposit of the mine and located 50 meters to the west. Western Flanks is currently the primary source of gold ore for Beta Hunt.
| 2. | Fosterville Gold Mine (Operator: Agnico Eagle Mines Limited (“Agnico Eagle")) |
We own a 2% NSR royalty interest in Agnico Eagle’s Fosterville mine in Australia.
GEOs earned were 807 for the three months ended December 31, 2025, compared to GEOs of 947 for the prior year comparable period. GEOs earned were 3,361 for the year ended December 31, 2025, compared to GEOs of 4,153 for the prior year.
The operator now expects Fosterville to produce between 140,000 to 160,000 ounces of gold in each of 2026 and 2027. Notably, production is now expected to further increase to a new steady-state of 170,000 to 190,000 in 2028 and remain at that level through the early 2030s, following the completion of mining and processing initiatives that will drive a 65% boost in throughput to 3,300 tonnes per day.
These initiatives at Fosterville include stope-cycle optimization, an increase in development rates to sustain 12 kilometers of annual development, upgrades to ventilation infrastructure, new tailings cells and upgrades to the grinding circuit.
| 3. | Young-Davidson Gold Mine (Operator: Alamos Gold Inc. (“Alamos”)) |
We own a 1.5% NSR royalty interest in Alamos’ Young-Davidson mine in Canada.
GEOs earned were 541 for the three months ended December 31, 2025, compared to GEOs of 641 for the same period in the prior year. GEOs earned were 2,455 for the year ended December 31, 2025, compared to GEOs of 2,681 for the same period in the prior year.
In January 2026, Alamos released three-year production guidance of 155,000 to 175,000 ounces of gold for each of 2026, 2027 and 2028.
16
| 4. | Camino Rojo (Operator: Orla Mining Ltd. (“Orla”) |
We own a 2% NSR royalty interest on oxide material at Orla‘s Camino Rojo mine in Mexico.
GEOs earned were 549 for the three months ended December 31, 2025, compared to GEOs of 890 for the prior year comparable period. GEOs earned were 2,272 for the year ended December 31, 2025, compared to GEOs of 2,794 for the prior year.
Orla announced that Camino Rojo produced 96,764 ounces of gold in 2025, in line with updated guidance of 95,000 to 105,000 ounces.
Preliminary operator guidance for 2026 at Camino Rojo is 110,000 to 120,000 ounces of gold as mining has returned to the main part of the deposit.
Prepaid Gold Interests, Investments and other
The following table summarizes investments, prepaid gold interests and other financial assets as at December 31, 2025, and December 31, 2024:
| | As at | | As at | ||
($ thousands) |
| December 31, 2025 |
| December 31, 2024 | ||
Auramet1 | | $ | 65,320 | | $ | 46,082 |
Steppe Gold Ltd. ("Steppe Gold")2 | |
| 2,570 | |
| 3,457 |
Total Prepaid Gold Interests | | $ | 67,890 | | $ | 49,539 |
Investments3 | | | 17,421 | | | 3,010 |
El Mochito4 | | | 23,125 | | | — |
Total Prepaid Gold Interests, Investments and other | | $ | 108,436 | | $ | 52,549 |
| 1. | The contract requires Auramet to deliver 1,250 ounces of gold to Triple Flag per quarter. Triple Flag is required to make ongoing cash payments equal to 16% of the spot gold price for each gold ounce delivered. On September 27, 2031, and after 50,000 ounces of gold have been delivered, Auramet will have the option to terminate the prepaid interest agreement. As at December 31, 2025, 27,500 ounces of gold remains to be delivered under the contract. The Auramet Prepaid Gold Interest is accounted for as a financial asset at fair value through profit or loss and is classified as level 3 of the fair value hierarchy. |
| 2. | On March 15, 2024, Triple Flag and Steppe Gold agreed to amend and restate the Steppe Gold Prepaid Gold Interest Agreement such that the Company made a further cash payment of $5.0 million in exchange for delivery of 2,650 ounces of gold. The Steppe Gold Prepaid Gold Interest is accounted for as a financial asset at fair value through profit or loss and is classified as level 3 of the fair value hierarchy. On February 13, 2025, Triple Flag received a delivery of 1,000 ounces of gold under the Steppe Gold Prepaid Gold Interest Agreement. Subsequently, Steppe Gold did not make delivery of the remaining 1,650 gold ounces and defaulted on its obligation under the amended and restated agreement. On March 17, 2025, Triple Flag filed a statement of claim in the Ontario Superior Court of Justice demanding immediate delivery of the outstanding 1,650 gold ounces, or contractual damages owed, under the Steppe Gold Prepaid Gold Interest Agreement. The fair value of the prepaid gold interest as of December 31, 2025, was estimated by considering the credit risk associated with the financial asset due to the ongoing contractual dispute. For the three and twelve months ended December 31, 2025, Steppe Gold is also in arrears on stream deliveries of gold and silver production at the ATO mine in Mongolia under the Steppe Gold Stream Agreement. On September 10, 2025, Triple Flag International, a subsidiary of Triple Flag, issued, through its counsel, a demand letter to Steppe Gold requiring delivery of outstanding ounces under the Steppe Gold Stream Agreement. On October 7, 2025, Triple Flag International filed a Request for Arbitration, under the Steppe Gold Stream Agreement, with the International Court of Arbitration of the International Chamber of Commerce requesting specific performance of the sale and delivery of the outstanding gold and silver, which at time of filing the Request for Arbitration, was a total of 1,139 ounces of gold and 8,332 ounces of silver. |
| 3. | Investments comprise equity interests and warrants in publicly traded and private companies and have been recorded at fair value. The fair value of the public equity investments is classified as level 1 of the fair value hierarchy, as the primary valuation inputs used are quoted prices in active markets. The fair value of the private equity investments is classified as level 3 of the fair value hierarchy, as the relevant observable inputs are not available. |
| 4. | The Settlement Agreement requires Kirungu to deliver 500,000 ounces of silver in 20 equal monthly instalments of 25,000 ounces of silver to Triple Flag. As at December 31, 2025, 475,000 ounces of silver remains to be delivered under the Settlement Agreement. The right to silver deliveries is accounted for as a financial asset at fair value through profit or loss and is classified as level 3 of the fair value hierarchy. |
17
Financial Condition and Shareholders’ Equity Review
Summary Balance Sheet
The following table presents summarized consolidated balance sheet information as at December 31, 2025, December 31, 2024 and December 31, 2023:
| | As at | | As at | | As at | |||
($ thousands) |
| December 31, 2025 | | December 31, 2024 | | December 31, 2023 | |||
Cash and cash equivalents | | $ | 71,284 | | $ | 36,245 | | $ | 17,379 |
Other current assets | |
| 81,513 | |
| 39,400 | |
| 39,659 |
Non‑current assets | |
| 1,960,681 | |
| 1,694,334 | |
| 1,837,426 |
Total assets | | $ | 2,113,478 | | $ | 1,769,979 | | $ | 1,894,464 |
| | | | | | | | | |
Current liabilities | | $ | 38,947 | | $ | 27,126 | | $ | 17,315 |
Debt | | | — | | | — | | | 57,000 |
Other non‑current liabilities | |
| 29,314 | |
| 7,133 | |
| 9,408 |
Total liabilities | |
| 68,261 | |
| 34,259 | |
| 83,723 |
Total shareholders’ equity | |
| 2,045,217 | |
| 1,735,720 | |
| 1,810,741 |
Total liabilities and shareholders’ equity | | $ | 2,113,478 | | $ | 1,769,979 | | $ | 1,894,464 |
Total assets were $2,113.5 million as at December 31, 2025, compared to $1,770.0 million as at December 31, 2024. Our asset base primarily consists of non-current assets such as mineral interests, which consist of our interests in streams and related interests and royalties. Our asset base also includes current assets, which generally include cash and cash equivalents, receivables, metal inventory and investments. The increase in total assets from December 31, 2024, was largely driven by acquisition of mineral interests, namely the royalty on the Arthur gold project, the Minera Florida royalties, the Tres Quebradas royalty and the Sierra Sun Streams, partially offset by depletion of mineral interests.
Total assets were $1,770.0 million as at December 31, 2024, compared to $1,894.5 million as at December 31, 2023. The decrease in total assets from December 31, 2024, was largely driven by impairment charges taken during the second quarter of 2024, combined with depletion of mineral interests, partially offset by acquisition of assets, including prepaid gold interests and mineral interests.
Total liabilities were $68.3 million as of December 31, 2025, compared to $34.3 million as of December 31, 2024. The year-over-year increase primarily reflects higher deferred income tax liabilities and an increase in stock-based payment liabilities, the latter largely driven by the Company’s share price performance. Total liabilities mainly comprise accounts payable and accrued liabilities, stock-based payment liabilities, deferred tax liabilities, and lease obligations. The Credit Facility was undrawn as at December 31, 2025. For additional details regarding the Credit Facility, refer to the “Liquidity and Capital Resources” section below.
Total liabilities were $34.3 million as at December 31, 2024, compared to $83.7 million as at December 31, 2023. The decrease in total liabilities was largely driven by net repayment of the Credit Facility.
Total shareholders’ equity as at December 31, 2025 was $2,045.2 million, compared to $1,735.7 million as at December 31, 2024. The increase in shareholders’ equity from December 31, 2024 largely reflects net earnings generated during the period and shares of the Company issued as part of the Orogen transaction, partially offset by dividends paid and shares repurchased under the Company’s Normal Course Issuer Bid (“NCIB”).
Total shareholders’ equity as at December 31, 2024 was $1,735.7 million, compared to $1,810.7 million as at December 31, 2023. The decrease in shareholders’ equity primarily results from the net loss for the period, along with the dividends that were distributed.
18
Shareholders’ Equity
As at December 31, 2025 | | Number of shares |
Common shares |
| 206,531,806 |
As at December 31, 2024 |
| Number of shares |
Common shares |
| 201,211,843 |
As at December 31, 2023 |
| Number of shares |
Common shares |
| 201,353,962 |
Our common shares are listed on the Toronto Stock Exchange (“TSX’) in Canadian dollars and on the New York Stock Exchange (“NYSE”) in U.S. dollars, in each case under the symbol “TFPM”.
In November 2024, Triple Flag renewed its NCIB, which expired on November 14, 2025. The NCIB was further renewed in November 2025. Daily repurchases on the TSX will be limited to a maximum of 43,278 common shares, representing 25% of the average daily trading volume on the TSX of 173,115 common shares for the period from May 1, 2025, to October 31, 2025 (net of repurchases made by Triple Flag on the TSX during that time period), except where purchases are made in accordance with the “block purchase exception” of the TSX rules. All common shares that are repurchased by the Company under the NCIB will be canceled. Under the current NCIB, the Company may acquire up to 10,328,075 of its common shares from time to time in accordance with the NCIB procedures of the TSX. Repurchases under the NCIB are authorized until November 16, 2026.
For the year ended December 31, 2025, the Company purchased 518,300 (2024: 615,200) of its common shares under the NCIB for $9.0 million (2024: $8.9 million).
In connection with the NCIB, the Company established an automatic share purchase plan (“ASPP”) with the designated broker responsible for the NCIB. The ASPP is intended to allow for the purchase of common shares under the NCIB at times when the Company would ordinarily not be permitted to purchase its common shares due to regulatory restrictions and customary self-imposed blackout periods.
As at February 18, 2026, 206,570,616 common shares were issued and outstanding, and stock options were outstanding to purchase a total of 1,180,072 common shares.
For the three months ended December 31, 2025, we declared and paid dividends in United States dollars totaling $11.9 million at $0.0575 per share (2024: $11.1 million at $0.0550 per share; 2023: $10.6 million at $0.0525 per share). For the year ended December 31, 2025, we declared and paid dividends totaling $45.8 million ($0.0550 per share in the first and second quarter, $0.0575 per share in the third and fourth quarter). For the year ended December 31, 2024, we declared and paid dividends totaling $43.3 million ($0.0525 per share in the first and second quarter, and $0.0550 per share in the third and fourth quarter). For the year ended December 31, 2023, we declared and paid dividends in U.S. dollars totaling $41.3 million ($0.05 per share in the first and second quarter and $0.0525 per share in the third and fourth quarter).
For the three months and year ended December 31, 2025, no common shares were issued from treasury for participation in the Company’s Dividend Reinvestment Plan (2024: nil).
19
Consolidated Statements of Income
Three months ended December 31, 2025, compared to three months ended December 31, 2024, and year ended December 31, 2025, compared to year ended December 31, 2024 and December 31, 2023
| | Three months ended December 31, | | Year ended December 31, | |||||||||||
($ thousands except share and per share information) |
| | 2025 | | | 2024 |
| | 2025 | | | 2024 | | | 2023 |
Revenue | | $ | 118,916 | | $ | 74,213 | | $ | 388,704 | | $ | 268,991 | | $ | 204,024 |
Cost of sales | | | (32,327) | | | (27,829) | | | (125,786) | | | (113,781) | | | (101,948) |
Gross profit | | | 86,589 | |
| 46,384 | |
| 262,918 | |
| 155,210 | |
| 102,076 |
| | | | | | | | | | | | | | | |
General administration costs | |
| (8,801) | |
| (4,626) | |
| (30,452) | |
| (21,755) | |
| (20,095) |
Business development costs | |
| (2,169) | |
| (366) | |
| (5,648) | |
| (3,405) | |
| (4,219) |
Impairment reversal (charges) and expected credit losses | | | — | | | — | | | 4,300 | | | (148,034) | | | (36,830) |
Other expenses | |
| (10,299) | |
| — | |
| (10,299) | |
| — | |
| — |
Operating income (loss) | |
| 65,320 | |
| 41,392 | |
| 220,819 | |
| (17,984) | |
| 40,932 |
| | | | | | | | | | | | | | | |
Increase in fair value of investments, prepaid gold interests and other | |
| 20,687 | |
| 7,249 | |
| 46,233 | |
| 12,775 | | | 1,467 |
Gain (loss) on disposition of mineral interests | | | 5,354 | |
| — | | | 6,710 | |
| — | | | (1,000) |
Finance costs, net | |
| (575) | |
| (901) | |
| (3,459) | |
| (5,073) | |
| (4,122) |
Sustainability initiatives | |
| (218) | | | (472) | |
| (531) | |
| (903) | |
| (670) |
Foreign currency translation gain (loss) | |
| 51 | |
| 76 | |
| (414) | |
| 181 | |
| (218) |
Other expenses | | | — | | | — | | | — | | | (1,766) | | | — |
Other income (expense) | |
| 25,299 | |
| 5,952 | |
| 48,539 | |
| 5,214 | |
| (4,543) |
Earnings (loss) before income taxes | |
| 90,619 | |
| 47,344 | |
| 269,358 | |
| (12,770) | |
| 36,389 |
Income tax expense | |
| (13,787) | |
| (6,064) | |
| (29,353) | |
| (10,314) | |
| (107) |
Net earnings (loss) | | $ | 76,832 | | $ | 41,280 | | $ | 240,005 | | $ | (23,084) | | $ | 36,282 |
Weighted average shares outstanding – basic | |
| 206,561,183 | |
| 201,367,681 | |
| 203,618,559 | |
| 201,304,234 | |
| 199,327,784 |
Weighted average shares outstanding – diluted | |
| 207,165,115 | |
| 201,677,897 | |
| 204,071,985 | |
| 201,304,234 | |
| 199,519,312 |
Earnings (loss) per share – basic | | $ | 0.37 | | $ | 0.20 | | $ | 1.18 | | $ | (0.11) | | | 0.18 |
Earnings (loss) per share – diluted | | $ | 0.37 | | $ | 0.20 | | $ | 1.18 | | $ | (0.11) | | $ | 0.18 |
20
Three months ended December 31, 2025, compared to three months ended December 31, 2024
Revenue was $118.9 million during the three months ended December 31, 2025, a quarterly record and an increase of 60% from $74.2 million for the same period in the prior year. The increase was largely driven by $21.0 million in higher revenue due to higher gold prices, $21.2 million in higher revenue due to higher silver prices, a $1.5 million increase due to higher volume from stream and related interests, and a $1.0 million increase from higher attributable royalty volumes. Higher volume from streams and related interests were driven by higher deliveries from Cerro Lindo and El Mochito. Higher revenue from royalties was largely due to higher attributable royalty ounces from Beta Hunt, partially offset by lower attributable royalty ounces from Camino Rojo.
The average market gold price and gold sales volume for our streams and related interests for the same period were $4,135 per ounce and 6,337 ounces, respectively, compared to $2,663 per ounce and 11,226 ounces, respectively, in the prior year period. The average market silver price and silver sales volume during the three months ended December 31, 2025 for our streams and related interests were $54.73 per ounce and 1.3 million ounces, respectively, compared to $31.38 per ounce and 864 thousand ounces, respectively, for the same period in the prior year.
Cost of sales primarily represented the price of metals acquired under the stream agreement and related interests as well as the depletion expense for streams and royalties, both of which are calculated based on units of metal sold or attributable royalty ounces. Cost of sales was $32.3 million (including depletion) from streams and related interests and royalties during the three months ended December 31, 2025, compared to $27.8 million (including depletion) from streams and related interests and royalties for the same period in the prior year. The increase in cost of sales for the three months ended December 31, 2025 was primarily driven by higher metal deliveries from the Cerro Lindo stream and higher metal prices. Cost of sales for the three months ended December 31, 2025, included $6.1 million in non-cash cost of sales related to prepaid gold interests, compared to $2.8 million for the same period in the prior year. The increase was largely due to higher metal prices.
Gross profit was $86.6 million for the three months ended December 31, 2025, an increase of 87% from $46.4 million for the same period in the prior year. The increase was largely driven by higher realized gold and silver prices, combined with higher sales from Cerro Lindo and El Mochito, partially offset by lower sales from Northparkes and Buriticá.
Depletion was $19.4 million for the three months ended December 31, 2025, broadly in line with the $19.2 million for the same period in the prior year.
General and administration costs were $8.8 million for the three months ended December 31, 2025, representing a 90% increase from $4.6 million in the same period of the prior year. The increase was largely attributable to mark-to-market adjustments of stock-based compensation, which resulted in a $3.5 million expense for the three months ended December 31, 2025, due to a significant increase in the Company’s share price over the period. The mark-to-market adjustment for the three months ended December 31, 2024, was a recovery of $0.2 million.
Business development costs were $2.2 million for the three months ended December 31, 2025, compared to $0.4 million for the same period in the prior year. Business development costs represent ongoing business development costs incurred including use of third-party service providers, net of costs capitalized, and costs reimbursed from our counterparties.
Other expenses of $10.3 million for the three months ended December 31, 2025, as compared to $nil for the same period in the prior year, includes the Company’s payment to Evolution, operator of the Northparkes mine, to settle a review of past transactions between the companies.
The increase in the fair value of our investments, prepaid gold interests and other for the three months ended December 31, 2025, was $20.7 million, compared to $7.3 million for the same period in the prior year. The increase is largely driven by higher market gold prices during the period, primarily related to the Auramet prepaid interest.
21
The gain on disposal of $5.4 million for the three months ended December 31, 2025, compared to $nil for the same period in the prior year, related to the gain on disposal of the El Mochito stream, refer to the “Key Developments” section for more detail.
Finance costs, net were $0.6 million for the three months ended December 31, 2025, compared to $0.9 million for the same period in the prior year. These finance costs largely reflect interest charges and standby fees on the Credit Facility, net of interest earned on cash and loan balances.
Income tax expense was $13.8 million for the three months ended December 31, 2025, compared to $6.1 million for the same period in the prior year. The increase in income tax was due to higher taxes driven by the increase in earnings as well as impact on earnings due to the current sales mix.
Net earnings were $76.8 million for the three months ended December 31, 2025, up from $41.3 million in the same period of the prior year. Net earnings growth was primarily driven by higher gross profit across the portfolio, reflecting higher metal prices, increased deliveries from streams and related interests, and higher attributable ounces from royalties, partially offset by higher general administration costs.
Year ended December 31, 2025, compared to year ended December 31, 2024
Revenue was $388.7 million for the year ended December 31, 2025, an annual record, compared to $269.0 million in the prior year. The increase was largely due to $48.3 million higher in revenue from higher gold prices, $42.0 million in higher revenue from higher silver prices, $24.0 million in higher revenue due to higher volume from stream and related interests and $5.4 million higher revenue from higher attributable royalty ounces. Higher revenue from streams and related interests was driven by higher deliveries from Northparkes and El Mochito, partially offset by lower deliveries from Cerro Lindo and ATO. Higher revenue from royalties was largely due to higher attributable royalty ounces from Beta Hunt and Kensington, partially offset by lower attributable royalty ounces from Fosterville.
The average market gold price and gold sales volume for our streams and related interests for the year ended December 31, 2025, was $3,432 per ounce and 48,856 ounces, respectively, compared to $2,386 per ounce and 44,962 ounces, respectively, in the prior year. The average market silver price and silver sales volume for our streams and related interests for the year ended December 31, 2025, was $40.03 per ounce and 3.4 million ounces, respectively, compared to $28.27 per ounce and 3.4 million ounces, respectively, in the prior year.
Cost of sales primarily represents the price of metals acquired under the stream agreements and related interests, as well as the depletion expense for streams and royalties, both of which are calculated based on units of metal sold or attributable royalty ounces. Cost of sales was $125.8 million (including depletion) from streams and related interests and royalties for the year ended December 31, 2025, compared to $113.8 million (including depletion) from streams and related interests and royalties for the prior year. The increase in cost of sales for the year ended December 31, 2025, was largely due to higher metal prices and cost of sales associated with higher metal deliveries from Northparkes, partially offset by lower deliveries from Cerro Lindo and ATO.
Gross profit was $262.9 million for the year ended December 31, 2025, compared to $155.2 million in the prior year. The increase was largely driven by higher gold and silver prices, higher deliveries from Northparkes and El Mochito, and higher attributable royalty ounces from Beta Hunt and Kensington, partially offset by lower metal deliveries from the ATO and Cerro Lindo streams and lower attributable royalty ounces from Fosterville.
General and administration costs were $30.5 million for the year ended December 31, 2025, representing a 40% increase from $21.8 million in the prior year. The increase was largely attributable to mark-to-market adjustments of share-based compensation, which resulted in a $12.5 million expense for the year ended December 31, 2025, due to a significant increase in the Company’s share price over the period. The comparable mark-to-market adjustment expense for the year ended December 31, 2024, was $1.4 million.
22
Business development costs were $5.6 million for the year ended December 31, 2025, compared to $3.4 million in the prior year. Business development costs represent ongoing business development costs incurred throughout the year including use of third-party service providers, net of costs capitalized, and costs reimbursed from our counterparties.
Impairment reversal was $4.3 million for the year ended December 31, 2025, compared to impairment charges and expected credit losses of $148.0 million for the prior year. The reversal of impairment charges related to the previous impairments taken on the Elevation Gold loan receivables, following a recovery under a formal CCAA process. Impairment charges and expected credit losses for the year ended December 31, 2024, were largely due to impairments and expected credit losses taken on the Nevada Copper stream and related interests as well as Elevation Gold stream and related interests.
Other expenses of $10.3 million for the year ended December 31, 2025, includes the Company’s payment to Evolution, operator of the Northparkes mine, to settle a review of past transactions between the companies.
The increase in the fair value of our investments, prepaid gold interests and other for the year ended December 31, 2025, was $46.2 million, compared to $12.8 million for the prior year. The increase related primarily to an increase in the fair value of our prepaid gold interests, which was driven by higher market gold prices during the year as well as mark-to-market adjustments on the Company’s investment in Orogen.
The gain on disposal of $6.7 million for the year ended December 31, 2025, compared to a $1.0 million loss on disposal in the prior year, largely related to the gain on disposal of the El Mochito stream. Refer to the “Key Developments” section for more detail.
Finance costs, net were $3.5 million for the year ended December 31, 2025, compared to $5.1 million in the prior year. The finance costs largely reflect interest charges and standby fees on the Credit Facility, net of interest earned on cash and loan balances. The decrease was largely driven by lower average debt balance drawn during the year.
Income tax expense was $29.4 million, compared to $10.3 million in the prior year. The increase in income tax expense was due to higher taxes driven by the increase in earnings as well as the current sales mix.
Net earnings for the year ended December 31, 2025 were $240.0 million, compared to a net loss of $23.1 million in the prior year. Net earnings in the current year were largely driven by higher gross profit across the portfolio, as well as an increase in the fair value of investments and prepaid gold interests, driven by higher metal prices. The net loss in 2024 was driven by impairment charges and expected credit losses as described above.
Year ended December 31, 2024, compared to year ended December 31, 2023
Revenue was $269.0 million for the year ended December 31, 2024, compared to $204.0 million in the prior year. The increase was largely due to $25.2 million in higher revenue from higher gold prices, $17.0 million in higher revenue from higher silver prices, $16.1 million in higher revenue from higher volume from stream and related interests and $5.7 million higher revenue from higher attributable royalty ounces. Higher revenue from streams and related interests was driven by higher deliveries from Northparkes, Cerro Lindo and Buriticá, as well as deliveries from the Allied Streams and initial ounces acquired during the third quarter of 2024, partially offset by lower deliveries from ATO, Moss, El Mochito and La Colorada. Higher revenue from royalties was largely due to higher attributable royalty ounces from Camino Rojo and Kensington, which began paying earlier in 2024, partially offset by lower attributable royalty ounces from Fosterville.
The average market gold price and gold sales volume for our streams and related interests for the year ended December 31, 2024, was $2,386 per ounce and 44,962 ounces, respectively, compared to $1,941 per ounce and 38,374 ounces, respectively, in the prior year. The average market silver price and silver sales volume for our streams and related interests for the year ended December 31, 2024, was $28.27 per ounce and 3.4 million ounces, respectively, compared to $23.35 per ounce and 3.2 million ounces, respectively, in the prior year.
23
Cost of sales primarily represents the price of metals acquired under the stream agreements and related interests, cost of sales related to prepaid gold interests, as well as the depletion expense for streams and royalties, both of which are calculated based on units of metal sold or attributable royalty ounces. Cost of sales for the year ended December 31, 2024 was $113.8 million (including depletion) from streams and related interests and royalties, compared to $101.9 million (including depletion) from streams and related interests and royalties in the prior year. The increase in cost of sales for the year ended December 31, 2024, was largely due to cost of sales associated with higher metal deliveries from the Northparkes, Cerro Lindo and Buriticá streams, partially offset by lower deliveries from the ATO, Moss, La Colorada and El Mochito streams. Cost of sales for the year ended December 31, 2024, included $6.9 million of costs relating to metal delivered from Agbaou and Bonikro based on production for the pre-closing period of January 1, 2024, to August 14, 2024, which were recorded at the prevailing market price.
Gross profit was $155.2 million for the year ended December 31, 2024, compared to $102.1 million in the prior year. The increase was largely driven by higher stream deliveries from Northparkes, Cerro Lindo and Buriticá, deliveries from the Allied Streams acquired during the year, combined with higher realized gold and silver prices and attributable royalty ounces from Camino Rojo and Kensington, which began paying earlier in 2024, partially offset by lower metal deliveries from the ATO, Moss, La Colorada and El Mochito streams and lower attributable royalty ounces from Fosterville.
General administration costs were $21.8 million for the year ended December 31, 2024, compared to $20.1 million in the prior year. Higher costs for the year ended December 31, 2024, were largely due to higher employee costs, higher office and other expenses driven by various public company costs, as well as higher professional services as we continued to grow the business.
Business development costs were $3.4 million for the year ended December 31, 2024, compared to $4.2 million in the prior year. Business development costs represent ongoing business development costs incurred throughout the year including use of third-party service providers, net of costs capitalized, and costs reimbursed from our counterparties.
Impairment charges and expected credit losses for the year ended December 31, 2024, of $148.0 million were largely due to impairments and expected credit losses taken on the Nevada Copper stream and related interests ($104.1 million) as well as impairments and expected credit losses taken on the Elevation Gold stream and related interests ($40.1 million). Impairment charges and expected credit losses for the year ended December 31, 2023 of $36.8 million related to the impairment of the Renard stream and loan receivables ($20.2 million) and the Beaufor royalty ($6.8 million), as well as expected credit losses taken against loans receivable from Elevation Gold ($9.7 million).
Sustainability initiative expenditures were $0.9 million for the year ended December 31, 2024, broadly in line with the $0.7 million incurred in the prior year.
The increase in the fair value of our investments, prepaid gold interests and other for the year ended December 31, 2024, was $14.3 million, compared to $4.6 million for the prior year. This increase is largely driven by higher market gold prices during the year, primarily related to the Auramet prepaid gold interest.
Finance costs, net were $5.1 million for the year ended December 31, 2024, compared to $4.1 million in the prior year. The finance costs largely reflect interest charges and standby fees on the Credit Facility, net of interest earned on cash and loan balances. The increase was largely driven by higher interest rates, and lower interest received during the period.
Income tax expense was $10.3 million for the year ended December 31, 2024, compared to $0.1 million in the prior year. The increase in income tax expense was due to higher taxes driven by the 2024 sales mix.
Net loss for the year ended December 31, 2024 was $23.1 million, compared to net earnings of $36.3 million in the prior year. The net loss in 2024 was driven by higher impairment charges and expected credit losses as described above, partially offset by higher gross profits across the portfolio.
24
Consolidated Statements of Cash Flows
Three months ended December 31, 2025, compared to three months ended December 31, 2024, and year ended December 31, 2025, compared to year ended December 31, 2024 and December 31, 2023
The following table presents summarized consolidated statements of cash flows information for the three months ended December 31, 2025, compared to the three months ended December 31, 2024, and the year ended December 31, 2025, compared to year ended December 31, 2024 and December 31, 2023.
| | Three months ended December 31, | | Year ended December 31, | |||||||||||
($ thousands) | | 2025 | | 2024 | | 2025 | | 2024 | | 2023 | |||||
Operating cash flow before working capital and taxes | | $ | 90,681 | | $ | 62,625 | | $ | 315,007 | | $ | 220,721 | | $ | 161,953 |
Income taxes paid | |
| (3,092) | |
| (257) | |
| (11,577) | |
| (6,992) | |
| (6,083) |
Operating cash flow before working capital | | | 87,589 | | | 62,368 | | | 303,430 | | | 213,729 | | | 155,870 |
Change in working capital | |
| 1,908 | |
| 1,105 | |
| 9,402 | |
| (226) | |
| (1,732) |
Operating cash flow | |
| 89,497 | |
| 63,473 | |
| 312,832 | |
| 213,503 | |
| 154,138 |
Net Cash (used in) from investing activities | |
| (341) | |
| 236 | |
| (217,971) | |
| (81,960) | |
| (212,979) |
Net Cash (used in) from financing activities | |
| (26,831) | |
| (51,007) | |
| (59,858) | |
| (112,600) | |
| 5,123 |
Effect of exchange rate changes on cash and cash equivalents | |
| 45 | |
| (59) | |
| 36 | |
| (77) | |
| (1) |
Increase (decrease) in cash during the period | |
| 62,370 | |
| 12,643 | |
| 35,039 | |
| 18,866 | |
| (53,719) |
Cash and cash equivalents at beginning of period | |
| 8,914 | |
| 23,602 | |
| 36,245 | |
| 17,379 | |
| 71,098 |
Cash and cash equivalents at end of period | | $ | 71,284 | | $ | 36,245 | | $ | 71,284 | | $ | 36,245 | | $ | 17,379 |
Three months ended December 31, 2025, compared to three months ended December 31, 2024
Operating cash flow for the three months ended December 31, 2025 was $89.5 million, a quarterly record and an increase of 41% from $63.5 million for the same period in the prior year. The increase was largely driven by higher cash flows from streams and related interests and royalties as a result of higher realized metal prices, combined with higher metal deliveries and higher attributable royalty ounces.
Net cash used in investing activities for the three months ended December 31, 2025, was $0.3 million, compared to net cash from investing activities of $0.2 million for the same period in the prior year.
Net cash used in financing activities for the three months ended December 31, 2025, was $26.8 million, compared to $51.0 million for the same period in the prior year. Net cash used in financing activities for the three months ended December 31, 2025, largely consisted of $13.0 million of Credit Facility repayments, dividend payments of $11.9 million, and $1.0 million paid to purchase common shares under the NCIB, as well as interest payments of $0.9 million. Net cash used in financing activities for the three months ended December 31, 2024 largely consisted of $35.0 million of Credit Facility repayments, dividend payments of $11.1 million, and $3.9 million paid to purchase common shares under the NCIB, as well as interest payments of $1.0 million.
25
Year ended December 31, 2025, compared to year ended December 31, 2024
Operating cash flow for the year ended December 31, 2025, was $312.8 million, an annual record and an increase of 47% from $213.5 million in the prior year. The increase was largely driven by higher cash flows from streams and related interests and royalties driven by higher realized metal prices as well as higher deliveries and attributable royalty ounces.
Net cash used in investing activities for the year ended December 31, 2025, was $218.0 million, compared to $82.0 million in the prior year. Net cash used in investing activities in 2025 largely consisted of the cash component of the acquisition of Orogen and its 1.0% NSR royalty on the Arthur Gold project in Nevada for $127.9 million, the acquisition of the Sierra Sun Streams for $35.0 million, the acquisition of the Tres Quebradas lithium royalty for $28.0 million, and the acquisition of an additional 1.5% GR royalty on the Johnson Camp Mine for $4.0 million, partially offset by proceeds from the sale of various equity investments and the $4.3 million recovery on loan receivables from Elevation Gold. Net cash used in investing activities in 2024 included the acquisition of the Allied Streams and Allied Initial Ounces for $53.0 million, the acquisition of the Additional Tamarack Royalty for $8.0 million, $5.0 million for the acquisition of the Steppe Gold Prepaid Gold Interest, and $2.0 million of funding for the Prieska GRR, partially offset by proceeds from the sale of investments of $3.1 million.
Net cash used in financing activities for the year ended December 31, 2025, was $59.9 million, compared to $112.6 million in the prior year. Net cash used in financing activities in 2025 largely consisted of $45.8 million of dividend payments and $9.0 million paid to purchase shares under the NCIB. Net cash from financing activities in 2024 largely consisted of $57.0 million in net Credit Facility repayments, $43.3 million of dividend payments, $8.9 million paid to purchase shares under the NCIB, and interest payments of $4.7 million.
Year ended December 31, 2024, compared to year ended December 31, 2023
Operating cash flow was $213.5 million for the year ended December 31, 2024, compared to $154.1 million in the prior year. The increase was largely driven by higher cash flows from streams and related interests and attributable royalties as a result of higher realized metal prices, along with higher metal deliveries and higher attributable royalty ounces.
Net cash used in investing activities was $82.0 million for the year ended December 31, 2024, compared to $213.0 million for the same period in the prior year. Net cash used in investing activities in 2024 included the acquisition of the Allied Streams and the Allied Initial Ounces for $53.0 million, acquisition of the Additional Tamarack Royalty for $8.0 million, and $5.0 million for the acquisition of the Steppe Gold Prepaid Gold Interest, partially offset by proceeds from the sale of various equity investments of $3.1 million. Net cash used in investing activities in 2023 included $146.0 million in net cash outflows pursuant to the Maverix acquisition, $16.6 million for the acquisition of an additional NSR royalty interest in Stawell, $13.5 million for the Agbaou NSR royalty, $5.5 million of funding for the Johnson Camp Mine GR royalty, and $3.4 million of funding for the Prieska GRR, $3.7 million for the Thunder Bay North NSR royalty, partially offset by $1.7 million of proceeds from the Eastern Borosi royalty buyback.
Net cash used in financing activities was $112.6 million for the year ended December 31, 2024, compared to net cash from financing activities of $5.1 million for the same period in the prior year. Net cash used in financing activities in 2024 largely consisted of $57.0 million in net Credit Facility repayments, $43.3 million of dividend payments, $8.9 million paid to purchase common shares under the NCIB, and interest payments of $4.7 million. Net cash from financing activities in 2023 largely consisted of $57.0 million in net drawdowns from the Credit Facility to fund the Maverix acquisition and $16.8 million of proceeds from the exercise of options and warrants, dividend payments of $41.3 million and $20.7 million paid to purchase common shares under the NCIB, as well as interest payments of $6.2 million.
26
Liquidity and Capital Resources
As at December 31, 2025, our cash and cash equivalents were $71.3 million, compared to $36.2 million as at December 31, 2024. Significant variations in the liquidity and capital resources during the period are explained in the ‘‘Consolidated Statements of Cash Flows’’ section of this MD&A.
Our primary uses of capital are to finance operations, acquire new stream and royalty assets, and for general working capital and payment of dividends. Our objectives when managing capital are to ensure that we will continue to have enough liquidity to achieve our acquisition growth strategy, finance working capital requirements and provide returns to our shareholders. The timing of metal sales from inventory from our stream and related interests is based on commercial considerations, including our assessment of market conditions and our financial requirements. We believe our cash on hand, estimated cash flow from royalties and the sales of metal credits will be sufficient to fund our anticipated operating cash requirements, payment of dividends and share repurchases under the NCIB for the next 12 months and beyond.
Credit Facility
The Company renewed and upsized its Credit Facility on April 22, 2025. The Company has a Credit Facility of $700.0 million with an additional uncommitted accordion of up to $300.0 million for a total availability of up to $1.0 billion, maturing on April 22, 2029. The Credit Facility is secured by the Company under a General Security Agreement. As at December 31, 2025, the Credit Facility balance was $nil.
Finance costs relating to the Credit Facility for the three months and year ended December 31, 2025 were $0.7 million and $4.0 million, respectively, including interest, amortization of debt issuance costs and standby fees. This compares to finance costs of $1.0 million and $5.5 million, respectively, for the three months and year ended December 31, 2024. The Credit Facility includes covenants that require us to maintain certain financial ratios, including leverage ratios, as well as certain non-financial requirements. As at December 31, 2025, all such ratios and requirements were met. The Credit Facility is used for general corporate purposes and investments in the mineral industry, including the acquisition of streams and related interests and royalty assets.
27
| | | | | | 2025 | | 2024 | | ||||||||
| | Q4 | | Q3 | | Q2 | | Q1 | | Q4 | | Q3 | | Q2 | | Q1 | |
Financial measures: | | | | | | | | | | | | | | | | | |
Cash and cash equivalents |
| 71,284 | | 8,914 | | 81,770 | | 18,757 | | 36,245 | | 23,602 | | 21,063 | | 29,361 |
|
Total assets |
| 2,113,478 | | 2,046,309 | | 1,848,480 | | 1,794,055 | | 1,769,979 | | 1,773,227 | | 1,740,847 | | 1,903,556 |
|
Revenue |
| 118,916 | | 93,456 | | 94,087 | | 82,245 | | 74,213 | | 73,669 | | 63,581 | | 57,528 |
|
Net earnings (loss) |
| 76,832 | | 61,916 | | 55,736 | | 45,521 | | 41,280 | | 29,649 | | (111,437) | | 17,424 |
|
Earnings (loss) per share - basic and diluted |
| 0.37 | | 0.30 | | 0.28 | | 0.23 | | 0.20 | | 0.15 | | (0.55) | | 0.09 |
|
Operating cash flow |
| 89,497 | | 81,366 | | 76,114 | | 65,854 | | 63,473 | | 61,798 | | 49,357 | | 38,875 |
|
Operating cash flow per share - basic |
| 0.43 | | 0.39 | | 0.38 | | 0.33 | | 0.32 | | 0.31 | | 0.25 | | 0.19 |
|
GEOs |
| 28,757 | | 27,037 | | 28,682 | | 28,761 | | 27,864 | | 29,773 | | 27,192 | | 27,794 |
|
| | | | | | | | | | | | | | | | | |
Non-IFRS measures3: | | | | | | | | | | | | | | | | |
|
Adjusted Net Earnings |
| 67,561 | | 49,292 | | 47,935 | | 40,677 | | 36,252 | | 28,327 | | 22,903 | | 22,180 |
|
Adjusted Net Earnings per share |
| 0.33 | | 0.24 | | 0.24 | | 0.20 | | 0.18 | | 0.14 | | 0.11 | | 0.11 |
|
Adjusted EBITDA |
| 101,000 | | 78,509 | | 76,166 | | 70,694 | | 62,980 | | 61,702 | | 49,553 | | 45,964 |
|
| | | | | | | | | | | | | | | | | |
Average gold price4 |
| 4,135 | | 3,457 | | 3,280 | | 2,860 | | 2,663 | | 2,474 | | 2,338 | | 2,070 |
|
Average silver price5 |
| 54.73 | | 39.40 | | 33.68 | | 31.88 | | 31.38 | | 29.43 | | 28.84 | | 23.34 |
|
| 1. | All amounts in thousands of U.S. dollars except for GEOs, per share information, and average gold and silver price. |
| 2. | Sum of all the quarters may not add up to the annual total due to rounding. |
| 3. | Adjusted net earnings, adjusted net earnings per share and adjusted EBITDA as presented above are non-IFRS financial performance measures with no standardized meaning under IFRS Accounting Standards and therefore may not be comparable to similar measures presented by other issuers. For further information and a detailed reconciliation of adjusted net earnings, adjusted net earnings per share and adjusted EBITDA to the most directly comparable IFRS Accounting Standards measure, see ‘‘Non-IFRS Financial Performance Measures’’ in this MD&A. |
| 4. | Based on the LBMA PM fix. |
| 5. | Based on the LBMA fix. |
In the fourth quarter of 2025, we achieved record revenue and operating cash flows driven by higher metal prices and higher deliveries from Cerro Lindo and El Mochito. We also divested the El Mochito silver stream, recognizing a gain of $5.4 million. In the third quarter of 2025, we completed the acquisition of Orogen and its 1.0% NSR royalty on the Arthur gold project in Nevada and acquired a portfolio of royalties on the Minera Florida gold mine in Chile. In the second quarter of 2025, we renewed and upsized our Credit Facility and acquired an additional 1.5% GR on the Johnson Camp Mine. In the first quarter of 2025, we completed the acquisition of the Tres Quebradas lithium royalty and the Sierra Sun Streams.
In the fourth quarter of 2024, we achieved significant growth in revenue and operating cash flows driven by higher metal prices and higher deliveries from Cerro Lindo, Northparkes and Buriticá. In the third quarter of 2024, we completed the acquisition of 3% gold streams on each of the Agbaou and Bonikro mines, as well as the acquisition of an additional royalty on the Tamarack project. In the first quarter of 2024, we reached a settlement on the Kensington royalty litigation with Coeur, which subsequently began paying.
28
From time to time, we are and may be involved in disputes with other parties arising in the ordinary course of business that may result in litigation. If we are unable to resolve these disputes favorably, it may have a material adverse impact on our financial condition, cash flow and results of operations. We record a liability when it is probable that a loss has been incurred and the amount can be reasonably estimated. We are not currently involved in any material legal proceedings.
Contractual Obligations and Commitments
In the normal course of business, we enter into contracts that give rise to commitments for future minimum payments.
As of December 31, 2025, we had significant commitments to make per ounce cash payments for precious metals and copper pursuant to the terms of the metals purchase and sale agreements and prepaid interests, as detailed in the following table:
| | | | | | | | Attributable | | | | |
|
| | | | | | | | volume | | Per unit | | |
|
Mineral interest | | Commodity | | Inception date | | Unit | | purchased | | cash payment | | Term |
|
Cerro Lindo |
| Silver |
| Dec. 20, 2016 |
| Ounce |
| 65%1 |
| 10% of monthly average |
| Life of mine | |
ATO |
| Gold |
| Aug. 11, 2017 |
| Ounce |
| 25%2 |
| 17% of spot |
| Life of mine | |
ATO |
| Silver |
| Aug. 11, 2017 |
| Ounce |
| 50%3 |
| 17% of spot |
| Life of mine | |
Gunnison |
| Copper |
| Oct. 30, 2018 |
| Pound |
| 16.5%4 |
| 25% of spot |
| Life of mine | |
Buriticá |
| Silver |
| Mar. 15, 2019 |
| Ounce |
| 100%5 |
| 5% of spot |
| Life of mine | |
Impala Bafokeng |
| Gold |
| Jan. 23, 2020 |
| Ounce |
| 70%6 |
| 5% of spot |
| Life of mine | |
Northparkes |
| Gold |
| Jul. 10, 2020 |
| Ounce |
| 54%7 |
| 10% of spot |
| Life of mine | |
Northparkes |
| Silver |
| Jul. 10, 2020 |
| Ounce |
| 80%7 |
| 10% of spot |
| Life of mine | |
La Bolsa | | Gold | | Jan. 19, 2023 | | Ounce | | 5% | | Lesser of $450 and spot | | Life of mine | |
La Colorada | | Gold | | Jan. 19, 2023 | | Ounce | | 100% | | Lesser of $650 and spot | | Life of mine | |
Agbaou | | Gold | | Aug. 14, 2024 | | Ounce | | 3%8 | | 10% of spot |
| Life of mine | |
Bonikro | | Gold | | Aug. 14, 2024 | | Ounce | | 3%9 | | 10% of spot |
| Life of mine | |
Arcata and Azuca | | Gold | | Feb. 27, 2025 | | Ounce | | 5% | | 10% of spot |
| Life of mine | |
Arcata and Azuca | | Silver | | Feb. 27, 2025 | | Ounce | | 5% | | 10% of spot |
| Life of mine | |
| | | | | | | | | | | | | |
Prepaid interests | | | | | | | | | | | | | |
Auramet |
| Gold |
| Jan. 19, 2023 | | Ounce |
| 1,250 ounces per |
| 16% of spot |
| Commercial conditions milestones | 10 |
| 1. | 65% of payable silver produced from Cerro Lindo until 19.5 million ounces have been delivered and 25% thereafter. |
| 2. | 25% of gold from ATO until 46,000 ounces of gold have been delivered and thereafter, 25% of gold subject to an annual cap of 7,125 ounces. |
| 3. | 50% of silver from ATO until 375,000 ounces of silver have been delivered and thereafter, 50% of silver subject to an annual cap of 59,315 ounces. |
| 4. | The stream percentage of refined copper produced from the Gunnison mine ranges from 3.5% to 16.5% depending on the Gunnison mine’s total production capacity, with the stream percentage starting at 16.5% and decreasing as the Gunnison mine’s production capacity increases. We have the option to increase our stream participation percentage by paying an additional deposit of an amount up to $65.0 million. |
| 5. | Streamed silver is to be based on a fixed silver-to-gold ratio of 1.84 over the life of the asset. |
| 6. | 70% of the payable gold until 261,000 ounces have been delivered and 42% thereafter. |
| 7. | 54% of the payable gold produced from the Northparkes mine until 630,000 ounces have been delivered and 27% thereafter; 80% of payable silver produced from the Northparkes mine until 9 million ounces have been delivered and 40% thereafter. |
| 8. | 3% of payable gold until 29,000 ounces have been delivered and 2% thereafter. |
| 9. | 3% of payable gold until 39,300 ounces have been delivered and 2% thereafter. |
| 10. | On and after September 27, 2031, and the delivery of 50,000 ounces of gold. |
29
($ thousands) | | Less than 1 year | | 1–3 years | | 3–5 years | | Total | ||||
Undiscounted lease obligation1 | | $ | 463 | | $ | 799 | | $ | 357 | | $ | 1,619 |
Amounts payable and other liabilities | |
| 35,322 | |
| — | |
| — | |
| 35,322 |
Stand-by fees2 | | | 2,030 | | | 4,066 | | | 623 | | | 6,719 |
| | $ | 37,815 | | $ | 4,865 | | $ | 980 | | $ | 43,660 |
| 1. | We are committed to minimum amounts under long-term lease agreements for office space, which expire in 2029. |
| 2. | Represents standby charges on the Credit Facility, which matures on April 22, 2029. |
Investments in Stream and Royalty Interests
As of December 31, 2025, we had commitments related to the acquisition of streams and royalties as detailed below:
Company | | Project (Asset) | | | | Triggering Event |
Centerra Gold Inc.1 | | Kemess Project | | $10 million |
| Positive construction decision |
| | | | $10 million |
| 1st anniversary of positive construction decision |
| | | | $12.5 million |
| 2nd anniversary of positive construction decision |
| | | | $12.5 million |
| 3rd anniversary of positive construction decision |
DS McKinnon Holdings Limited |
| Hemlo | | C$50,000 |
| For each 100,000 ounces of gold produced by the |
154619 Canada Inc. |
| Eagle River | | C$50,000 |
| For each 50,000 ounces of gold produced by the |
Silvercorp Metals2 | | Silvertip | | Payment of deferred | | Payment contingent upon commencement of commercial production and cumulative throughput of 400,000 tonnes of ore |
Barrick Gold Corporation3 | | Portfolio of royalties | | Up to $10 million | | Payment contingent upon certain commercial conditions |
Orion Minerals Ltd.4 | | Prieska Copper‐Zinc | | $80 million | | Conditional upon certain conditions |
| 1. | Kemess stream agreement is with Aurico Metals Inc., a subsidiary of Centerra Gold Inc. |
| 2. | Maverix acquired the Silvertip royalty from 0875786 BC. Ltd., a subsidiary of Silvercorp Metals inc. (“Silvercorp”). The payment of the deferred equity consideration is payable to Silvercorp. |
| 3. | Subsequent to year end, Skeena Gold + Silver announced that it had completed the permitting process for its Eskay Creek Gold-Silver Project. Receipt of permits to advance Eskay Creek into commercial production triggered the payment of contingent consideration to Barrick Gold Corporation (“Barrick”) of $6 million. Following this payment, remaining additional contingent consideration payment obligations owed to Barrick of up to $4 million will continue to be outstanding. |
| 4. | Upon the condition of obtaining the South African Reserve Bank exchange control approvals, the mine being fully funded and the finalization of an executable mine plan to Triple Flag’s satisfaction. If the above conditions are met, funding is to be provided in tranches with each tranche subject to the mine continuing to be fully funded to production, among other conditions, and of an amount not to exceed planned expenditures for the next 90 days. Triple Flag has the option to reject the mine plan and supporting documentation, entitling either party to terminate the stream agreement. |
The commitments noted in the table above are expected to be funded from operating cash flow over the next few years.
30
Off-Balance Sheet Arrangements or Commitments
We have not entered into any off-balance sheet arrangements or commitments other than as set forth under ‘‘Contractual Obligations and Commitments’’.
Contingencies
Contingencies can be either possible assets or possible liabilities arising from past events which, by their nature, will be resolved only when one or more future events, not wholly within our control, occur or fail to occur. The assessment of such contingencies inherently involves the exercise of significant judgment and estimates of the outcome of future events. Refer to Note 17 to the Annual Financial Statements for further details on the contingencies.
We are not aware of any known trends, commitments (other than as described above), events or uncertainties that will materially affect the Company.
Overview
We are in the business of rational risk-taking in pursuit of value creation. Effective risk management is core to the attainment of often competing priorities. The ability to deliver on our vision and strategic objectives depends on our ability to understand and effectively respond to and mitigate the risks or uncertainties we face. To achieve this, we:
| ● | Identify, assess and communicate our key risks; |
| ● | Integrate risk management into strategic priorities and plans; |
| ● | Incorporate procedures for managing risk into our decision-making processes so that we mitigate risks and minimize the uncertainty of achieving our objectives; |
| ● | Combine careful due diligence, legal, financial and commercial structuring and oversight to identify, assess and manage risks on new deals and for existing assets in the portfolio; |
| ● | Maintain a structure to manage risk effectively and in a manner that seeks to maximize value creation; |
| ● | Monitor relevant controls on an ongoing basis to assess their effectiveness and ensure that they are complied with; and |
| ● | Provide assurance to the Chief Executive Officer and the Audit & Risk Committee of the Board of Directors on the effectiveness of key control activities on a regular basis. |
Board of Directors and Audit & Risk Committee Oversight
We maintain strong risk oversight practices at Triple Flag by clearly outlining responsibilities in the mandates of Triple Flag’s board of directors (the “Board”) and Audit & Risk Committee. The Board’s mandate makes clear the responsibility for reviewing and discussing with management the processes used to assess and manage risk, including the identification of the principal risks of the business and the implementation of appropriate systems to deal with such risks. The Audit & Risk Committee assists the Board in overseeing the Company’s management of risks as well as the implementation of policies and standards for monitoring such risks and monitoring and reviewing the Company’s financial position and risk management programs. The Audit & Risk Committee also provides oversight focusing on financial and operational (e.g., cyber security, hedging practices, etc.) risk exposures.
31
Management Oversight
Senior management oversees a weekly team meeting to discuss various issues including, but not limited to, risks facing the organization. This allows for the timely identification and mitigation of key risks that may prevent us from achieving our objectives, while fostering transparency. We rely on ongoing broad management involvement and specific external expertise in key meetings on new deals, particularly at the moment of committing capital, to equip us to make well-informed decisions and encourage contrarian and divergent perspectives to challenge our views and analyses.
The following subsections highlight some of our key sources of uncertainty and relevant risk mitigation activities. The occurrence of any of the risks discussed below could materially adversely affect our business, prospects, financial condition, cash flow or share price. The list of risk factors below is not exhaustive, and other risks and uncertainties that we do not presently consider to be material, or of which we are not presently aware, may become important factors that affect our future financial condition and results of operations.
Key Risk Factors
| ● | Fluctuations in commodity prices; |
| ● | The passive nature of our investments – we have limited to no control over the operation of the properties in which we hold an interest, or an operator’s failure to perform or their decision to cease or suspend operations; |
| ● | Our inability to control the budgeting, forecasting and planning capabilities of our portfolio asset mining partners requires us to apply judgment in establishing forward-looking outlooks as we seek to set guidance for our investors; |
| ● | Revenue concentration – a significant portion of our revenue comes from a small number of operating properties within our portfolio, and adverse developments at these properties could have a more significant or lasting impact; |
| ● | Future pandemics and public health emergencies; |
| ● | The impact of global financial conditions such as inflation and changes in the U.S. dollar and interest rates; |
| ● | Our liquidity profile, including level of indebtedness; |
| ● | Changes in governments, the intervention of governments, or other political or economic developments in the jurisdictions in which we do, or may in the future, carry on business; |
| ● | Changing or increasing regulatory requirements, including increasing taxes, the imposition of tariffs, or other measures; |
| ● | Our ability to maintain appropriate internal control over financial reporting and disclosure; and |
| ● | Our reliance on information and plans, including mine plans, from counterparties for our guidance that are based on estimates, including mineral reserves and resources, and assumptions and interpretations that may not prove to be correct. |
For additional information about these risks and others, see the “Risk Factors” section of the Company’s most recent annual information form available on SEDAR+ at www.sedarplus.ca and on EDGAR at www.sec.gov. Also see the “Forward-Looking Information” section in this MD&A.
32
Disclosure Controls & Procedures
Management is responsible for establishing and maintaining a system of disclosure controls and procedures to provide reasonable assurance that all material information relating to the Company is gathered and reported to senior management, including the Chief Executive Officer and Chief Financial Officer of the Company, on a timely basis so that appropriate decisions can be made regarding public disclosure, including to ensure that information required to be disclosed by the Company in reports that the Company files or submits under the U.S. Securities Exchange Act of 1934, as amended (the “U.S. Exchange Act”), and applicable Canadian securities laws is recorded, processed, summarized and reported within the time periods specified in the rules and forms of the U.S. Securities and Exchange Commission (the “SEC”) and the Canadian securities regulatory authorities. Management, under the oversight of the Chief Executive Officer and Chief Financial Officer, has evaluated the effectiveness of the Company’s disclosure controls and procedures as of December 31, 2025. Based on this evaluation, the Chief Executive Officer and Chief Financial Officer concluded that the Company’s disclosure controls and procedures (as defined in National Instrument 52-109 – Certification of Disclosure in Issuers’ Annual and Interim Filings and in Rule 13a-15(e) and Rule 15d-15(e) under the U.S. Exchange Act) were effective as of December 31, 2025.
The Company’s disclosure controls and procedures are designed to provide reasonable assurance of achieving their objectives, and the Chief Executive Officer and Chief Financial Officer do not expect that the disclosure controls and procedures will prevent all errors and fraud. A control system, no matter how well conceived or operated, can provide only reasonable, not absolute, assurance that the objectives of the control system are met. Disclosure controls and procedures have been designed to provide reasonable assurance that all relevant information required to be disclosed by the Company is accumulated and communicated to senior management as appropriate to allow timely decisions regarding required disclosure.
Internal Controls over Financial Reporting
The Chief Executive Officer and Chief Financial Officer are responsible for establishing and maintaining internal controls over financial reporting in order to provide reasonable assurance regarding the reliability of financial reporting and the preparation of financial statements for external purposes in accordance with IFRS Accounting Standards. The Company’s internal control framework was designed based on the criteria set forth in Internal Control – Integrated Framework (2013) issued by the Committee of Sponsoring Organizations (COSO) of the Treadway Commission 2013 Framework.
There was no change in the Company’s internal controls over financial reporting that occurred during the three months and year ended December 31, 2025, that has materially affected, or is reasonably likely to materially affect, the Company’s internal controls over financial reporting.
The Company’s management assessed the effectiveness of the Company’s internal control over financial reporting as at December 31, 2025, using the COSO framework. Based on management’s assessment, the Company’s internal control over financial reporting was effective as at December 31, 2025. The effectiveness of the Company’s internal control over financial reporting as at December 31, 2025, has been audited by PricewaterhouseCoopers LLP, Independent Registered Public Accounting Firm, as stated in their report, which is located on page 3 of the Company’s Annual Financial Statements.
The Company’s management, including the Chief Executive Officer and Chief Financial Officer, believe that any internal controls over financial reporting and disclosure controls and procedures, no matter how well designed, can have inherent limitations. Therefore, even those systems determined to be effective can provide only reasonable assurance that the objectives of the control system are met.
33
IFRS Accounting Standards Critical Accounting Policies and Accounting Estimates
Management has discussed the development and selection of our critical accounting estimates with the Audit & Risk Committee and the Board, and the Audit & Risk Committee has reviewed the disclosure relating to such estimates in conjunction with its review of this MD&A. The accounting policies and methods we utilize determine how we report our financial condition and results of operations, and they may require management to make estimates or rely on assumptions about matters that are inherently uncertain. The consolidated financial statements have been prepared in accordance with IFRS Accounting Standards. Our material accounting policies are disclosed in Note 3 to the Annual Financial Statements, including a summary of current and future changes in accounting policies, which are included in Note 5 to the Annual Financial Statements.
New accounting standards issued but not yet effective which are applicable to the Company.
Amendments to IFRS 9 Financial Instruments (“IFRS 9”) and IFRS 7 Financial Instruments: Disclosures (“IFRS 7”)
The International Accounting Standards Board (“IASB”) has issued amendments that allow an entity to elect to apply trade-date accounting for the derecognition of financial liabilities when settled in cash through electronic payment systems. The amendments also introduce additional disclosure requirements to improve transparency regarding equity instruments designated at Fair value through other comprehensive income (“FVOCI”) and financial instruments containing contingent features. These changes are effective for annual reporting periods beginning on or after January 1, 2026, with early adoption permitted.
The IFRS 9 amendment allows a financial liability to be derecognized upon the irrevocable settlement instruction via an electronic payment system, even if cash settlement occurs shortly thereafter. The Company has determined that this amendment will not have a material effect on the Company’s financial position.
The IFRS 7 amendments require enhanced disclosures for (i) equity instruments designated at FVOCI and (ii) financial instruments that include contingent settlement or conversion features. As the Company does not hold any FVOCI-designated equities and has no material contingent payment features in its financial instruments, these new disclosures will have limited impact.
IFRS 18 Presentation and Disclosures in Financial Statements (“IFRS 18”)
IFRS 18 introduces categories and defined subtotals in the statement of profit or loss, disclosures on management-defined performance measures (“MPMs”), and requirements to improve the aggregation and disaggregation of information in the financial statements. Amendments to IAS 7 Cash Flows were issued concurrently as a result of the new subtotals introduced in the statement of profit or loss. IFRS 18 is effective for annual reporting periods beginning on or after January 1, 2027, and is to be applied retrospectively, with early adoption permitted. The adoption of IFRS 18 is expected to change the presentation and structure of the Company’s primary financial statements but is not expected to have a material impact on the measurement of net earnings or cash flows.
The adoption of IFRS 18 will reshape the presentation of the Company’s financial statements but is not expected to affect the measurement of net earnings or cash flows. IFRS 18 will require additional note disclosures such as for MPMs where certain non-IFRS performance measures, representing subtotals of income and expenses, are used in public communications. Management is monitoring pronouncements from both the IASB and the regulators. The Company is continuing to evaluate the detailed impact of IFRS 18 on the Company’s financial statement presentation, disclosures, and internal controls.
34
Critical Accounting Estimates and Judgments
The preparation of consolidated financial statements in accordance with IFRS Accounting Standards requires management to make judgments, estimates and assumptions that affect the application of the Company’s accounting policies, which are described in Note 3, the reported amounts of assets and liabilities and disclosure of commitments at the date of the consolidated financial statements, and the reported amounts of revenues and expenses during the reporting period. The determination of estimates requires the exercise of judgment based on various assumptions and other factors such as historical experience, and current and expected economic conditions. Actual results could differ from those estimates.
Management’s estimates and underlying assumptions are reviewed on an ongoing basis. Any changes or revisions to estimates and underlying assumptions are recognized in the period in which the estimates are revised and in any future periods affected.
The key sources of estimation uncertainty that have a significant risk of causing a material adjustment to the carrying amounts of assets and liabilities and earnings within the next financial year and key judgments used in the preparation of these consolidated financial statements are discussed below.
Mineral Resource and Mineral Reserves estimates and depletion
Mineral interests represent agreements for which settlement is called for in the payment of royalties or in multi-year delivery with reference to a percentage of production from a mine. Mineral interests comprise a large component of the Company’s assets and, as such, any change in the Mineral Resources and Mineral Reserves estimates of the properties to which the interests relate may have a significant effect on the Company’s consolidated financial statements. The estimation of Mineral Resources and Mineral Reserves includes the volume and timing of future metal deliveries which impacts rates of depletion and recoverability of the carrying value of the mineral interests.
In determining these estimates, the Company relies on information to which it is entitled under contracts with operators and/or public disclosures of Mineral Resource and Mineral Reserves information from the mine operators for specific properties.
The estimation of recoverable Mineral Resources and Mineral Reserves in respect of each agreement is generally based upon factors such as:
| ● | estimates of mine operating costs; |
| ● | foreign exchange rates and commodity prices; |
| ● | terms for offtake agreements; |
| ● | future development costs; and |
| ● | geological interpretation of drill results and judgments made in estimating the size and grade of the ore body. |
The Company estimates exploration potential based on:
| ● | the size of the land package applicable to the agreement; |
| ● | the cost and intensity of exploration programs proposed by the mine operator; |
| ● | geological structures; and |
| ● | ore body continuity and assessment of geotechnical limits. |
These assumptions are, by their nature, subject to interpretation and uncertainty.
The estimates of Mineral Resources and Mineral Reserves may change based on additional knowledge gained subsequent to the initial assessment. Changes in the estimates of Mineral Resources and Mineral Reserves may materially impact the recorded amounts of depletion and the assessed recoverability of the carrying value of royalty and stream interests.
35
Impairment
Assessment of whether there are any indicators of impairment and reversal of impairment of mineral interests at the end of each reporting period requires the application of judgment.
Indicators which could trigger an impairment or impairment reversal include, but is not limited to, significant adverse changes to (i) future production and operator reserve and resource estimates, (ii) current and forecast commodity prices, (iii) industry or economic trends, and (iv) other relevant operator information. Changes to any of the assumptions and estimates used in determining the fair value of the royalty and streams could impact the impairment or impairment reversal analysis.
As at December 31, 2025, the Company did not identify any indicators of impairment or indicators of impairment losses previously recognized which should be reversed or partially reversed.
Income taxes
The interpretation and application of existing tax laws, regulations and rules in Australia, Bermuda, Canada, Colombia, Côte d’Ivoire, Mexico, Mongolia, Peru, South Africa, the United Kingdom and the United States, or any of the other countries in which mineral interests are located or where commodities are sold, requires judgment. The likelihood that tax positions taken will be sustained upon examination by applicable tax authorities is based on facts and circumstances of the relevant tax position, considering all available evidence. Differing interpretation of these laws, regulations and rules could result in an increase in the Company’s taxes, governmental charges, duties or impositions.
In assessing the probability of realizing deferred income tax assets, the Company makes estimates related to expectations of future taxable income and expected timing of reversals of existing temporary differences. Such estimates are based on forecasted cash flows from operations which require the use of estimates and assumptions, such as forecast commodity prices and future production. Therefore, the amount of deferred income tax assets recognized on the balance sheet could be reduced if the actual results differ significantly from forecast. The Company reassesses its deferred income tax assets at the end of each reporting period. Deferred tax assets are reduced to the extent that it is no longer probable that sufficient taxable profit will be available to allow all or part of the asset to be recovered.
Non-IFRS Financial Performance Measures
Adjusted Net Earnings and Adjusted Net Earnings per Share
Adjusted net earnings is a non-IFRS financial measure, which excludes the following from net earnings:
| ● | impairment charges, write-downs, and reversals, including expected credit losses; |
| ● | gain/loss on sale or disposition of assets/mineral interests; |
| ● | foreign currency translation gains/losses; |
| ● | increase/decrease in fair value of investments, prepaid gold interests and other; |
| ● | other non-recurring charges; and |
| ● | impact of income taxes on these items. |
36
Management uses this measure internally to evaluate our underlying operating performance for the reporting periods presented and to assist with the planning and forecasting of future operating results. Management believes that adjusted net earnings is a useful measure of our performance because impairment charges, write-downs, and reversals, including expected credit losses, gain/loss on sale or disposition of assets/mineral interests, foreign currency translation gains/losses, increase/decrease in fair value of investments, prepaid gold interests and other, and non-recurring charges do not reflect the underlying operating performance of our core business and are not necessarily indicative of future operating results. The tax effect is also excluded by reconciling the amounts on a post-tax basis, consistent with net earnings. Management’s internal budgets and forecasts and public guidance do not reflect the types of items we adjust for. Consequently, the presentation of adjusted net earnings enables users to better understand the underlying operating performance of our core business through the eyes of management. Management periodically evaluates the components of adjusted net earnings based on an internal assessment of performance measures that are useful for evaluating the operating performance of our business and a review of the non-IFRS measures used by industry analysts and other streaming and royalty companies. Adjusted net earnings is intended to provide additional information only and does not have any standardized definition under IFRS Accounting Standards and should not be considered in isolation or as a substitute for measures of performance prepared in accordance with IFRS Accounting Standards. This measure is not necessarily indicative of gross profit or operating cash flow as determined under IFRS Accounting Standards. Other companies may calculate these measures differently. The following table reconciles adjusted net earnings to net earnings, the most directly comparable IFRS Accounting Standards measure.
Reconciliation of Net Earnings to Adjusted Net Earnings
| | Three months ended December 31, | | Year ended December 31, | ||||||||
($ thousands, except share and per share information) | | 2025 | | 2024 | | 2025 | | 2024 | ||||
Net earnings (loss) | | $ | 76,832 | | $ | 41,280 | | $ | 240,005 | | $ | (23,084) |
Impairment (reversal) charges and expected credit losses1 | | | — | | | — | | | (4,300) | | | 148,034 |
Gain on disposition of mineral interests | | | (5,354) | | | — | | | (6,710) | | | — |
Foreign currency translation (gain) loss | |
| (51) | |
| (76) | |
| 414 | |
| (181) |
Increase in fair value of investments, prepaid gold interests and other | |
| (20,687) | |
| (7,249) | |
| (46,233) | |
| (12,775) |
Other non-recurring charges2 | | | 10,299 | | | — | | | 10,299 | | | — |
Income tax effect | |
| 6,522 | |
| 2,297 | |
| 11,990 | |
| (2,387) |
Adjusted net earnings | | $ | 67,561 | | $ | 36,252 | | $ | 205,465 | | $ | 109,607 |
Weighted average shares outstanding – basic | |
| 206,561,183 | |
| 201,367,681 | |
| 203,618,559 | |
| 201,304,234 |
Weighted average shares outstanding – diluted | | | 207,165,115 | | | 201,677,897 | | | 204,071,985 | | | 201,304,234 |
Net earnings per share - basic | | $ | 0.37 | | $ | 0.20 | | $ | 1.18 | | $ | (0.11) |
Net earnings per share - diluted | | | 0.37 | | | 0.20 | | | 1.18 | | | (0.11) |
Adjusted net earnings per share - basic and diluted | | $ | 0.33 | | $ | 0.18 | | $ | 1.01 | | $ | 0.54 |
| 1. | Impairment reversals for the year ended December 31, 2025 are due to a reversal of impairment losses relating to previous impairments taken on the Elevation Gold loan receivables, following a recovery under a formal CCAA process. Impairment charges and expected credit losses for the year ended December 31, 2024 are largely due to impairments taken on the Nevada Copper stream and related interests as well as impairments taken on the Elevation Gold stream and related interests. |
| 2. | During the quarter and year ended December 31, 2025, the Company incurred $10.3 million (2024: nil) to settle a review of past transactions between the Company and Evolution, the operator of the Northparkes mine. |
37
Free Cash Flow
Free cash flow is a non-IFRS measure that deducts acquisition of other assets (excluding acquisition of investments and prepaid gold and other interests or mineral interests) from operating cash flow. Management believes this to be a useful indicator of our ability to operate without reliance on additional borrowing or usage of existing cash. Free cash flow is intended to provide additional information only and does not have any standardized definition under IFRS Accounting Standards and should not be considered in isolation or as a substitute for measures of performance prepared in accordance with IFRS Accounting Standards. The measure is not necessarily indicative of operating profit or operating cash flow as determined under IFRS Accounting Standards. Other companies may calculate this measure differently. The following table reconciles free cash flow to operating cash flow, the most directly comparable IFRS Accounting Standards measure:
| Three months ended December 31, | | Year ended December 31, | ||||||||
($ thousands) | 2025 | | 2024 | | 2025 | | 2024 | ||||
Operating cash flow | $ | 89,497 | | $ | 63,473 | | $ | 312,832 | | $ | 213,503 |
Acquisition of other assets |
| — | |
| — | |
| — | |
| — |
Free cash flow | $ | 89,497 | | $ | 63,473 | | $ | 312,832 | | $ | 213,503 |
Adjusted EBITDA
Adjusted EBITDA is a non-IFRS financial measure, which excludes the following from net earnings:
| ● | income tax expense; |
| ● | finance costs, net; |
| ● | depletion and amortization; |
| ● | impairment charges, write-downs, and reversals, including expected credit losses; |
| ● | gain/loss on sale or disposition of assets/mineral interests; |
| ● | foreign currency translation gains/losses; |
| ● | increase/decrease in fair value of investments, prepaid gold interests and other; |
| ● | non-cash cost of sales related to prepaid gold interests and other; and |
| ● | other non-recurring charges. |
Management believes that adjusted EBITDA is a valuable indicator of our ability to generate liquidity by producing operating cash flow to fund working capital needs, service debt obligations and fund acquisitions. Management uses adjusted EBITDA for this purpose. Adjusted EBITDA is also frequently used by investors and analysts for valuation purposes, whereby adjusted EBITDA is multiplied by a factor or ‘‘multiple’’ that is based on an observed or inferred relationship between adjusted EBITDA and market values to determine the approximate total enterprise value of a company.
In addition to excluding income tax expense, finance costs net, and depletion and amortization, adjusted EBITDA also removes the effect of impairment charges, write-downs, and reversals, including expected credit losses, gain/loss on sale or disposition of assets/mineral interests, foreign currency translation gains/losses, increase/decrease in fair value of investments, prepaid gold interests and other, non-cash cost of sales related to prepaid gold interests and other and non-recurring charges. We believe these items provide a greater level of consistency with the adjusting items included in our adjusted net earnings reconciliation, with the exception that these amounts are adjusted to remove any impact of income tax expense as they do not affect adjusted EBITDA. We believe this additional information will assist analysts, investors and our shareholders to better understand our ability to generate liquidity from operating cash flow, by excluding these amounts from the calculation as they are not indicative of the performance of our core business and not necessarily reflective of the underlying operating results for the periods presented.
38
Adjusted EBITDA is intended to provide additional information to investors and analysts and does not have any standardized definition under IFRS Accounting Standards and should not be considered in isolation or as a substitute for measures of performance prepared in accordance with IFRS Accounting Standards. Adjusted EBITDA is not necessarily indicative of operating profit or operating cash flow as determined under IFRS Accounting Standards. Other companies may calculate adjusted EBITDA differently. The following table reconciles adjusted EBITDA to net earnings, the most directly comparable IFRS Accounting Standards measure.
Reconciliation of Net Earnings to Adjusted EBITDA
| Three months ended December 31, | | Year ended December 31, | ||||||||
($ thousands) | 2025 | | 2024 | | 2025 | | 2024 | ||||
Net earnings (loss) | $ | 76,832 | | $ | 41,280 | | $ | 240,005 | | $ | (23,084) |
Finance costs, net |
| 575 | |
| 901 | |
| 3,459 | |
| 5,073 |
Income tax expense |
| 13,787 | |
| 6,064 | |
| 29,353 | |
| 10,314 |
Depletion and amortization |
| 19,468 | |
| 19,271 | |
| 79,578 | |
| 75,900 |
Impairment (reversal) charges and expected credit losses1 | | — | | | — | | | (4,300) | | | 148,034 |
Non-cash cost of sales related to prepaid gold interests and other |
| 6,131 | |
| 2,789 | |
| 19,149 | |
| 16,919 |
Gain on disposition of mineral interests | | (5,354) | | | — | | | (6,710) | | | — |
Foreign currency translation (gain) loss |
| (51) | |
| (76) | |
| 414 | |
| (181) |
Increase in fair value of investments, prepaid gold interests and other |
| (20,687) | |
| (7,249) | |
| (46,233) | |
| (12,775) |
Other non-recurring charges2 | | 10,299 | | | — | | | 10,299 | | | — |
Adjusted EBITDA | $ | 101,000 | | $ | 62,980 | | $ | 325,014 | | $ | 220,200 |
| 1. | Impairment reversals for the year ended December 31, 2025 are due to a reversal of impairment losses relating to previous impairments taken on the Elevation Gold loan receivables, following a recovery under a formal CCAA process. Impairment charges and expected credit losses for the year ended December 31, 2024 are largely due to impairments taken on the Nevada Copper stream and related interests as well as impairments taken on the Elevation Gold stream and related interests. |
| 2. | During the quarter and year ended December 31, 2025, the Company incurred $10.3 million (2024: nil) to settle a review of past transactions between the Company and Evolution, the operator of the Northparkes mine. |
39
Gross Profit Margin and Asset Margin
Gross profit margin is an IFRS Accounting Standards financial measure which we define as gross profit divided by revenue. Asset margin is a non-IFRS financial measure which we define by taking gross profit and adding back depletion and non-cash cost of sales related to prepaid gold interests and other and dividing by revenue. We use gross profit margin to assess the profitability of our metal sales and asset margin to evaluate our performance in increasing revenue, containing costs and to provide a useful comparison to our peers. Asset margin is intended to provide additional information only and does not have any standardized definition under IFRS Accounting Standards and should not be considered in isolation or as a substitute for measures of performance prepared in accordance with IFRS Accounting Standards. The following table reconciles asset margin to gross profit margin, the most directly comparable IFRS Accounting Standards measure:
| Three months ended December 31, | | Year ended December 31, | ||||||||
($ thousands except Gross profit margin and Asset margin) | 2025 | | 2024 | | 2025 | | 2024 | ||||
Revenue | $ | 118,916 | | $ | 74,213 | | $ | 388,704 | | $ | 268,991 |
Less: Cost of sales |
| (32,327) | |
| (27,829) | |
| (125,786) | |
| (113,781) |
Gross profit |
| 86,589 | |
| 46,384 | |
| 262,918 | |
| 155,210 |
Gross profit margin |
| 73% | |
| 63% | |
| 68% | |
| 58% |
Gross profit | $ | 86,589 | | $ | 46,384 | | $ | 262,918 | | $ | 155,210 |
Add: Depletion |
| 19,401 | |
| 19,186 | |
| 79,255 | |
| 75,554 |
Add: Non-cash cost of sales related to prepaid gold interests and other |
| 6,131 | |
| 2,789 | |
| 19,149 | |
| 16,919 |
|
| 112,121 | |
| 68,359 | |
| 361,322 | |
| 247,683 |
Revenue |
| 118,916 | |
| 74,213 | |
| 388,704 | |
| 268,991 |
Asset margin |
| 94% | |
| 92% | |
| 93% | |
| 92% |
Public Securities Filings and Regulatory Announcements
Additional information related to Triple Flag, including the Company’s most recent annual information form, is available on SEDAR+ at www.sedarplus.ca and on EDGAR at www.sec.gov. These documents contain descriptions of certain of Triple Flag’s stream and royalty and related interests, as well as a description of risk factors affecting the Company. For additional information, please see our website at www.tripleflagpm.com. The content of any website referred to in this MD&A is not incorporated by reference in, and does not form part of, this MD&A.
40
This MD&A contains “forward-looking information” within the meaning of applicable Canadian securities laws and “forward-looking statements” within the meaning of the United States Private Securities Litigation Reform Act of 1995, respectively (collectively referred to herein as “forward-looking information”). Forward-looking information may be identified by the use of forward-looking terminology such as “plans”, “targets”, “expects”, “is expected”, “budget”, “scheduled”, “estimates”, “outlook”, “forecasts”, “projection”, “prospects”, “strategy”, “intends”, “anticipates”, “believes”, or variations of such words and phrases or terminology which states that certain actions, events or results “may”, “could”, “would”, “might”, “will”, “will be taken”, “occur” or “be achieved”. Forward-looking information in this MD&A includes, but is not limited to, statements with respect to the Company’s annual guidance, operational and corporate developments for the Company; developments, outlook, upside and growth potential in respect of the Company’s portfolio of royalties and streams and related interests and those developments at certain of the mines, projects or properties that underlie the Company’s interests and our assessments of, and expectations for, future periods (including, but not limited to, the long-term production outlook for GEOs and our other guidance under the heading “2026 Guidance” in this MD&A); expectations with respect to the completion and timing of any report, guidance, study or other disclosure to be made by the operators of the mines, projects or properties that underlie the Company’s interests; statements relating to ongoing discussions, negotiations and proceedings with Steppe Gold and the results of those discussions, negotiations and proceedings (including any legal enforcement); and the expected benefits and deliveries under the Settlement Agreement. Our assessments of and expectations for future periods described in this MD&A, including our future financial outlook and anticipated events or results, business, financial position, business strategy, growth plans, strategies, budgets, operations, financial results, taxes, dividend policy, plans and objectives, are considered forward-looking information. In addition, any statements that refer to expectations, intentions, projections or other characterizations of future events or circumstances contain forward-looking information. Statements containing forward-looking information are not historical facts but instead represent management’s expectations, estimates and projections regarding possible future events or circumstances.
The forward-looking information included in this MD&A is based on our opinions, estimates and assumptions considering our experience and perception of historical trends, current conditions and expected future developments, as well as other factors that we currently believe are appropriate and reasonable in the circumstances. The forward-looking information contained in this MD&A is also based upon a number of assumptions, including the ongoing operation of the properties in which we hold a stream, royalty or other similar interest by the owners or operators of such properties in a manner consistent with past practice; the accuracy of public statements and disclosures made by the owners or operators of such underlying properties; and the accuracy of publicly disclosed expectations for the development of underlying properties that are not yet in production. These assumptions include, but are not limited to, the following: assumptions in respect of current and future market conditions and the execution of our business strategies; that operations, or ramp-up where applicable, at properties in which we hold a royalty, stream or other interest continue without further interruption through the period; and the absence of any other factors that could cause actions, events or results to differ from those anticipated, estimated, intended or implied.
Despite a careful process to prepare and review the forward-looking information, there can be no assurance that the underlying opinions, estimates and assumptions will prove to be correct. Forward-looking information is also subject to known and unknown risks, uncertainties and other factors that may cause the actual results, level of activity, performance or achievements to be materially different from those expressed or implied by such forward-looking information.
41
Such risks, uncertainties and other factors include, but are not limited to, those set forth under the caption “Risk Factors” in our most recently filed annual information form which is available on SEDAR+ at www.sedarplus.ca and on EDGAR at www.sec.gov. For clarity, mineral resources that are not mineral reserves do not have demonstrated economic viability and inferred resources are considered too geologically speculative for the application of economic considerations.
Although we have attempted to identify important risk factors that could cause actual results or future events to differ materially from those contained in the forward-looking information, there may be other risk factors not presently known to us or that we presently believe are not material that could also cause actual results or future events to differ materially from those expressed in such forward-looking information. There can be no assurance that such information will prove to be accurate, as actual results and future events could differ materially from those anticipated in such information. Accordingly, readers should not place undue reliance on forward-looking information, which speaks only as of the date made. The forward-looking information contained in this MD&A represents our expectations as of the date of this MD&A and is subject to change after such date. We disclaim any intention or obligation or undertaking to update or revise any forward-looking information whether as a result of new information, future events or otherwise, except as required by applicable securities laws. All of the forward-looking information contained in this MD&A is expressly qualified by the foregoing cautionary statements.
Cautionary Statement to U.S. Investors
Information contained or referenced in this MD&A or in the documents referenced herein concerning the properties, technical information and operations of Triple Flag has been prepared in accordance with requirements and standards under Canadian securities laws, which differ from the requirements of the SEC under subpart 1300 of Regulation S-K (“S-K 1300”). Because the Company is eligible for the Multijurisdictional Disclosure System adopted by the SEC and Canadian Securities Administrators, Triple Flag is not required to present disclosure regarding its mineral properties in compliance with S-K 1300. Accordingly, certain information contained in this MD&A may not be comparable to similar information made public by U.S. companies subject to reporting and disclosure requirements of the SEC.
Technical and Third-Party Information
Triple Flag does not own, develop or mine the underlying properties on which it holds stream, royalty or other similar interests. As a royalty or stream holder, Triple Flag has limited, if any, access to properties included in its asset portfolio. As a result, Triple Flag is dependent on the owners or operators of the properties and their qualified persons to provide information to Triple Flag and on publicly available information to prepare disclosure pertaining to properties and operations on the properties on which Triple Flag holds stream, royalty, or other similar interests. Triple Flag generally has limited or no ability to independently verify such information. Although Triple Flag does not believe that such information is inaccurate or incomplete in any material respect, there can be no assurance that such third-party information is complete or accurate.
42