Exhibit (c)(iii)
Project Breeze Discussion Materials April 8, 2025 Evercore
Exhibit (c)(iii)
Project Breeze Discussion Materials April 8, 2025 Evercore
Situation Update ü On March 12th, 2025, Bravo and the co-founders of Tango (collectively, “Stakeholders”), sent a non-binding bid letter to the Board of Tango proposing to acquire 100% of the outstanding Class A shares of the Company not owned by Stakeholders for $16/sh in cash „ The proposal represents a 22% premium to closing price on 3/12/25 and a 29% premium to opening price on 4/7/25 ü On March 13th and 17th, members of the Evercore team, Tango and the Special Committee’s counsel (Cravath) held several calls to discuss an overview of a potential transaction, process considerations, work to be performed and a general timeline ü On March 19th, Evercore held a call with members of Bravo and Tango’s CEO, during which Bravo confirmed that they would not consider a sale to third parties and did not believe there would be any interested parties in Tango given ongoing uncertainty in the industry „ Tango’s CEO also confirmed that he would not pursue a sale to a third-party ü On March 20th, Evercore, Cravath and members of the Special Committee held a call to report on Evercore’s conversation with Bravo and Tango’s CEO and to discuss process implications and next steps ü On March 21st and 27th, Evercore and Tango held due diligence discussions to review the information required for Evercore to perform its due diligence and evaluation of Stakeholders’ proposal ü On March 24th, Evercore and the Company executed an NDA to begin sharing information „ On March 26th, a virtual data room was set up and subsequently populated by the Company (see next page for details) ü On March 31st, members of the Evercore and Tango teams held a due diligence meeting to review, among other things, a history of the Company, management’s forecast assumptions and annual budgeting process, and key client relationships 2 Project Breeze
Summary of Information Shared by the Company As of April 8, 2025 ü Overview of Clients and Contracts „ Revenue breakout by industry / top client tiers; overview of revenue mix by contract type ü Go-to-Market Strategy and Sales „ Overview of historical win / renewal rates and current pipeline ü Overview of Delivery „ Historical and projected revenue breakdown by geography (2021-2027) ü Technology Investments „ Overview of core business, operations, product suite and client technology stack ü Financial Projections „ Historical budget vs. actuals (2021-2024) and 2025 budget; materials from recent Board meetings (2025 forecast, annual revenue trends by client) and Audit Committee meeting (capital allocation forecasts 2024-2028) „ Financial model with Base and Downside cases (2025-2028), capex overview (2024-2025); historical adjusted EBITDA and Net Income adjustments (2021-2024); service line revenue breakdown by client (2024-2025) ü Management, People and Stock-Based Compensation „ Headcount by geography, 2025 global seats projection; SBC award overview 3 Project Breeze
Diligence Session Agenda Summary March 31, 2025 ü Attendees: „ Tango: Bryce Maddock (CEO), Balaji Sekar (CFO), Sachin Verma (Vice President, FP&A)„ Cravath, Swaine & Moore: Claudia Ricciardi (Partner) „ Evercore: Will Hiltz (SMD), Damien Fisher (SMD), Seth Bergstein (SMD), Sandeep Sharma (SMD), Alex Kirshenbaum (VP), John Oh (Associate), Noah Lin (Analyst) ü Business Outlook and Strategy „ Evolution of industry and Tango, changes since IPO, long-term strategy, impact of AI / LLMs ü Evolution of Competitive Landscape „ Tango’s right-to-win / competitive differentiation versus peers, strategies to sustain and build competitive differentiation, key competitors, AI impact on competitive landscape ü Clients and Contracts „ Overview of large clients, recent wins / losses / renewals, contract terms and pricing model ü Go-to-Market Strategy „ Strategy overview, sales organization / structure, compensation, KPIs and differences across service lines, cross sell / upsell success and initiatives ü Overview of Delivery „ Evolution of delivery strategy over time, geographical mix, impact of COVID / shift to work from home, management’s view on delivery mix trends, impact of AI on delivery ü Technology Investments „ AI-related investments made and planned, current technology platform, ongoing AI initiatives and financial impact, overview of technology stack ü Management, People / Talent, Stock-Based Compensation and Other „ Recruitment strategy, time to ramp new projects, use of stock-based compensation, ongoing organizational changes„ Miscellaneous: strategic / sponsor counterparty interest, equity research coverage 4 Project Breeze
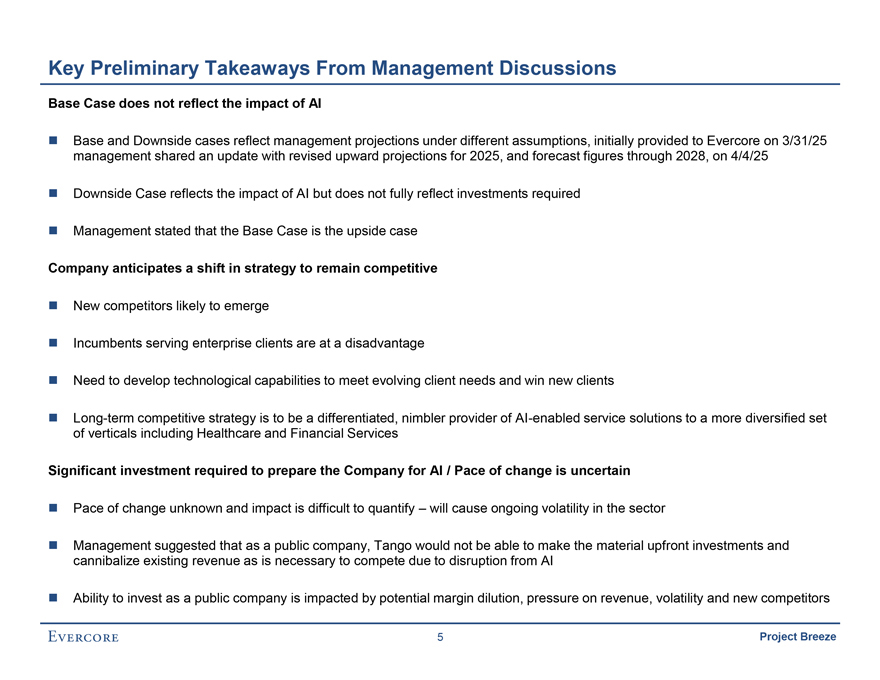
Key Preliminary Takeaways From Management Discussions Base Case does not reflect the impact of AI ü Base and Downside cases reflect management projections under different assumptions, initially provided to Evercore on 3/31/25 management shared an update with revised upward projections for 2025, and forecast figures through 2028, on 4/4/25 ü Downside Case reflects the impact of AI but does not fully reflect investments required ü Management stated that the Base Case is the upside case Company anticipates a shift in strategy to remain competitive ü New competitors likely to emerge ü Incumbents serving enterprise clients are at a disadvantage ü Need to develop technological capabilities to meet evolving client needs and win new clients ü Long-term competitive strategy is to be a differentiated, nimbler provider of AI-enabled service solutions to a more diversified set of verticals including Healthcare and Financial Services Significant investment required to prepare the Company for AI / Pace of change is uncertain ü Pace of change unknown and impact is difficult to quantify – will cause ongoing volatility in the sector ü Management suggested that as a public company, Tango would not be able to make the material upfront investments and cannibalize existing revenue as is necessary to compete due to disruption from AI ü Ability to invest as a public company is impacted by potential margin dilution, pressure on revenue, volatility and new competitors 5 Project Breeze
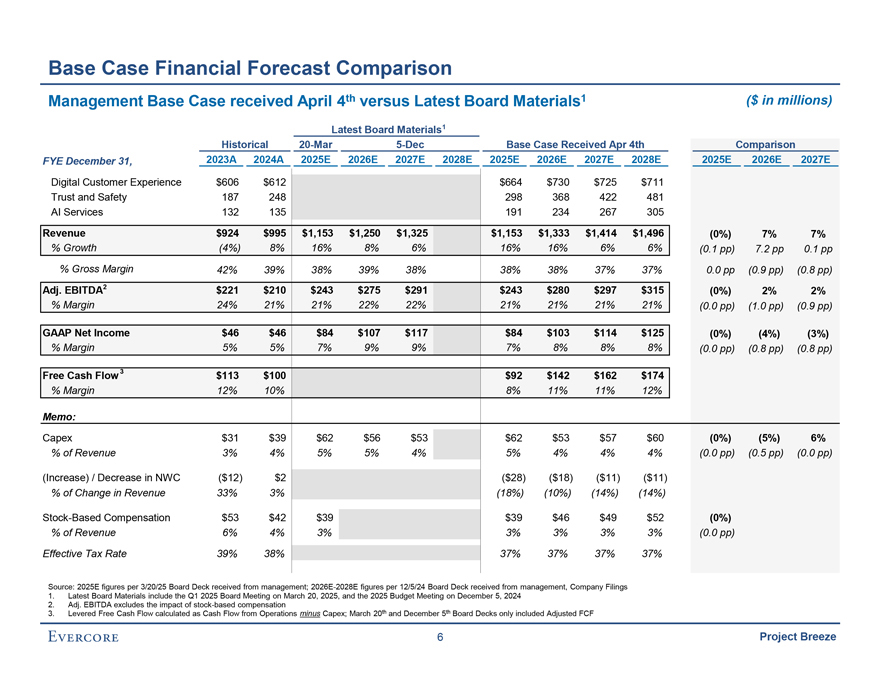
Base Case Financial Forecast Comparison Management Base Case received April 4th versus Latest Board Materials1 ($ in millions) Latest Board Materials1 Historical 20-Mar 5-Dec Base Case Received Apr 4th Comparison FYE December 31, 2023A 2024A 2025E 2026E 2027E 2028E 2025E 2026E 2027E 2028E 2025E 2026E 2027E Digital Customer Experience $606 $612 $664 $730 $725 $711 Trust and Safety 187 248 298 368 422 481 AI Services 132 135 191 234 267 305 Revenue $924 $995 $1,153 $1,250 $1,325 $1,153 $1,333 $1,414 $1,496 (0%) 7% 7% % Growth (4%) 8% 16% 8% 6% 16% 16% 6% 6% (0.1 pp) 7.2 pp 0.1 pp % Gross Margin 42% 39% 38% 39% 38% 38% 38% 37% 37% 0.0 pp (0.9 pp) (0.8 pp) Adj. EBITDA2 $221 $210 $243 $275 $291 $243 $280 $297 $315 (0%) 2% 2% % Margin 24% 21% 21% 22% 22% 21% 21% 21% 21% (0.0 pp) (1.0 pp) (0.9 pp) GAAP Net Income $46 $46 $84 $107 $117 $84 $103 $114 $125 (0%) (4%) (3%) % Margin 5% 5% 7% 9% 9% 7% 8% 8% 8% (0.0 pp) (0.8 pp) (0.8 pp) Free Cash Flow 3 $113 $100 $92 $142 $162 $174 % Margin 12% 10% 8% 11% 11% 12% Memo: Capex $31 $39 $62 $56 $53 $62 $53 $57 $60 (0%) (5%) 6% % of Revenue 3% 4% 5% 5% 4% 5% 4% 4% 4% (0.0 pp) (0.5 pp) (0.0 pp) (Increase) / Decrease in NWC ($12) $2 ($28) ($18) ($11) ($11) % of Change in Revenue 33% 3% (18%) (10%) (14%) (14%) Stock-Based Compensation $53 $42 $39 $39 $46 $49 $52 (0%) % of Revenue 6% 4% 3% 3% 3% 3% 3% (0.0 pp) Effective Tax Rate 39% 38% 37% 37% 37% 37% Source: 2025E figures per 3/20/25 Board Deck received from management; 2026E-2028E figures per 12/5/24 Board Deck received from management, Company Filings 1. Latest Board Materials include the Q1 2025 Board Meeting on March 20, 2025, and the 2025 Budget Meeting on December 5, 2024 2. Adj. EBITDA excludes the impact of stock-based compensation 3. Levered Free Cash Flow calculated as Cash Flow from Operations minus Capex; March 20th and December 5th Board Decks only included Adjusted FCF 6 Project Breeze
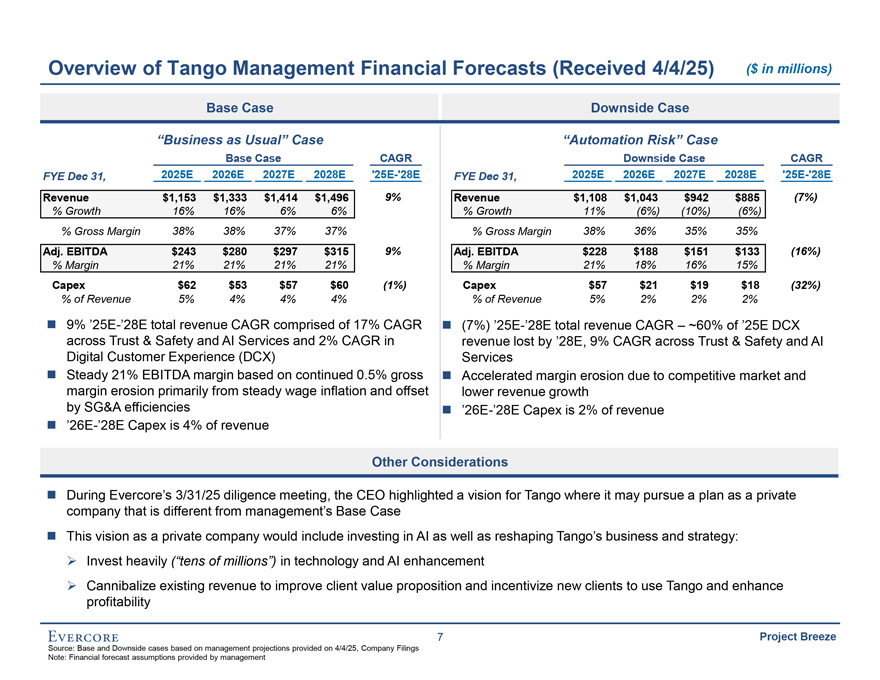
Overview of Tango Management Financial Forecasts (Received 4/4/25) ($ in millions) Base Case Downside Case “Business as Usual” Case “Automation Risk” Case Base Case CAGR Downside Case CAGR FYE Dec 31, 2025E 2026E 2027E 2028E ‘25E-‘28E FYE Dec 31, 2025E 2026E 2027E 2028E ‘25E-‘28E Revenue $1,153 $1,333 $1,414 $1,496 9% Revenue $1,108 $1,043 $942 $885 (7%) % Growth 16% 16% 6% 6% % Growth 11% (6%) (10%) (6%) % Gross Margin 38% 38% 37% 37% % Gross Margin 38% 36% 35% 35% Adj. EBITDA $243 $280 $297 $315 9% Adj. EBITDA $228 $188 $151 $133 (16%) % Margin 21% 21% 21% 21% % Margin 21% 18% 16% 15% Capex $62 $53 $57 $60 (1%) Capex $57 $21 $19 $18 (32%) % of Revenue 5% 4% 4% 4% % of Revenue 5% 2% 2% 2% ü 9% ’25E-’28E total revenue CAGR comprised of 17% CAGR ü (7%) ’25E-’28E total revenue CAGR – ~60% of ’25E DCX across Trust & Safety and AI Services and 2% CAGR in revenue lost by ’28E, 9% CAGR across Trust & Safety and AI Digital Customer Experience (DCX) Services ü Steady 21% EBITDA margin based on continued 0.5% gross ü Accelerated margin erosion due to competitive market and margin erosion primarily from steady wage inflation and offset lower revenue growth by SG&A efficiencies ü ’26E-’28E Capex is 2% of revenue ü ’26E-’28E Capex is 4% of revenue Other Considerations ü During Evercore’s 3/31/25 diligence meeting, the CEO highlighted a vision for Tango where it may pursue a plan as a private company that is different from management’s Base Case ü This vision as a private company would include investing in AI as well as reshaping Tango’s business and strategy: ¢ Invest heavily (“tens of millions”) in technology and AI enhancement ¢ Cannibalize existing revenue to improve client value proposition and incentivize new clients to use Tango and enhance profitability 7 Project Breeze Source: Base and Downside cases based on management projections provided on 4/4/25, Company Filings Note: Financial forecast assumptions provided by management
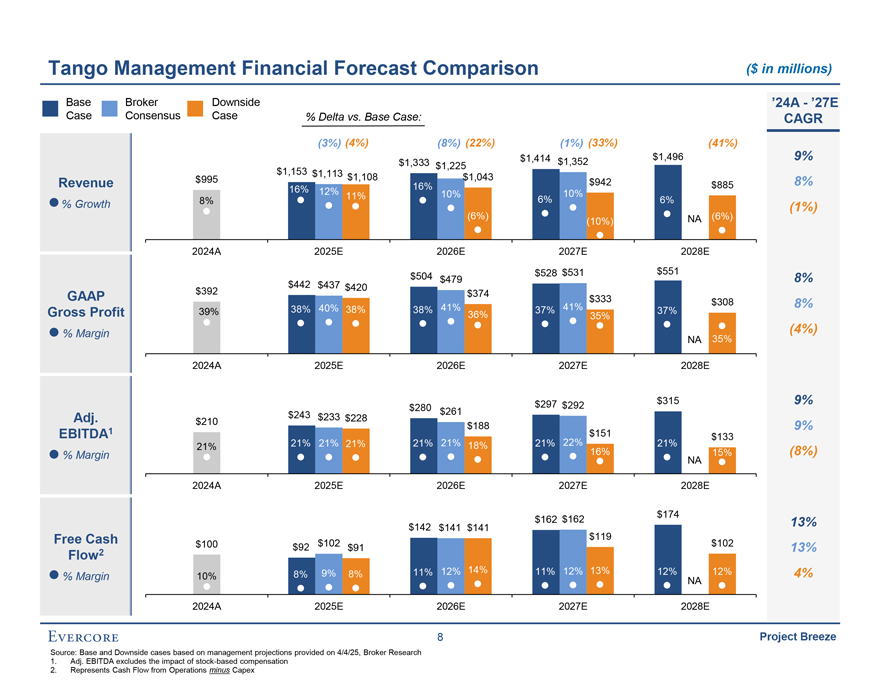
Tango Management Financial Forecast Comparison ($ in millions) Base Broker Downside ’24A—’27E Case Consensus Case % Delta vs. Base Case: CAGR (3%) (4%) (8%) (22%) (1%) (33%) (41%) $1,414 $1,496 9% $1,333 $1,225 $1,352 $1,153 $1,113 $995 $1,108 $1,043 Revenue 16% $942 $885 8% 16% 12% 10% 11% 10% % Growth 8% 6% 6% (1%) (6%) NA (6%) (10%) 2024A 2025E 2026E 2027E 2028E $528 $531 $551 $442 $437 $504 $479 8% $392 $420 GAAP $374 $333 $308 8% 38% 40% 38% 38% 41% 37% 41% 37% Gross Profit 39% 36% 35% % Margin 35% (4%) NA 2024A 2025E 2026E 2027E 2028E $297 $315 9% $280 $292 $243 $261 Adj. $233 $228 $210 $188 9% EBITDA1 $151 $133 21% 21% 21% 21% 21% 21% 18% 21% 22% 21% % Margin 16% NA 15% (8%) 2024A 2025E 2026E 2027E 2028E $174 $162 $162 13% $142 $141 $141 $119 Free Cash $100 $102 $102 $92 $91 13% Flow2 9% 8% 11% 12% 14% 11% 12% 13% 12% 12% 4% % Margin 10% 8% NA 2024A 2025E 2026E 2027E 2028E 8 Project Breeze Source: Base and Downside cases based on management projections provided on 4/4/25, Broker Research 1. Adj. EBITDA excludes the impact of stock-based compensation 2. Represents Cash Flow from Operations minus Capex
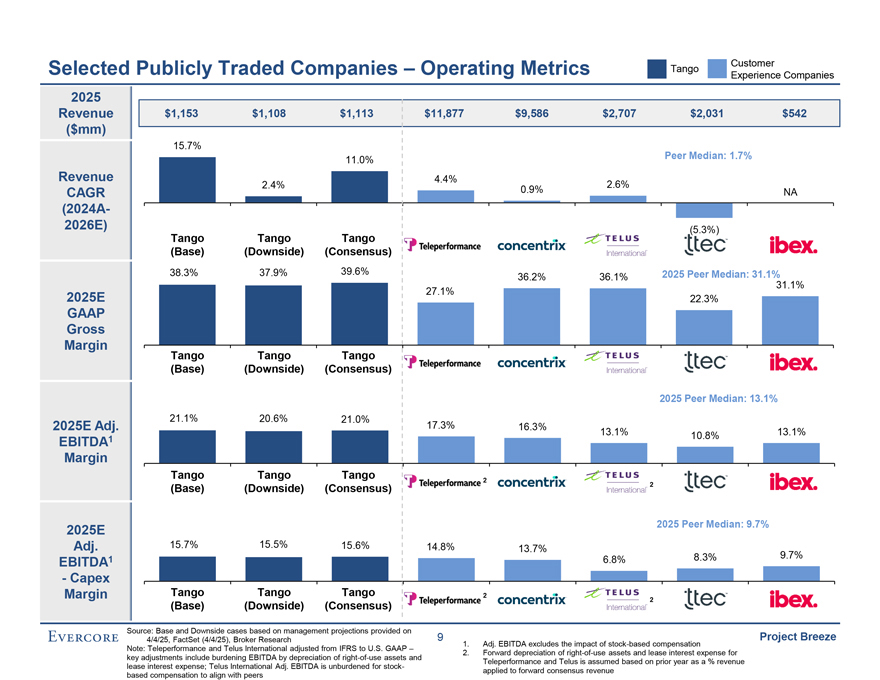
Customer Selected Publicly Traded Companies – Operating Metrics Tango Experience Companies 2025 Revenue $1,153 $1,108 $1,113 $11,877 $9,586 $2,707 $2,031 $542 ($mm) 15.7% 11.0% Peer Median: 1.7% Revenue 4.4% 2.4% 2.6% CAGR 0.9% NA (2024A-2026E) (5.3%) Tango Tango Tango (Base) (Downside) (Consensus) 38.3% 37.9% 39.6% 2025 Peer Median: 31.1% 36.2% 36.1% 31.1% 2025E 27.1% 22.3% GAAP Gross Margin Tango Tango Tango (Base) (Downside) (Consensus) 2025 Peer Median: 13.1% 21.1% 20.6% 21.0% 2025E Adj. 17.3% 16.3% 13.1% 10.8% 13.1% EBITDA1 Margin Tango Tango Tango 2 (Base) (Downside) (Consensus) 2 2025E 2025 Peer Median: 9.7% Adj. 15.7% 15.5% 15.6% 14.8% 13.7% 8.3% 9.7% EBITDA1 6.8% —Capex Margin Tango Tango Tango 2 2 (Base) (Downside) (Consensus) Source: Base and Downside cases based on management projections provided on 4/4/25, FactSet (4/4/25), Broker Research 9 Project Breeze 1. Adj. EBITDA excludes the impact of stock-based compensation Note: Teleperformance and Telus International adjusted from IFRS to U.S. GAAP – 2. Forward depreciation of right-of-use assets and lease interest expense for key adjustments include burdening EBITDA by depreciation of right-of-use assets and Teleperformance and Telus is assumed based on prior year as a % revenue lease interest expense; Telus International Adj. EBITDA is unburdened for stock-applied to forward consensus revenue based compensation to align with peers
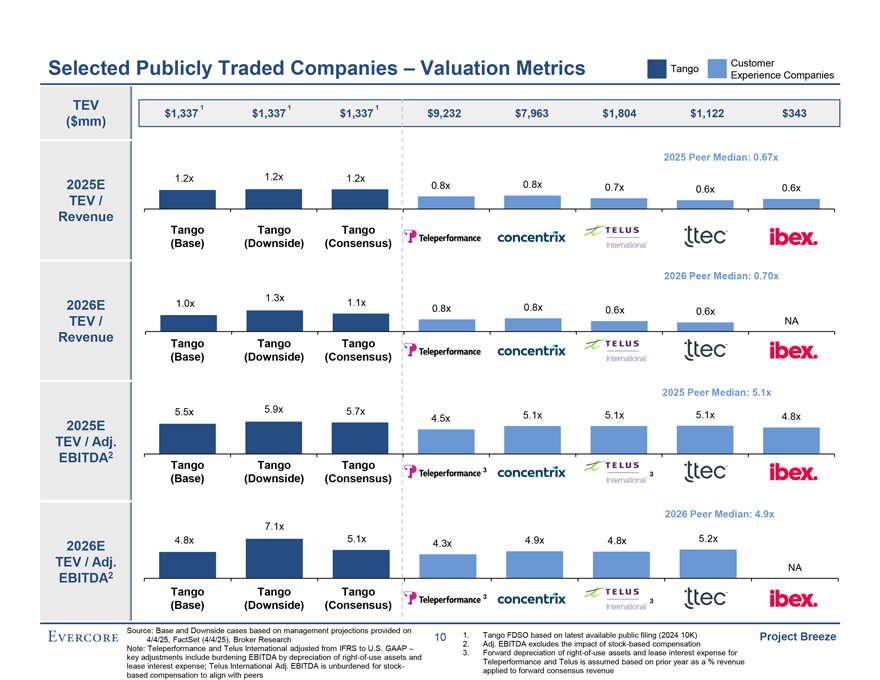
Customer Selected Publicly Traded Companies – Valuation Metrics Tango Experience Companies TEV 1 1 1 $1,337 $1,337 $1,337 $9,232 $7,963 $1,804 $1,122 $343 ($mm) 2025 Peer Median: 0.67x 1.2x 1.2x 1.2x 2025E 0.8x 0.8x 0.7x 0.6x 0.6x TEV / Revenue Tango Tango Tango (Base) (Downside) (Consensus) 2026 Peer Median: 0.70x 1.3x 2026E 1.0x 1.1x 0.8x 0.8x 0.6x 0.6x TEV / NA Revenue Tango Tango Tango (Base) (Downside) (Consensus) 2025 Peer Median: 5.1x 5.5x 5.9x 5.7x 2025E 4.5x 5.1x 5.1x 5.1x 4.8x TEV / Adj. EBITDA2 Tango Tango Tango 3 (Base) (Downside) (Consensus) 3 2026 Peer Median: 4.9x 7.1x 4.8x 5.1x 4.9x 4.8x 5.2x 2026E 4.3x TEV / Adj. EBITDA2 NA Tango Tango Tango 3 (Base) (Downside) (Consensus) 3 Source: Base and Downside cases based on management projections provided on 10 1. Tango FDSO based on latest available public filing (2024 10K) Project Breeze 4/4/25, FactSet (4/4/25), Broker Research 2. Adj. EBITDA excludes the impact of stock-based compensation Note: Teleperformance and Telus International adjusted from IFRS to U.S. GAAP – 3. Forward depreciation of right-of-use assets and lease interest expense for key adjustments include burdening EBITDA by depreciation of right-of-use assets and Teleperformance and Telus is assumed based on prior year as a % revenue lease interest expense; Telus International Adj. EBITDA is unburdened for stock-applied to forward consensus revenue based compensation to align with peers
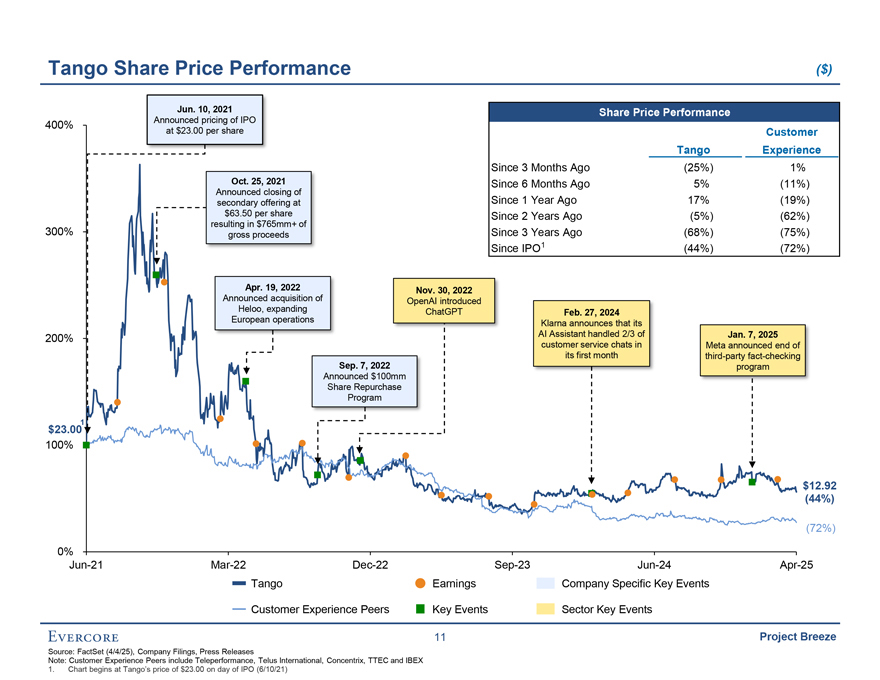
Tango Share Price Performance ($) Jun. 10, 2021 Share Price Performance 400% Announced pricing of IPO at $23.00 per share Customer Tango Experience Since 3 Months Ago (25%) 1% Oct. 25, 2021 Since 6 Months Ago 5% (11%) Announced closing of secondary offering at Since 1 Year Ago 17% (19%) $63.50 per share Since 2 Years Ago (5%) (62%) resulting in $765mm+ of 300% gross proceeds Since 3 Years Ago (68%) (75%) Since IPO1 (44%) (72%) Apr. 19, 2022 Nov. 30, 2022 Announced acquisition of OpenAI introduced Heloo, expanding ChatGPT Feb. 27, 2024 European operations Klarna announces that its 200% AI Assistant handled 2/3 of Jan. 7, 2025 customer service chats in Meta announced end of its first month third-party fact-checking Sep. 7, 2022 program Announced $100mm Share Repurchase Program 1 $23.00 100% $12.92 (44%) (72%) 0% Jun-21 Mar-22 Dec-22 Sep-23 Jun-24 Apr-25 Tango Earnings Company Specific Key Events Customer Experience Peers Key Events Sector Key Events 11 Project Breeze Source: FactSet (4/4/25), Company Filings, Press Releases Note: Customer Experience Peers include Teleperformance, Telus International, Concentrix, TTEC and IBEX 1. Chart begins at Tango’s price of $23.00 on day of IPO (6/10/21)
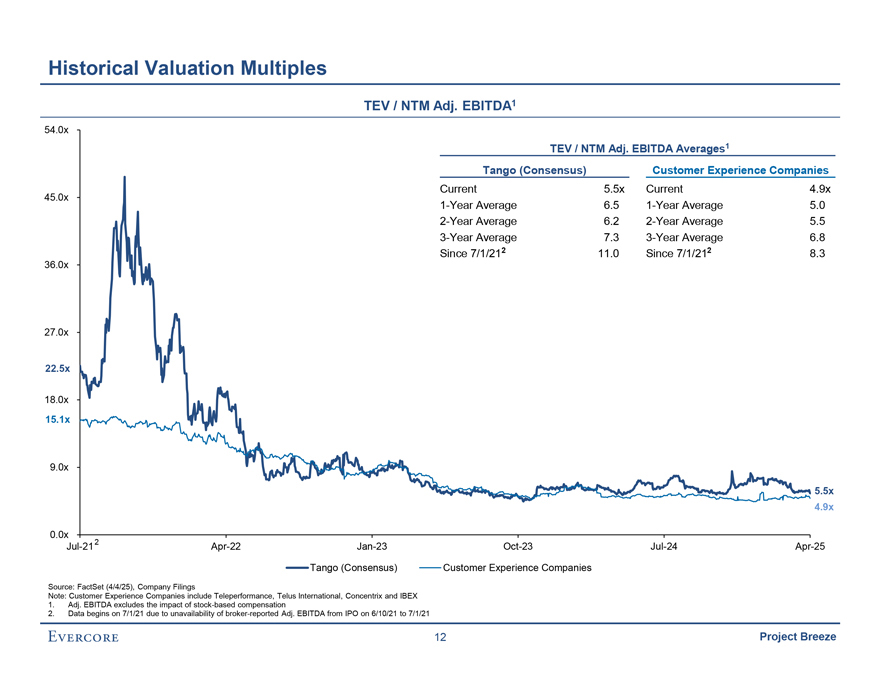
Historical Valuation Multiples TEV / NTM Adj. EBITDA1 54.0x TEV / NTM Adj. EBITDA Averages1 Tango (Consensus) Customer Experience Companies Current 5.5x Current 4.9x 45.0x 1-Year Average 6.5 1-Year Average 5.0 2-Year Average 6.2 2-Year Average 5.5 3-Year Average 7.3 3-Year Average 6.8 Since 7/1/212 11.0 Since 7/1/212 8.3 36.0x 27.0x 22.5x 18.0x 15.1x 9.0x 5.5x 4.9x 0.0x 2 Jul-21 Apr-22 Jan-23 Oct-23 Jul-24 Apr-25 Tango (Consensus) Customer Experience Companies Source: FactSet (4/4/25), Company Filings Note: Customer Experience Companies include Teleperformance, Telus International, Concentrix and IBEX 1. Adj. EBITDA excludes the impact of stock-based compensation 2. Data begins on 7/1/21 due to unavailability of broker-reported Adj. EBITDA from IPO on 6/10/21 to 7/1/21 12 Project Breeze
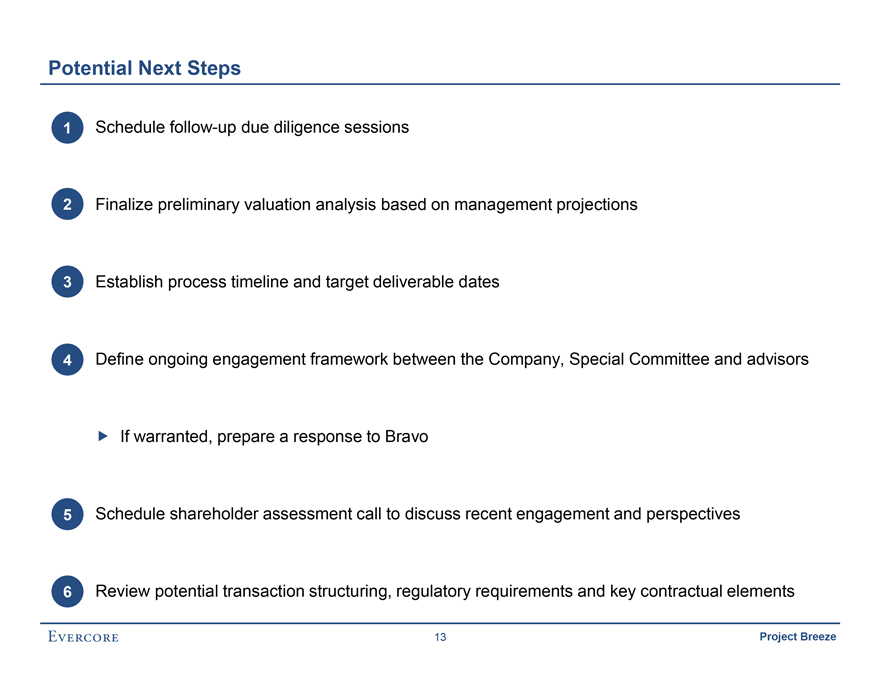
Potential Next Steps 1ü Schedule follow-up due diligence sessions 2ü Finalize preliminary valuation analysis based on management projections 3ü Establish process timeline and target deliverable dates 4ü Define ongoing engagement framework between the Company, Special Committee and advisors„ If warranted, prepare a response to Bravo 5ü Schedule shareholder assessment call to discuss recent engagement and perspectives 6ü Review potential transaction structuring, regulatory requirements and key contractual elements 13 Project Breeze

Appendix Evercore
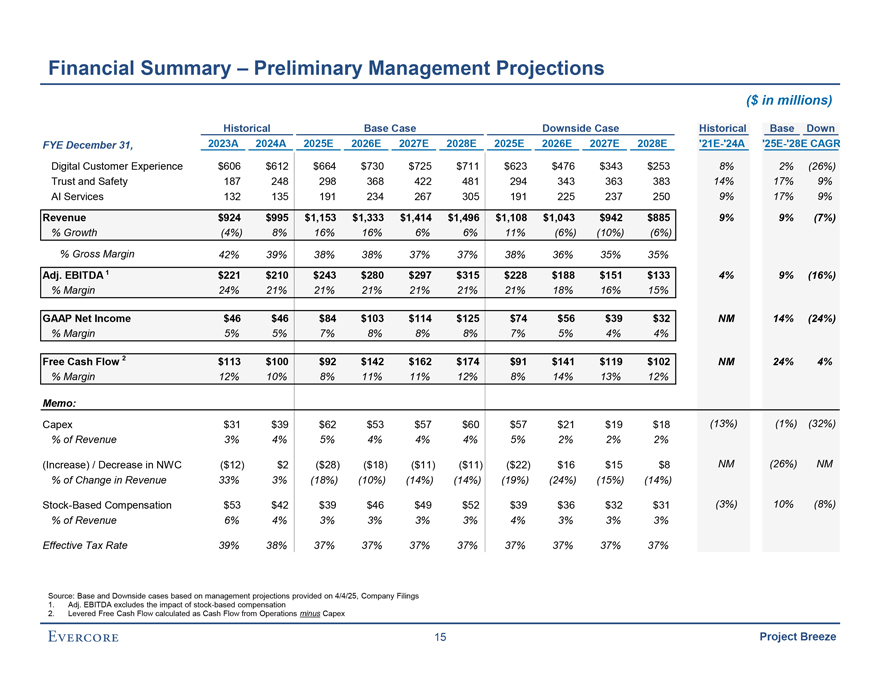
Financial Summary – Preliminary Management Projections ($ in millions) Historical Base Case Downside Case Historical Base Down FYE December 31, 2023A 2024A 2025E 2026E 2027E 2028E 2025E 2026E 2027E 2028E ‘21E-‘24A ‘25E-‘28E CAGR Digital Customer Experience $606 $612 $664 $730 $725 $711 $623 $476 $343 $253 8% 2% (26%) Trust and Safety 187 248 298 368 422 481 294 343 363 383 14% 17% 9% AI Services 132 135 191 234 267 305 191 225 237 250 9% 17% 9% Revenue $924 $995 $1,153 $1,333 $1,414 $1,496 $1,108 $1,043 $942 $885 9% 9% (7%) % Growth (4%) 8% 16% 16% 6% 6% 11% (6%) (10%) (6%) % Gross Margin 42% 39% 38% 38% 37% 37% 38% 36% 35% 35% Adj. EBITDA 1 $221 $210 $243 $280 $297 $315 $228 $188 $151 $133 4% 9% (16%) % Margin 24% 21% 21% 21% 21% 21% 21% 18% 16% 15% GAAP Net Income $46 $46 $84 $103 $114 $125 $74 $56 $39 $32 NM 14% (24%) % Margin 5% 5% 7% 8% 8% 8% 7% 5% 4% 4% Free Cash Flow 2 $113 $100 $92 $142 $162 $174 $91 $141 $119 $102 NM 24% 4% % Margin 12% 10% 8% 11% 11% 12% 8% 14% 13% 12% Memo: Capex $31 $39 $62 $53 $57 $60 $57 $21 $19 $18 (13%) (1%) (32%) % of Revenue 3% 4% 5% 4% 4% 4% 5% 2% 2% 2% (Increase) / Decrease in NWC ($12) $2 ($28) ($18) ($11) ($11) ($22) $16 $15 $8 NM (26%) NM % of Change in Revenue 33% 3% (18%) (10%) (14%) (14%) (19%) (24%) (15%) (14%) Stock-Based Compensation $53 $42 $39 $46 $49 $52 $39 $36 $32 $31 (3%) 10% (8%) % of Revenue 6% 4% 3% 3% 3% 3% 4% 3% 3% 3% Effective Tax Rate 39% 38% 37% 37% 37% 37% 37% 37% 37% 37% Source: Base and Downside cases based on management projections provided on 4/4/25, Company Filings 1. Adj. EBITDA excludes the impact of stock-based compensation 2. Levered Free Cash Flow calculated as Cash Flow from Operations minus Capex 15 Project Breeze
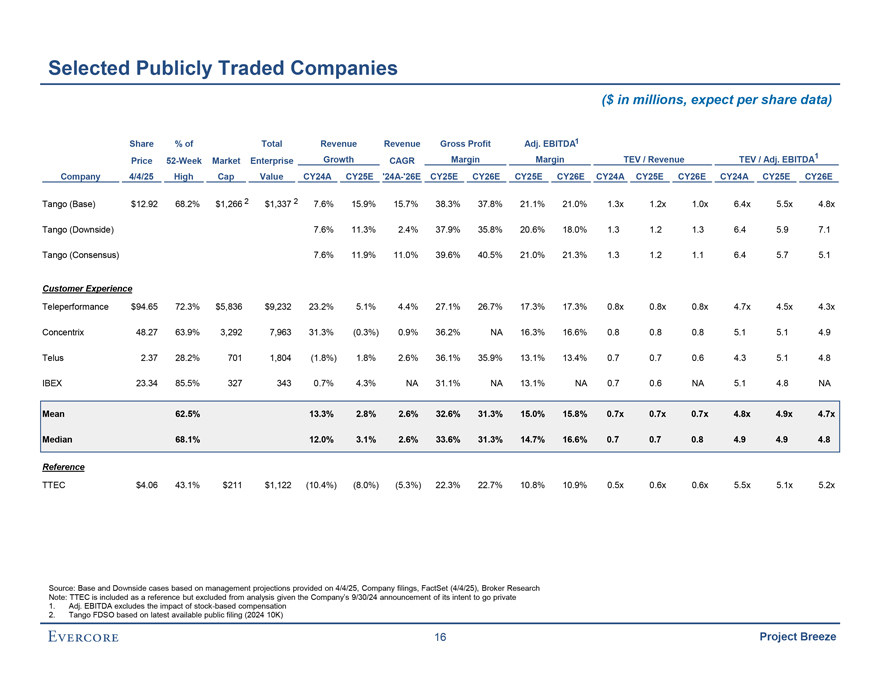
Selected Publicly Traded Companies ($ in millions, expect per share data) Share % of Total Revenue Revenue Gross Profit Adj. EBITDA1 Growth Margin Margin TEV / Revenue TEV / Adj. EBITDA1 Price 52-Week Market Enterprise CAGR Company 4/4/25 High Cap Value CY24A CY25E ‘24A-‘26E CY25E CY26E CY25E CY26E CY24A CY25E CY26E CY24A CY25E CY26E Tango (Base) $12.92 68.2% $1,266 2 $1,337 2 7.6% 15.9% 15.7% 38.3% 37.8% 21.1% 21.0% 1.3x 1.2x 1.0x 6.4x 5.5x 4.8x Tango (Downside) 7.6% 11.3% 2.4% 37.9% 35.8% 20.6% 18.0% 1.3 1.2 1.3 6.4 5.9 7.1 Tango (Consensus) 7.6% 11.9% 11.0% 39.6% 40.5% 21.0% 21.3% 1.3 1.2 1.1 6.4 5.7 5.1 Customer Experience Teleperformance $94.65 72.3% $5,836 $9,232 23.2% 5.1% 4.4% 27.1% 26.7% 17.3% 17.3% 0.8x 0.8x 0.8x 4.7x 4.5x 4.3x Concentrix 48.27 63.9% 3,292 7,963 31.3% (0.3%) 0.9% 36.2% NA 16.3% 16.6% 0.8 0.8 0.8 5.1 5.1 4.9 Telus 2.37 28.2% 701 1,804 (1.8%) 1.8% 2.6% 36.1% 35.9% 13.1% 13.4% 0.7 0.7 0.6 4.3 5.1 4.8 IBEX 23.34 85.5% 327 343 0.7% 4.3% NA 31.1% NA 13.1% NA 0.7 0.6 NA 5.1 4.8 NA Mean 62.5% 13.3% 2.8% 2.6% 32.6% 31.3% 15.0% 15.8% 0.7x 0.7x 0.7x 4.8x 4.9x 4.7x Median 68.1% 12.0% 3.1% 2.6% 33.6% 31.3% 14.7% 16.6% 0.7 0.7 0.8 4.9 4.9 4.8 Reference TTEC $4.06 43.1% $211 $1,122 (10.4%) (8.0%) (5.3%) 22.3% 22.7% 10.8% 10.9% 0.5x 0.6x 0.6x 5.5x 5.1x 5.2x Source: Base and Downside cases based on management projections provided on 4/4/25, Company filings, FactSet (4/4/25), Broker Research Note: TTEC is included as a reference but excluded from analysis given the Company’s 9/30/24 announcement of its intent to go private 1. Adj. EBITDA excludes the impact of stock-based compensation 2. Tango FDSO based on latest available public filing (2024 10K) 16 Project Breeze
These materials have been prepared by Evercore Group L.L.C. (“Evercore”) for the Special Committee of the Board of Directors of Tango to whom such materials are directly addressed and delivered and may not be used or relied upon for any purpose other than as specifically contemplated. These materials are based on information provided by or on behalf of the Company and/or other potential transaction participants, from public sources or otherwise reviewed by Evercore. Evercore assumes no responsibility for independent investigation or verification of such information and has relied on such information being complete and accurate in all material respects. To the extent such information includes estimates and forecasts of future financial performance prepared by or reviewed with the Management of the Company and/or other potential transaction participants or obtained from public sources, Evercore has assumed that such estimates and forecasts have been reasonably prepared on bases reflecting the best currently available estimates and judgments of such Management (or, with respect to estimates and forecasts obtained from public sources, represent reasonable estimates). No representation or warranty, express or implied, is made as to the accuracy or completeness of such information and nothing contained herein is, or shall be relied upon as, a representation, whether as to the past, the present or the future. These materials were designed for use by specific persons familiar with the business and affairs of the Company. These materials are not intended to provide the sole basis for evaluating, and should not be considered a recommendation with respect to, any transaction or other matter. These materials have been developed by and are proprietary to Evercore and were prepared exclusively for the benefit and internal use of the Special Committee of the Board of Directors of the Company. These materials were compiled on a confidential basis for use by the Special Committee of the Board of Directors of the Company in evaluating the potential transaction described herein and not with a view to public disclosure or filing thereof under state or federal securities laws, and may not be reproduced, disseminated, quoted or referred to, in whole or in part, without the prior written consent of Evercore. These materials do not constitute an offer or solicitation to sell or purchase any securities and are not a commitment by Evercore (or any affiliate) to provide or arrange any financing for any transaction or to purchase any security in connection therewith. Evercore assumes no obligation to update or otherwise revise these materials. These materials may not reflect information known to other professionals in other business areas of Evercore and its affiliates. Evercore and its affiliates do not provide legal, accounting or tax advice. Accordingly, any statements contained herein as to tax matters were neither written nor intended by Evercore or its affiliates to be used and cannot be used by any taxpayer for the purpose of avoiding tax penalties that may be imposed on such taxpayer. Each person should seek legal, accounting and tax advice based on his, her or its particular circumstances from independent advisors regarding the impact of the transactions or matters described herein. Project Breeze