Exhibit (c)(iv)
[***] indicates information has been omitted on the basis of a confidential treatment request pursuant to Rule 24b-2 of the Securities Exchange Act of 1934, as amended. This information has been filed separately with the Securities and Exchange Commission. Project Breeze Discussion Materials April 18, 2025 Evercore
Situation Update On March 12th, 2025, Bravo and the co-founders of Tango (collectively, “Stakeholders”), sent a non-binding bid letter to the Board of Tango proposing to acquire 100% of the outstanding Class A shares of the Company not owned by Stakeholders for $16/sh in cash „ The proposal represents a 22% premium to closing price on 3/12/25 and a 23% premium to closing price on 4/17/25 On March 13th and 17th, members of the Evercore team, Tango and the Special Committee’s counsel (Cravath) held several calls to discuss an overview of a potential transaction, process considerations, work to be performed and a general timeline On March 19th, Evercore held a call with members of Bravo and Tango’s CEO, during which Bravo confirmed that they would not consider a sale to third parties and did not believe there would be any interested parties in Tango given ongoing uncertainty in the industry „ Tango’s CEO also confirmed that he would not pursue a sale to a third party On March 20th, Evercore, Cravath and the Special Committee held a call to report on Evercore’s conversation with Bravo and Tango’s CEO and to discuss process implications and next steps On March 21st and 27th, Evercore and Tango held due diligence discussions to review the information required for Evercore to perform its due diligence and evaluation of Stakeholders’ proposal On March 24th, Evercore and the Company executed an NDA to begin sharing information„ On March 26th, a virtual data room was set up and subsequently populated by the Company On March 31st, members of Evercore and Tango held a due diligence meeting to review, among other things, a history of the Company, Management’s forecast assumptions and annual budgeting process, and key client relationships On April 8th Evercore, Cravath and the Special Committee held a call to discuss Base and Downside Case financial forecasts received from Management, process timing, and next steps 2 Project Breeze
Situation Update (Con’t) On April 10th, Evercore and Tango held a call to confirm several items related to financial forecasts received to date „ Tango provided supplemental analysis to reconcile the 2025E budget GAAP Net Income of $94.1 million (originally shared with the Board in the 12/5/24 Budget presentation) with the updated 2025E forecast GAAP Net Income of $84.3 million (shared with the Board in the 3/20/25 Compensation Committee Meeting presentation) On April 15th, Evercore shared initial 2029E and perpetuity extrapolations for the Base Case with Tango for validation, which were informed by prior discussions with Tango, along with confirmation of Fully Diluted Shares Outstanding (“FDSO”) figures originally shared on 4/4/25 „ On April 15th, Evercore and Tango held a call to discuss the materials shared by Evercore On April 16th, Evercore and Tango held a call to continue discussions related to the Base Case 2029E and perpetuity extrapolations „ On April 16th, Tango provided revised extrapolations, revised Downside Case Capex figures, and supplemental materials on FDSO „ On April 16th, Evercore also received a “Blended Case” from Tango, which is not included for the purpose of the present preliminary analysis. The “Blended Case” reflects the 2025E figures included in Tango’s 3/20/25 Q1 2025 Board presentation, and the 2026-2027E figures included in Tango’s 12/5/24 2025 Budget presentation, and Management extrapolations for 2028-2029E Based on the materials provided, Evercore has prepared a preliminary analysis with the following cases: „ Case A with Initial Extrapolation – reflects figures from Tango Management’s Base Case provided to Evercore on 4/4/25 with initial extrapolations informed by prior discussions with Tango Management „ Case A with Revised Extrapolation – reflects figures from Tango Management’s Base Case provided to Evercore on 4/4/25 with revised extrapolations from Tango Management on 4/16/25 „ Case B – reflects figures from Tango Management’s Downside Case provided to Evercore on 4/4/25 with the addition of extrapolations from Tango Management and revised Capex figures received by Evercore on 4/16/25 3 Project Breeze
Table of Contents Section Preliminary Review of Financial Projections I Company and Peer Benchmarking Analysis II Preliminary Valuation Analysis III Appendix Evercore Project Breeze
Preliminary Review of Financial Projections Evercore
Review of Financials Presented to Special Committee on 4/8/25 Management Case A received April 4th versus Latest Board Materials1 ($ in millions) Latest Board Materials1 Historical 20-Mar 4-Mar Case A Received 4-Apr Comparison FYE December 31, 2023A 2024A 2025E 2026E 2027E 2028E 2025E 2026E 2027E 2028E 2025E 2026E 2027E Digital Customer Experience $606 $612 $664 $730 $725 $711 Trust and Safety 187 248 298 368 422 481 AI Services 132 135 191 234 267 305 Revenue $924 $995 $1,153 $1,250 $1,325 $1,153 $1,333 $1,414 $1,496 (0.0%) 6.6% 6.7% % Growth (4%) 8% 16% 8% 6% 16% 16% 6% 6% (0.1 pp) 7.2 pp 0.1 pp % Gross Margin 42% 39% 38% 39% 38% 38% 38% 37% 37% 0.0 pp (0.9 pp) (0.8 pp) Adj. EBITDA2 $221 $210 $243 $275 $291 $243 $280 $297 $315 (0.0%) 1.9% 2.2% % Margin 24% 21% 21% 22% 22% 21% 21% 21% 21% (0.0 pp) (1.0 pp) (0.9 pp) GAAP Net Income $46 $46 $84 $107 $117 $84 $103 $114 $125 (0.0%) (3.5%) (2.6%) % Margin 5% 5% 7% 9% 9% 7% 8% 8% 8% (0.0 pp) (0.8 pp) (0.8 pp) Free Cash Flow 3 $113 $100 $92 $142 $162 $174 % Margin 12% 10% 8% 11% 11% 12% Memo: Capex $31 $39 $62 $564 $534 $62 $53 $57 $60 (0.0%) (5.4%) 5.9% % of Revenue 3% 4% 5% 5% 4% 5% 4% 4% 4% (0.0 pp) (0.5 pp) (0.0 pp) (Increase) / Decrease in NWC ($12) $2 ($28) ($18) ($11) ($11) % of Change in Revenue 33% 3% (18%) (10%) (14%) (14%) Stock-Based Compensation $53 $42 $39 $39 $46 $49 $52 (0.3%) % of Revenue 6% 4% 3% 3% 3% 3% 3% (0.0 pp) Effective Tax Rate 39% 38% 37% 37% 37% 37% Source: Tango Management estimates received 4/4/25, 3/20/25 Tango Q1 2025 Board presentation; 3/4/25 Tango Compensation Committee Meeting presentation, 12/5/24 Tango 2025 Budget presentation, Company Filings 1. 2025E figures per 3/20/25 Tango Q1 2025 Board presentation, 2026-2027E Revenue, Adj. EBITDA, GAAP Net Income per 3/4/25 Tango Compensation Committee Meeting presentation, 2026-2027E Capex per 12/5/24 Tango 2025 Budget presentation 2. Adj. EBITDA excludes the impact of stock-based compensation 3. Levered Free Cash Flow calculated as Cash Flow from Operations minus Capex; 3/20/25 and 12/5/24 Tango Board presentations only included Adjusted FCF 4. Per 12/5/24 Tango 2025 Budget presentation 6 Project Breeze
Provided in Board II Provided by Tango 2025E GAAP Net Income Reconciliation I 1 2 materials (3/20/25) Management on 4/10/25 December 5th 2025 Budget Presentation vs. March 20th Q1 2025 Board Presentation I 5-Dec-24 20-Mar-25 Delta ($) Management Commentary Budget Adj. EBITDA $253.0 $253.0 -One Time (1.2) (1.2) (-) [***] [***] [***]—[***] (-) [***] [***] [***]—[***] (-) BCG (0.3) (0.3) Investment (7.6) (7.6) (-) Physical Security (3.3) (3.3)—Additional physical security added across geos (-) Infosec Investment (3.5) (3.5) (-) New Sites (0.8) (0.8)—Additional site in India & CO Business Change (4.4) (4.4) (-) [***] [***] [***]—[***]—[***] (-) [***] [***] [***] (+) Revenue Change 0.9 0.9—Based on hedge accounting 50% cost hedged & 50% based on (+) Macro—FX 4.9 4.9 forecasted FX depreciation of PHP, INR & MXP (-) Others (1.4) (1.4)—[***] Adj. EBITDA Forecast $253.0 $243.3 ($9.7) II BITDA Forecast $219.7 $209.8 ($9.8) (-) Depreciation (35.7) (37.5) (1.8)—Impact from increased Capex (-) Amortization of Intangible Assets (19.9) (19.9) -(-) Financing Expense (19.3) (18.6) 0.7 EBT $144.8 $133.8 (11.0) (-) Provision for Income Taxes (50.7) (49.5) 1.3—Impact of lower EBT partially offset by higher tax rate forecast Effective Tax Rate 35.0% 37.0%—Increase in tax rate based on latest forecast I AAP Net Income $94.1 $84.3 ($9.7) 7 Project Breeze Source: Figures based on 3/20/25 Tango Q1 2025 Board presentation, 12/5/24 Tango 2025 Budget presentation and EBITDA to GAAP Net Income reconciliation from Tango Management on 4/10/25 1. Budget Adj. EBITDA to Forecast Adj. EBITDA bridge provided in the 3/20/25 Tango Q1 2025 Board presentation 2. Supplemental analysis on EBITDA forecast to GAAP Net Income bridge provided by Tango Management on 4/10/25
Overview of Tango Management Financial Forecasts (Received 4/4/25) ($ in millions) A Case A B Case B Case A CAGR Case B CAGR FYE Dec 31, 2025E 2026E 2027E 2028E ‘25E-‘28E FYE Dec 31, 2025E 2026E 2027E 2028E ‘25E-‘28E Revenue $1,153 $1,333 $1,414 $1,496 9% Revenue $1,108 $1,043 $942 $885 (7%) % Growth 16% 16% 6% 6% % Growth 11% (6%) (10%) (6%) % Gross Margin 38% 38% 37% 37% % Gross Margin 38% 36% 35% 35% Adj. EBITDA $243 $280 $297 $315 9% Adj. EBITDA $228 $188 $151 $133 (16%) % Margin 21% 21% 21% 21% % Margin 21% 18% 16% 15% Capex $62 $53 $57 $60 (1%) Capex (4/4/25) $57 $21 $19 $18 (32%) % of Revenue 5% 4% 4% 4% % of Revenue 5% 2% 2% 2% Capex (4/16/25) $62 $42 $38 $27 (25%) % of Revenue 6% 4% 4% 3% 9% ’25E-’28E total revenue CAGR comprised of 17% CAGR across Trust & Safety and AI Services and 2% CAGR in (7%) ’25E-’28E total revenue CAGR – ~60% of ’25E DCX Digital Customer Experience (DCX) revenue lost by ’28E, 9% CAGR across Trust & Safety and AI Steady 21% EBITDA margin based on continued 0.5% gross Services margin erosion primarily from steady wage inflation and offset Accelerated margin erosion due to competitive market and by SG&A efficiencies lower revenue growth ’26E-’28E Capex is 4% of revenue Initial (4/4/25) Case B Capex forecast revised by Tango Management on 4/16/25 Other Considerations During Evercore’s 3/31/25 diligence meeting, the CEO highlighted a vision for Tango where it may pursue a plan as a private company that is different from Case A This vision as a private company would include investing in AI as well as reshaping Tango’s business and strategy: ¢ Invest heavily (“tens of millions”) in technology and AI enhancement ¢ Cannibalize existing revenue to improve client value proposition and incentivize new clients to use Tango and enhance profitability Source: Tango Management estimates received 4/4/25, Other Considerations per 3/31/25 diligence discussion with Tango Management, Tango Management Case B Capex forecast received 4/16 8 Project Breeze
Management Financials A Case A with Initial Extrapolation ($ in millions) Case A Received April 4th; Initial Extrapolations Informed by Discussions with Tango on March 31st – April 10th Unlevered Free Cash Flow Summary 2029E Extrapolation Management Forecast Extrapolation Revenue growth steps down to 5% Fiscal Year End 12/31, 2024A 2025E 2026E 2027E 2028E 2029E Terminal Adjusted EBITDA Margin remains flat at 21% margin Revenue $995 $1,153 $1,333 $1,414 $1,496 $1,567 $1,567 Stock-Based Compensation and Depreciation % Growth 16% 16% 6% 6% 5% remain flat at 3% of revenue Adj. EBITDA1 $210 $243 $280 $297 $315 $330 $330 Capex remains of revenue % Margin 21% 21% 21% 21% 21% 21% 21% flat at 4% Amortization remains flat at $20mm (-) Stock-Based Compensation (39) (46) (49) (52) (54) (54) % of Revenue 3% 3% 3% 3% 3% 3% Other Pre-Tax Adjustments remain equal to $0 Adj. EBITDA (SBC-burdened) $205 $234 $249 $263 $276 $276 Change in Net Working Capital remains flat at 14% % Margin 18% 18% 18% 18% 18% 18% of change in revenue (-) Depreciation (38) (43) (46) (49) (51) (51) Effective Tax Rate remains flat at 37% % of Revenue 3% 3% 3% 3% 3% 3% (-) Amortization of Intangibles (20) (20) (20) (20) (20)—Perpetuity Assumptions 2 (-) Other Pre-Tax Adjustments 2 (1) — —— Adjusted EBITDA Margin remains flat relative to EBIT (SBC, Amort-burdened) $146 $171 $183 $194 $204 $224 2028E and 2029E at 21% margin % Margin 13% 13% 13% 13% 13% 14% Stock-Based Compensation and Depreciation (-) Unlevered Taxes (54) (63) (68) (72) (76) (83) remain flat at 3% of revenue % Tax Rate 37% 37% 37% 37% 37% 37% Capex decreases to $51mm in perpetuity, matching NOPAT3 $92 $108 $115 $122 $129 $141 perpetuity Depreciation levels (+) Depreciation 38 43 46 49 51 51 Amortization of Intangibles and Other Pre-Tax (+) Amortization of Intangibles 20 20 20 20 20—Adjustments equal to $0 in perpetuity (-) Capital Expenditures (62) (53) (57) (60) (63) (51) % of Revenue 5% 4% 4% 4% 4% 3% Change in Net Working Capital remains flat at 14% (-) (Increase) / Decrease in NWC (28) (18) (11) (11) (10) (9)4 of change in revenue % of Change in Revenue 18% 10% 14% 14% 14% 14% Effective Tax Rate remains flat at 37% Unlevered FCF (SBC-burdened)5 $60 $100 $113 $120 $127 $133 Source: Tango Management estimates received 4/4/25, Tango Management extrapolations discussed between 3. Represents GAAP Net Income plus tax-affected net interest expense 3/31/25-4/10/25, Company Filings 4. Terminal year Change in Net Working Capital calculated using % of change in revenue based on Tango 1. Adj. EBITDA excludes the impact of stock-based compensation Management guidance 2. 2025E Other Pre-Tax Adjustments comprised of ($3mm) litigation expense and $2mm foreign exchange 5. Unlevered FCF shown above treats SBC as a cash expense and thus does not add back SBC expense. If gain SBC were added back, Unlevered FCF would equal CFO less Capex plus tax affected net interest expense 9 Project Breeze
Management Financials A Case A with Revised Extrapolation ($ in millions) Case A Received April 4th; Revised Extrapolations Received on April 16th Unlevered Free Cash Flow Summary 2029E Extrapolation Management Forecast Extrapolation Revenue growth steps down to 4% Fiscal Year End 12/31, 2024A 2025E 2026E 2027E 2028E 2029E Terminal Adjusted EBITDA Margin steps down to 19.5% Revenue $995 $1,153 $1,333 $1,414 $1,496 $1,556 $1,556 Stock-Based Compensation and Depreciation % Growth 16% 16% 6% 6% 4% remain flat at 3% of revenue Adj. EBITDA1 $210 $243 $280 $297 $315 $303 $280 remains flat 4% of revenue % Margin 21% 21% 21% 21% 21% 20% 18% Capex at Amortization remains flat at $20mm (-) Stock-Based Compensation (39) (46) (49) (52) (54) (54) % of Revenue 3% 3% 3% 3% 3% 3% Other Pre-Tax Adjustments remain equal to $0 Adj. EBITDA (SBC-burdened) $205 $234 $249 $263 $250 $226 Change in Net Working Capital remains flat at 14% % Margin 18% 18% 18% 18% 16% 15% of change in revenue (-) Depreciation (38) (43) (46) (49) (51) (57) Effective Tax Rate remains flat at 37% % of Revenue 3% 3% 3% 3% 3% 4% (-) Amortization of Intangibles (20) (20) (20) (20) (20)—Perpetuity Assumptions 2 (-) Other Pre-Tax Adjustments 2 (1) — —— Adjusted EBITDA Margin steps down to 18% in EBIT (SBC, Amort-burdened) $146 $171 $183 $194 $179 $169 perpetuity % Margin 13% 13% 13% 13% 12% 11% Stock-Based Compensation remains flat at 3% of (-) Unlevered Taxes (54) (63) (68) (72) (66) (63) revenue % Tax Rate 37% 37% 37% 37% 37% 37% Capex remains flat at 4% of revenue, terminal NOPAT3 $92 $108 $115 $122 $113 $107 Depreciation equal to $57 (+) Depreciation 38 43 46 49 51 57 Amortization of Intangibles and Other Pre-Tax (+) Amortization of Intangibles 20 20 20 20 20—Adjustments equal to $0 in perpetuity (-) Capital Expenditures (62) (53) (57) (60) (62) (62) % of Revenue 5% 4% 4% 4% 4% 4% Change in Net Working Capital remains flat at 14% (-) (Increase) / Decrease in NWC (28) (18) (11) (11) (8) (9)4 of change in revenue % of Change in Revenue 18% 10% 14% 14% 14% 14% Effective Tax Rate remains flat at 37% Unlevered FCF (SBC-burdened)5 $60 $100 $113 $120 $113 $93 Source: Tango Management estimates received 4/4/25, Tango Management extrapolations received 4/16/25, 3. Represents GAAP Net Income plus tax-affected net interest expense Company Filings 4. Terminal year Change in Net Working Capital calculated using % of change in revenue based on Tango 1. Adj. EBITDA excludes the impact of stock-based compensation Management guidance 2. 2025E Other Pre-Tax Adjustments comprised of ($3mm) litigation expense and $2mm foreign exchange 5. Unlevered FCF shown above treats SBC as a cash expense and thus does not add back SBC expense. If gain SBC were added back, Unlevered FCF would equal CFO less Capex plus tax affected net interest expense 10 Project Breeze
Management Financials B Case B ($ in millions) Case B Received April 4th; Extrapolations Received on April 16th Unlevered Free Cash Flow Summary 2029E Extrapolation Management Forecast Extrapolation Revenue decline reduces to (2%) Fiscal Year End 12/31, 2024A 2025E 2026E 2027E 2028E 2029E Terminal Adjusted EBITDA Margin steps down to 14% Revenue $995 $1,108 $1,043 $942 $885 $867 $867 Stock-Based Compensation and Depreciation % Growth 11% (6%) (10%) (6%) (2%) remain flat at 3% of revenue Adj. EBITDA1 $210 $228 $188 $151 $133 $121 $139 3% of revenue % Margin 21% 21% 18% 16% 15% 14% 16% Capex remains flat at Amortization remains flat at $20mm (-) Stock-Based Compensation (39) (36) (32) (31) (30) (30) % of Revenue 4% 3% 3% 3% 3% 3% Other Pre-Tax Adjustments remain equal to $0 Adj. EBITDA (SBC-burdened) $189 $152 $119 $102 $92 $109 Change in Net Working Capital remains flat at 14% % Margin 17% 15% 13% 12% 11% 13% of change in revenue (-) Depreciation (36) (34) (31) (29) (28) (23) Effective Tax Rate remains flat at 37% % of Revenue 3% 3% 3% 3% 3% 3% (-) Amortization of Intangibles (20) (20) (20) (20) (20)—Perpetuity Assumptions 2 (-) Other Pre-Tax Adjustments 2 (3) — —— Adjusted EBITDA Margin normalizes at 16% in EBIT (SBC, Amort-burdened) $130 $98 $68 $54 $43 $86 perpetuity % Margin 12% 9% 7% 6% 5% 10% Stock-Based Compensation remains flat at 3% of (-) Unlevered Taxes (48) (36) (25) (20) (16) (32) revenue % Tax Rate 37% 37% 37% 37% 37% 37% Capex remains flat at 3% of revenue, terminal NOPAT3 $82 $62 $43 $34 $27 $54 Depreciation equal to $23 (+) Depreciation 36 34 31 29 28 23 Amortization of Intangibles and Other Pre-Tax (+) Amortization of Intangibles 20 20 20 20 20—Adjustments equal to $0 in perpetuity (-) Capital Expenditures4 (62) (42) (38) (27) (26) (26) % of Revenue 6% 4% 4% 3% 3% 3% Change in Net Working Capital remains flat at 14% (-) (Increase) / Decrease in NWC (22) 16 15 8 2 (4)5 of change in revenue % of Change in Revenue 19% 24% 15% 14% 14% 14% Effective Tax Rate remains flat at 37% Unlevered FCF (SBC-burdened)6 $54 $90 $71 $64 $52 $47 Source: Tango Management estimates received 4/4/25, Tango Management extrapolations received 4/16/25, 4. Revised Case B Capex forecast received from Tango Management on 4/16 Company Filings 5. Terminal year Change in Net Working Capital calculated using % of change in revenue based on Tango 1. Adj. EBITDA excludes the impact of stock-based compensation Management guidance 2. 2025E Other Pre-Tax Adjustments comprised of ($3mm) litigation expense 6. Unlevered FCF shown above treats SBC as a cash expense and thus does not add back SBC expense. If 3. Represents GAAP Net Income plus tax-affected net interest expense SBC were added back, Unlevered FCF would equal CFO less Capex plus tax affected net interest expense 11 Project Breeze
II. Company and Peer Benchmarking Analysis Evercore
Tango Management Financial Forecast Comparison ($ in millions) Broker ’24A—’27E Case A Case B Consensus % Delta vs. Case A: CAGR (3%) (4%) (8%) (22%) (1%) (33%) (41%) $1,414 $1,496 9% $1,333 $1,225 $1,352 $1,153 $1,113 $995 $1,108 $1,043 Revenue 16% $942 $885 8% 16% 12% 10% 11% 10% % Growth 8% 6% 6% (1%) (6%) NA (6%) (10%) 2024A 2025E 2026E 2027E 2028E $528 $531 $551 $442 $437 $504 $479 8% $392 $420 GAAP $374 $333 $308 8% 38% 40% 38% 38% 41% 37% 41% 37% Gross Profit 39% 36% 35% % Margin 35% (4%) NA 2024A 2025E 2026E 2027E 2028E $297 $315 9% $280 $292 $243 $261 Adj. $233 $228 $210 $188 9% EBITDA1 $151 $133 21% 21% 21% 21% 21% 21% 18% 21% 22% 21% % Margin 16% NA 15% (8%) 2024A 2025E 2026E 2027E 2028E $174 $162 $162 13% $142 $141 $120 Free Cash $100 $102 $100 $92 $86 $84 13% Flow2 8% 9% 8% 11% 12% 11% 11% 12% 11% 12% 9% (0)% % Margin 10% NA 2024A 2025E 2026E 2027E 2028E 13 Project Breeze Source: Tango Management estimates received 4/4/25, Broker Research Note: Consensus figures reflect median of Broker estimates 1. Adj. EBITDA excludes the impact of stock-based compensation 2. Represents Cash Flow from Operations minus Capex; 2025E-2028E Case B Capex figures revised by Management on 4/16/25 from original estimates received on 4/4/25
Selected Publicly Traded Companies – Operating Metrics Customer Experience Companies 2025E Revenue $1,153 $1,108 $1,113 $12,236 $9,586 $2,769 $2,031 $542 ($mm) 15.7% Peer Median: 2.1% 11.0% Revenue 3 3.7% 2.4% 3.3% CAGR 0.9% NA (2024A-2026E) (5.3%) Tango Tango Tango Case A Consensus Case B 38.3% 39.6% 37.9% 2025E Peer Median: 31.1% 36.2% 36.1% 31.1% 2025E 27.2% 22.3% GAAP Gross Margin Tango Tango Tango Case A Consensus Case B 2025E Peer Median: 13.1% 21.1% 21.0% 20.6% 2025E Adj. 17.4% 16.3% 13.1% 10.8% 13.1% EBITDA1 Margin Tango Tango Tango 2,3 Case A Consensus Case B 2 2025E Peer Median: 9.7% 2025E 15.7% 15.6% 15.0% 14.9% Adj. 13.7% 8.3% 9.7% 6.8% EBITDA1 —Capex Margin Tango Tango Tango 4 2,3 2 Case A Consensus Case B Source: Tango Management estimates received 4/4/25, FactSet (4/17/25), Note: Consensus figures reflect median of Broker estimates Project Breeze Broker Research 14 1. Adj. EBITDA excludes the impact of stock-based compensation Note: Teleperformance and TELUS International adjusted from IFRS to U.S. 2. Forward depreciation of right-of-use assets and lease interest expense for Teleperformance and TELUS International is assumed GAAP – key adjustments include burdening EBITDA by depreciation of right-of- based on prior year as a % revenue applied to forward consensus revenue use assets and lease interest expense; TELUS International Adj. EBITDA is 3. Teleperformance financials reflect pro forma figures following its acquisition of ZP Better Together, which closed on 2/5/25 unburdened for stock-based compensation to align with other companies shown 4. 2025E Capex for Case B revised by Management on 4/16/25 from original estimates received on 4/4/25
Selected Publicly Traded Companies – Valuation Metrics Customer Experience Companies TEV 1 1 1 $1,299 $1,299 $1,299 $10,223 $7,822 $1,817 $1,097 $342 ($mm) 2025E Peer Median: 0.66x 1.1x 1.2x 1.2x 2025E 0.8x 0.8x 0.7x 0.6x 0.5x TEV / Revenue Tango Tango Tango Case A Consensus Case B 2026E Peer Median: 0.72x 2026E 1.0x 1.1x 1.2x 0.8x 0.8x 0.6x 0.6x TEV / NA Revenue Tango Tango Tango Case A Consensus Case B 2025E Peer Median: 5.0x 5.3x 5.6x 5.7x 2025E 4.8x 5.0x 5.0x 5.0x 4.8x TEV / Adj. EBITDA2 Tango Tango Tango 3,4 Case A Consensus Case B 3 2026E Peer Median: 4.8x 6.9x 4.6x 5.0x 4.6x 4.8x 4.8x 5.1x 2026E TEV / Adj. NA EBITDA2 Tango Tango Tango 3,4 Case A Consensus Case B 3 Source: Tango Management estimates received 4/4/25, FactSet (4/17/25), Broker Research 1. Class A and Class B shares outstanding, RSUs, PSUs and options outstanding as of 2/28/25 per Tango Note: Teleperformance and TELUS International adjusted from IFRS to U.S. GAAP – key 15 Management; FDSO based on treasury stock method treatment of in-the-money options Project Breeze adjustments include burdening EBITDA by depreciation of right-of-use assets and lease 2. Adj. EBITDA excludes the impact of stock-based compensation interest expense; TELUS International Adj. EBITDA is unburdened for stock-based 3. Forward depreciation of right-of-use assets and lease interest expense for Teleperformance and TELUS compensation to align with other companies shown; Total Enterprise Values exclude the International is assumed based on prior year as a % revenue applied to forward consensus revenue impact of underfunded employee benefit obligations 4. Teleperformance financials reflect pro forma figures following its acquisition of ZP Better Together, which Note: Consensus figures reflect median of Broker estimates closed on 2/5/25
Tango Share Price Performance ($) Jun. 10, 2021 Share Price Performance 400% Announced pricing of IPO at $23.00 per share Customer Tango Experience Since 3 Months Ago (23%) (3%) Oct. 25, 2021 Since 6 Months Ago 7% (10%) Announced closing of secondary offering at Since 1 Year Ago 19% (14%) $63.50 per share Since 2 Years Ago (9%) (58%) resulting in $765mm+ of 300% gross proceeds Since 3 Years Ago (63%) (73%) Since IPO1 (44%) (72%) Apr. 19, 2022 Nov. 30, 2022 Announced acquisition of OpenAI introduced Heloo, expanding ChatGPT Feb. 27, 2024 European operations Klarna announces that its 200% AI Assistant handled 2/3 of Jan. 7, 2025 customer service chats in Meta announced end of its first month third-party fact-checking Sep. 7, 2022 program Announced $100mm Share Repurchase Program 1 $23.00 100% $12.96 (44%) (72%) 0% Jun-21 Mar-22 Dec-22 Oct-23 Jul-24 Apr-25 Tango Earnings Company Specific Key Events Customer Experience Key Events Sector Key Events Companies 16 Project Breeze Source: FactSet (4/17/25), Company Filings, Press Releases Note: Customer Experience Companies include Teleperformance, Telus International, Concentrix, TTEC and IBEX 1. Chart begins at Tango’s price of $23.00 on day of IPO (6/10/21)
Historical Valuation Multiples TEV / NTM Adj. EBITDA1 54.0x TEV / NTM Adj. EBITDA Averages1 Tango (Consensus) Customer Experience Companies3 45.0x Current 5.5x Current 4.9x 1-Year Average 6.5 1-Year Average 5.0 2-Year Average 6.1 2-Year Average 5.3 3-Year Average 7.1 3-Year Average 6.6 Since 7/1/212 10.9 Since 7/1/212 8.1 36.0x 27.0x 22.5x 18.0x 14.8x 9.0x 5.5x 4.9x 0.0x 2 Jul-21 Apr-22 Jan-23 Oct-23 Jul-24 Apr-25 3 Source: FactSet (4/17/25), Company Filings Tango (Consensus) Customer Experience Companies Note: Customer Experience Companies include Teleperformance, Telus International, Concentrix and IBEX 1. Adj. EBITDA excludes the impact of stock-based compensation 2. Data begins on 7/1/21 due to unavailability of broker-reported Adj. EBITDA from IPO on 6/10/21 to 7/1/21 3. Teleperformance financials reflect pro forma figures following its acquisition of ZP Better Together, which closed on 2/5/25 17 Project Breeze
III. Preliminary Valuation Analysis Evercore
Illustrative Financial Analysis Summary ($ in millions, except per share data) Valuation as of 12/31/24 Current Price: Implied Implied Proposal: $16.00 $12.96 Total Enterprise CY25E Adj. CY26E Adj. 1 Value 2 EBITDA 3 EBITDA 3 Key Metrics and Methodologies Implied Share Price Select Public Company EBITDA Multiples $10.80 $13.40 CY25E Case A Adj. EBITDA $243 $1,095—$1,339 4.5x—5.5x 3.9x—4.8x Peer CY25 Multiple Range: 4.50x—5.50x Trading Multiples Select Public Company EBITDA Multiples CY26E Case A Adj. EBITDA $280 $11.80 $14.80 $1,191—$1,471 4.9x—6.0x 4.3x—5.3x Peer CY26 Multiple Range: 4.25x—5.25x Transaction Multiples Transaction $10.30 $25.80 4 LTM Adj. EBITDA (@ 12/31/24): $210 $1,049—$2,518 4.3x—10.3x 3.7x—9.0x Multiples Transaction LTM Multiples: 5.0x—12.0x DCF Case A 5-Year Discounted Cash Flows (PGR) $11.70 $18.40 with Initial Perpetuity Growth Rate: 3.0%—5.0% $1,178—$1,818 4.8x—7.5x 4.2x—6.5x Extrapolation Discount Rate: 11.0%—13.0% DCF Case A 5-Year Discounted Cash Flows (PGR) $9.10 $13.70 with Revised Perpetuity Growth Rate: 3.0%—5.0% $933—$1,372 3.8x—5.6x 3.3x—4.9x Extrapolation Discount Rate: 11.0%—13.0% 5-Year Discounted Cash Flows (PGR) $4.80 $6.90 DCF Case B Perpetuity Growth Rate: 2.5%—4.5% $521—$719 2.1x—3.0x 1.9x—2.6x Discount Rate: 11.0%—13.0% 5 Premiums Paid to Unaffected 30D VWAP $15.60 $19.50 Premiums Paid: 20.0%—50.0% $1,551—$1,923 6.4x—7.9x 5.5x—6.9x 30 Day VWAP (as of 4/17/25): $13.00 For 52-Week Trading Range 6 Reference $10.80 $18.90 $1,097—$1,869 4.5x—7.7x 3.9x—6.7x as of 4/17/25 Only Broker Price Targets 7 $13.00 $21.00 $1,398—$2,065 5.7x—8.5x 5.0x—7.4x As of 4/17/25 (Based on Available Analysts) Source: FactSet (4/17/25), Tango Management estimates received 4/4/25, Initial Extrapolation discussed 3/31/25-4/10/25, Revised Extrapolation guidance received 4/16/25, Bravo NBO dated 3/12/25, Company Filings Note: Total Enterprise Values exclude the impact of underfunded employee benefit obligations; net debt calculated using $192mm cash and $256mm debt as reported in Tango’s FY2024 10K, dated 3/6/25 19 Project Breeze 1. Implied Share Price rounded to the nearest $0.10 4. Rounded to the nearest whole multiple, based on select transaction multiples 2. Trading Multiples, Transaction Multiples, Premiums Paid, 52-Week Trading, and Broker Price Targets based on 2/28/25 5. Based on 25th and 75th percentile, rounded to nearest 5% FDSO per Tango Management; DCF based on 12/31/24 FDSO per Tango Management; FDSO based on treasury stock 6. Based on low and high end of 52-week trading range method treatment of in-the-money options 7. Based on low and high end of Broker Price Targets 3. CY25E and CY26E figures represents Case A figures
Illustrative Discounted Cash Flow Analysis – Percent-Weighted Value Valuation as of 12/31/24, Case A Initial Extrapolation and Case B ($) Case Percent Weighting Methodology Case A with initial extrapolation and Case B DCF valuations based on Methodology applies specified percentage weightings to Case A (initial methodology and assumptions shown on page 24 and page 26, extrapolation) and Case B price per share valuations to provided a respectively weighted price per share Case A DCF valuation based on initial extrapolation received 4/16/25 Assumes WACC range of 11-13% for both Case A (initial extrapolation) and Case B Perpetuity Growth Rate Adj. EBITDA Terminal Multiple Illustrative Case A (initial extrapolation) Perpetuity Growth Rate of Illustrative Case A (initial extrapolation) Terminal Multiple of 6.0x Adj. 4.0% EBITDA Illustrative Case B Perpetuity Growth Rate of 3.5% Illustrative Case B Terminal Multiple of 5.0x Adj. EBITDA Case (% PGR) Price Per Share Case (Terminal Mult.) Price Per Share Case A (4.0%): 50% 63% 75% 88% 100% Case A (6.0x): 50% 63% 75% 88% 100% Case B (3.5%): 50% 38% 25% 13% 0% Case B (5.0x): 50% 38% 25% 13% 0% 11.0% $11.35 $12.59 $13.84 $15.09 $16.34 11.0% $11.08 $12.24 $13.40 $14.56 $15.72 te Discount Rate 12.0% $9.92 $10.99 $12.06 $13.13 $14.20 Discount Ra 12.0% $10.64 $11.75 $12.87 $13.98 $15.09 13.0% $8.81 $9.74 $10.68 $11.61 $12.54 13.0% $10.22 $11.29 $12.36 $13.43 $14.49 Source: Tango Management estimates received 4/4/25, Case A extrapolation guidance discussed between 3/31/25-4/10/25, Case B extrapolation guidance received 4/16/25 20 Project Breeze
Illustrative Discounted Cash Flow Analysis – Percent-Weighted Value Valuation as of 12/31/24, Case A Revised Extrapolation and Case B ($) Case Percent Weighting Methodology Case A with revised extrapolation and Case B DCF valuations based on Methodology applies specified percentage weightings to Case A (revised methodology and assumptions shown on page 25 and page 26, extrapolation) and Case B price per share valuations to provided a respectively weighted price per share Case A DCF valuation based on revised extrapolation received 4/16/25 Assumes WACC range of 11-13% for both Case A (revised extrapolation) and Case B Perpetuity Growth Rate Adj. EBITDA Terminal Multiple Illustrative Case A (revised extrapolation) Perpetuity Growth Rate of Illustrative Case A (revised extrapolation) Terminal Multiple of 6.0x Adj. 4.0% EBITDA Illustrative Case B Perpetuity Growth Rate of 3.5% Illustrative Case B Terminal Multiple of 5.0x Adj. EBITDA Case (% PGR) Price Per Share Case (Terminal Mult.) Price Per Share Case A (4.0%): 50% 63% 75% 88% 100% Case A (6.0x): 50% 63% 75% 88% 100% Case B (3.5%): 50% 38% 25% 13% 0% Case B (5.0x): 50% 38% 25% 13% 0% 11.0% $9.38 $10.13 $10.89 $11.64 $12.40 11.0% $10.11 $11.03 $11.95 $12.87 $13.79 te Discount Rate 12.0% $8.26 $8.92 $9.57 $10.22 $10.88 Discount Ra 12.0% $9.72 $10.60 $11.48 $12.37 $13.25 13.0% $7.39 $7.96 $8.54 $9.11 $9.69 13.0% $9.34 $10.19 $11.04 $11.89 $12.73 Source: Tango Management estimates received 4/4/25, Extrapolation guidance received 4/16/25 21 Project Breeze
Selected Publicly Traded Companies ($ in millions, expect per share data) 1 Share % of Total Revenue Revenue Gross Profit Adj. EBITDA Growth Margin Margin TEV / Revenue TEV / Adj. EBITDA1 Price 52-Week Market Enterprise CAGR Company 4/17/25 High Cap Value2 CY24A CY25E ‘24A-‘26E CY25E CY26E CY25E CY26E CY24A CY25E CY26E CY24A CY25E CY26E 3 3,4 Tango Case A $12.96 68.4% $1,235 $1,299 7.6% 15.9% 15.7% 38.3% 37.8% 21.1% 21.0% 1.3x 1.1x 1.0x 6.2x 5.3x 4.6x Tango Case B 7.6% 11.3% 2.4% 37.9% 35.8% 20.6% 18.0% 1.3 1.2 1.2 6.2 5.7 6.9 Tango (Consensus) 7.6% 11.9% 11.0% 39.6% 40.5% 21.0% 21.3% 1.3 1.2 1.1 6.2 5.6 5.0 Customer Experience Teleperformance 5,6 $101.02 74.7% $6,228 $10,223 25.8% 2.7% 3.3% 27.2% 26.7% 17.4% 17.4% 0.9x 0.8x 0.8x 5.0x 4.8x 4.6x Concentrix 47.33 62.6% 3,228 7,822 31.3% (0.3%) 0.9% 36.2% NA 16.3% 16.6% 0.8 0.8 0.8 5.0 5.0 4.8 TELUS International 6 2.47 29.6% 731 1,817 (1.8%) 4.2% 3.7% 36.1% 36.0% 13.1% 13.1% 0.7 0.7 0.6 4.3 5.0 4.8 IBEX 23.35 85.5% 327 342 0.7% 4.3% NA 31.1% NA 13.1% NA 0.7 0.6 NA 5.1 4.8 NA Mean 63.1% 14.0% 2.7% 2.6% 32.7% 31.3% 15.0% 15.7% 0.8x 0.7x 0.7x 4.9x 4.9x 4.8x Median 68.6% 13.3% 3.4% 3.3% 33.6% 31.3% 14.7% 16.6% 0.7 0.7 0.8 5.0 4.9 4.8 Reference TTEC $3.58 42.9% $186 $1,097 (10.4%) (8.0%) (5.3%) 22.3% 22.7% 10.8% 10.9% 0.5x 0.5x 0.6x 5.4x 5.0x 5.1x Source: Tango Management estimates received 4/4/25, Company filings, FactSet (4/17/25) Note: Teleperformance and TELUS International adjusted from IFRS to U.S. GAAP – key adjustments include burdening EBITDA by depreciation of right-of-use assets and lease interest expense; TELUS International Adj. EBITDA is unburdened for stock-based compensation to align with select publicly traded companies; Total Enterprise Values exclude the impact of underfunded employee benefit obligations; TTEC is included as a reference but excluded from analysis following the Company’s announcement of its intent to go private on 9/30/24 1. Adjusted to reflect Adj. EBITDA before taking into account stock-based compensation 2. Total Enterprise Values exclude the impact of underfunded employee benefit obligations 3. Class A and Class B shares outstanding, RSUs, PSUs and options outstanding as of 2/28/25 per Tango Management; FDSO based on treasury stock method treatment of in-the-money options 4. Excludes $6.5mm underfunded employee benefit obligations as of 12/31/24 5. Teleperformance financials reflect pro forma figures following its acquisition of ZP Better Together, which closed on 2/5/25 6. Forward depreciation of right-of-use assets and lease interest expense for Teleperformance and TELUS International is assumed based on prior year as a % revenue applied to forward consensus revenue 22 Project Breeze
Transaction Multiples ($ in millions, except per share data) Total Enterprise TEV / Date Announced Acquirer Target Value LTM Adj. EBITDA1 3/1/24 Founder & Group TDCX $685 5.2x2 10/10/23 Capital Square Partners Startek 217 5.93 4/26/23 Teleperformance Majorel 3,143 7.74 3/29/23 Concentrix Webhelp 4,768 11.85 Mean $2,203 7.6x Median 1,914 6.8 Pre-AI Sector Correction 6 6/18/21 Sitel Group Sykes Enterprises $2,119 9.7x 12/4/19 TELUS International Competence Call Centre 1,015 10.77 7/9/19 Groupe Bruxelles Lambert Webhelp 2,690 NA 6/28/18 Synnex Convergys 2,528 7.48 6/14/18 Teleperformance Intelenet 1,045 12.6 9,10 Mean $1,879 10.1x Median 2,119 10.2 Source: Company filings, Press Releases 6. Reflects LTM Adj. EBITDA as of 6/30/21 Note: Exchange rate reflected as of announcement date 7. Reflects LTM Adj. EBITDA as of 12/31/19 1. Adjusted to reflect Adj. EBITDA before taking into account stock-based compensation 8. Reflects LTM Adj. EBITDA as of 6/30/18 2. Reflects LTM Adj. EBITDA as of 12/31/23 9. Reflects LTM EBITDA as of 3/31/18 3. Reflects LTM Adj. EBITDA as of 9/30/23 10. Multiples are presented on an IFRS-16 basis 4. Reflects LTM Operating EBITDA as of 6/30/23 5. Reflects LTM Adj. EBITDA as of 3/31/23 23 Project Breeze
Discounted Cash Flow Analysis Case A with Initial Extrapolation Valuation as of 12/31/24 – 12.0% WACC ($ in millions, except per share data) Management Forecast Extrapolation Fiscal Year End 12/31, 2024A 2025E 2026E 2027E 2028E 2029E Terminal Implied Per Share Valuation Revenue $995 $1,153 $1,333 $1,414 $1,496 $1,567 $1,567 4.00% 6.0x % Growth 16% 16% 6% 6% 5% PGR EBITDA Adj. EBITDA $210 $243 $280 $297 $315 $330 $330 Terminal Cash Flow / Adj. EBITDA $133 $330 % Margin 21% 21% 21% 21% 21% 21% 21% Terminal Value 1,725 1,977 Discount Factor 0.601x 0.567x (-) Stock-Based Compensation (39) (46) (49) (52) (54) (54) (-) Depreciation (38) (43) (46) (49) (51) (51) PV of Terminal Value $1,036 $1,122 (-) Amortization of Intangibles (20) (20) (20) (20) (20)—Plus: PV of Projected FCF 383 383 (-) Other Pre-Tax Adjustments (1) — ——Total Enterprise Value $1,419 $1,505 EBIT (SBC, Amort-burdened) $146 $171 $183 $194 $204 $224 Plus: Cash 192 192 % Margin 13% 13% 13% 13% 13% 14% Less: Debt (256) (256) (-) Unlevered Taxes (54) (63) (68) (72) (76) (83) Equity Value $1,355 $1,441 % Tax Rate 37% 37% 37% 37% 37% 37% (/) FDSO 1 95.5 95.5 (+) Depreciation 38 43 46 49 51 51 Price Per Share $14.20 $15.09 (+) Amortization of Intangibles 20 20 20 20 20—% Premium to Close (4/17/25) 9.6% 16.5% (-) Capital Expenditures (62) (53) (57) (60) (63) (51) Implied Terminal EBITDA Multiple 5.5x (-) (Increase) / Decrease in NWC (28) (18) (11) (11) (10) (9)2 Implied PGR 4.6% Total Unlevered FCF $60 $100 $113 $120 $127 $133 (x) Discount Factor @ 12.0% Disc. Rate 0.94x 0.84x 0.75x 0.67x 0.60x PV of Unlevered FCF $56 $84 $85 $81 $76 NPV of Projected Cash Flows $383 Implied Price Per Share Implied Terminal EBITDA Mult. Implied Price Per Share Implied PGR Perpetuity Growth Rate Perpetuity Growth Rate Terminal Value Multiple Terminal Value Multiple 3.00% 4.00% 5.00% 3.00% 4.00% 5.00% 5.5x 6.0x 6.5x 5.5x 6.0x 6.5x 11.0% $14.81 $16.34 $18.37 5.6x 6.3x 7.3x $14.70 $15.72 $16.74 3.0% 3.7% 4.2% Discount Rate 12.0% 13.07 14.20 15.65 5.0 5.5 6.3 14.12 15.09 16.06 3.9% 4.6% 5.1% 13.0% 11.67 12.54 13.62 4.5 4.9 5.5 13.57 14.49 15.42 4.8% 5.5% 6.0% 24 Project Breeze Source: FactSet (4/17/25), Tango Management estimates received 4/4/25, Tango Management extrapolations discussed between 3/31/25-4/10/25, Company Filings Note: Total Enterprise Value excludes the impact of underfunded employee benefit obligations 1. Class A and Class B shares, RSUs, PSUs, and options outstanding as of 12/31/24 per Tango Management; FDSO based on treasury stock method treatment of in-the-money options 2. Terminal year Change in Net Working Capital calculated using % of change in revenue based on Tango Management guidance
Discounted Cash Flow Analysis Case A with Revised Extrapolation Valuation as of 12/31/24 – 12.0% WACC ($ in millions, except per share data) Management Forecast Extrapolation Fiscal Year End 12/31, 2024A 2025E 2026E 2027E 2028E 2029E Terminal Implied Per Share Valuation Revenue $995 $1,153 $1,333 $1,414 $1,496 $1,556 $1,556 4.00% 6.0x % Growth 16% 16% 6% 6% 4% PGR EBITDA Adj. EBITDA $210 $243 $280 $297 $315 $303 $280 Terminal Cash Flow / Adj. EBITDA $93 $280 % Margin 21% 21% 21% 21% 21% 20% 18% Terminal Value 1,207 1,680 Discount Factor 0.601x 0.567x (-) Stock-Based Compensation (39) (46) (49) (52) (54) (54) (-) Depreciation (38) (43) (46) (49) (51) (57) PV of Terminal Value $725 $953 (-) Amortization of Intangibles (20) (20) (20) (20) (20)—Plus: PV of Projected FCF 375 375 (-) Other Pre-Tax Adjustments (1) — ——Total Enterprise Value $1,099 $1,328 EBIT (SBC, Amort-burdened) $146 $171 $183 $194 $179 $169 Plus: Cash 192 192 % Margin 13% 13% 13% 13% 12% 11% Less: Debt (256) (256) (-) Unlevered Taxes (54) (63) (68) (72) (66) (63) Equity Value $1,035 $1,264 % Tax Rate 37% 37% 37% 37% 37% 37% (/) FDSO 1 95.2 95.4 (+) Depreciation 38 43 46 49 51 57 Price Per Share $10.88 $13.25 (+) Amortization of Intangibles 20 20 20 20 20—% Premium to Close (4/17/25) (16.1%) 2.2% (-) Capital Expenditures (62) (53) (57) (60) (62) (62) Implied Terminal EBITDA Multiple 4.6x (-) (Increase) / Decrease in NWC (28) (18) (11) (11) (8) (9)2 Implied PGR 5.4% Total Unlevered FCF $60 $100 $113 $120 $113 $93 (x) Discount Factor @ 12.0% Disc. Rate 0.94x 0.84x 0.75x 0.67x 0.60x PV of Unlevered FCF $56 $84 $85 $81 $68 NPV of Projected Cash Flows $375 Implied Price Per Share Implied Terminal EBITDA Mult. Implied Price Per Share Implied PGR Perpetuity Growth Rate Perpetuity Growth Rate Terminal Value Multiple Terminal Value Multiple 3.00% 4.00% 5.00% 3.00% 4.00% 5.00% 5.5x 6.0x 6.5x 5.5x 6.0x 6.5x 11.0% $11.38 $12.40 $13.74 4.6x 5.2x 6.0x $12.93 $13.79 $14.66 4.1% 4.5% 4.9% Discount Rate 12.0% 10.13 10.88 11.83 4.1 4.6 5.1 12.42 13.25 14.08 4.9% 5.4% 5.8% 13.0% 9.13 9.69 10.39 3.7 4.1 4.5 11.94 12.73 13.52 5.7% 6.2% 6.7% 25 Project Breeze Source: FactSet (4/17/25), Tango Management estimates received 4/4/25, Tango Management extrapolations received 4/16/25, Company Filings Note: Total Enterprise Value excludes the impact of underfunded employee benefit obligations 1. Class A and Class B shares, RSUs, PSUs, and options outstanding as of 12/31/24 per Tango Management; FDSO based on treasury stock method treatment of in-the-money options 2. Terminal year Change in Net Working Capital calculated using % of change in revenue based on Tango Management guidance
Discounted Cash Flow Analysis Case B Valuation as of 12/31/24 – 12.0% WACC Management Forecast Extrapolation Fiscal Year End 12/31, 2024A 2025E 2026E 2027E 2028E 2029E Terminal Revenue $995 $1,108 $1,043 $942 $885 $867 $867 % Growth 11% (6%) (10%) (6%) (2%) Adj. EBITDA $210 $228 $188 $151 $133 $121 $139 % Margin 21% 21% 18% 16% 15% 14% 16% (-) Stock-Based Compensation (39) (36) (32) (31) (30) (30) (-) Depreciation (36) (34) (31) (29) (28) (23) (-) Amortization of Intangibles (20) (20) (20) (20) (20)—(-) Other Pre-Tax Adjustments (3) — ——EBIT (SBC, Amort-burdened) $130 $98 $68 $54 $43 $86 % Margin 12% 9% 7% 6% 5% 10% (-) Unlevered Taxes (48) (36) (25) (20) (16) (32) % Tax Rate 37% 37% 37% 37% 37% 37% (+) Depreciation 36 34 31 29 28 23 (+) Amortization of Intangibles 20 20 20 20 20—(-) Capital Expenditures (62) (42) (38) (27) (26) (26) (-) (Increase) / Decrease in NWC (22) 16 15 8 2 (4) Total Unlevered FCF $54 $90 $71 $64 $52 $47 (x) Discount Factor @ 12.0% Disc. Rate 0.94x 0.84x 0.75x 0.67x 0.60x PV of Unlevered FCF $51 $76 $53 $43 $31 NPV of Projected Cash Flows $255 Implied Per Share Valuation 3.50% PGR 5.0x EBITDA Terminal Cash Flow / Adj. EBITDA $47 $139 Terminal Value 571 694 Discount Factor 0.601x 0.567x PV of Terminal Value $343 $394 Plus: PV of Projected FCF 255 255 Total Enterprise Value $598 $649 Plus: Cash 192 192 Less: Debt (256) (256) Equity Value $534 $585 (/) FDSO 94.6 94.6 Price Per Share $5.65 $6.18 % Premium to Close (4/17/25) (56.4%) (52.3%) Implied Terminal EBITDA Multiple 4.4x Implied PGR 5.1% Implied Price Per Share Implied Price Per Share Perpetuity Growth Rate Terminal Value Multiple 2.50% 3.50% 4.50% 11.0% $5.91 $6.36 $6.93 12.0% 5.32 5.65 6.06 13.0% 4.83 5.09 5.40 Discount Rate 26 Implied Terminal EBITDA Mult. Implied PGR Perpetuity Growth Rate Terminal Value Multiple 2.50% 3.50% 4.50% 4.4x 4.9x 5.6x 4.0 4.4 4.9 3.6 3.9 4.3 Implied PGR Terminal Value Multiple 4.5x 5.0x 5.5x 3.2% 4.1% 4.8% 4.2% 5.1% 5.8% 5.3% 6.1% 6.9% Implied Price Per Share Terminal Value Multiple 4.5x 5.0x 5.5x $5.99 $6.43 $6.86 5.77 6.18 6.60 5.55 5.95 6.35 ($ in millions, except per share data) 2 1 Source: FactSet (4/17/25), Tango Management estimates received 4/4/25, Tango Management extrapolations received 4/16/25, Company Filings Note: Total Enterprise Value excludes the impact of underfunded employee benefit obligations Class A and Class B shares, RSUs, PSUs, and options outstanding as of 12/31/24 per Tango Management; FDSO based on treasury stock method treatment of in-the-money options Terminal year Change in Net Working Capital calculated using % of change in revenue based on Tango Management guidance
For Reference Only: Illustrative Leveraged Buyout Analysis Case A with Revised Extrapolation ($ in millions, except per share data) Key Assumptions1 Financial Summary and Credit Statistics Case A—Revised Extrapolation Illustrative transaction close date of Dec 31, 2024, and Fiscal Year Ended 12/31, 2025E 2026E 2027E 2028E 2029E exit on Dec 31, 2029 (5-year holding period) Revenue $1,153 $1,333 $1,414 $1,496 $1,556 Illustrative Sources & Uses shows entry at $16.002 % Growth 16% 16% 6% 6% 4% offer price per share for a purchase TEV of $1.6bn Adj. EBITDA $243 $280 $297 $315 $303 % Margin 21% 21% 21% 21% 20% $600mm PF Gross Leverage (3.4x PF LTM EBITDA), (+) Annual PubCo Cost Savings 8 8 8 8 8 consisting of: (–) SBC Replacement (100% of Rev.) (39) (46) (49) (52) (54) „ $600 Unitranche @ SOFR+325bps, 99.5 OID, PF EBITDA (SBC-burdened) $213 $242 $257 $271 $258 % Margin 18% 18% 18% 18% 17% 2.25% financing fee, 1.00% annual amortization PF EBIT (SBC, Amort-burdened) $155 $179 $190 $202 $187 $100mm3 minimum cash balance % Margin 13% 13% 13% 13% 12% (-) Cash Taxes (42) (54) (60) (67) (64) $15mm transaction fees % Tax Rate 37% 37% 37% 37% 37% Assumes 100% cash replacement of stock-based (+) Depreciation & Intangible Amort. 57 63 66 69 71 compensation, no Management promote (-) Net Interest Expense (37) (30) (24) (17) (10) (-) Change in NWC (28) (18) (11) (11) (8) $8mm annual public company cost savings3 (-) Capital Expenditures (62) (53) (57) (60) (62) Levered Free Cash Flow $42 $87 $104 $115 $113 Cumulative Free Cash Flow 42 129 233 348 461 Sources Memo: Leverage and Credit Statistics Unitranche Facility $600 Net Debt $458 $371 $267 $152 $39 Pro Forma Debt 600 Total Debt / Adj. EBITDA 2.6x 1.9x 1.4x 0.9x 0.5x Net Debt / Adj. EBITDA 2.2 1.5 1.0 0.6 0.2 Balance Sheet Cash 192 Sponsor Equity 1,124 Total Sources $1,916 Implied TEV and Offer Price (’29 Exit, 3.4x Gross PF LTM Leverage) Implied Purchase TEV Implied Offer Price Uses Tango Purchase Equity 4 $1,529 Exit LTM EBITDA Multiple Exit LTM EBITDA Multiple Refinance Term Loan 256 5.0x 6.0x 7.0x 5.0x 6.0x 7.0x Minimum Cash 100 17.5% $1,129 $1,264 $1,400 17.5% $11.18 $12.59 $13.99 Transaction Fees 15 Req’d Req’d Financing Fees & OID 17 20.0% 1,063 1,185 1,307 20.0% $10.49 $11.76 $13.03 IRR IRR Total Uses $1,916 22.5% 1,004 1,114 1,224 22.5% $9.89 $11.03 $12.17 27 Project Breeze Source: Management estimates received 4/4/25, Revised Case A extrapolations received 4/16/25, 2. Based on Bravo NBO dated 3/12/25 Company Filings 3. Per Tango Management on 3/31/25 1. Transaction structure assumptions based on Evercore estimates of leverage capacity, financing costs 4. Class A and Class B shares, RSUs, PSUs, and options outstanding as of 12/31/24 per Tango and pro forma cash replacement of stock-based compensation Management; FDSO based on treasury stock method treatment of in-the-money options
Appendix Evercore
Analysis at Various Prices ($ in millions) Offer Consideration Current Transaction Prices Price Per Share (4/17/25) $12.96 $14.00 $15.00 $16.00 $17.00 $18.00 $19.00 $20.00 $21.00 Premium to Current 8% 16% 23% 31% 39% 47% 54% 62% Premium to 52 Week High ($18.94 @ 11/8/24) (32%) (26%) (21%) (16%) (10%) (5%) 0% 6% 11% Premium to 52 Week Low ($10.84 @ 4/18/24) 20% 29% 38% 48% 57% 66% 75% 85% 94% Premium to 30-Day VWAP ($13.00) (0%) 8% 15% 23% 31% 38% 46% 54% 62% Premium to 3 Month VWAP ($14.83) (13%) (6%) 1% 8% 15% 21% 28% 35% 42% Premium to 1 Year Average ($14.15) (8%) (1%) 6% 13% 20% 27% 34% 41% 48% Premium to 3 Year Average ($14.88) (13%) (6%) 1% 8% 14% 21% 28% 34% 41% FDSO 1 95.3 95.4 95.4 95.5 95.5 95.5 95.6 95.6 95.6 Equity Value $1,235 $1,335 $1,431 $1,527 $1,624 $1,720 $1,816 $1,912 $2,008 Premium to Equity Value—8.1% 15.9% 23.7% 31.5% 39.2% 47.0% 54.8% 62.6% Plus: Total Debt (12/31/24) 256 256 256 256 256 256 256 256 256 Less: Cash (12/31/24) (192) (192) (192) (192) (192) (192) (192) (192) (192) Enterprise Value 2 $1,299 $1,399 $1,495 $1,591 $1,688 $1,784 $1,880 $1,976 $2,072 Premium to TEV—7.7% 15.1% 22.5% 29.9% 37.3% 44.7% 52.1% 59.5% Multiple Analysis Enterprise Value to: Metric Tango Case A 2024A Revenue $995 1.3x 1.4x 1.5x 1.6x 1.7x 1.8x 1.9x 2.0x 2.1x 2025E Revenue 1,153 1.1 1.2 1.3 1.4 1.5 1.5 1.6 1.7 1.8 2026E Revenue 1,333 1.0 1.0 1.1 1.2 1.3 1.3 1.4 1.5 1.6 2024A Adj. EBITDA $210 6.2x 6.7x 7.1x 7.6x 8.0x 8.5x 9.0x 9.4x 9.9x 2025E Adj. EBITDA 243 5.3 5.7 6.1 6.5 6.9 7.3 7.7 8.1 8.5 2026E Adj. EBITDA 280 4.6 5.0 5.3 5.7 6.0 6.4 6.7 7.1 7.4 Tango Consensus 2025E Revenue $1,113 1.2x 1.3x 1.3x 1.4x 1.5x 1.6x 1.7x 1.8x 1.9x 2026E Revenue 1,225 1.1 1.1 1.2 1.3 1.4 1.5 1.5 1.6 1.7 2025E Adj. EBITDA $233 5.6x 6.0x 6.4x 6.8x 7.2x 7.6x 8.1x 8.5x 8.9x 2026E Adj. EBITDA 261 5.0 5.4 5.7 6.1 6.5 6.8 7.2 7.6 7.9 29 Project Breeze Source: FactSet (4/17/25), Company Filings, Tango Management estimates as of 4/4/25, Bravo NBO dated 3/12/25 1. Class A and Class B shares outstanding, RSUs, PSUs and options outstanding as of 2/28/25 per Tango Management; FDSO based on treasury stock method treatment of in-the-money options 2. Excludes $6.5mm underfunded employee benefit obligations as of 12/31/24
Weighted Average Cost of Capital (WACC) ($ in millions) Selected Public Companies—Cost of Capital Cost of Equity and WACC Calculation Share Total Gross Historical Supply-Side Price Market Enterprise Gross Debt to Adj. Unl. Tango Peers Tango Peers Company 4/17/25 Cap Value Debt Equity Beta2 Beta2 Risk Free Rate1 4.8% 4.8% 4.8% 4.8% Tango Case A $12.96 $1,235 $1,299 $256 20.7% 1.22 1.08 Unlevered Beta2 1.08 0.64 1.08 0.64 Customer Experience Teleperformance $101.02 $6,228 $10,223 $5,280 84.8% 1.24 0.76 Debt / Equity Ratio 20.7% 118.3% 20.7% 118.3% Concentrix 47.33 3,228 7,822 4,902 151.9% 1.10 0.52 TELUS 2.47 731 1,817 1,276 174.5% 1.20 0.52 Tax Rate3 36.9% 26.0% 36.9% 26.0% IBEX 23.35 327 342 34 10.4% 0.95 0.88 4 Levered Beta 1.22 1.21 1.22 1.21 Mean 105.4% 1.12 0.67 Market Risk Premium5 7.3% 7.3% 6.3% 6.3% Median 118.3% 1.15 0.64 Size Premium5 0.9% 0.9% 0.9% 0.9% WACC—Sensitivities Cost of Equity6 14.6% 14.5% 13.3% 13.3% WACC Historical Supply-Side Pre-tax Cost of Debt7 7.1% 7.1% 7.1% 7.1% WACC WACC Debt / Equity Ratio Debt / Equity Ratio After-tax Cost of Debt 4.5% 5.3% 4.5% 5.3% 15.0% 20.0% 25.0% 15.0% 20.0% 25.0% Equity to Total Cap. 82.8% 45.8% 82.8% 45.8% 0.70 10.4% 10.3% 10.2% 0.70 9.7% 9.6% 9.5% Unl. Unl. 0.95 12.2% 12.0% 11.9% 0.95 11.2% 11.1% 11.0% Beta Beta 8 WACC 12.9% 9.5% 11.8% 8.9% 1.20 13.9% 13.7% 13.6% 1.20 12.7% 12.5% 12.4% Source: Company filings, FactSet (4/17/25), Ibbotson, Bloomberg 4. Levered Beta = Unlevered Beta * (1 + (1—Tax Rate) * (Debt / Equity)) Note: Total Enterprise Values exclude the impact of underfunded employee benefit obligations 5. Kroll (2024). The market size of $1,235mm assumed for Tango is equivalent to a 8th decile size premium 1. 20-year Treasury rate as of 4/17/25 6. Cost of Equity = Risk Free Rate + (Market Risk Premium * Levered Beta) 2. Raw Beta based on average of two-year weekly Beta, calculated in comparison to the MSCI World Index. Adjusted Beta = 7. Based off Tango’s 9/22 senior secured term loan YTM of 7.111% as of 4/17/25 (2/3) * Raw Beta + (1/3) * 1. Unlevered Beta = Levered Beta / (1 + (1—Tax rate) * (Debt / Equity)) 8. WACC = Cost of Equity * Equity to Total Capitalization + After-tax Cost of Debt * (1—Equity to Total Capitalization) 3. Assumes 36.9% tax rate provided by Management 30 Project Breeze
North America Take Private Premiums Paid Analysis Analysis of last 3 years of Tech sector, take private transactions with TEV $1.0bn – $3.0bn (15 Deals) Premium to Unaffected Premium to 30-Day VWAP1 Number of Deals Number of Deals 1 1 3—3 7 1 2 1 2 4 5 Median: 48.2% Median: 44.1% Mean: 46.3% 46.7% Mean: 42.7% 33.3% 26.7% 20.0% 20.0% 13.3% 13.3% 6.7% 6.7% 6.7% 6.7% 0.0% <10% 10%-20% 20%-30% 30%-40% 40%-50% >50% <10% 10%-20% 20%-30% 30%-40% 40%-50% >50% Premium to 60-Day VWAP1 Premium to 90-Day VWAP1 Number of Deals Number of Deals 4 3 — 2 6 4 1 2 2 1 5 Median: 40.1% Median: 34.6% Mean: 32.9% Mean: 33.8% 40.0% 33.3% 26.7% 26.7% 20.0% 13.3% 13.3% 13.3% 6.7% 6.7% 0.0% 0.0% <10% 10%-20% 20%-30% 30%-40% 40%-50% >50% <10% 10%-20% 20%-30% 30%-40% 40%-50% >50% Source: London Stock Exchange Group, FactSet, Company Filings Note: Analysis only includes tech industry transactions 1. VWAP relative to unaffected date 31 Project Breeze
Summary of Equity Research Perspectives Selected Analyst Price Targets1 Analyst Commentary Broker Date Rating Target Valuation Methodology Strong client base and revenue Goldman Sachs 4/6/25 Sell $13.00 Long term AI risk to its DCX or Trust retention with over 100 clients across and Safety delivery several verticals within the digital Baird 4/1/25 Buy 20.00—economy Morgan Stanley 3/5/25 Buy 21.00—Investments in AI are bearing fruit, J.P. Morgan 2/27/25 Hold 17.00 EV / EBITDA and Management expects that AI Client concentration remains William Blair 2/27/25 Buy NA EV / EBITDA reasonably high services will be the fastest growing service line in 2025 Guggenheim 2/27/25 Hold NA—RBC Capital 2/26/25 Hold 20.00 EV / EBITDA Diversification efforts to include BTIG 11/1/24 Hold NA—more traditional enterprises, such Lack of diversification in revenue as healthcare and BFSI, add a level Mean $18.20 of stability to the business over time Median 20.00 Offshore mix will increase 25th Percentile 17.00 Revenue headwinds from significantly next year, which 75th Percentile 20.00 incremental offshoring typically comes at 20pts in higher margins than onsite work Actual Share Performance vs. Target Price (Since IPO)2 Analyst Rating History # of Research Analysts: $100 Premium to Current: 54.3% 9 9 10 10 10 10 9 9 8 8 8 8 8 $75 10% 10% 10% 11% 11% 20% 11% 11% 13% 13% 13% 13% 13% $50 44% 44% 38% 38% 38% 38% 38% 50% 50% 50% 56% 56% 40% $25 $20.00 44% 44% 50% 50% 50% 50% 50% $12.96 40% 40% 40% 40% 33% 33% $0 Jun 21 Mar 22 Dec 22 Oct 23 Jul 24 Apr 25 Apr May Jun Jul Aug Sep Oct Nov Dec Jan Feb Mar Apr 24 24 24 24 24 24 24 24 24 25 25 25 25 Tango Share Price Median Price Target Buy Hold Sell 32 Project Breeze Source: FactSet (4/17/25), Bloomberg, Wall Street research 1. Target price not discounted to present value 2. IPO Date of 6/10/21; Analyst price target first available on 7/1/21
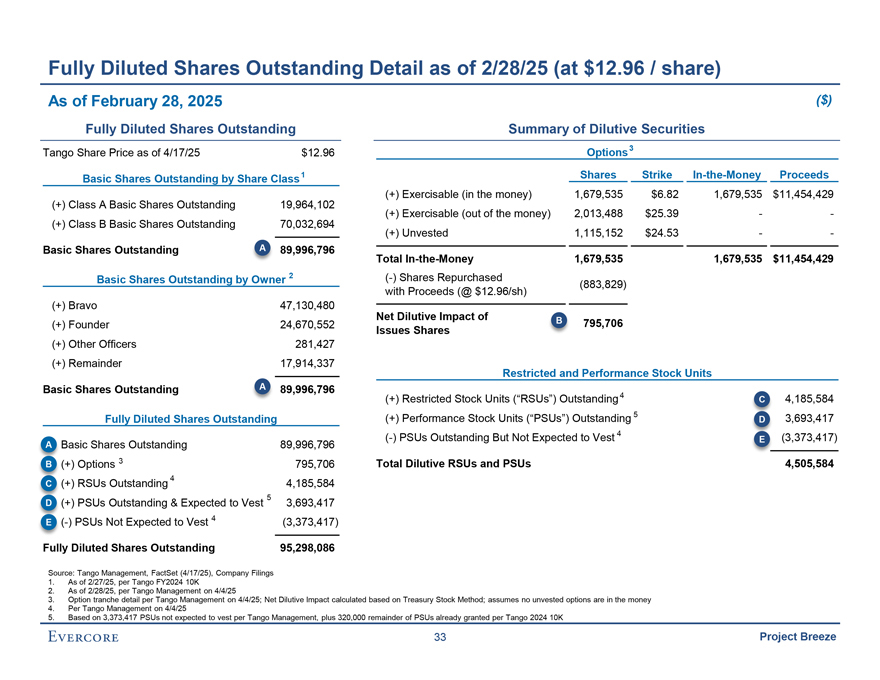
Fully Diluted Shares Outstanding Detail as of 2/28/25 (at $12.96 / share) As of February 28, 2025 ($) Fully Diluted Shares Outstanding Summary of Dilutive Securities Tango Share Price as of 4/17/25 $12.96 Options3 Basic Shares Outstanding by Share Class1 Shares Strike In-the-Money Proceeds (+) Exercisable (in the money) 1,679,535 $6.82 1,679,535 $11,454,429 (+) Class A Basic Shares Outstanding 19,964,102 (+) Exercisable (out of the money) 2,013,488 $25.39 —(+) Class B Basic Shares Outstanding 70,032,694 (+) Unvested 1,115,152 $24.53 — Basic Shares Outstanding A 89,996,796 Total In-the-Money 1,679,535 1,679,535 $11,454,429 Basic Shares Outstanding by Owner 2 (-) Shares Repurchased (883,829) with Proceeds (@ $12.96/sh) (+) Bravo 47,130,480 Net Dilutive Impact of B (+) Founder 24,670,552 795,706 Issues Shares (+) Other Officers 281,427 (+) Remainder 17,914,337 Restricted and Performance Stock Units Basic Shares Outstanding A 89,996,796 4 (+) Restricted Stock Units (“RSUs”) Outstanding C 4,185,584 (+) Performance Stock Units (“PSUs”) Outstanding 5 3,693,417 Fully Diluted Shares Outstanding D (-) PSUs Outstanding But Not Expected to Vest 4 (3,373,417) E A Basic Shares Outstanding 89,996,796 B (+) Options 3 795,706 Total Dilutive RSUs and PSUs 4,505,584 4 C (+) RSUs Outstanding 4,185,584 5 D (+) PSUs Outstanding & Expected to Vest 3,693,417 4 E (-) PSUs Not Expected to Vest (3,373,417) Fully Diluted Shares Outstanding 95,298,086 Source: Tango Management, FactSet (4/17/25), Company Filings 1. As of 2/27/25, per Tango FY2024 10K 2. As of 2/28/25, per Tango Management on 4/4/25 3. Option tranche detail per Tango Management on 4/4/25; Net Dilutive Impact calculated based on Treasury Stock Method; assumes no unvested options are in the money 4. Per Tango Management on 4/4/25 5. Based on 3,373,417 PSUs not expected to vest per Tango Management, plus 320,000 remainder of PSUs already granted per Tango 2024 10K 33 Project Breeze
Fully Diluted Shares Outstanding Detail as of 12/31/24 (at $12.96 / share) As of December 31, 2024 ($) Fully Diluted Shares Outstanding Summary of Dilutive Securities Tango Share Price as of 4/17/25 $12.96 Options3 Basic Shares Outstanding by Share Class1 Shares Strike In-the-Money Proceeds (+) Exercisable (in the money) 1,717,857 $6.75 1,717,857 $11,595,535 (+) Class A Basic Shares Outstanding 19,891,464 (+) Exercisable (out of the money) 1,988,127 $25.34 —(+) Class B Basic Shares Outstanding 70,032,694 (+) Unvested 1,140,513 $24.62 — Basic Shares Outstanding A 89,924,158 Total In-the-Money 1,717,857 1,717,857 $11,595,535 Basic Shares Outstanding by Owner 2 (-) Shares Repurchased (894,717) with Proceeds (@ $12.96/sh) (+) Bravo 47,130,480 Net Dilutive Impact of B (+) Founder 24,670,552 823,140 Issues Shares (+) Other Officers 281,427 (+) Remainder 17,841,699 Restricted and Performance Stock Units Basic Shares Outstanding A 89,924,158 4 (+) Restricted Stock Units (“RSUs”) Outstanding C 4,309,358 (+) Performance Stock Units (“PSUs”) Outstanding 5 3,693,417 Fully Diluted Shares Outstanding D (-) PSUs Outstanding But Not Expected to Vest 4 (3,373,417) E A Basic Shares Outstanding 89,924,158 B (+) Options 3 823,140 Total Dilutive RSUs and PSUs 4,629,358 4 C (+) RSUs Outstanding 4,309,358 5 D (+) PSUs Outstanding & Expected to Vest 3,693,417 4 E (-) PSUs Not Expected to Vest (3,373,417) Fully Diluted Shares Outstanding 95,376,656 Source: Tango Management, FactSet (4/17/25), Company Filings 1. As of 12/31/24, per Tango FY2024 10K 2. As of 12/31/24, per Tango Management on 4/4/25 3. Option tranche detail per Tango Management on 4/4/25; Net Dilutive Impact calculated based on Treasury Stock Method; assumes no unvested options are in the money 4. Per Tango Management on 4/4/25 5. Based on 3,373,417 PSUs not expected to vest per Tango Management, plus 320,000 remainder of PSUs already granted per Tango 2024 10K 34 Project Breeze
These materials have been prepared by Evercore Group L.L.C. (“Evercore”) for the Special Committee of the Board of Directors of Tango to whom such materials are directly addressed and delivered and may not be used or relied upon for any purpose other than as specifically contemplated. These materials are based on information provided by or on behalf of the Company and/or other potential transaction participants, from public sources or otherwise reviewed by Evercore. Evercore assumes no responsibility for independent investigation or verification of such information and has relied on such information being complete and accurate in all material respects. To the extent such information includes estimates and forecasts of future financial performance prepared by or reviewed with the Management of the Company and/or other potential transaction participants or obtained from public sources, Evercore has assumed that such estimates and forecasts have been reasonably prepared on bases reflecting the best currently available estimates and judgments of such Management (or, with respect to estimates and forecasts obtained from public sources, represent reasonable estimates). No representation or warranty, express or implied, is made as to the accuracy or completeness of such information and nothing contained herein is, or shall be relied upon as, a representation, whether as to the past, the present or the future. These materials were designed for use by specific persons familiar with the business and affairs of the Company. These materials are not intended to provide the sole basis for evaluating, and should not be considered a recommendation with respect to, any transaction or other matter. These materials have been developed by and are proprietary to Evercore and were prepared exclusively for the benefit and internal use of the Special Committee of the Board of Directors of the Company. These materials were compiled on a confidential basis for use by the Special Committee of the Board of Directors of the Company in evaluating the potential transaction described herein and not with a view to public disclosure or filing thereof under state or federal securities laws, and may not be reproduced, disseminated, quoted or referred to, in whole or in part, without the prior written consent of Evercore. These materials do not constitute an offer or solicitation to sell or purchase any securities and are not a commitment by Evercore (or any affiliate) to provide or arrange any financing for any transaction or to purchase any security in connection therewith. Evercore assumes no obligation to update or otherwise revise these materials. These materials may not reflect information known to other professionals in other business areas of Evercore and its affiliates. Evercore and its affiliates do not provide legal, accounting or tax advice. Accordingly, any statements contained herein as to tax matters were neither written nor intended by Evercore or its affiliates to be used and cannot be used by any taxpayer for the purpose of avoiding tax penalties that may be imposed on such taxpayer. Each person should seek legal, accounting and tax advice based on his, her or its particular circumstances from independent advisors regarding the impact of the transactions or matters described herein. Project Breeze