Exhibit (c)(vi)
Project Breeze Discussion Materials April 24, 2025 Evercore
Exhibit (c)(vi)
Project Breeze Discussion Materials April 24, 2025 Evercore
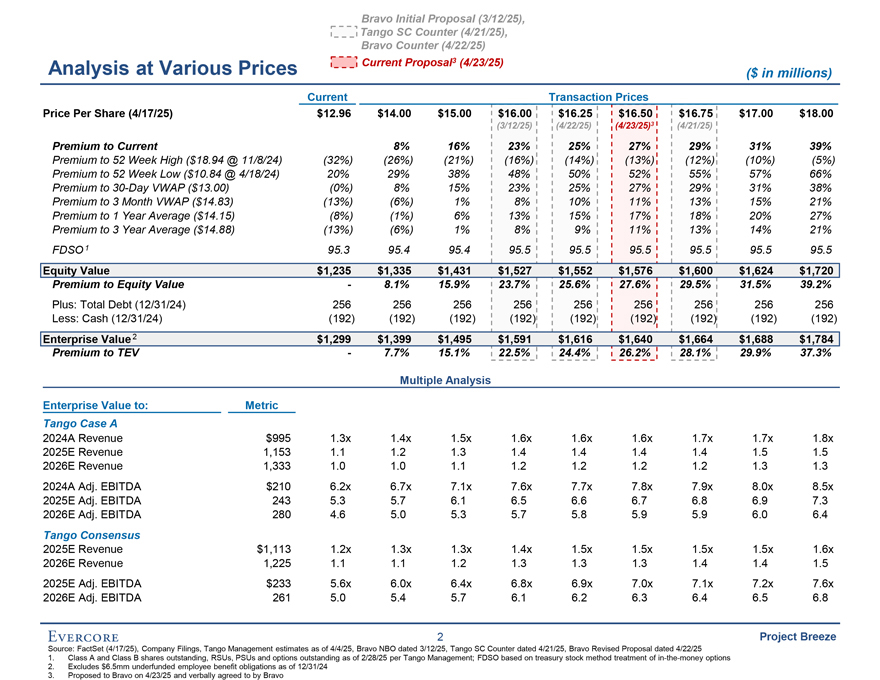
Bravo Initial Proposal (3/12/25), Tango SC Counter (4/21/25), Bravo Counter (4/22/25) Analysis at Various Prices Current Proposal3 (4/23/25) ($ in millions) Current Transaction Prices Price Per Share (4/17/25) $12.96 $14.00 $15.00 $16.00 $16.25 $16.50 $16.75 $17.00 $18.00 (3/12/25) (4/22/25) (4/23/25)3 (4/21/25) Premium to Current 8% 16% 23% 25% 27% 29% 31% 39% Premium to 52 Week High ($18.94 @ 11/8/24) (32%) (26%) (21%) (16%) (14%) (13%) (12%) (10%) (5%) Premium to 52 Week Low ($10.84 @ 4/18/24) 20% 29% 38% 48% 50% 52% 55% 57% 66% Premium to 30-Day VWAP ($13.00) (0%) 8% 15% 23% 25% 27% 29% 31% 38% Premium to 3 Month VWAP ($14.83) (13%) (6%) 1% 8% 10% 11% 13% 15% 21% Premium to 1 Year Average ($14.15) (8%) (1%) 6% 13% 15% 17% 18% 20% 27% Premium to 3 Year Average ($14.88) (13%) (6%) 1% 8% 9% 11% 13% 14% 21% FDSO1 95.3 95.4 95.4 95.5 95.5 95.5 95.5 95.5 95.5 Equity Value $1,235 $1,335 $1,431 $1,527 $1,552 $1,576 $1,600 $1,624 $1,720 Premium to Equity Value - 8.1% 15.9% 23.7% 25.6% 27.6% 29.5% 31.5% 39.2% Plus: Total Debt (12/31/24) 256 256 256 256 256 256 256 256 256 Less: Cash (12/31/24) (192) (192) (192) (192) (192) (192) (192) (192) (192) Enterprise Value2 $1,299 $1,399 $1,495 $1,591 $1,616 $1,640 $1,664 $1,688 $1,784 Premium to TEV - 7.7% 15.1% 22.5% 24.4% 26.2% 28.1% 29.9% 37.3% Multiple Analysis Enterprise Value to: Metric Tango Case A 2024A Revenue $995 1.3x 1.4x 1.5x 1.6x 1.6x 1.6x 1.7x 1.7x 1.8x 2025E Revenue 1,153 1.1 1.2 1.3 1.4 1.4 1.4 1.4 1.5 1.5 2026E Revenue 1,333 1.0 1.0 1.1 1.2 1.2 1.2 1.2 1.3 1.3 2024A Adj. EBITDA $210 6.2x 6.7x 7.1x 7.6x 7.7x 7.8x 7.9x 8.0x 8.5x 2025E Adj. EBITDA 243 5.3 5.7 6.1 6.5 6.6 6.7 6.8 6.9 7.3 2026E Adj. EBITDA 280 4.6 5.0 5.3 5.7 5.8 5.9 5.9 6.0 6.4 Tango Consensus 2025E Revenue $1,113 1.2x 1.3x 1.3x 1.4x 1.5x 1.5x 1.5x 1.5x 1.6x 2026E Revenue 1,225 1.1 1.1 1.2 1.3 1.3 1.3 1.4 1.4 1.5 2025E Adj. EBITDA $233 5.6x 6.0x 6.4x 6.8x 6.9x 7.0x 7.1x 7.2x 7.6x 2026E Adj. EBITDA 261 5.0 5.4 5.7 6.1 6.2 6.3 6.4 6.5 6.8 2 Project Breeze Source: FactSet (4/17/25), Company Filings, Tango Management estimates as of 4/4/25, Bravo NBO dated 3/12/25, Tango SC Counter dated 4/21/25, Bravo Revised Proposal dated 4/22/25 1. Class A and Class B shares outstanding, RSUs, PSUs and options outstanding as of 2/28/25 per Tango Management; FDSO based on treasury stock method treatment of in-the-money options 2. Excludes $6.5mm underfunded employee benefit obligations as of 12/31/24 3. Proposed to Bravo on 4/23/25 and verbally agreed to by Bravo
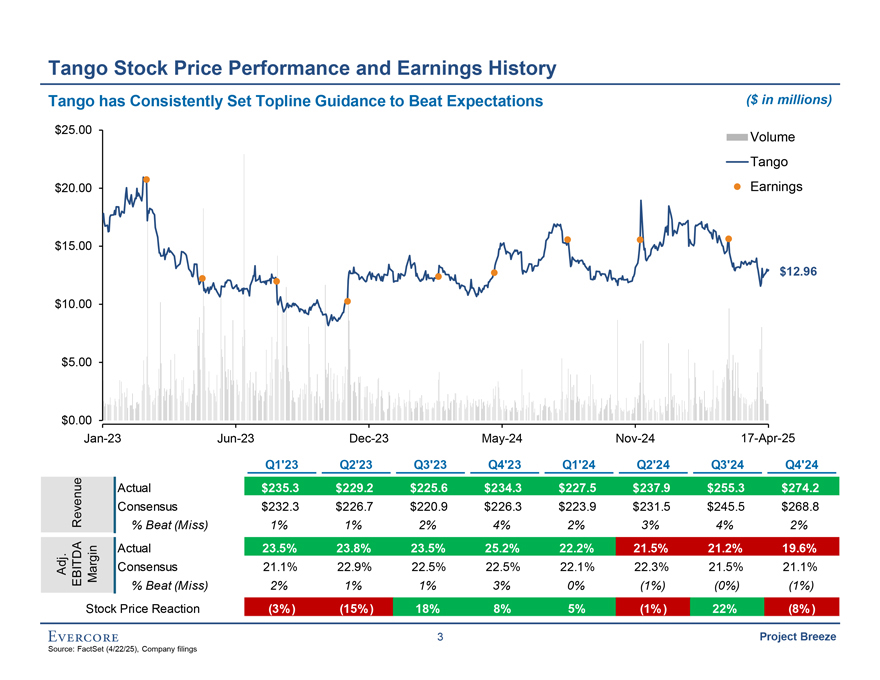
Tango Stock Price Performance and Earnings History Tango has Consistently Set Topline Guidance to Beat Expectations ($ in millions) $25.00 Volume Tango $20.00 Earnings $15.00 $12.96 $10.00 $5.00 $0.00 Jan-23 Jun-23 Dec-23 May-24 Nov-24 17-Apr-25 Q1’23 Q2’23 Q3’23 Q4’23 Q1’24 Q2’24 Q3’24 Q4’24 Actual $235.3 $229.2 $225.6 $234.3 $227.5 $237.9 $255.3 $274.2 Revenue Consensus $232.3 $226.7 $220.9 $226.3 $223.9 $231.5 $245.5 $268.8 % Beat (Miss) 1% 1% 2% 4% 2% 3% 4% 2% Actual 23.5% 23.8% 23.5% 25.2% 22.2% 21.5% 21.2% 19.6% Adj. EBITDA Margin Consensus 21.1% 22.9% 22.5% 22.5% 22.1% 22.3% 21.5% 21.1% % Beat (Miss) 2% 1% 1% 3% 0% (1%) (0%) (1%) Stock Price Reaction (3%) (15%) 18% 8% 5% (1%) 22% (8%) 3 Project Breeze Source: FactSet (4/22/25), Company filings
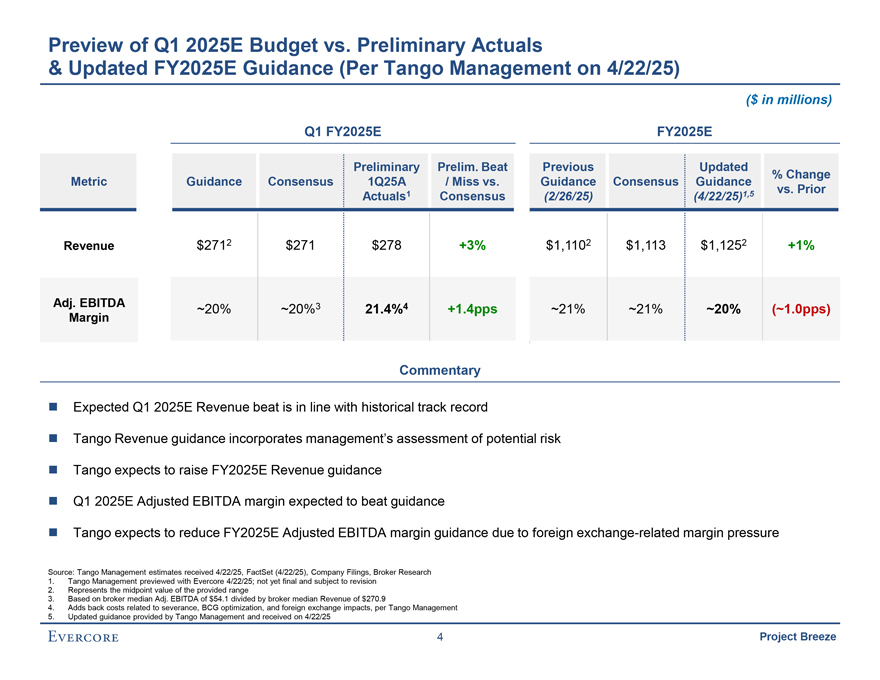
Preview of Q1 2025E Budget vs. Preliminary Actuals & Updated FY2025E Guidance (Per Tango Management on 4/22/25) ($ in millions) Q1 FY2025E FY2025E Preliminary Prelim. Beat Previous Updated % Change Metric Guidance Consensus 1Q25A / Miss vs. Guidance Consensus Guidance 1 1,5 vs. Prior Actuals Consensus (2/26/25) (4/22/25) Revenue $2712 $271 $278 +3% $1,1102 $1,113 $1,1252 +1% Adj. EBITDA ~20% ~20%3 21.4%4 +1.4pps ~21% ~21% ~20% (~1.0pps) Margin Commentary ? Expected Q1 2025E Revenue beat is in line with historical track record ? Tango Revenue guidance incorporates management’s assessment of potential risk? Tango expects to raise FY2025E Revenue guidance? Q1 2025E Adjusted EBITDA margin expected to beat guidance ? Tango expects to reduce FY2025E Adjusted EBITDA margin guidance due to foreign exchange-related margin pressure Source: Tango Management estimates received 4/22/25, FactSet (4/22/25), Company Filings, Broker Research 1. Tango Management previewed with Evercore 4/22/25; not yet final and subject to revision 2. Represents the midpoint value of the provided range 3. Based on broker median Adj. EBITDA of $54.1 divided by broker median Revenue of $270.9 4. Adds back costs related to severance, BCG optimization, and foreign exchange impacts, per Tango Management 5. Updated guidance provided by Tango Management and received on 4/22/25 4 Project Breeze
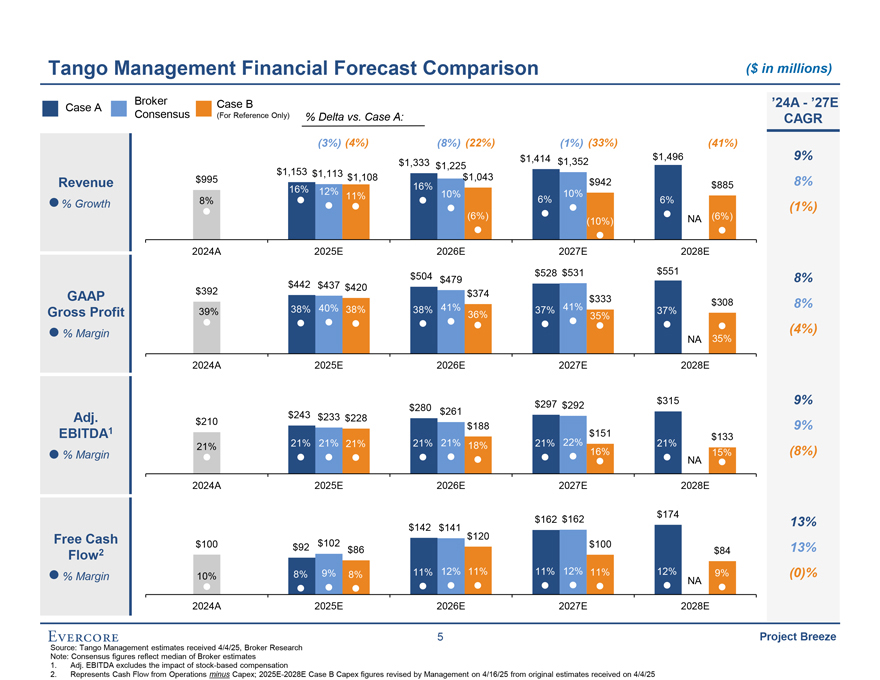
Tango Management Financial Forecast Comparison ($ in millions) Broker Case B ‘24A - ‘27E Case A Consensus (For Reference Only) % Delta vs. Case A: CAGR (3%) (4%) (8%) (22%) (1%) (33%) (41%) 9% $1,414 $1,352 $1,496 $1,333 $1,225 $1,153 $1,113 Revenue $995 $1,108 $1,043 $942 8% 16% 16% $885 12% 11% 10% 10% % Growth 8% 6% 6% (1%) (6%) NA (6%) (10%) 2024A 2025E 2026E 2027E 2028E $504 $528 $531 $551 8% $442 $479 $437 $420 GAAP $392 $374 $333 $308 8% Gross Profit 39% 38% 40% 38% 38% 41% 37% 41% 37% 36% 35% % Margin (4%) NA 35% 2024A 2025E 2026E 2027E 2028E $297 $292 $315 9% $280 $261 Adj. $243 $233 $228 1 $210 $188 9% EBITDA $151 $133 21% 21% 21% 21% 21% 21% 18% 21% 22% 21% % Margin 16% 15% (8%) NA 2024A 2025E 2026E 2027E 2028E $162 $162 $174 $142 $141 13% Free Cash $120 $100 $92 $102 $100 13% Flow2 $86 $84 % Margin 10% 8% 9% 8% 11% 12% 11% 11% 12% 11% 12% 9% (0)% NA 2024A 2025E 2026E 2027E 2028E 5 Project Breeze Source: Tango Management estimates received 4/4/25, Broker Research Note: Consensus figures reflect median of Broker estimates 1. Adj. EBITDA excludes the impact of stock-based compensation 2. Represents Cash Flow from Operations minus Capex; 2025E-2028E Case B Capex figures revised by Management on 4/16/25 from original estimates received on 4/4/25

Appendix Evercore
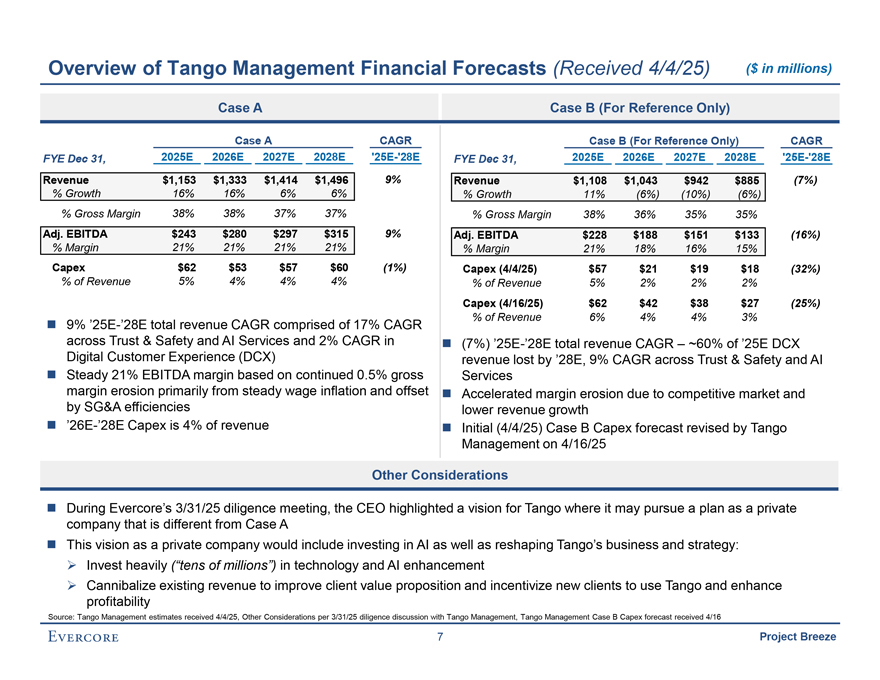
Overview of Tango Management Financial Forecasts (Received 4/4/25) ($ in millions) Case A Case B (For Reference Only) Case A CAGR Case B (For Reference Only) CAGR FYE Dec 31, 2025E 2026E 2027E 2028E ‘25E-’28E FYE Dec 31, 2025E 2026E 2027E 2028E ‘25E-’28E Revenue $1,153 $1,333 $1,414 $1,496 9% Revenue $1,108 $1,043 $942 $885 (7%) % Growth 16% 16% 6% 6% % Growth 11% (6%) (10%) (6%) % Gross Margin 38% 38% 37% 37% % Gross Margin 38% 36% 35% 35% Adj. EBITDA $243 $280 $297 $315 9% Adj. EBITDA $228 $188 $151 $133 (16%) % Margin 21% 21% 21% 21% % Margin 21% 18% 16% 15% Capex $62 $53 $57 $60 (1%) Capex (4/4/25) $57 $21 $19 $18 (32%) % of Revenue 5% 4% 4% 4% % of Revenue 5% 2% 2% 2% Capex (4/16/25) $62 $42 $38 $27 (25%) comprised of 17% CAGR % of Revenue 6% 4% 4% 3% ? 9% ‘25E-’28E total revenue CAGR across Trust & Safety and AI Services and 2% CAGR in ? (7%) ‘25E-’28E total revenue CAGR – ~60% of ‘25E DCX Digital Customer Experience (DCX) revenue lost by ‘28E, 9% CAGR across Trust & Safety and AI ? Steady 21% EBITDA margin based on continued 0.5% gross Services margin erosion primarily from steady wage inflation and offset ? Accelerated margin erosion due to competitive market and by SG&A efficiencies lower revenue growth? ‘26E-’28E Capex is 4% of revenue? Initial (4/4/25) Case B Capex forecast revised by Tango Management on 4/16/25 Other Considerations ? During Evercore’s 3/31/25 diligence meeting, the CEO highlighted a vision for Tango where it may pursue a plan as a private company that is different from Case A ? This vision as a private company would include investing in AI as well as reshaping Tango’s business and strategy:? Invest heavily (“tens of millions”) in technology and AI enhancement? Cannibalize existing revenue to improve client value proposition and incentivize new clients to use Tango and enhance profitability Source: Tango Management estimates received 4/4/25, Other Considerations per 3/31/25 diligence discussion with Tango Management, Tango Management Case B Capex forecast received 4/16 7 Project Breeze
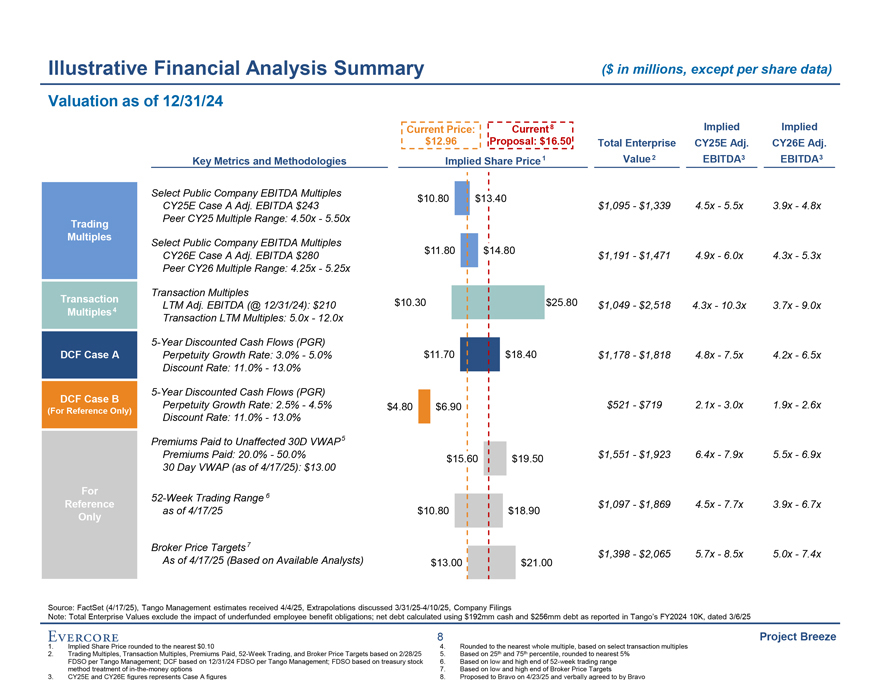
Illustrative Financial Analysis Summary ($ in millions, except per share data) Valuation as of 12/31/24 Current Price: Current 8 Implied Implied $12.96 Proposal: $16.50 Total Enterprise CY25E Adj. CY26E Adj. Key Metrics and Methodologies Implied Share Price1 Value2 EBITDA3 EBITDA3 Select Public Company EBITDA Multiples $10.80 $13.40 CY25E Case A Adj. EBITDA $243 $1,095 - $1,339 4.5x - 5.5x 3.9x - 4.8x Trading Peer CY25 Multiple Range: 4.50x - 5.50x Multiples Select Public Company EBITDA Multiples CY26E Case A Adj. EBITDA $280 $11.80 $14.80 $1,191 - $1,471 4.9x - 6.0x 4.3x - 5.3x Peer CY26 Multiple Range: 4.25x - 5.25x Transaction Multiples Transaction $10.30 $25.80 4 LTM Adj. EBITDA (@ 12/31/24): $210 $1,049 - $2,518 4.3x - 10.3x 3.7x - 9.0x Multiples Transaction LTM Multiples: 5.0x - 12.0x 5-Year Discounted Cash Flows (PGR) DCF Case A Perpetuity Growth Rate: 3.0% - 5.0% $11.70 $18.40 $1,178 - $1,818 4.8x - 7.5x 4.2x - 6.5x Discount Rate: 11.0% - 13.0% 5-Year Discounted Cash Flows (PGR) DCF Case B Perpetuity Growth Rate: 2.5% - 4.5% $4.80 $6.90 $521 - $719 2.1x - 3.0x 1.9x - 2.6x (For Reference Only) Discount Rate: 11.0% - 13.0% Premiums Paid to Unaffected 30D VWAP5 Premiums Paid: 20.0% - 50.0% $15.60 $19.50 $1,551 - $1,923 6.4x - 7.9x 5.5x - 6.9x 30 Day VWAP (as of 4/17/25): $13.00 For 52-Week Trading Range 6 Reference $1,097 - $1,869 4.5x - 7.7x 3.9x - 6.7x as of 4/17/25 $10.80 $18.90 Only Broker Price Targets7 $1,398 - $2,065 5.7x - 8.5x 5.0x - 7.4x As of 4/17/25 (Based on Available Analysts) $13.00 $21.00 Source: FactSet (4/17/25), Tango Management estimates received 4/4/25, Extrapolations discussed 3/31/25-4/10/25, Company Filings Note: Total Enterprise Values exclude the impact of underfunded employee benefit obligations; net debt calculated using $192mm cash and $256mm debt as reported in Tango’s FY2024 10K, dated 3/6/25 8 Project Breeze 1. Implied Share Price rounded to the nearest $0.10 4. Rounded to the nearest whole multiple, based on select transaction multiples 2. Trading Multiples, Transaction Multiples, Premiums Paid, 52-Week Trading, and Broker Price Targets based on 2/28/25 5. Based on 25th and 75th percentile, rounded to nearest 5% FDSO per Tango Management; DCF based on 12/31/24 FDSO per Tango Management; FDSO based on treasury stock 6. Based on low and high end of 52-week trading range method treatment of in-the-money options 7. Based on low and high end of Broker Price Targets 3. CY25E and CY26E figures represents Case A figures 8. Proposed to Bravo on 4/23/25 and verbally agreed to by Bravo
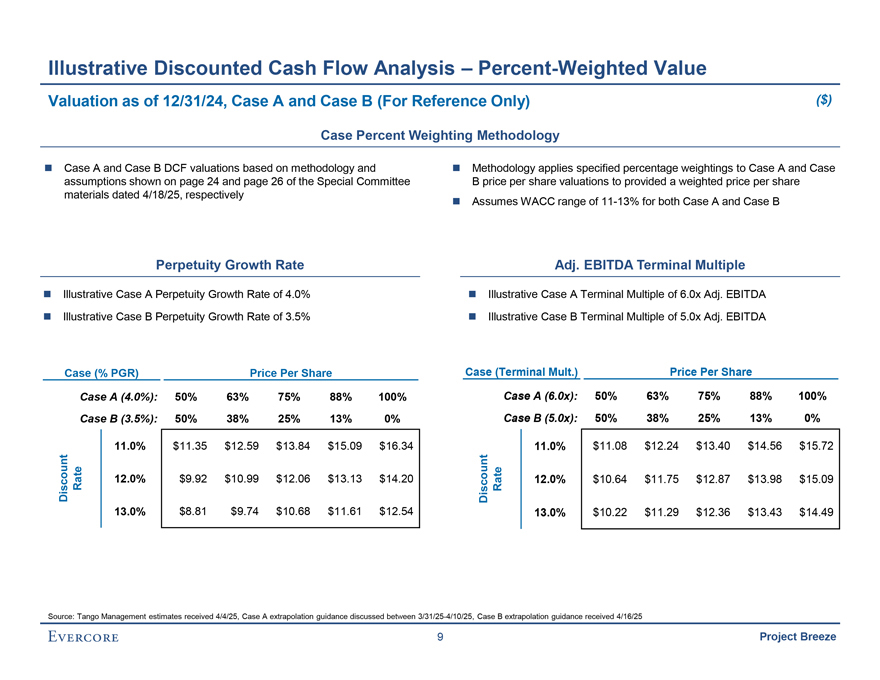
Illustrative Discounted Cash Flow Analysis – Percent-Weighted Value Valuation as of 12/31/24, Case A and Case B (For Reference Only) ($) Case Percent Weighting Methodology ? Case A and Case B DCF valuations based on methodology and ? Methodology applies specified percentage weightings to Case A and Case assumptions shown on page 24 and page 26 of the Special Committee B price per share valuations to provided a weighted price per share materials dated 4/18/25, respectively? Assumes WACC range of 11-13% for both Case A and Case B Perpetuity Growth Rate Adj. EBITDA Terminal Multiple ? Illustrative Case A Perpetuity Growth Rate of 4.0%? Illustrative Case A Terminal Multiple of 6.0x Adj. EBITDA? Illustrative Case B Perpetuity Growth Rate of 3.5%? Illustrative Case B Terminal Multiple of 5.0x Adj. EBITDA Case (% PGR) Price Per Share Case (Terminal Mult.) Price Per Share Case A (4.0%): 50% 63% 75% 88% 100% Case A (6.0x): 50% 63% 75% 88% 100% Case B (3.5%): 50% 38% 25% 13% 0% Case B (5.0x): 50% 38% 25% 13% 0% 11.0% $11.35 $12.59 $13.84 $15.09 $16.34 11.0% $11.08 $12.24 $13.40 $14.56 $15.72 Discount Rate 12.0% $9.92 $10.99 $12.06 $13.13 $14.20 Discount Rate 12.0% $10.64 $11.75 $12.87 $13.98 $15.09 13.0% $8.81 $9.74 $10.68 $11.61 $12.54 13.0% $10.22 $11.29 $12.36 $13.43 $14.49 Source: Tango Management estimates received 4/4/25, Case A extrapolation guidance discussed between 3/31/25-4/10/25, Case B extrapolation guidance received 4/16/25 9 Project Breeze
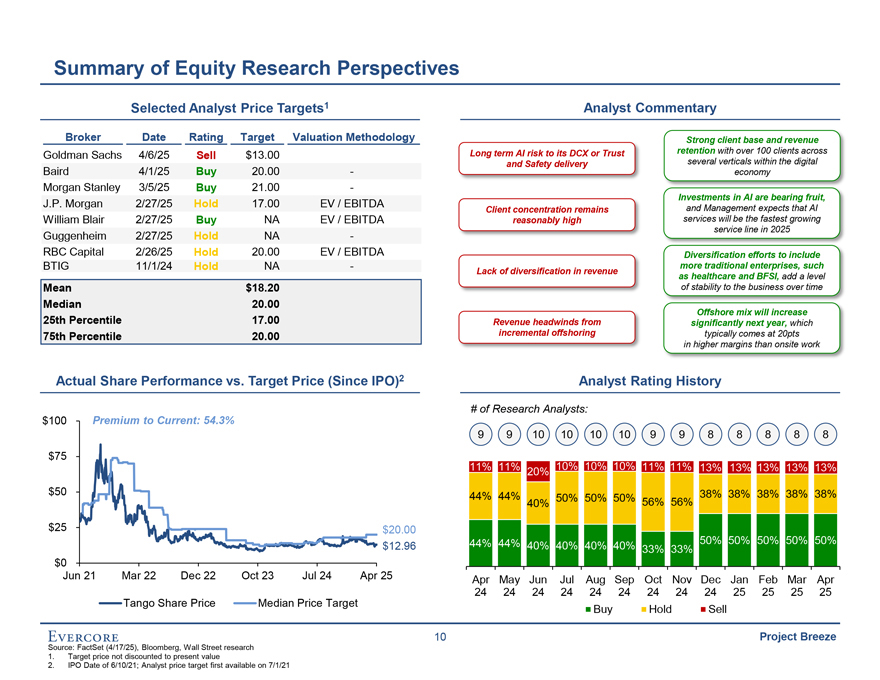
Summary of Equity Research Perspectives Selected Analyst Price Targets1 Analyst Commentary Broker Date Rating Target Valuation Methodology Strong client base and revenue Goldman Sachs 4/6/25 Sell $13.00 Long term AI risk to its DCX or Trust retention with over 100 clients across and Safety delivery several verticals within the digital Baird 4/1/25 Buy 20.00 - economy Morgan Stanley 3/5/25 Buy 21.00 - Investments in AI are bearing fruit, J.P. Morgan 2/27/25 Hold 17.00 EV / EBITDA and Management expects that AI Client concentration remains services will be the fastest growing William Blair 2/27/25 Buy NA EV / EBITDA reasonably high service line in 2025 Guggenheim 2/27/25 Hold NA -RBC Capital 2/26/25 Hold 20.00 EV / EBITDA Diversification efforts to include BTIG 11/1/24 Hold NA - more traditional enterprises, such Lack of diversification in revenue as healthcare and BFSI, add a level Mean $18.20 of stability to the business over time Median 20.00 Offshore mix will increase 25th Percentile 17.00 Revenue headwinds from significantly next year, which 75th Percentile 20.00 incremental offshoring typically comes at 20pts in higher margins than onsite work Actual Share Performance vs. Target Price (Since IPO)2 Analyst Rating History # of Research Analysts: $100 Premium to Current: 54.3% 9 9 10 10 10 10 9 9 8 8 8 8 8 $75 11% 11% 20% 10% 10% 10% 11% 11% 13% 13% 13% 13% 13% $50 44% 44% 38% 38% 38% 38% 38% 40% 50% 50% 50% 56% 56% $25 $20.00 44% 44% 40% 40% 40% 40% 50% 50% 50% 50% 50% $12.96 33% 33% $0 Jun 21 Mar 22 Dec 22 Oct 23 Jul 24 Apr 25 Apr May Jun Jul Aug Sep Oct Nov Dec Jan Feb Mar Apr 24 24 24 24 24 24 24 24 24 25 25 25 25 Tango Share Price Median Price Target Buy Hold Sell 10 Project Breeze Source: FactSet (4/17/25), Bloomberg, Wall Street research 1. Target price not discounted to present value 2. IPO Date of 6/10/21; Analyst price target first available on 7/1/21
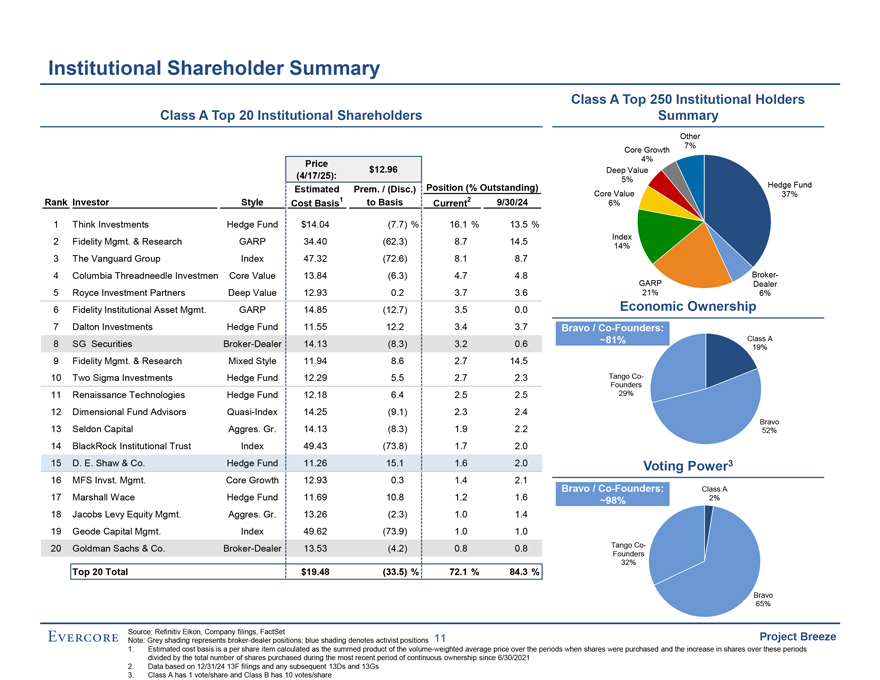
Institutional Shareholder Summary Class A Top 250 Institutional Holders Class A Top 20 Institutional Shareholders Summary Other 7% Core Growth Price 4% $12.96 Deep Value (4/17/25): 5% Hedge Fund Estimated Prem. / (Disc.) Position (% Outstanding) Core Value 37% Rank Investor Style Cost Basis1 to Basis Current2 9/30/24 6% 1 Think Investments Hedge Fund $14.04 (7.7) % 16.1 % 13.5 % 2 Fidelity Mgmt. & Research GARP 34.40 (62.3) 8.7 14.5 Index 14% 3 The Vanguard Group Index 47.32 (72.6) 8.1 8.7 4 Columbia Threadneedle Investmen Core Value 13.84 (6.3) 4.7 4.8 GARP Broker-21% Dealer 5 Royce Investment Partners Deep Value 12.93 0.2 3.7 3.6 6% 6 Fidelity Institutional Asset Mgmt. GARP 14.85 (12.7) 3.5 0.0 Economic Ownership 7 Dalton Investments Hedge Fund 11.55 12.2 3.4 3.7 Bravo / Co-Founders: 8 SG Securities Broker-Dealer 14.13 (8.3) 3.2 0.6 ~81% Class A 19% 9 Fidelity Mgmt. & Research Mixed Style 11.94 8.6 2.7 14.5 10 Two Sigma Investments Hedge Fund 12.29 5.5 2.7 2.3 Tango Co-Founders 11 Renaissance Technologies Hedge Fund 12.18 6.4 2.5 2.5 29% 12 Dimensional Fund Advisors Quasi-Index 14.25 (9.1) 2.3 2.4 Bravo 13 Seldon Capital Aggres. Gr. 14.13 (8.3) 1.9 2.2 52% 14 BlackRock Institutional Trust Index 49.43 (73.8) 1.7 2.0 15 D. E. Shaw & Co. Hedge Fund 11.26 15.1 1.6 2.0 Voting Power3 16 MFS Invst. Mgmt. Core Growth 12.93 0.3 1.4 2.1 Bravo / Co-Founders: Class A 17 Marshall Wace Hedge Fund 11.69 10.8 1.2 1.6 ~98% 2% 18 Jacobs Levy Equity Mgmt. Aggres. Gr. 13.26 (2.3) 1.0 1.4 19 Geode Capital Mgmt. Index 49.62 (73.9) 1.0 1.0 20 Goldman Sachs & Co. Broker-Dealer 13.53 (4.2) 0.8 0.8 Tango Co-Founders Top 20 Total $19.48 (33.5) % 72.1 % 84.3 % 32% Bravo 65% Source: Refinitiv Eikon, Company filings, FactSet Project Breeze Note: Grey shading represents broker-dealer positions; blue shading denotes activist positions 11 1. Estimated cost basis is a per share item calculated as the summed product of the volume-weighted average price over the periods when shares were purchased and the increase in shares over these periods divided by the total number of shares purchased during the most recent period of continuous ownership since 6/30/2021 2. Data based on 12/31/24 13F filings and any subsequent 13Ds and 13Gs 3. Class A has 1 vote/share and Class B has 10 votes/share
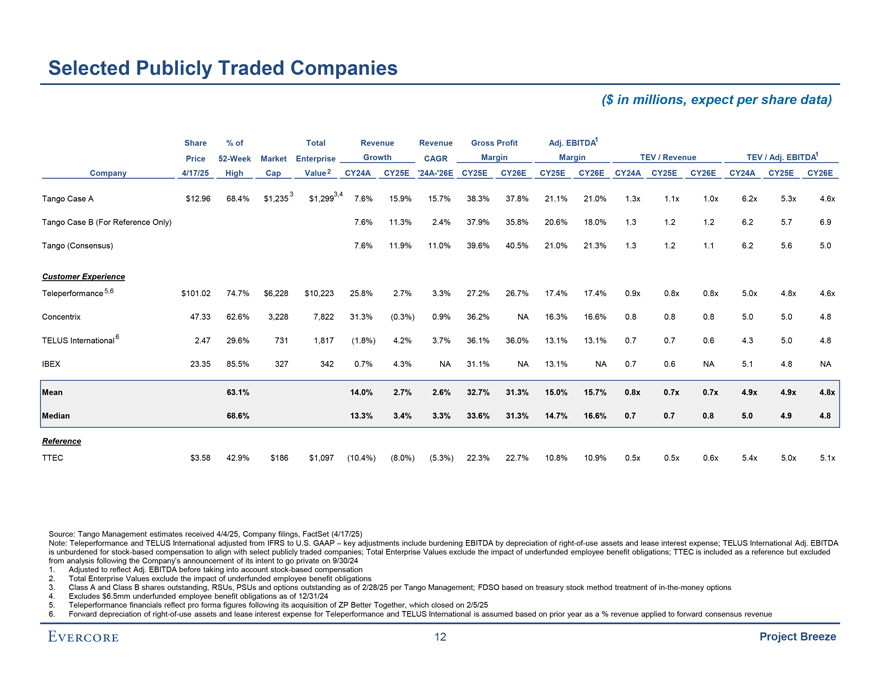
Selected Publicly Traded Companies ($ in millions, expect per share data) Share % of Total Revenue Revenue Gross Profit Adj. EBITDA1 Growth Margin Margin TEV / Revenue TEV / Adj. EBITDA1 Price 52-Week Market Enterprise CAGR Company 4/17/25 High Cap Value2 CY24A CY25E ‘24A-’26E CY25E CY26E CY25E CY26E CY24A CY25E CY26E CY24A CY25E CY26E 3 3,4 Tango Case A $12.96 68.4% $1,235 $1,299 7.6% 15.9% 15.7% 38.3% 37.8% 21.1% 21.0% 1.3x 1.1x 1.0x 6.2x 5.3x 4.6x Tango Case B (For Reference Only) 7.6% 11.3% 2.4% 37.9% 35.8% 20.6% 18.0% 1.3 1.2 1.2 6.2 5.7 6.9 Tango (Consensus) 7.6% 11.9% 11.0% 39.6% 40.5% 21.0% 21.3% 1.3 1.2 1.1 6.2 5.6 5.0 Customer Experience Teleperformance5,6 $101.02 74.7% $6,228 $10,223 25.8% 2.7% 3.3% 27.2% 26.7% 17.4% 17.4% 0.9x 0.8x 0.8x 5.0x 4.8x 4.6x Concentrix 47.33 62.6% 3,228 7,822 31.3% (0.3%) 0.9% 36.2% NA 16.3% 16.6% 0.8 0.8 0.8 5.0 5.0 4.8 TELUS International6 2.47 29.6% 731 1,817 (1.8%) 4.2% 3.7% 36.1% 36.0% 13.1% 13.1% 0.7 0.7 0.6 4.3 5.0 4.8 IBEX 23.35 85.5% 327 342 0.7% 4.3% NA 31.1% NA 13.1% NA 0.7 0.6 NA 5.1 4.8 NA Mean 63.1% 14.0% 2.7% 2.6% 32.7% 31.3% 15.0% 15.7% 0.8x 0.7x 0.7x 4.9x 4.9x 4.8x Median 68.6% 13.3% 3.4% 3.3% 33.6% 31.3% 14.7% 16.6% 0.7 0.7 0.8 5.0 4.9 4.8 Reference TTEC $3.58 42.9% $186 $1,097 (10.4%) (8.0%) (5.3%) 22.3% 22.7% 10.8% 10.9% 0.5x 0.5x 0.6x 5.4x 5.0x 5.1x Source: Tango Management estimates received 4/4/25, Company filings, FactSet (4/17/25) Note: Teleperformance and TELUS International adjusted from IFRS to U.S. GAAP – key adjustments include burdening EBITDA by depreciation of right-of-use assets and lease interest expense; TELUS International Adj. EBITDA is unburdened for stock-based compensation to align with select publicly traded companies; Total Enterprise Values exclude the impact of underfunded employee benefit obligations; TTEC is included as a reference but excluded from analysis following the Company’s announcement of its intent to go private on 9/30/24 1. Adjusted to reflect Adj. EBITDA before taking into account stock-based compensation 2. Total Enterprise Values exclude the impact of underfunded employee benefit obligations 3. Class A and Class B shares outstanding, RSUs, PSUs and options outstanding as of 2/28/25 per Tango Management; FDSO based on treasury stock method treatment of in-the-money options 4. Excludes $6.5mm underfunded employee benefit obligations as of 12/31/24 5. Teleperformance financials reflect pro forma figures following its acquisition of ZP Better Together, which closed on 2/5/25 6. Forward depreciation of right-of-use assets and lease interest expense for Teleperformance and TELUS International is assumed based on prior year as a % revenue applied to forward consensus revenue 12 Project Breeze
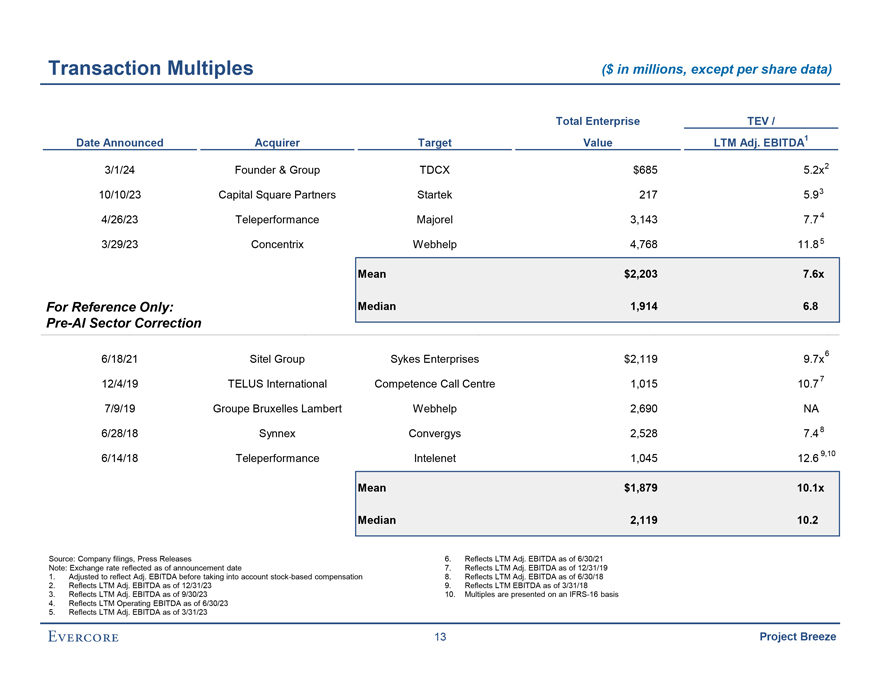
Transaction Multiples ($ in millions, except per share data) Total Enterprise TEV / Date Announced Acquirer Target Value LTM Adj. EBITDA1 3/1/24 Founder & Group TDCX $685 5.2x2 10/10/23 Capital Square Partners Startek 217 5.93 4/26/23 Teleperformance Majorel 3,143 7.74 3/29/23 Concentrix Webhelp 4,768 11.85 Mean $2,203 7.6x For Reference Only: Median 1,914 6.8 Pre-AI Sector Correction 6/18/21 Sitel Group Sykes Enterprises $2,119 9.7x6 12/4/19 TELUS International Competence Call Centre 1,015 10.77 7/9/19 Groupe Bruxelles Lambert Webhelp 2,690 NA 6/28/18 Synnex Convergys 2,528 7.48 6/14/18 Teleperformance Intelenet 1,045 12.6 9,10 Mean $1,879 10.1x Median 2,119 10.2 Source: Company filings, Press Releases 6. Reflects LTM Adj. EBITDA as of 6/30/21 Note: Exchange rate reflected as of announcement date 7. Reflects LTM Adj. EBITDA as of 12/31/19 1. Adjusted to reflect Adj. EBITDA before taking into account stock-based compensation 8. Reflects LTM Adj. EBITDA as of 6/30/18 2. Reflects LTM Adj. EBITDA as of 12/31/23 9. Reflects LTM EBITDA as of 3/31/18 3. Reflects LTM Adj. EBITDA as of 9/30/23 10. Multiples are presented on an IFRS-16 basis 4. Reflects LTM Operating EBITDA as of 6/30/23 5. Reflects LTM Adj. EBITDA as of 3/31/23 13 Project Breeze
These materials have been prepared by Evercore Group L.L.C. (“Evercore”) for the Special Committee of the Board of Directors of Tango to whom such materials are directly addressed and delivered and may not be used or relied upon for any purpose other than as specifically contemplated. These materials are based on information provided by or on behalf of the Company and/or other potential transaction participants, from public sources or otherwise reviewed by Evercore. Evercore assumes no responsibility for independent investigation or verification of such information and has relied on such information being complete and accurate in all material respects. To the extent such information includes estimates and forecasts of future financial performance prepared by or reviewed with the Management of the Company and/or other potential transaction participants or obtained from public sources, Evercore has assumed that such estimates and forecasts have been reasonably prepared on bases reflecting the best currently available estimates and judgments of such Management (or, with respect to estimates and forecasts obtained from public sources, represent reasonable estimates). No representation or warranty, express or implied, is made as to the accuracy or completeness of such information and nothing contained herein is, or shall be relied upon as, a representation, whether as to the past, the present or the future. These materials were designed for use by specific persons familiar with the business and affairs of the Company. These materials are not intended to provide the sole basis for evaluating, and should not be considered a recommendation with respect to, any transaction or other matter. These materials have been developed by and are proprietary to Evercore and were prepared exclusively for the benefit and internal use of the Special Committee of the Board of Directors of the Company. These materials were compiled on a confidential basis for use by the Special Committee of the Board of Directors of the Company in evaluating the potential transaction described herein and not with a view to public disclosure or filing thereof under state or federal securities laws, and may not be reproduced, disseminated, quoted or referred to, in whole or in part, without the prior written consent of Evercore. These materials do not constitute an offer or solicitation to sell or purchase any securities and are not a commitment by Evercore (or any affiliate) to provide or arrange any financing for any transaction or to purchase any security in connection therewith. Evercore assumes no obligation to update or otherwise revise these materials. These materials may not reflect information known to other professionals in other business areas of Evercore and its affiliates. Evercore and its affiliates do not provide legal, accounting or tax advice. Accordingly, any statements contained herein as to tax matters were neither written nor intended by Evercore or its affiliates to be used and cannot be used by any taxpayer for the purpose of avoiding tax penalties that may be imposed on such taxpayer. Each person should seek legal, accounting and tax advice based on his, her or its particular circumstances from independent advisors regarding the impact of the transactions or matters described herein. Project Breeze