
3Q Earnings Presentation November 2025 Copyright © 2025 agilon health. Confidential internal document containing proprietary information. Do not distribute.
2 Disclaimers and Forward-Looking Statements FORWARD-LOOKING STATEMENTS AND OTHER INFORMATION Statements in this presentation that are not historical factual statements are “forward-looking statements” within the meaning of Section 27A of the Securities Act of 1933, as amended, and Section 21E of the Securities Exchange Act of 1934, as amended. Forward-looking statements include, among other things, statements regarding our and our officers’ intent, belief or expectation as identified by the use of words such as “believes,” “expects,” “may,” “will,” “shall,” “should,” “would,” “could,” “seeks,” “aims,” “projects,” “is optimistic,” “intends,” “plans,” “estimates,” “anticipates” or the negative versions of these words or other comparable terms. Examples of forward-looking statements include, among other things: statements regarding our expectation about levers in 2026, our cash flow and capital priorities, total and average membership, expected Total Revenues, Medical Margin, Adjusted EBITDA, Geography Entry Costs and other financial projections and assumptions, including our full year 2025 guidance. Forward-looking statements reflect our current expectations and views about future events and are subject to risks and uncertainties that could significantly affect our future financial condition and results of operations. While forward-looking statements reflect our good faith belief and assumptions we believe to be reasonable based upon current information, we can give no assurance that our expectations or forecasts will be attained. Forward-looking statements are subject to known and unknown risks and uncertainties, many of which may be outside our control, including but not limited to: our history of net losses and the expectation that our expenses will increase in the future; failure to identify and develop successful new geographies, physician partners and payors, or execute upon our growth initiatives; success in executing our operating strategies or achieving results consistent with our historical performance; medical expenses incurred on behalf of our members may exceed revenues we receive; our ability to maintain and secure additional contracts with Medicare Advantage payors on favorable terms, if at all; our ability to grow new physician partner relationships sufficient to recover startup costs; availability of additional capital, on acceptable terms or at all, to support our business in the future; significant reduction in our membership; transition to a Total Care Model may be challenging for physician partners; public health crises, such as pandemics or epidemics, could adversely affect us; inaccuracy in estimates of our members’ risk adjustment factors, medical services expense, incurred but not reported claims, and earnings pursuant to payor contracts; the impact of restrictive clauses or exclusivity provisions in some of our contracts with physician partners; our ability to hire and retain qualified personnel; our ability to realize the full value of our intangible assets; security breaches, cybersecurity attacks, loss of data and other disruptions to our information systems; our ability to protect the confidentiality of our know-how and other proprietary and internally developed information; our reliance on our subsidiaries to perform and fund their operations; our use of artificial intelligence and machine learning in our business and challenges with properly managing the development and use of these technologies; our reliance on a limited number of key payors; the limited terms of contracts with our payors and our ability to renew them upon expiration; our ability to navigate the changing healthcare payor market; our reliance on our payors, physician partners and other providers to operate our business; our ability to obtain accurate and complete diagnosis data; our reliance on third-party software, data, infrastructure and bandwidth; consolidation and competition in the healthcare industry; the impact of changes to, and dependence on, federal government healthcare programs; uncertain or adverse economic and macroeconomic conditions, including a downturn or decrease in government expenditures; regulation of the healthcare industry and our and our physician partners’ ability to comply with such laws and regulations; federal and state investigations, audits and enforcement actions; repayment obligations arising out of payor audits; negative publicity regarding the managed healthcare industry generally; our use, disclosure and processing of personally identifiable information, protected health information, and de-identified data; failure to obtain or maintain an insurance license, a certificate of authority or an equivalent authorization; changes in tax laws and regulations, or changes in related judgments or assumptions; our indebtedness and our potential to incur more debt; our dependence on our subsidiaries for cash to fund all of our operations and expenses; provisions in our governing documents; our ability to achieve a return on investment depends on appreciation in the price of our common stock; lawsuits not covered by insurance and securities class action litigation; sustainability issues; our stock price may be volatile; and risks related to management transitions, including the search for a permanent CEO, and our ability to effectively manage leadership changes . These risks and uncertainties that could cause actual results and outcomes to differ from those reflected in forward-looking statements include, but are not limited to, those factors discussed in our filings with the Securities and Exchange Commission (the “SEC”), including the factors discussed under “Risk Factors” in our Annual Report on Form 10-K for the fiscal year ended December 31, 2024, which can be found at the SEC’s website at www.sec.gov. Additionally, ongoing implementation of performance initiatives, leadership changes, and dynamic market conditions create additional uncertainty regarding our future operating and financial performance. Except as required by law, we do not undertake, and hereby disclaim, any obligation to update any forward-looking statements, which speak only as of the date on which they are made. NON-GAAP FINANCIAL MEASURES This presentation includes references to non‐GAAP financial measures, including but not limited to Medical Margin and Adjusted EBITDA. We believe medical margin and Adjusted EBITDA help identify underlying trends in our business and facilitate evaluation of period-to-period operating performance of our operations by eliminating items that are variable in nature and not considered by us in the evaluation of ongoing operating performance, allowing comparison of our recurring core business operating results over multiple periods. We also believe Medical Margin and Adjusted EBITDA provide useful information about our operating results, enhance the overall understanding of our past performance and future prospects, and allow for greater transparency with respect to key metrics we use for financial and operational decision-making. We believe Medical Margin and Adjusted EBITDA or similarly titled non-GAAP measures are widely used by investors, securities analysts, ratings agencies, and other parties in evaluating companies in our industry as a measure of financial performance. Other companies may calculate Medical Margin and Adjusted EBITDA or similarly titled non-GAAP measures differently from the way we calculate these metrics. As a result, our presentation of Medical Margin and Adjusted EBITDA may not be comparable to similarly titled measures of other companies, limiting their usefulness as comparative measures Medical Margin and Adjusted EBITDA have limitations as analytical tools and should not be considered in isolation or as an alternative to GAAP measures or other financial statement data presented in agilon’s consolidated financial statements. Reconciliation of such non-GAAP measures to the applicable GAAP measures are set forth in the appendix. TRADEMARKS All rights to the trademarks included herein, other than the Company’s trademarks, belong to their respective owners and our use hereof does not imply any endorsement by the owners of these trademarks.
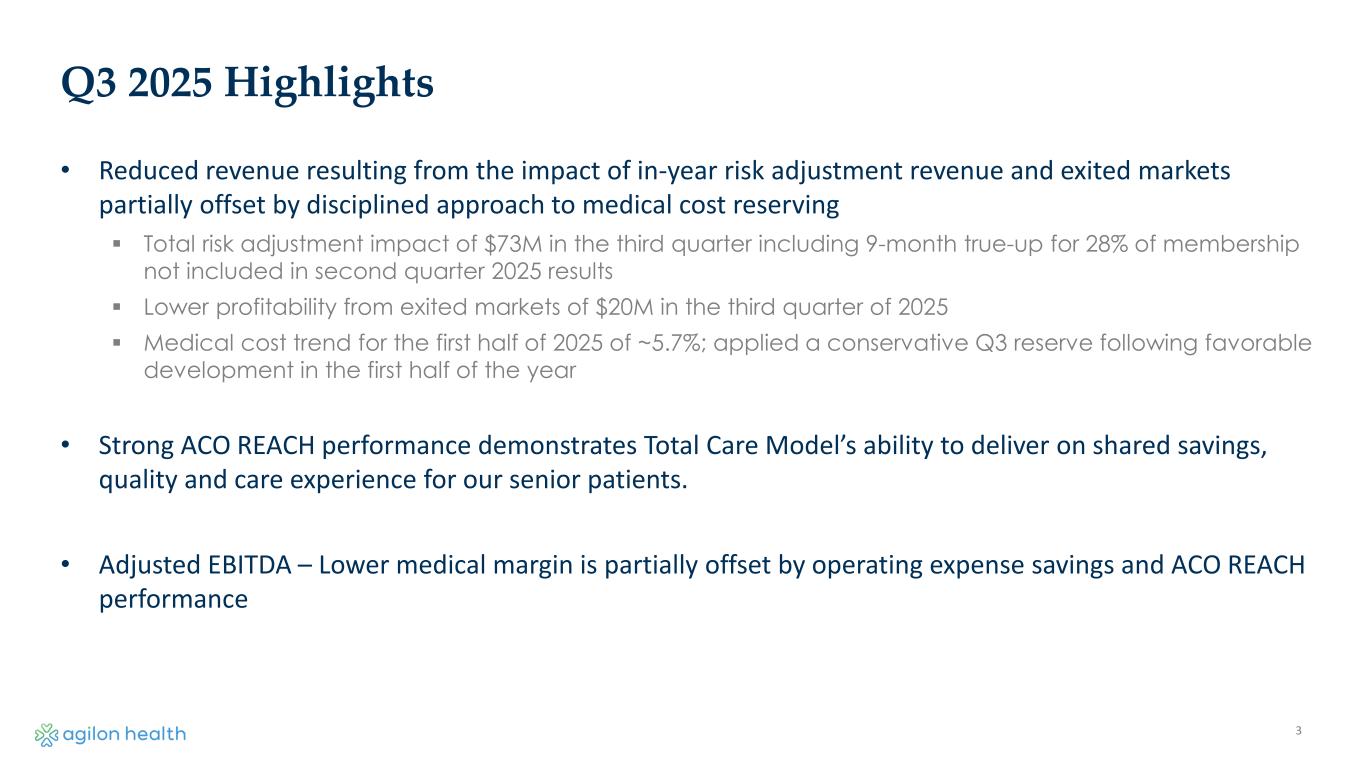
3 Q3 2025 Highlights • Reduced revenue resulting from the impact of in-year risk adjustment revenue and exited markets partially offset by disciplined approach to medical cost reserving Total risk adjustment impact of $73M in the third quarter including 9-month true-up for 28% of membership not included in second quarter 2025 results Lower profitability from exited markets of $20M in the third quarter of 2025 Medical cost trend for the first half of 2025 of ~5.7%; applied a conservative Q3 reserve following favorable development in the first half of the year • Strong ACO REACH performance demonstrates Total Care Model’s ability to deliver on shared savings, quality and care experience for our senior patients. • Adjusted EBITDA – Lower medical margin is partially offset by operating expense savings and ACO REACH performance
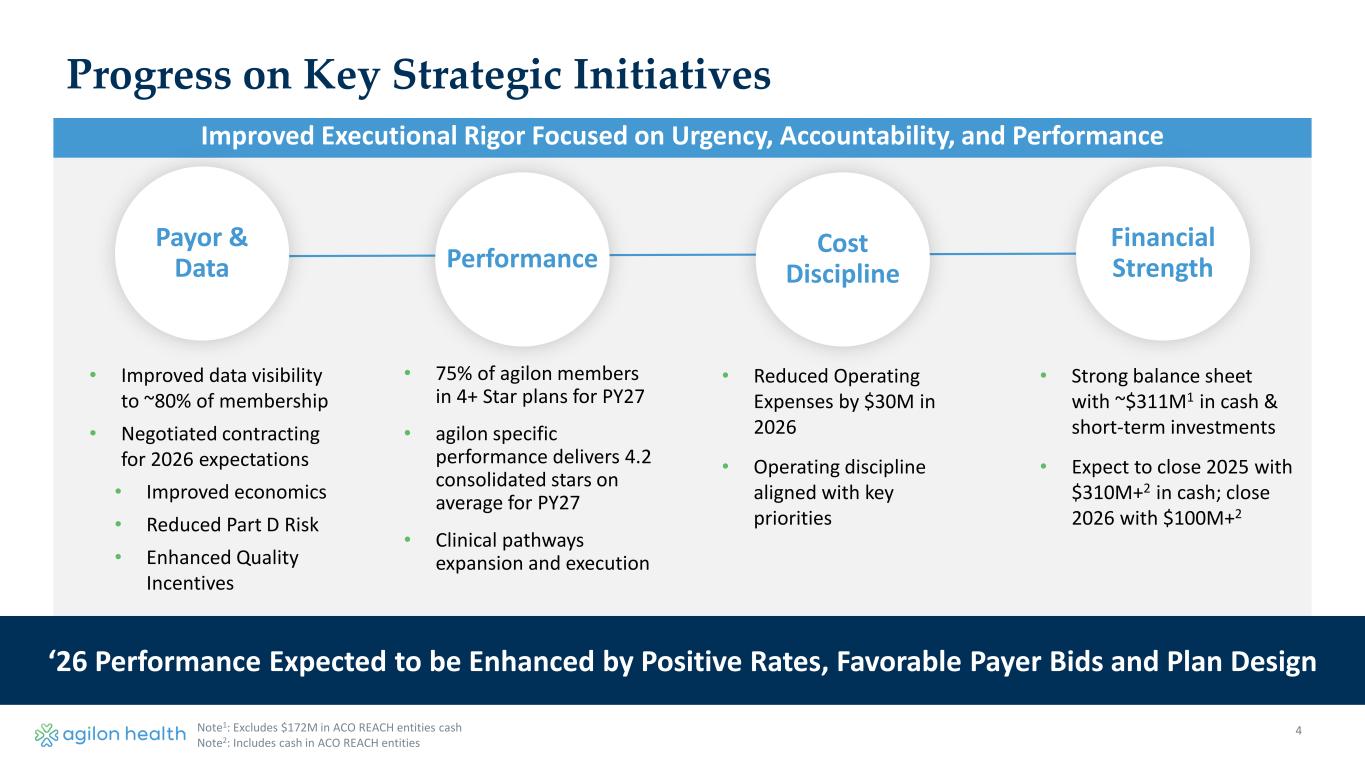
4 Improved Executional Rigor Focused on Urgency, Accountability, and Performance • 75% of agilon members in 4+ Star plans for PY27 • agilon specific performance delivers 4.2 consolidated stars on average for PY27 • Clinical pathways expansion and execution • Reduced Operating Expenses by $30M in 2026 • Operating discipline aligned with key priorities • Strong balance sheet with ~$311M1 in cash & short-term investments • Expect to close 2025 with $310M+2 in cash; close 2026 with $100M+2 Progress on Key Strategic Initiatives • Improved data visibility to ~80% of membership • Negotiated contracting for 2026 expectations • Improved economics • Reduced Part D Risk • Enhanced Quality Incentives Payor & Data Performance Cost Discipline Financial Strength Note1: Excludes $172M in ACO REACH entities cash Note2: Includes cash in ACO REACH entities ‘26 Performance Expected to be Enhanced by Positive Rates, Favorable Payer Bids and Plan Design
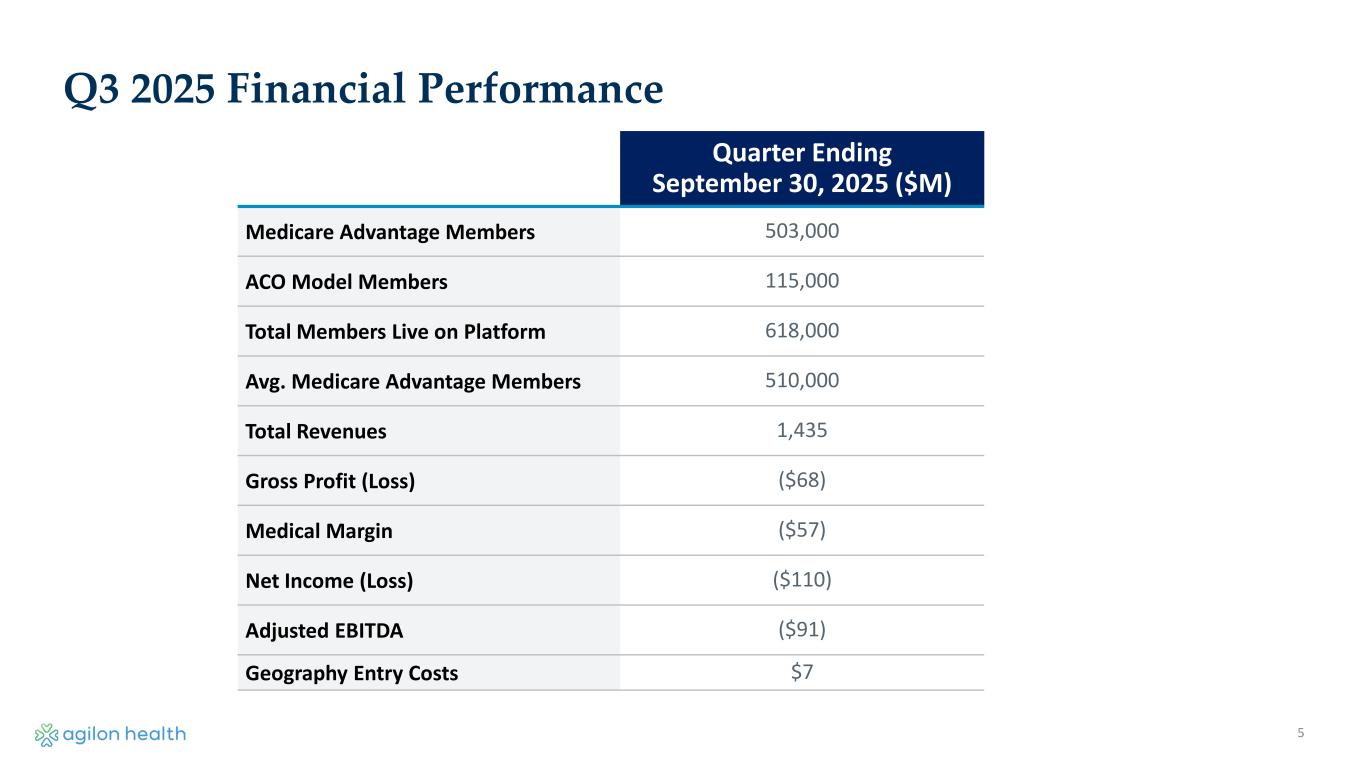
Quarter Ending September 30, 2025 ($M) Medicare Advantage Members 503,000 ACO Model Members 115,000 Total Members Live on Platform 618,000 Avg. Medicare Advantage Members 510,000 Total Revenues 1,435 Gross Profit (Loss) ($68) Medical Margin ($57) Net Income (Loss) ($110) Adjusted EBITDA ($91) Geography Entry Costs $7 Q3 2025 Financial Performance 5
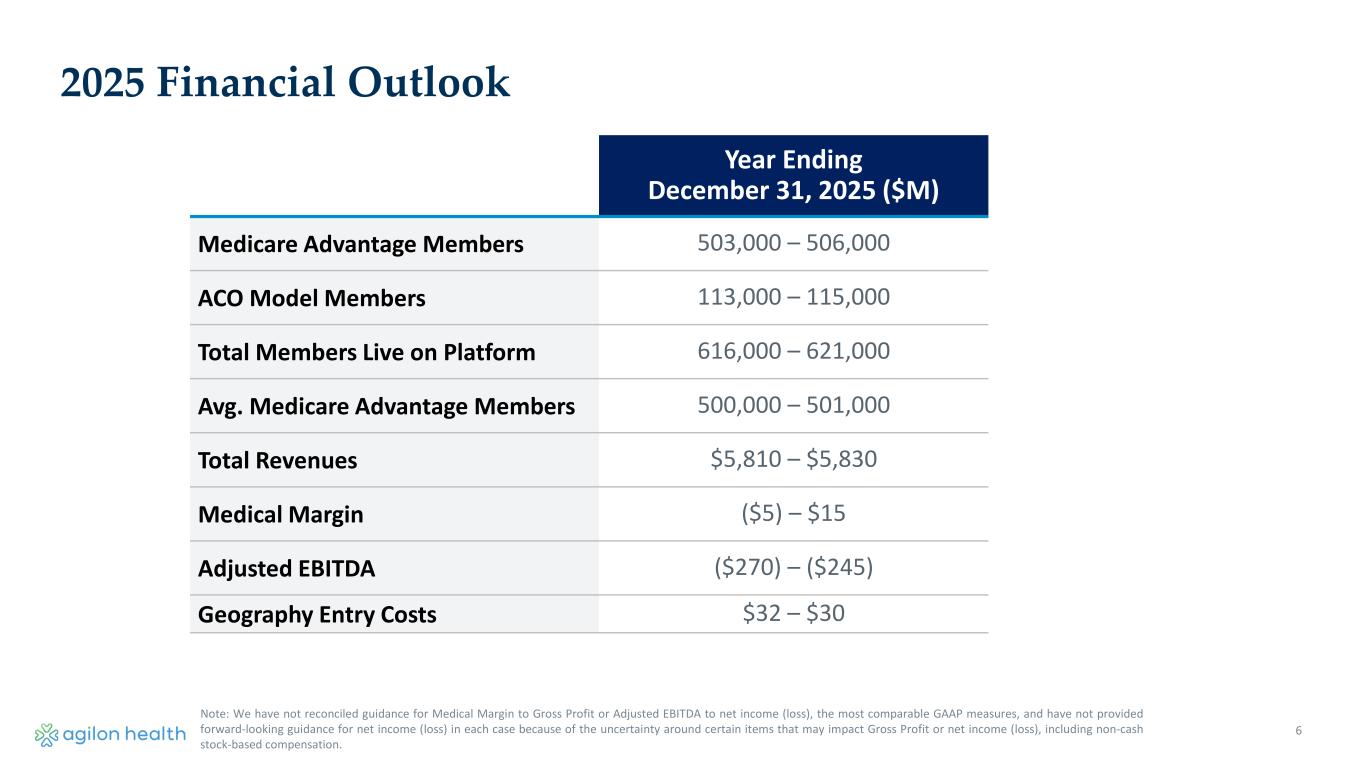
6 Year Ending December 31, 2025 ($M) Medicare Advantage Members 503,000 – 506,000 ACO Model Members 113,000 – 115,000 Total Members Live on Platform 616,000 – 621,000 Avg. Medicare Advantage Members 500,000 – 501,000 Total Revenues $5,810 – $5,830 Medical Margin ($5) – $15 Adjusted EBITDA ($270) – ($245) Geography Entry Costs $32 – $30 2025 Financial Outlook Note: We have not reconciled guidance for Medical Margin to Gross Profit or Adjusted EBITDA to net income (loss), the most comparable GAAP measures, and have not provided forward-looking guidance for net income (loss) in each case because of the uncertainty around certain items that may impact Gross Profit or net income (loss), including non-cash stock-based compensation.
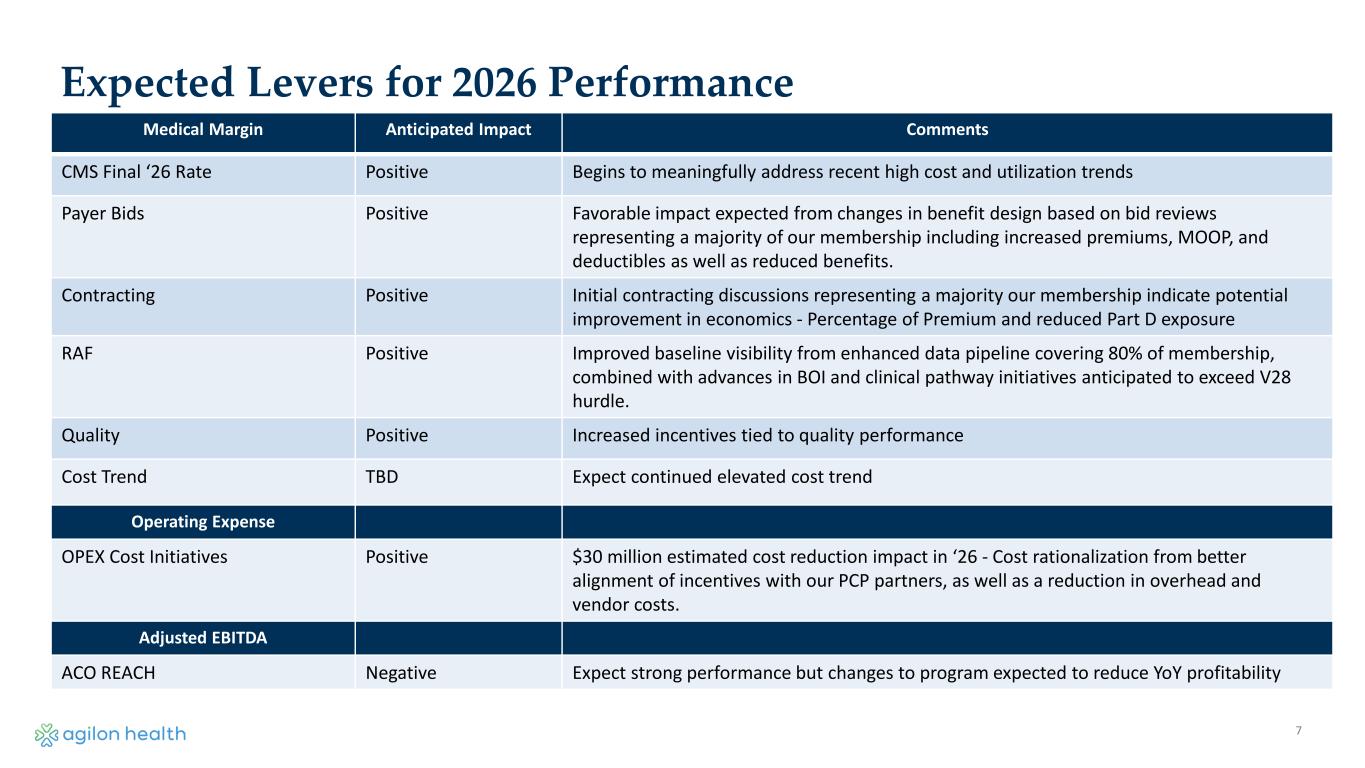
7 Expected Levers for 2026 Performance Medical Margin Anticipated Impact Comments CMS Final ‘26 Rate Positive Begins to meaningfully address recent high cost and utilization trends Payer Bids Positive Favorable impact expected from changes in benefit design based on bid reviews representing a majority of our membership including increased premiums, MOOP, and deductibles as well as reduced benefits. Contracting Positive Initial contracting discussions representing a majority our membership indicate potential improvement in economics - Percentage of Premium and reduced Part D exposure RAF Positive Improved baseline visibility from enhanced data pipeline covering 80% of membership, combined with advances in BOI and clinical pathway initiatives anticipated to exceed V28 hurdle. Quality Positive Increased incentives tied to quality performance Cost Trend TBD Expect continued elevated cost trend Operating Expense OPEX Cost Initiatives Positive $30 million estimated cost reduction impact in ‘26 - Cost rationalization from better alignment of incentives with our PCP partners, as well as a reduction in overhead and vendor costs. Adjusted EBITDA ACO REACH Negative Expect strong performance but changes to program expected to reduce YoY profitability
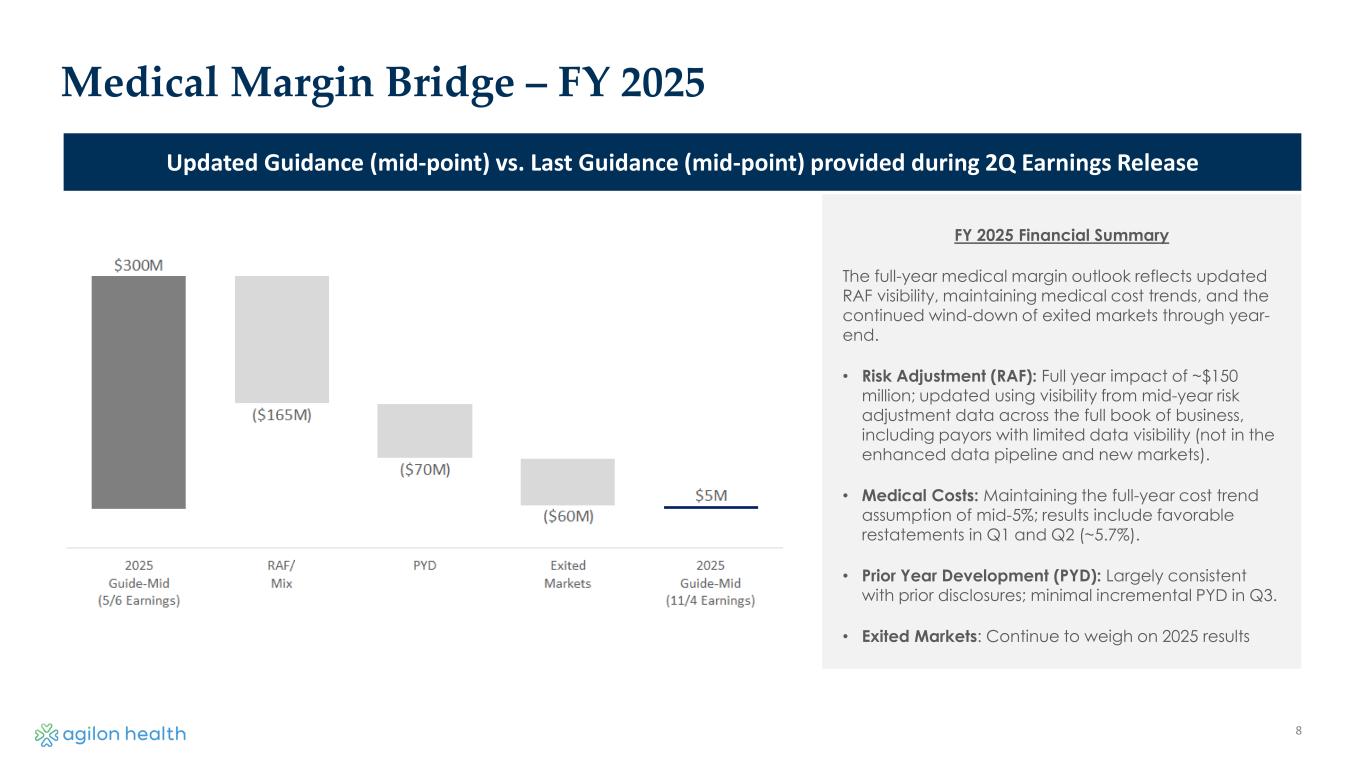
8 Medical Margin Bridge – FY 2025 Updated Guidance (mid-point) vs. Last Guidance (mid-point) provided during 2Q Earnings Release FY 2025 Financial Summary The full-year medical margin outlook reflects updated RAF visibility, maintaining medical cost trends, and the continued wind-down of exited markets through year- end. • Risk Adjustment (RAF): Full year impact of ~$150 million; updated using visibility from mid-year risk adjustment data across the full book of business, including payors with limited data visibility (not in the enhanced data pipeline and new markets). • Medical Costs: Maintaining the full-year cost trend assumption of mid-5%; results include favorable restatements in Q1 and Q2 (~5.7%). • Prior Year Development (PYD): Largely consistent with prior disclosures; minimal incremental PYD in Q3. • Exited Markets: Continue to weigh on 2025 results
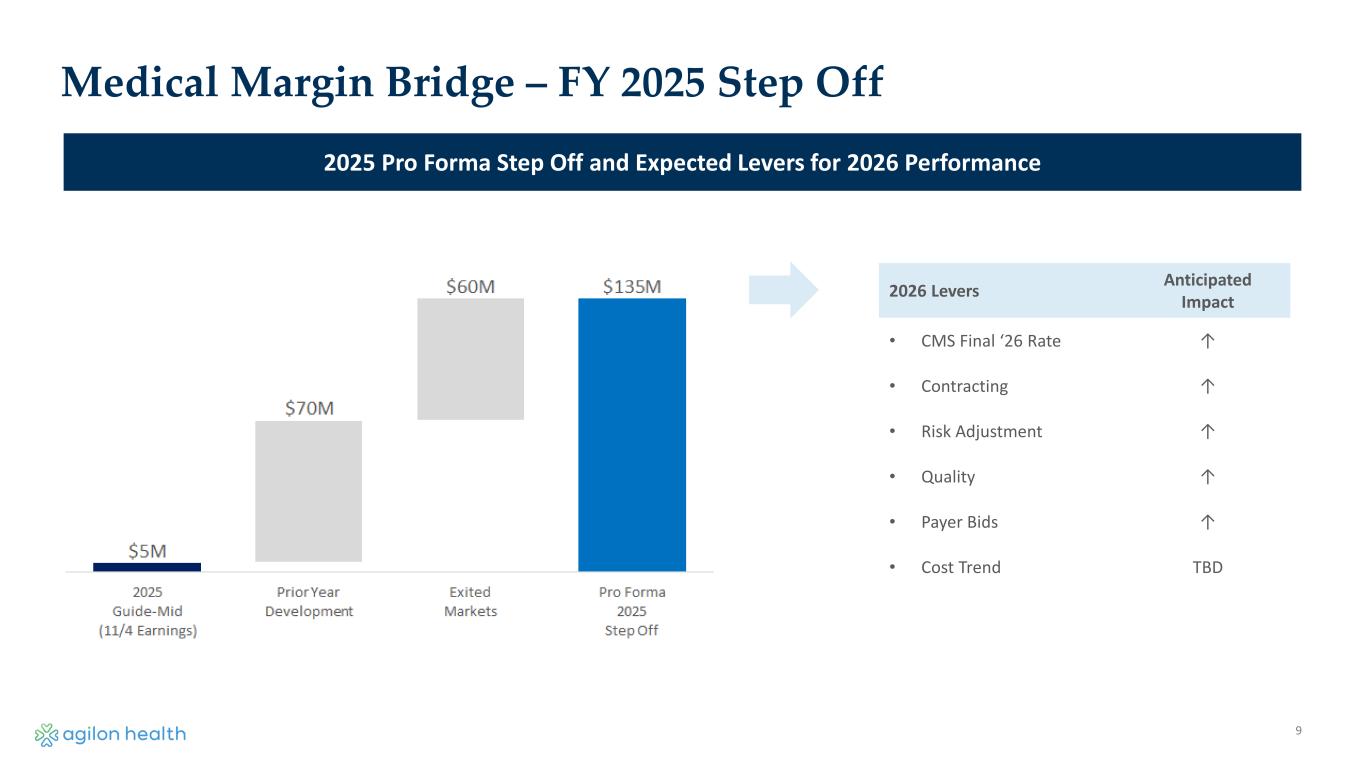
9 Medical Margin Bridge – FY 2025 Step Off 2025 Pro Forma Step Off and Expected Levers for 2026 Performance 2026 Levers Anticipated Impact • CMS Final ‘26 Rate ↑ • Contracting ↑ • Risk Adjustment ↑ • Quality ↑ • Payer Bids ↑ • Cost Trend TBD
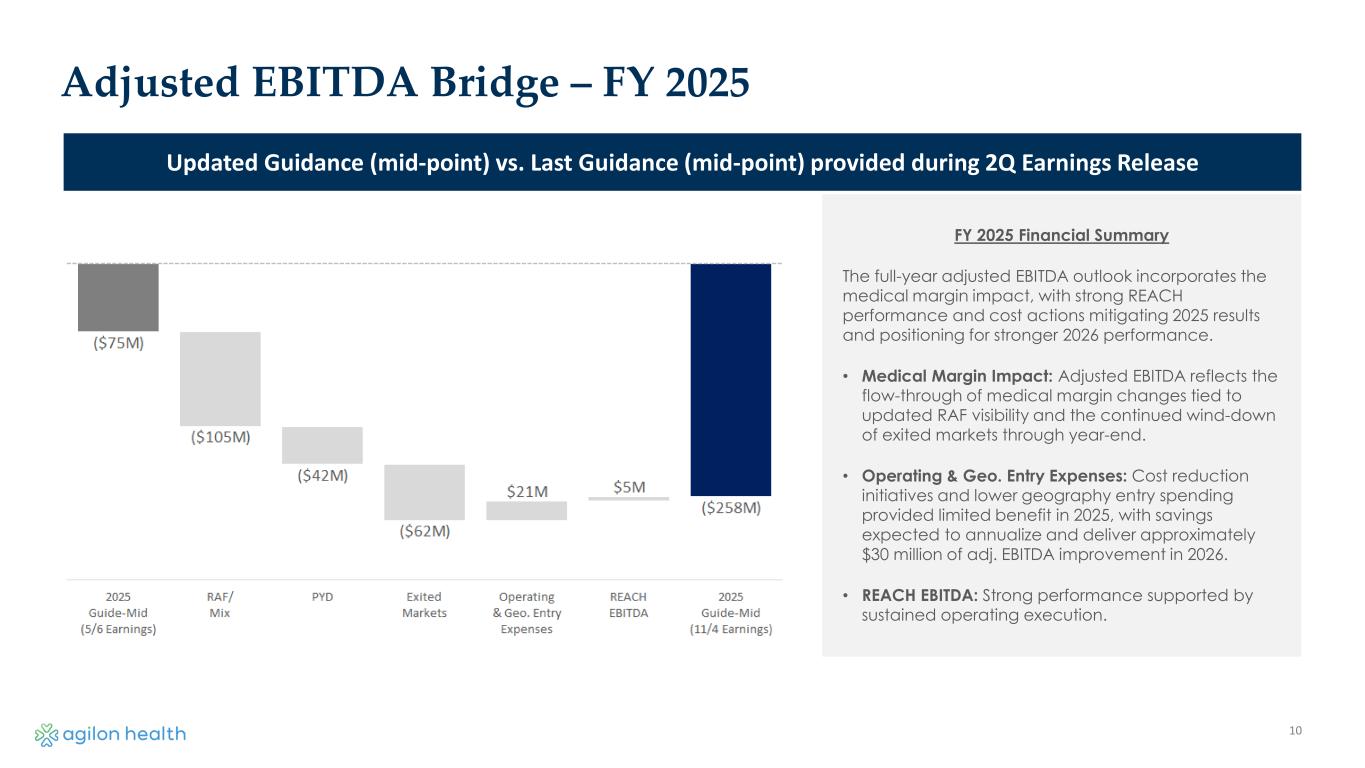
10 Adjusted EBITDA Bridge – FY 2025 Updated Guidance (mid-point) vs. Last Guidance (mid-point) provided during 2Q Earnings Release FY 2025 Financial Summary The full-year adjusted EBITDA outlook incorporates the medical margin impact, with strong REACH performance and cost actions mitigating 2025 results and positioning for stronger 2026 performance. • Medical Margin Impact: Adjusted EBITDA reflects the flow-through of medical margin changes tied to updated RAF visibility and the continued wind-down of exited markets through year-end. • Operating & Geo. Entry Expenses: Cost reduction initiatives and lower geography entry spending provided limited benefit in 2025, with savings expected to annualize and deliver approximately $30 million of adj. EBITDA improvement in 2026. • REACH EBITDA: Strong performance supported by sustained operating execution.
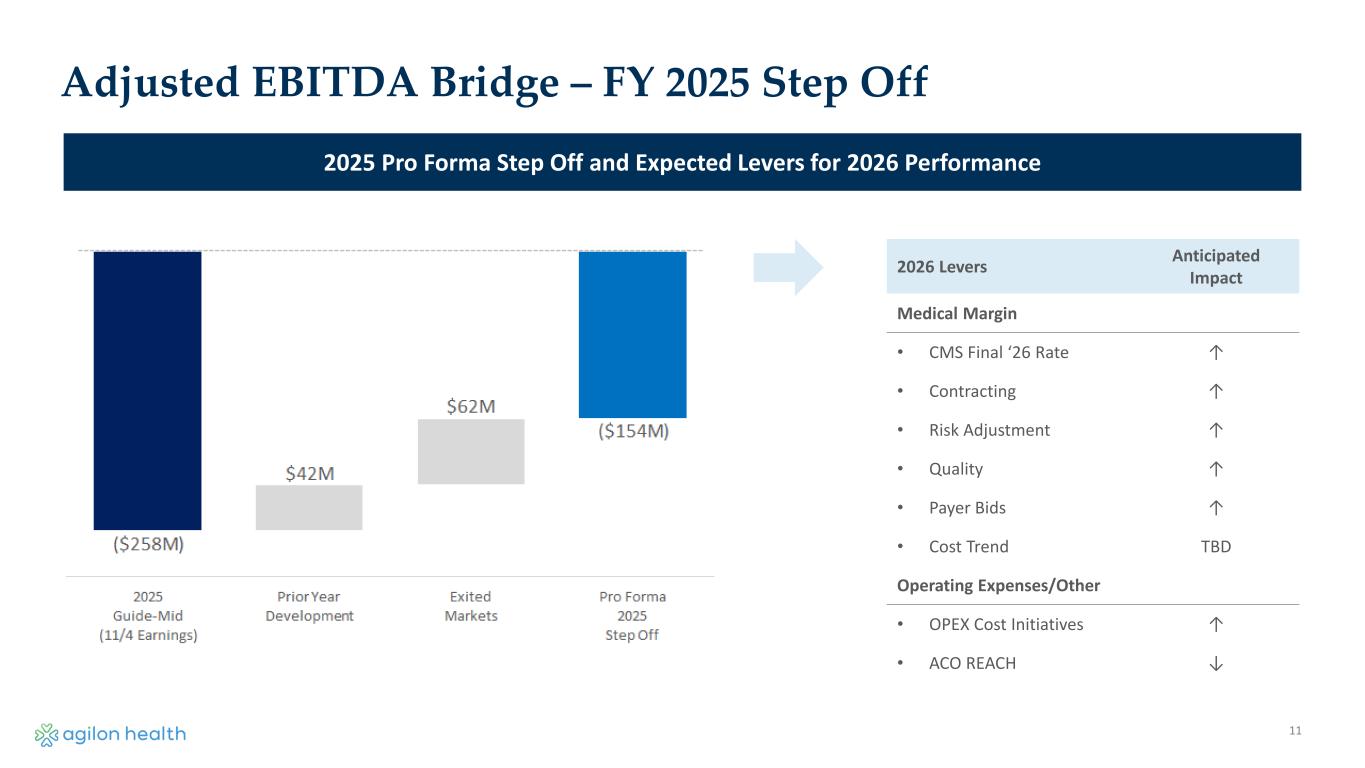
11 Adjusted EBITDA Bridge – FY 2025 Step Off 2025 Pro Forma Step Off and Expected Levers for 2026 Performance 2026 Levers Anticipated Impact Medical Margin • CMS Final ‘26 Rate ↑ • Contracting ↑ • Risk Adjustment ↑ • Quality ↑ • Payer Bids ↑ • Cost Trend TBD Operating Expenses/Other • OPEX Cost Initiatives ↑ • ACO REACH ↓

12 Non-GAAP Reconciliations

13 Non-GAAP Reconciliations (Dollars in thousands) Three Months Ended September 30, Nine Months Ended September 30, 2025 2024 2025 2024 Gross profit (loss)(1) $ (67,646) $ (64,167) $ (69,351) $ 43,096 Other operating revenue (2,884) (3,235) (8,730) (9,573) Other medical expenses 13,488 9,149 95,845 171,096 Medical margin $ (57,042) $ (58,253) $ 17,764 $ 204,619 1) Gross profit is defined as total revenues less medical services expenses and other medical expense. Medical Margin
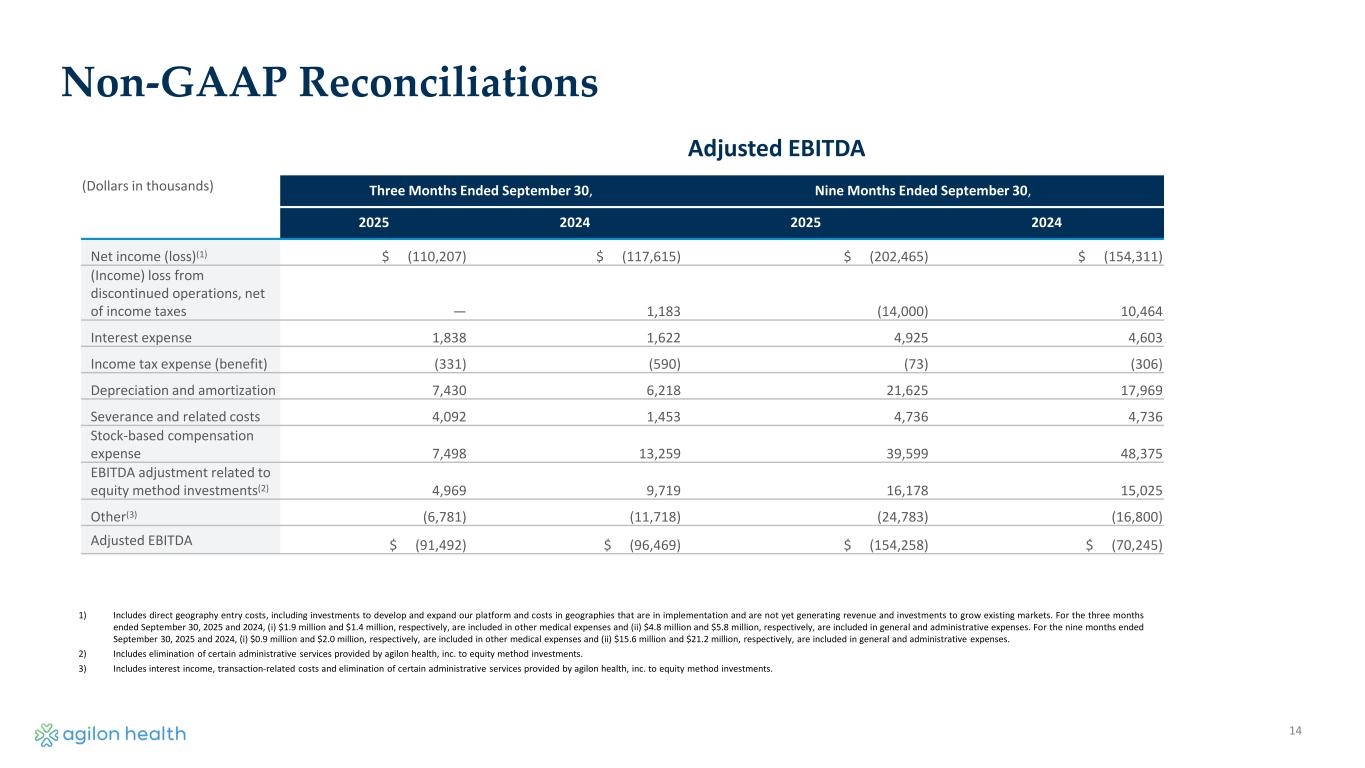
14 Non-GAAP Reconciliations (Dollars in thousands) Three Months Ended September 30, Nine Months Ended September 30, 2025 2024 2025 2024 Net income (loss)(1) $ (110,207) $ (117,615) $ (202,465) $ (154,311) (Income) loss from discontinued operations, net of income taxes — 1,183 (14,000) 10,464 Interest expense 1,838 1,622 4,925 4,603 Income tax expense (benefit) (331) (590) (73) (306) Depreciation and amortization 7,430 6,218 21,625 17,969 Severance and related costs 4,092 1,453 4,736 4,736 Stock-based compensation expense 7,498 13,259 39,599 48,375 EBITDA adjustment related to equity method investments(2) 4,969 9,719 16,178 15,025 Other(3) (6,781) (11,718) (24,783) (16,800) Adjusted EBITDA $ (91,492) $ (96,469) $ (154,258) $ (70,245) 1) Includes direct geography entry costs, including investments to develop and expand our platform and costs in geographies that are in implementation and are not yet generating revenue and investments to grow existing markets. For the three months ended September 30, 2025 and 2024, (i) $1.9 million and $1.4 million, respectively, are included in other medical expenses and (ii) $4.8 million and $5.8 million, respectively, are included in general and administrative expenses. For the nine months ended September 30, 2025 and 2024, (i) $0.9 million and $2.0 million, respectively, are included in other medical expenses and (ii) $15.6 million and $21.2 million, respectively, are included in general and administrative expenses. 2) Includes elimination of certain administrative services provided by agilon health, inc. to equity method investments. 3) Includes interest income, transaction-related costs and elimination of certain administrative services provided by agilon health, inc. to equity method investments. Adjusted EBITDA