2Q 2026 INVESTOR PRESENTATION August 4, 2026
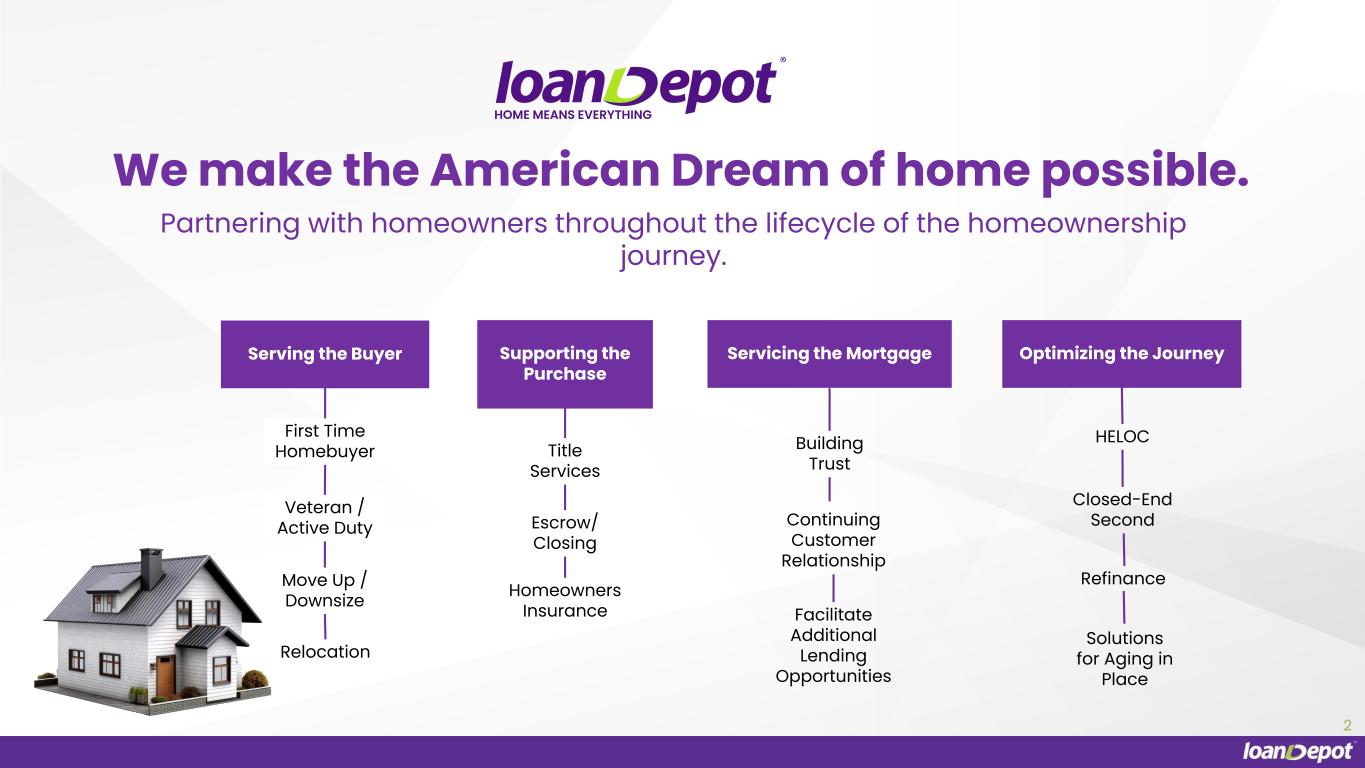
We make the American Dream of home possible. Partnering with homeowners throughout the lifecycle of the homeownership journey. Serving the Buyer First Time Homebuyer Veteran / Active Duty Move Up / Downsize Relocation Supporting the Purchase Servicing the Mortgage Optimizing the Journey Title Services Escrow/ Closing Homeowners Insurance Building Trust Continuing Customer Relationship Facilitate Additional Lending Opportunities HELOC Closed-End Second Refinance 2 Solutions for Aging in Place
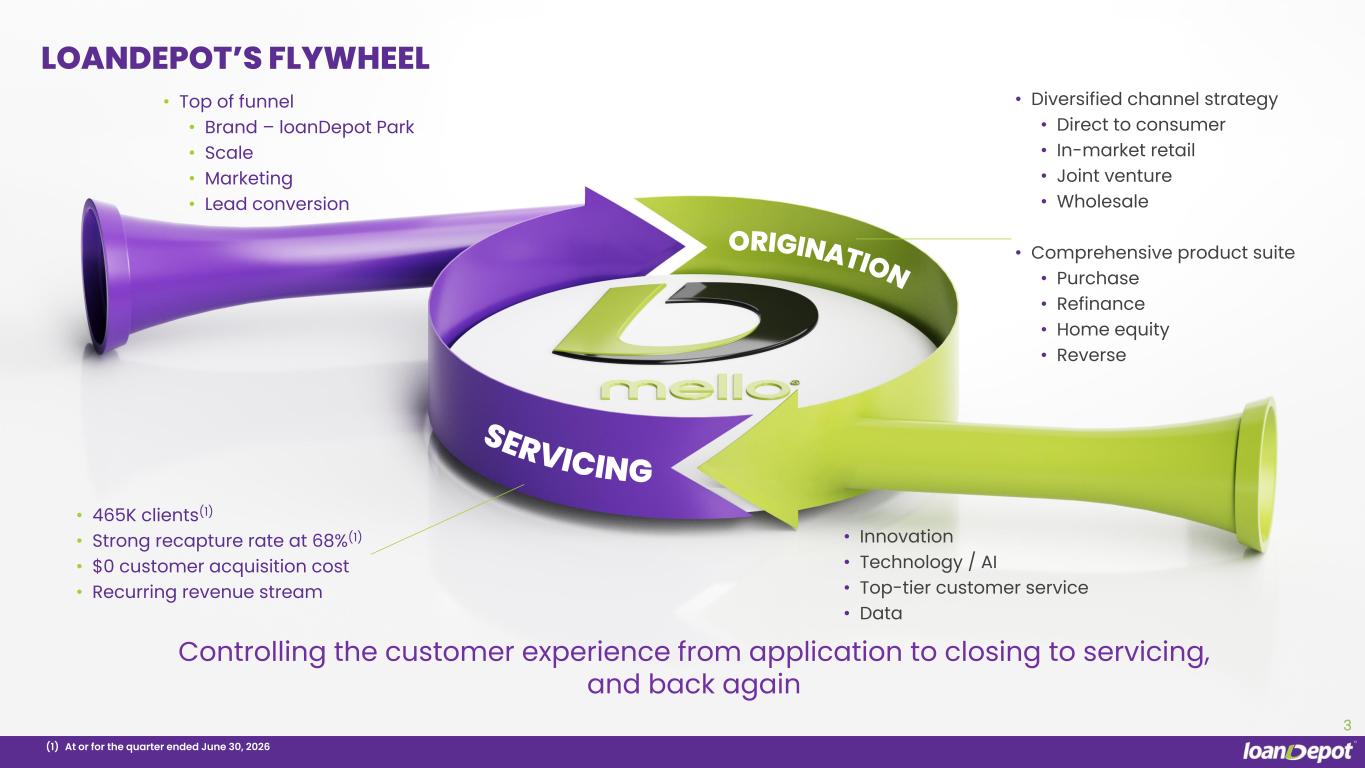
3 • Innovation • Technology / AI • Top-tier customer service • Data • Diversified channel strategy • Direct to consumer • In-market retail • Joint venture • Wholesale • Comprehensive product suite • Purchase • Refinance • Home equity • Reverse ORIGINATION SERVICING • Top of funnel • Brand – loanDepot Park • Scale • Marketing • Lead conversion LOANDEPOT’S FLYWHEEL (1) At or for the quarter ended June 30, 2026 • 465K clients(1) • Strong recapture rate at 68%(1) • $0 customer acquisition cost • Recurring revenue stream Controlling the customer experience from application to closing to servicing, and back again
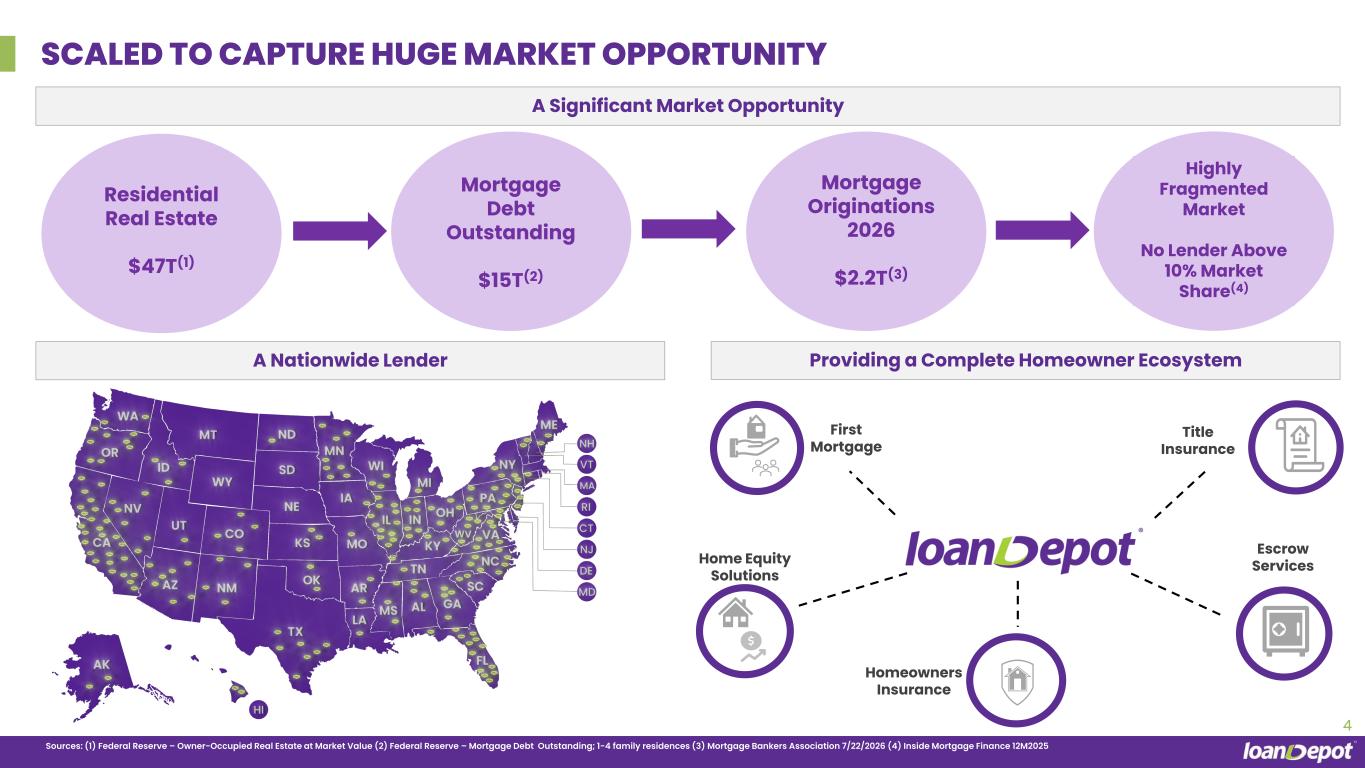
A Nationwide Lender SCALED TO CAPTURE HUGE MARKET OPPORTUNITY Providing a Complete Homeowner Ecosystem 4 Title Insurance Escrow Services Homeowners Insurance First Mortgage Home Equity Solutions A Significant Market Opportunity Residential Real Estate $47T(1) Mortgage Debt Outstanding $15T(2) Mortgage Originations 2026 $2.2T(3) Highly Fragmented Market No Lender Above 10% Market Share(4) Sources: (1) Federal Reserve – Owner-Occupied Real Estate at Market Value (2) Federal Reserve – Mortgage Debt Outstanding; 1-4 family residences (3) Mortgage Bankers Association 7/22/2026 (4) Inside Mortgage Finance 12M2025

EXPERIENCED MANAGEMENT TEAM WITH UNIQUE SKILLSETS Jeff DerGurahian Chief Investment Officer and Head Economist 5 Joe Grassi Chief Legal and Risk Officer Melanie Graper Chief Human Resources Officer David Hayes Chief Financial Officer Dominick Marchetti Chief Digital Officer Adam Saab Executive Vice President, Servicing Nikul Patel Chief Growth Officer Anthony Hsieh Founder and Chief Executive Officer Mortgage - Loansdirect.com
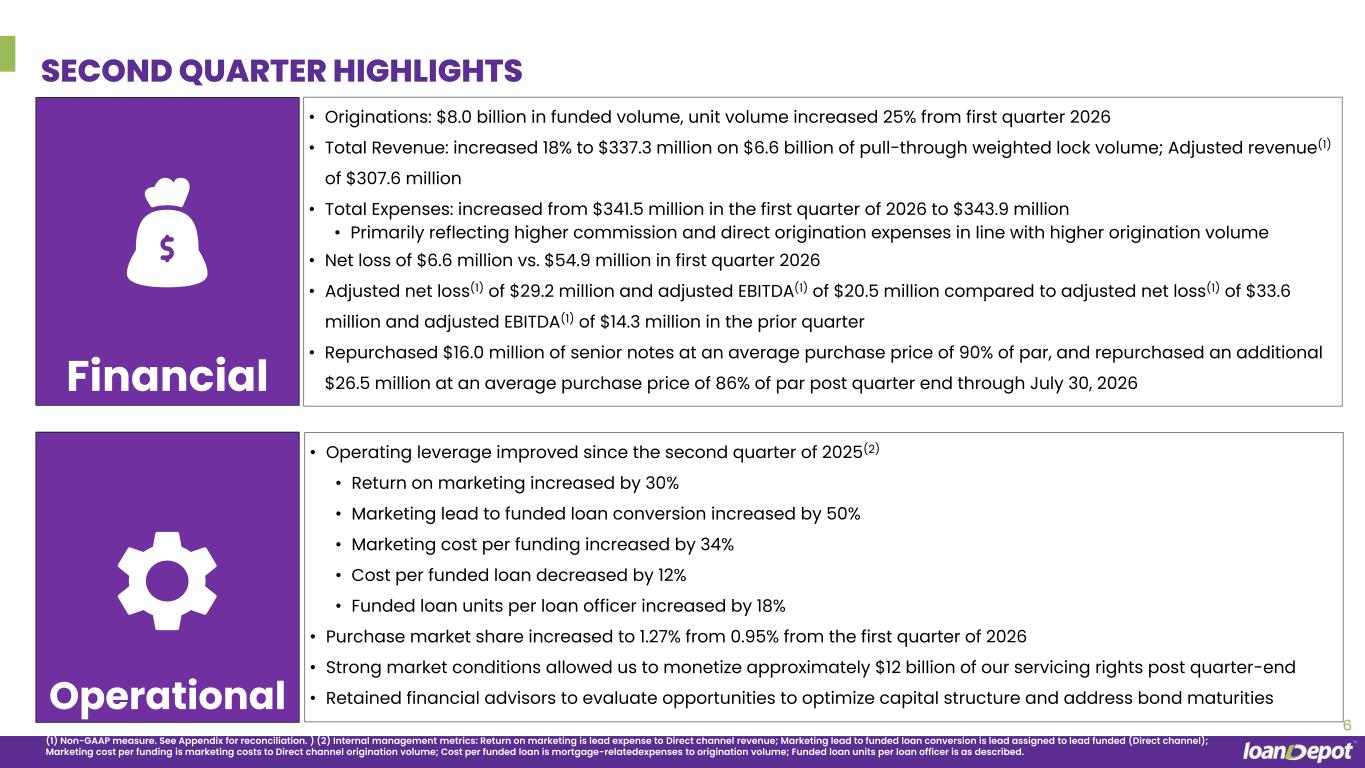
6 SECOND QUARTER HIGHLIGHTS Financial Operational • Originations: $8.0 billion in funded volume, unit volume increased 25% from first quarter 2026 • Total Revenue: increased 18% to $337.3 million on $6.6 billion of pull-through weighted lock volume; Adjusted revenue(1) of $307.6 million • Total Expenses: increased from $341.5 million in the first quarter of 2026 to $343.9 million • Primarily reflecting higher commission and direct origination expenses in line with higher origination volume • Net loss of $6.6 million vs. $54.9 million in first quarter 2026 • Adjusted net loss(1) of $29.2 million and adjusted EBITDA(1) of $20.5 million compared to adjusted net loss(1) of $33.6 million and adjusted EBITDA(1) of $14.3 million in the prior quarter • Repurchased $16.0 million of senior notes at an average purchase price of 90% of par, and repurchased an additional $26.5 million at an average purchase price of 86% of par post quarter end through July 30, 2026 • Operating leverage improved since the second quarter of 2025(2) • Return on marketing increased by 30% • Marketing lead to funded loan conversion increased by 50% • Marketing cost per funding increased by 34% • Cost per funded loan decreased by 12% • Funded loan units per loan officer increased by 18% • Purchase market share increased to 1.27% from 0.95% from the first quarter of 2026 • Strong market conditions allowed us to monetize approximately $12 billion of our servicing rights post quarter-end • Retained financial advisors to evaluate opportunities to optimize capital structure and address bond maturities (1) Non-GAAP measure. See Appendix for reconciliation. ) (2) Internal management metrics: Return on marketing is lead expense to Direct channel revenue; Marketing lead to funded loan conversion is lead assigned to lead funded (Direct channel); Marketing cost per funding is marketing costs to Direct channel origination volume; Cost per funded loan is mortgage-relatedexpenses to origination volume; Funded loan units per loan officer is as described.
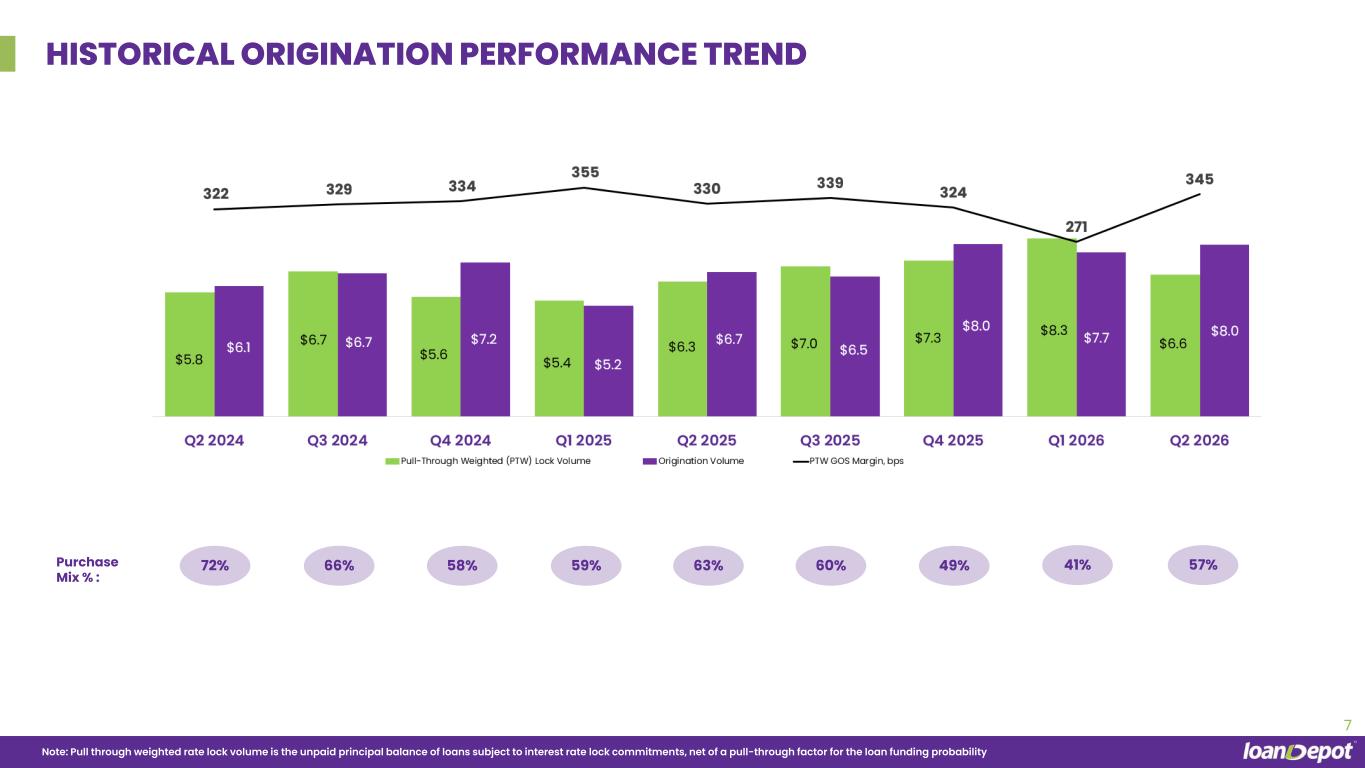
HISTORICAL ORIGINATION PERFORMANCE TREND Note: Pull through weighted rate lock volume is the unpaid principal balance of loans subject to interest rate lock commitments, net of a pull-through factor for the loan funding probability 7 Purchase Mix % : 49% 41%66% 58% 59% 63% 60% 57%72%
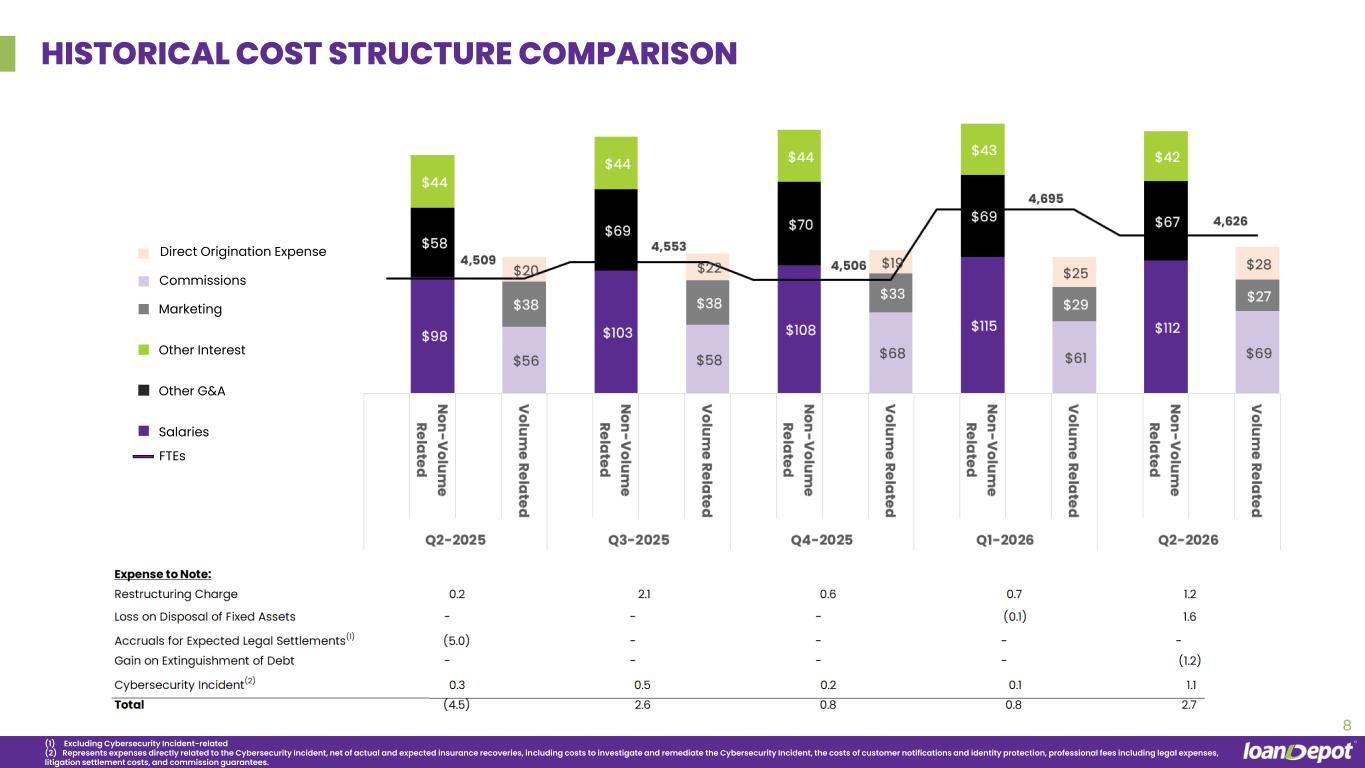
HISTORICAL COST STRUCTURE COMPARISON 8 Salaries Other Interest Marketing Commissions Other G&A FTEs Direct Origination Expense (1) Excluding Cybersecurity Incident-related (2) Represents expenses directly related to the Cybersecurity Incident, net of actual and expected insurance recoveries, including costs to investigate and remediate the Cybersecurity Incident, the costs of customer notifications and identity protection, professional fees including legal expenses, litigation settlement costs, and commission guarantees.
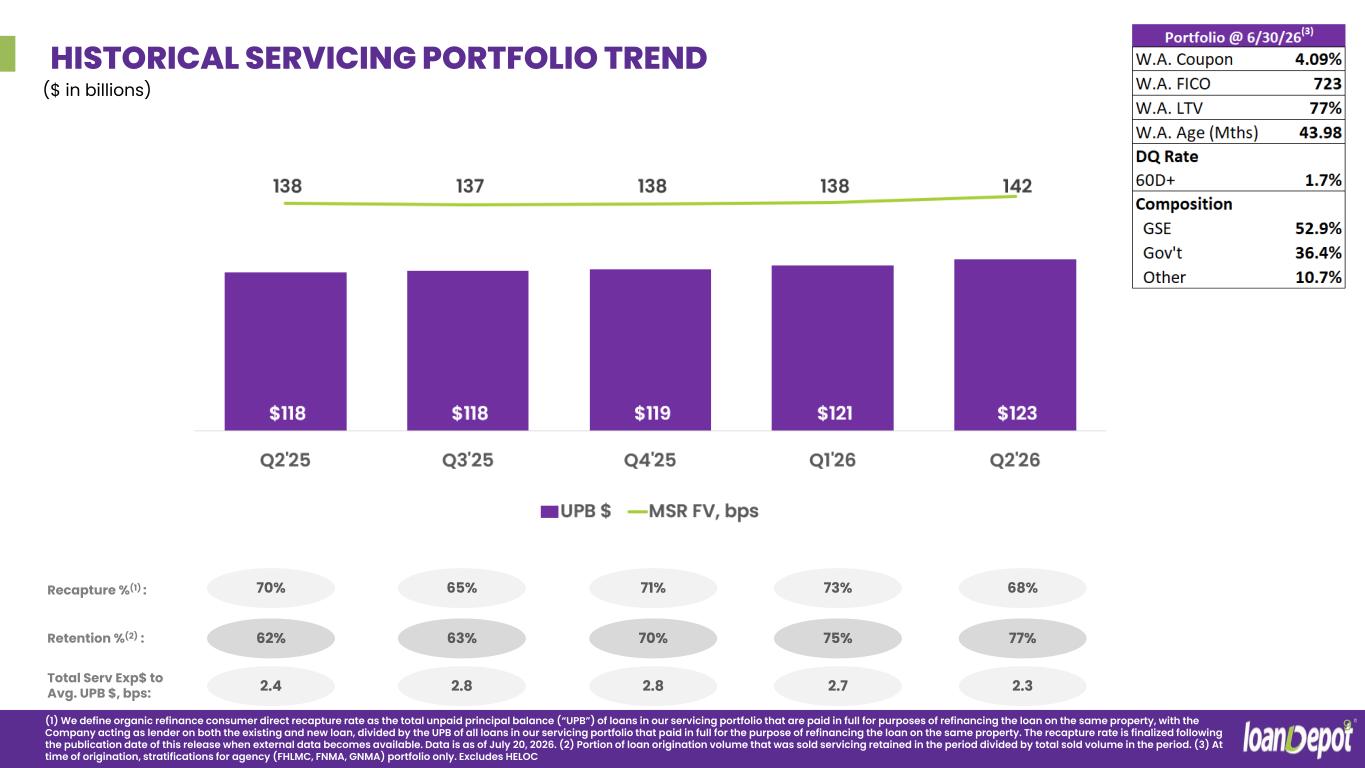
HISTORICAL SERVICING PORTFOLIO TREND 9 ($ in billions) Retention %(2) : Recapture %(1) : (1) We define organic refinance consumer direct recapture rate as the total unpaid principal balance (“UPB”) of loans in our servicing portfolio that are paid in full for purposes of refinancing the loan on the same property, with the Company acting as lender on both the existing and new loan, divided by the UPB of all loans in our servicing portfolio that paid in full for the purpose of refinancing the loan on the same property. The recapture rate is finalized following the publication date of this release when external data becomes available. Data is as of July 20, 2026. (2) Portion of loan origination volume that was sold servicing retained in the period divided by total sold volume in the period. (3) At time of origination, stratifications for agency (FHLMC, FNMA, GNMA) portfolio only. Excludes HELOC Total Serv Exp$ to Avg. UPB $, bps: 70% 65% 2.8 75% 71% 2.8 77% 73% 2.7 62% 68% 2.3 63% 70% 2.4
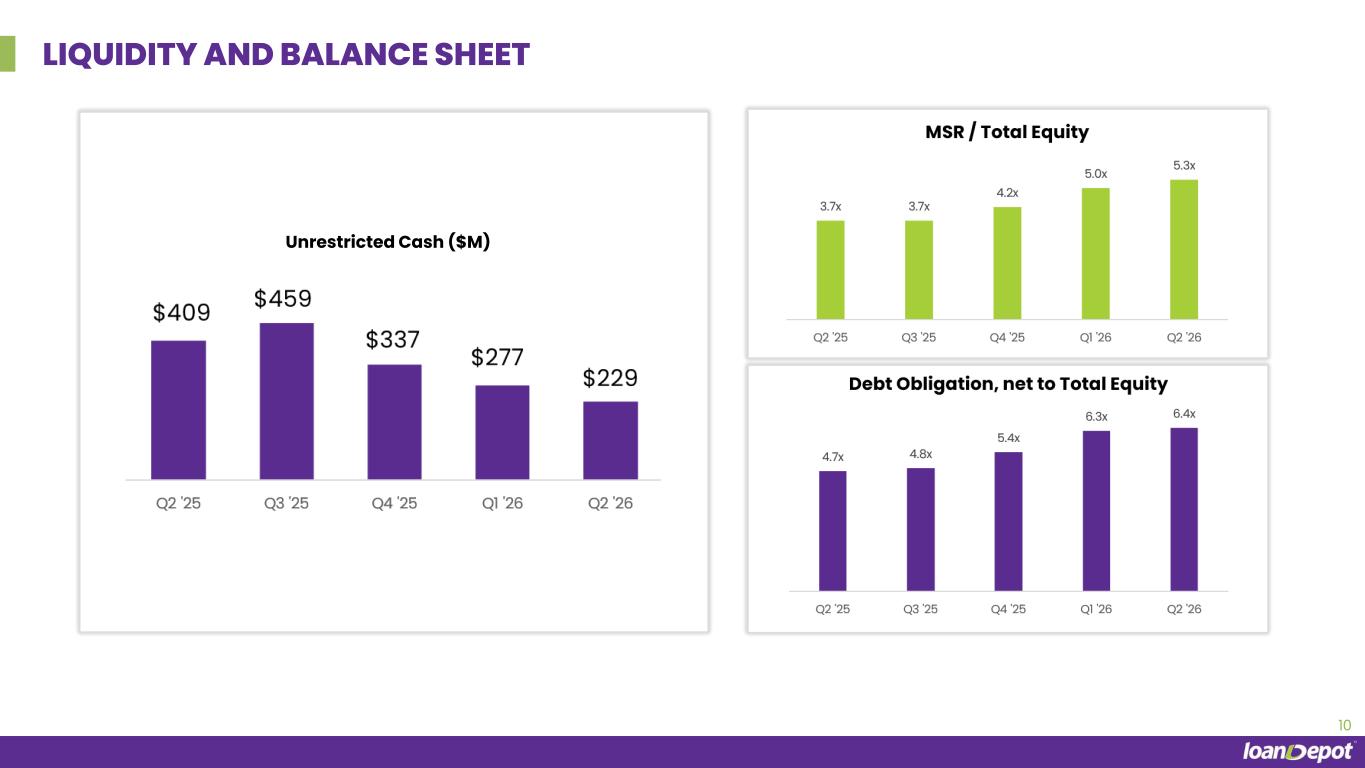
LIQUIDITY AND BALANCE SHEET 10 Unrestricted Cash ($M)
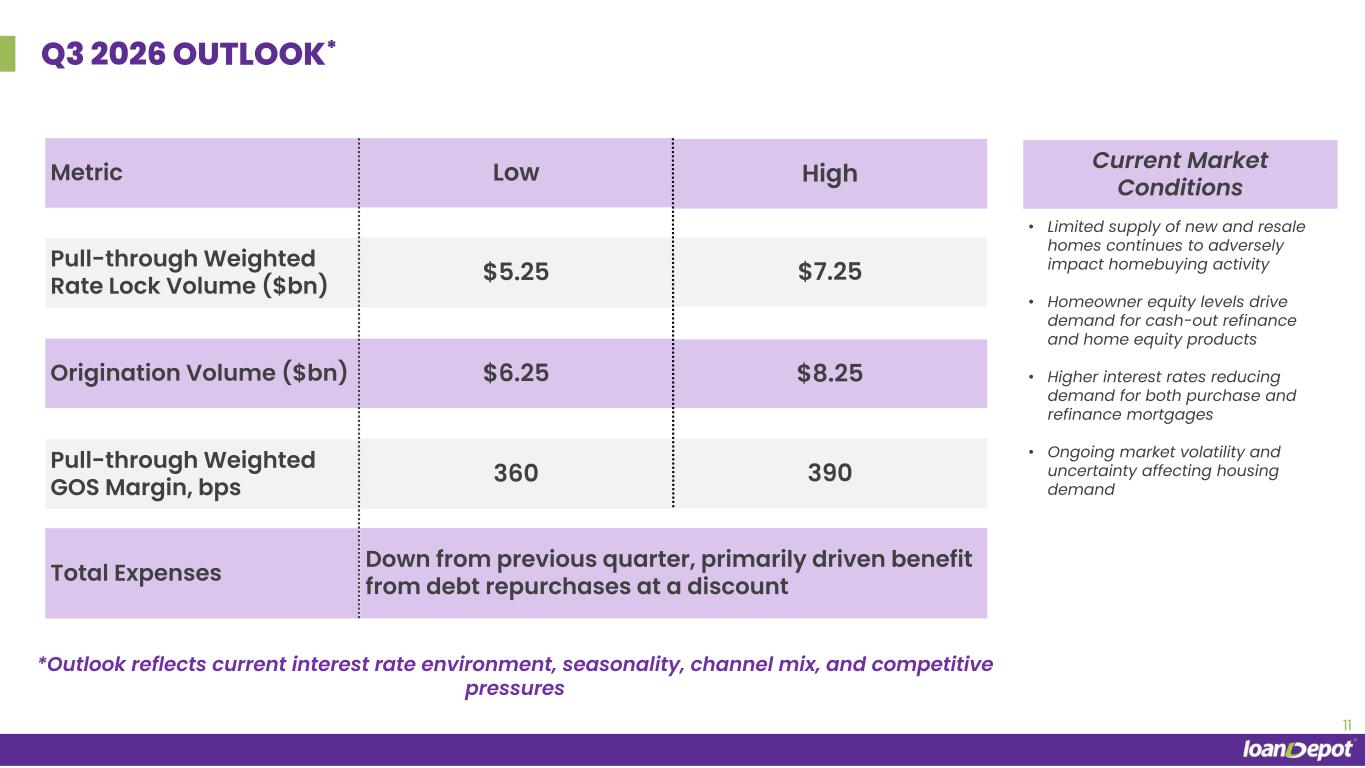
Down from previous quarter, primarily driven benefit from debt repurchases at a discountTotal Expenses 11 Q3 2026 OUTLOOK* Metric Low High Pull-through Weighted Rate Lock Volume ($bn) $5.25 $7.25 Origination Volume ($bn) $6.25 $8.25 Pull-through Weighted GOS Margin, bps 360 390 Current Market Conditions • Limited supply of new and resale homes continues to adversely impact homebuying activity • Homeowner equity levels drive demand for cash-out refinance and home equity products • Higher interest rates reducing demand for both purchase and refinance mortgages • Ongoing market volatility and uncertainty affecting housing demand *Outlook reflects current interest rate environment, seasonality, channel mix, and competitive pressures

APPENDIX
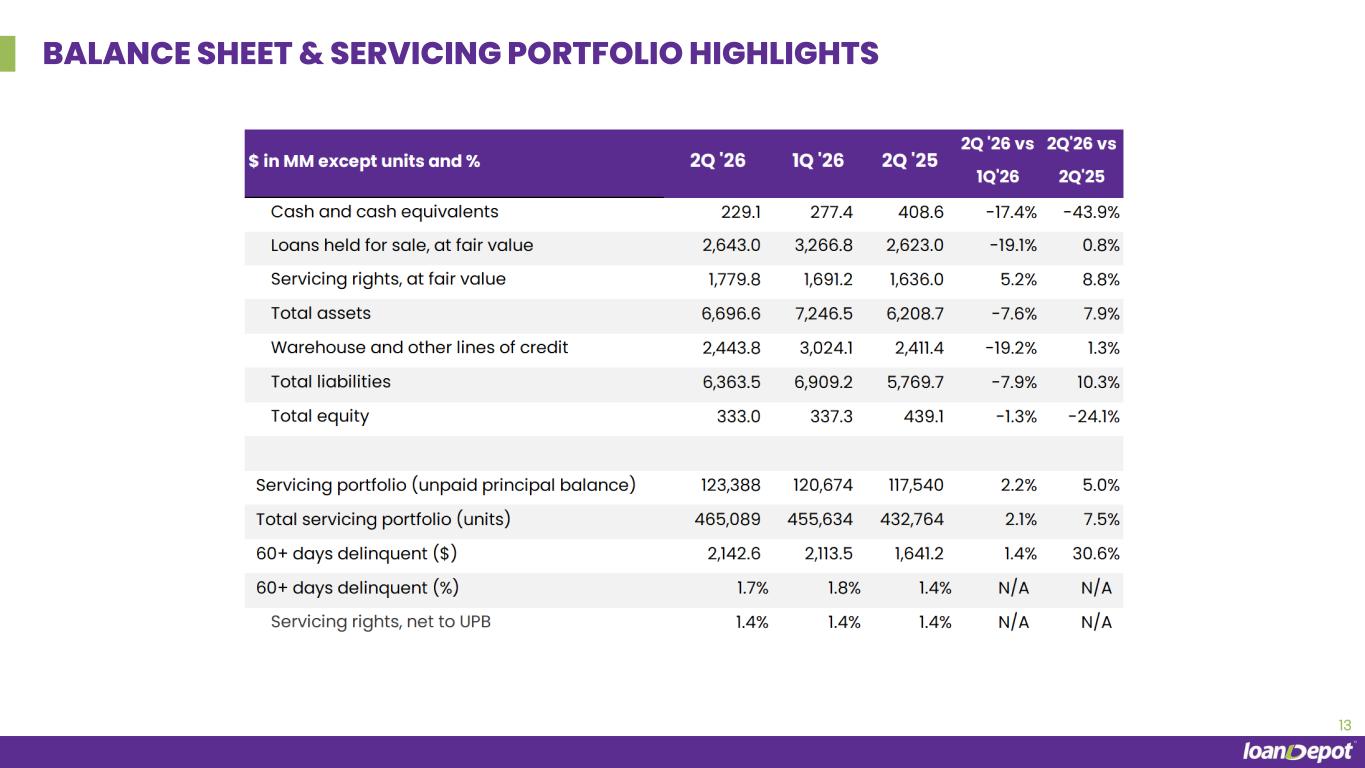
BALANCE SHEET & SERVICING PORTFOLIO HIGHLIGHTS 13
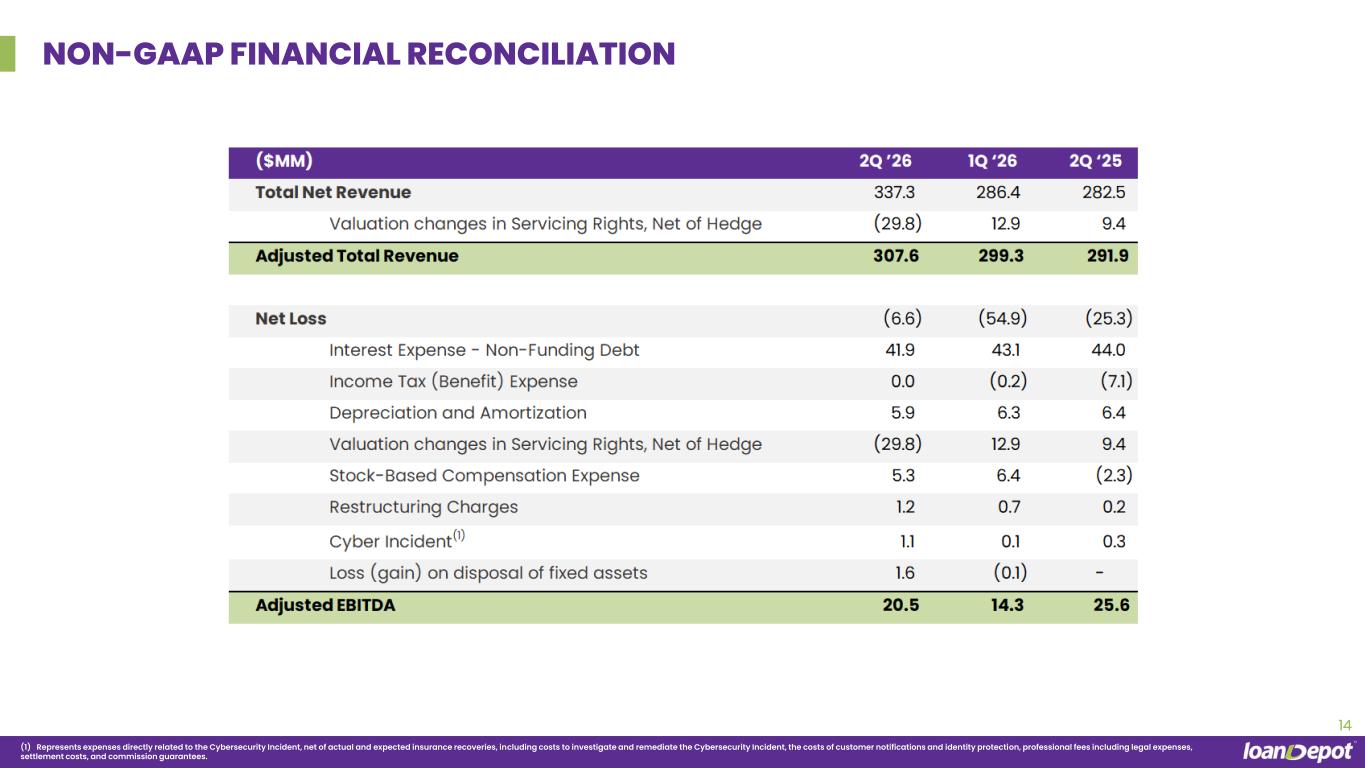
NON-GAAP FINANCIAL RECONCILIATION 14 (1) Represents expenses directly related to the Cybersecurity Incident, net of actual and expected insurance recoveries, including costs to investigate and remediate the Cybersecurity Incident, the costs of customer notifications and identity protection, professional fees including legal expenses, settlement costs, and commission guarantees.
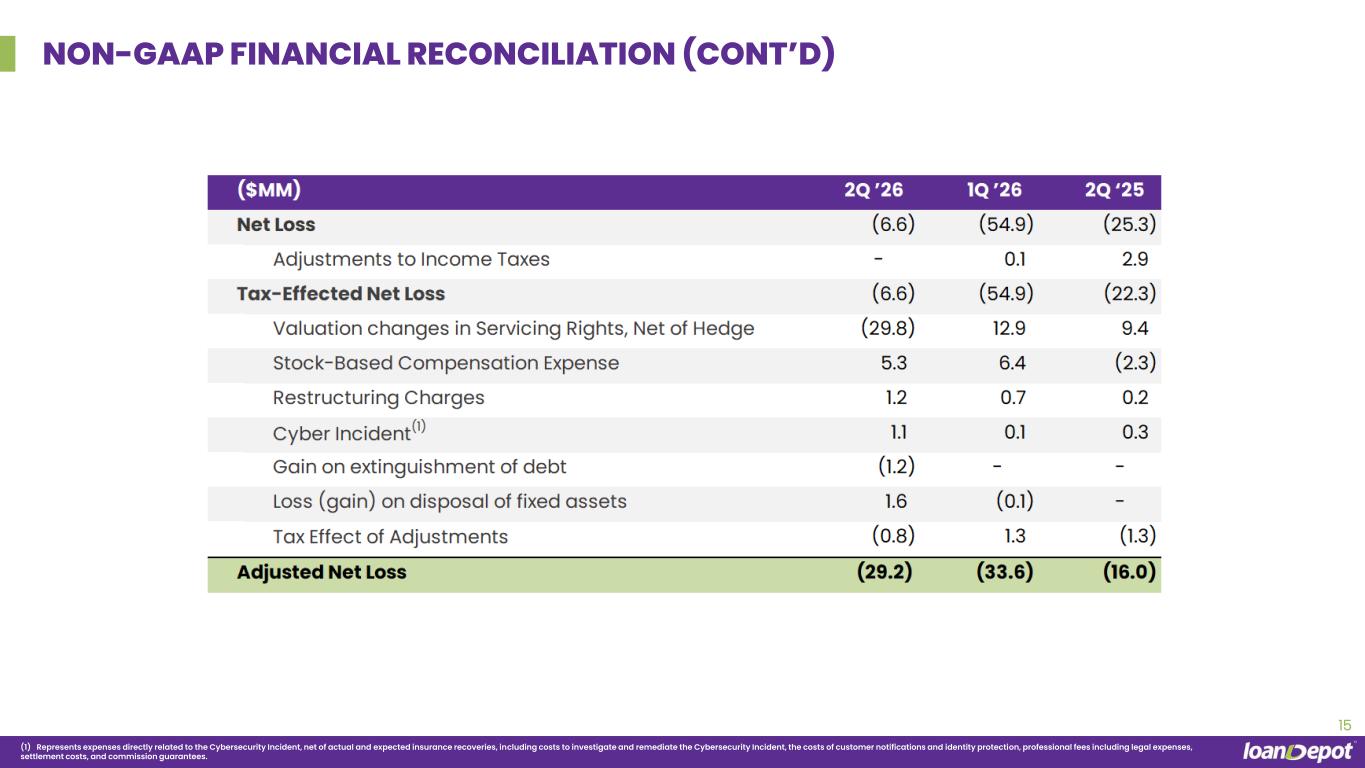
NON-GAAP FINANCIAL RECONCILIATION (CONT’D) 15 (1) Represents expenses directly related to the Cybersecurity Incident, net of actual and expected insurance recoveries, including costs to investigate and remediate the Cybersecurity Incident, the costs of customer notifications and identity protection, professional fees including legal expenses, settlement costs, and commission guarantees.
DISCLAIMER AND NON-GAAP FINANCIAL INFORMATION 16 Forward-Looking Statements and Other Information This presentation contains forward-looking statements that can be identified by the fact that they do not relate strictly to historical or current facts and may contain the words “believe,” “aim,” “anticipate,” “expect,” “goal,” “intend,” “plan,” “predict,” “estimate,” “project,” “will be,” “will continue,” “will likely result,” or other similar words and phrases or future or conditional verbs such as “will,” “may,” “might,” “should,” “would,” or “could” and the negatives of those terms. Examples of forward-looking statements include, but are not limited to, our strategic expansion into home equity lending and the expected benefits of that strategy; attractiveness and growth of our home equity products, competitive advantages and market differentiators; automation, technology and innovation initiatives and investments, including artificial intelligence and the benefits of our technology-enabled, multi-channel platform; strategic opportunities, strengths, plans, focuses, and progress; our momentum; our readiness to take advantage of improved market opportunities; market share; hedging strategy benefits; return to profitability; expenses and expense management; liquidity and financing strategies; settlement of a mortgage servicing rights transaction; productivity initiatives; loan officer growth and development; operating leverage; loan origination volumes; pull-through weighted lock volume; pull-through weighted gain on sale margin; and evaluation of capital structures and bond maturities. These forward-looking statements are based on current available operating, financial, economic and other information, and are not guarantees of future performance and are subject to risks, uncertainties and assumptions that are difficult to predict, including but not limited to, the following: our ability to achieve the expected benefits of our strategic plans and priorities and the success of other business initiatives, including our partnership with Figure Technology Solutions; our ability to achieve profitability; our loan production volume; our ability to maintain an operating platform and management system sufficient to conduct our business; our ability to maintain warehouse lines of credit and other sources of capital and liquidity; our ability to effectively utilize artificial intelligence and emerging technologies; impacts of cybersecurity incidents, cyberattacks, information or security breaches and technology disruptions or failures, of ours or of our third party vendors; the outcome of legal proceedings to which we are a party; our ability to favorably resolve regulatory matters related to the Cybersecurity Incident; adverse changes in macroeconomic and U.S residential real estate and mortgage market conditions, including changes in interest rates, changes in global trade policy and tariffs, geopolitical tensions and conflicts and impacts from government shutdowns; changing federal, state and local laws, as well as changing regulatory enforcement policies and priorities; our ability to address our senior notes; and other risks detailed in the "Risk Factors" section of loanDepot, Inc.'s Annual Report on Form 10-K for the year ended December 31, 2025, as well as any subsequent filings with the Securities and Exchange Commission. Therefore, current plans, anticipated actions, and financial results, as well as the anticipated development of the industry, may differ materially from what is expressed or forecasted in any forward-looking statement. loanDepot does not undertake any obligation to publicly update or revise any forward-looking statement to reflect future events or circumstances, except as required by applicable law. Non-GAAP Financial Information To provide investors with information in addition to our results as determined by GAAP, we disclose certain non-GAAP measures to assist investors in evaluating our financial results. We believe these non- GAAP measures provide useful information to investors regarding our results of operations because each measure assists both investors and management in analyzing and benchmarking the performance and value of our business. They facilitate company-to-company operating performance comparisons by backing out potential differences caused by variations in hedging strategies, changes in valuations, capital structures (affecting interest expense on non-funding debt), taxation, the age and book depreciation of facilities (affecting relative depreciation expense), and other cost or benefit items which may vary for different companies for reasons unrelated to operating performance. These non-GAAP measures include our Adjusted Total Revenue, Adjusted Net Loss, Adjusted Diluted Weighted Average Shares Outstanding, and Adjusted EBITDA. We exclude from these non-GAAP financial measures the change in fair value of MSRs, gains (losses) from the sale of MSRs, and related hedging gains and losses that represent realized and unrealized adjustments resulting from changes in valuation, mostly due to changes in market interest rates, and are not indicative of the Company’s operating performance or results of operation. We have excluded expenses directly related to the cybersecurity incident in January 2024 that resulted from unauthorized access to our systems (the “Cybersecurity Incident”), net of insurance recoveries during fiscal 2024, such as costs to investigate and remediate the Cybersecurity Incident, the costs of customer notifications and identity protection, and professional fees, including legal expenses, litigation settlement costs, and commission guarantees. We also exclude stock-based compensation expense, which is a non-cash expense, gains or losses on extinguishment of debt and disposal of fixed assets, and impairment charges to operating lease right-of-use assets, as well as certain costs associated with our restructuring efforts, as management does not consider these costs to be indicative of our performance or results of operations. Adjusted EBITDA includes interest expense on funding facilities, which are recorded as a component of “net interest income,” as these expenses are a direct operating expense driven by loan origination volume. By contrast, interest expense on our non-funding debt is a function of our capital structure and is therefore excluded from Adjusted EBITDA. Adjustments for income taxes are made to reflect historical results of operations on the basis that it was taxed as a corporation under the Internal Revenue Code, and therefore subject to U.S. federal, state, and local income taxes. Adjustments to Diluted Weighted Average Shares Outstanding assumes the pro forma conversion of weighted average Class B and Class C common stock to Class A common stock. These non-GAAP measures have limitations as analytical tools and should not be considered in isolation or as a substitute for revenue, net income, or any other operating performance measure calculated in accordance with GAAP, and may not be comparable to a similarly titled measure reported by other companies. Market and Industry Data This presentation also contains information regarding the loanDepot’s market and industry that is derived from third-party research and publications. That information may rely upon a number of assumptions and limitations, and the Company has not independently verified its accuracy or completeness.