

Investor Presentation September 2025

Disclaimers and Forward-Looking Statements This investor presentation (this "presentation“) and any oral statements made in connection with this presentation are for information purposes only and do not constitute an offer to sell, a solicitation of an offer to buy, or a recommendation to purchase any equity, debt or other securities of Aveanna Healthcare Holdings Inc. (including its consolidated subsidiaries, "Aveanna," the "Company," "we," "us" or "our"). The information contained herein does not purport to be all inclusive. The data contained herein has been derived from various internal and external sources believed to be reliable, but there can be no assurance as to the accuracy or completeness of such information. Any data on past performance contained herein is not an indication as to future performance. Except as required by applicable law, Aveanna assumes no obligation to update the information in this presentation. Nothing herein shall be deemed to constitute investment, legal, tax, financial, accounting or other advice. This presentation is not intended for distribution to, or use by, any person in, any jurisdiction where such distribution or use would be contrary to local law or regulation. No representation or warranty (whether express or implied) has been made by Aveanna with respect to the matters set forth in this presentation. Cautionary Note Regarding Forward-Looking Statements Certain matters discussed in this presentation constitute forward-looking statements within the meaning of the Private Securities Litigation Reform Act of 1995. All statements (other than statements of historical facts) in this presentation regarding our prospects, plans, financial position, business strategy, expected financial and operational results, and any other future events may constitute forward-looking statements. Forward-looking statements generally can be identified by the use of terminology such as “believe,” “expect,” “anticipate,” “design,” “would,” “could,” “intend,” “plan,” “estimate,” “seek,” “will,” “may,” “should,” “predict,” “project,” “potential,” “continue,” “guidance,” or the negatives of these terms or variations of them or similar expressions. These statements are based on certain assumptions that we have made in light of our experience in the industry as well as our perceptions of historical trends, current conditions, expected future developments and other factors we believe are appropriate in these circumstances. These forward-looking statements are based on our current expectations and beliefs concerning future developments and their potential effect on us. Forward-looking statements involve a number of risks and uncertainties that may cause actual results to differ materially from those expressed or implied by such forward-looking statements, such as our ability to successfully execute our growth strategy, including through organic growth, estimation inaccuracies in revenue recognition, our ability to drive margin leverage through lower costs, unexpected increases in SG&A and other expenses, changes in reimbursement, changes in government regulations (including in the One Big Beautiful Bill Act), changes in Aveanna’s relationships with referral sources, increased competition for Aveanna’s services or wage inflation, the failure to retain or attract employees, changes in the interpretation of government regulations or discretionary determinations made by government officials, uncertainties regarding the outcome of rate discussions with managed care organizations and our ability to effectively collect our cash from these organizations, changes in the case-mix of our patients, as well as the payor mix and payment methodologies, our substantial indebtedness, the impact of adverse weather, and other risks set forth under the heading “Risk Factors” in Aveanna’s Annual Report on Form 10-K for its 2024 fiscal year filed with the Securities and Exchange Commission (the “SEC”) on March 13, 2025, as well as under similar headings in Aveanna’s subsequently filed Quarterly Reports on Form 10-Q and other filings with the SEC. In addition, these forward-looking statements necessarily depend upon assumptions, estimates and dates that may prove to be incorrect or imprecise. Accordingly, forward-looking statements included in this presentation do not purport to be predictions of future events or circumstances, and actual results may differ materially from those expressed by forward-looking statements. All forward-looking statements speak only as of the date made, and Aveanna undertakes no obligation to update or revise any forward-looking statements, whether as a result of new information, future events or otherwise, except as required by law. Industry and Market Data Unless otherwise indicated, information contained in this presentation concerning our industry, competitive position and the markets in which we operate is based on information from independent industry and research organizations, other third-party sources and management estimates. Aveanna has not independently verified the information and data obtained from third party sources and cannot assure you of such data’s accuracy or completeness. Management estimates are derived from publicly available information released by third-party sources, as well as data from our internal research, and are based on assumptions made by us upon reviewing such data, and our experience in, and knowledge of, such industry and markets, which we believe to be reasonable. Any industry forecasts are based on data (including third-party data), models and experience of various professionals and are based on various assumptions, all of which are subject to change without notice. In addition, projections, assumptions and estimates of the future performance of the industry in which we operate, and our future performance are necessarily subject to uncertainty and risk due to a variety of factors, including those described in “Cautionary Note Regarding Forward-Looking Statements.” These and other factors could cause results to differ materially from those expressed in the estimates made by the independent parties and by us. Non-GAAP Financial Measures This presentation includes various performance indicators and non-GAAP financial measures that we use to help us evaluate our business, identify trends affecting our business, formulate business plans, and make strategic decisions. EBITDA, Adjusted EBITDA, Net Leverage, Free Cash Flow, and pro forma presentations of the foregoing are financial measures that are calculated and presented on the basis of methodologies other than in accordance with generally accepted accounting principles in the United States of America (“GAAP”). Reconciliations of such non-GAAP measures to their nearest comparable GAAP measures can be found in the Appendix to this presentation. Any non-GAAP financial measures used in this presentation are in addition to, and not meant to be considered superior to, or a substitute for, the Company’s financial statements prepared in accordance with GAAP. Additional information with respect to Aveanna is contained in its filings with the SEC and is available at the SEC's website, www.sec.gov, and on Aveanna's website, www.aveanna.com
Non-GAAP Financial Measures In addition to our results of operations prepared in accordance with U.S. generally accepted accounting principles (“U.S. GAAP”), we also evaluate our financial performance using EBITDA, Adjusted EBITDA, Field contribution and Field contribution margin, Free cash flow, and Net leverage. Given our determination of adjustments in arriving at our computations, these non-GAAP measures have limitations as analytical tools and should not be considered in isolation or as substitutes or alternatives to net income or loss, revenue, operating income or loss, cash flows from operating activities, total indebtedness, gross margin, gross margin percentage or any other financial measures calculated in accordance with GAAP. Each non-GAAP measure should be viewed in addition to our reported results prepared in accordance with U.S. GAAP. EBITDA and Adjusted EBITDA EBITDA and Adjusted EBITDA are non-GAAP financial measures and are not intended to replace financial performance measures determined in accordance with U.S. GAAP, such as net income or loss. Rather, we present EBITDA and Adjusted EBITDA as supplemental measures of our performance. We define EBITDA as net income or loss before interest expense, net; income tax expense or benefit; and depreciation and amortization. We define Adjusted EBITDA as EBITDA, adjusted for the impact of certain other items that are either non-recurring, infrequent, non-cash, unusual, or items deemed by management to not be indicative of the performance of our core operations, including impairments of goodwill, intangible assets, and other long-lived assets; non-cash, share-based compensation and associated employer payroll taxes; loss on extinguishment of debt; fees related to debt modifications; the effect of interest rate derivatives; acquisition-related and integration costs; legal costs and settlements associated with acquisition matters; restructuring costs; other legal matters; other system transition costs, professional fees; and other costs including gains and losses on acquisitions and dispositions of certain businesses. As non-GAAP financial measures, our computations of EBITDA and Adjusted EBITDA may vary from similarly termed non-GAAP financial measures used by other companies, making comparisons with other companies on the basis of this measure impracticable. Management believes our computations of EBITDA and Adjusted EBITDA are helpful in highlighting trends in our core operating performance. In determining which adjustments are made to arrive at EBITDA and Adjusted EBITDA, management considers both (1) certain non-recurring, infrequent, non-cash or unusual items, which can vary significantly from year to year, as well as (2) certain other items that may be recurring, frequent, or settled in cash but which management does not believe are indicative of our core operating performance. We use EBITDA and Adjusted EBITDA to assess operating performance and make business decisions. We have occasionally incurred substantial acquisition-related costs and integration costs. The underlying acquisition activities take place over a defined timeframe, have distinct project timelines and are incremental to activities and costs that arise in the ordinary course of our business. Therefore, we believe it is important to exclude these costs from our Adjusted EBITDA because it provides management a normalized view of our core, ongoing operations after integrating our acquired companies, which is an important measure in assessing our performance. Field Contribution and Field Contribution Margin Field contribution and Field contribution margin are non-GAAP financial measures and are not intended to replace financial performance measures determined in accordance with U.S. GAAP, such as gross margin and gross margin percentage. Rather, we present Field contribution and Field contribution margin as supplemental measures of our performance. We define Field contribution as gross margin less branch and regional administrative expenses. Field contribution margin is Field contribution as a percentage of revenue. As non-GAAP financial measures, our computations of Field contribution and Field contribution margin may vary from similarly termed non-GAAP financial measures used by other companies, making comparisons with other companies on the basis of these measures impracticable. Management believes Field contribution and Field contribution margin are helpful in highlighting trends in our core operating performance and evaluating trends in our branch and regional results, which can vary from year to year. We use Field contribution and Field contribution margin to make business decisions and assess the operating performance and results delivered by our core field operations, prior to corporate and other costs not directly related to our field operations. These metrics are also important because they guide us in determining whether or not our branch and regional administrative expenses are appropriately sized to support our caregivers and direct patient care operations. Additionally, Field contribution and Field contribution margin determine how effective we are in managing our field supervisory and administrative costs associated with supporting our provision of services and sale of products. Free Cash Flow Free cash flow is a non-GAAP financial measure and is not intended to replace financial performance measures determined in accordance with U.S. GAAP. Free cash flow is a liquidity measure that represents operating cash flow, adjusted for the impact of purchases of property, equipment and software, principal payments on term loans, notes payable and financing leases, and settlements with swap counterparties. The most comparable GAAP measure is cash flow from operations. As a non-GAAP measure our computation of free cash flow may vary from similarly termed non-GAAP measures used by other companies, making comparisons with other companies on the basis of this measure impracticable. Management believes free cash flow is helpful in highlighting the cash generated or used by the Company, after taking into consideration mandatory payments on term loans, notes payable and financing leases, as well as cash needed for non-acquisition related capital expenditures, and cash paid to or received from derivative counterparties. Net Leverage Net leverage is a non-GAAP financial measure and is not intended to replace financial performance measures determined in accordance with U.S. GAAP, such as total debt to net income ratio. Rather, we present Net leverage as a supplemental measure of our performance. We define Net leverage as a ratio of total consolidated debt less cash and cash equivalents divided by Adjusted EBITDA (as defined above) for the trailing twelve months. As a non-GAAP measure our computation of Net leverage may vary from similarly termed non-GAAP measures used by other companies, making comparisons with other companies on the basis of this measure impracticable. Management believes our computation of Net leverage is helpful in highlighting our performance on a basis that is of interest to our lenders and credit partners and considers the length of time necessary to generate adjusted earnings required to cover our long-term debt obligations. Non-GAAP Measures

Contents Introduction 5 Company Overview 8 Financial Overview 24 Appendix 28

I. Introduction

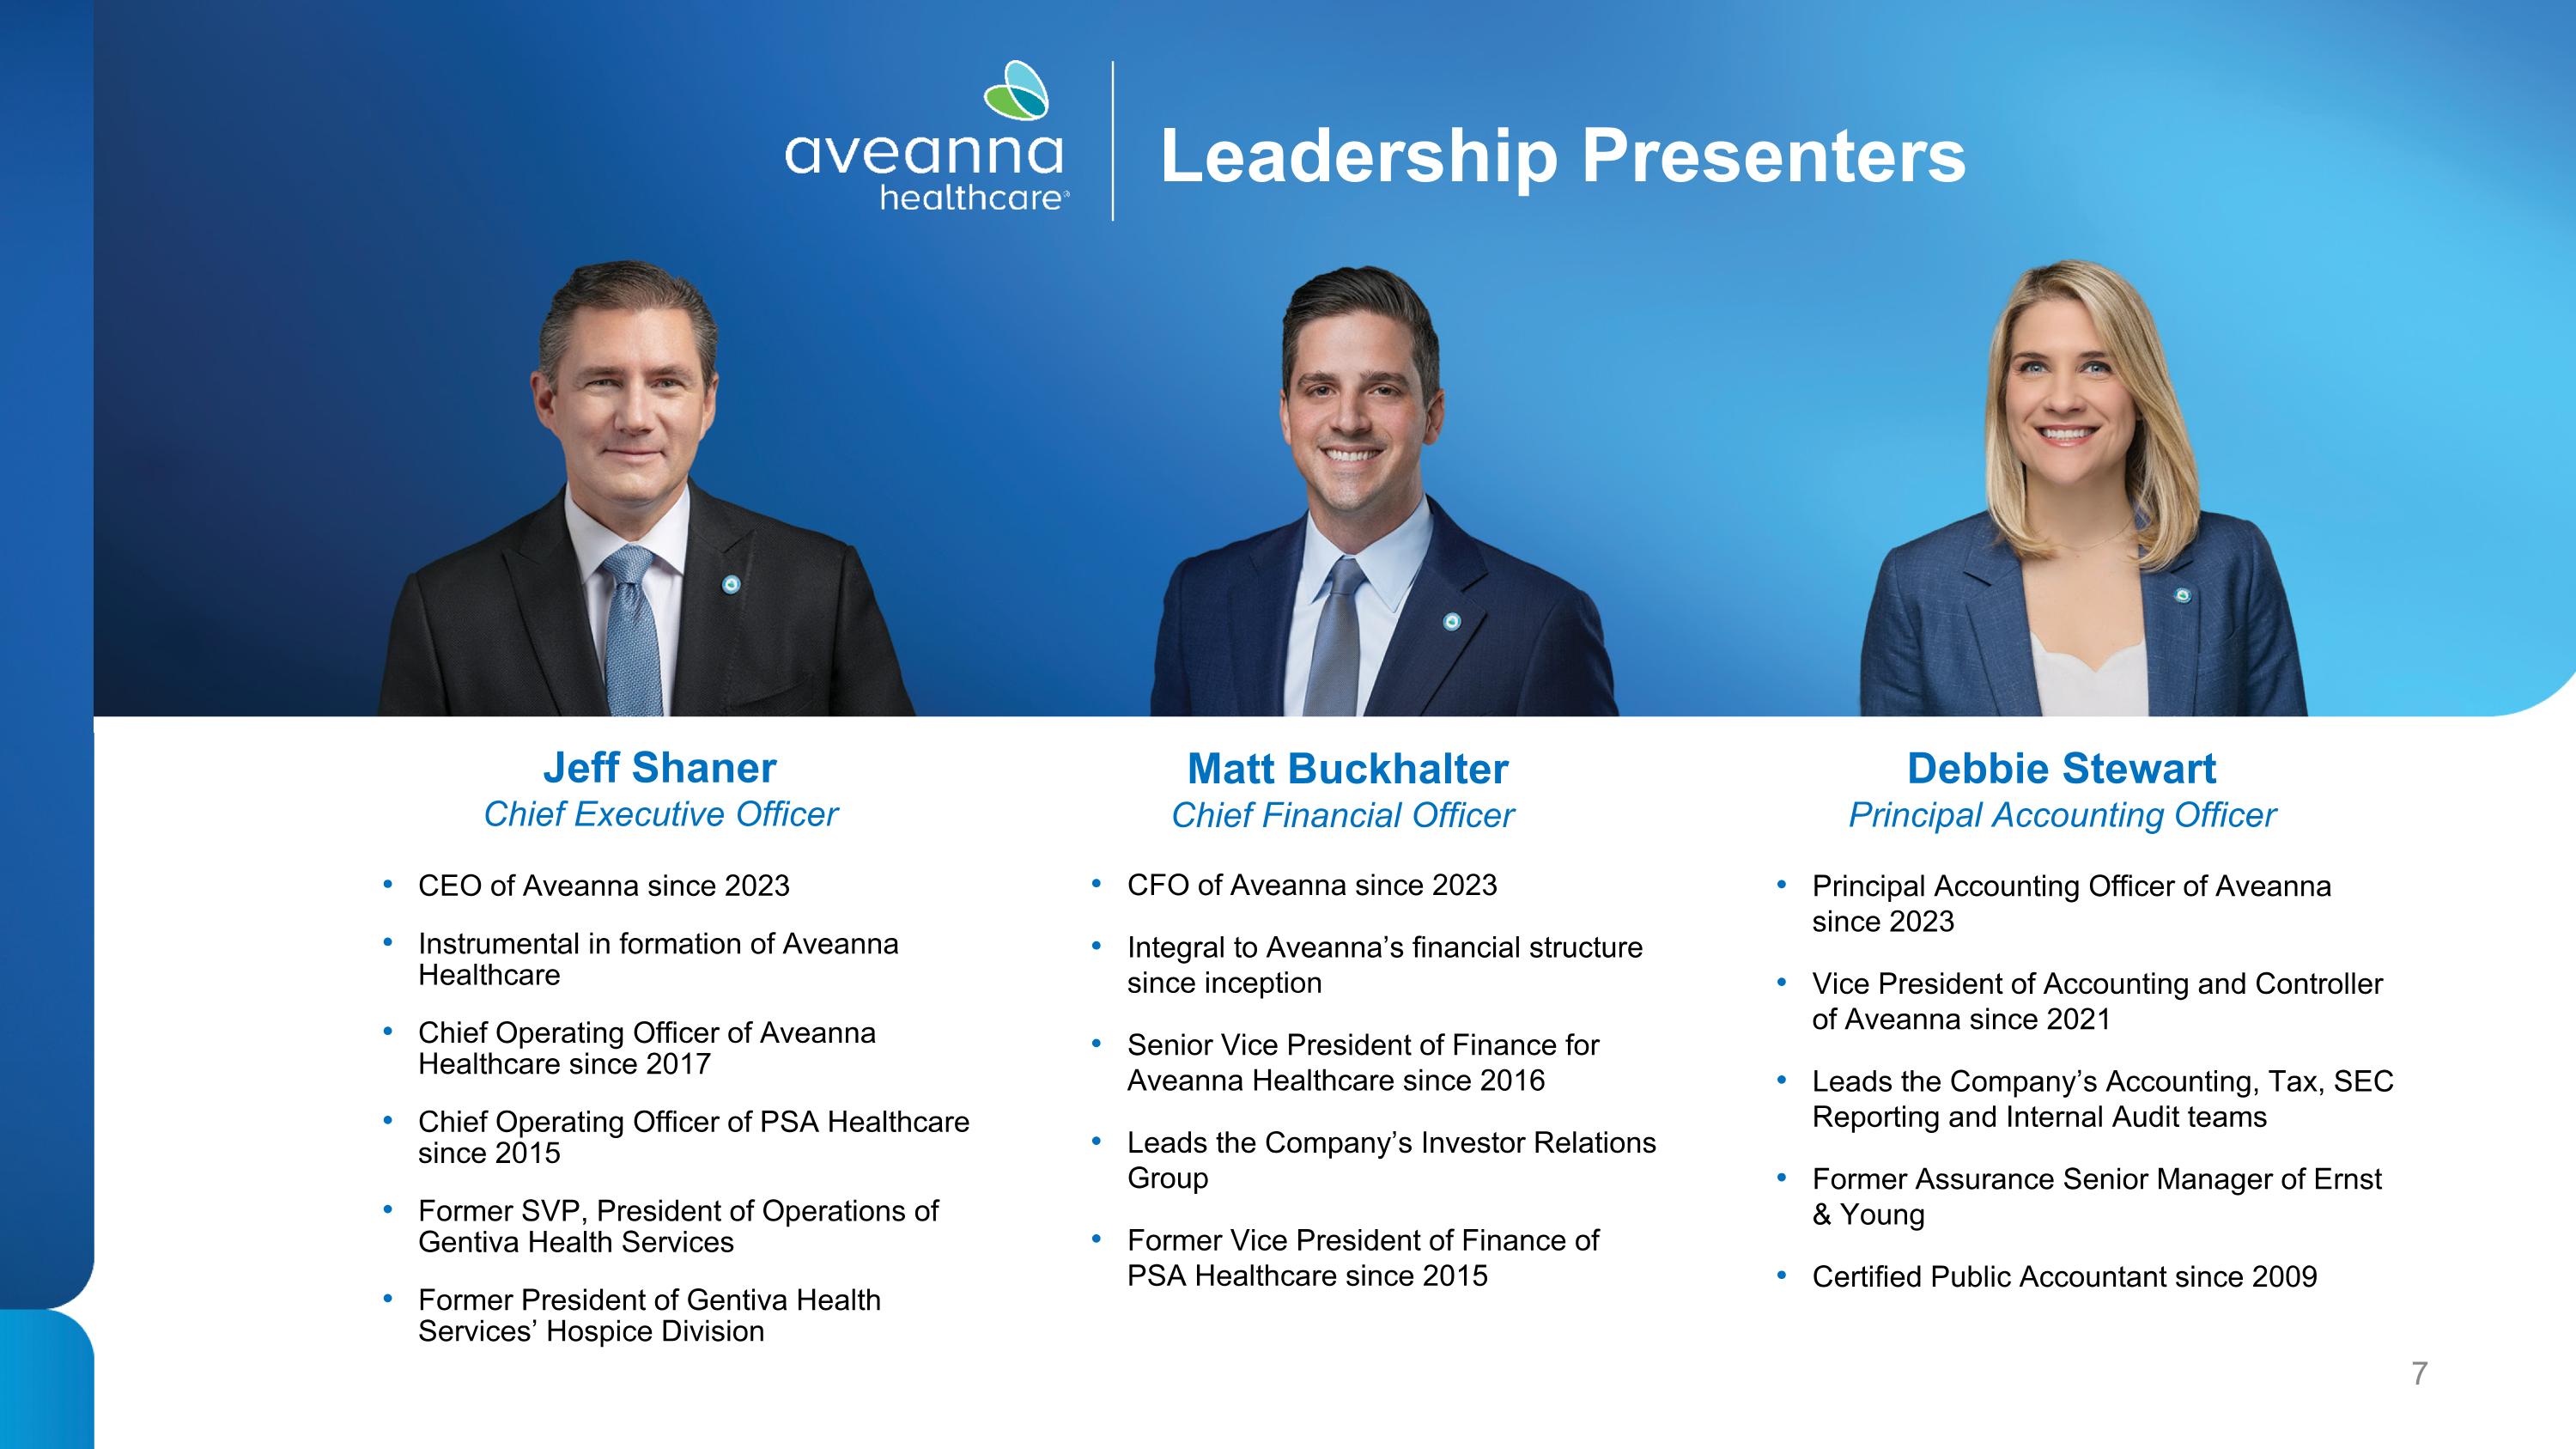
Debbie Stewart Principal Accounting Officer Jeff Shaner Chief Executive Officer CEO of Aveanna since 2023 Instrumental in formation of Aveanna Healthcare Chief Operating Officer of Aveanna Healthcare since 2017 Chief Operating Officer of PSA Healthcare since 2015 Former SVP, President of Operations of Gentiva Health Services Former President of Gentiva Health Services’ Hospice Division CFO of Aveanna since 2023 Integral to Aveanna’s financial structure since inception Senior Vice President of Finance for Aveanna Healthcare since 2016 Leads the Company’s Investor Relations Group Former Vice President of Finance of PSA Healthcare since 2015 Principal Accounting Officer of Aveanna since 2023 Vice President of Accounting and Controller of Aveanna since 2021 Leads the Company’s Accounting, Tax, SEC Reporting and Internal Audit teams Former Assurance Senior Manager of Ernst & Young Certified Public Accountant since 2009 Matt Buckhalter Chief Financial Officer Leadership Presenters

II. Company Overview
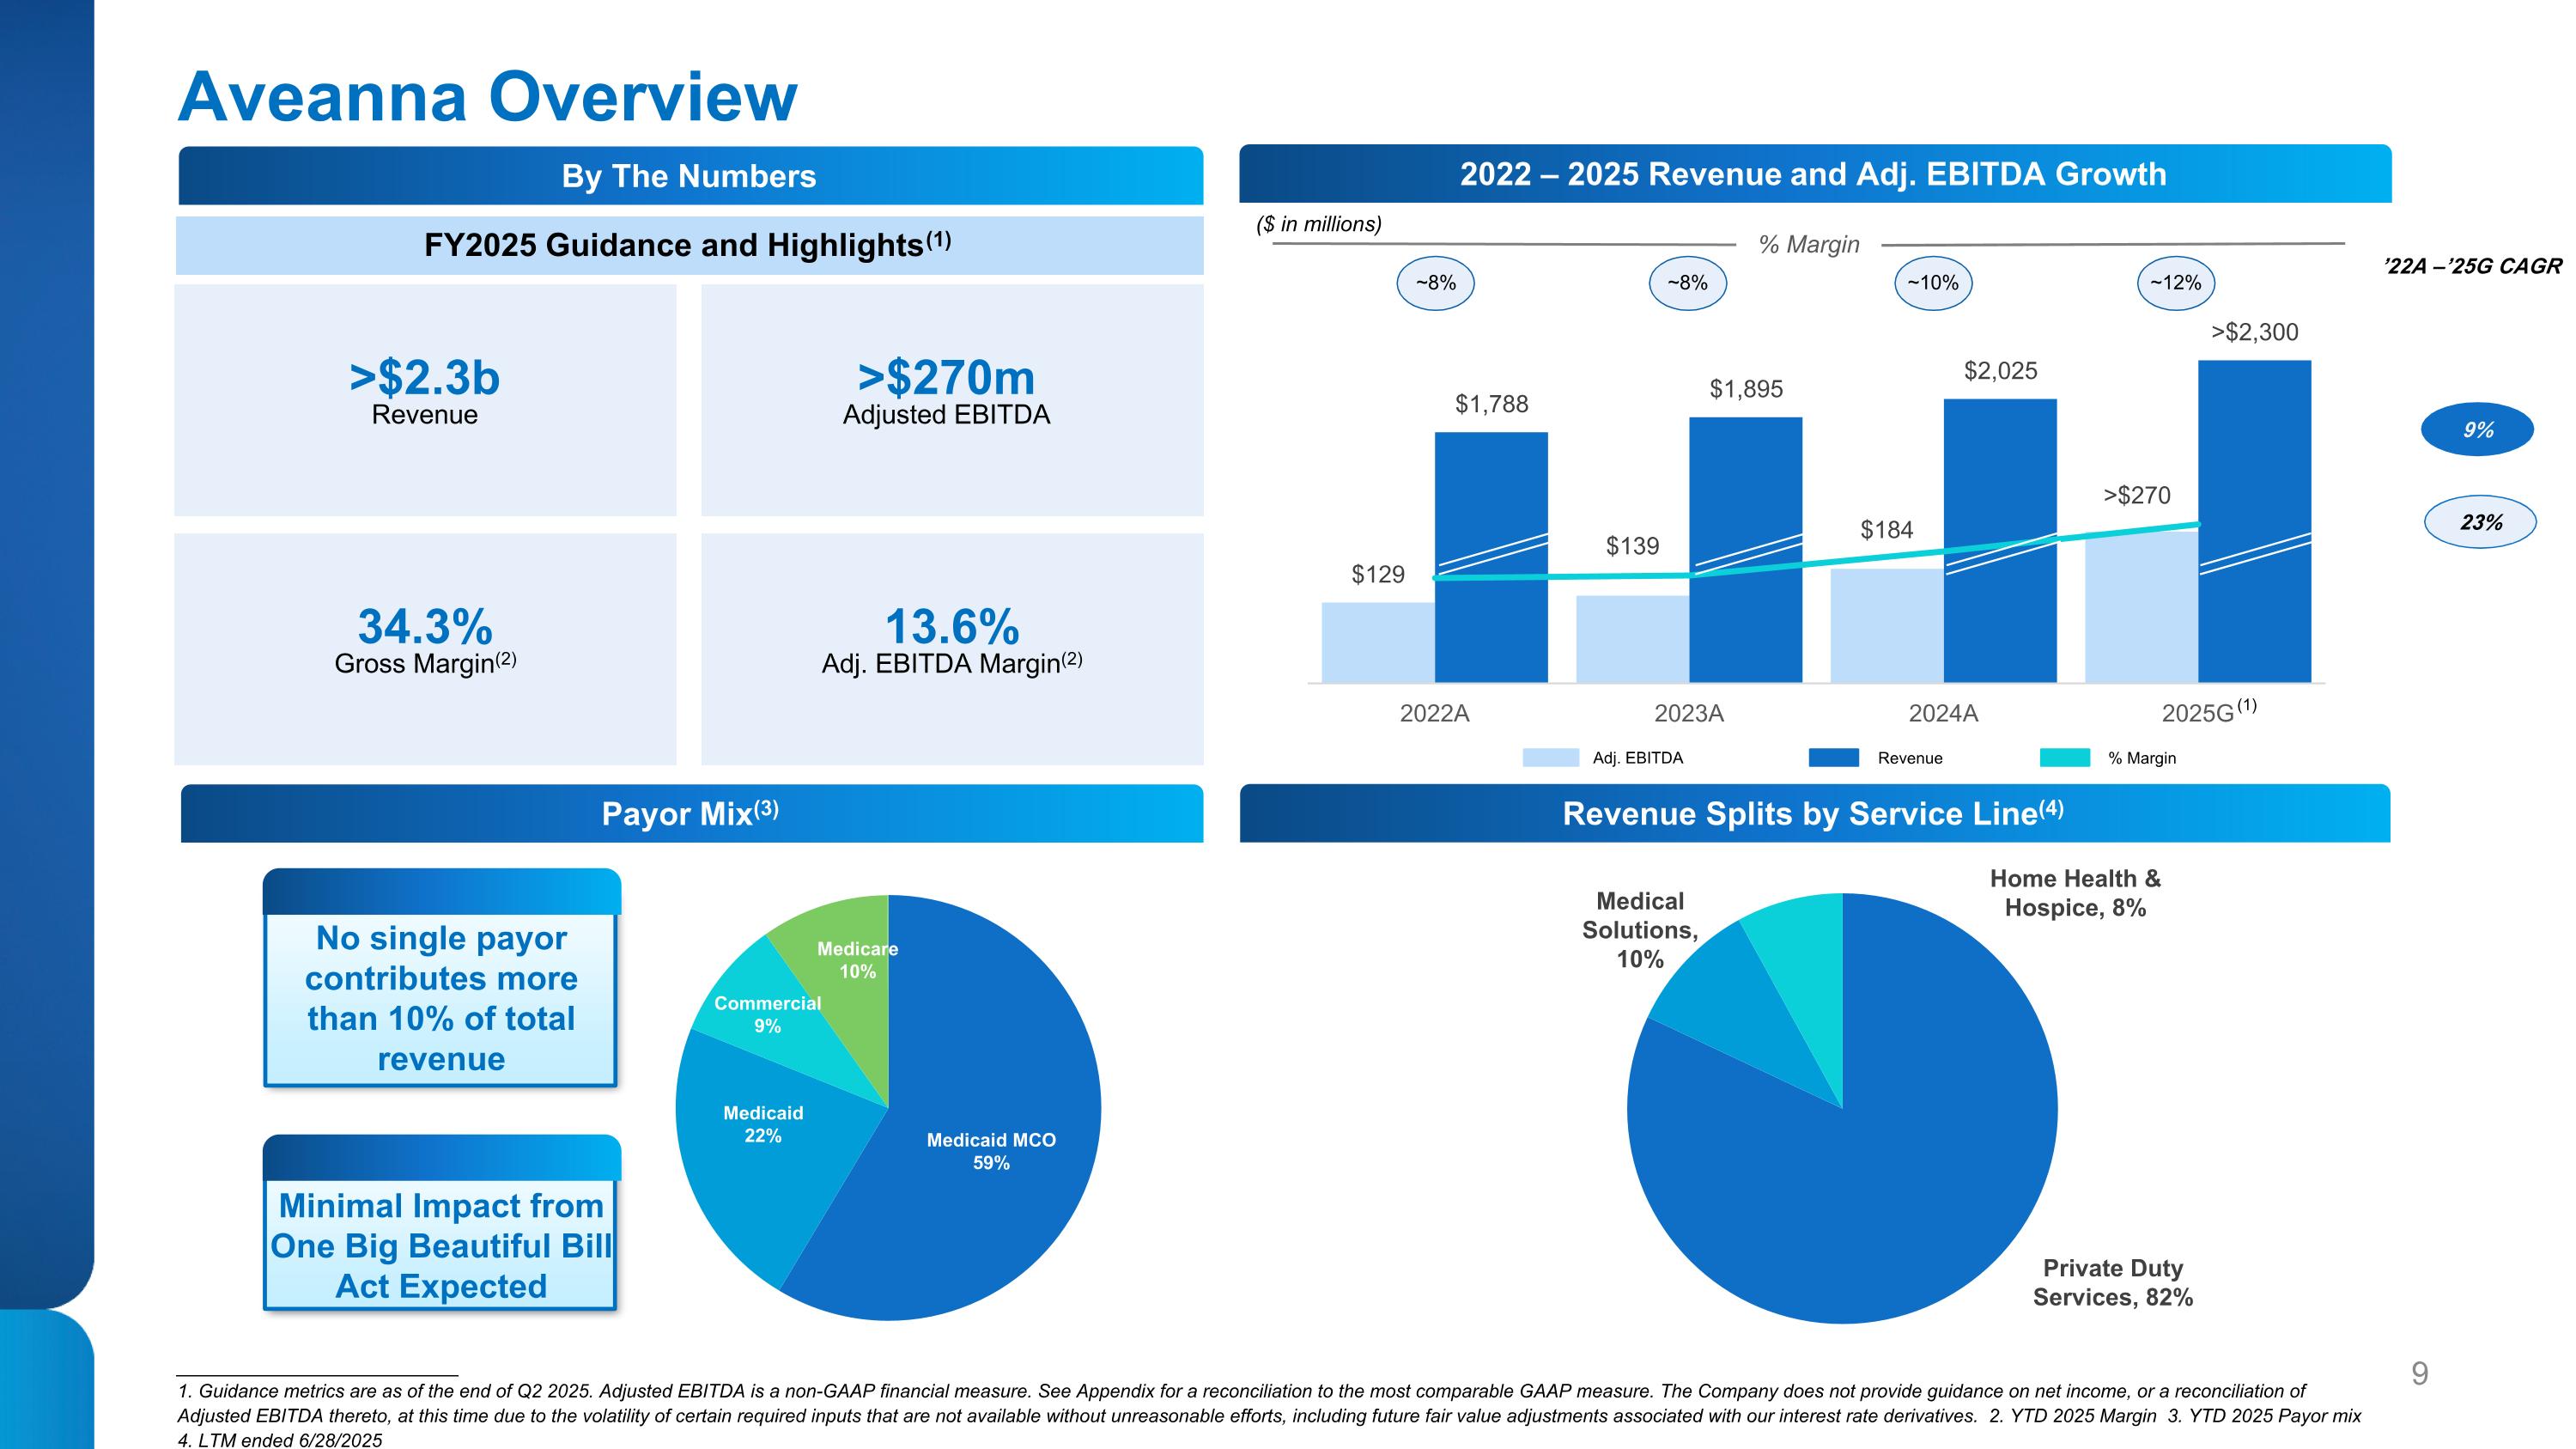
Aveanna Overview ___________________________ 1. Guidance metrics are as of the end of Q2 2025. Adjusted EBITDA is a non-GAAP financial measure. See Appendix for a reconciliation to the most comparable GAAP measure. The Company does not provide guidance on net income, or a reconciliation of Adjusted EBITDA thereto, at this time due to the volatility of certain required inputs that are not available without unreasonable efforts, including future fair value adjustments associated with our interest rate derivatives. 2. YTD 2025 Margin 3. YTD 2025 Payor mix 4. LTM ended 6/28/2025 ($ in millions) Payor Mix(3) 2022 – 2025 Revenue and Adj. EBITDA Growth Revenue Splits by Service Line(4) No single payor contributes more than 10% of total revenue Minimal Impact from One Big Beautiful Bill Act Expected % Margin ~8% ~8% ~10% ~12% Adj. EBITDA Revenue % Margin FY2025 Guidance and Highlights(1) >$2.3b Revenue 34.3% Gross Margin(2) >$270m Adjusted EBITDA By The Numbers 23% 9% ’22A –’25G CAGR 13.6% Adj. EBITDA Margin(2) (1)

The Premier National Pediatric and Geriatric Nursing Platform 38 States 366 Locations 29K Caregivers 88 Preferred Payors 43.9m Homecare Hours(1) ___________________________ 1. YTD PDS Hours Annualized

Melia and Mom Heather Valerie Aveanna's Transformative Homecare Platform Preferred Payor Partnerships Government Affairs Strategy Scaled National Platform Technology and Data Driven Results Reduction in Total Cost of Care Our advanced homecare platform positions us to improve outcomes with data-driven results and introduce value-based agreements that deliver exceptional value to our partners. Improved Clinical Outcomes
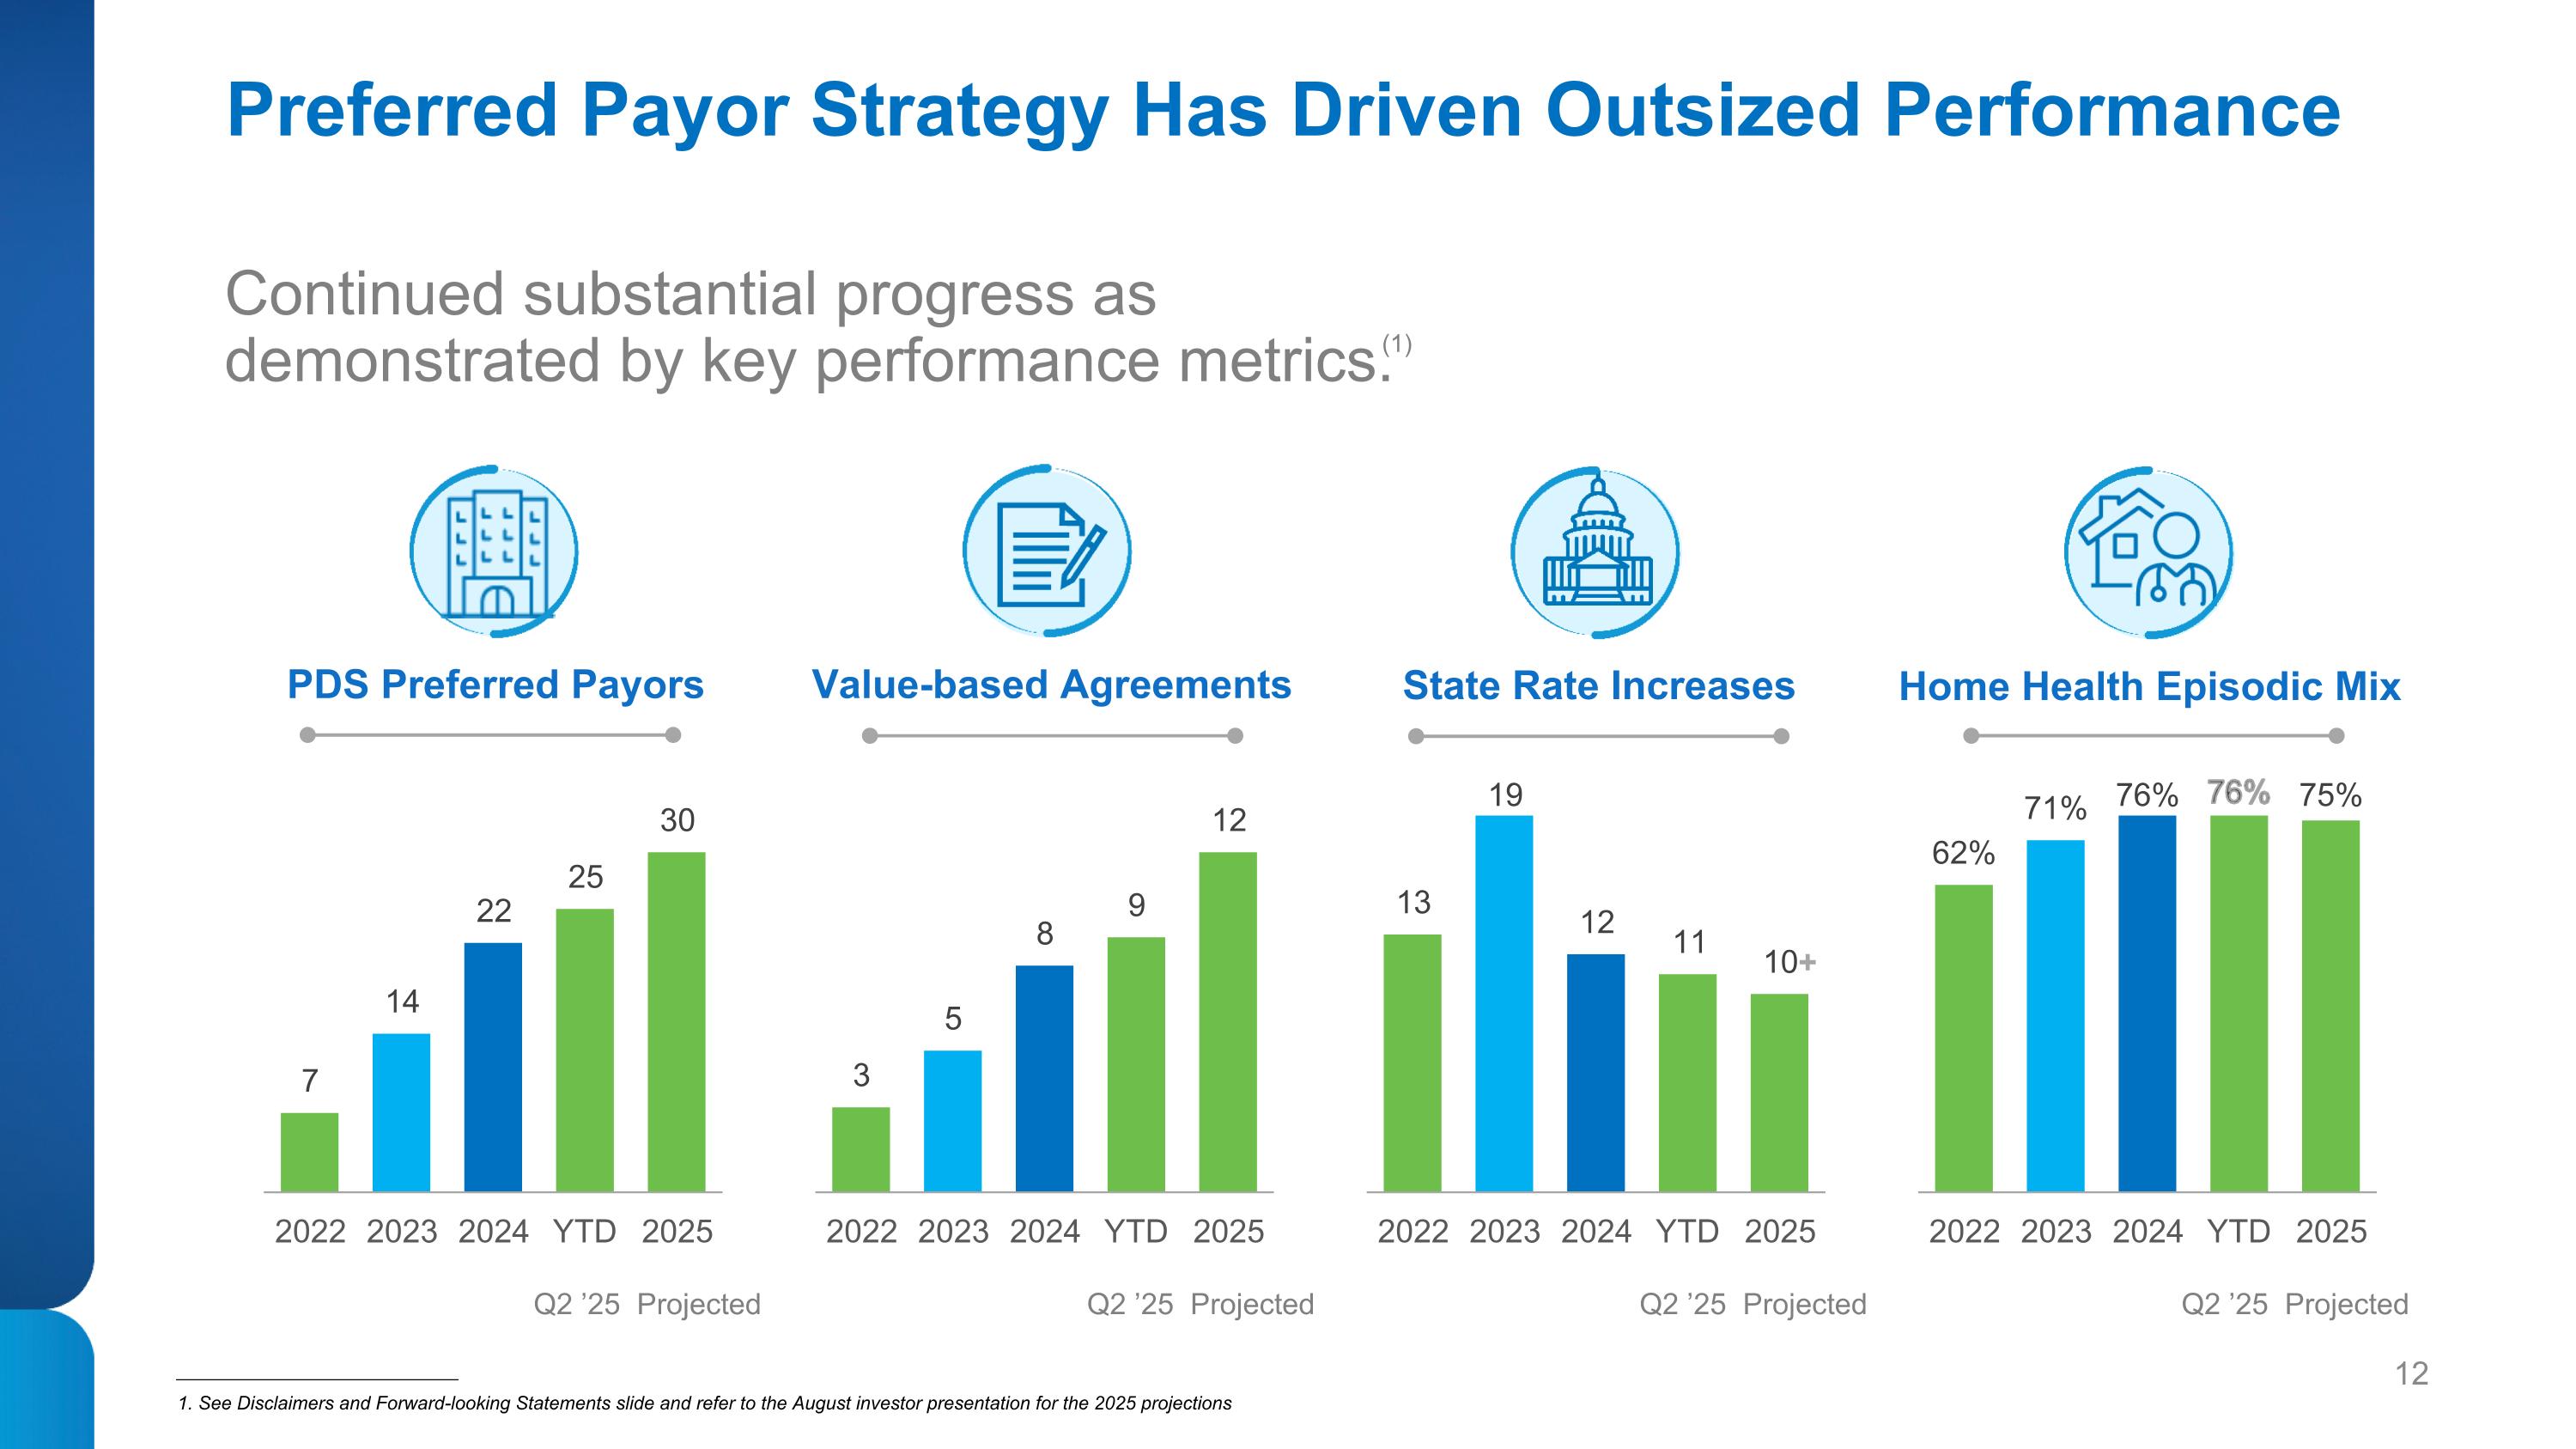
Preferred Payor Strategy Has Driven Outsized Performance PDS Preferred Payors State Rate Increases Home Health Episodic Mix Value-based Agreements Continued substantial progress as demonstrated by key performance metrics. (1) ___________________________ 1. See Disclaimers and Forward-looking Statements slide and refer to the August investor presentation for the 2025 projections Projected + Q2 ’25 Projected Q2 ’25 Projected Q2 ’25 Projected Q2 ’25

Melia and Mom Heather Valerie Our future opportunity will continue to provide enhanced value that is driven by our significant investment in our value-based national homecare platform. Aveanna's Transformative Homecare Platform Value-based Organic Growth Risk-based Growth Core Organic Growth Scaled national platform drives growth Payor partnerships underpinned by shared value creation Government agencies shifting programs and reimbursement to homecare Data and outcomes that define value and savings Capitating risk and population health management Strategic tuck-in acquisitions that strengthen our offerings to key payor and government partners M&A 3 – 4% 2 – 3% 2 – 3% 7 – 10% ___________________________ 1. See Disclaimers and Forward-looking Statements slide. Long-term Growth Rate (1)

Differentiated Growth, Diversification and Scale vs. Public Peers ___________________________ Source: Capital IQ and Wall Street research as of September 23, 2025 1. Amedisys is no longer publicly traded as of August 14,2025 2. Represents YTD Q2 2025 3. Represents total Non-Medicare Fee for Services 4. Includes Medicare Advantage 5. The Company does not provide guidance on net income, or a reconciliation of Adjusted EBITDA thereto, at this time due to the volatility of certain required inputs that are not available without unreasonable efforts, including future fair value adjustments associated with our interest rate derivatives 38 38 23 34 13 $273 $269 $178 $107 $70 40% 4% 21% 5% 31% States Payor Mix(2) 2025E Adj. EBITDA Consensus(5) ($M) Segment Mix(2) ’23 – ’25 Adj. EBITDA CAGR Medical Solutions Private Duty Services Home Health & Hospice Personal Care High Acuity Care Senior Living Services Other Continuous Care State, local and other governmental program Medicaid Managed Care Commercial Medicare Medicaid MCO Other (3) (4) (1)

Fragmented Home Care Markets Support Sustainable Growth $20bn Legacy Pediatric Focus Personal Care $18.0bn Annual U.S. Healthcare Spend $4.5tn Therapy $6.0bn Enteral Nutrition $3.0bn Therapy $7.0bn Private Duty Nursing $10.0bn Hospice $23.0bn $99bn Addressable Adult Opportunity TAM annual growth from 2023-2028 $119bn ~4% Untapped PDN demand with only a fraction of children and adults getting needed care Family caregiver program expansion Most cost efficient and patient preferred setting Our Market Opportunity Home Health $58.0bn ___________________________ Source: 2022 Third party consulting report, management estimates
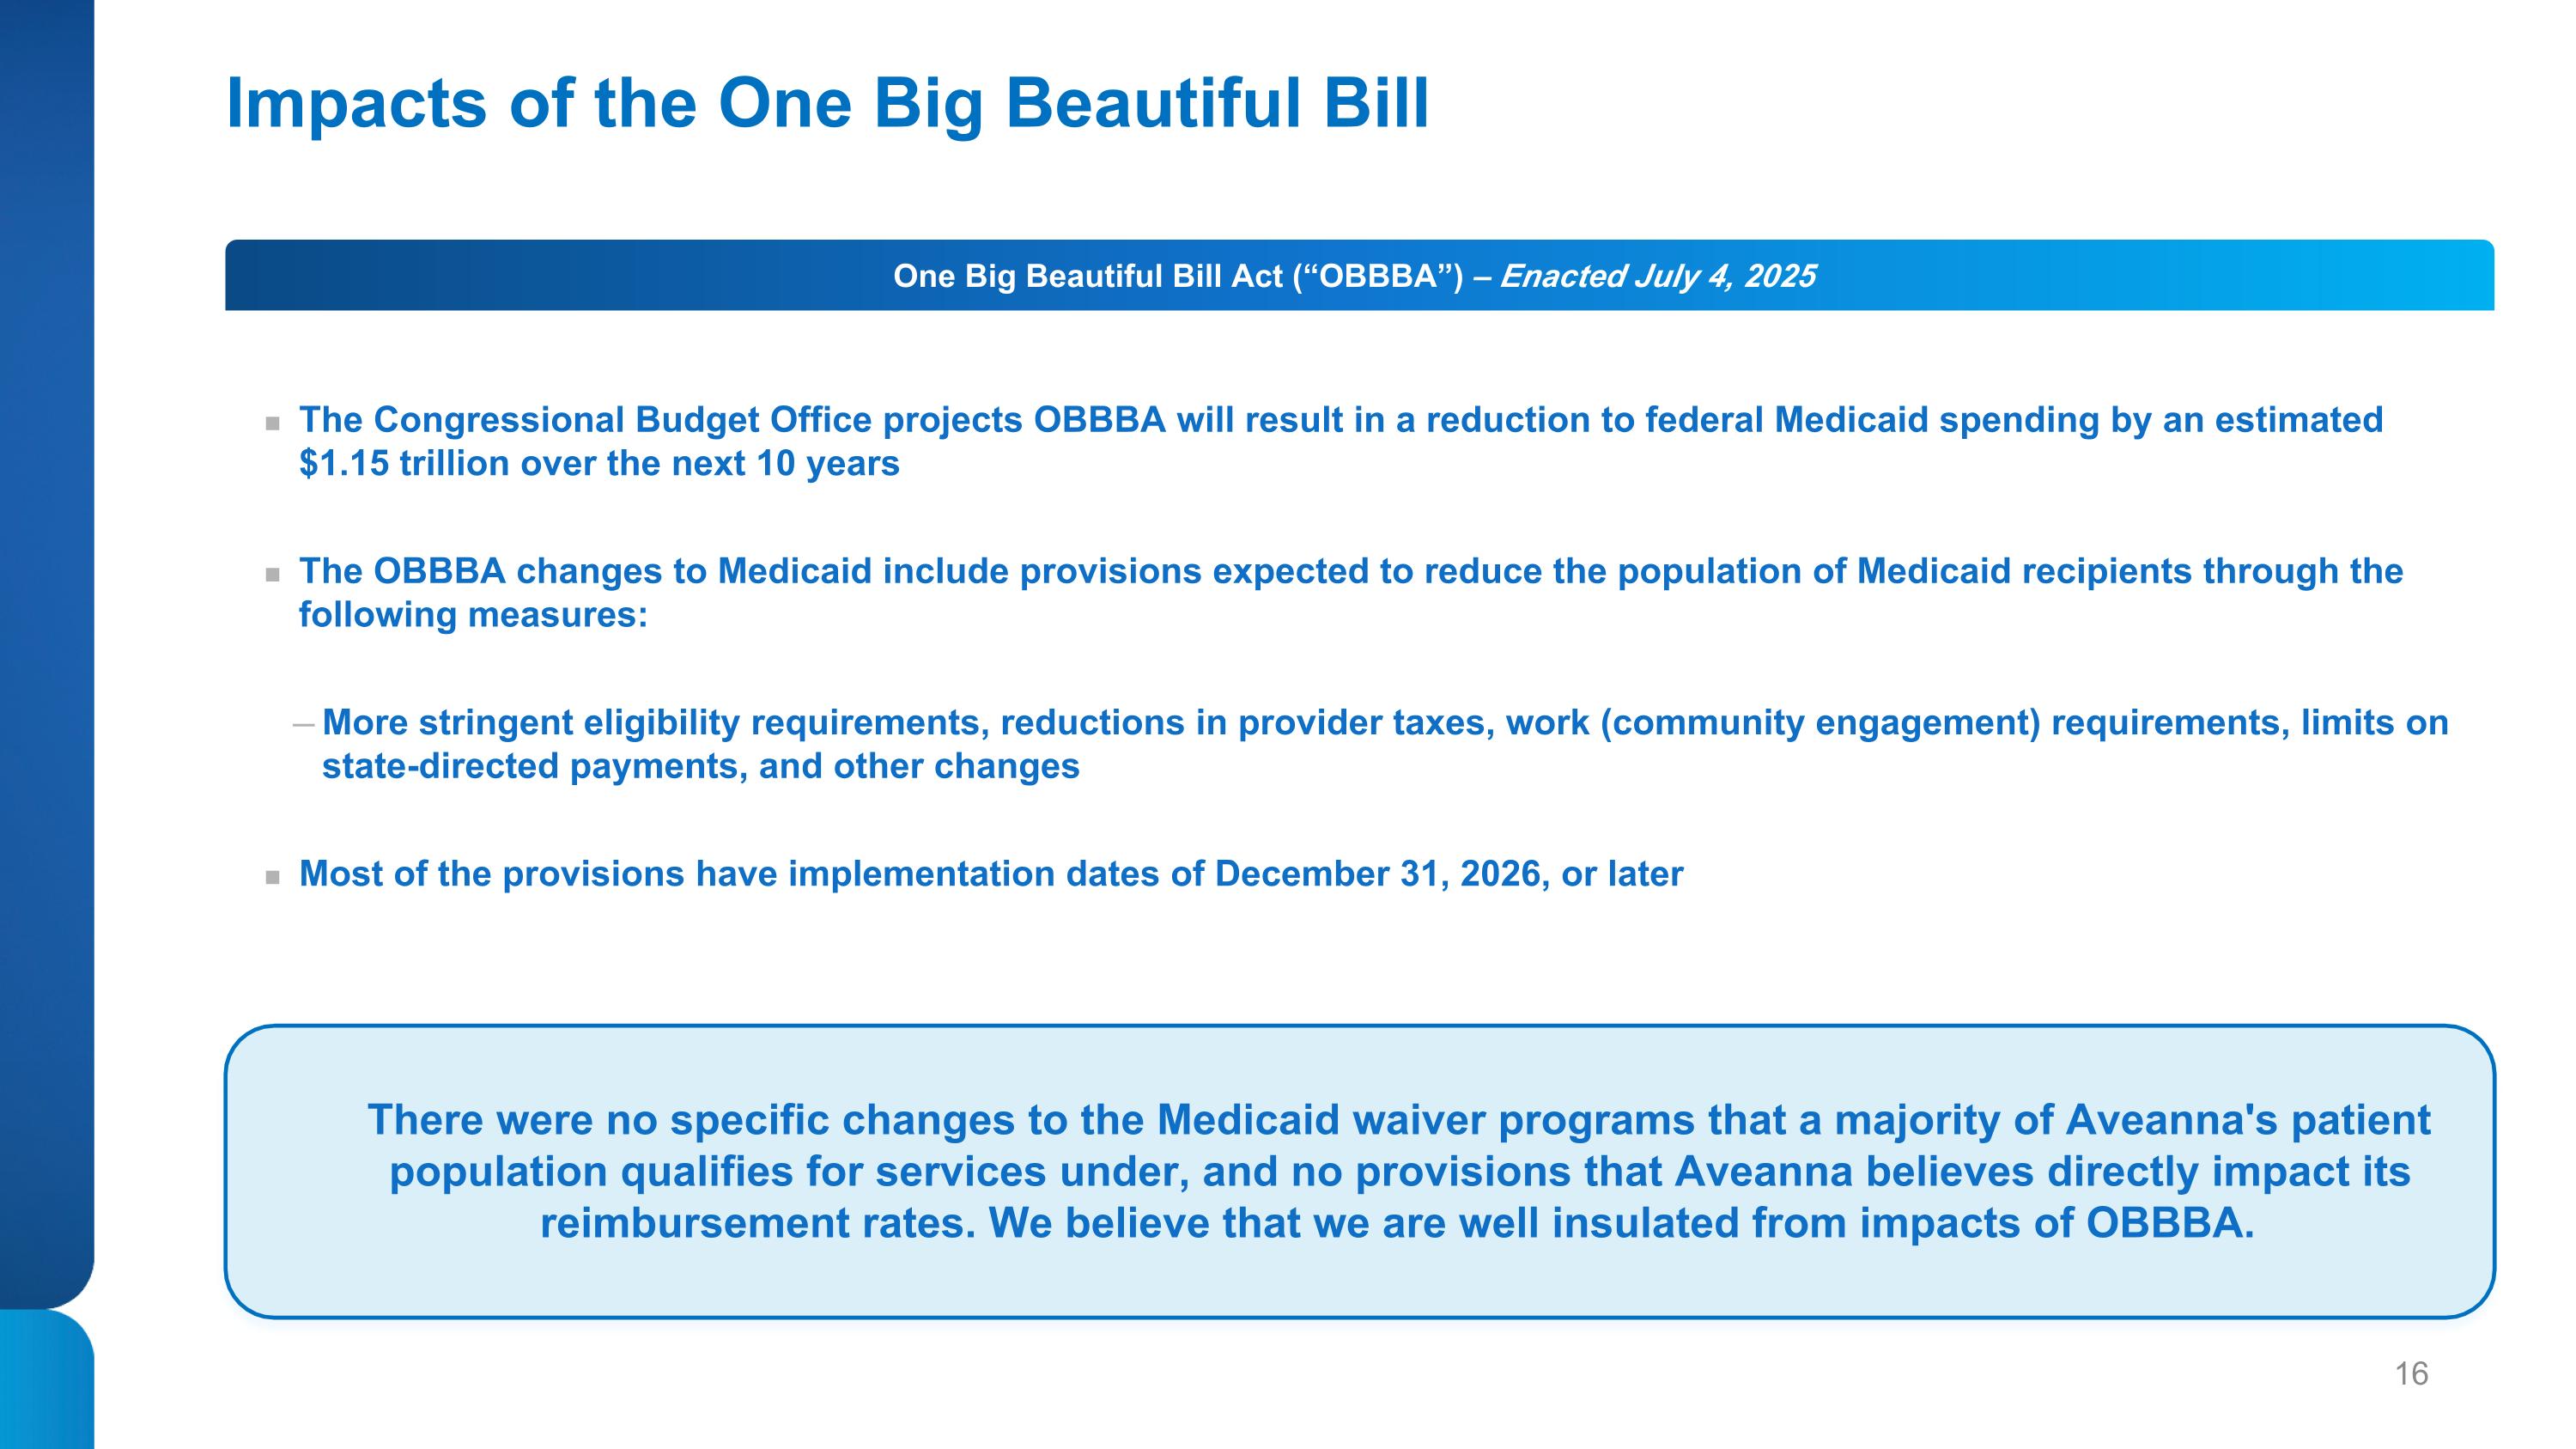
Impacts of the One Big Beautiful Bill The Congressional Budget Office projects OBBBA will result in a reduction to federal Medicaid spending by an estimated $1.15 trillion over the next 10 years The OBBBA changes to Medicaid include provisions expected to reduce the population of Medicaid recipients through the following measures: More stringent eligibility requirements, reductions in provider taxes, work (community engagement) requirements, limits on state-directed payments, and other changes Most of the provisions have implementation dates of December 31, 2026, or later One Big Beautiful Bill Act (“OBBBA”) – Enacted July 4, 2025 There were no specific changes to the Medicaid waiver programs that a majority of Aveanna's patient population qualifies for services under, and no provisions that Aveanna believes directly impact its reimbursement rates. We believe that we are well insulated from impacts of OBBBA.

Consistent Track Record of EBITDA Expansion and Performance 2023A – 2025A Quarterly Adjusted EBITDA Beat / (Miss) ~18% ~69% ~35% ~18% ~7% ~8% ~17% ~23% ~23% ~83% ___________________________ Source: Capital IQ and Public Filings. 1. Beat / (Miss) indicates performance relative to consensus estimates. (1)

Focused Approach to Continued De-Levering >5x Deleveraging in 3 years Total Net Leverage(1) ___________________________ Note: Includes securitization. 1. Net Leverage is a non-GAAP financial measure. See Appendix for a reconciliation to the most comparable GAAP measure.

Medical Solutions Home Health & Hospice Aveanna Business Segments Home Health Geriatric Patient Population Intermittent Services at Home Shorter Length of Stay Patients Value-based Care Component Hospice Geriatric Patient Population Per Diem Reimbursement End-of-life Care / Support Median Length of Stay Patients Nutritional Support – Enteral Product, Equipment and Supplies Provided to Pediatric, Adult, and Geriatric Patients 24-hour Clinical Support Longer Length of Stay Patients Complementary Referrals with PDS and HHH One Nurse – One Patient Setting Full Time & Per Diem Caregivers Paid by the Hour Longer Length of Stay Patients Patient Demand Exceeds Caregiver Supply Significant Cost Savings to Medicaid / MCO Payors Private Duty Services
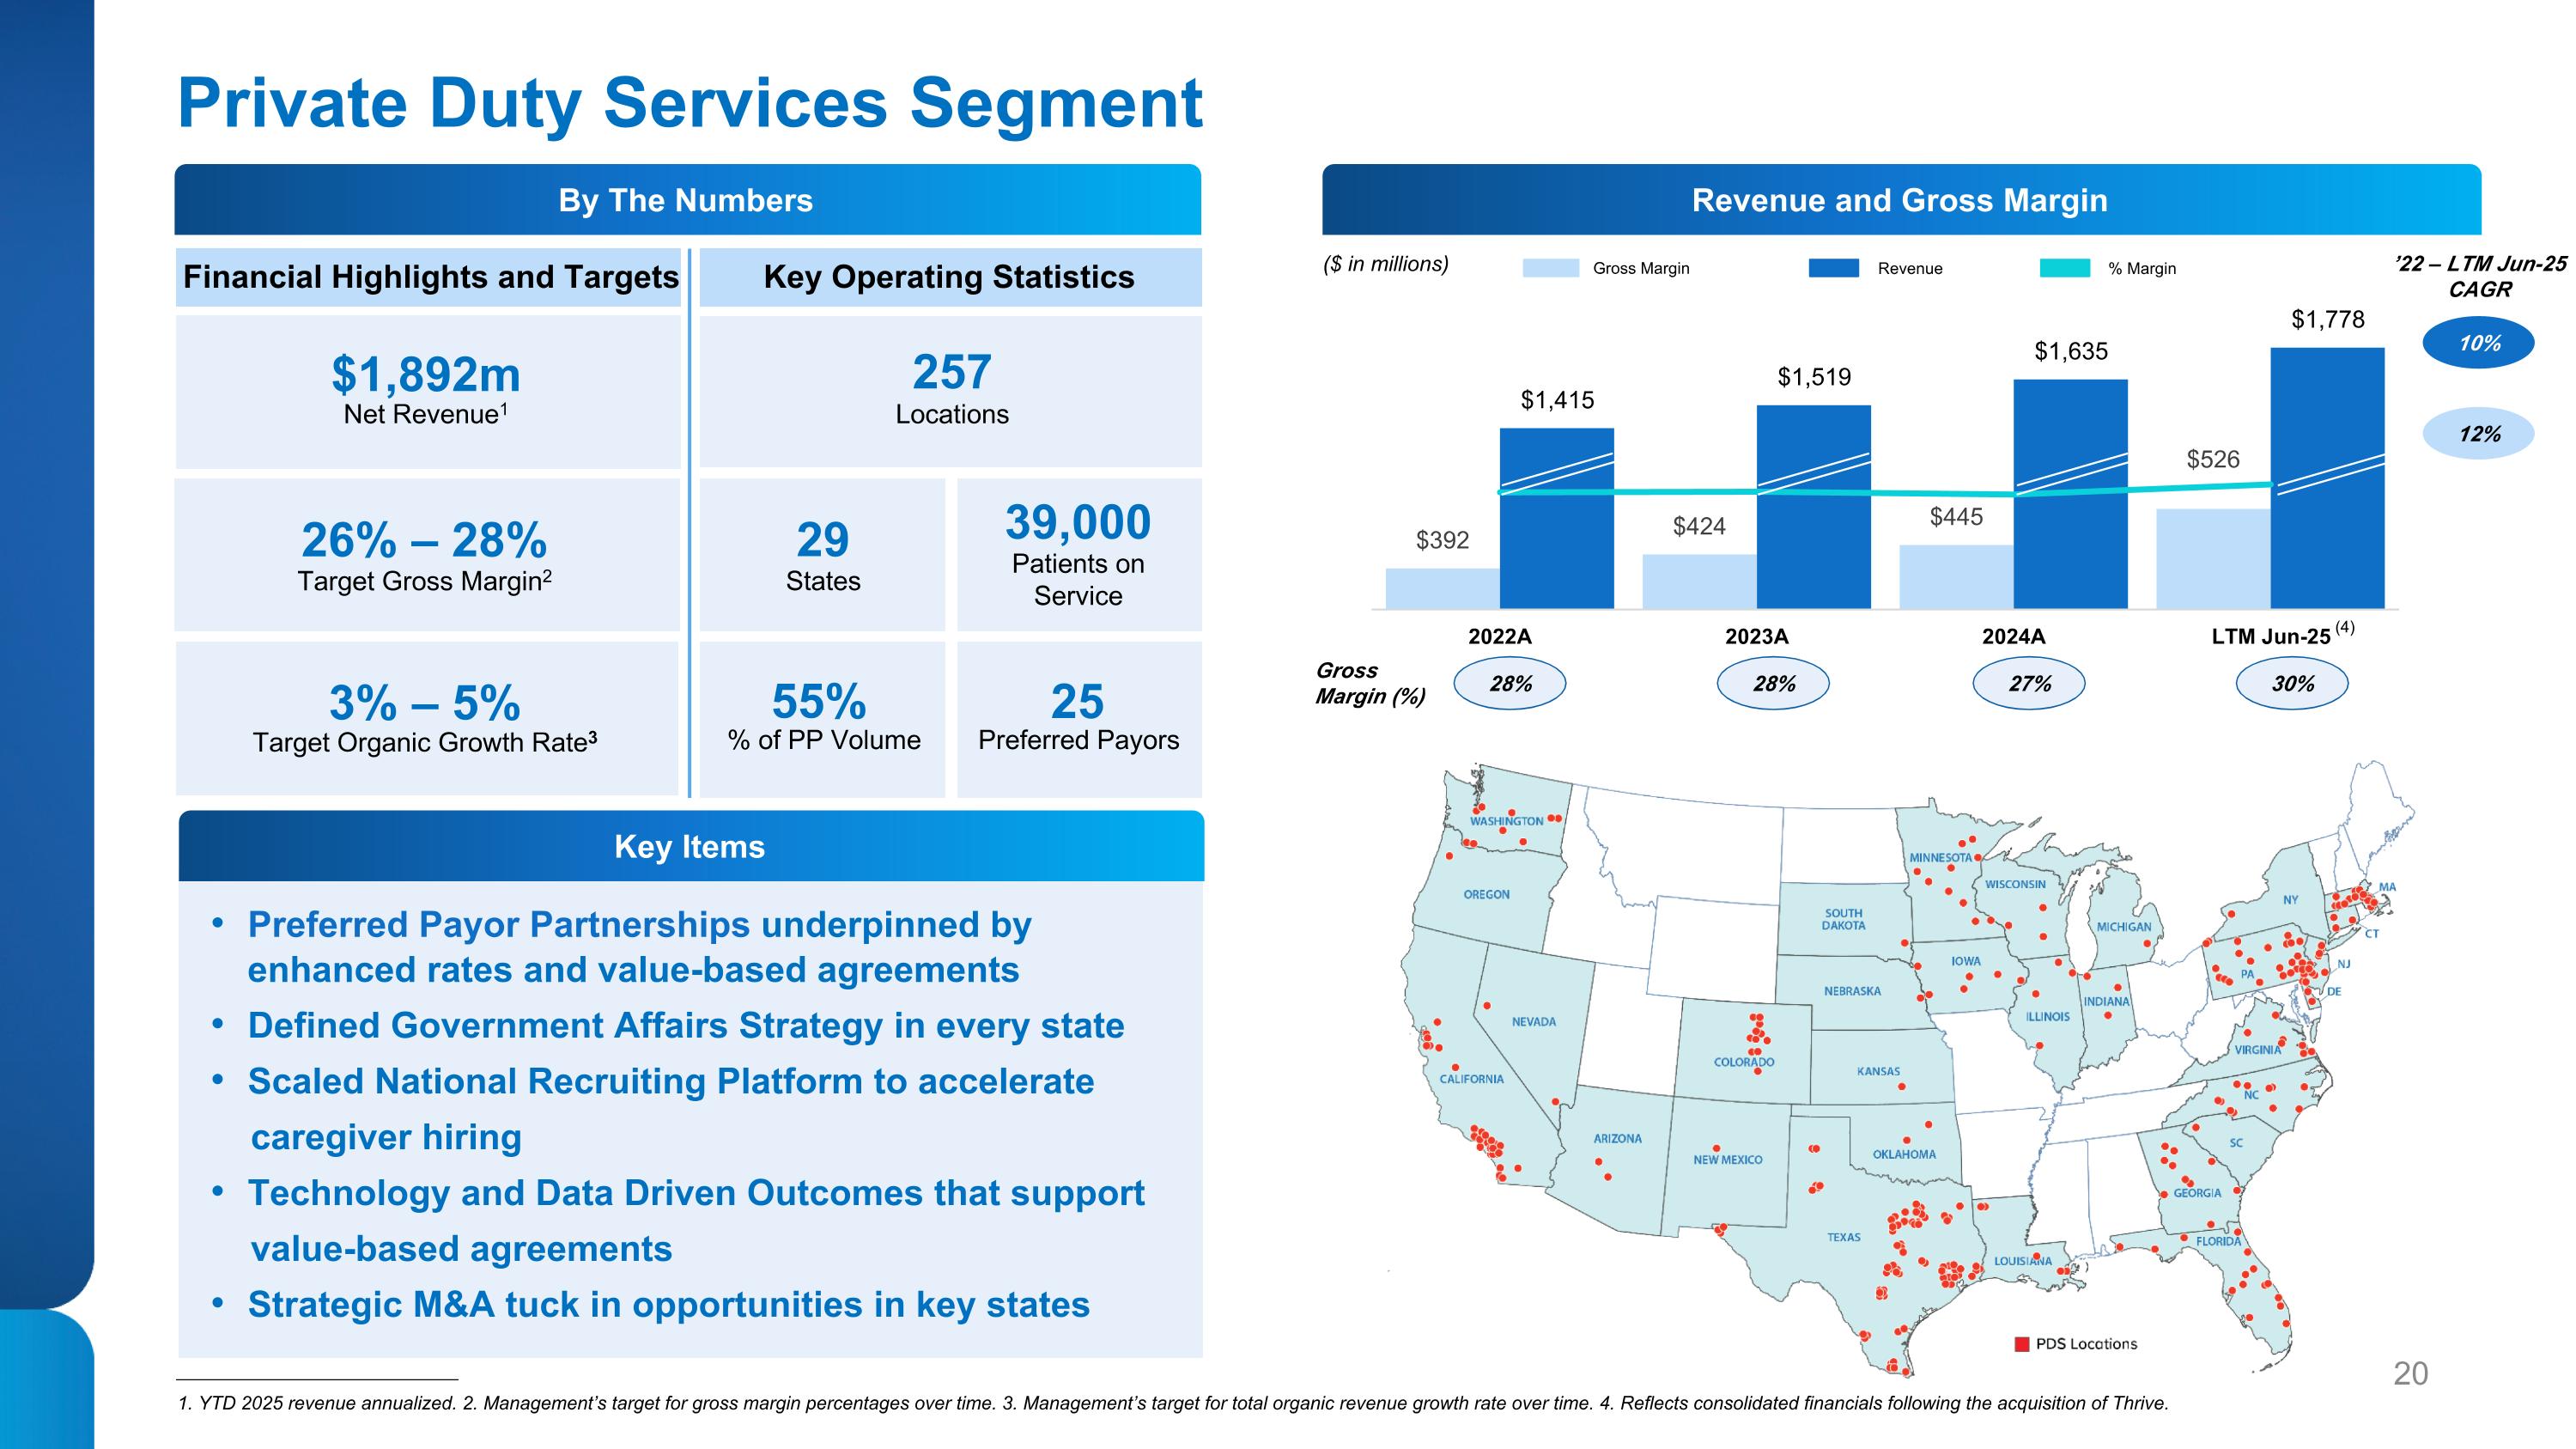
Gross Margin Revenue % Margin Private Duty Services Segment Financial Highlights and Targets Key Operating Statistics $1,892m Net Revenue1 26% – 28% Target Gross Margin2 3% – 5% Target Organic Growth Rate3 257 Locations 29 States 39,000 Patients on Service 55% % of PP Volume Preferred Payors 25 Preferred Payor Partnerships underpinned by enhanced rates and value-based agreements Defined Government Affairs Strategy in every state Scaled National Recruiting Platform to accelerate caregiver hiring Technology and Data Driven Outcomes that support value-based agreements Strategic M&A tuck in opportunities in key states ___________________________ 1. YTD 2025 revenue annualized. 2. Management’s target for gross margin percentages over time. 3. Management’s target for total organic revenue growth rate over time. 4. Reflects consolidated financials following the acquisition of Thrive. By The Numbers Key Items Revenue and Gross Margin 28% Gross Margin (%) ($ in millions) 28% 27% 30% 12% 10% ’22 – LTM Jun-25 CAGR (4)

Home Health & Hospice Segment ___________________________ 1. YTD 2025 revenue annualized. 2. Management’s target for gross margin percentages over time. 3. Management’s target for total organic revenue growth rate over time. HH Preferred Payors defined as episodic agreements Caregiver Capacity aligned with preferred payors Organic growth initiatives that support the preferred payor strategy Superior clinical outcomes with high patient satisfaction The most cost-effective and patient preferred healthcare setting Key Items Financial Highlights and Targets Key Operating Statistics $234m Net Revenue1 50% – 52% Target Gross Margin2 5% – 7% Target Organic Growth Rate3 82 Locations 15 States 13,850 Patients on Service 76% Episodic Mix Preferred Payors 45 By The Numbers Revenue and Gross Margin 44% Gross Margin (%) ($ in millions) 48% 54% 54% 7% (1%) ’22 – LTM Jun-25 CAGR Gross Margin Revenue % Margin

Medical Solutions Segment ___________________________ 1. YTD 2025 revenue annualized. 2. Management’s target for gross margin percentages over time. 3. Management’s target for total organic revenue growth rate over time. Preferred Payor Contracts provide in-network patient support at favorable rates Enhanced AMS Model driving need to refine our payor network with focus on preferred payors Nationally Scaled Enteral Provider Strong Patient Demand drives growth trends Symbiotic relationship with PDN services Key Items Financial Highlights and Targets Key Operating Statistics $172m Net Revenue1 42% – 44% Target Gross Margin2 8% – 10% Target Organic Growth Rate3 27 States we deliver to 2 – 3 Years Avg. Case Length 30,300 Patients on Service ~$477 Rate / UPS Preferred Payors 18 By The Numbers Revenue and Gross Margin 42% Gross Margin (%) ($ in millions) 42% 43% 45% 12% 9% ’22 – LTM Jun-25 CAGR Gross Margin Revenue % Margin

Scaled Platform Built for Driving Growth and Enhancing Value

III. Financial Overview
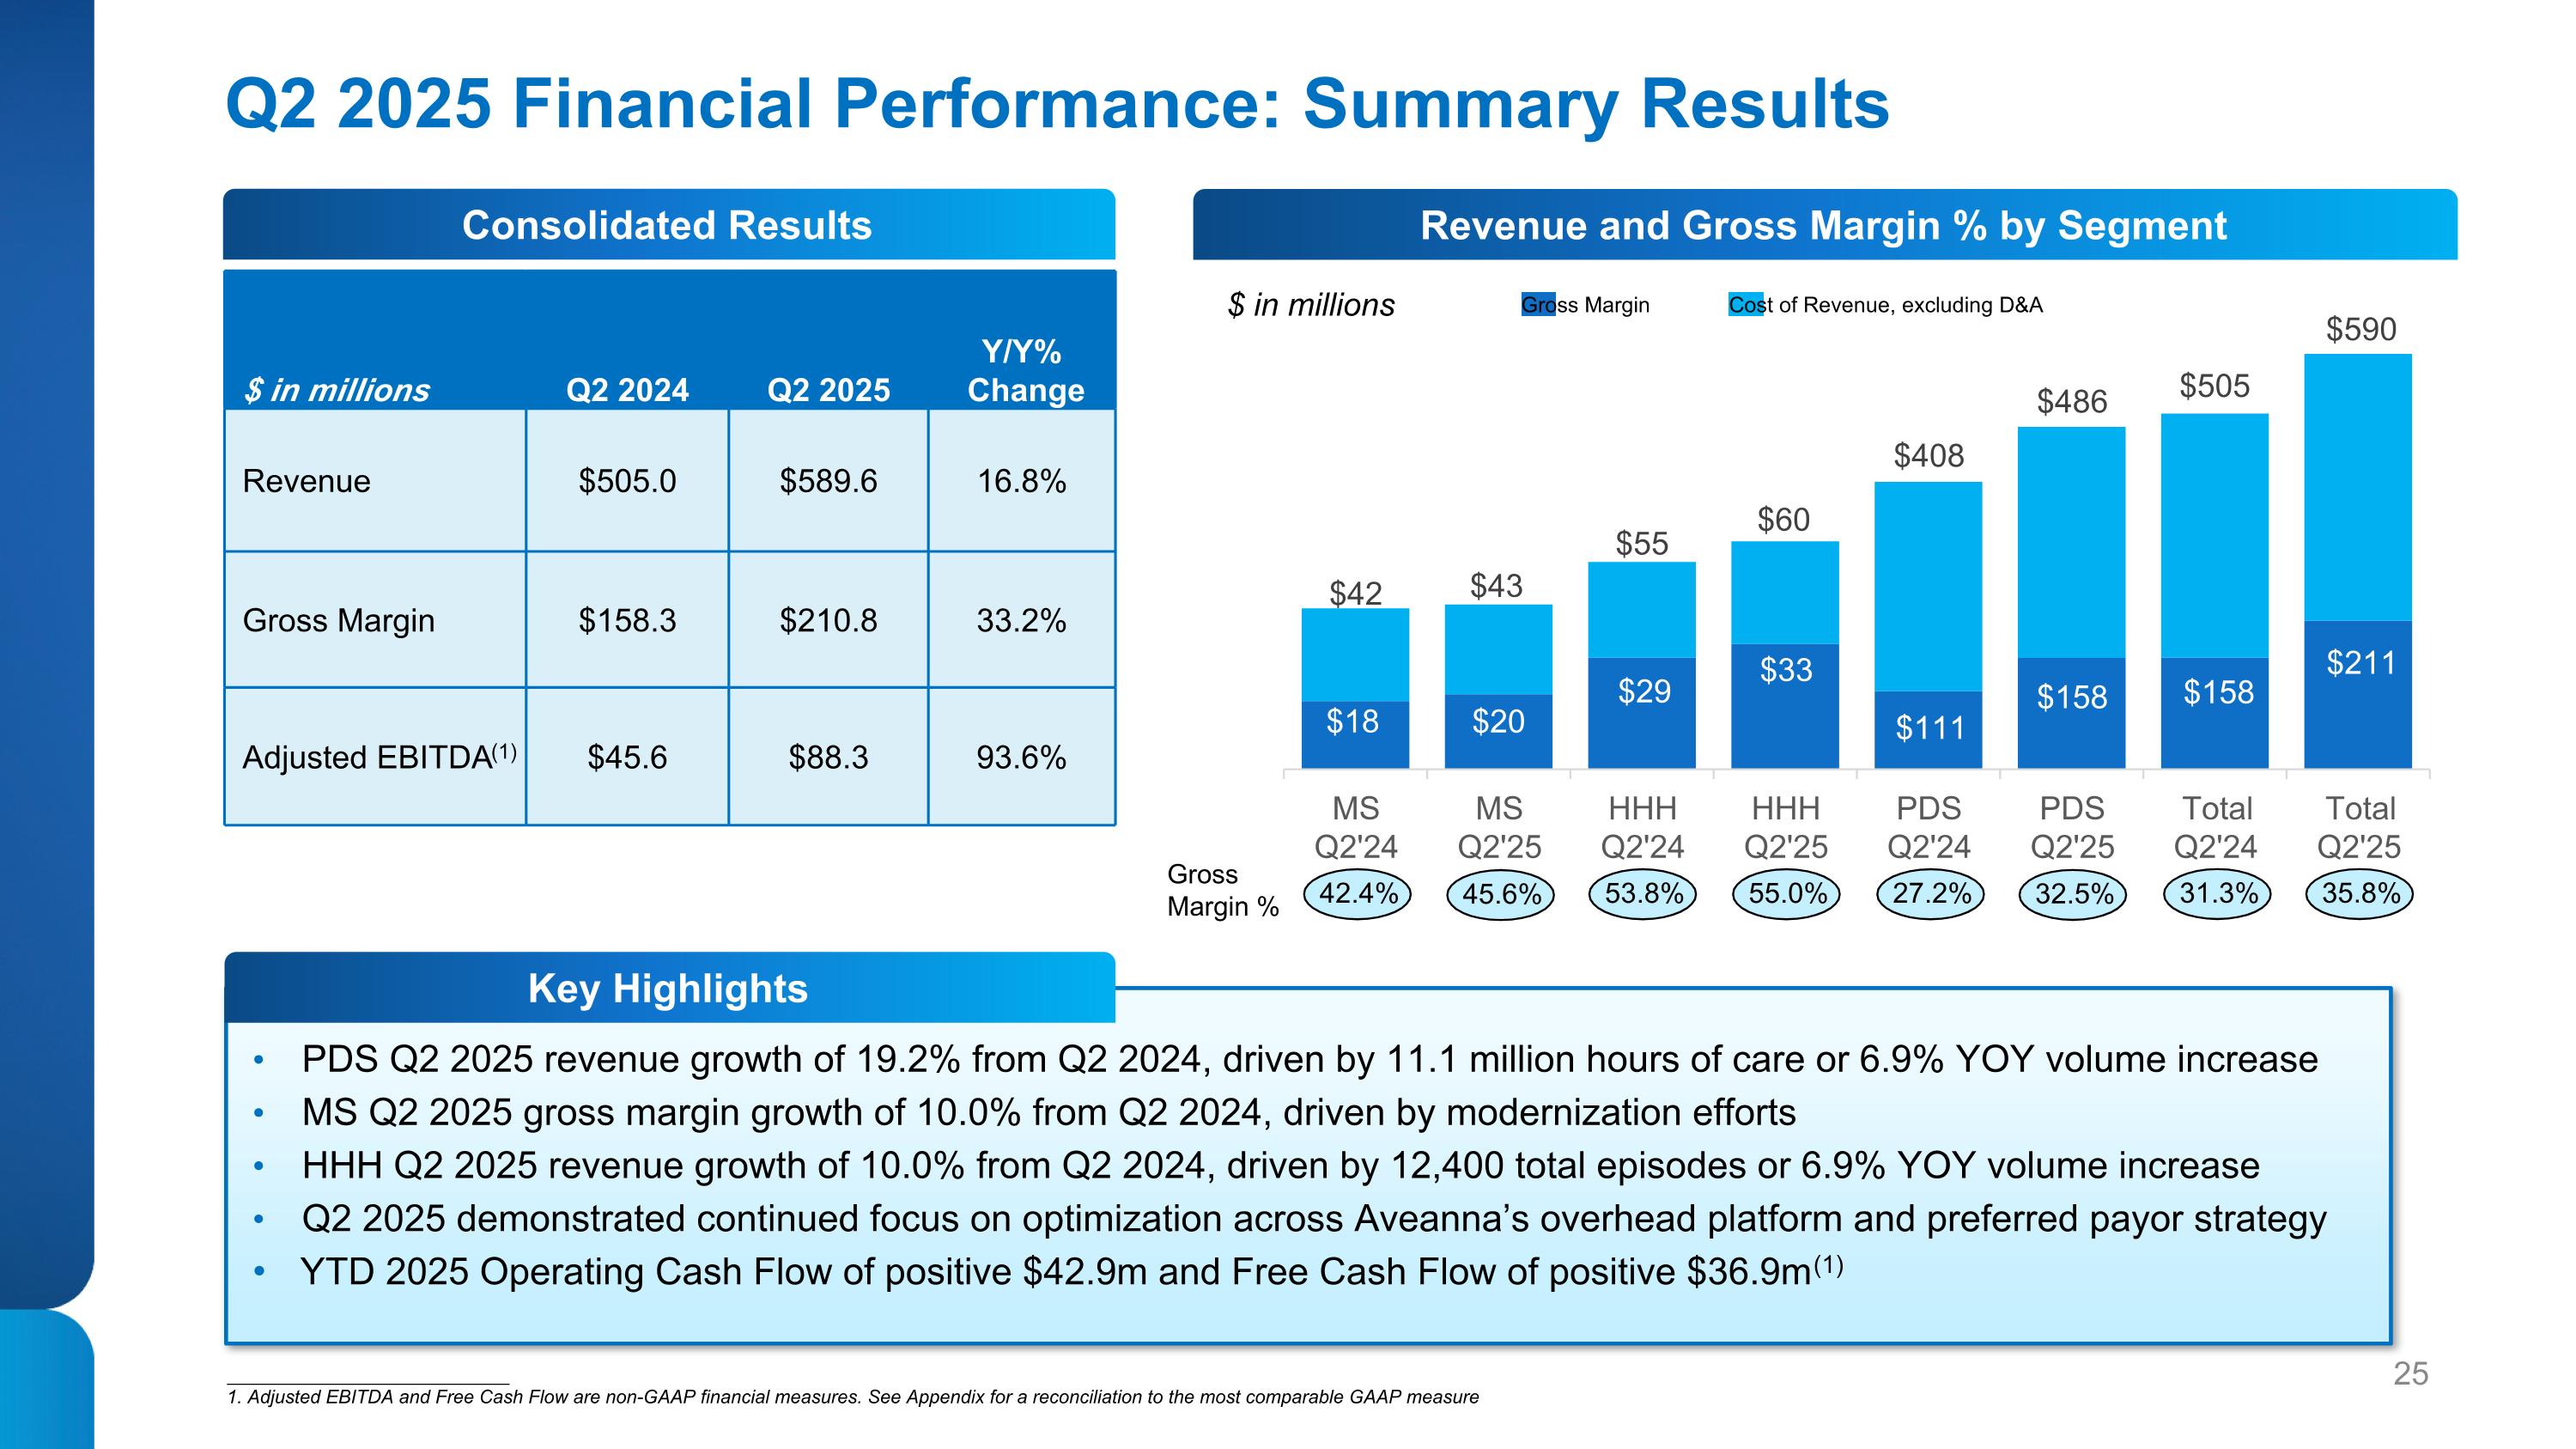
Q2 2025 Financial Performance: Summary Results PDS Q2 2025 revenue growth of 19.2% from Q2 2024, driven by 11.1 million hours of care or 6.9% YOY volume increase MS Q2 2025 gross margin growth of 10.0% from Q2 2024, driven by modernization efforts HHH Q2 2025 revenue growth of 10.0% from Q2 2024, driven by 12,400 total episodes or 6.9% YOY volume increase Q2 2025 demonstrated continued focus on optimization across Aveanna’s overhead platform and preferred payor strategy YTD 2025 Operating Cash Flow of positive $42.9m and Free Cash Flow of positive $36.9m (1) $ in millions Q2 2024 Q2 2025 Y/Y% Change Revenue $505.0 $589.6 16.8% Gross Margin $158.3 $210.8 33.2% Adjusted EBITDA(1) $45.6 $88.3 93.6% 31.3% 35.8% 27.2% 32.5% 53.8% 55.0% 42.4% 45.6% Gross Margin % ___________________________ 1. Adjusted EBITDA and Free Cash Flow are non-GAAP financial measures. See Appendix for a reconciliation to the most comparable GAAP measure Consolidated Results Key Highlights Revenue and Gross Margin % by Segment $ in millions Gross Margin Cost of Revenue, excluding D&A
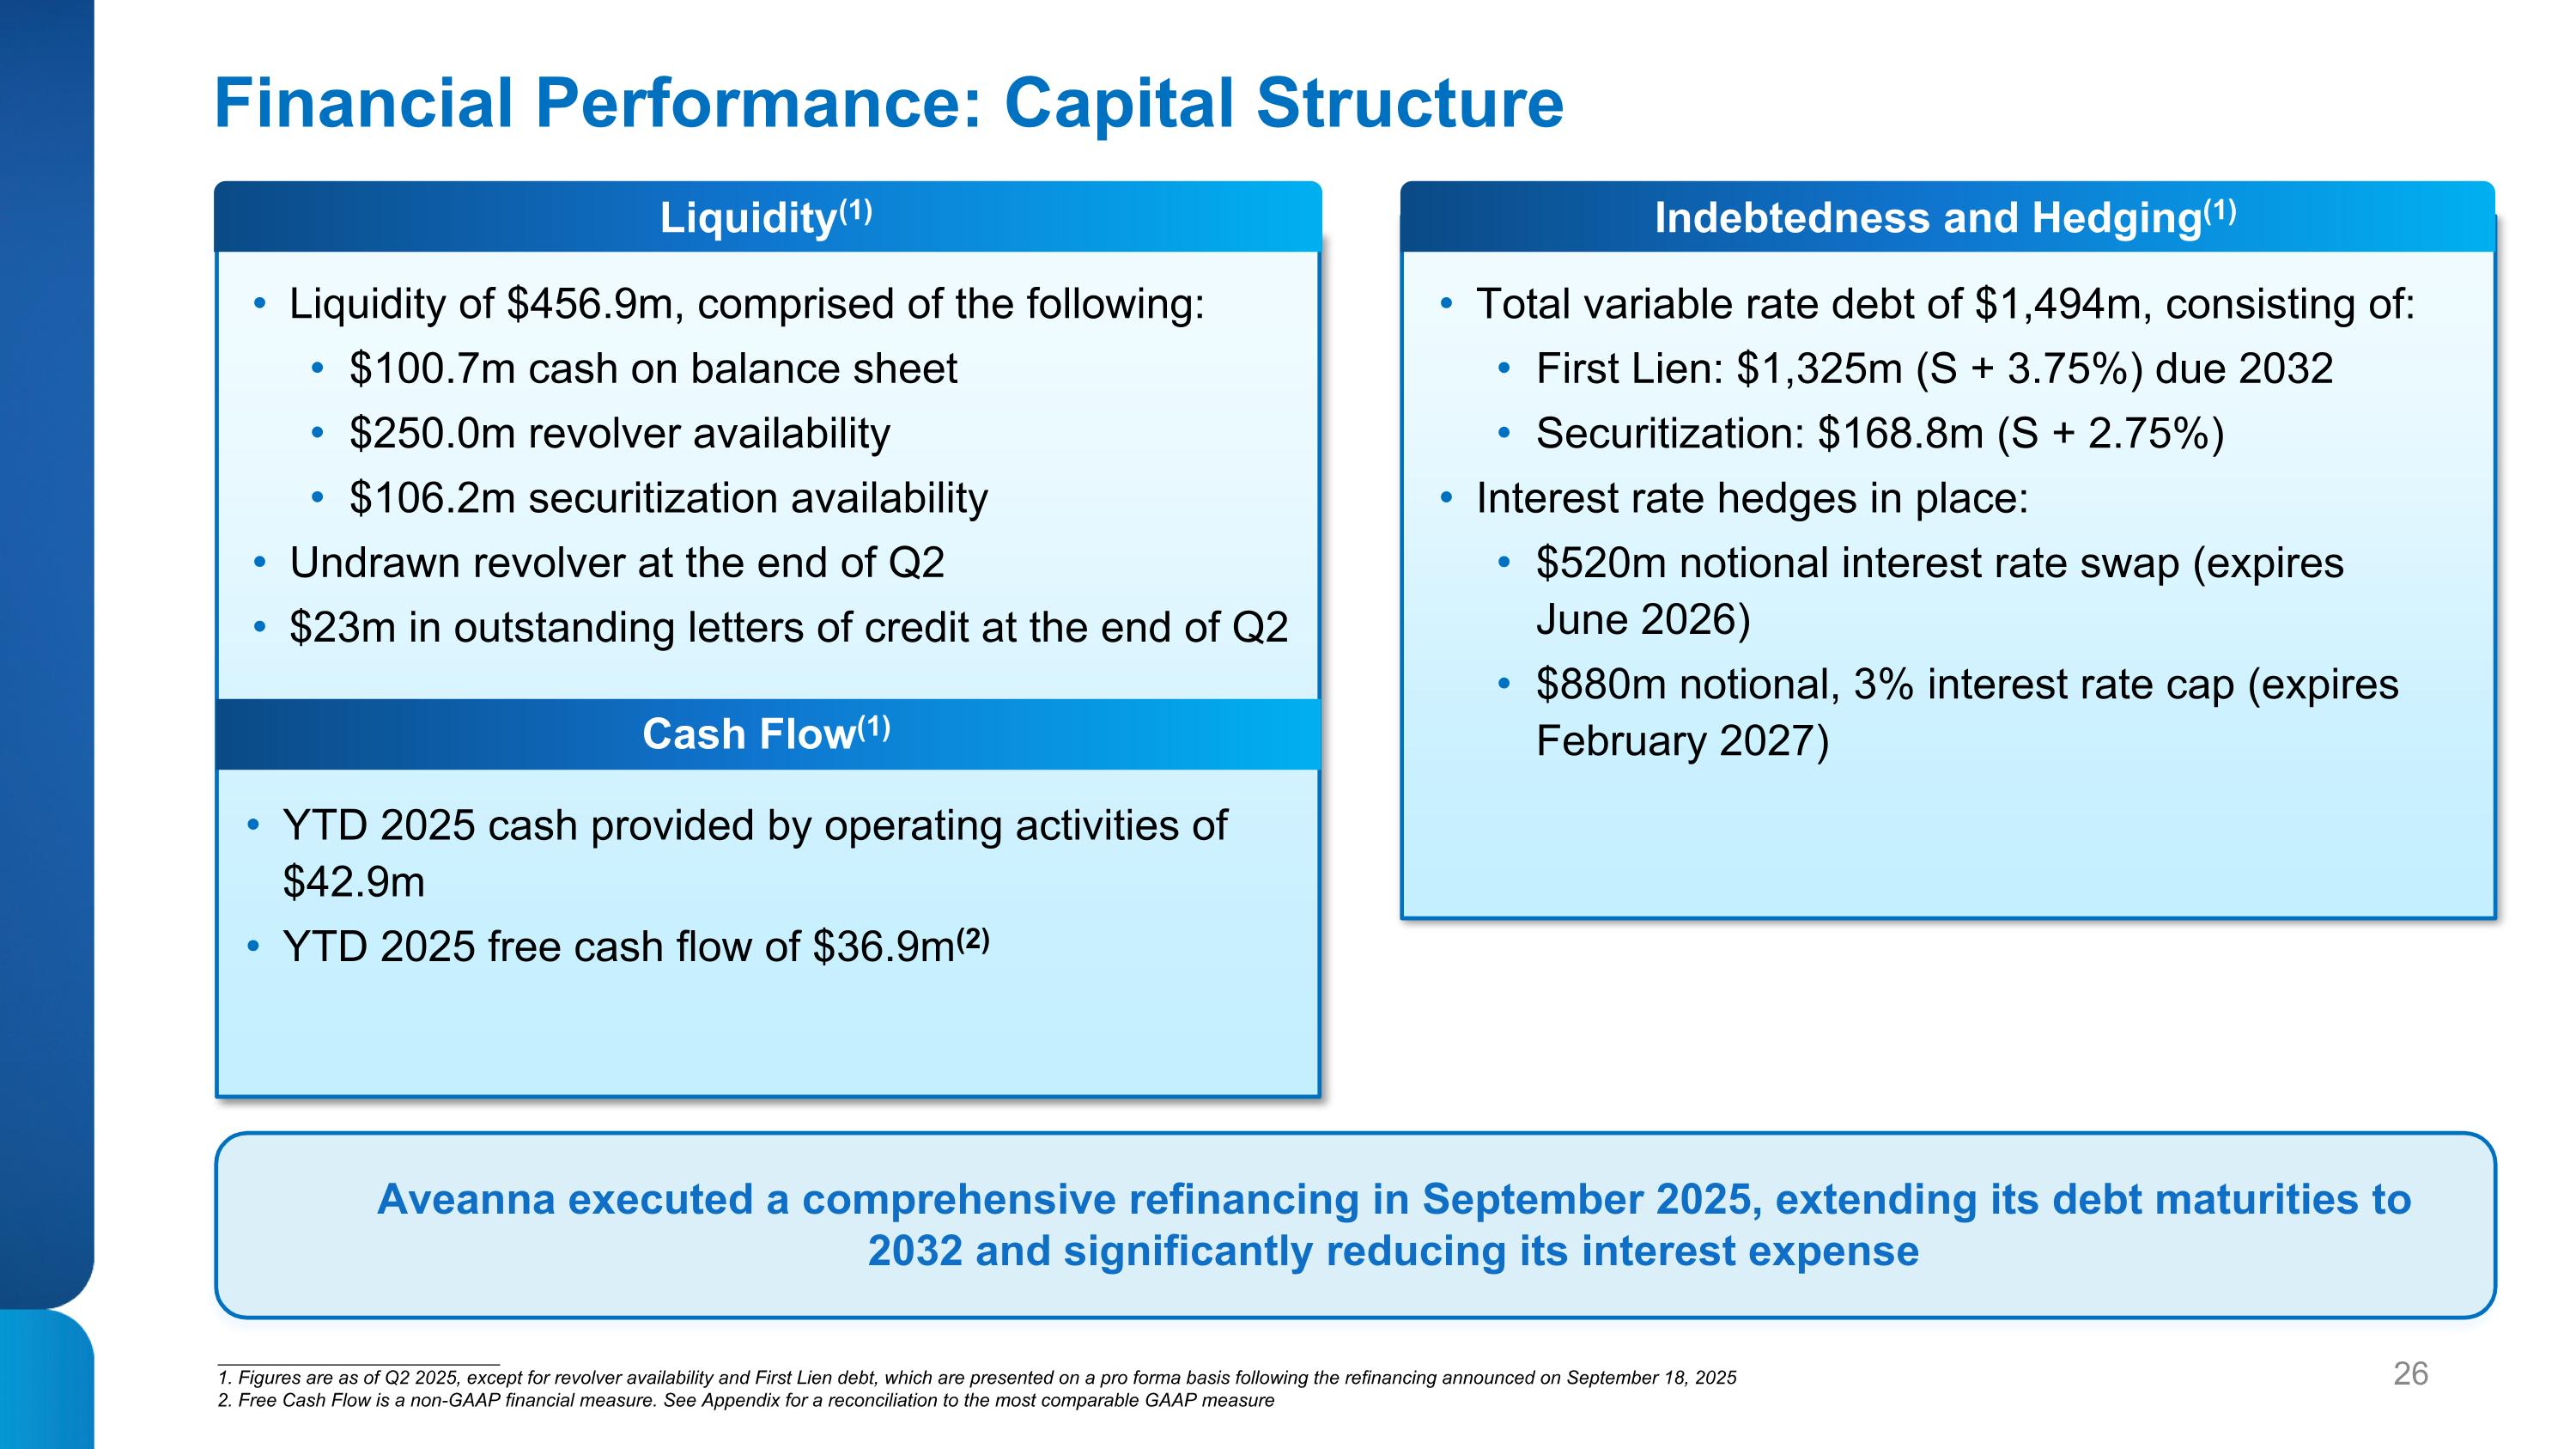
Financial Performance: Capital Structure Liquidity of $456.9m, comprised of the following: $100.7m cash on balance sheet $250.0m revolver availability $106.2m securitization availability Undrawn revolver at the end of Q2 $23m in outstanding letters of credit at the end of Q2 Total variable rate debt of $1,494m, consisting of: First Lien: $1,325m (S + 3.75%) due 2032 Securitization: $168.8m (S + 2.75%) Interest rate hedges in place: $520m notional interest rate swap (expires June 2026) $880m notional, 3% interest rate cap (expires February 2027) ___________________________ 1. Figures are as of Q2 2025, except for revolver availability and First Lien debt, which are presented on a pro forma basis following the refinancing announced on September 18, 2025 2. Free Cash Flow is a non-GAAP financial measure. See Appendix for a reconciliation to the most comparable GAAP measure YTD 2025 cash provided by operating activities of $42.9m YTD 2025 free cash flow of $36.9m(2) Liquidity(1) Cash Flow(1) Indebtedness and Hedging(1) Aveanna executed a comprehensive refinancing in September 2025, extending its debt maturities to 2032 and significantly reducing its interest expense

Path Forward: Strategic and Operational Focus on Driving Shareholder Value Value-based Growth Enhanced Capital Structure Core Organic Growth

IV. Appendix

Reconciliation of Net Income to Adjusted EBITDA ___________________________ 1-7 and A: Please see our financial filings (10K, 10Q) for 2023, 2024, and Q2 2025 for further description of the nature of these items

Net Leverage Reconciliation
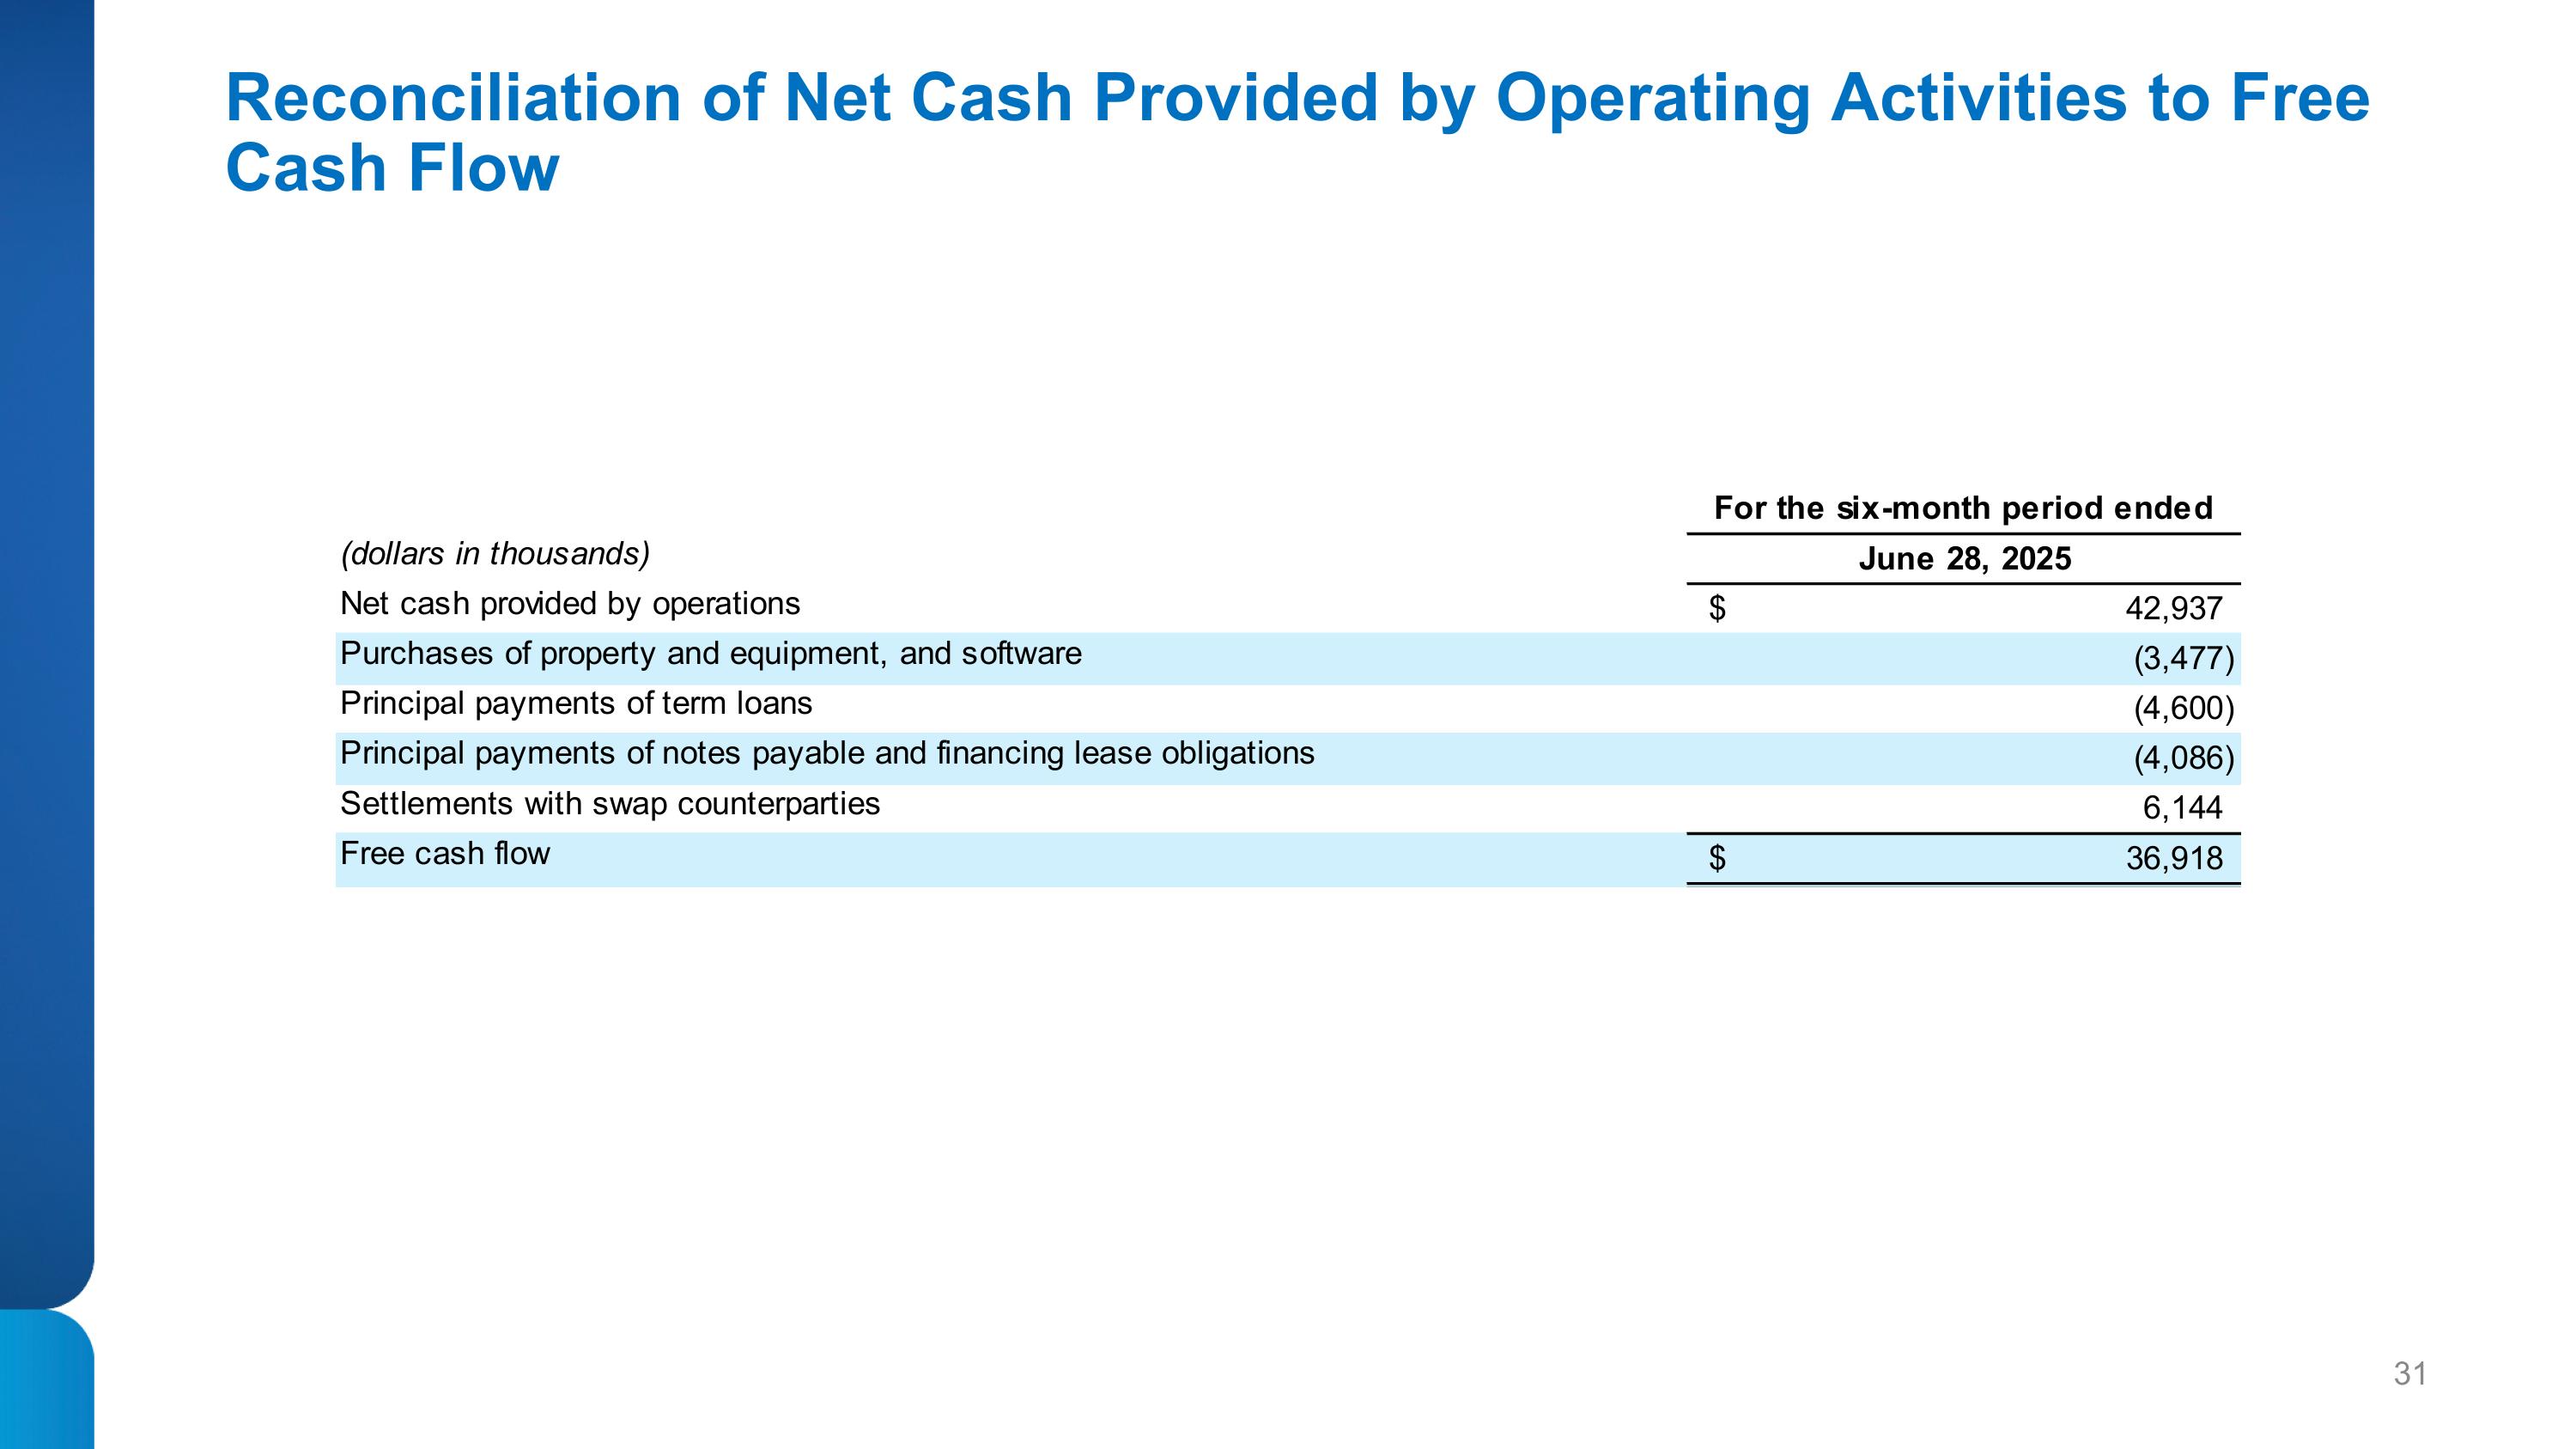
Reconciliation of Net Cash Provided by Operating Activities to Free Cash Flow