
1JanusIntl.com Presented by: JanusIntl.com THIRD QUARTER 2025 EARNINGS PRESENTATION Nov mber 6, 2025
2JanusIntl.com Forward-Looking Statements Certain statements in this communication, including the estimated guidance provided under “2025 Guidance and Key Planning Assumptions”, “Long-Term Fundamentals and Investment Highlights”, and “Executing Against the Plan for Significant Value” herein, may be considered “forward-looking statements” within the meaning of Section 27A of the Securities Act of 1933, as amended, and Section 21E of the Securities Exchange Act of 1934, as amended. All statements other than statements of historical fact included in this communication are forward-looking statements, including, but not limited to statements regarding Janus’s belief regarding the demand outlook for Janus’s products and the strength of the industrials markets. When used in this communication, words such as “plan,” “believe,” “expect,” “anticipate,” “intend,” “outlook,” “estimate,” “forecast,” “project,” “continue,” “could,” “may,” “might,” “possible,” “potential,” “predict,” “should,” “would,” “will,” and other similar words and expressions or the negative of such terms or other similar expressions, as they relate to the management team, identify forward-looking statements. The forward-looking statements contained in this communication are based on our current expectations and beliefs concerning future developments and their potential effects on us. We cannot assure you that future developments affecting us will be those that we have anticipated. These forward-looking statements involve a number of risks, uncertainties (some of which are beyond our control) or other assumptions that may cause actual results or performance to be materially different from those expressed or implied by these forward-looking statements. Should one or more of these risks or uncertainties materialize, or should any of our assumptions prove incorrect, actual results may vary in material respects from those projected in these forward-looking statements. Some factors that could cause actual results to differ include, but are not limited to: (i) risks of the self-storage industry; (ii) the highly competitive nature of the self-storage industry and Janus’s ability to compete therein; (iii) litigation, complaints, and/or adverse publicity; (iv) risks from tariffs; (v) cyber incidents or directed attacks that could result in information theft, data corruption, operational disruption and/or financial loss; (vi) the risk that our share repurchase program will be fully consummated or that it will enhance shareholder value; and (vii) the risk that the demand outlook for Janus’s products may not be as strong as anticipated. There can be no assurance that the events, results, trends or guidance regarding financial outlook identified in these forward-looking statements will occur or be achieved. Forward-looking statements speak only as of the date they are made, and Janus is not under any obligation and expressly disclaims any obligation, to update, alter or otherwise revise any forward-looking statement, whether as a result of new information, future events or otherwise, except as required by law. This communication is not intended to be all-inclusive or to contain all the information that a person may desire in considering an investment in Janus and is not intended to form the basis of an investment decision in Janus. All subsequent written and oral forward-looking statements concerning Janus or other matters and attributable to Janus or any person acting on its behalf are expressly qualified in their entirety by the cautionary statements above and under the heading “Risk Factors” in Janus’s most recently filed Annual Report on Form 10-K and any subsequent Quarterly Report on Form 10-Q, as updated from time to time in amendments and its subsequent filings with the SEC. Non-GAAP Financial Measures Janus uses measures of performance that are not required by or presented in accordance with GAAP in the United States. Non-GAAP financial performance measures are used to supplement the financial information presented on a GAAP basis. These non-GAAP financial measures should not be considered in isolation or as a substitute for the relevant GAAP measures and should be read in conjunction with information presented on a GAAP basis. Please see Appendix, which includes definitions of non-GAAP measures and metrics used in this presentation and reconciliations of non-GAAP measures to the most directly comparable GAAP measure. Adjusted EBITDA, Adjusted Net Income, Adjusted Diluted EPS, Free Cash Flow, Free Cash Flow Conversion of Adjusted Net Income, and Net Leverage Ratio are non-GAAP financial measures used by Janus to evaluate its operating performance, generate future operating plans, and make strategic decisions, including those relating to operating expenses and the allocation of internal resources. Accordingly, Janus believes these non-GAAP financial measures provide useful information to investors and others in understanding and evaluating Janus’s operating results in the same manner as its management and board of directors and in comparison with Janus’s peer group companies. In addition, these non-GAAP financial measures provide useful measures for period-to-period comparisons of Janus’s business, as they remove the effect of certain non-recurring events and other non-recurring charges, such as acquisitions, and certain variable or non-recurring charges. Adjusted EBITDA is defined as net income excluding interest expense, income taxes, depreciation expense, amortization, and other non-operational, non-recurring items. Adjusted Net Income is defined as net income plus the corresponding tax-adjusted add-backs shown in the Adjusted EBITDA reconciliation. Please note that the Company has not provided the most directly comparable GAAP financial measure, or a quantitative reconciliation thereto, for the Adjusted EBITDA forward-looking guidance for 2025 included in this communication in reliance on the "unreasonable efforts" exception provided under Item 10(e)(1)(i)(B) of Regulation S-K. Providing the most directly comparable GAAP financial measure, or a quantitative reconciliation thereto, cannot be done without unreasonable effort due to the inherent uncertainty and difficulty in predicting certain non-cash, material and/or non-recurring expenses or benefits, legal settlements or other matters, and certain tax positions. Because these adjustments are inherently variable and uncertain and depend on various factors that are beyond the Company's control, the Company is also unable to predict their probable significance. The variability of these items could have an unpredictable, and potentially significant, impact on our future GAAP financial results. Adjusted EBITDA, Adjusted Net Income, Adjusted Diluted EPS, Free Cash Flow, Free Cash Flow Conversion of Adjusted Net Income, and Net Leverage Ratio should not be considered in isolation of, or as an alternative to, measures prepared in accordance with GAAP. There are a number of limitations related to the use of Adjusted EBITDA and Adjusted Net Income rather than net income (loss), which is the nearest GAAP equivalent of Adjusted EBITDA and Adjusted Net Income. These limitations include that the non-GAAP financial measures: exclude depreciation and amortization, and although these are non-cash expenses, the assets being depreciated may be replaced in the future; do not reflect interest expense, or the cash requirements necessary to service interest on debt, which reduces cash available; do not reflect the provision for or benefit from income tax that may result in payments that reduce cash available; exclude non-recurring items (i.e., the extinguishment of debt); and may not be comparable to similar non-GAAP financial measures used by other companies, because the expenses and other items that Janus excludes in the calculation of these non-GAAP financial measures may differ from the expenses and other items, if any, that other companies may exclude from these non-GAAP financial measures when they report their operating results. Because of these limitations, these non-GAAP financial measures should be considered along with other operating and financial performance measures presented in accordance with GAAP.

3JanusIntl.com Ramey Jackson Chief Executive Officer Business Overview & Market Update Anselm Wong Chief Financial Officer 3Q25 Financial Overview & Guidance Update Agenda
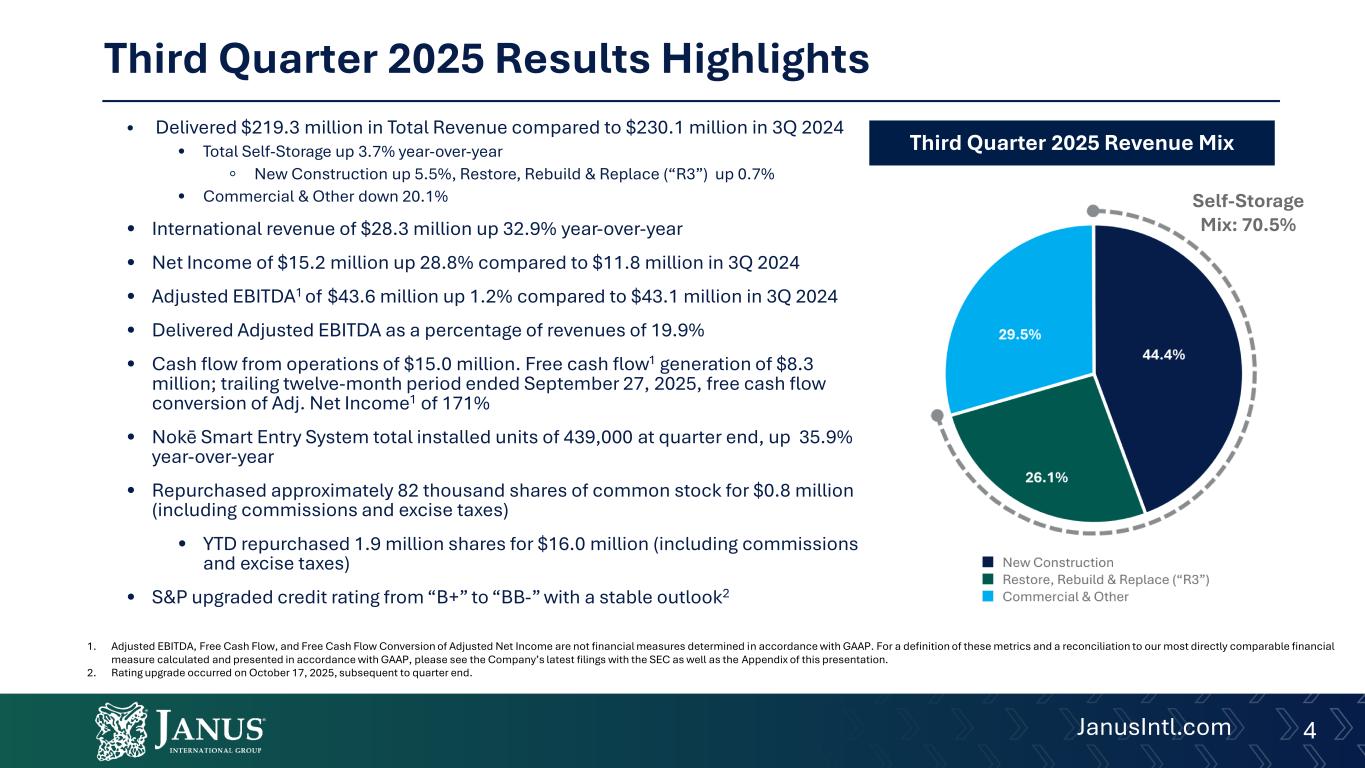
4JanusIntl.com Third Quarter 2025 Results Highlights • Delivered $219.3 million in Total Revenue compared to $230.1 million in 3Q 2024 • Total Self-Storage up 3.7% year-over-year ◦ New Construction up 5.5%, Restore, Rebuild & Replace (“R3”) up 0.7% • Commercial & Other down 20.1% • International revenue of $28.3 million up 32.9% year-over-year • Net Income of $15.2 million up 28.8% compared to $11.8 million in 3Q 2024 • Adjusted EBITDA1 of $43.6 million up 1.2% compared to $43.1 million in 3Q 2024 • Delivered Adjusted EBITDA as a percentage of revenues of 19.9% • Cash flow from operations of $15.0 million. Free cash flow1 generation of $8.3 million; trailing twelve-month period ended September 27, 2025, free cash flow conversion of Adj. Net Income1 of 171% • Nokē Smart Entry System total installed units of 439,000 at quarter end, up 35.9% year-over-year • Repurchased approximately 82 thousand shares of common stock for $0.8 million (including commissions and excise taxes) • YTD repurchased 1.9 million shares for $16.0 million (including commissions and excise taxes) • S&P upgraded credit rating from “B+” to “BB-” with a stable outlook2 Third Quarter 2025 Revenue Mix Self-Storage Mix: 70.5% 1. Adjusted EBITDA, Free Cash Flow, and Free Cash Flow Conversion of Adjusted Net Income are not financial measures determined in accordance with GAAP. For a definition of these metrics and a reconciliation to our most directly comparable financial measure calculated and presented in accordance with GAAP, please see the Company’s latest filings with the SEC as well as the Appendix of this presentation. 2. Rating upgrade occurred on October 17, 2025, subsequent to quarter end.
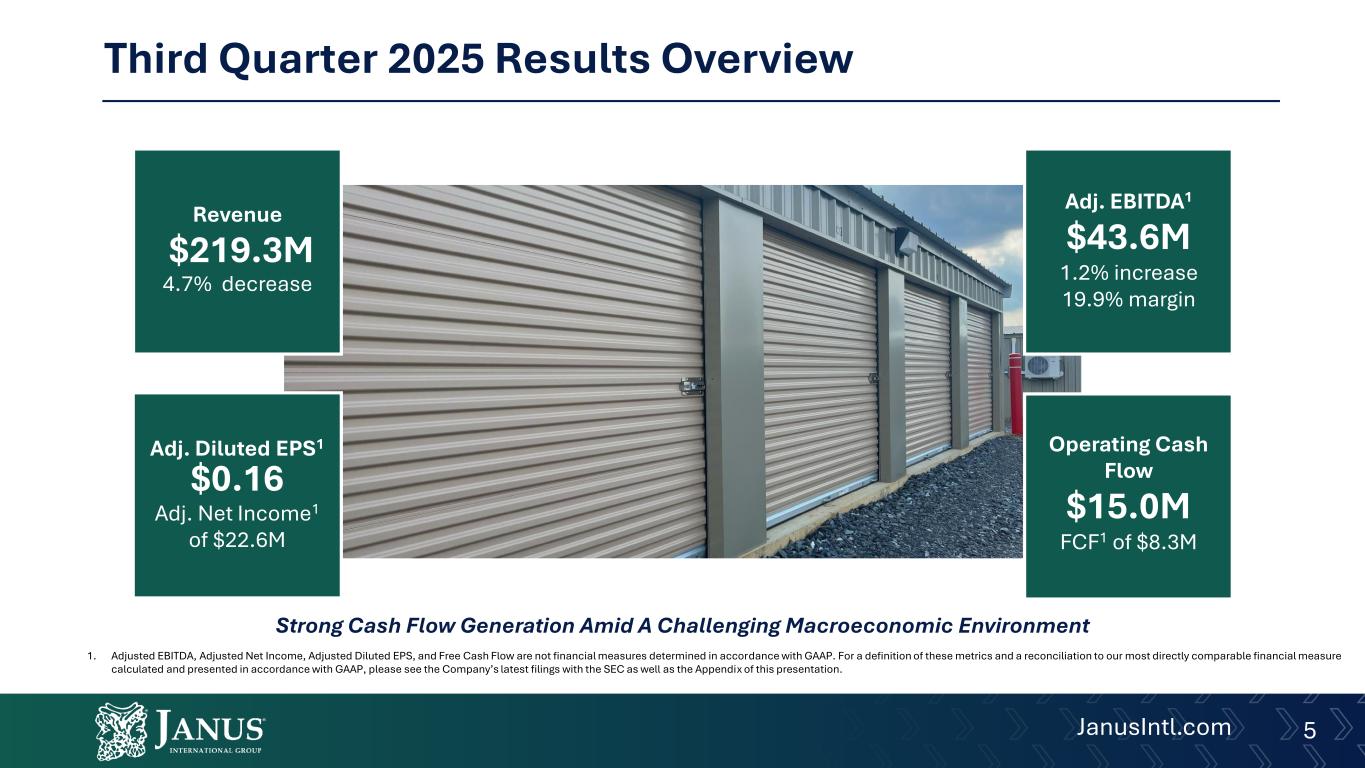
5JanusIntl.com Third Quarter 2025 Results Overview 1. Adjusted EBITDA, Adjusted Net Income, Adjusted Diluted EPS, and Free Cash Flow are not financial measures determined in accordance with GAAP. For a definition of these metrics and a reconciliation to our most directly comparable financial measure calculated and presented in accordance with GAAP, please see the Company’s latest filings with the SEC as well as the Appendix of this presentation. Adj. EBITDA1 $43.6M 1.2% increase 19.9% margin Revenue $219.3M 4.7% decrease Adj. Diluted EPS1 $0.16 Adj. Net Income1 of $22.6M Operating Cash Flow $15.0M FCF1 of $8.3M Strong Cash Flow Generation Amid A Challenging Macroeconomic Environment
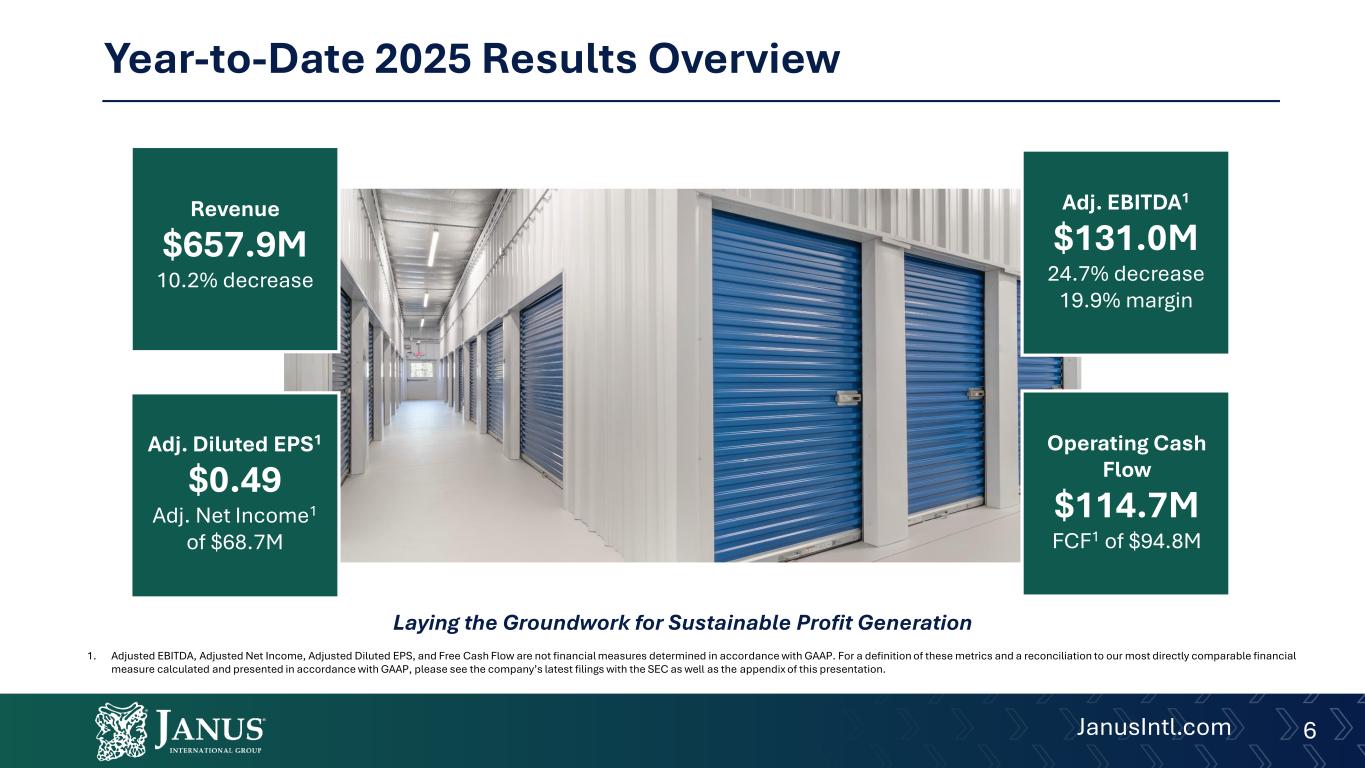
6JanusIntl.com Year-to-Date 2025 Results Overview Adj. EBITDA1 $131.0M 24.7% decrease 19.9% margin Revenue $657.9M 10.2% decrease Adj. Diluted EPS1 $0.49 Adj. Net Income1 of $68.7M Operating Cash Flow $114.7M FCF1 of $94.8M 1. Adjusted EBITDA, Adjusted Net Income, Adjusted Diluted EPS, and Free Cash Flow are not financial measures determined in accordance with GAAP. For a definition of these metrics and a reconciliation to our most directly comparable financial measure calculated and presented in accordance with GAAP, please see the company’s latest filings with the SEC as well as the appendix of this presentation. Laying the Groundwork for Sustainable Profit Generation
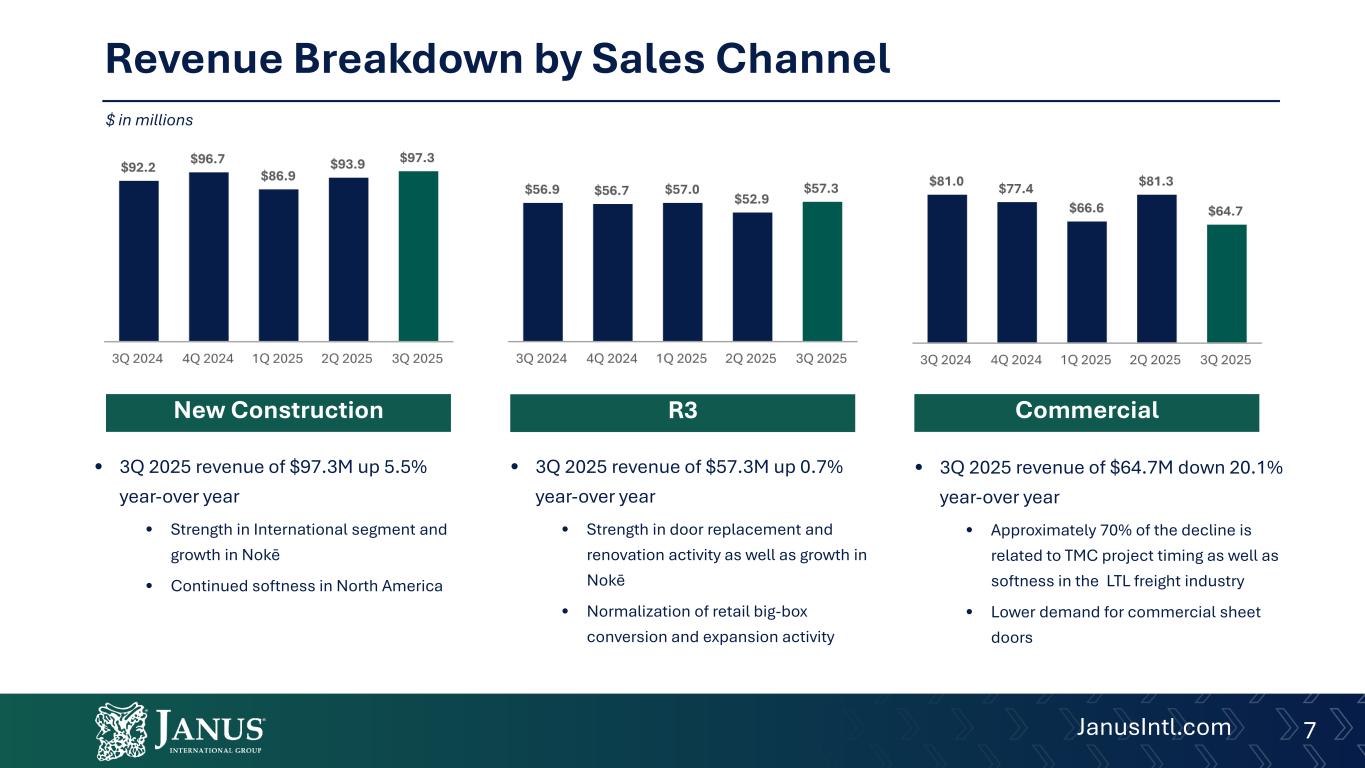
7JanusIntl.com Revenue Breakdown by Sales Channel New Construction R3 Commercial • 3Q 2025 revenue of $97.3M up 5.5% year-over year • Strength in International segment and growth in Nokē • Continued softness in North America • 3Q 2025 revenue of $57.3M up 0.7% year-over year • Strength in door replacement and renovation activity as well as growth in Nokē • Normalization of retail big-box conversion and expansion activity • 3Q 2025 revenue of $64.7M down 20.1% year-over year • Approximately 70% of the decline is related to TMC project timing as well as softness in the LTL freight industry • Lower demand for commercial sheet doors $ in millions
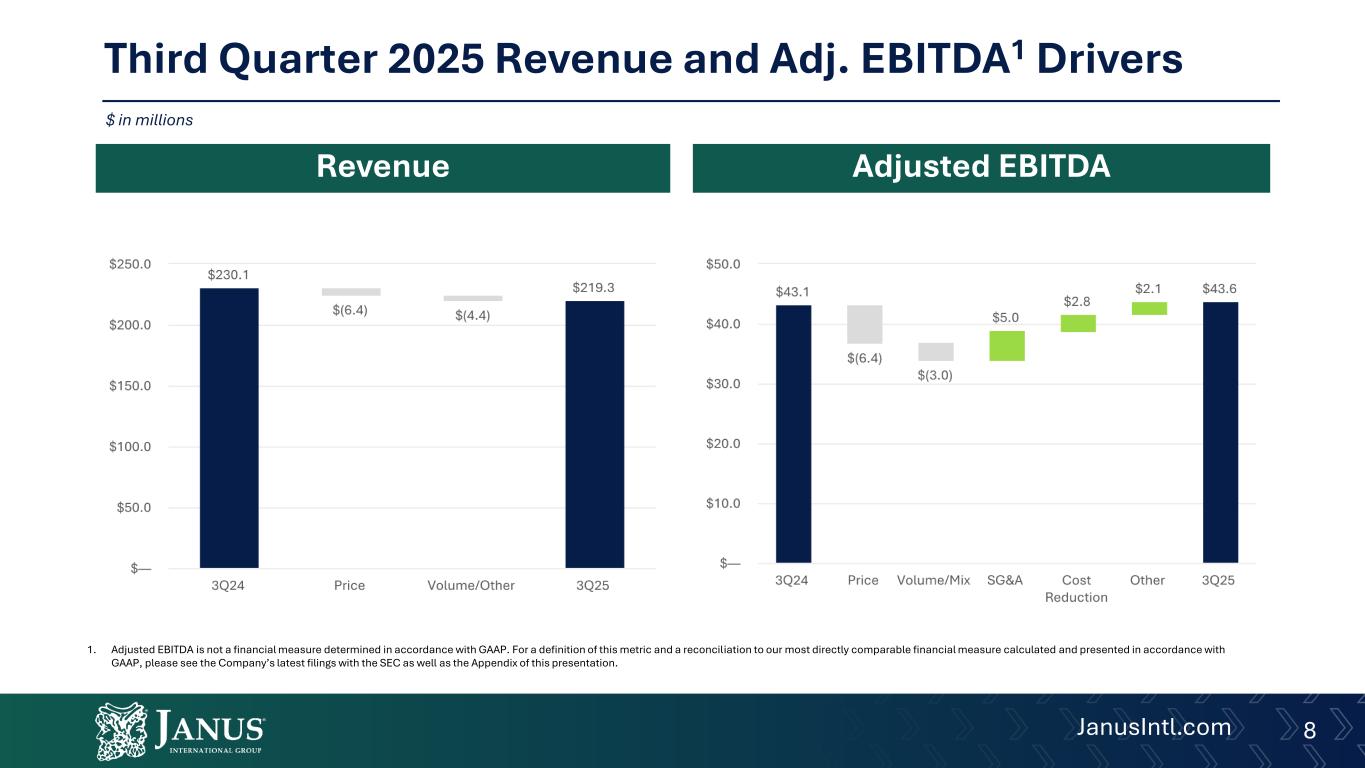
8JanusIntl.com Third Quarter 2025 Revenue and Adj. EBITDA1 Drivers Revenue Adjusted EBITDA 1. Adjusted EBITDA is not a financial measure determined in accordance with GAAP. For a definition of this metric and a reconciliation to our most directly comparable financial measure calculated and presented in accordance with GAAP, please see the Company’s latest filings with the SEC as well as the Appendix of this presentation. $ in millions
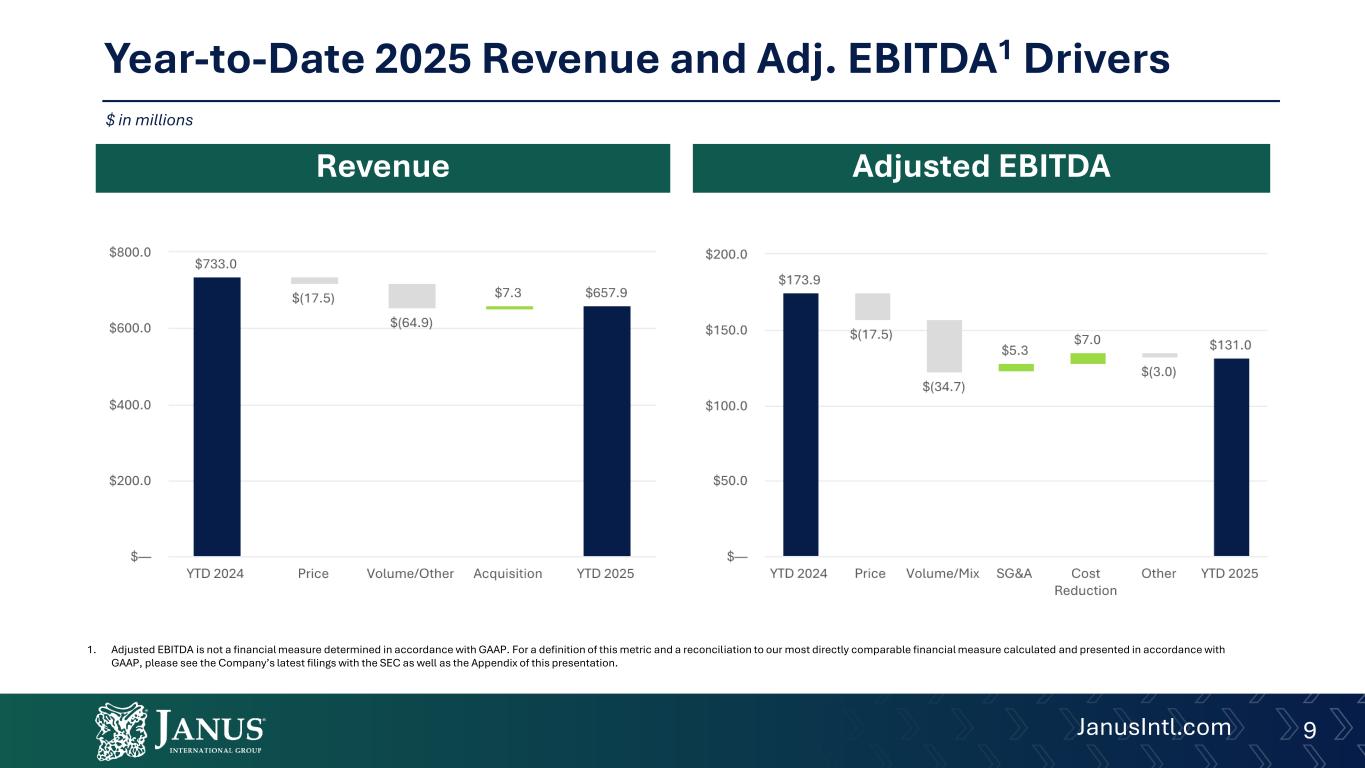
9JanusIntl.com Year-to-Date 2025 Revenue and Adj. EBITDA1 Drivers Revenue Adjusted EBITDA 1. Adjusted EBITDA is not a financial measure determined in accordance with GAAP. For a definition of this metric and a reconciliation to our most directly comparable financial measure calculated and presented in accordance with GAAP, please see the Company’s latest filings with the SEC as well as the Appendix of this presentation. $ in millions
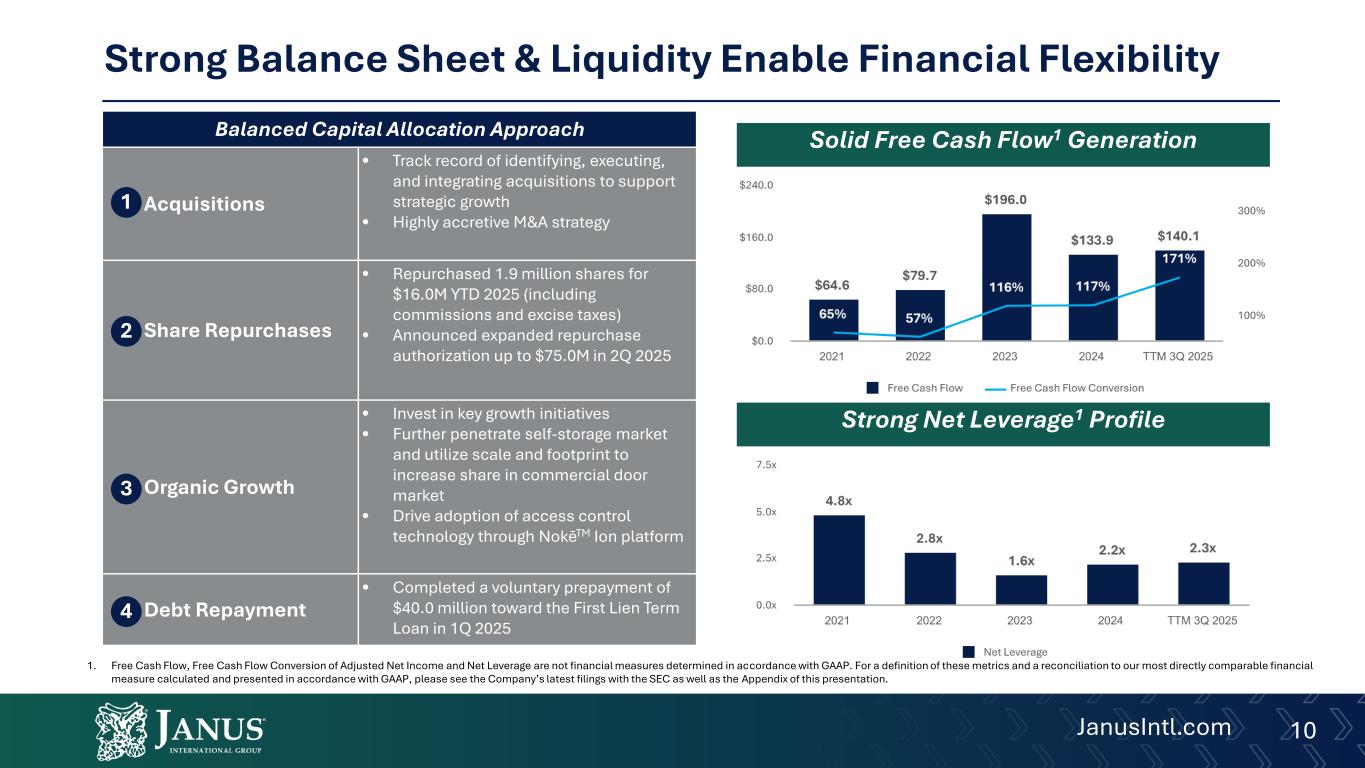
10JanusIntl.com Strong Balance Sheet & Liquidity Enable Financial Flexibility Balanced Capital Allocation Approach Acquisitions • Track record of identifying, executing, and integrating acquisitions to support strategic growth • Highly accretive M&A strategy Share Repurchases • Repurchased 1.9 million shares for $16.0M YTD 2025 (including commissions and excise taxes) • Announced expanded repurchase authorization up to $75.0M in 2Q 2025 Organic Growth • Invest in key growth initiatives • Further penetrate self-storage market and utilize scale and footprint to increase share in commercial door market • Drive adoption of access control technology through NokēTM Ion platform Debt Repayment • Completed a voluntary prepayment of $40.0 million toward the First Lien Term Loan in 1Q 2025 2 1 3 4 Solid Free Cash Flow1 Generation Strong Net Leverage1 Profile 1. Free Cash Flow, Free Cash Flow Conversion of Adjusted Net Income and Net Leverage are not financial measures determined in accordance with GAAP. For a definition of these metrics and a reconciliation to our most directly comparable financial measure calculated and presented in accordance with GAAP, please see the Company’s latest filings with the SEC as well as the Appendix of this presentation.
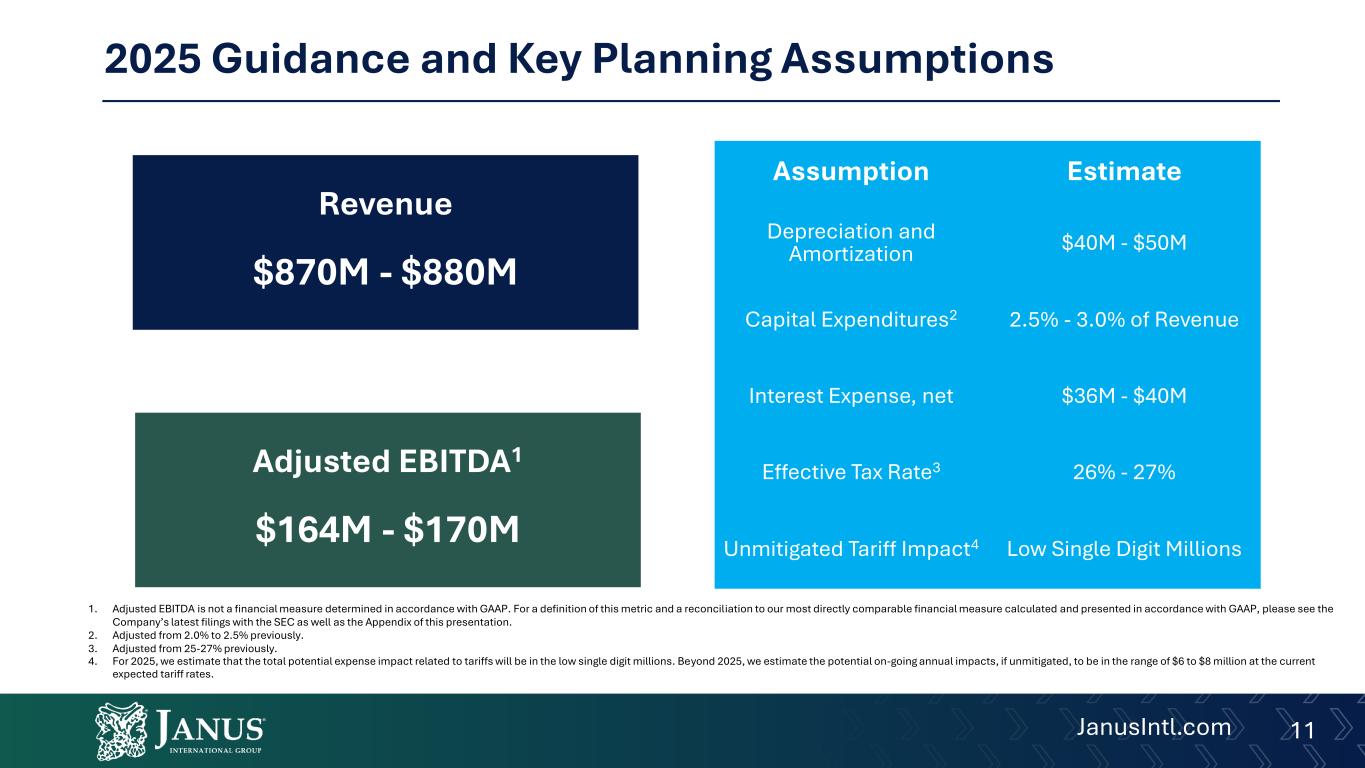
11JanusIntl.com Revenue $870M - $880M Adjusted EBITDA1 $164M - $170M Assumption Estimate Depreciation and Amortization $40M - $50M Capital Expenditures2 2.5% - 3.0% of Revenue Interest Expense, net $36M - $40M Effective Tax Rate3 26% - 27% Unmitigated Tariff Impact4 Low Single Digit Millions 1. Adjusted EBITDA is not a financial measure determined in accordance with GAAP. For a definition of this metric and a reconciliation to our most directly comparable financial measure calculated and presented in accordance with GAAP, please see the Company’s latest filings with the SEC as well as the Appendix of this presentation. 2. Adjusted from 2.0% to 2.5% previously. 3. Adjusted from 25-27% previously. 4. For 2025, we estimate that the total potential expense impact related to tariffs will be in the low single digit millions. Beyond 2025, we estimate the potential on-going annual impacts, if unmitigated, to be in the range of $6 to $8 million at the current expected tariff rates. 2025 Guidance and Key Planning Assumptions
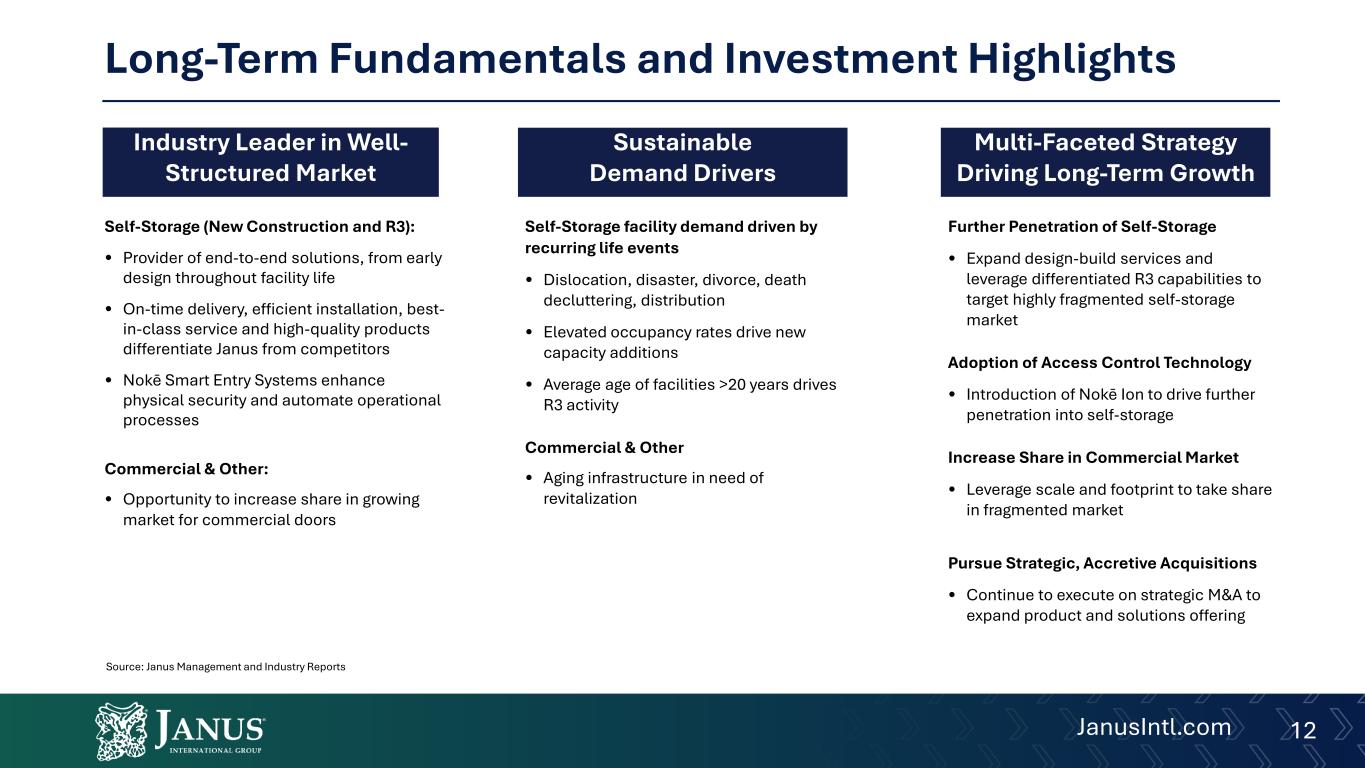
12JanusIntl.com Long-Term Fundamentals and Investment Highlights Industry Leader in Well- Structured Market Sustainable Demand Drivers Self-Storage facility demand driven by recurring life events • Dislocation, disaster, divorce, death decluttering, distribution • Elevated occupancy rates drive new capacity additions • Average age of facilities >20 years drives R3 activity Commercial & Other • Aging infrastructure in need of revitalization Self-Storage (New Construction and R3): • Provider of end-to-end solutions, from early design throughout facility life • On-time delivery, efficient installation, best- in-class service and high-quality products differentiate Janus from competitors • Nokē Smart Entry Systems enhance physical security and automate operational processes Commercial & Other: • Opportunity to increase share in growing market for commercial doors Multi-Faceted Strategy Driving Long-Term Growth Further Penetration of Self-Storage • Expand design-build services and leverage differentiated R3 capabilities to target highly fragmented self-storage market Adoption of Access Control Technology • Introduction of Nokē Ion to drive further penetration into self-storage Increase Share in Commercial Market • Leverage scale and footprint to take share in fragmented market Pursue Strategic, Accretive Acquisitions • Continue to execute on strategic M&A to expand product and solutions offering Source: Janus Management and Industry Reports

13JanusIntl.com Executing Against the Plan for Significant Value1 2.0x - 3.0x75% - 100% Cash Flow Generation (Long-Term Targets) Organic Revenue Growth (Long-Term Targets) • Strong organic growth trajectory • Leveraging end-market growth dynamics • Structural demand for self storage space not dependent on economic cycles • High occupancy rates drive new construction demand • Aging facilities and industry consolidation catalyze renovation (R3) activity • M&A investment provides additional upside to growth targets • Realizing benefits of structural resilience • Commercial actions • Flexible customer contract structuring to capture input cost cyclicality • Operating leverage on higher volume • Operational improvements and technology investments • Continued growth in Nokē contribution to results • Maintain strong conversion of Adjusted Net Income to Free Cash Flow • Tight working capital management • Low levels of maintenance capex • Significant balance sheet capacity enhances strategic flexibility • Maintain ratio within target range of 2.0x – 3.0x • Remain flexible for acquisitions, growth initiatives and value-enhancing investments Margin Expansion (Long-Term Targets) Annual Organic Revenue Growth Adjusted EBITDA2 Margin Free Cash Flow2 Conversion Net Leverage2 4% - 6% 25% - 27% 1. Figures in this slide represent the Company’s targets and no guarantee can be provided that these figures or other potential results discussed in this Slide will be achieved. See “Forward-Looking Statements.” 2. Adjusted EBITDA, Free Cash Flow Conversion of Adjusted Net Income and Net Leverage are not financial measures determined in accordance with GAAP. For a definition of this metric and a reconciliation to our most directly comparable financial measure calculated and presented in accordance with GAAP, please see the company’s latest filings with the SEC.

14JanusIntl.com APPENDIX
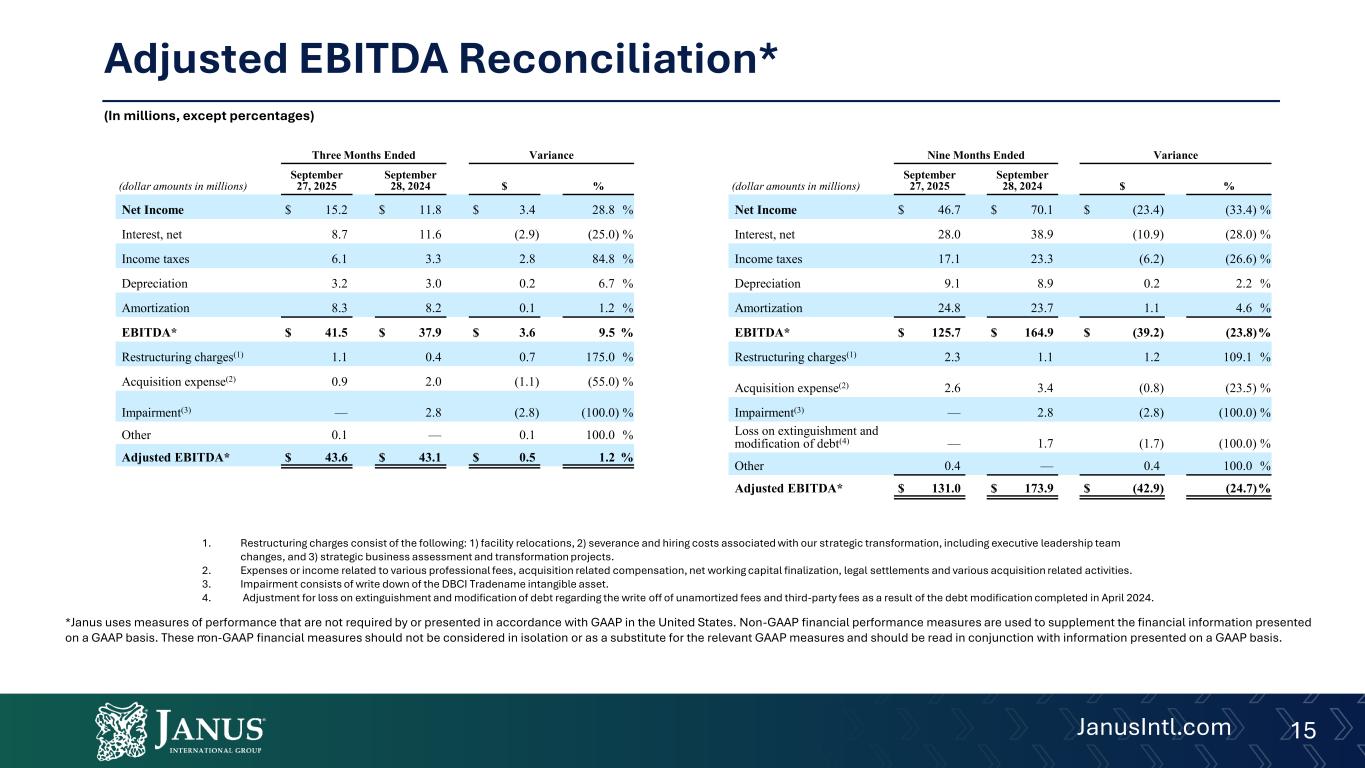
15JanusIntl.com Adjusted EBITDA Reconciliation* 1. Restructuring charges consist of the following: 1) facility relocations, 2) severance and hiring costs associated with our strategic transformation, including executive leadership team changes, and 3) strategic business assessment and transformation projects. 2. Expenses or income related to various professional fees, acquisition related compensation, net working capital finalization, legal settlements and various acquisition related activities. 3. Impairment consists of write down of the DBCI Tradename intangible asset. 4. Adjustment for loss on extinguishment and modification of debt regarding the write off of unamortized fees and third-party fees as a result of the debt modification completed in April 2024. . (In millions, except percentages) *Janus uses measures of performance that are not required by or presented in accordance with GAAP in the United States. Non-GAAP financial performance measures are used to supplement the financial information presented on a GAAP basis. These non-GAAP financial measures should not be considered in isolation or as a substitute for the relevant GAAP measures and should be read in conjunction with information presented on a GAAP basis. Three Months Ended Variance (dollar amounts in millions) September 27, 2025 September 28, 2024 $ % Net Income $ 15.2 $ 11.8 $ 3.4 28.8 % Interest, net 8.7 11.6 (2.9) (25.0) % Income taxes 6.1 3.3 2.8 84.8 % Depreciation 3.2 3.0 0.2 6.7 % Amortization 8.3 8.2 0.1 1.2 % EBITDA* $ 41.5 $ 37.9 $ 3.6 9.5 % Restructuring charges(1) 1.1 0.4 0.7 175.0 % Acquisition expense(2) 0.9 2.0 (1.1) (55.0) % Impairment(3) — 2.8 (2.8) (100.0) % Other 0.1 — 0.1 100.0 % Adjusted EBITDA* $ 43.6 $ 43.1 $ 0.5 1.2 % Nine Months Ended Variance (dollar amounts in millions) September 27, 2025 September 28, 2024 $ % Net Income $ 46.7 $ 70.1 $ (23.4) (33.4) % Interest, net 28.0 38.9 (10.9) (28.0) % Income taxes 17.1 23.3 (6.2) (26.6) % Depreciation 9.1 8.9 0.2 2.2 % Amortization 24.8 23.7 1.1 4.6 % EBITDA* $ 125.7 $ 164.9 $ (39.2) (23.8)% Restructuring charges(1) 2.3 1.1 1.2 109.1 % Acquisition expense(2) 2.6 3.4 (0.8) (23.5) % Impairment(3) — 2.8 (2.8) (100.0) % Loss on extinguishment and modification of debt(4) — 1.7 (1.7) (100.0) % Other 0.4 — 0.4 100.0 % Adjusted EBITDA* $ 131.0 $ 173.9 $ (42.9) (24.7)%

16JanusIntl.com Adjusted Net Income Reconciliation* (In millions, except percentages) Three Months Ended Nine Months Ended September 27, 2025 September 28, 2024 September 27, 2025 September 28, 2024 Net Income $ 15.2 $ 11.8 $ 46.7 $ 70.1 Net Income Adjustments(1) 2.1 5.2 5.3 9.0 Amortization 8.3 8.2 24.8 23.7 Tax Effect on Net Income Adjustments(2) (3.0) (2.9) (8.1) (8.1) Prior Year Adjustments(3) — — — (1.9) Non-GAAP Adjusted Net Income* $ 22.6 $ 22.3 $ 68.7 $ 92.8 1. Net Income Adjustments for the three month period ended September 27, 2025 include $1.1 of restructuring charges, $0.9 of acquisition expenses and $0.1 of other expenses. Net Income Adjustments for the nine month period ended September 27, 2025 include $2.6 of acquisition expenses, $2.3 of restructuring charges and $0.4 of other. Refer to the Adjusted EBITDA table above for further details. 2. The effective tax rates of 28.6% and 21.9% were used for the three month periods ended September 27, 2025 and September 28, 2024, respectively. The effective tax rates of 26.8% and 24.9% were used for the nine month periods ended September 27, 2025 and September 28, 2024, respectively. 3. Prior year adjustments for the nine month period ended September 28, 2024 include a $1.9 reduction in service cost of revenues, net of tax. . *Janus uses measures of performance that are not required by or presented in accordance with GAAP in the United States. Non-GAAP financial performance measures are used to supplement the financial information presented on a GAAP basis. These non-GAAP financial measures should not be considered in isolation or as a substitute for the relevant GAAP measures and should be read in conjunction with information presented on a GAAP basis.

17JanusIntl.com Non-GAAP Adjusted EPS* (In millions, except share and per share data) Three Months Ended Nine Months Ended September 27, 2025 September 28, 2024 September 27, 2025 September 28, 2024 Numerator: GAAP Net Income $ 15.2 $ 11.8 $ 46.7 $ 70.1 Non-GAAP Adjusted Net Income* $ 22.6 $ 22.3 $ 68.7 $ 92.8 Denominator: Weighted average number of shares: Basic 138,869,081 143,666,406 139,490,841 145,376,074 Adjustment for Dilutive Securities 566,297 614,846 412,480 544,789 Diluted 139,435,378 144,281,252 139,903,321 145,920,863 GAAP Basic EPS $ 0.11 $ 0.08 $ 0.33 $ 0.48 GAAP Diluted EPS $ 0.11 $ 0.08 $ 0.33 $ 0.48 Non-GAAP Adjusted Basic EPS* $ 0.16 $ 0.16 $ 0.49 $ 0.64 Non-GAAP Adjusted Diluted EPS* $ 0.16 $ 0.15 $ 0.49 $ 0.64 *Janus uses measures of performance that are not required by or presented in accordance with GAAP in the United States. Non-GAAP financial performance measures are used to supplement the financial information presented on a GAAP basis. These non-GAAP financial measures should not be considered in isolation or as a substitute for the relevant GAAP measures and should be read in conjunction with information presented on a GAAP basis.
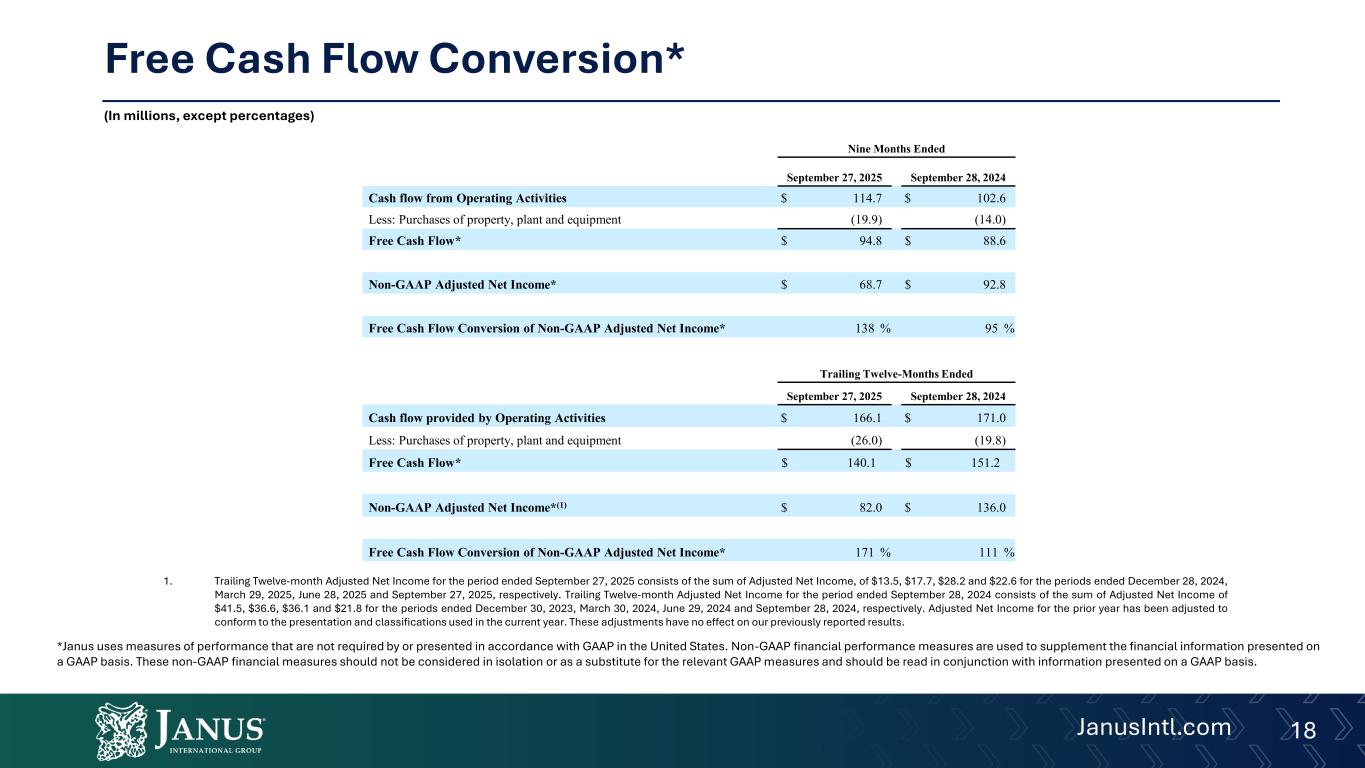
18JanusIntl.com Free Cash Flow Conversion* (In millions, except percentages) Nine Months Ended September 27, 2025 September 28, 2024 Cash flow from Operating Activities $ 114.7 $ 102.6 Less: Purchases of property, plant and equipment (19.9) (14.0) Free Cash Flow* $ 94.8 $ 88.6 Non-GAAP Adjusted Net Income* $ 68.7 $ 92.8 Free Cash Flow Conversion of Non-GAAP Adjusted Net Income* 138 % 95 % Trailing Twelve-Months Ended September 27, 2025 September 28, 2024 Cash flow provided by Operating Activities $ 166.1 $ 171.0 Less: Purchases of property, plant and equipment (26.0) (19.8) Free Cash Flow* $ 140.1 $ 151.2 Non-GAAP Adjusted Net Income*(1) $ 82.0 $ 136.0 Free Cash Flow Conversion of Non-GAAP Adjusted Net Income* 171 % 111 % *Janus uses measures of performance that are not required by or presented in accordance with GAAP in the United States. Non-GAAP financial performance measures are used to supplement the financial information presented on a GAAP basis. These non-GAAP financial measures should not be considered in isolation or as a substitute for the relevant GAAP measures and should be read in conjunction with information presented on a GAAP basis. 1. Trailing Twelve-month Adjusted Net Income for the period ended September 27, 2025 consists of the sum of Adjusted Net Income, of $13.5, $17.7, $28.2 and $22.6 for the periods ended December 28, 2024, March 29, 2025, June 28, 2025 and September 27, 2025, respectively. Trailing Twelve-month Adjusted Net Income for the period ended September 28, 2024 consists of the sum of Adjusted Net Income of $41.5, $36.6, $36.1 and $21.8 for the periods ended December 30, 2023, March 30, 2024, June 29, 2024 and September 28, 2024, respectively. Adjusted Net Income for the prior year has been adjusted to conform to the presentation and classifications used in the current year. These adjustments have no effect on our previously reported results.
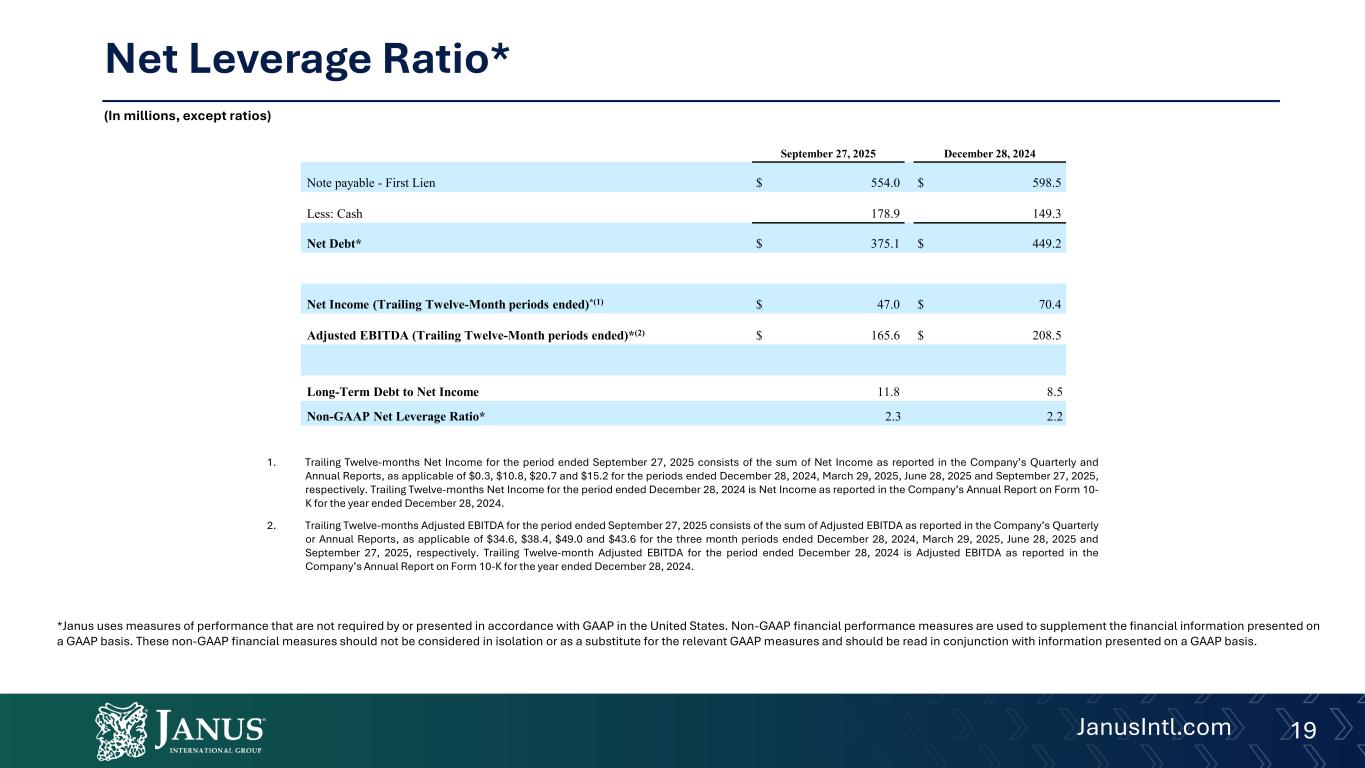
19JanusIntl.com Net Leverage Ratio* (In millions, except ratios) *Janus uses measures of performance that are not required by or presented in accordance with GAAP in the United States. Non-GAAP financial performance measures are used to supplement the financial information presented on a GAAP basis. These non-GAAP financial measures should not be considered in isolation or as a substitute for the relevant GAAP measures and should be read in conjunction with information presented on a GAAP basis. September 27, 2025 December 28, 2024 Note payable - First Lien $ 554.0 $ 598.5 Less: Cash 178.9 149.3 Net Debt* $ 375.1 $ 449.2 Net Income (Trailing Twelve-Month periods ended)*(1) $ 47.0 $ 70.4 Adjusted EBITDA (Trailing Twelve-Month periods ended)*(2) $ 165.6 $ 208.5 Long-Term Debt to Net Income 11.8 8.5 Non-GAAP Net Leverage Ratio* 2.3 2.2 1. Trailing Twelve-months Net Income for the period ended September 27, 2025 consists of the sum of Net Income as reported in the Company’s Quarterly and Annual Reports, as applicable of $0.3, $10.8, $20.7 and $15.2 for the periods ended December 28, 2024, March 29, 2025, June 28, 2025 and September 27, 2025, respectively. Trailing Twelve-months Net Income for the period ended December 28, 2024 is Net Income as reported in the Company’s Annual Report on Form 10- K for the year ended December 28, 2024. 2. Trailing Twelve-months Adjusted EBITDA for the period ended September 27, 2025 consists of the sum of Adjusted EBITDA as reported in the Company’s Quarterly or Annual Reports, as applicable of $34.6, $38.4, $49.0 and $43.6 for the three month periods ended December 28, 2024, March 29, 2025, June 28, 2025 and September 27, 2025, respectively. Trailing Twelve-month Adjusted EBITDA for the period ended December 28, 2024 is Adjusted EBITDA as reported in the Company’s Annual Report on Form 10-K for the year ended December 28, 2024.