0001840776FALSEFY202512/31P3YP1Yhttp://fasb.org/us-gaap/2025#OtherAssetshttp://fasb.org/us-gaap/2025#OtherAssetshttp://fasb.org/us-gaap/2025#OtherLiabilitiesNoncurrentP2Y142iso4217:USDxbrli:sharesiso4217:USDxbrli:sharesxbrli:purehgty:segmentshgty:borrowerhgty:claimhgty:letter_of_credithgty:consecutiveTradingDayhgty:vote00018407762025-01-012025-12-3100018407762025-06-300001840776us-gaap:CommonClassAMember2026-02-200001840776hgty:CommonClassVMember2026-02-200001840776hgty:CommissionRevenueAndFeeRevenueMember2025-01-012025-12-310001840776hgty:CommissionRevenueAndFeeRevenueMember2024-01-012024-12-310001840776hgty:CommissionRevenueAndFeeRevenueMember2023-01-012023-12-3100018407762024-01-012024-12-3100018407762023-01-012023-12-310001840776hgty:MembershipAndOtherRevenueMember2025-01-012025-12-310001840776hgty:MembershipAndOtherRevenueMember2024-01-012024-12-310001840776hgty:MembershipAndOtherRevenueMember2023-01-012023-12-310001840776us-gaap:CommonClassAMember2025-01-012025-12-310001840776us-gaap:CommonClassAMember2024-01-012024-12-310001840776us-gaap:CommonClassAMember2023-01-012023-12-3100018407762025-12-3100018407762024-12-310001840776us-gaap:CommonClassAMember2024-12-310001840776us-gaap:CommonClassAMember2025-12-310001840776hgty:CommonClassVMember2025-12-310001840776hgty:CommonClassVMember2024-12-310001840776us-gaap:SeriesAPreferredStockMemberus-gaap:PreferredStockMember2024-12-310001840776us-gaap:CommonClassAMemberus-gaap:CommonStockMember2024-12-310001840776hgty:CommonClassVMemberus-gaap:CommonStockMember2024-12-310001840776us-gaap:AdditionalPaidInCapitalMember2024-12-310001840776us-gaap:RetainedEarningsMember2024-12-310001840776us-gaap:AccumulatedOtherComprehensiveIncomeMember2024-12-310001840776us-gaap:ParentMember2024-12-310001840776us-gaap:NoncontrollingInterestMember2024-12-310001840776us-gaap:RetainedEarningsMember2025-01-012025-12-310001840776us-gaap:ParentMember2025-01-012025-12-310001840776us-gaap:NoncontrollingInterestMember2025-01-012025-12-310001840776us-gaap:SeriesAPreferredStockMemberus-gaap:PreferredStockMember2025-01-012025-12-310001840776us-gaap:AdditionalPaidInCapitalMember2025-01-012025-12-310001840776us-gaap:AccumulatedOtherComprehensiveIncomeMember2025-01-012025-12-310001840776us-gaap:CommonClassAMemberus-gaap:CommonStockMember2025-01-012025-12-310001840776hgty:CommonClassVMemberus-gaap:CommonStockMember2025-01-012025-12-310001840776us-gaap:SeriesAPreferredStockMemberus-gaap:PreferredStockMember2025-12-310001840776us-gaap:CommonClassAMemberus-gaap:CommonStockMember2025-12-310001840776hgty:CommonClassVMemberus-gaap:CommonStockMember2025-12-310001840776us-gaap:AdditionalPaidInCapitalMember2025-12-310001840776us-gaap:RetainedEarningsMember2025-12-310001840776us-gaap:AccumulatedOtherComprehensiveIncomeMember2025-12-310001840776us-gaap:ParentMember2025-12-310001840776us-gaap:NoncontrollingInterestMember2025-12-310001840776us-gaap:SeriesAPreferredStockMemberus-gaap:PreferredStockMember2023-12-310001840776us-gaap:CommonClassAMemberus-gaap:CommonStockMember2023-12-310001840776hgty:CommonClassVMemberus-gaap:CommonStockMember2023-12-310001840776us-gaap:AdditionalPaidInCapitalMember2023-12-310001840776us-gaap:RetainedEarningsMember2023-12-310001840776us-gaap:AccumulatedOtherComprehensiveIncomeMember2023-12-310001840776us-gaap:ParentMember2023-12-310001840776us-gaap:NoncontrollingInterestMember2023-12-3100018407762023-12-310001840776us-gaap:RetainedEarningsMember2024-01-012024-12-310001840776us-gaap:ParentMember2024-01-012024-12-310001840776us-gaap:NoncontrollingInterestMember2024-01-012024-12-310001840776us-gaap:SeriesAPreferredStockMemberus-gaap:PreferredStockMember2024-01-012024-12-310001840776us-gaap:AdditionalPaidInCapitalMember2024-01-012024-12-310001840776us-gaap:AccumulatedOtherComprehensiveIncomeMember2024-01-012024-12-310001840776us-gaap:CommonClassAMemberus-gaap:CommonStockMember2024-01-012024-12-310001840776us-gaap:SeriesAPreferredStockMemberus-gaap:PreferredStockMember2022-12-310001840776us-gaap:CommonClassAMemberus-gaap:CommonStockMember2022-12-310001840776hgty:CommonClassVMemberus-gaap:CommonStockMember2022-12-310001840776us-gaap:AdditionalPaidInCapitalMember2022-12-310001840776us-gaap:RetainedEarningsMember2022-12-310001840776us-gaap:AccumulatedOtherComprehensiveIncomeMember2022-12-310001840776us-gaap:ParentMember2022-12-310001840776us-gaap:NoncontrollingInterestMember2022-12-3100018407762022-12-310001840776us-gaap:RetainedEarningsMember2023-01-012023-12-310001840776us-gaap:ParentMember2023-01-012023-12-310001840776us-gaap:NoncontrollingInterestMember2023-01-012023-12-310001840776us-gaap:SeriesAPreferredStockMemberus-gaap:PreferredStockMember2023-01-012023-12-310001840776us-gaap:AdditionalPaidInCapitalMember2023-01-012023-12-310001840776us-gaap:AccumulatedOtherComprehensiveIncomeMember2023-01-012023-12-310001840776us-gaap:CommonClassAMemberus-gaap:CommonStockMember2023-01-012023-12-310001840776hgty:HagertyReinsuranceLimitedMembersrt:MinimumMember2025-01-012025-12-310001840776hgty:HagertyReinsuranceLimitedMembersrt:MaximumMember2025-01-012025-12-310001840776hgty:HagertyReinsuranceLimitedMember2025-01-012025-12-310001840776srt:RevisionOfPriorPeriodReclassificationAdjustmentMember2024-01-012024-12-310001840776srt:RevisionOfPriorPeriodReclassificationAdjustmentMember2023-01-012023-12-310001840776hgty:TheHagertyGroupLLCMember2025-01-012025-12-310001840776hgty:TheHagertyGroupLLCMember2024-01-012024-12-310001840776srt:MinimumMemberus-gaap:ComputerEquipmentMember2025-12-310001840776srt:MaximumMemberus-gaap:AutomobilesMember2025-12-310001840776us-gaap:BuildingAndBuildingImprovementsMember2025-12-310001840776srt:MinimumMember2025-12-310001840776srt:MaximumMember2025-12-310001840776hgty:SpeedDigitalAndBroadArrowMember2025-12-310001840776us-gaap:CustomerConcentrationRiskMemberhgty:TheHagertyGroupLLCMemberus-gaap:SalesRevenueNetMember2025-01-012025-12-310001840776us-gaap:ShortTermContractWithCustomerMember2025-01-012025-12-310001840776hgty:LaborAndRelatedExpenseMemberMember2025-01-012025-12-310001840776hgty:LaborAndRelatedExpenseMemberMember2024-01-012024-12-310001840776hgty:LaborAndRelatedExpenseMemberMember2023-01-012023-12-310001840776us-gaap:VariableInterestEntityPrimaryBeneficiaryMember2025-12-310001840776us-gaap:VariableInterestEntityPrimaryBeneficiaryMember2024-12-310001840776us-gaap:OperatingSegmentsMemberhgty:CommissionRevenueAndFeeRevenueMemberhgty:InsuranceSegmentMember2025-01-012025-12-310001840776us-gaap:OperatingSegmentsMemberhgty:CommissionRevenueAndFeeRevenueMemberhgty:MarketplaceSegmentMember2025-01-012025-12-310001840776us-gaap:OperatingSegmentsMemberhgty:InsuranceSegmentMember2025-01-012025-12-310001840776us-gaap:OperatingSegmentsMemberhgty:MarketplaceSegmentMember2025-01-012025-12-310001840776us-gaap:OperatingSegmentsMemberhgty:MembershipAndOtherRevenueMemberhgty:InsuranceSegmentMember2025-01-012025-12-310001840776us-gaap:OperatingSegmentsMemberhgty:MembershipAndOtherRevenueMemberhgty:MarketplaceSegmentMember2025-01-012025-12-310001840776us-gaap:CorporateNonSegmentMember2025-01-012025-12-310001840776us-gaap:OperatingSegmentsMemberhgty:CommissionRevenueAndFeeRevenueMemberhgty:InsuranceSegmentMember2024-01-012024-12-310001840776us-gaap:OperatingSegmentsMemberhgty:CommissionRevenueAndFeeRevenueMemberhgty:MarketplaceSegmentMember2024-01-012024-12-310001840776us-gaap:OperatingSegmentsMemberhgty:InsuranceSegmentMember2024-01-012024-12-310001840776us-gaap:OperatingSegmentsMemberhgty:MarketplaceSegmentMember2024-01-012024-12-310001840776us-gaap:OperatingSegmentsMemberhgty:MembershipAndOtherRevenueMemberhgty:InsuranceSegmentMember2024-01-012024-12-310001840776us-gaap:OperatingSegmentsMemberhgty:MembershipAndOtherRevenueMemberhgty:MarketplaceSegmentMember2024-01-012024-12-310001840776us-gaap:CorporateNonSegmentMember2024-01-012024-12-310001840776us-gaap:OperatingSegmentsMemberhgty:CommissionRevenueAndFeeRevenueMemberhgty:InsuranceSegmentMember2023-01-012023-12-310001840776us-gaap:OperatingSegmentsMemberhgty:CommissionRevenueAndFeeRevenueMemberhgty:MarketplaceSegmentMember2023-01-012023-12-310001840776us-gaap:OperatingSegmentsMemberhgty:InsuranceSegmentMember2023-01-012023-12-310001840776us-gaap:OperatingSegmentsMemberhgty:MarketplaceSegmentMember2023-01-012023-12-310001840776us-gaap:OperatingSegmentsMemberhgty:MembershipAndOtherRevenueMemberhgty:InsuranceSegmentMember2023-01-012023-12-310001840776us-gaap:OperatingSegmentsMemberhgty:MembershipAndOtherRevenueMemberhgty:MarketplaceSegmentMember2023-01-012023-12-310001840776us-gaap:CorporateNonSegmentMember2023-01-012023-12-310001840776country:UShgty:InsuranceSegmentMember2025-01-012025-12-310001840776country:UShgty:MarketplaceSegmentMember2025-01-012025-12-310001840776country:US2025-01-012025-12-310001840776us-gaap:NonUsMemberhgty:InsuranceSegmentMember2025-01-012025-12-310001840776us-gaap:NonUsMemberhgty:MarketplaceSegmentMember2025-01-012025-12-310001840776us-gaap:NonUsMember2025-01-012025-12-310001840776hgty:InsuranceSegmentMember2025-01-012025-12-310001840776hgty:MarketplaceSegmentMember2025-01-012025-12-310001840776country:UShgty:InsuranceSegmentMember2024-01-012024-12-310001840776country:UShgty:MarketplaceSegmentMember2024-01-012024-12-310001840776country:US2024-01-012024-12-310001840776us-gaap:NonUsMemberhgty:InsuranceSegmentMember2024-01-012024-12-310001840776us-gaap:NonUsMemberhgty:MarketplaceSegmentMember2024-01-012024-12-310001840776us-gaap:NonUsMember2024-01-012024-12-310001840776hgty:InsuranceSegmentMember2024-01-012024-12-310001840776hgty:MarketplaceSegmentMember2024-01-012024-12-310001840776country:UShgty:InsuranceSegmentMember2023-01-012023-12-310001840776country:UShgty:MarketplaceSegmentMember2023-01-012023-12-310001840776country:US2023-01-012023-12-310001840776us-gaap:NonUsMemberhgty:InsuranceSegmentMember2023-01-012023-12-310001840776us-gaap:NonUsMemberhgty:MarketplaceSegmentMember2023-01-012023-12-310001840776us-gaap:NonUsMember2023-01-012023-12-310001840776hgty:InsuranceSegmentMember2023-01-012023-12-310001840776hgty:MarketplaceSegmentMember2023-01-012023-12-310001840776hgty:CommissionAndFeeRevenueMemberus-gaap:SalesChannelThroughIntermediaryMember2025-01-012025-12-310001840776hgty:CommissionAndFeeRevenueMemberus-gaap:SalesChannelDirectlyToConsumerMember2025-01-012025-12-310001840776hgty:CommissionAndFeeRevenueMember2025-01-012025-12-310001840776hgty:ContingentCommissionMemberus-gaap:SalesChannelThroughIntermediaryMember2025-01-012025-12-310001840776hgty:ContingentCommissionMemberus-gaap:SalesChannelDirectlyToConsumerMember2025-01-012025-12-310001840776hgty:ContingentCommissionMember2025-01-012025-12-310001840776hgty:CommissionRevenueAndFeeRevenueMemberus-gaap:SalesChannelThroughIntermediaryMember2025-01-012025-12-310001840776hgty:CommissionRevenueAndFeeRevenueMemberus-gaap:SalesChannelDirectlyToConsumerMember2025-01-012025-12-310001840776hgty:CommissionAndFeeRevenueMemberus-gaap:SalesChannelThroughIntermediaryMember2024-01-012024-12-310001840776hgty:CommissionAndFeeRevenueMemberus-gaap:SalesChannelDirectlyToConsumerMember2024-01-012024-12-310001840776hgty:CommissionAndFeeRevenueMember2024-01-012024-12-310001840776hgty:ContingentCommissionMemberus-gaap:SalesChannelThroughIntermediaryMember2024-01-012024-12-310001840776hgty:ContingentCommissionMemberus-gaap:SalesChannelDirectlyToConsumerMember2024-01-012024-12-310001840776hgty:ContingentCommissionMember2024-01-012024-12-310001840776hgty:CommissionRevenueAndFeeRevenueMemberus-gaap:SalesChannelThroughIntermediaryMember2024-01-012024-12-310001840776hgty:CommissionRevenueAndFeeRevenueMemberus-gaap:SalesChannelDirectlyToConsumerMember2024-01-012024-12-310001840776hgty:CommissionAndFeeRevenueMemberus-gaap:SalesChannelThroughIntermediaryMember2023-01-012023-12-310001840776hgty:CommissionAndFeeRevenueMemberus-gaap:SalesChannelDirectlyToConsumerMember2023-01-012023-12-310001840776hgty:CommissionAndFeeRevenueMember2023-01-012023-12-310001840776hgty:ContingentCommissionMemberus-gaap:SalesChannelThroughIntermediaryMember2023-01-012023-12-310001840776hgty:ContingentCommissionMemberus-gaap:SalesChannelDirectlyToConsumerMember2023-01-012023-12-310001840776hgty:ContingentCommissionMember2023-01-012023-12-310001840776hgty:CommissionRevenueAndFeeRevenueMemberus-gaap:SalesChannelThroughIntermediaryMember2023-01-012023-12-310001840776hgty:CommissionRevenueAndFeeRevenueMemberus-gaap:SalesChannelDirectlyToConsumerMember2023-01-012023-12-310001840776us-gaap:CorporateDebtSecuritiesMember2025-12-310001840776us-gaap:USTreasurySecuritiesMember2025-12-310001840776us-gaap:USStatesAndPoliticalSubdivisionsMember2025-12-310001840776us-gaap:ForeignGovernmentDebtSecuritiesMember2025-12-310001840776us-gaap:AssetBackedSecuritiesMember2025-12-310001840776us-gaap:MortgageBackedSecuritiesMember2025-12-310001840776us-gaap:CorporateDebtSecuritiesMember2024-12-310001840776us-gaap:USTreasurySecuritiesMember2024-12-310001840776us-gaap:USStatesAndPoliticalSubdivisionsMember2024-12-310001840776us-gaap:ForeignGovernmentDebtSecuritiesMember2024-12-310001840776us-gaap:AssetBackedSecuritiesMember2024-12-310001840776us-gaap:MortgageBackedSecuritiesMember2024-12-310001840776hgty:StatesAndMunicipalitiesMember2025-12-310001840776us-gaap:CashAndCashEquivalentsMember2025-01-012025-12-310001840776us-gaap:CashAndCashEquivalentsMember2024-01-012024-12-310001840776us-gaap:CashAndCashEquivalentsMember2023-01-012023-12-310001840776us-gaap:FixedMaturitiesMember2025-01-012025-12-310001840776us-gaap:FixedMaturitiesMember2024-01-012024-12-310001840776us-gaap:FixedMaturitiesMember2023-01-012023-12-310001840776us-gaap:FixedMaturitiesMember2025-01-012025-12-310001840776us-gaap:FixedMaturitiesMember2024-01-012024-12-310001840776us-gaap:InterestRateSwapMember2020-12-310001840776us-gaap:InterestRateSwapMember2024-06-300001840776us-gaap:CommonClassAMember2024-07-3100018407762024-07-3100018407762024-07-012024-09-300001840776us-gaap:CommonClassAMember2024-07-012024-09-300001840776hgty:PrivatePlacementWarrantsMemberhgty:WarrantLiabilitiesMember2023-12-310001840776hgty:UnderwriterWarrantsMemberhgty:WarrantLiabilitiesMember2023-12-310001840776hgty:OTMWarrantsMemberhgty:WarrantLiabilitiesMember2023-12-310001840776hgty:PIPEWarrantsMemberhgty:WarrantLiabilitiesMember2023-12-310001840776hgty:WarrantLiabilitiesMember2023-12-310001840776hgty:PrivatePlacementWarrantsMemberhgty:WarrantLiabilitiesMember2024-01-012024-12-310001840776hgty:UnderwriterWarrantsMemberhgty:WarrantLiabilitiesMember2024-01-012024-12-310001840776hgty:OTMWarrantsMemberhgty:WarrantLiabilitiesMember2024-01-012024-12-310001840776hgty:PIPEWarrantsMemberhgty:WarrantLiabilitiesMember2024-01-012024-12-310001840776hgty:WarrantLiabilitiesMember2024-01-012024-12-310001840776hgty:PrivatePlacementWarrantsMemberhgty:WarrantLiabilitiesMember2024-12-310001840776hgty:UnderwriterWarrantsMemberhgty:WarrantLiabilitiesMember2024-12-310001840776hgty:OTMWarrantsMemberhgty:WarrantLiabilitiesMember2024-12-310001840776hgty:PIPEWarrantsMemberhgty:WarrantLiabilitiesMember2024-12-310001840776hgty:WarrantLiabilitiesMember2024-12-310001840776us-gaap:CorporateDebtSecuritiesMemberus-gaap:FairValueMeasurementsRecurringMember2025-12-310001840776us-gaap:CorporateDebtSecuritiesMemberus-gaap:FairValueMeasurementsRecurringMemberus-gaap:FairValueInputsLevel1Member2025-12-310001840776us-gaap:CorporateDebtSecuritiesMemberus-gaap:FairValueMeasurementsRecurringMemberus-gaap:FairValueInputsLevel2Member2025-12-310001840776us-gaap:CorporateDebtSecuritiesMemberus-gaap:FairValueMeasurementsRecurringMemberus-gaap:FairValueInputsLevel3Member2025-12-310001840776us-gaap:USTreasurySecuritiesMemberus-gaap:FairValueMeasurementsRecurringMember2025-12-310001840776us-gaap:USTreasurySecuritiesMemberus-gaap:FairValueMeasurementsRecurringMemberus-gaap:FairValueInputsLevel1Member2025-12-310001840776us-gaap:USTreasurySecuritiesMemberus-gaap:FairValueMeasurementsRecurringMemberus-gaap:FairValueInputsLevel2Member2025-12-310001840776us-gaap:USTreasurySecuritiesMemberus-gaap:FairValueMeasurementsRecurringMemberus-gaap:FairValueInputsLevel3Member2025-12-310001840776us-gaap:USStatesAndPoliticalSubdivisionsMemberus-gaap:FairValueMeasurementsRecurringMember2025-12-310001840776us-gaap:USStatesAndPoliticalSubdivisionsMemberus-gaap:FairValueMeasurementsRecurringMemberus-gaap:FairValueInputsLevel1Member2025-12-310001840776us-gaap:USStatesAndPoliticalSubdivisionsMemberus-gaap:FairValueMeasurementsRecurringMemberus-gaap:FairValueInputsLevel2Member2025-12-310001840776us-gaap:USStatesAndPoliticalSubdivisionsMemberus-gaap:FairValueMeasurementsRecurringMemberus-gaap:FairValueInputsLevel3Member2025-12-310001840776us-gaap:ForeignGovernmentDebtSecuritiesMemberus-gaap:FairValueMeasurementsRecurringMember2025-12-310001840776us-gaap:ForeignGovernmentDebtSecuritiesMemberus-gaap:FairValueMeasurementsRecurringMemberus-gaap:FairValueInputsLevel1Member2025-12-310001840776us-gaap:ForeignGovernmentDebtSecuritiesMemberus-gaap:FairValueMeasurementsRecurringMemberus-gaap:FairValueInputsLevel2Member2025-12-310001840776us-gaap:ForeignGovernmentDebtSecuritiesMemberus-gaap:FairValueMeasurementsRecurringMemberus-gaap:FairValueInputsLevel3Member2025-12-310001840776us-gaap:AssetBackedSecuritiesMemberus-gaap:FairValueMeasurementsRecurringMember2025-12-310001840776us-gaap:AssetBackedSecuritiesMemberus-gaap:FairValueMeasurementsRecurringMemberus-gaap:FairValueInputsLevel1Member2025-12-310001840776us-gaap:AssetBackedSecuritiesMemberus-gaap:FairValueMeasurementsRecurringMemberus-gaap:FairValueInputsLevel2Member2025-12-310001840776us-gaap:AssetBackedSecuritiesMemberus-gaap:FairValueMeasurementsRecurringMemberus-gaap:FairValueInputsLevel3Member2025-12-310001840776us-gaap:MortgageBackedSecuritiesMemberus-gaap:FairValueMeasurementsRecurringMember2025-12-310001840776us-gaap:MortgageBackedSecuritiesMemberus-gaap:FairValueMeasurementsRecurringMemberus-gaap:FairValueInputsLevel1Member2025-12-310001840776us-gaap:MortgageBackedSecuritiesMemberus-gaap:FairValueMeasurementsRecurringMemberus-gaap:FairValueInputsLevel2Member2025-12-310001840776us-gaap:MortgageBackedSecuritiesMemberus-gaap:FairValueMeasurementsRecurringMemberus-gaap:FairValueInputsLevel3Member2025-12-310001840776us-gaap:CommonStockMemberus-gaap:FairValueMeasurementsRecurringMember2025-12-310001840776us-gaap:CommonStockMemberus-gaap:FairValueMeasurementsRecurringMemberus-gaap:FairValueInputsLevel1Member2025-12-310001840776us-gaap:CommonStockMemberus-gaap:FairValueMeasurementsRecurringMemberus-gaap:FairValueInputsLevel2Member2025-12-310001840776us-gaap:CommonStockMemberus-gaap:FairValueMeasurementsRecurringMemberus-gaap:FairValueInputsLevel3Member2025-12-310001840776us-gaap:FairValueMeasurementsRecurringMember2025-12-310001840776us-gaap:FairValueMeasurementsRecurringMemberus-gaap:FairValueInputsLevel1Member2025-12-310001840776us-gaap:FairValueMeasurementsRecurringMemberus-gaap:FairValueInputsLevel2Member2025-12-310001840776us-gaap:FairValueMeasurementsRecurringMemberus-gaap:FairValueInputsLevel3Member2025-12-310001840776us-gaap:CorporateDebtSecuritiesMemberus-gaap:FairValueMeasurementsRecurringMember2024-12-310001840776us-gaap:CorporateDebtSecuritiesMemberus-gaap:FairValueMeasurementsRecurringMemberus-gaap:FairValueInputsLevel1Member2024-12-310001840776us-gaap:CorporateDebtSecuritiesMemberus-gaap:FairValueMeasurementsRecurringMemberus-gaap:FairValueInputsLevel2Member2024-12-310001840776us-gaap:CorporateDebtSecuritiesMemberus-gaap:FairValueMeasurementsRecurringMemberus-gaap:FairValueInputsLevel3Member2024-12-310001840776us-gaap:USTreasurySecuritiesMemberus-gaap:FairValueMeasurementsRecurringMember2024-12-310001840776us-gaap:USTreasurySecuritiesMemberus-gaap:FairValueMeasurementsRecurringMemberus-gaap:FairValueInputsLevel1Member2024-12-310001840776us-gaap:USTreasurySecuritiesMemberus-gaap:FairValueMeasurementsRecurringMemberus-gaap:FairValueInputsLevel2Member2024-12-310001840776us-gaap:USTreasurySecuritiesMemberus-gaap:FairValueMeasurementsRecurringMemberus-gaap:FairValueInputsLevel3Member2024-12-310001840776us-gaap:USStatesAndPoliticalSubdivisionsMemberus-gaap:FairValueMeasurementsRecurringMember2024-12-310001840776us-gaap:USStatesAndPoliticalSubdivisionsMemberus-gaap:FairValueMeasurementsRecurringMemberus-gaap:FairValueInputsLevel1Member2024-12-310001840776us-gaap:USStatesAndPoliticalSubdivisionsMemberus-gaap:FairValueMeasurementsRecurringMemberus-gaap:FairValueInputsLevel2Member2024-12-310001840776us-gaap:USStatesAndPoliticalSubdivisionsMemberus-gaap:FairValueMeasurementsRecurringMemberus-gaap:FairValueInputsLevel3Member2024-12-310001840776us-gaap:ForeignGovernmentDebtSecuritiesMemberus-gaap:FairValueMeasurementsRecurringMember2024-12-310001840776us-gaap:ForeignGovernmentDebtSecuritiesMemberus-gaap:FairValueMeasurementsRecurringMemberus-gaap:FairValueInputsLevel1Member2024-12-310001840776us-gaap:ForeignGovernmentDebtSecuritiesMemberus-gaap:FairValueMeasurementsRecurringMemberus-gaap:FairValueInputsLevel2Member2024-12-310001840776us-gaap:ForeignGovernmentDebtSecuritiesMemberus-gaap:FairValueMeasurementsRecurringMemberus-gaap:FairValueInputsLevel3Member2024-12-310001840776us-gaap:AssetBackedSecuritiesMemberus-gaap:FairValueMeasurementsRecurringMember2024-12-310001840776us-gaap:AssetBackedSecuritiesMemberus-gaap:FairValueMeasurementsRecurringMemberus-gaap:FairValueInputsLevel1Member2024-12-310001840776us-gaap:AssetBackedSecuritiesMemberus-gaap:FairValueMeasurementsRecurringMemberus-gaap:FairValueInputsLevel2Member2024-12-310001840776us-gaap:AssetBackedSecuritiesMemberus-gaap:FairValueMeasurementsRecurringMemberus-gaap:FairValueInputsLevel3Member2024-12-310001840776us-gaap:MortgageBackedSecuritiesMemberus-gaap:FairValueMeasurementsRecurringMember2024-12-310001840776us-gaap:MortgageBackedSecuritiesMemberus-gaap:FairValueMeasurementsRecurringMemberus-gaap:FairValueInputsLevel1Member2024-12-310001840776us-gaap:MortgageBackedSecuritiesMemberus-gaap:FairValueMeasurementsRecurringMemberus-gaap:FairValueInputsLevel2Member2024-12-310001840776us-gaap:MortgageBackedSecuritiesMemberus-gaap:FairValueMeasurementsRecurringMemberus-gaap:FairValueInputsLevel3Member2024-12-310001840776us-gaap:CommonStockMemberus-gaap:FairValueMeasurementsRecurringMember2024-12-310001840776us-gaap:CommonStockMemberus-gaap:FairValueMeasurementsRecurringMemberus-gaap:FairValueInputsLevel1Member2024-12-310001840776us-gaap:CommonStockMemberus-gaap:FairValueMeasurementsRecurringMemberus-gaap:FairValueInputsLevel2Member2024-12-310001840776us-gaap:CommonStockMemberus-gaap:FairValueMeasurementsRecurringMemberus-gaap:FairValueInputsLevel3Member2024-12-310001840776us-gaap:FairValueMeasurementsRecurringMember2024-12-310001840776us-gaap:FairValueMeasurementsRecurringMemberus-gaap:FairValueInputsLevel1Member2024-12-310001840776us-gaap:FairValueMeasurementsRecurringMemberus-gaap:FairValueInputsLevel2Member2024-12-310001840776us-gaap:FairValueMeasurementsRecurringMemberus-gaap:FairValueInputsLevel3Member2024-12-310001840776hgty:BroadArrowGroupIncMember2025-01-012025-12-310001840776hgty:BroadArrowGroupIncMember2025-12-310001840776hgty:BroadArrowGroupIncMember2024-12-310001840776us-gaap:LoansReceivableMember2025-12-310001840776hgty:ConsignorAdvancesReceivableMember2025-12-310001840776us-gaap:CustomerConcentrationRiskMemberus-gaap:FinanceReceivablesMember2025-12-310001840776hgty:OneBorrowMemberus-gaap:CustomerConcentrationRiskMemberus-gaap:FinanceReceivablesMember2025-01-012025-12-310001840776us-gaap:CustomerConcentrationRiskMemberus-gaap:FinanceReceivablesMember2025-01-012025-12-310001840776hgty:ConsolidatedNationalInsuranceCompanyCNICMember2024-09-012024-09-010001840776hgty:MemberHubsHoldingLLCMember2024-09-300001840776hgty:MemberHubsHoldingLLCMemberhgty:HagertyVenturesLLCMember2024-07-012024-09-300001840776hgty:MemberHubsHoldingLLCMember2023-07-012023-09-300001840776hgty:MemberHubsHoldingLLCMember2023-09-290001840776hgty:HagertyDriveShareLLCMember2023-07-012023-09-300001840776hgty:HagertyDriveShareLLCMember2024-04-012024-06-300001840776hgty:ReductionInForceMember2023-01-012023-12-310001840776srt:WeightedAverageMemberus-gaap:ComputerSoftwareIntangibleAssetMember2025-12-310001840776us-gaap:ComputerSoftwareIntangibleAssetMember2025-12-310001840776srt:WeightedAverageMemberus-gaap:CustomerContractsMember2025-12-310001840776us-gaap:CustomerContractsMember2025-12-310001840776srt:WeightedAverageMemberus-gaap:TrademarksAndTradeNamesMember2025-12-310001840776us-gaap:TrademarksAndTradeNamesMember2025-12-310001840776us-gaap:LicensingAgreementsMember2025-12-310001840776srt:WeightedAverageMemberus-gaap:CustomerRelatedIntangibleAssetsMember2025-12-310001840776us-gaap:CustomerRelatedIntangibleAssetsMember2025-12-310001840776srt:WeightedAverageMemberus-gaap:OtherIntangibleAssetsMember2025-12-310001840776us-gaap:OtherIntangibleAssetsMember2025-12-310001840776srt:WeightedAverageMemberus-gaap:ComputerSoftwareIntangibleAssetMember2024-12-310001840776us-gaap:ComputerSoftwareIntangibleAssetMember2024-12-310001840776srt:WeightedAverageMemberus-gaap:CustomerContractsMember2024-12-310001840776us-gaap:CustomerContractsMember2024-12-310001840776srt:WeightedAverageMemberus-gaap:TrademarksAndTradeNamesMember2024-12-310001840776us-gaap:TrademarksAndTradeNamesMember2024-12-310001840776us-gaap:LicensingAgreementsMember2024-12-310001840776srt:WeightedAverageMemberus-gaap:CustomerRelatedIntangibleAssetsMember2024-12-310001840776us-gaap:CustomerRelatedIntangibleAssetsMember2024-12-310001840776srt:WeightedAverageMemberus-gaap:OtherIntangibleAssetsMember2024-12-310001840776us-gaap:OtherIntangibleAssetsMember2024-12-310001840776hgty:HurricaneHeleneMember2025-01-012025-12-310001840776hgty:HurricaneHeleneMember2024-01-012024-12-310001840776hgty:HurricaneMiltonMember2025-01-012025-12-310001840776hgty:HurricaneMiltonMember2024-01-012024-12-310001840776hgty:AutoInsurancePolicyMember2025-12-310001840776hgty:AutoInsurancePolicyMember2024-12-310001840776hgty:MarineInsurancePolicyMember2025-12-310001840776hgty:MarineInsurancePolicyMember2024-12-310001840776hgty:AutoInsurancePolicyMemberus-gaap:ShortDurationInsuranceContractAccidentYear2020Member2021-12-310001840776hgty:AutoInsurancePolicyMemberus-gaap:ShortDurationInsuranceContractAccidentYear2020Member2022-12-310001840776hgty:AutoInsurancePolicyMemberus-gaap:ShortDurationInsuranceContractAccidentYear2020Member2023-12-310001840776hgty:AutoInsurancePolicyMemberus-gaap:ShortDurationInsuranceContractAccidentYear2020Member2024-12-310001840776hgty:AutoInsurancePolicyMemberus-gaap:ShortDurationInsuranceContractAccidentYear2020Member2025-12-310001840776hgty:AutoInsurancePolicyMemberus-gaap:ShortDurationInsuranceContractAccidentYear2021Member2022-12-310001840776hgty:AutoInsurancePolicyMemberus-gaap:ShortDurationInsuranceContractAccidentYear2021Member2023-12-310001840776hgty:AutoInsurancePolicyMemberus-gaap:ShortDurationInsuranceContractAccidentYear2021Member2024-12-310001840776hgty:AutoInsurancePolicyMemberus-gaap:ShortDurationInsuranceContractAccidentYear2021Member2025-12-310001840776hgty:AutoInsurancePolicyMemberus-gaap:ShortDurationInsuranceContractAccidentYear2022Member2023-12-310001840776hgty:AutoInsurancePolicyMemberus-gaap:ShortDurationInsuranceContractAccidentYear2022Member2024-12-310001840776hgty:AutoInsurancePolicyMemberus-gaap:ShortDurationInsuranceContractAccidentYear2022Member2025-12-310001840776hgty:AutoInsurancePolicyMemberus-gaap:ShortDurationInsuranceContractAccidentYear2023Member2024-12-310001840776hgty:AutoInsurancePolicyMemberus-gaap:ShortDurationInsuranceContractAccidentYear2023Member2025-12-310001840776hgty:AutoInsurancePolicyMemberus-gaap:ShortDurationInsuranceContractAccidentYear2024Member2024-12-310001840776hgty:AutoInsurancePolicyMemberus-gaap:ShortDurationInsuranceContractAccidentYear2024Member2025-12-310001840776hgty:VariousReinsurersMember2025-01-012025-12-310001840776us-gaap:HurricaneMember2025-12-310001840776Catastrophe Reinsurance Layer One2025-01-012025-12-310001840776Catastrophe Reinsurance Layer One2025-01-012025-01-310001840776Catastrophe Reinsurance Layer Two2025-01-012025-01-310001840776Catastrophe Reinsurance Layer Two2025-01-012025-12-310001840776hgty:VariousReinsurersMemberCatastrophe Program - High Net Worth2025-01-012025-12-310001840776hgty:EvanstonInsuranceCompanyMemberCatastrophe Program - High Net Worth2025-01-012025-12-310001840776hgty:HagertyReinsuranceLtdMember2025-12-310001840776hgty:HagertyReinsuranceLtdMember2024-12-310001840776hgty:StateFarmTermLoanFacilityMemberhgty:HagertyReinsuranceLtdMemberus-gaap:LineOfCreditMember2025-12-310001840776hgty:HagertyReinsuranceLtdMember2025-01-012025-12-310001840776hgty:HagertyReinsuranceLtdMember2024-01-012024-12-310001840776hgty:HagertyReinsuranceLtdMember2023-01-012023-12-310001840776hgty:DriversEdgeInsuranceLtdMember2025-12-310001840776hgty:DriversEdgeInsuranceLtdMember2024-12-310001840776hgty:DriversEdgeInsuranceLtdMember2025-01-012025-12-310001840776hgty:DriversEdgeInsuranceLtdMember2024-01-012024-12-310001840776us-gaap:RevolvingCreditFacilityMemberhgty:A2025JPMCreditFacilityMemberus-gaap:LineOfCreditMember2025-12-310001840776us-gaap:RevolvingCreditFacilityMemberhgty:A2025JPMCreditFacilityMemberus-gaap:LineOfCreditMember2024-12-310001840776us-gaap:RevolvingCreditFacilityMemberhgty:JPMCreditFacilityMemberus-gaap:LineOfCreditMember2025-12-310001840776us-gaap:RevolvingCreditFacilityMemberhgty:JPMCreditFacilityMemberus-gaap:LineOfCreditMember2024-12-310001840776us-gaap:RevolvingCreditFacilityMemberhgty:BACCreditFacilityMemberus-gaap:LineOfCreditMember2025-12-310001840776us-gaap:RevolvingCreditFacilityMemberhgty:BACCreditFacilityMemberus-gaap:LineOfCreditMember2024-12-310001840776hgty:StateFarmTermLoanFacilityMemberus-gaap:LineOfCreditMember2025-12-310001840776hgty:StateFarmTermLoanFacilityMemberus-gaap:LineOfCreditMember2024-12-310001840776us-gaap:NotesPayableOtherPayablesMember2025-12-310001840776us-gaap:NotesPayableOtherPayablesMember2024-12-310001840776us-gaap:LetterOfCreditMemberhgty:A2025JPMCreditFacilityMemberus-gaap:LineOfCreditMember2025-12-310001840776us-gaap:RevolvingCreditFacilityMemberhgty:A2025JPMCreditFacilityMemberus-gaap:ForeignLineOfCreditMember2025-12-310001840776us-gaap:LetterOfCreditMemberhgty:A2025JPMCreditFacilityMemberus-gaap:ForeignLineOfCreditMember2025-12-310001840776hgty:A2025JPMCreditFacilityMember2025-12-310001840776hgty:A2025JPMCreditFacilityMemberus-gaap:LineOfCreditMember2025-01-012025-12-310001840776us-gaap:RevolvingCreditFacilityMemberhgty:BACCreditFacilityMemberus-gaap:LineOfCreditMember2025-11-030001840776us-gaap:RevolvingCreditFacilityMemberhgty:BACCreditFacilityMemberus-gaap:LineOfCreditMember2025-11-040001840776us-gaap:RevolvingCreditFacilityMemberhgty:BACCreditFacilityMemberus-gaap:LineOfCreditMember2025-01-012025-12-310001840776hgty:StateFarmTermLoanFacilityMemberhgty:HagertyReinsuranceLtdMemberus-gaap:LineOfCreditMember2023-09-300001840776hgty:StateFarmTermLoanFacilityMemberus-gaap:LineOfCreditMember2023-09-300001840776country:GBus-gaap:NotesPayableOtherPayablesMember2024-12-310001840776us-gaap:SeriesAPreferredStockMember2023-06-012023-06-300001840776us-gaap:SeriesAPreferredStockMember2023-06-300001840776hgty:HagertyIncMember2023-12-310001840776us-gaap:SeriesAPreferredStockMember2025-12-310001840776us-gaap:SeriesAPreferredStockMember2025-01-012025-12-310001840776us-gaap:SeriesAPreferredStockMember2024-06-012024-06-300001840776us-gaap:SeriesAPreferredStockMember2025-06-012025-06-300001840776us-gaap:DebtInstrumentRedemptionPeriodOneMemberus-gaap:CommonClassAMember2025-01-012025-12-310001840776us-gaap:DebtInstrumentRedemptionPeriodTwoMemberus-gaap:CommonClassAMember2025-01-012025-12-310001840776us-gaap:SeriesAPreferredStockMemberus-gaap:DebtInstrumentRedemptionPeriodOneMemberhgty:ChangeOfControlMember2025-01-012025-12-310001840776us-gaap:SeriesAPreferredStockMemberus-gaap:DebtInstrumentRedemptionPeriodTwoMemberhgty:ChangeOfControlMember2025-01-012025-12-310001840776us-gaap:SeriesAPreferredStockMemberus-gaap:DebtInstrumentRedemptionPeriodThreeMemberhgty:ChangeOfControlMember2025-01-012025-12-310001840776hgty:FundamentalTransactionMemberus-gaap:SeriesAPreferredStockMember2025-12-310001840776us-gaap:SeriesAPreferredStockMemberus-gaap:DebtInstrumentRedemptionPeriodOneMemberhgty:FundamentalTransactionMember2025-01-012025-12-310001840776us-gaap:SeriesAPreferredStockMemberus-gaap:DebtInstrumentRedemptionPeriodTwoMemberhgty:FundamentalTransactionMember2025-01-012025-12-310001840776us-gaap:SeriesAPreferredStockMemberus-gaap:DebtInstrumentRedemptionPeriodFourMemberhgty:FundamentalTransactionMember2025-01-012025-12-310001840776us-gaap:SeriesAPreferredStockMemberus-gaap:DebtInstrumentRedemptionPeriodFiveMemberhgty:FundamentalTransactionMember2025-01-012025-12-310001840776us-gaap:SeriesAPreferredStockMemberhgty:DebtInstrumentRedemptionPeriodSixMemberhgty:FundamentalTransactionMember2025-01-012025-12-310001840776us-gaap:SeriesAPreferredStockMemberhgty:DebtInstrumentRedemptionPeriodSevenMemberhgty:FundamentalTransactionMember2025-01-012025-12-310001840776us-gaap:SeriesAPreferredStockMemberhgty:DebtInstrumentRedemptionPeriodEightMemberhgty:FundamentalTransactionMember2025-01-012025-12-310001840776us-gaap:SeriesAPreferredStockMemberus-gaap:DebtInstrumentRedemptionPeriodFourMemberhgty:OptionalTermRedemptionMember2025-01-012025-12-310001840776us-gaap:SeriesAPreferredStockMemberus-gaap:DebtInstrumentRedemptionPeriodFiveMemberhgty:OptionalTermRedemptionMember2025-01-012025-12-310001840776us-gaap:SeriesAPreferredStockMemberhgty:DebtInstrumentRedemptionPeriodSixMemberhgty:OptionalTermRedemptionMember2025-01-012025-12-310001840776us-gaap:SeriesAPreferredStockMemberhgty:DebtInstrumentRedemptionPeriodSevenMemberhgty:OptionalTermRedemptionMember2025-01-012025-12-310001840776us-gaap:SeriesAPreferredStockMemberhgty:DebtInstrumentRedemptionPeriodThirteenMemberhgty:OptionalTermRedemptionMember2025-01-012025-12-310001840776us-gaap:SeriesAPreferredStockMemberhgty:DebtInstrumentRedemptionPeriodFourteenMemberhgty:OptionalTermRedemptionMember2025-01-012025-12-310001840776hgty:CommonClassVMember2025-01-012025-12-310001840776us-gaap:ConvertiblePreferredStockMember2025-12-310001840776us-gaap:SeriesAPreferredStockMember2024-12-310001840776hgty:TheHagertyGroupLLCMemberus-gaap:CommonClassAMember2024-12-310001840776hgty:TheHagertyGroupLLCMemberus-gaap:CommonClassAMember2023-12-310001840776hgty:TheHagertyGroupLLCMemberus-gaap:CommonClassAMember2025-01-012025-12-310001840776hgty:TheHagertyGroupLLCMemberus-gaap:CommonClassAMember2024-01-012024-12-310001840776hgty:TheHagertyGroupLLCMemberus-gaap:CommonClassAMember2025-12-310001840776hgty:TheHagertyGroupLLCMember2024-12-310001840776hgty:TheHagertyGroupLLCMember2023-12-310001840776hgty:TheHagertyGroupLLCMember2025-12-310001840776hgty:OtherUnitHoldersMember2024-12-310001840776hgty:OtherUnitHoldersMember2023-12-310001840776hgty:OtherUnitHoldersMemberus-gaap:CommonClassAMember2025-01-012025-12-310001840776hgty:OtherUnitHoldersMemberus-gaap:CommonClassAMember2024-01-012024-12-310001840776hgty:OtherUnitHoldersMember2025-12-310001840776hgty:A2021StockIncentivePlanMemberus-gaap:CommonClassAMember2025-01-012025-12-310001840776hgty:A2021StockIncentivePlanMemberus-gaap:CommonClassAMember2024-01-012024-12-310001840776hgty:A2021EmployeeStockPurchasePlanMemberus-gaap:CommonClassAMember2025-01-012025-12-310001840776hgty:A2021EmployeeStockPurchasePlanMemberus-gaap:CommonClassAMember2024-01-012024-12-310001840776hgty:CommonClassVMember2025-07-012025-09-300001840776us-gaap:CommonClassAMember2025-07-012025-09-300001840776hgty:CommonClassVMember2024-01-012024-12-310001840776hgty:THGUnitExchangeMember2025-01-012025-12-310001840776hgty:THGLLCMember2024-06-012024-06-300001840776hgty:THGLLCMember2025-06-012025-06-300001840776hgty:THGLLCMember2025-01-012025-12-310001840776hgty:THGLLCMember2024-01-012024-12-310001840776hgty:HagertyIncMemberhgty:THGLLCMember2025-01-012025-12-310001840776hgty:HagertyIncMemberhgty:THGLLCMember2024-01-012024-12-310001840776hgty:A2021StockIncentivePlanMemberus-gaap:CommonClassAMember2021-12-310001840776hgty:A2021StockIncentivePlanMember2025-12-310001840776us-gaap:RestrictedStockUnitsRSUMember2025-01-012025-12-310001840776us-gaap:RestrictedStockUnitsRSUMember2024-01-012024-12-310001840776us-gaap:RestrictedStockUnitsRSUMember2023-01-012023-12-310001840776us-gaap:PerformanceSharesMember2025-01-012025-12-310001840776us-gaap:PerformanceSharesMember2024-01-012024-12-310001840776us-gaap:PerformanceSharesMember2023-01-012023-12-310001840776hgty:EmployeeStockPurchasePlanMember2025-01-012025-12-310001840776hgty:EmployeeStockPurchasePlanMember2024-01-012024-12-310001840776hgty:EmployeeStockPurchasePlanMember2023-01-012023-12-310001840776srt:MinimumMemberus-gaap:EmployeeStockOptionMember2025-01-012025-12-310001840776srt:MaximumMemberus-gaap:EmployeeStockOptionMember2025-01-012025-12-310001840776us-gaap:RestrictedStockUnitsRSUMember2024-12-310001840776us-gaap:RestrictedStockUnitsRSUMember2025-12-310001840776us-gaap:RestrictedStockUnitsRSUMemberus-gaap:CommonClassAMember2025-01-012025-12-310001840776hgty:MarketConditionPerformanceSharesMember2022-04-012022-04-300001840776hgty:MarketConditionPerformanceSharesMemberus-gaap:ShareBasedCompensationAwardTrancheOneMember2022-04-012022-04-300001840776hgty:MarketConditionPerformanceSharesMemberus-gaap:ShareBasedCompensationAwardTrancheOneMember2022-04-300001840776hgty:MarketConditionPerformanceSharesMemberus-gaap:ShareBasedCompensationAwardTrancheTwoMember2022-04-012022-04-300001840776hgty:MarketConditionPerformanceSharesMemberus-gaap:ShareBasedCompensationAwardTrancheTwoMember2022-04-300001840776hgty:MarketConditionPerformanceSharesMemberus-gaap:ShareBasedCompensationAwardTrancheThreeMember2022-04-012022-04-300001840776hgty:MarketConditionPerformanceSharesMemberus-gaap:ShareBasedCompensationAwardTrancheThreeMember2022-04-300001840776srt:MinimumMemberhgty:MarketConditionPerformanceSharesMember2022-04-012022-04-300001840776srt:MaximumMemberhgty:MarketConditionPerformanceSharesMember2022-04-012022-04-300001840776hgty:MarketConditionPerformanceSharesMember2025-01-012025-12-310001840776hgty:MarketConditionPerformanceSharesMember2025-12-310001840776hgty:PerformanceConditionPerformanceSharesMembersrt:MinimumMemberhgty:A2024PerformanceRestrictedStockUnitAgreementMember2024-03-310001840776hgty:PerformanceConditionPerformanceSharesMembersrt:MaximumMemberhgty:A2024PerformanceRestrictedStockUnitAgreementMember2024-03-310001840776hgty:PerformanceConditionPerformanceSharesMember2024-12-310001840776hgty:PerformanceConditionPerformanceSharesMember2025-01-012025-12-310001840776hgty:PerformanceConditionPerformanceSharesMember2025-12-310001840776hgty:A2024PerformanceRestrictedStockUnitAgreementMemberus-gaap:CommonClassAMember2025-01-012025-12-310001840776hgty:PerformanceConditionPerformanceSharesMember2024-01-012024-12-310001840776us-gaap:CommonClassAMemberhgty:EmployeeStockPurchasePlanMember2025-01-012025-12-310001840776us-gaap:CommonClassAMemberhgty:EmployeeStockPurchasePlanMember2025-12-310001840776hgty:HagertyGroupUnitsMember2025-01-012025-12-310001840776hgty:HagertyGroupUnitsMember2024-01-012024-12-310001840776hgty:HagertyGroupUnitsMember2023-01-012023-12-310001840776us-gaap:SeriesAPreferredStockMember2025-01-012025-12-310001840776us-gaap:SeriesAPreferredStockMember2024-01-012024-12-310001840776us-gaap:SeriesAPreferredStockMember2023-01-012023-12-310001840776us-gaap:StockCompensationPlanMember2025-01-012025-12-310001840776us-gaap:StockCompensationPlanMember2024-01-012024-12-310001840776us-gaap:StockCompensationPlanMember2023-01-012023-12-310001840776us-gaap:WarrantMember2025-01-012025-12-310001840776us-gaap:WarrantMember2024-01-012024-12-310001840776us-gaap:WarrantMember2023-01-012023-12-310001840776country:BM2025-01-012025-12-310001840776country:CA2025-01-012025-12-310001840776country:GB2025-01-012025-12-310001840776us-gaap:ForeignTaxJurisdictionOtherMember2025-01-012025-12-310001840776hgty:THGUnitExchangeMember2025-12-310001840776hgty:THGUnitExchangeMember2024-12-310001840776us-gaap:DomesticCountryMember2025-12-310001840776us-gaap:StateAndLocalJurisdictionMember2025-12-310001840776us-gaap:StateAndLocalJurisdictionMemberhgty:IndefiniteMember2025-12-310001840776us-gaap:StateAndLocalJurisdictionMemberhgty:TaxYear2026Through2045Member2025-12-310001840776us-gaap:ForeignCountryMember2025-12-310001840776us-gaap:ForeignCountryMemberhgty:IndefiniteMember2025-12-310001840776us-gaap:ForeignCountryMemberhgty:TaxYear2036Through2044Member2025-12-310001840776us-gaap:DomesticCountryMemberhgty:TaxYear2044Through2045Memberus-gaap:ResearchMember2025-12-3100018407762025-07-012025-09-300001840776hgty:THGUnitExchangeMember2025-07-012025-09-300001840776hgty:THGUnitExchangeMember2024-01-012024-12-3100018407762024-10-012024-12-310001840776hgty:HagertyIncMemberus-gaap:CommonClassAMembersrt:AffiliatedEntityMemberhgty:MarkelMember2025-12-310001840776hgty:HagertyIncMemberus-gaap:CommonClassAMembersrt:AffiliatedEntityMemberhgty:StateFarmMember2025-12-310001840776hgty:HagertyIncMemberhgty:CommonClassVMembersrt:AffiliatedEntityMemberhgty:MarkelMember2025-12-310001840776hgty:HagertyIncMemberhgty:CommonClassVMembersrt:AffiliatedEntityMemberhgty:StateFarmMember2025-12-310001840776hgty:HagertyIncMemberus-gaap:SeriesAPreferredStockMembersrt:AffiliatedEntityMemberhgty:MarkelMember2025-12-310001840776hgty:HagertyIncMemberus-gaap:SeriesAPreferredStockMembersrt:AffiliatedEntityMemberhgty:StateFarmMember2025-12-310001840776hgty:HagertyIncMembersrt:AffiliatedEntityMemberhgty:MarkelMemberhgty:HagertyGroupUnitsMember2025-12-310001840776hgty:HagertyIncMembersrt:AffiliatedEntityMemberhgty:StateFarmMemberhgty:HagertyGroupUnitsMember2025-12-310001840776hgty:HagertyIncMembersrt:AffiliatedEntityMemberhgty:MarkelMemberus-gaap:ParentMember2025-12-310001840776hgty:HagertyIncMembersrt:AffiliatedEntityMemberhgty:StateFarmMemberus-gaap:ParentMember2025-12-310001840776hgty:HagertyIncMembersrt:AffiliatedEntityMemberhgty:MarkelMember2025-12-310001840776hgty:HagertyIncMembersrt:AffiliatedEntityMemberhgty:StateFarmMember2025-12-310001840776srt:AffiliatedEntityMemberhgty:MarkelMemberhgty:AllianceAgreementMember2025-01-012025-12-310001840776srt:AffiliatedEntityMemberhgty:MarkelMemberhgty:AllianceAgreementMember2024-01-012024-12-310001840776srt:AffiliatedEntityMemberhgty:MarkelMemberhgty:AllianceAgreementMember2023-01-012023-12-310001840776srt:AffiliatedEntityMemberhgty:MarkelMemberhgty:RelatedPartyConcentrationRiskMemberus-gaap:RevenueFromContractWithCustomerMemberhgty:AllianceAgreementMember2025-01-012025-12-310001840776srt:AffiliatedEntityMemberhgty:MarkelMemberhgty:RelatedPartyConcentrationRiskMemberus-gaap:RevenueFromContractWithCustomerMemberhgty:AllianceAgreementMember2024-01-012024-12-310001840776srt:AffiliatedEntityMemberhgty:MarkelMemberhgty:RelatedPartyConcentrationRiskMemberus-gaap:RevenueFromContractWithCustomerMemberhgty:AllianceAgreementMember2023-01-012023-12-310001840776srt:AffiliatedEntityMemberhgty:MarkelMemberhgty:AllianceAgreementMember2025-12-310001840776srt:AffiliatedEntityMemberhgty:MarkelMemberhgty:AllianceAgreementMember2024-12-310001840776srt:AffiliatedEntityMemberhgty:MarkelMemberhgty:RelatedPartyConcentrationRiskMemberhgty:DueToRelatedPartiesMemberhgty:AllianceAgreementMember2025-01-012025-12-310001840776srt:AffiliatedEntityMemberhgty:MarkelMemberhgty:RelatedPartyConcentrationRiskMemberhgty:DueToRelatedPartiesMemberhgty:AllianceAgreementMember2024-01-012024-12-310001840776hgty:ReinsuranceAgreementMembersrt:AffiliatedEntityMember2025-01-012025-12-310001840776hgty:ReinsuranceAgreementMembersrt:AffiliatedEntityMember2023-01-012023-01-010001840776srt:AffiliatedEntityMemberhgty:MarkelMemberhgty:ReinsuranceAgreementMember2025-01-012025-12-310001840776srt:AffiliatedEntityMemberhgty:MarkelMemberhgty:ReinsuranceAgreementMember2024-01-012024-12-310001840776srt:AffiliatedEntityMemberhgty:MarkelMemberhgty:ReinsuranceAgreementMember2023-01-012023-12-310001840776srt:AffiliatedEntityMemberhgty:MarkelMemberhgty:ReinsuranceAgreementMember2025-12-310001840776srt:AffiliatedEntityMemberhgty:MarkelMemberhgty:ReinsuranceAgreementMember2024-12-310001840776srt:AffiliatedEntityMemberhgty:EvanstonMemberhgty:ReinsuranceAgreementMember2025-12-310001840776srt:AffiliatedEntityMemberhgty:EvanstonMemberhgty:ReinsuranceAgreementMember2024-12-310001840776srt:AffiliatedEntityMemberhgty:StateFarmMemberhgty:AllianceAgreementMember2025-01-012025-12-310001840776srt:AffiliatedEntityMemberhgty:StateFarmMemberhgty:AllianceAgreementMember2025-12-310001840776srt:AffiliatedEntityMemberhgty:StateFarmMemberhgty:ReinsuranceAgreementMember2025-01-012025-12-310001840776srt:AffiliatedEntityMemberhgty:StateFarmMemberhgty:ReinsuranceAgreementMember2024-01-012024-12-310001840776srt:AffiliatedEntityMemberhgty:StateFarmMemberhgty:ReinsuranceAgreementMember2023-01-012023-12-310001840776srt:AffiliatedEntityMemberhgty:StateFarmMemberhgty:ReinsuranceAgreementMember2025-12-310001840776srt:AffiliatedEntityMemberhgty:StateFarmMemberhgty:ReinsuranceAgreementMember2024-12-310001840776hgty:NewYorkDepartmentOfFinancialServicesMember2025-10-012025-10-310001840776hgty:NewYorkAttorneyGeneralMember2025-10-012025-10-310001840776srt:ParentCompanyMember2025-01-012025-12-310001840776srt:ParentCompanyMember2024-01-012024-12-310001840776srt:ParentCompanyMember2023-01-012023-12-310001840776srt:ParentCompanyMember2025-12-310001840776srt:ParentCompanyMember2024-12-310001840776us-gaap:CommonClassAMembersrt:ParentCompanyMember2025-12-310001840776us-gaap:CommonClassAMembersrt:ParentCompanyMember2024-12-310001840776hgty:CommonClassVMembersrt:ParentCompanyMember2025-12-310001840776hgty:CommonClassVMembersrt:ParentCompanyMember2024-12-310001840776srt:ParentCompanyMember2023-12-310001840776srt:ParentCompanyMember2022-12-310001840776stpr:CAsrt:ParentCompanyMember2025-01-012025-12-310001840776stpr:GAsrt:ParentCompanyMember2025-01-012025-12-310001840776stpr:NYsrt:ParentCompanyMember2025-01-012025-12-310001840776us-gaap:ValuationAllowanceOfDeferredTaxAssetsMember2024-12-310001840776us-gaap:ValuationAllowanceOfDeferredTaxAssetsMember2025-01-012025-12-310001840776us-gaap:ValuationAllowanceOfDeferredTaxAssetsMember2025-12-310001840776us-gaap:ValuationAllowanceOfDeferredTaxAssetsMember2023-12-310001840776us-gaap:ValuationAllowanceOfDeferredTaxAssetsMember2024-01-012024-12-310001840776us-gaap:ValuationAllowanceOfDeferredTaxAssetsMember2022-12-310001840776us-gaap:ValuationAllowanceOfDeferredTaxAssetsMember2023-01-012023-12-310001840776hgty:LaurieHarrisMember2025-10-012025-12-310001840776hgty:LaurieHarrisMember2025-12-3100018407762025-10-012025-12-31
ANNUAL REPORT PURSUANT TO SECTION 13 OR 15(d) OF THE SECURITIES EXCHANGE ACT OF 1934
For the fiscal year ended December 31, 2025
OR
☐
TRANSITION REPORT PURSUANT TO SECTION 13 OR 15(d) OF THE SECURITIES EXCHANGE ACT OF 1934
For the transition period from ________ to _______
Commission file number: 001-40244
HAGERTY, INC.
(Exact name of registrant as specified in its charter)
Delaware
86-1213144
(State of incorporation)
(I.R.S. Employer Identification No.)
121 Drivers Edge, Traverse City, Michigan
49684
(Address of principal executive offices)
(Zip code)
(800)922-4050
Registrant's telephone number, including area code
Securities registered pursuant to Section 12(b) of the Act:
Title of each class
Trading Symbols
Name of each exchange on which registered
Class A common stock, par value $0.0001 per share
HGTY
The New York Stock Exchange
Securities registered pursuant to section 12(g) of the Act: None
Indicate by check mark if the registrant is a well-known seasoned issuer, as defined in Rule 405 of the Securities Act. Yes ☐ No☒
Indicate by check mark if the registrant is not required to file reports pursuant to Section 13 or Section 15(d) of the Act. Yes ☐No☒
Indicate by check mark whether the registrant: (1) has filed all reports required to be filed by Section 13 or 15(d) of the Securities Exchange Act of 1934 during the preceding 12 months (or for such shorter period that the registrant was required to file such reports); and (2) has been subject to such filing requirements for the past 90 days. Yes☒ No ☐
Indicate by check mark whether the registrant has submitted electronically and posted on its corporate web site, if any, every Interactive Data File required to be submitted and posted pursuant to Rule 405 of Regulation S-T (§232.405 of this chapter) during the preceding 12 months (or for such shorter period that the registrant was required to submit and post such files). Yes☒ No ☐
Indicate by check mark whether the registrant is a large accelerated filer, an accelerated filer, a non-accelerated filer, smaller reporting company, or an emerging growth company. See the definitions of "large accelerated filer," "accelerated filer," "smaller reporting company," and "emerging growth company" in Rule 12b-2 of the Exchange Act.
Large accelerated filer
☐
Accelerated filer
☒
Non-accelerated filer
☐
Smaller reporting company
☐
Emerging growth company
☐
If an emerging growth company, indicate by check mark if the registrant has elected not to use the extended transition period for complying with any new or revised financial accounting standards provided pursuant to Section 13(a) of the Exchange Act. ☐
Indicate by check mark whether the registrant has filed a report on and attestation to its management's assessment of the effectiveness of its internal control over financial reporting under Section 404(b) of the Sarbanes-Oxley Act (15 U.S.C. 7262(b)) by the registered public accounting firm that prepared or issued its audit report. ☒
If securities are registered pursuant to Section 12(b) of the Act, indicate by check mark whether the financial statements of the registrant included in the filing reflect the correction of an error to previously issued financial statements. ☐
Indicate by check mark whether any of those error corrections are restatements that required a recovery analysis of incentive-based compensation received by any of the registrant's executive officers during the relevant recovery period pursuant to §240.10D-1(b) ☐
Indicate by check mark whether the registrant is a shell company (as defined in Rule 12b-2 of the Act). Yes ☐ No ☒
The aggregate market value of voting stock held by non-affiliates of the Registrant on June 30, 2025, based on the closing price of $10.11 for shares of the Registrant’s Class A Common Stock as reported by the New York Stock Exchange, was approximately $309.9 million. Shares of common stock beneficially owned by each executive officer, director, and holders of more than 10% of our common stock have been excluded in that such persons may be deemed to be affiliates. This determination of affiliate status is not necessarily a conclusive determination for other purposes.
The registrant had 101,066,533 shares of Class A Common Stock outstanding and 241,552,156 shares of Class V Common Stock outstanding as of February 20, 2026.
Documents incorporated by reference:
Portions of the registrant's definitive Proxy Statement for its 2026 Annual Meeting of Stockholders, which will be filed with the Securities and Exchange Commission within 120 days of December 31, 2025, are incorporated by reference into Part III, Items 10-14 of this Annual Report on Form 10-K.
Our Annual Reports on Form 10-K, Quarterly Reports on Form 10-Q, Current Reports on Form 8-K, as well as any amendments to those reports, are available free of charge through our website at investor.hagerty.com after we file them with, or furnish them to, the Securities and Exchange Commission ("SEC"). We use our investor relations website, investor.hagerty.com, as a means of disclosing information which may be of interest or material to our investors and for complying with disclosure obligations under Regulation FD. Accordingly, investors should monitor our investor relations website, in addition to following our press releases, SEC filings, public conference calls, webcasts, and social media channels. Information contained on or accessible through our website or social media channels is not a part of, and is not incorporated by reference into, this Annual Report on Form 10-K (this "Annual Report") or any other report or document we file with the SEC. Any reference to our website in this Annual Report is intended to be an inactive textual reference only.
Unless the context indicates otherwise, the terms "we," "our," "us," "Hagerty," and the "Company" refer to Hagerty, Inc. and its consolidated subsidiaries, including The Hagerty Group, LLC ("THG").
This Annual Report, as well as other oral or written information we provide, contain statements that constitute "forward-looking statements" within the meaning of the federal securities laws. All statements we provide, other than statements of historical fact, are forward-looking statements, including those regarding our future operating results and financial position, our business strategy and plans, products, services, and technology implementations, market conditions, growth and trends, expansion plans and opportunities, and our objectives for future operations. The words "anticipate," "believe," "envision," "estimate," "expect," "intend," "may," "plan," "predict," "project," "target," "potential," "will," "would," "could," "should," "continue," "ongoing," "contemplate," and similar expressions, and the negative of these expressions, are intended to identify forward-looking statements.
We have based these forward-looking statements largely on our current expectations about future events, which may not materialize. Actual results could differ materially and adversely from those anticipated or implied in our forward-looking statements. Some of the factors that could cause actual results to differ from our expectations include the risks and uncertainties described in Item 1A of Part I — Risk Factors of this Annual Report, which highlight, among other risks, our ability to:
•compete effectively within our industry and attract and retain our insurance policyholders and paid Hagerty Drivers Club subscribers (collectively, "Members");
•maintain key strategic relationships with our insurance distribution and underwriting carrier partners;
•prevent, monitor, and detect fraudulent activity;
•manage risks associated with disruptions, interruptions, outages or other issues with our technology platforms or our use of third-party services;
•accelerate the adoption of our membership and marketplace products and services, as well as any new insurance programs and products we offer;
•successfully implement the fronting arrangement consummated with Markel Group Inc. (together with its subsidiaries, "Markel") and realize the anticipated benefits while also managing the increased exposure to underwriting volatility, catastrophes, reinsurance counterparty risk, and legal, compliance, and regulatory risks resulting from the shift to our wholly owned subsidiary, Hagerty Reinsurance Limited ("Hagerty Re"), assuming 100% of the risk for policies written through this arrangement;
•underwrite and price new products, including Enthusiast+, consistent with expected loss ratios and risk tolerances;
•execute Broad Arrow Group, Inc.'s ("Broad Arrow") private sale, auction, and financing strategies;
•manage the cyclical nature of the insurance business and broader macroeconomic conditions, including inflation, interest rates, and potential recessionary pressures;
•achieve our investment objectives and avoid losses in our investment portfolio;
•address unexpected increases in the frequency or severity of claims, including catastrophe losses; and
•comply with the numerous laws and regulations applicable to our business, including without limitation state, federal, and foreign laws relating to insurance and rate increases, privacy and cybersecurity, marketing and advertising, digital services, accounting matters, tax, anti-money laundering, and economic sanctions.
You should not rely on forward-looking statements as predictions of future events. We operate in a very competitive and rapidly changing environment and new risks emerge from time to time. The forward-looking statements in this Annual Report represent our views as of the date hereof. We undertake no obligation to update any of these forward-looking statements for any reason after the date of this Annual Report.
We are a market leader in providing insurance for collector cars and enthusiast vehicles, helping the automotive enthusiast community protect and enjoy their special cars for more than 40 years. Our insurance products are complemented by our membership product, Hagerty Drivers Club ("HDC"), our renowned car events, and our media and entertainment platforms. We also operate a trusted marketplace where collectors and enthusiasts can buy and sell a wide range of vehicles, from entry level enthusiast vehicles to high value collector cars. Together, our integrated automotive ecosystem fosters a vibrant community where enthusiasts connect, share their passion, and access resources that enhance their ownership experience. Our vision is to be the world's most trusted and preferred brand for automotive enthusiasts to insure, buy, sell, and enjoy their special cars.
Beginning with this Annual Report, we present our Consolidated Financial Statements in accordance with Article 7 of Regulation S-X, reflecting the continued expansion of our insurance operations, including expanded risk assumption under the Markel Fronting Arrangement and the introduction of Enthusiast+, as discussed under "Markel Alliance" and "Drivers Edge Insurance Company"below. In addition, we now operate our business and report our financial performance using two segments: Insurance and Marketplace. Our segments provide management with a comprehensive financial view of our key businesses, as well as a framework for timely and rational allocation of resources.
Refer to "Transition to Article 7 Reporting Framework" in Item 7 of Part II of this Annual Report and Note 2 — Summary of Significant Accounting Policies in Item 8 of Part II of this Annual Report for additional information on the transition to Article 7 reporting.
Refer to Note 4 — Segment Reporting and Disaggregated Revenue in Item 8 of Part II of this Annual Report for additional information regarding segment reporting.
The first Hagerty company was founded in 1984. Hagerty, Inc., a Delaware corporation, was formed in 2020 and became a public company traded on the New York Stock Exchange ("NYSE") in 2021 under the ticker symbol HGTY.
Business Model and Competitive Strengths
The Hagerty brand has been carefully curated over the last four decades by providing Members with excellent customer service through our passionate team of automotive experts. We have become known as an automotive enthusiast brand built by drivers, for drivers. We believe that consumers who feel a part of an enthusiast community or club are more engaged and have higher renewal rates than those who simply purchase a good or service. With an insurance policy retention rate of nearly 90% and an average policy life of nine years, we have demonstrated a strong recurring revenue model that benefits from a combination of high insurance policy retention, new Member growth, and increases in premiums driven, in part, by the increasing values of insured vehicles over the long term.
Our connection to the automotive enthusiast community is complemented by HDC, our renowned car events, and our media and entertainment platforms, which generate positive ongoing engagement with current Members, as well as interest in our brand, products, and services from prospective members. The enthusiast community also benefits from the synergies of our trusted marketplace where we leverage our brand, relationships, and expertise to provide collectors and enthusiasts a seamless way to buy and sell a wide range of vehicles, from entry level enthusiast vehicles to high value collector cars.
Typical insurance businesses engage with their customers only a few times a year, but our diverse offerings result in numerous touchpoints with Members throughout the year. In addition, our media content features the work of talented automotive content creators, journalists, and storytellers who bring the automotive world to life in exciting and unexpected ways across a variety of digital, print, and video media formats. Our media team covers entertainment, news, market information, and vehicle valuation trends, all of which help generate an engaged audience that drives retention and attracts new Members. We believe our leading Net Promoter Score ("NPS")1 and strong retention rates reflect the effectiveness of our enthusiast ecosystem and that our business model is a significant advantage over competitors who, without strong affinity or engagement, are left to compete solely on price.
1NPS is a barometer of brand loyalty and engagement, supporting Member growth and policy retention. NPS is measured twice annually through a web-based survey sent by email invitation to a random sample of existing Members, which currently excludes customers in our Marketplace segment, and is reported annually using an average of the two surveys.
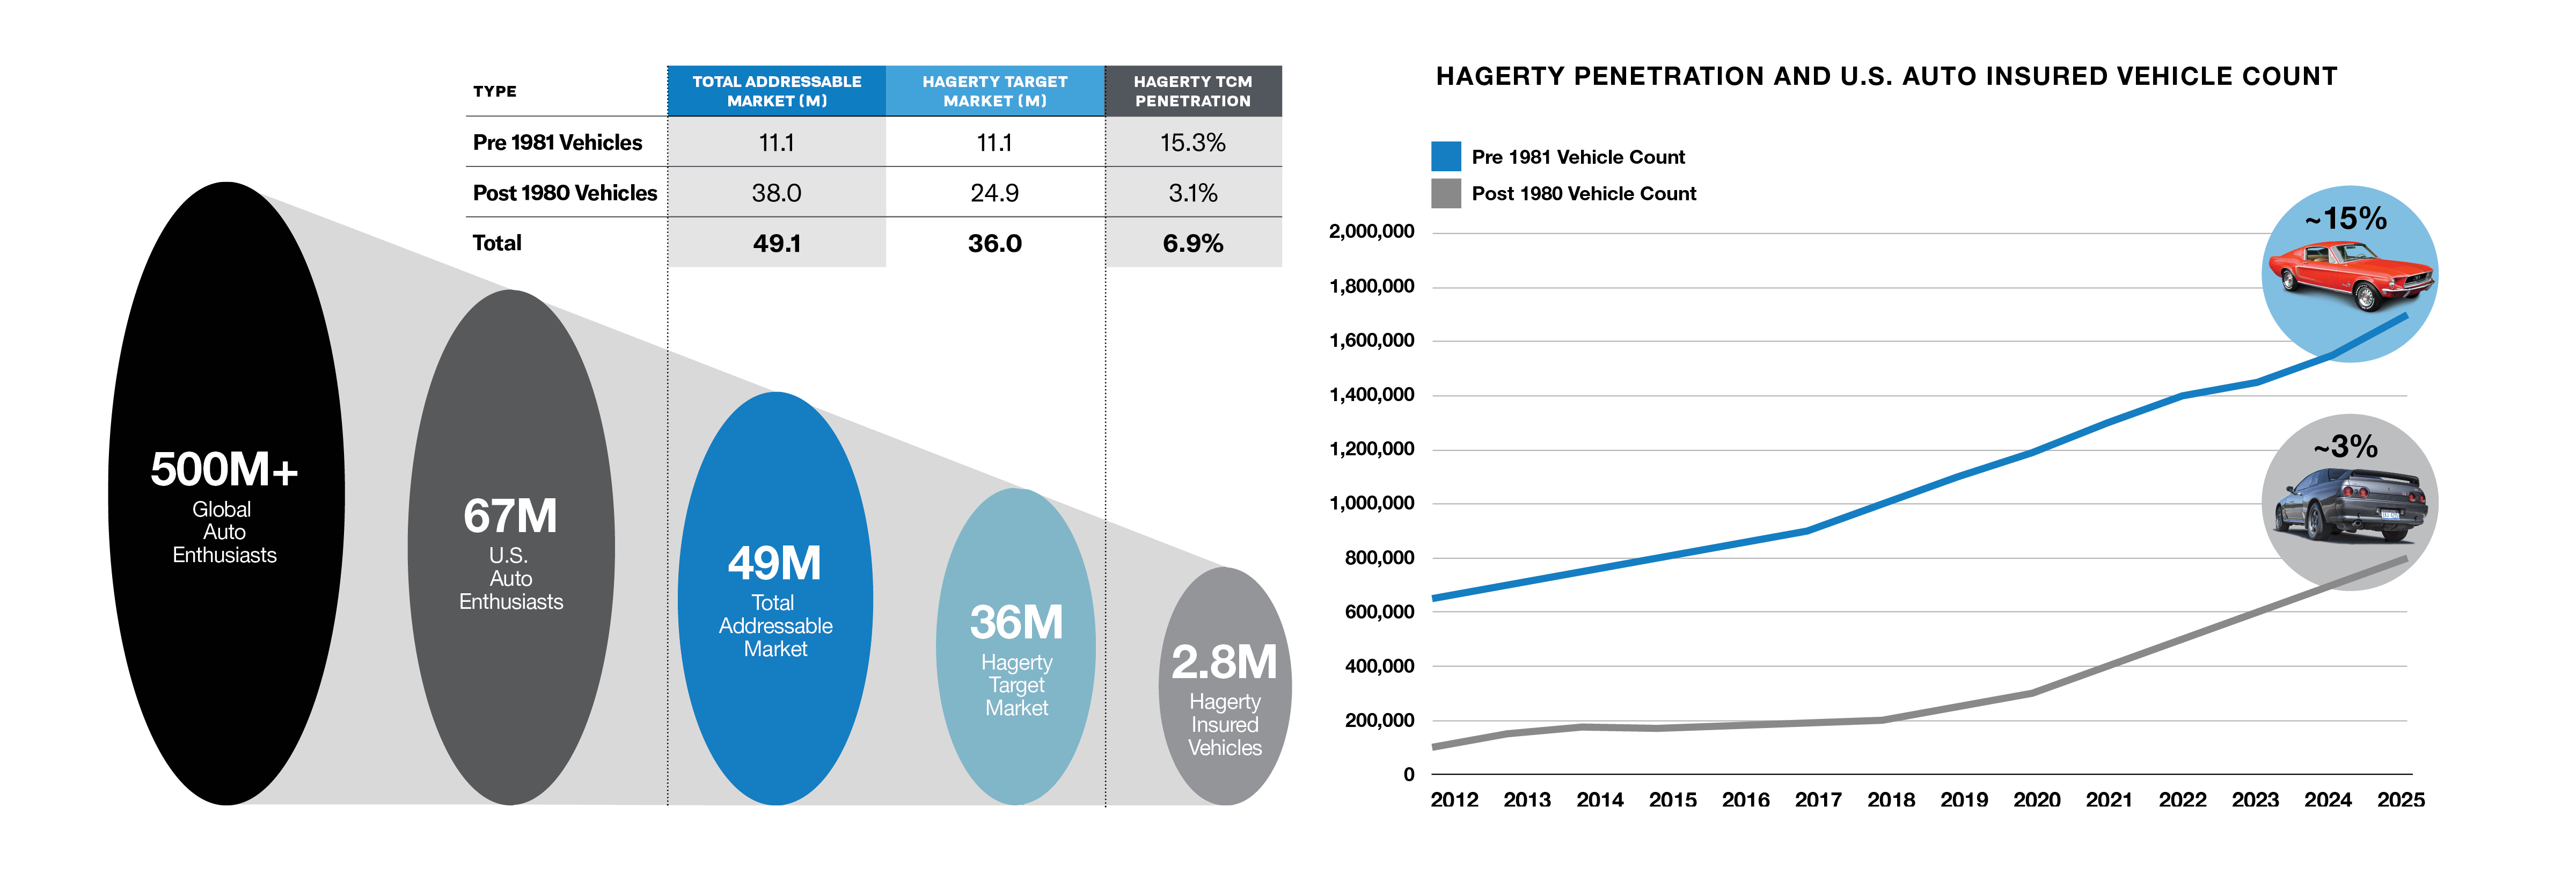
We have established ourselves as one of the leading providers of collector car and enthusiast vehicle insurance with an overall market share of approximately 7% within the United States ("U.S.") collector car and enthusiast vehicle market of 36 million vehicles. This includes an estimated market share of approximately 15% for pre-1981 classic vehicles in the U.S. and an estimated U.S. market share for post-1980 collectible vehicles of 3%. On this basis, we estimate that our U.S. target market of collector cars and enthusiast vehicles represents approximately $15 billion of annual written premium based on our average vehicle premium of $423 per year. Over the last decade, we have increased our written premium by a compound annual growth rate of 14%, powered primarily by strong growth in the number of our insurance policies in force.
We believe that our strong brand and value proposition position us well to capture a larger share of this growing market over the coming decade, including through our recent acquisition of Drivers Edge Insurance Company ("Drivers Edge"). For more information regarding Drivers Edge, refer to "Insurance and Reinsurance — Drivers Edge Insurance Company" below.
In order to fully capitalize on this opportunity, we perform a data-driven Member and vehicle analysis to understand vehicle ownership data, demographic data, vehicle usage, and values. Based upon this analysis, we are able to identify key vehicle markets, explore additional opportunities within these markets, and overlay demographic and usage data to enrich our approach and leverage the information to better serve the automotive enthusiast community.
Insurance Segment
We operate as a Managing General Agent ("MGA") by underwriting, selling, and servicing collector car and enthusiast vehicle insurance policies on behalf of our insurance carrier partners. Due to our consistent track record of delivering strong underwriting results, we then reinsure a significant portion of the risks written by our MGA subsidiaries through Hagerty Re. Hagerty Re reinsures risks predominantly from policies issued by Essentia Insurance Company ("Essentia"), a wholly owned subsidiary of Markel. Hagerty Re's quota share percentage for the risks that is assumes from Essentia has ranged from 25% at the program's inception to 80% as of December 31, 2025, and increased to 100% in 2026 as discussed under "Markel Alliance" below.
Our insurance offerings are centered around our "Guaranteed Value" insurance policy, which differentiates our coverage from the standard auto insurance market by insuring covered vehicles at their agreed upon value, rather than their depreciated value. We work closely with our Members to determine the right amount of coverage for their vehicle, utilizing Hagerty Valuation Tools, which has been built over decades of collecting vehicle sales information, to accurately assess the risk associated with insuring collector cars and enthusiast vehicles.
For over 40 years, we have consistently grown our insurance business and, as of December 31, 2025, 2.8 million collector cars and enthusiast vehicles were covered by our insurance policies. We have built a strong reputation for providing excellent customer service through our passionate team of member service center professionals, resulting in an NPS of approximately 81 in recent years, an insurance policy retention rate approaching 90%, and a typical policy life of approximately nine years.
For the years ended December 31, 2025, 2024, and 2023, Insurance segment revenue represented 92%, 96% and 97%, respectively, of our total revenue.
Operating as an MGA allows us to offer our insurance products through an omnichannel distribution model, enabling us to sell our insurance wherever our policyholders need us. This omnichannel approach allows us to offer our insurance products across two channels: (i) directly to consumers; and (ii) through our agent channel, which includes a vast network of independent agents and brokers, as well as strategic distribution partnerships with large traditional auto insurers. We believe that this distribution model creates a win-win situation that allows us to capture more of the collector car and enthusiast vehicle insurance market. In connection with the servicing of insurance policies, we also handle claims on behalf of our insurance carrier partners to ensure that our Members receive a high level of service focused on the unique requirements of repairing vintage and rare vehicles.
When operating as an MGA, we earn commission and fee revenue primarily from the underwriting, sale, and servicing of collector car and enthusiast vehicle insurance policies written on behalf of insurance carriers. For the years ended December 31, 2025, 2024, and 2023, commission and fee revenue earned by our MGA subsidiaries represented 33%, 34%, and 36%, respectively, of our total revenue.
Direct Sales Channel
Our direct sales channel is serviced by our employee agents who sell policies in the U.S., Canada, and the United Kingdom ("U.K."). For the year ended December 31, 2025, approximately 44% of our total auto written premium was generated through direct sales.
Agent Channel
We market our insurance products through our insurance distribution partnerships, which include 9 of the top 10 largest auto insurers, as ranked by the National Association of Insurance Commissioners based upon 2024 direct premiums written. Under these arrangements, we generally make our specialty insurance products and related services available to the insurers' agents, who then refer or present Hagerty to their customers. Our track record of expertise and growth creates opportunities for cultivating strong, mutually beneficial distribution partnerships that allow us to continue to meaningfully grow our share of the collector car and enthusiast vehicle market in the U.S.
Most insurance companies offer and compete for multi-line insurance: auto, homeowners, umbrella, watercraft, aircraft, and other exclusive collectibles. Our focus on collector car and enthusiast vehicle products reduces competitive threats for partners and raises their confidence in transacting with us. Furthermore, we focus on developing capabilities that serve the interests of the automotive enthusiast market. This depth and discipline of focus has enabled us to maintain a "neutral" and non-threatening partner of choice position with the highest quality automobile insurance companies in the market as we help them reduce the risk of losing a customer and the total value of the bundled insurance and membership offerings.
Our approach to distribution partnerships enables complementary growth. Our business model is attractive to our partners because we offer a full-service solution for their customers and their special cars. Our focus on the collector car and enthusiast vehicle space allows our distribution partners to focus on other parts of their business portfolios and because our financial interests are aligned, both parties benefit from the relationship. We do well when our partners win and grow, and we take great care to build partnerships with companies who share our focus on excellent customer service. As a result of these partnerships, both brands benefit symbiotically through longer-lasting and more intimate customer relationships.
We also have relationships with over 54,000 independent agents and brokers, representing all top 10 brokers in the U.S. by revenue. Our high-engagement and experiential approach to the market is often co-branded by independent agents and brokers to deliver automotive enthusiasts an experience the agent or broker could not deliver themselves.
For the year ended December 31, 2025, approximately 56% of our total U.S. auto written premium was generated through our agent channel.
Insurance and Reinsurance
Hagerty Re
Hagerty Re's primary function is to reinsure a significant portion of the risk underwritten by our MGA subsidiaries, allowing us to retain and manage risk on our balance sheet, efficiently deploy capital, and participate directly in the underwriting profit generated by our MGA operations.
Hagerty Re reinsures risks predominantly from policies issued by Essentia. Hagerty Re's quota share percentage for the risks that it assumes from Essentia has ranged from 25% at the program's inception to 80% as of December 31, 2025, and increased to 100% in 2026 as discussed under "Markel Alliance" below.
Our risk management philosophy is rooted in actuarial discipline and a deliberate approach to underwriting. Through our MGA subsidiaries, we leverage proprietary data analytics, rigorous pricing models, and ongoing reserve analysis to ensure prudent risk selection and loss reserving. Over the last three years, Hagerty Re has achieved an average loss ratio of 42%, which is significantly better than the overall auto insurance industry average of approximately 74%, excluding loss adjustment expenses. This performance underscores our ability to deliver consistent, profitable underwriting results and highlights the effectiveness of our risk management framework.
Hagerty Re purchases catastrophe reinsurance to manage risk exposure and protect its capital from large catastrophic events, and facultative reinsurance to cede a portion of the physical damage exposure related to certain high value vehicles. In addition, Hagerty Re cedes 100% of its physical damage exposure on U.S. policies written or renewed with total insured values ("TIV") equal to or greater than $5.0 million ("High-Net-Worth Accounts") via quota share agreements with various reinsurers. These High-Net-Worth Accounts are assumed 100% from Essentia. Certain reinsurers involved in these quota share agreements are related parties. Refer to Note 16 — Reinsurance and Note 24 — Related-Party Transactions in Item 8 of Part II of this Annual Report for additional information.
Hagerty Re is a registered Class 3A reinsurer under the Bermuda Insurance Act of 1978 and is subject to comprehensive regulatory oversight by the Bermuda Monetary Authority ("BMA"). Under its license, Hagerty Re is only permitted to accept business underwritten by our MGA subsidiaries on behalf of our insurance carrier partners. The BMA requires Hagerty Re to maintain minimum capital and surplus levels, comply with solvency and liquidity ratios, adhere to restrictions on dividends and investment activities, and satisfy reporting obligations. In addition, Hagerty Re's reinsurance arrangements are structured to ensure that all counterparties meet stringent credit quality standards, further reinforcing the financial strength and stability of our insurance platform.
For the years ended December 31, 2025, 2024, and 2023, Hagerty Re earned premium represented 50%, 52%, and 52%, respectively, of our total revenue.
Drivers Edge Insurance Company
In September 2024, we acquired all the issued and outstanding capital stock of Consolidated National Insurance Company ("CNIC"), which was a shell insurance company holding certain state licenses. CNIC was subsequently renamed Drivers Edge Insurance Company. In the third quarter of 2025, Drivers Edge launched Enthusiast+ in Colorado, which is a new insurance product tailored for modern enthusiast vehicles that are typically driven more frequently and stored more flexibly than traditional collector cars. This product evolved from our growing exposure to modern enthusiast vehicles and is designed to broaden our addressable market by offering coverage to a wider range of vehicles and customer profiles. The entirety of the risk underwritten by our U.S. MGA subsidiary on behalf of Drivers Edge is ceded to Hagerty Re.
We expect Enthusiast+ policies to command higher premiums and, given the distinct risk characteristics of the targeted vehicles and customer segments, have higher loss ratios relative to our traditional insurance offerings. Enthusiast+ features differentiated pricing and advanced coverage options, representing a strategic evolution in our risk profile and business model.
We plan to implement a phased, nationwide rollout of Enthusiast+ over the next four years. We believe that Enthusiast+ will generate attractive returns for us, widen our funnel of insurable vehicles, and contribute to the long-term growth and diversification of our insurance portfolio.
HDC, Events and Media
Our Insurance segment also offers HDC memberships, which are bundled with our insurance policies and provide Members with access to an array of products and services, including emergency roadside assistance, Hagerty Drivers Club Magazine, special access to automotive enthusiast events, our proprietary vehicle valuation tool, and special vehicle-related discounts. Lastly, our Insurance segment includes related ancillary activities such as our events and media and entertainment platforms, which support brand awareness and sales of our insurance policies through their distribution and high rates of pass-along circulation.
We are party to an alliance agreement (the "Markel Alliance Agreement") and associated agency and claims services agreements with Markel, which govern our long-standing business relationship related to marketing, underwriting, and administration of personal automobile insurance for collector cars and enthusiast vehicles in the U.S. Under this arrangement, our U.S. MGA subsidiary is licensed and authorized to develop insurance products, underwrite, bill, and perform claims services for policies written through Essentia. Essentia is exclusive to our U.S. MGA subsidiary and only writes insurance policies we produce. State laws govern many of the activities under this relationship and our MGA subsidiary must maintain the appropriate licensing as a producer and, where required, as an MGA, plus additional requirements in some states for claims adjusting. In 2025 and 2024, our U.S. MGA subsidiary earned a base commission rate of approximately 37%, as well as an additional contingent underwriting commission ("CUC") that scaled annually from -5% to a maximum of +5% of written premium.
On December 31, 2025, we entered into new contractual arrangements and amended the terms of our existing contractual arrangements with Markel and its affiliates. These coordinated transactions with Markel formed an arrangement that became effective January 1, 2026 (the "Markel Fronting Arrangement"). Under the Markel Fronting Arrangement: (i) we continue to issue policies through Essentia, with our underwriting authority (including pricing decisions, rate filing, insurance rating, and risk selections) and claims authority expanded to the maximum levels permitted by applicable law; (ii) we have assumed increased administrative responsibilities for the policies issued through Essentia; (iii) Hagerty Re controls 100% of the premium and assumes 100% of the risk for policies issued through Essentia; and (iv) Hagerty Re pays an initial fronting fee, representing 2% of written premium, to Markel for administrative support, which incrementally decreases based on the level of written premium in each calendar year. We expect these changes to result in increased profitability and additional control, allowing for enhanced operational efficiencies.
As a result of these changes, beginning in the first quarter of 2026, our accounting for the Essentia book of business will significantly change, impacting the recognition of commission revenue earned by our U.S. MGA subsidiary and ceding commission expense incurred by Hagerty Re. Refer to the section entitled "Recent Developments" within Item 7 of Part II of this Annual Report for additional information.
For the years ended December 31, 2025, 2024, and 2023, commission revenue associated with the Markel Alliance Agreement was $436.8 million, $388.0 million, and $340.5 million, respectively, representing 91%, 93%, and 95%, respectively, of total commission revenue.
Markel is a related party to the Company. Refer to Note 24 — Related-Party Transactions in Item 8 of Part II of this Annual Report for additional information.
Aviva Canada Alliance
Aviva Canada Inc. ("Aviva") serves as the carrier for the specialty collector vehicle insurance policies sold by our Canadian MGA subsidiary ("Hagerty Canada"). The relationship with Aviva in Canada is exclusive with respect to specialty, enthusiast, classic, and collector vehicle insurance, with the exception of the Quebec province, where a third-party insurance agency carries the appropriate licenses and authority to submit business to Aviva. Aviva and Hagerty Re also have a quota share reinsurance agreement under which Hagerty Re reinsures 50% of the risk written by Hagerty Canada on behalf of Aviva. Canadian provincial laws govern many of the activities under this relationship and Hagerty Canada must maintain the appropriate licensing. The terms of our agreements with Aviva expire in 2030 and include a 5-year extension if certain thresholds are met.
State Farm Alliance
We have a 10-year master alliance agreement and associated managing general underwriter agreement with State Farm Mutual Automobile Insurance Company ("State Farm") (the "State Farm Master Alliance Agreement") under which State Farm Classic+ policies are offered to State Farm's customers through State Farm agents. This program began offering State Farm Classic+ policies in September 2023. As of December 31, 2025, State Farm Classic+ policies were being offered in 27 states, with conversions of their existing book of business occurring in seven of these states and plans to offer such policies in additional states in 2026 and 2027. Hagerty Re does not have a quota share reinsurance agreement with State Farm and as such, we do not reinsure any of the risk written under the State Farm Classic+ policies. Under the State Farm Master Alliance Agreement, State Farm paid Hagerty an advanced commission of $20.0 million in 2020, which is being recognized as "Commission and fee revenue" over the remaining life of the arrangement. In addition, we are paid a commission for underwriting, binding coverage, and issuing State Farm Classic+ policies and can offer HDC memberships to State Farm Classic+ customers, providing us an additional revenue opportunity.
State Farm is a related party to the Company. Refer to Note 24 — Related-Party Transactions in Item 8 of Part II of this Annual Report for additional information.
Our Insurance segment operates in certain geographic regions where vehicles are purchased and driven more frequently during the spring and summer months, and a larger portion of our annual insurance policies renew during those months. Accordingly, we experience peak MGA commission and fee revenue in the second and third quarters of the year. In addition, catastrophic loss events, such as hurricanes and wildfires, are typically more prevalent in the second half of the year, so our losses and loss adjustment expenses may reflect that seasonality. As a result of these factors, we have historically experienced seasonal fluctuations in our quarterly operating results, which may not fully reflect the underlying performance of our business.
Marketplace Segment
We strive to be the most trusted marketplace where collectors and enthusiasts can buy and sell a wide range of vehicles, ranging from entry level enthusiast vehicles to high value collector cars. Our marketplace offerings include live auctions and an online sale platform, as well as brokered private sales, where we facilitate transactions on behalf of sellers and buyers. From time to time, we also purchase cars or entire collections through our Marketplace segment when a seller prefers an outright sale instead of an auction or brokered private sale.
At the high-end of the collector car and enthusiast vehicle market, where values typically exceed $100,000, our live auctions and brokered private sales are conducted by our wholly owned subsidiary, Broad Arrow. In addition to consigning cars to auctions or through brokered private sales, from time to time, Broad Arrow opportunistically acquires collector cars and enthusiast vehicles when the owner(s) prefer an immediate sale rather than consigning the vehicle(s) for auction or private sale. In those instances, Broad Arrow opportunistically acquires the cars and offers them for sale at auction or through private sale. At lower price points, typically below $100,000, our Marketplace segment offers sellers the ability to list their vehicles on digital auctions through Hagerty Marketplace, where we earn a bidder fee for successful introductions on our online sale platform. Hagerty Marketplace also offers a classifieds platform for our Members, where we currently do not earn a fee.
As compensation for our live auction services, we earn a commission from both the buyer ("buyer's premium") and, to a lesser extent, the seller ("seller's commission") (collectively, "auction commission revenue"), both of which are typically calculated as a percentage of the hammer (sale) price of the vehicle sold at auction. We also earn private sales commissions through the direct brokering of purchases and sales of classic cars and enthusiast vehicles.
The market for buying and selling collector cars and enthusiast vehicles is substantial, encompassing live auctions and digital sales, as well as private sales. We estimate that there are approximately 36 million insurable collector cars and enthusiast vehicles in the U.S. and in 2025, in our U.S. insurance book alone, we observed over 300,000 collector car and enthusiast vehicle transactions. We believe we can differentiate ourselves from other platforms and services by incorporating a higher level of trust into this marketplace by using our existing size, scale, reach, improved processes, and trusted brand status.
During 2025, Broad Arrow expanded its live auction and private sale offerings in the EMEA region. This led to three inaugural European auctions for Broad Arrow: the Concorso d’Eleganza Villa d’Este Auction in partnership with BMW AG on the shores of Lake Como in Italy in the second quarter, the Zoute Concours Auction in partnership with Zoute Grand Prix Car Week held in Knokke-Heist, Belgium in the fourth quarter, and the Zürich Auction in partnership with Auto Zürich held in Zürich, Switzerland in the fourth quarter. In addition to Broad Arrow's European expansion, Broad Arrow became the official auction partner of Concours at Wynn Las Vegas, a new auction for Broad Arrow in the fourth quarter of 2025.
In 2026, Broad Arrow expects to further expand its auction calendar. In the first quarter, Broad Arrow added an online auction during the Salon Retromobile week in Paris. In the third quarter, Broad Arrow will be the official auction partner of The Quail, a Motorsports Gathering in Carmel, California. The Quail Auction will replace the Monterey Jet Center Auction. In the fourth quarter, Broad Arrow will host its first auction as the official auction partner of the Audrain Newport Concours and Motor Week in Newport, Rhode Island. Each of these auctions are held in partnership with various well-established concurs and/or automotive events with multi-year partnership agreements.
We also provide financing solutions to qualified collectors and businesses in the U.S., Canada, the U.K., and certain European countries by structuring loans secured by their collector cars through our wholly owned subsidiary Broad Arrow Capital LLC ("BAC"). The loans underwritten by BAC include term loans and short-term bridge loans. Loans underwritten by BAC are typically $250,000 or higher, with a focus on collector cars and enthusiast vehicles that are typically not financed by traditional banks and lenders. The lending activities of BAC are funded, in part, with borrowings drawn from a dedicated revolving credit facility, with the remainder funded by our available liquidity. In November 2025, BAC amended its dedicated revolving credit facility to, among other things, increase its borrowing capacity from $75 million to $150 million. For information regarding the BAC loan portfolio, refer to Note 7 — Notes Receivable in Item 8 of Part II of this Annual Report.
For the years ended December 31, 2025, 2024, and 2023, Marketplace segment revenue represented 8%, 4%, and 3%, respectively, of our total revenue.
Investments
Investment income is a meaningful component of our earnings. The predominant portion of our investment portfolio is held at Hagerty Re. As a reinsurer, Hagerty Re receives premiums and is required to provide ceding carriers with security, which it provides primarily in the form of trust accounts. Such funds make up a majority of our investment portfolio. Our investment portfolio predominantly consists of fixed maturity securities such as corporate bonds, U.S. treasury securities, and agency mortgage-backed securities. Our investment portfolio also includes a relatively small balance of equity securities and other strategic direct investments.
We seek to generate an attractive total return on an after-tax basis, net of fees, over the long-term, subject to the following objectives and constraints: (i) compliance with all legal, regulatory, and contractual requirements; (ii) maintaining strong liquidity; (iii) assuming a level of risk that is carefully calibrated and responsive to enterprise-wide considerations; and (iv) returns should be achieved through executing an efficient, diversified portfolio.
Our investments as of December 31, 2025 and 2024 are summarized as follows:
As of December 31, 2025
Estimated Fair Value
% of Estimated Fair Value
Fixed maturities:
in thousands (except percentages)
Corporate
$
266,168
25.6
%
U.S. Treasury
181,617
17.5
%
States and municipalities
30,146
2.9
%
Foreign
32,992
3.2
%
Asset-backed securities
32,251
3.1
%
Mortgage-backed securities
153,097
14.7
%
Total fixed maturities
696,271
67.1
%
Equity securities
34,871
3.4
%
Cash and cash equivalents and restricted cash and cash equivalents
Cash and cash equivalents and restricted cash and cash equivalents
232,845
28.0
%
Other investments
7,831
0.9
%
Total investments
$
830,203
100.0
%
Refer to the section titled "Risk Factors — Risks Related to Our Business — Performance of our investment portfolio is subject to a variety of investment risks that may adversely affect our financial results." withinItem 1A of Part I — Risk Factors and Note 5 — Investments in Item 8 of Part II of this Annual Report for additional information.
Regulatory Environment
We operate across jurisdictions in North America and Europe and our businesses (in particular, insurance) are subject to comprehensive regulation and supervision. Each jurisdiction in which we operate has established supervisory agencies with broad administrative and oversight powers for various business practices (for example, financial services consumer protection and data protection). While we are not aware of any proposed or recently enacted domestic or international regulation that would have a material impact on our operations, earnings, or competitive position, we cannot predict the effect that future regulatory changes might have on us. Refer to the section titled "Risk Factors — Legal, Regulatory and Political Risks" within Item 1A of Part I — Risk Factors in this Annual Report for additional information.
Intellectual Property
We believe our intellectual property rights are valuable and important to our business. We rely on trademarks, patents, copyrights, trade secrets, license agreements, intellectual property assignment agreements, confidentiality procedures, non-disclosure agreements, and electronic and physical security measures to establish and protect our proprietary rights. Though we rely in part upon these legal, contractual, and other protections, we believe that factors such as the skill and ingenuity of our employees and the functionality and frequent enhancements to our platform are large contributors to our success. We intend to pursue additional intellectual property protection on such enhancements to the extent we believe it would be beneficial and cost-effective.
As of December 31, 2025, we have two issued patents in the U.S. and one in Canada. The issued patents generally relate to (i) our vehicle information number decoder, which allows us to determine vehicle configuration details and associated vehicle values; and (ii) our method and system for storage and selective sharing of vehicle data. The issued patents are expected to expire in August 2030, May 2031, and May 2033, respectively. We continually review our development efforts to assess the existence and the ability to protect new intellectual property.
We have trademark rights in our name, our logo, and other brand indicia, and have trademark registrations for select markets in the U.S., Canada, U.K., European Union, and Australia. We have copyrights for our media and entertainment content and registered copyrights for our vehicle information tools in the U.S. We also have registered various domain names related to our brand for websites that we use in our business, including Hagerty.com.
Although we believe our intellectual property rights are valuable and strong, intellectual property rights are sometimes subject to invalidation or circumvention. Refer to the section titled "Risk Factors — Legal, Regulatory and Political Risks — Our intellectual property rights are extremely valuable and if they are not properly protected, our products, services, and brand could be adversely impacted." within Item 1A of Part I — Risk Factors, in this Annual Report for additional information.
We believe that our business model of integrated products and services is unique. While there are other specialty insurance companies offering collector car insurance, the size of their operations is small compared to ours. We believe our enthusiast-centered ecosystem, with a focus on community and engagement, is a significant competitive advantage over competitors who, without strong affinity or engagement, are left to compete solely based on price. We experience some competition in the larger standard auto insurance market as the majority of collector cars and enthusiast vehicles are currently insured through traditional auto insurance carriers. However, in lieu of competing directly with standard auto insurance carriers, we have formed relationships with many of them to offer their customers our specialty insurance products and HDC memberships. These relationships with the largest auto insurance carriers enable us to provide a high-touchpoint experience for customers, resulting in more appropriate levels of coverage and higher overall customer service satisfaction.
The collector car and enthusiast vehicle market is highly competitive for both Broad Arrow at the high-end of the market and Hagerty Marketplace at the lower price points. A fundamental challenge facing any auctioneer or dealer is the sourcing of high quality and valuable vehicles for sale either as agent or principal. The ability to obtain such vehicles for consignment is often dependent on collector and dealer relationships, which can sometimes take years to develop. In the market for high-end collector car and enthusiast vehicles, Broad Arrow primarily competes with other global auction houses, including RM Sotheby’s, Gooding Christie’s, Bonhams, and Artcurial. In the market for lower priced collector car and enthusiast vehicles, Hagerty Marketplace primarily competes with traditional auction houses including Barrett-Jackson and Mecum, and digital auction platforms including Bring a Trailer Auctions, Cars & Bids, PCARMARKET, and Collecting Cars.
Human Capital
Our performance-based culture is shaped by our people, and their engagement, accountability and alignment with our key objectives as an organization. Our strategy involves hiring great people, providing challenging and meaningful work, and investing in their professional and personal development, and we believe this creates a strategic advantage for us. Our objectives include effectively identifying, recruiting, retaining, and incentivizing our employees. As of December 31, 2025, we had 1,891 full-time employees. None of our employees are represented by a labor union or covered by a collective bargaining agreement.
Compensation
Our compensation programs are designed to attract, retain, and motivate talented, deeply qualified, and committed individuals who believe in our mission, while rewarding employees for long-term value creation. We have a pay-for-performance culture in which employee compensation is aligned to company performance, as well as individual contributions and impacts. The potential for stock-based compensation awards through our equity incentive plan, as well as the opportunity to participate in an employee stock purchase plan are designed to align employee compensation to the long-term interests of our stockholders, while encouraging them to think and act like owners. We strive for a fair, competitive, transparent, and equitable approach in recognizing and rewarding our employees.
Health and Wellness
The health and wellness of our employees and their families is integral to our success. We have a comprehensive benefits program to support the physical, mental, and financial well-being of our employees. We have a self-insured medical plan in which our employees pay approximately 21% of the monthly estimated premiums. In addition to core medical benefits, we offer maternity and paternity benefits, as well as employee assistance programs to support the mental health of our employees. Additionally, aside from our competitive paid time off program, we offer caregiver time off, which provides employees 40 hours each year of paid time off for caregiver responsibilities.
Performance Culture
Our performance culture objective is to be a company where each employee genuinely belongs, is respected and valued, and is driven to do their best work. We take this to heart not just within our Company, but also within the broader automotive enthusiast community.
To help achieve our goals, we ensure fair and transparent processes in talent assessment, hiring, performance management, career progression, and retention. We are creating an environment focused on the respectful treatment of others, including employees, Members, and partners. Engagement and belonging are fueled by having a meaningful connection to others and opportunities to grow and develop careers. Across these dimensions, we are building programs, systems, and tools that foster greater belonging.
We intend to continue to invest and further develop our leadership training and support to ensure that all leaders — those promoted, developing, or hired — understand how to effectively lead a high-performance team.
Below are certain risks and uncertainties applicable to our business and the industry in which we operate, and some of which are beyond our control. These are not the only risks we face. Additional risks and uncertainties that we are unaware of, or that we currently believe are not material, may also become important factors that affect us. You should carefully read these risks as well as the cautionary statements referred to in "Cautionary Statement Regarding Forward-Looking Statements" herein. If any of the risks and uncertainties described below or elsewhere in this Annual Report actually occur, our business, financial condition or results of operations could be materially and adversely affected, the trading price of our securities could decline, and you might lose all or part of your investment.
Risk Factors Summary
Our business is subject to numerous risks and uncertainties of which you should be aware. Among others, these risks relate to:
•our ability to attract and retain Members and compete effectively within our industry;
•our dependence on a limited number of insurance distribution and underwriting carrier partners;
•our ability to prevent, monitor, and detect fraudulent activity;
•issues with our technology platforms and our ability to anticipate or prevent cyberattacks;
•our ability to continue to develop, implement, and maintain the confidentiality of our proprietary technology and prevent the misappropriation of our data;
•our reliance on a highly skilled management team, workforce, and unique culture;
•our ability to successfully execute and integrate future acquisitions, partnerships and investments;
•new products and services with limited operating history that may not achieve profitability as quickly as anticipated, or at all;
•the performance of our investment portfolio, which is subject to a variety of investment risks;
•our reliance on a limited number of payment processing services;
•our susceptibility to inflation, interest rate, and foreign currency exchange rate fluctuations;
•tariffs on imported goods, which may increase our costs and reduce consumer spending on collector cars and related services, which could adversely affect our business, financial condition, and results of operations;
•unexpected increases in the frequency or severity of claims, including increases caused by catastrophic events;
•compliance with the numerous laws and regulations applicable to our business, including state, federal and foreign laws relating to insurance and rate increases, privacy and cybersecurity, marketing and advertising, digital services, accounting matters, tax, anti-money laundering, and economic sanctions;
•the cyclical nature of the insurance business and our dependence on our ability to collect vehicle usage and driving data;
•the ability or unwillingness of our reinsurers to pay claims on a timely basis, or at all, which may materially adversely affect our business, financial condition, and results of operations;
•unexpected changes in the interpretation of our coverage or provisions, including loss limitations and exclusions, in the insurance policies we sell and service;
•our ability to realize the anticipated benefits from the growth and integration of our Marketplace segment offerings with our other businesses;
•the potential for significant fluctuations in the collector car market and asset values, which may materially impact our ability to obtain and sell consigned vehicles and may have an adverse effect on the loan-to-value ("LTV") ratio of our loan portfolio within the Marketplace segment;
•the accounting implications of the Markel Fronting Arrangement, which will impact the recognition of commission revenue and ceding commission expense, may not be readily understood by market participants;
•the fact that we are a "controlled company" within the meaning of the NYSE listing requirements, and, as a result, we will qualify for, and intend to rely on, exemptions from certain corporate governance requirements;
•the fact that Hagerty Holding Corp. ("HHC") controls us, and its interests may conflict with ours or yours in the future;
•potential that the price of our securities may be volatile or may decline regardless of our operating performance; and
•the fact that Hagerty, Inc.'s only material asset is its interest in THG, and, accordingly, it will depend on distributions from THG to pay taxes and payments under the Tax Receivable Agreement ("TRA").
Risks Related to Our Business
We have experienced significant Member growth in recent years. Our business and revenue growth depend on our ability to continuously attract and retain Members, which we cannot assure, and Member retention may decline.
We believe our growth depends on our ability to: (i) retain existing Members; (ii) add Members in our current markets, as well as new geographic markets; (iii) add new insurance programs and products; and (iv) continue to grow our offering of non-insurance automotive enthusiast-related products. Increasing our Member count, expanding into new geographic markets, and introducing new product and service offerings may be time-consuming and expensive. In addition, if existing Members and consumers do not perceive our offerings to be of value, including if we introduce new or adjust existing features, coverage or service offerings, or change the mix of offerings in a manner that is not favorably received, we may not be able to retain existing Members or attract new Members. We may also, from time to time, adjust pricing or the pricing model itself, which may result in cancelled insurance policies or HDC memberships and fewer new Members joining our programs.
Many of our Members are referred to us by existing Members. Therefore, if our efforts to satisfy our existing Members are not successful, we may not be able to attract new Members, and as a result, our ability to grow our business will be adversely affected. Similarly, a large percentage of our revenues are derived from direct-to-consumer sales, including through digital channels. If we fail to meet consumer expectations for the Member experience through digital or other sales channels, our growth may be impacted through the loss of existing Members or inability to attract new Members.
A significant loss of Members could lead to declining revenue, which would adversely impact our profitability. If we are unable to remain competitive with Member experience, pricing, or insurance coverage options, our ability to grow and retain our business may also be adversely affected. In addition, we might not be able to accurately predict risk segmentation of new and renewal Members or potential Members, which could also reduce our profitability.
A large percentage of our Insurance segment products and services are distributed through a few relationships and the loss of business provided by any one of them could have an adverse effect on us.
In addition to our direct sales efforts and independent channels, we market our insurance products through several insurance distribution partners. For the year ended December 31, 2025, approximately 17% of our gross written premium was attributable to five distribution partner marketing relationships. For three of these distribution partners, we have long-term arrangements, which have expiration dates in 2029, 2030, and 2033. The other relationships have shorter durations. Upon expiration or termination of these agreements, these partners may decide to discontinue distributing our products and services or may be unwilling to do so on terms acceptable to us. If we are not successful in maintaining existing relationships and continuing to expand our distribution relationships, or if we encounter regulatory, technological, or other impediments to delivering our products and services to Members through these relationships, our ability to retain Members and grow our business could be adversely impacted. In addition, the broker/agent relationships with many of the partners we work with may change and their own internal strategy about how products are marketed may change, and, where we do not have exclusivity, we face competition by providers who seek to build or strengthen relationships with our distribution partners, which could cause a loss of focus on or exposure to our products and services, adversely impacting new sales.
We may not be able to prevent, monitor, or detect fraudulent activity, including transactions with insurance policies or payments of claims as well as transactions through our Marketplace segment.
If we fail to maintain adequate systems and processes to prevent, monitor, and detect fraud, including employee, agent, policy, vendor, marketplace, or claims fraud, our business could be materially adversely impacted. Fraud schemes have become increasingly more sophisticated and are ever evolving into different and creative avenues of fraudulent activity. While we believe that any past incidents of fraudulent activity have been relatively isolated, we cannot be certain that our systems and processes will always be adequate to detect such activity as fraudulent activity and schemes continue to evolve. While our employees are required to take comprehensive anti-fraud training and use a variety of tools to protect against fraud, these trainings and tools may not always be successful at preventing fraud.
Instances of fraud may result in increased costs, including possible settlement and litigation expenses, higher deductibles and increased corporate insurance premiums, and could have a material adverse effect on our business and reputation. In addition, failure to monitor and detect fraud and otherwise comply with state Special Investigation Unit requirements can result in regulatory fines or penalties.
Like others in our industry, we face potential exposures to operational disruptions caused by cyber breaches or resiliency failures impacting us or third party technology providers upon whom we rely, which could impair website availability and crucial technology operations.
Cyberattacks, denial-of-service attacks, ransomware attacks, business email compromises, computer malware, viruses, social engineering (including phishing) and other malicious internet-based activity are prevalent in our industry, and such attacks continue to increase with frequency, levels of sophistication, and persistence. We utilize third-party providers to host, transmit, or otherwise process electronic data in connection with our business activities. We and/or our vendors and business partners may experience attacks, unavailable systems, unauthorized access, or disclosure due to theft or misuse, denial-of-service attacks, sophisticated attacks by nation-state and nation-state supported actors, and advanced persistent threat intrusions. Despite our efforts to ensure the security, privacy, integrity, confidentiality, availability, and authenticity of information technology networks and systems, processing and information, we may not be able to fully anticipate, or to implement effective measures against all data security and privacy threats. The recovery systems, security protocols, network protection mechanisms, and other security measures that we have integrated into our systems, networks, and physical facilities, may not be adequate to prevent or detect service interruption, system failure, data loss or theft, or other material adverse consequences.
Any regulatory enforcement actions, such as the inquiry related to unauthorized access into our online quote feature described in the section "Data Security Incident" within Note 25 — Commitments and Contingencies in Item 8 of Part II of this Annual Report, or future cyberattacks on our systems, could result in reputational damage and/or cause current and prospective Members to stop using our services. Further, we may be required to expend significant financial and operational resources in response to a security breach, which could be costly and divert resources and the attention of our management and key personnel away from our business operations. Any of the foregoing could have a material adverse effect on our business, financial condition, and results of operations.
Our technology platforms may not function properly, which might subject us to loss of business and revenue, breach of contractual obligations, and place us out of compliance with state and federal rules and regulations.
We utilize numerous technology platforms throughout our business for various functions, including platforms to gather Member data to price and administer our insurance products, for claims management, to issue and service our membership products, provide valuation services, and transact live and digital auctions. We use proprietary algorithms in certain circumstances within our underwriting processes for efficiency. Our technology platforms require continued development and are complex. The continuous development, maintenance, and operation of our technology platforms may entail unforeseen difficulties, including material performance problems or undetected defects or errors. We may encounter technical obstacles, and it is possible that we may discover additional problems that prevent our technology from operating properly. If our platforms do not function reliably, we may incorrectly underwrite or bill our Members, price insurance products, or pay or deny insurance claims made by our Members. These errors could result in inadequate insurance premiums collected relative to claims made, resulting in increased financial losses. These errors could also cause Member dissatisfaction with us, which could cause Members to cancel or fail to renew their insurance policies with us or make it less likely that prospective Members obtain new insurance policies from us. Additionally, platform errors may lead to unintentional bias in underwriting, exposing us to legal or regulatory liability and harm to our brand and reputation. If material performance, defects, or errors persist we may be forced to terminate our technology agreements and incur substantial additional costs transitioning to alternative solutions. Any of these eventualities could result in a material adverse effect on our business, financial condition, and results of operations.
Our future success depends on our ability to continue to develop and implement technology to transform or replace legacy technology, and to maintain the security and confidentiality of our legacy technology, each in compliance with evolving privacy and cybersecurity laws.
Our future success depends on us keeping pace with technological advances for interacting with our Members. New technology is complex, expensive, and requires an ongoing commitment of significant resources to implement. While we are implementing new technology, we must also continue to develop, implement, and maintain the security and confidentiality of our proprietary legacy technology in compliance with complex evolving privacy and cybersecurity laws. Changes to existing laws, their interpretation or implementation, or the introduction of new laws could impede the use of our legacy technology and/or the implementation of new technology. If we are delayed or unable to effectively update our technology or implement new technology it could result in systemic inefficiencies, negatively impact our competitive position and result in a material adverse effect on our business, financial condition, and results of operations.
Future legal or regulatory requirements impacting internet and mobile technologies, marketing and advertising practices, transactions, or the collection and use of personal data may impact how we interact with our Members and prospective Members, and could adversely affect our business, financial condition, and results of operations.
We rely on the internet and mobile technologies to execute our business strategy and are subject to laws and regulations governing our marketing, advertising, and sales—online and offline—including the collection, use, retention, security, transfer, disclosure, and other processing of personal information. Existing and future laws, regulations, and consumer expectations may impede our use of the internet and mobile technologies and applications to interact with current and future Members and to effectively market, advertise, and sell our products and services. In particular, complex and evolving privacy laws regulate our ability to use personal data for targeted or cross-contextual behavioral advertising. Any of these outcomes could adversely affect our business, growth, member engagement, financial condition, and results of operations.
It is possible that the laws and regulations may be interpreted and applied in a manner that is inconsistent from one jurisdiction to another and may conflict with other rules or our practices. As new laws, regulations, and consumer expectations are adopted, our compliance obligations may increase. Regulators may reinterpret or amend existing requirements, require changes to our operations, or impose penalties that restrict certain activities. At the same time, we may be subject to individual or class action claims by plaintiffs using both new and pre-existing laws based on new technologies, some of which are part of our sales and marketing efforts. Future legal developments, regulatory interpretations, or enforcement actions could require changes to our practices or otherwise increase our compliance risk.
Any actual or perceived noncompliance could harm our reputation and erode consumer trust, reduce engagement and revenue, and result in investigations, enforcement actions, or litigation by governmental entities or private parties, including matters such as the "Data Security Incident" referenced within Note 25 — Commitments and Contingencies in Item 8 of Part II of this Annual Report. Any such proceeding or action could hurt our reputation, force us to incur significant additional expense and time in defending regulatory proceedings or legal actions, and may result in the imposition of monetary liability. Court or regulatory orders may also demand the disgorgement of personal data and any algorithms trained on, or products or services derived from, such personal data. Regulatory proceedings or legal actions could increase our operational costs and decrease use of our mobile applications or websites by current and future Members. They may also divert management attention, increase operating costs, reduce Member usage of our mobile applications or websites, require indemnification of third parties, and result in losses that are not fully covered by insurance.
We may not be able to prevent or address the misappropriation of Hagerty-owned data or websites.
From time to time, third parties may misappropriate our data through website scraping, bots, or other means and aggregate this data on their websites with data from other companies. In addition, copycat websites or mobile apps may misappropriate data and attempt to imitate our brand or the functionality of our website or our mobile applications. Although we may take technological and legal steps to detect and stop these activities, we may not identify all instances in a timely manner, and our efforts may be ineffective or insufficient to halt them.
Our ability to enforce rights may be limited, particularly against operators located outside the U.S. Regardless of outcome, efforts to address misappropriation may require significant time and expense and could divert resources. Misappropriation or copycat activity could also confuse consumers or advertisers, harm our brand, and adversely affect our business, financial condition, or results of operations.
Rapid evolution and adoption of artificial intelligence could adversely affect our competitive position, operations, and brand.
Artificial intelligence ("AI") technologies are evolving rapidly, and competitors or new market entrants may develop or deploy AI more effectively than we do, which could reduce our competitive advantages in product features, pricing, risk management, customer acquisition, and operating efficiency. If our AI adoption or commercialization is delayed or limited by cost, talent, data, or other constraints, we may fail to meet customer expectations, lose market share, or experience margin pressure.
Our use of AI may also produce unintended or harmful outcomes, including inaccurate or biased outputs, reduced transparency, degraded customer experiences, operational disruptions, data governance or security failures (including privacy, consent, cross-border transfer, and leakage), and reputational harm. Deficiencies in data governance, data labeling, or rights to training data, as well as misuse by vendors or partners, or noncompliance with evolving laws and standards, could increase regulatory scrutiny and expose us to legal claims or penalties. Any of these risks could reduce demand for our offerings, impair relationships with customers and partners, and adversely affect our business, financial condition, and results of operations.
We rely on our Chief Executive Officer and other key employees. If we cannot attract, retain, or motivate key personnel, our business may be severely impacted.
Our success depends on the ability to attract, retain, and motivate a highly skilled and diverse management team and workforce. Our Chief Executive Officer is well known and respected in our industry. He is an integral part of our brand, and his departure would likely create difficulty with respect to both the perception and execution of our business. Additionally, the loss of key personnel within our senior management, Insurance segment, and Marketplace segment teams might significantly delay or prevent the achievement of our strategic business objectives and could harm our business. We rely on a small number of specialized experts, the loss of any one of whom could have a disproportionate impact on our business. Our compensation arrangements, such as our equity award programs, may not always be successful in attracting new employees and retaining and motivating our existing employees. Moreover, if and when our equity awards are substantially vested, employees under such equity arrangements may be more likely to leave, particularly if the underlying shares have seen a significant appreciation in value.
Our inability to ensure that we have the depth and breadth of management and personnel with the necessary skills and experience could affect our ability to deliver growth objectives and execute our operational strategy. As we continue to expand and grow, we will need to promote or hire additional staff, and it may be difficult to attract or retain such individuals in a timely manner and without incurring significant additional costs. If we are unable to integrate new team members or if they do not perform adequately, our business may be harmed.
Our unique culture has contributed to our success, and if we are not able to maintain this culture in the future, our business could be harmed.
Our culture supports a high level of employee engagement, which translates into a service model that produces a high level of Member satisfaction and retention. We face a number of challenges that may affect our ability to sustain our culture, including:
•failure to identify, attract, reward, and retain people in leadership positions in our organization who share and further our culture, values, and mission;
•the size and geographic diversity of our workforce and our ability to promote a uniform and consistent culture across all our offices and employees working remotely;
•competitive pressures to move in directions that may divert us from our mission, vision, and values;
•the continued challenges of a rapidly evolving industry; and
•the increasing need to develop expertise in new areas of business needed to execute our growth plans and strategy.
If we are not successful in instilling our culture in new employees, or maintaining our culture as we grow, our operations may be disrupted, and our financial performance may suffer.
Our future growth and profitability may be affected by new entrants into the market or current competitors developing preferred offerings.
Our business is rapidly growing and evolving in highly competitive markets. We face competition from large, well-capitalized national and international companies, including other insurance providers, technology companies, automotive media companies, established automotive auction and marketplace providers, other well-financed companies seeking new opportunities, or new competitors using technologically advanced systems such as artificial intelligence, or other innovations. Many of our competitors have substantial resources, experienced management, and strong marketing, underwriting, and pricing capabilities. Because collector auto insurance constitutes a significant portion of our overall business, we may be more sensitive than other providers of insurance to, and more adversely affected by, trends that could decrease auto insurance rates or reduce demand or distribution channels for auto insurance over time, such as industry advances in mileage-based or usage-based insurance offerings, departures by some insurers from certain states that are prone to natural disasters, changes in vehicle technology, autonomous or semi-autonomous vehicles, or vehicle sharing arrangements. In addition, there are limited barriers to entry in the automotive lifestyle business. Accordingly, more established brands with significantly more resources may compete against us in in the future. If we are unable to compete effectively, we may not be able to grow our business and our financial condition and results of operations may be adversely affected.
Future acquisitions or investments contain inherent strategic, execution, and compliance risks that could disrupt our business and harm our financial condition.
We have completed strategic acquisitions, including Drivers Edge in September 2024 and Broad Arrow in August 2022. In the future, we may pursue additional acquisitions or investments to grow our business in line with our strategic objectives. Our acquisitions or investments may not achieve their intended purpose or the desired return sought. Additionally, our acquisitions and investments may also result in unforeseen liabilities, expenses, or negative consequences, including contingent liabilities, high implementation costs, misalignment of culture, burdensome regulatory requirements, tax liabilities, and distraction of senior management from pursuing more profitable strategic objectives. If we are unable to effectively execute and integrate strategic acquisitions and make profitable investments, we may not be able to grow our business and our financial condition and results of operations may be adversely affected.
From time to time we introduce new products and services that have limited operating history, making it difficult to forecast operating results. We may not achieve profitability from these offerings as quickly as anticipated, or at all.
The success of new product and service introductions depends on a number of factors, including timely and successful development, market acceptance, our ability to manage the risks associated with new product production ramp-up issues, the availability of application software for new products and services, the effective management of purchase commitments and vendor relationships in line with anticipated product demand, the availability of products in appropriate quantities and at expected costs to meet anticipated demand, and the risk that new products and services may have quality or other defects or deficiencies. Accordingly, we cannot determine in advance the ultimate effect of new product and service introductions and transitions. If our new products or services are not well received, or if we are unable to introduce them in a cost-effective manner, we may not be able to realize a profit on those products and services and may, in fact, recognize losses for some time. This could have an adverse effect on our financial condition and results of operations.
We are subject to payment processing risks which could adversely affect our results of operations.
We currently rely on a limited number of financial institutions and payment facilitators/processors to provide payment processing services, and our business would be disrupted if any of the banks and/or vendors become unwilling or unable to provide these services to us, and we are unable to find a suitable replacement on a timely basis. If we or our processing banks/vendors fail to maintain adequate systems for the authorization and processing of financial payment transactions, it could cause one or more of the financial institutions or acquiring banks to disallow our continued use of their payment products. In addition, if these systems fail to work properly and, as a result, we do not charge our customers’ payment method on a timely basis, or at all, our business, financial condition and results of operations could be harmed.
The payment methods that we offer also subject us to potential fraud and theft by criminals, who are becoming increasingly more sophisticated, seeking to obtain unauthorized access to, or exploit weaknesses that may exist in the payment systems. There are potential legal, contractual, and regulatory risks if we are not able to properly process payments. If we are unable to comply with applicable rules or requirements for the payment methods that we accept, or if payment-related data is compromised due to a cybersecurity incident or a breach, we may be liable for significant costs incurred by payment regulatory bodies, payment card issuing banks and other third parties, subject to fines and higher transaction fees, subject to potential litigation or enforcement action, or our ability to accept or facilitate certain types of payments may be impaired.
In addition, our customers could lose confidence in certain payment types, which may result in a shift to other payment types or potential changes to our payment systems that may result in higher costs. If we fail to adequately control fraudulent credit card transactions, we could face civil liability, diminished public perception of our security measures, and significantly higher credit card-related costs, each of which could harm our business, financial condition and results of operations.
Current economic conditions including inflation and interest rate uncertainty may affect demand for our products and services.
Unfavorable global economic conditions, including elevated inflation, higher interest rates, unemployment rate fluctuations, and volatility in the financial markets, create uncertainty in consumer discretionary spending. In such environments, consumers may reduce spending on collector cars and enthusiast vehicles, and related services, which could decrease demand for our products and services and negatively impact our revenue and profitability. Although the Federal Reserve Board lowered the federal funds rate by an aggregate of 75 basis points in 2025 and has indicated that rates may decrease further in 2026, there is no certainty as to the magnitude or timing of any such decreases, or whether rates will stabilize or increase. A sustained elevated interest rate environment, or any significant increases in benchmark interest rates, could increase our cost of borrowing, reduce credit availability, and adversely affect our ability to raise capital through the issuance of equity or debt on acceptable terms, particularly if equity markets become less favorable. These dynamics may also dampen consumer financing availability for purchases of collectible cars and enthusiast vehicles, further constraining demand. The combined impact of reduced consumer demand, higher capital costs, and tighter financing conditions could have a material adverse effect on our business, financial condition, and results of operations.
The imposition of tariffs on imported goods could increase costs, reduce consumer spending on collector cars and related services, and negatively impact our business, financial condition, and results of operations.
The recent imposition of tariffs on certain imported goods could affect the availability and cost of parts to repair our insureds' vehicles, which could impact our cost of claims, insurance premiums, and customer satisfaction. Additionally, a significant number of collectible cars and enthusiast vehicles and related parts are imported from outside the U.S., and imposition of tariffs could impact our Marketplace business by increasing the cost of importing vehicles for sale. While we have not yet identified material direct effects from the recent changes in tariffs and other trade measures in our business, the long-term consequences of these actions remain uncertain and could negatively affect both the overall economy and our business. Any prolonged downturns in the economy or decreases in consumer demand for collector cars and related services could materially adversely affect our business, financial condition, and results of operations.
Performance of our investment portfolio is subject to a variety of investment risks that may adversely affect our financial results.
Our financial condition and results of operations depend, in part, on the performance of our investment portfolio. The decisions related to our investment activity are governed by our Group Investment Policy, which has been approved by our Board and any proposed modifications are reviewed by our Finance and Capital Committee.
Historically, our investment portfolio was primarily invested in cash and cash equivalents and fixed maturity securities consisting solely of Canadian Sovereign, Provincial, and Municipal bonds. However, during the second quarter of 2024, we diversified our investment portfolio by opening positions in higher-yield fixed maturity securities, including principally corporate bonds, U.S. Treasury securities, and mortgage-backed securities, as well as, to a lesser extent, equity securities. Our investments in fixed maturity securities and equity securities are carried on our balance sheet at fair market value and are subject to potential losses and declines in market value.
The primary market risk to our investment portfolio is interest rate risk associated with our investments in fixed maturity securities. Fluctuations in interest rates have a direct effect on the market valuation of these securities. When market interest rates increase, the fair value of our fixed maturity securities decreases. Conversely, as interest rates decrease, the fair value of our fixed maturity securities increases.
The value of our investment portfolio is also subject to the risk that certain investments in fixed maturity securities may default or become impaired due to deterioration in the financial condition of one or more issuers of the securities we hold, or due to deterioration in the financial condition of an insurer that guarantees an issuer's payments on such investments. Downgrades in the credit ratings of fixed maturity securities also have a significant negative effect on the market value of such securities.
In addition to the risks associated with fixed maturity securities, our investment portfolio is also exposed to equity risk, particularly with respect to our holdings in publicly traded equities. Equity securities are inherently subject to greater volatility than fixed income securities, and their market values can fluctuate significantly in response to a variety of factors, including changes in general economic conditions, market sentiment, company performance, and geopolitical events. Periods of heightened volatility in the equity markets, such as those experienced during broad market corrections or economic downturns, can result in substantial declines in the value of our equity investments, which could materially and adversely affect our financial condition, results of operations, and liquidity.
Each of the foregoing factors could reduce our net investment income and/or result in realized investment losses. We cannot be certain that our investment objectives will be achieved, and results may vary substantially over time. In addition, although we seek to employ investment strategies that are not correlated with our insurance and reinsurance exposures, losses in our investment portfolio may occur concurrently with underwriting losses and, therefore, exacerbate the adverse effect of the losses on us.
Changes to the law and social attitudes towards petroleum-powered vehicles may make ownership of collector vehicles less desirable, leading to a decline in demand for our products and services.
Changes to the law, governmental policies, consumer preferences, and social attitudes in favor of new vehicle technology and growing environmental concerns, may discourage the sale, use, and enjoyment of petroleum-powered vehicles which may in turn reduce the need or desire for many of our products and services, leading to lost revenue and lower profits and the inability to deliver on our purpose in an impactful manner.
The traditional business model of car sales is starting to be complemented by a range of diverse, on-demand mobility solutions, especially in dense urban environments that proactively discourage private-car use. This shift, along with a significant rise in the annual growth of car sharing members and autonomous and electric vehicles, and legislative efforts to reduce carbon emissions, in the markets we currently conduct business, could have a trickle-down effect to the collector car space and result in reduced demand for our products and services, which could have a material adverse effect on our business, financial condition, and results of operations.
Our day-to-day operations create transactions, events, and conditions that give rise to the need for accounting estimates to be recognized or disclosed in our Consolidated Financial Statements. There is a risk that these estimates are incorrect, which could have a material adverse effect on our financial condition and/or results of operations.
The preparation of our financial statements requires us to make significant judgments, assumptions, and estimates that materially affect the amounts reported in our Consolidated Financial Statements. If these judgments, assumptions, or estimates prove to be incorrect, it could have a material adverse effect on our financial condition and/or results of operations. We have identified several accounting estimates as being "critical" to the fair presentation of our financial condition and results of operations because they involve major aspects of our business and require us to make judgments about matters that are inherently uncertain. Refer to the section "Critical Accounting Estimates" within Item 7 of Part II of this Annual Report for additional information.
We may require additional capital in the future, which may not be available or may only be available on unfavorable terms, and we may encounter difficulty in obtaining funds to meet our commitments.
We are exposed to credit risk, and liquidity risk, through our banking partners. If we were to experience operating losses and are not able to generate additional liquidity through a capital raise or other cash infusion, we may need to secure additional sources of funds, which may or may not be available. Additionally, a failure to generate additional liquidity could negatively impact our ability to operate our business. The revolving borrowing period provided by the primary credit facility agreement that supports the lending business of BAC is scheduled to expire in November 2027 unless it is extended upon the mutual agreement of BAC and the administrative agent for an additional year until November 2028. To the extent that we are unable to extend or replace this credit agreement on terms favorable to us, we may not be able to finance certain transactions that would otherwise be profitable to us and our expected growth and profitability could be adversely impacted. Furthermore, our ability to access liquidity from our subsidiaries may be limited. For example, our ability to dividend excess earnings from Hagerty Re is subject to regulatory and solvency requirements. As a result, we could have sufficient liquidity in aggregate but be unable to access it when needed.
To the extent that cash flows generated by our operations are insufficient to fund future operating requirements, or that our capital position is adversely impacted by a decline in the fair value of our investment portfolio, losses from catastrophic events or otherwise, we may need to raise additional funds. We also may be required to liquidate fixed maturity securities, which may result in realized investment losses. Any further sources of capital, including capacity needed for letters of credit, if available at all, may be on terms that are unfavorable to us. Our access to additional sources of capital will depend on a variety of factors, such as market conditions, the general availability of credit, the availability of credit to the industries in which we operate, our financial condition, results of operations, credit ratings and credit capacity, as well as pending litigation or regulatory investigations. Our ability to borrow under our revolving credit facilities and letter of credit facilities is contingent on our compliance with the covenants and other requirements under those facilities. Similarly, our access to capital may be impaired if regulatory authorities or rating agencies take negative actions against us. Additionally, to reduce the risk of a bank failure, we engage only with high-quality counterparties with high credit ratings. Our inability to obtain adequate capital when needed could have a negative impact on our ability to invest in, or take advantage of opportunities to expand our businesses, such as possible acquisitions or the creation of new ventures, and inhibit our ability to refinance our existing indebtedness on terms acceptable to us. Any of these factors could have a material adverse effect on our financial condition and results of operations.
Our estimates of market opportunity and forecasts of market growth may prove to be inaccurate, and even if the market in which we compete achieves the forecasted growth, our business could fail to grow at a similar rate, if at all.
Market opportunity estimates and growth forecasts, including those we have generated ourselves, are subject to significant uncertainty and are based on assumptions and estimates that may not prove to be accurate. Not every owner of collector cars or enthusiast vehicles, which underlie our market opportunity estimates, will necessarily purchase insurance from us or similar products in the near-term or at all, and some or many of these owners may choose to continue using insurance products offered by our competitors. It is impossible to have an insurance product that satisfies every potential customer, and our competitors may offer greater flexibility or other features that we do not provide. In presenting our total addressable market, we are not making any claim that we can realistically serve that market. The variables used in the calculation of our market opportunity are subject to change over time, and there is no guarantee that any particular number or percentage of owners of collector cars or enthusiast vehicles will generate any particular level of revenue for us, if any. Even if the market in which we compete meets our size estimates and growth forecasts, our business could fail to grow for a variety of reasons outside of our control, including competition in our industry, customer preferences or the other risks set forth in this Annual Report and other documents we file with the SEC from time to time. If any of these risks materialize, it could harm our business and prospects.
Risks Related to Our Insurance Segment
The insurance products that we develop and sell for our underwriting carriers are subject to regulatory approval, and we may incur significant expenses in connection with the development and filing of new products before revenue is generated from new products.
The insurance products that we develop and sell require regulatory approvals in each respective jurisdiction. The product development and filing process can be lengthy and costly at times. The process can also be time-consuming, given the unknown timelines in which insurance departments might take to review and approve filings. Questions and objections from insurance departments may also delay product approval and launch, and may result in disapproval.
The nature of the product development and filing cycles may cause us to experience delays between the time we incur expenses associated with research and development and the time we generate revenues, if any, from new products. If we spend a significant amount of resources on research and development, and our efforts do not lead to the successful introduction or improvement of products that are competitive in the marketplace, this could materially and adversely affect our business and results of operations.
Additionally, there could be a change in the anticipated Member demand for a product we are developing before the product is released. Member demand could decrease after the development cycle has begun. A decrease in Member demand for a new or improved product could cause us to fall short of our sales targets, and we might not be able to avoid the substantial costs associated with the product's development or improvement. If we are unable to complete product development and filing cycles successfully, in a timely manner, that meets Member demand for new or improved products, and generate revenues from these future products, the growth of our business could be harmed.
Our Insurance segment operates in a highly regulated environment for insurance product distribution and faces risks associated with compliance requirements, some of which cause us to make judgments that could have an adverse effect on us.
The industry in which our Insurance segment operates is subject to extensive regulation. We are subject to regulation and supervision both federally and in each applicable state or provincial jurisdiction. In general, these regulations are designed to protect policyholder and insured Members and to protect the integrity of the financial markets, rather than to protect stockholders or creditors. The ability of our Insurance segment to conduct business in these jurisdictions depends on its compliance with the rules and regulations promulgated by federal, state, or provincial regulatory bodies and other regulatory authorities. Maintaining compliance with rules and regulations is often complex, and sometimes requires us to make determinations that require judgments regarding uncertain issues that ultimately may be resolved differently than we have determined, which could have an adverse effect on us.
Unexpected increases in the frequency or severity of claims may adversely affect the operations of our Insurance segment and our financial condition.
The Insurance segment may experience increases in claim frequency on occasion. Any changes in claim frequency might be derived from changes in miles driven, driving behaviors, macroeconomics, weather-related events, or other factors. A significant increase in claim frequency could have an adverse effect on our financial condition and the results of operations of the Insurance segment. Short-term trends with an increase in claim frequency may not continue over the longer term.
The Insurance segment could also experience increases in the severity of claims. Changes in bodily injury claim severity can be impacted by inflation in medical costs, litigation trends and precedents, regulation, and the overall safety of automobile travel. Changes in auto physical damage claim severity can be driven by inflation in the cost to repair vehicles, including parts and labor rates, the mix of vehicles that are declared total losses, the availability of parts to repair vehicles, the shrinking pool of qualified craftsmen to repair collector vehicles, and an increase in value for collector vehicles. Unanticipated increases in claim severity can arise from events that are inherently difficult to predict. Although we pursue various loss management initiatives to mitigate future increases in claim severity, these initiatives may not successfully identify or reduce the effect of future increases in claim severity. A significant increase in claim severity could have an adverse effect on our financial condition and the results of operations of the Insurance segment.
Severe weather events, catastrophes, and unnatural events are unpredictable, and we may experience losses or disruptions from these events.
Our Insurance segment may be exposed to catastrophic events such as tornadoes, tsunamis, tropical storms (including hurricanes), earthquakes, windstorms, hailstorms, severe thunderstorms, wildfires and other fires, as well as non-natural events such as explosions, riots, pandemics, terrorism, or war, which could cause the operating results of the Insurance segment to vary significantly from one period to the next. Our Insurance segment may incur claims from severe weather events, and catastrophe losses in excess of: (i) those experienced in prior years; (ii) the average expected level used in pricing; (iii) current reinsurance coverage limits; or (iv) loss estimates from external models at various levels of probability.
Generally, the frequency and severity of insurance claims and the occurrence of severe weather conditions are interconnected. The incidence and severity of severe weather conditions and catastrophes are inherently unpredictable, and the occurrence of one catastrophe does not render the possibility of another catastrophe greater or lower. The extent of losses from a catastrophe is a function of both the total amount of insured exposure in the area affected by the event and the severity of the event. In particular, severe weather and other catastrophes could significantly increase our costs due to a surge in claims following such events and/or legal and regulatory changes in response to catastrophes that may impair our ability to limit our liability under our policies. Severe weather conditions and catastrophes can cause greater losses, which could cause our liquidity and financial condition to deteriorate.
Environmental changes, including shifts in temperatures and weather patterns, may affect the occurrence of certain natural events, such as an increase in the frequency or severity of wind and thunderstorm events, eruptions of volcanoes, and tornado or hailstorm events due to increased convection in the atmosphere; more frequent wildfires and subsequent landslides in certain geographies; higher incidence of deluge flooding and the potential for an increase in severity of the hurricane events due to higher sea surface temperatures. Consequently, changes in the frequency or severity of those events may cause an impact on the demand, price and availability of insurance. Due to significant variability associated with environmental changes, we are unable to predict the impact these types of events will have on our business.
We may not be able to adapt effectively and timely to any changes in law.
A failure to comply with regulatory requirements, or changes in regulatory requirements or interpretations, can result in actions by regulators, potentially leading to penalties and enforcement actions, and in extreme cases, revocation of authority to do business in one or more jurisdictions. This could result in adverse publicity and potential damage to our brand and reputation in the marketplace. In addition, we could face lawsuits by Members and other parties for alleged violations of these laws and regulations.
Insurance regulators and other governmental bodies are granted broad administrative authority in the supervision and regulation of many aspects of the insurance business, including the licensing of our insurance operations, the handling of third-party funds held in a fiduciary capacity, and trade practices, such as marketing, advertising, and compensation arrangements entered into by insurance brokers and agents. Additionally, the National Association of Insurance Commissioners supports the states' insurance regulators by continually reviewing laws and regulations, and setting industry standards and best practices.
We believe that generally our Insurance segment is in material compliance with applicable laws. However, should any regulatory agency take a contrary position and prevail, we may be required to change the manner in which we operate and we may be subject to penalties and other enforcement actions up to, and including, license suspension or revocation.
Regulatory review or the issuance of interpretations of existing laws and regulations may result in the enactment of new or amended laws and regulations that could adversely affect the operations of our Insurance segment or its ability to conduct business profitably. It is difficult to predict whether, and to what degree, changes resulting from new laws and regulations will affect the insurance industry or the business of the Insurance segment.
Our MGA subsidiaries do business with a limited number of key underwriting carrier partners in our insurance markets, and we may not be able to find suitable replacements for our existing carriers.
Our MGA subsidiaries work with a limited number of carriers in the U.S., Canada, and the U.K. to offer our personal lines insurance products, and there is a risk that if one or more of the carriers becomes impaired or terminates its relationship with us such that the profitability of our Insurance segment may be adversely affected. If a carrier partner relationship terminates or there is loss of strategic support or alignment, we may be unable to transition to a new relationship without disruption, increased cost, lost profits, or lost market share, or a combination of the foregoing.
Our Insurance segment derives a large portion of its revenue from commissions and quota share reinsurance on the sale of personal lines insurance products. In the U.S., this is primarily through our MGA relationships with Essentia and State Farm, and in Canada and the U.K., it is through our MGA relationship with Aviva. If these carriers were to experience liquidity problems or other financial (such as rating agency downgrades) or operational difficulties, we could encounter business disruptions, and the results of operations of our Insurance segment may suffer.
Our alliance agreements with each of Markel and State Farm contain provisions that allow those partners to terminate our agreements with them at any time upon the occurrence of a change of control including, for example, if HHC ceases to own the majority of our voting shares. Accordingly, if we experience a change of control, we could lose our agreements with one or both of these partners, which could have a material adverse effect on the business, operations and financial results of our Insurance segment.
Rapid growth may strain our infrastructure, resources, and relationships, which could then impair service quality, operational execution, and financial performance of our Insurance segment.
Our Insurance segment has experienced, and may continue to experience, rapid growth in its business, including increases in premium volume, distribution partners, insureds, and the scope of services we provide as an MGA. Rapid growth places significant demands on our operational infrastructure, technology systems, underwriting and claims processes, compliance framework, financial controls, and human capital. If we are unable to scale our organization effectively and in a timely manner, we may be unable to maintain our service levels, product quality, and regulatory compliance. For example, growth beyond our current capacity could lead to delays or errors in underwriting and policy administration, slower claims handling, diminished responsiveness to brokers and insureds, and increased operational incidents or control failures. It may also increase the likelihood of errors and omissions claims and elevate our exposure to penalties or remediation costs if compliance gaps arise. Any of these factors could lead to an adverse effect on the business, financial condition, and results of operations of our Insurance segment.
A regulatory environment that requires rate increases to be approved and that can dictate underwriting and pricing and mandate participation in loss sharing arrangements may adversely affect our financial condition and the results of operations of our Insurance segment.
Political events and positions can affect the insurance market on occasion, including efforts to reduce rates to a level that may prevent our Insurance segment from being profitable or may not allow us to reach our goals. If the loss ratio for the insurance programs that we administer is favorable to that of the industry, regulatory authorities could impose rate restrictions, require payment of premium refunds to policyholders, or could challenge or delay efforts to raise rates. Rate changes may be required for us to achieve our profitability and return on equity objectives. Challenges in predicting when or if rate changes will be approved or delays in obtaining approvals for rate changes impact our ability to meet our profitability goals in the time desired. For example, certain states have enacted laws that require an insurer conducting business in that state to participate in assigned risk plans, reinsurance facilities, and joint underwriting associations where rates may be restricted. Certain states also require insurers to offer coverage to all consumers, often restricting an insurer's ability to charge the price it might otherwise charge. Laws and regulations of many states also limit an insurer's ability to withdraw from one or more lines of insurance, except pursuant to a plan that is approved by the state insurance department. This limitation can prolong and provide additional challenges for executing on strategic business plans related to conversions, transfers, and book rolls. The operations, business, financial condition, or results of operations of our Insurance segment could be adversely affected by any of these factors.
The underwriting companies that we work with, Driver's Edge, and our MGA subsidiaries are periodically subject to examinations and audits by insurance regulators, which could result in adverse findings, enforcement actions, require payments of fines or penalties, and necessitate remedial actions.
In the U.S., our insurance agencies operate as an MGA for both Essentia and also State Farm Classic Insurance Company for servicing the State Farm Classic+ program. Essentia is domiciled in Missouri and has a classic auto insurance program in all 50 United States, plus the District of Columbia. We operate as the MGA for the Essentia program in all 51 jurisdictions. As of December 31, 2025, State Farm Classic+ policies were being offered in 27 states, with conversions of their existing book of business occurring in seven of these states and plans to offer such policies in additional states in 2026 and 2027. We also operate similar auto insurance programs in Canada and the U.K., underwritten by Aviva. Lastly, we also operate our own insurance carrier, Drivers Edge, which is a collector and enthusiast auto insurer.
Both Hagerty Re and Drivers Edge must meet and maintain relevant solvency margin, liquidity, and other ratios under applicable law and their respective licensing. Hagerty Re's license limits it to accepting only business produced through our MGA subsidiaries that is underwritten by our subsidiaries or carriers rated A- or better by A.M. Best or similar rating agency.
Insurance regulators periodically subject the underwriting companies that we work with to audits and examinations to assess compliance with applicable laws and regulations, financial condition, and the conduct of regulated activities. These examinations and audits may be conducted during a jurisdiction’s typical review cycle, or because of a targeted investigation. Our MGA subsidiaries can also be subject to regulatory audits and exams. A formal examination or audit provides insurance regulators with an opportunity to review and scrutinize the underwriting companies we work with, the insurance programs we administer, and our operations. Drivers Edge is also subject to a financial examination in its state of domicile as part of the state's regular review cycle of the carriers domiciled in that specific jurisdiction. A financial examination ensures that a company is financially sound and assesses the company’s solvency, processes and controls, and verifies compliance with laws and regulations.
As a result of an examination or an audit, an insurance regulator could determine that an underwriting company's financial condition or capital resources are less than satisfactory. An insurance regulator could also determine that there are other aspects of either the underwriting company or our operations that are less than satisfactory, or that either we or the underwriting company that we work with are in violation of applicable laws or regulations. These types of examination or audit findings could lead an insurance regulator to require either us or the underwriting company that we work with to take one or more remedial actions or otherwise subject us to regulatory scrutiny or impose fines and penalties.
We cannot predict with precision the likelihood, nature, or extent, including the associated costs, of any necessary remedial actions, or any financial impact that could result from an examination or audit. Any regulatory or enforcement action or any regulatory order imposing remedial, injunctive, or other corrective action against us or any of the underwriting companies we work with resulting from these examinations or audits could have a material adverse effect on the business, reputation, financial condition, and results of operations of our Insurance segment.
We rely on external data and our digital platform to collect and evaluate information that we utilize in producing, pricing, and underwriting insurance policies (in accordance with the rates, rules, and forms filed with regulators, where required), managing claims and customer support, and improving business processes. Any future legal or regulatory requirements that might restrict our ability to collect or utilize this data could potentially have an adverse effect on the business, financial condition, and prospects of our Insurance segment.
We use our digital platform to collect data points that we evaluate in pricing and underwriting insurance policies, managing claims and customer support, and improving business processes. The business model of our Insurance segment is dependent on its ability to collect vehicle and personal data. If federal, state, or international regulators were to determine that the type of data we collect, the process we use for collecting this data, or how we use it, unfairly discriminates against a protected class of people or otherwise violates applicable privacy and cybersecurity laws and regulations, regulators could prohibit or restrict our collection or use of this data. In addition, if evolving privacy laws were to restrict our ability to collect motor vehicle records and other related personal data, it could impair our capacity to underwrite insurance cost effectively, negatively impacting the revenue and earnings of our Insurance segment.
The insurance business, including the market for property and casualty insurance, is historically cyclical in nature, and there may be periods with excess underwriting capacity and unfavorable premium rates, which could adversely affect our Insurance segment.
Our Insurance segment operates primarily in North America and the seasonality of driving in that region has caused a large portion of its commission and fee revenue to be generated in the spring and summer months of each year. This in turn impacts operational cash flows and could produce volatility in its earnings. Fluctuations in the operating results of our Insurance segment could be due to a number of other factors, many of which may be outside of our control, including competition, but also the frequency and severity of catastrophic events, levels of capacity, adverse litigation trends, regulatory constraints, general economic conditions, and agreement on underwriting appetite with our carrier partners, and other factors. The supply of insurance is related to prevailing prices, the level of insured losses, and the level of capital available to the industry that, in turn, may fluctuate in response to changes in rates of return on investments being earned in the insurance industry. As a result, the auto insurance business historically has been a cyclical industry characterized by periods of intense price competition due to excessive underwriting capacity, as well as periods when shortages of capacity increased premium levels.
Our Insurance segment operates in a specialty sector of the auto insurance market and needs to be mindful of these and other factors which could impact its operations. Demand for insurance depends on numerous factors, including the frequency and severity of catastrophic events, levels of capacity, the introduction of new capital providers, and general economic conditions.
All of these factors fluctuate and may contribute to price declines generally in the insurance industry. We cannot predict with certainty whether market conditions affecting the auto insurance market and the insurance market in general will improve, remain constant, or deteriorate. Negative market conditions may impair our ability to underwrite insurance at rates we consider appropriate and commensurate relative to the risk assumed. Additionally, negative market conditions could result in a decline in policies sold, an increase in the frequency or severity of claims and premium defaults, and an uptick in the frequency of fraud, including the falsification of claims. If we cannot underwrite insurance at appropriate rates, our ability to transact business will be materially and adversely affected. Any of these factors could lead to an adverse effect on the business, financial condition, and results of operations of our Insurance segment.
The shift to Hagerty Re assuming 100% of the risk for policies written through the Markel Fronting Arrangement increases our exposure to underwriting volatility, catastrophes, reinsurance counterparty risk, and legal, compliance, and regulatory risks, which could adversely affect the capital, liquidity, and results of our Insurance segment.
Beginning on January 1, 2026, Hagerty Re began assuming 100% of the quota share on risks written by our U.S. MGA subsidiary through the Markel Fronting Arrangement, compared to 80% in recent years. While the change increases our participation in underwriting income, it also increases our exposure to adverse frequency and severity trends, and other large losses. If we are unable to obtain sufficient retrocessional protection on acceptable terms, we may need to retain more risk, adjust underwriting, or deploy additional capital or letters of credit to support statutory or rating requirements. A shortfall, delay, dispute, or insolvency involving any reinsurance counterparty could increase our retained losses and strain our liquidity and capital position. In addition, we will bear increased legal, compliance, and regulatory expenses and risks under the new arrangement. Any of these factors could lead to an adverse effect on the business, financial condition, and results of operations of our Insurance segment.
The reinsurance Hagerty Re purchases to protect against catastrophic and large losses may become unavailable on current coverage terms, limits, or pricing.
The business that Hagerty Re reinsures is exposed to catastrophic events that are inherently unpredictable and may cause capacity in the reinsurance market to become scarcer, leading to rate increases or changes in coverage terms, or a combination of both. This in turn may cause Hagerty Re to retain more risk, be unable to accept further risk and grow, or require greater capital investment that may not be available, in each case resulting in lower profits, as well as materially impacting our financial condition and insurance business results.
If we do not price and underwrite risks accurately at competitive, profitable rates, the business and financial condition of our Insurance segment could be adversely affected.
In general, the premiums for the insurance policies in our programs are established at the time a policy is issued and, therefore, before all of the underlying costs are known. The accuracy of the pricing is subject to our ability to adequately assess risks, estimate losses, and comply with insurance laws and regulations. Like others in the industry, we rely on estimates and assumptions in setting the premium rates. We also utilize the data that we gather through our interactions with Members.
Establishing adequate premium rates is necessary, together with investment income, if any, to generate sufficient revenue to offset losses, loss adjustment expenses, and other costs. If we do not accurately assess the risks that are underwritten, adequate premiums may not be charged to cover losses and expenses, which would adversely affect the results of operations and profitability of our Insurance segment. Moreover, if we determine that the prices are too low, insurance regulations may prevent us from non-renewing insurance contracts, non-renewing Members, or raising prices. Alternatively, we could set the premiums too high, which could reduce our competitiveness and lead to lower revenues, which could have a material adverse effect on the business, financial condition, and results of operations of our Insurance segment.
Pricing involves the acquisition and analysis of historical loss data and the projection of future trends, loss costs, expenses, and inflation trends, among other factors, for each of the products in multiple risk levels and many different markets. In order to accurately price the policies, we must, among other factors:
•collect and properly and accurately analyze a substantial volume of data from our Members;
•develop, test, and apply appropriate actuarial projections and rating formulas;
•review and evaluate competitive product offerings and pricing dynamics;
•closely monitor and timely recognize changes in trends;
•project both frequency and severity of our Members’ losses with reasonable accuracy; and
•in many jurisdictions, obtain regulatory approval for the resulting rates.
We may not have success in implementing a pricing methodology accurately in accordance with our assumptions. Our ability to accurately price policies is subject to a number of risks and uncertainties, including, but not limited to:
•insufficient, inaccurate, or unreliable data;
•incorrect or incomplete analysis of available data;
•uncertainties generally inherent in estimates and assumptions;
•our inability to implement appropriate actuarial projections and rating formulas or other pricing methodologies;
•incorrect or incomplete analysis of the competitive environment;
•regulatory constraints on rate increases or coverage limitations;
•our inability to accurately estimate investment yields and the duration of our liability for loss and loss adjustment expenses; and
•unanticipated litigation, court decisions, and legislative or regulatory actions or changes to the existing regulatory landscape.
To address the potential errors or desired or required changes in our current business model, we may be compelled to increase the amount allocated to cover policy claims, or to address other economic factors resulting in an increase in future premium rates, or to additionally or alternatively adopt different underwriting standards. Any of these changes may result in a decline in new business and renewals and, as a result, have a material adverse effect on the business, financial condition, and results of operations of our Insurance segment.
Reinsurance subjects Hagerty Re to counterparty risk if reinsurers fail to pay or timely pay claims due to insolvency or otherwise fail to honor their obligations.
Hagerty Re is legally obligated to pay claims under the reinsurance agreements where Hagerty Re has assumed risk, regardless of whether Hagerty Re is able to secure its own reinsurance for ceded reinsurance coverages. If one or more of Hagerty Re's reinsurance providers become insolvent or default in payment when reimbursement is sought by Hagerty Re, this may have a material effect on Hagerty Re's financial condition and results of operations as well as its ability to accept risk. Such an event may cause Hagerty Re to require capital investments that may not be available.
Unexpected changes in the interpretation of coverage or provisions, including loss limitations and exclusions, in the insurance policies we sell and service could have a material adverse effect on the financial condition and operations of our Insurance segment.
We have specifically negotiated loss limitations and exclusions in the policies we sell and service, and these limitations and exclusions may not be enforceable in the manner we intend. As industry practices and legal, judicial, social, and other conditions change, unexpected and unintended issues related to claims and coverage may emerge. While these limitations and exclusions help us assess and mitigate our loss exposure, it is possible that a court or regulatory authority could nullify or void a limitation or exclusion, or legislation could be enacted modifying or barring the use of such limitations or exclusions. These types of governmental actions could result in higher than anticipated losses and loss adjustment expenses, which could have a material adverse effect on the financial condition or results of operations of our Insurance segment. In addition, court decisions have eliminated long standing coverage limitations by a narrow reading of policy exclusions. Under the insurance laws, the insurer typically has the burden of proving an exclusion applies and any ambiguities in the terms of a loss limitation or exclusion provision are typically construed against the insurer. These types of cases and the issues they raise may adversely affect our business by either broadening coverage beyond our underwriting intent or by increasing the frequency or severity of claims. In some instances, these changes may not become apparent until sometime after we have issued insurance contracts that are affected by the changes. As a result, the full extent of liability under the insurance contract may not be known for many years after a contract is issued. There could also be additional exposure with claims for other household vehicles that are not covered under an insurance policy issued by us, such as for someone's regular use vehicle. It is possible that our underwriting companies that we write business through may share in liability with these types of claims in certain instances.
Hagerty Re's ultimate loss liability could exceed our loss and loss adjustment expense reserves, materially adversely affecting the financial condition and results of operations of our Insurance segment.
Significant periods of time often elapse between the occurrence of an insured or reinsured loss, the reporting of the loss to us, and our payment of that loss. To recognize liabilities for unpaid losses, we establish reserves as balance sheet liabilities representing management's best estimate of unpaid losses related to both reported claims and incurred but not reported ("IBNR") claims. These reserves also include management's best estimate of all expenses associated with processing and settling claims. The process of estimating loss reserves is inherently complex and subjective and involves a high degree of judgment. The factors considered by management in estimating the provision for unpaid losses and loss adjustment expenses include the following:
•the views of our actuaries;
•historical trends in claim frequency and severity, including the impacts of adverse weather-related events;
•changes in claim cycle time and claim settlement practices;
•observed industry trends;
•the changing mix of business, predominantly due to the large growth in modern collectible cars which carry a different risk profile than the risks associated with collector cars;
•inflation or deflation;
•retention limits under current catastrophe and treaty reinsurance programs; and
•legislative and judicial changes in the jurisdictions in which we operate.
This process assumes that past experience, adjusted for the effects of current developments and anticipated trends, is an appropriate basis for predicting future events. There is no precise method, however, for evaluating the impact of any specific factor on the adequacy of reserves, and actual results will differ from original estimates. As part of the reserving process, we regularly review our loss reserves and make adjustments as necessary. Future increases in loss reserves may result in additional charges to earnings, which may be material. Our estimates could prove to be inadequate, and this underestimation could have a material adverse effect on our financial condition.
Our expansion into different insurance products and jurisdictions may subject us to additional costs and expenses, and our plans might not be as profitable as projected.
We believe that the growth of the business and revenue of our Insurance segment depends in part upon our ability to expand into different jurisdictions and accurately project profitability.
Increasing our Member count, expanding into new geographic markets, and introducing new products takes time. Such expansions also require us to navigate and comply with extensive regulations, and may happen more slowly than we expect or than it has occurred in the past. As a result, we may incur losses or otherwise not be successful in entering new markets or introducing new products.
If we are unable to remain competitive on Member experience, pricing, or insurance coverage options, our ability to grow and retain our business may also be adversely affected. In addition, we might not be able to accurately predict risk segmentation of new and renewal Members or potential Members, which could also reduce the profitability of our Insurance segment.
Our expansion into new markets and new products may place us in unfamiliar competitive environments and involve various risks, including competition, government regulation, the need to invest significant resources, and the possibility that returns on such investments might not be achieved for several years, or at all. If we grow our geographic footprint or product offering at a slower rate than expected, or if we are unable to overcome the challenges listed above, the business, financial condition and results of operations of our Insurance segment could be materially and adversely affected.
Our reliance on technology and intellectual property from third parties for pricing and underwriting insurance policies, handling claims, and maximizing automation, could cause an adverse impact on the business and operations of our Insurance segment if these third parties become unavailable or provide us with inaccurate information.
We use data, technology, and intellectual property licensed from unaffiliated third parties in certain components of our products, including insurance industry proprietary information that we license, and we may license additional third-party technology and intellectual property in the future. Any errors or defects in this third-party technology and intellectual property could result in errors that could harm our brand and business. In addition, licensed technology and intellectual property may not continue to be available on commercially reasonable terms, or at all. Also, should a company refuse to license its proprietary information to us on the same terms that it offers to our competitors, we could be placed at a significant competitive disadvantage. If any technology and intellectual property we license from others becomes unavailable, we may not be able to find replacement technologies or intellectual property at a reasonable cost or at all, which could materially harm the business and results of operations of our Insurance segment.
Our failure to accurately and timely pay claims on our insurance programs could have an adverse impact on the business, financial condition and prospects of our Insurance segment.
We must accurately and timely evaluate and pay claims made under the policies in our insurance programs. There are many factors that could affect our ability to pay claims accurately and timely, including the efficiency of our claims processing, the training and experience of our claims adjusters, and our ability to develop or select and implement appropriate procedures and systems to support our claims functions.
The risks included in our insurance programs are typically those of an antique, classic, or collectible vehicle nature. Adjusting claims on these types of risks often requires specialized knowledge of collector vehicles, so our claims staff is trained to have collectible vehicle expertise to provide an efficient, yet comprehensive, claims experience. The manner in which we handle claims is a differentiating factor for our business, and an inability to be able to continue to offer a timely and comprehensive claims experience could undermine our brand and position in the collector car and enthusiast vehicle insurance marketplace. Additionally, any failure to pay claims accurately or timely could also lead to regulatory and administrative actions or material litigation, loss or reduction in reinsurance recoverable, or result in damage to our reputation, any one of which could materially and adversely affect the business, financial condition, results of operations and prospects of our Insurance segment.
If our claims adjusters are unable to effectively process our volume of claims in accordance with our service metrics and the manner that our Members expect, our ability to grow our business while maintaining high levels of Member satisfaction could be compromised, which in turn, could adversely affect the reputation, financial condition, and results of operations of our Insurance segment.
A downgrade in the financial strength rating of the carriers on our insurance programs may adversely affect our ability to conduct business as currently conducted.
The ability of our carrier partners to underwrite business on our insurance programs is dependent upon their financial strength ratings as evaluated by independent rating agencies. In the event that any of our carrier partners are downgraded, we believe our ability to write business through them would be adversely affected. In the normal course of business, we evaluate their capital needs to support the amount of business they write in order to maintain their financial strength ratings.
Hagerty Re is subject to regulatory requirements to maintain its license in Bermuda as a Class 3A insurer.
Hagerty Re is registered as a Class 3A insurer under the Bermuda Insurance Act. The BMA issues regulations and other guidance prescribing requirements that Bermuda-licensed insurance companies, like Hagerty Re, are required to comply with. For example, the BMA requires Bermuda-licensed insurers to maintain a minimum level of capital and surplus, comply with restrictions on dividends, make financial statement filings, prepare a financial condition report, maintain a principal office in Bermuda from which insurance business is directed and managed and allow for the performance of certain periodic examinations of financial condition. These statutes and regulations may restrict Hagerty Re's ability to write reinsurance contracts, distribute funds and pursue its investment strategy.
Under its license as a Class 3A insurer, Hagerty Re must meet and maintain the relevant solvency margin, and liquidity and other ratios applicable under Bermuda law. For example, Hagerty Re's license limits it to reinsuring business that is underwritten by our subsidiaries and carriers rated A- or better by A.M. Best or similar rating agencies. Additional operational requirements for Hagerty Re in Bermuda include:
•maintaining a principal office in Bermuda and having a certain number of Bermuda-domiciled managers involved in overseeing operations;
•obtaining prior approval for changes in ownership/transfers of shares;
•complying with Bermuda know-your-customer and anti-bribery type laws;
•having audited financial statements and being subject to BMA examination; and
•carrying out operations in accordance with its filed and approved business plan.
Failure to operate properly in accordance with Bermuda law could cause Hagerty Re's license to be restricted or revoked, result in possible supervisory control of Hagerty Re and its assets and termination of reinsurance agreements with its ceding insurers.
Risks Related to Our Marketplace Segment
Our growth strategy involves the development and expansion of our Marketplace segment offerings, and if we are unable to realize the anticipated benefits from their growth and integration with our Insurance segment, the business, financial condition, and results of operations of our Marketplace segment could be materially and adversely affected.
Our Marketplace segment, through which automotive enthusiasts can buy, sell, and finance collector cars and enthusiast vehicles, complements the offerings of our Insurance segment. It is possible that the anticipated development and expansion of our Marketplace segment, including the Broad Arrow business, could take longer than planned and may not complement the growth in our Insurance segment as we expect.
Any of the foregoing factors could result in the loss of valuable employees, Members, and buyer and seller relationships. These factors could also result in the disruption of our ongoing businesses, processes, systems, as well as inconsistencies in standards, controls, procedures, practices, policies, and compensation arrangements. Any of these disruptions could adversely affect our ability to achieve the anticipated benefits from the integration of our Marketplace segment with our Insurance segment.
Expansion into new markets exposes our Marketplace segment to complex, inconsistent global regulations and higher compliance costs, which may result in disruption to our ongoing businesses.
As Broad Arrow expands into new geographies, it subjects our Marketplace segment to complex, evolving, and sometimes inconsistent regulatory frameworks across different jurisdictions, including stringent consumer protection rules, advertising and distance selling requirements, auction and motor-vehicle transaction regulations, duties and value added tax ("VAT") schemes, economic sanctions, anti-money laundering and know-your-customer obligations, data privacy and security requirements, payment services and credit-related authorizations and conduct standards, and country-specific licensing, reporting, and disclosure regimes. Compliance demands may require significant investment in local expertise, systems, and controls; may necessitate changes to our platform design, business processes, and customer experience; may result in the disruption of our ongoing businesses, processes, and systems; and may limit or delay certain product features, monetization strategies, data uses, and cross-border operations.
Competition in the global market for sales of collector cars and enthusiast vehicles and the variability of the value, demand and availability of quality collector cars for sale may adversely impact the business, financial condition, and results of operations of our Marketplace segment.
Our Marketplace segment competes with other collector car auction houses, dealers, brokers, and classifieds platforms to obtain valuable consignments to offer for sale either at auction or through private sale. The level of competition can adversely impact our ability to obtain valuable consignments for sale, as well as the commission margins realized on such consignments.
The values and availability of quality collector cars and enthusiast vehicles for sale is influenced by a number of factors not within our control. The supply and demand for collector cars and enthusiast vehicles, and therefore the values of collector cars and enthusiast vehicles, are influenced not only by overall economic conditions, but also by changing trends in the collector car and enthusiast vehicle market as to which vehicles and provenance are most sought after and by the collecting preferences of individual collectors. Marketplace businesses generate revenues through fees and commissions generally based on a percentage of the final sale price, which can fluctuate based on the market dynamics. Further, the fees and commissions we charge may be lowered based on both the level of competition and the market dynamics between supply and demand for collector cars and enthusiast vehicles. These conditions and trends are generally unpredictable and may adversely impact our ability to obtain and sell consigned vehicles and our ability to maintain our fee structure, which may cause significant variability in the results of operations of the Marketplace segment from period to period.
Many major consignments, and specifically large single-owner collection sale consignments, are often driven by personal circumstances of the owner, including but not limited to death, divorce, and/or other financial circumstances, all of which are unpredictable and may cause significant variability in the results of operations of our Marketplace segment from period to period.
Our Marketplace segment could be exposed to losses in the event of title, authenticity or other claims related to damage or theft.
The assessment of collector cars and enthusiast vehicles offered for auction or private sale can involve potential claims regarding title, authenticity of chassis, drivetrain and vehicle identification numbers, provenance, and condition. The vehicles we sell may be subject to statutory warranties as to title or other limited warranties that cannot be disclaimed under our General Conditions of Sale that are published online or in our auction sale catalogs and the terms stated in, and the laws applicable to, agreements governing private sale transactions. Our assessment of the vehicles we offer is based on scholarship and research, but necessarily requires a degree of judgment by our car specialists and researchers. In the event of a title, authenticity or other claim against us, we may have recourse against the consignor or seller of the property and may have the benefit of insurance, but a claim could nevertheless expose us to losses and to reputational risk.
Valuable collector cars and enthusiast vehicles are exhibited and stored at events and facilities around the world. Although we maintain security measures at our premises and insurance, valuable property may be subject to damage or theft. The damage or theft of valuable property despite these security measures and insurance could have an adverse impact on the business and reputation of our Marketplace segment.
If we are unable to maintain or obtain our dealer licenses, auctioneer licenses, and/or other applicable permits and licenses as required in certain jurisdictions in which we operate, or plan to operate, such licensing issues may adversely impact the business, financial condition, and results of operation of our Marketplace segment.
Our Marketplace segment businesses are licensed and permitted, as required, in the jurisdictions where they operate, including as a dealer, auction house, lender, or intermediary to facilitate the auction, sale, purchase, or financing of collector cars and enthusiast vehicles. Our inability to maintain or obtain the required licenses or permits in any jurisdiction where we operate or plan to operate may adversely impact the business, financial condition, and results of operations of the businesses within our Marketplace segment.
The limited operating history of BAC may not represent BAC's future operating results and the fact that there have been no material loan losses on the BAC loan portfolio to date may not be indicative of future loan loss experience. In addition, our ability to realize proceeds from the sale of collateral for BAC loans may be delayed or limited.
BAC, our wholly owned collector car financing business, has a limited operating history and has incurred no material losses on its loan portfolio to date. Accordingly, despite our conservative loan underwriting standards, our current loan loss experience may not be indicative of the future performance of the loan portfolio. In the event of a loan default, our ability to realize proceeds from the sale of collateral may be impaired where the collateral was incorrectly valued, or there are competing claims on the collateral, or disputes involving a borrower and/or the collateral including, but not limited to, bankruptcy, litigation or insolvency laws.
Changes to tax laws may affect the volume of collector car and enthusiast vehicle inventory available for our Marketplace segment and increase our compliance risks.
Because our Marketplace segment operates across many U.S. states and international jurisdictions, we are subject to a patchwork of rules on sales tax, use tax, VAT, and other transaction-based taxes. Governments are rapidly updating these laws to cover online platforms, and we may be required to register, collect and remit taxes in more places as we grow. These changes may make buying or selling through our Marketplace more expensive or burdensome for collectors, which could reduce the number of vehicles listed or sold through Marketplace operations.
As rules evolve, we may also face greater compliance obligations and scrutiny from tax authorities. If we misinterpret a requirement, are late in registering, or fail to collect or remit the proper tax or supporting documentation, we could be required to pay back taxes, penalties and interest, even when our collectors are responsible for the tax. We may also incur costs to update systems, processes or reporting to meet new rules. Any increase in tax complexity, liability or compliance burden could reduce Marketplace transaction volumes and negatively affect our financial results.
The legal and regulatory requirements applicable to our business are extensive. If we are not able to comply, it could have an adverse effect on us. Extensive regulation and potential further restrictive regulation could increase our operating costs and limit our growth.
We are subject to extensive laws, regulations, and supervision in the jurisdictions in which we conduct business, including those related to:
•data privacy and cybersecurity;
•anti-money laundering, anti-corruption, and anti-bribery;
•domestic and international economic sanctions;
•restrictions on advertising and marketing;
•restrictions on rebating and inducements related to insurance transactions;
•restrictions on sharing insurance commissions and payments of referral fees;
•restrictions related to underwriting and pricing of insurance;
•approval of policy forms and premiums;
•restrictions on the adjustment and settlement of insurance claims;
•restrictions on the sale, solicitation, and negotiation of insurance;
•rules regarding licensing, affiliations, and appointments;
•regulation of registered securities, corporate governance and risk management, and consumer finance; and
•periodic examinations of operations, finances, market conduct, and claims practices.
These laws are complex and subject to change. Any adverse changes in, or the enactment of new, applicable laws and regulations may increase the complexity of the regulatory environment in which we operate, which could materially increase our direct and indirect compliance costs and other expenses of doing business, adversely impact our growth or profitability and result in adverse changes to our business practices.
While we believe that we have adopted adequate and effective risk management and compliance programs, compliance risks remain, especially as we become subject to additional rules and regulations. The increasing speed and volume of regulatory changes could hinder our ability to appropriately review, analyze, and implement processes to ensure compliance in a timely manner. Our failure to comply with applicable laws and regulations could subject us to regulatory fines, sanctions, equitable relief, changes to our business practices and other penalties, including restrictions on our ability to do business in affected jurisdictions, any of which could have a material adverse effect on our financial condition and results of operations.
Complex legal, regulatory, and contractual requirements regarding data privacy and cybersecurity may impact how we market and interact with existing and future Members, and could have an adverse effect on our business, financial condition, and operations.
We are subject to complex and evolving laws, regulations, industry standards, and contractual obligations, relating to the collection, use, retention, security, transfer, disclosure, and other processing of personal information. Compliance requirements may restrict our communications and marketing activities, limit permissible uses of data, increase operational complexity and costs, and reduce our ability to effectively acquire and retain Members.
As public and regulatory scrutiny of cybersecurity incidents in the insurance industry increases, new or revised requirements may further expand our compliance obligations and limit the effectiveness of our marketing and outreach, potentially reducing revenue and Member growth. We may also be contractually liable to indemnify and hold harmless third parties from the costs or consequences of non-compliance with any such laws or regulations. Our insurance coverage relating to any data security and privacy damages and claim expenses may not be sufficient to compensate for all liabilities we may incur.
Our intellectual property rights are extremely valuable and if they are not properly protected, our products, services, and brand could be adversely impacted.
As we continue expanding our development of intellectual property across all channels, we may be unable to adequately protect and/or obtain appropriate rights, leading to increased risk. Additionally, our intellectual property rights may be subject to invalidation or circumvention. Competitors may target certain products or services and seek to assert competing rights. If appropriate contractual measures are not maintained, employees, contractors, and vendors may divulge trade secrets or claim ownership over our intellectual property.
Risks Related to Ownership of Our Securities
Our entry into the Markel Fronting Arrangement will reduce our reported commission revenue and ceding commission expense beginning in 2026 and reduce period‑to‑period comparability of our Consolidated Financial Statements.
As a result of the Markel Fronting Arrangement, effective January 1, 2026, (i) we continue to issue policies through Essentia, with our underwriting authority (including pricing decisions, rate filing, insurance rating, and risk selections) and claims authority expanded to the maximum levels permitted by applicable law; (ii) we have assumed increased administrative responsibilities for the policies issued through Essentia; (iii) Hagerty Re controls 100% of the premium and assumes 100% of the risk for policies written through Essentia; and (iv) Hagerty Re pays an initial fronting fee, representing 2% of written premium, to Markel for administrative support, which incrementally decreases based on the level of written premium in each calendar year.
Due to the expanded underwriting and claims authority granted to us under the Markel Fronting Arrangement, we now control the Markel book of business and as a result, the accounting for this book of business will change to reflect the new contractual terms, affecting the recognition of MGA commission revenue and Hagerty Re ceding commission expense. Although we expect the Markel Fronting Arrangement to result in increased profitability over the long term, our reported commission revenue and policy acquisition costs, including ceding commission expense, will be lower than in prior periods and our Consolidated Financial Statements will be less comparable across reporting periods. However, we have not yet conducted a financial closing for a period that includes the Markel Fronting Arrangement, and the accounting implications of the arrangement may be different than what we are expecting. These accounting implications may not be readily understood by investors and analysts. If market participants do not fully appreciate the effect of the Markel Fronting Arrangement on our reported results, expectations regarding our financial performance could be negatively affected, which could adversely impact our stock price and increase volatility.
Our entry into the Markel Fronting Arrangement may not result in the commercial benefits we are expecting.
We may not be able to derive the anticipated benefits from the Markel Fronting Arrangement for any number of reasons, including our or Markel’s inability to implement it effectively, market or industry dynamics, regulatory considerations, or other factors, some of which are beyond our control. These factors may require us to incur unexpected costs, distract our management, or otherwise adversely impact the business, financial condition, and results of operations of our Insurance Segment.
Our stock may be diluted by future issuances of additional Hagerty, Inc. Class A Common Stock ("Class A Common Stock") in connection with our incentive plans, acquisitions or otherwise; future sales of such shares in the public market or the expectations that such sales may occur could lower our stock price.
We may issue additional shares of Class A Common Stock in several ways:
By the Board of Directors (the "Board"). Our Amended and Restated Charter authorizes us to issue shares of our Class A Common Stock and options, rights, warrants and appreciation rights relating to our Class A Common Stock on the terms and conditions established by our Board in its sole discretion, whether in connection with acquisitions or otherwise.
Under the 2021 Stock Incentive Plan. We have reserved 38,317,399 shares of Class A Common Stock for issuance under our 2021 Stock Incentive Plan(as defined in Note 21 — Share-Based Compensation in Item 8 of Part II of this Annual Report). As of December 31, 2025, we have issued 3,042,094 shares under this Plan.
Under the 2021 Employee Stock Purchase Plan. We have reserved 11,495,220 shares of Class A Common Stock for issuance under our 2021 Employee Stock Purchase Plan (as defined in Note 21 — Share-Based Compensation in Item 8 of Part II of this Annual Report). As of December 31, 2025, we have issued 285,028 shares under this Plan.
Under the Contribution and Exchange Agreement. We reserved 4,724,560 shares of Class A Common Stock for exchange under our Contribution and Exchange Agreement (as defined within the Sixth Amended and Restated Limited Liability Company Agreement of THG (the "LLC Agreement"), incorporated by reference within Item 15. Exhibits, Financial Statement Schedules, in this Annual Report). As of December 31, 2025, we have exchanged 855,922 shares under the Contribution and Exchange Agreement.
Under the Securities Purchase Agreement. We reserved 6,785,410 shares of Class A Common Stock for conversion under our Securities Purchase Agreement. As of December 31, 2025, no shares of Series A Convertible Preferred Stock have been converted to shares of Class A Common Stock under the Securities Purchase Agreement. Refer to Note 19 — Convertible Preferred Stock in Item 8 of Part II of this Annual Report for additional information.
The Talent, Culture, and Compensation Committee (the "Compensation Committee") of our Board may in the future increase the number of shares to be reserved for future issuance under our equity incentive plans at its discretion. At such time, we may file additional registration statements on Form S-8 under the Securities Act to register shares of our Class A Common Stock or securities convertible into or exchangeable for shares of Class A Common Stock issued pursuant to our equity incentive plans. Any such Form S-8 registration statements will automatically become effective upon filing. Accordingly, shares registered under such registration statements will be available for sale in the open market.
Any stock that we issue or exchange would dilute the percentage ownership held by the investors who purchase our Class A Common Stock. The market price of shares of our Class A Common Stock could decline as a result of newly issued or exchanged stock, or the perception that we might issue or exchange stock. A decline in the price of our Class A Common Stock might impede our ability to raise capital through the issuance of additional shares of Class A Common Stock or other equity securities.
Substantial blocks of our total outstanding shares may be sold into the market. If there are substantial sales of shares of our Class A Common Stock, the price of our Class A Common Stock could decline.
The market price of our Class A Common Stock could decline if there are substantial sales of our Class A Common Stock, or the perception in the market that the holders of a large number of shares intend to sell their shares, particularly sales by our directors, executive officers, and significant stockholders, or if there is a large number of shares of our Class A Common Stock available for sale. For example, we have conducted secondary offerings in the past and may do so in the future. As of February 20, 2026, we have 101,066,533 shares of our Class A Common Stock outstanding. Shares held by directors, executive officers and other affiliates are subject to volume limitations under Rule 144 under the Securities Act of 1933, as amended, or the Securities Act, and various vesting agreements.
We qualify as, and have elected to be treated as, a "controlled company" within the meaning of the NYSE listing standards and, as a result, our stockholders may not have certain corporate governance protections that are available to stockholders of companies that are not controlled companies.
So long as more than 50% of the voting power for the election of directors is held by an individual, a group, or another company, we will qualify as a "controlled company" under the NYSE listing requirements. As of December 31, 2025, HHC controls approximately 66.0% of the voting power of our outstanding capital stock. As a result, we qualify as, and elect to be treated as, a "controlled company" under the NYSE listing standards and will not be subject to the requirements that would otherwise require us to have: (i) a majority of "independent directors," as defined under the listing standards of the NYSE; (ii) a nominating committee comprised solely of independent directors; (iii) compensation of our executive officers determined by a majority of the independent directors or a compensation committee comprised solely of independent directors; and (iv) director nominees selected, or recommended for the Boards' selection, either by a majority of the independent directors or a nominating committee comprised solely of independent directors.
HHC may have its interest diluted due to future equity issuances or its own actions in selling shares of common stock, in each case, which could result in a loss of the "controlled company" exemption under the NYSE listing rules. We would then be required to comply with those provisions of the NYSE listing requirements.
The dual class structure of our common stock may adversely affect the trading market for our Class A Common Stock.
S&P Dow Jones and FTSE Russell limit their eligibility criteria for inclusion of shares of public companies on certain indices, including the S&P 500, namely, to exclude companies with multiple classes of shares of common stock from being added to such indices. In addition, several stockholder advisory firms have announced their opposition to the use of multiple class structures. As a result, the dual class structure of our common stock may prevent the inclusion of our Class A Common Stock in such indices and may cause stockholder advisory firms to publish negative commentary about our corporate governance practices or otherwise seek to cause us to change our capital structure. Any such exclusion from such indices could result in a less active trading market for our Class A Common Stock. Any actions or publications by stockholder advisory firms critical of our corporate governance practices or capital structure could also adversely affect the value of our Class A Common Stock.
The dual class structure of our common stock will have the effect of concentrating voting power with two stockholders, which will limit your ability to influence the outcome of important transactions, including a change in control.
The Hagerty, Inc. Class V Common Stock ("Class V Common Stock") has 10 votes per share and our Class A Common Stock has one vote per share. Markel and HHC, who currently hold all of the Class V Common Stock, together hold a substantial majority of the voting power of our outstanding capital stock. Because of the 10-to-1 voting ratio between our Class V and Class A Common Stock, the holders of our Class V Common Stock will collectively control a majority of the combined voting power of common stock and, therefore, will be able to control all matters submitted to our stockholders until the earlier of (i) 15 years from the date of the consummation of the business combination that formed Hagerty, Inc. in 2021; and (ii) the date on which such share of Class V Common Stock is transferred other than pursuant to a Qualified Transfer (as defined in our Amended and Restated Charter). This concentrated control will limit or preclude your ability to influence the outcome of important corporate matters, including a change in control, for the foreseeable future.
Transfers by holders of Class V Common Stock will generally result in those shares losing their super voting rights, subject to limited exceptions, such as certain transfers effected for estate planning or charitable purposes.
Our three largest stockholders hold significant voting power, have the right to designate directors to our Board and are entitled to preemptive rights with respect to the issuance of new shares of Class A Common Stock, which provides these stockholders with significant power to influence our business and affairs.
Our three largest stockholders are HHC, Markel, and State Farm. HHC controls approximately 66.0% of the voting power, Markel controls approximately 29.9% of the voting power, and State Farm controls approximately 2.2% of the voting power. Pursuant to the terms of the Investor Rights Agreement among HHC, Markel, and State Farm, HHC has the right to designate two directors to our Board, and Markel and State Farm have each designated one director to our Board. Pursuant to the Investor Rights Agreement, each of HHC, Markel, and State Farm has agreed to vote for the election of any director nominated by HHC, Markel, and State Farm in furtherance of the director designation rights described above. As a consequence, at present, the re-election in 2026 of the directors designated by HHC, Markel and State Farm is assured.
Moreover, under the terms of the Investor Rights Agreement, each of HHC, Markel, and State Farm has a contractual preemptive right. Specifically, under the terms of the Investor Rights Agreement, for so long as HHC, Markel, and State Farm, as applicable, are entitled to nominate a director, each of HHC, Markel, and State Farm, as applicable, subject to certain conditions, has a preemptive right to purchase up to the amount of any new securities we propose to issue or sell as is necessary to maintain the relative pro rata ownership position (determined on a fully diluted basis at the time of determination) of HHC, Markel, and State Farm, as applicable. Therefore, while other holders of our stock would risk suffering a reduction in percentage ownership in connection with a new issuance of securities by us, HHC, Markel, and State Farm would, through this preemptive right, have the opportunity to avoid a reduction in percentage ownership. As long as HHC, Markel, and State Farm continue to hold a significant portion of our outstanding common stock, each will have the ability to influence the vote in any election of directors and over decisions that require stockholder approval.
By virtue of their voting power and Board designation rights, preemptive right to purchase additional equity securities in future stock offerings and approval rights, HHC, Markel, and State Farm, collectively and separately, have the power to significantly influence our business and affairs and the outcome of matters required to be submitted to stockholders for approval, including the election of our directors, amendments to our charter, mergers, or sales of assets. Their influence over our business and affairs may not be consistent with the interests of some or all of our other stockholders and might negatively affect the market price of our common stock.
Because we have no current plans to pay cash dividends on our Class A Common Stock for the foreseeable future, you may not receive any return on investment unless you sell your Class A Common Stock for a price greater than that which you paid for it.
We intend to retain future earnings, if any, for future operations, expansion and debt repayment and there are no current plans to pay any cash dividends on our Class A Common Stock for the foreseeable future. The declaration, amount and payment of any future dividends on shares of our Class A Common Stock will be at the sole discretion of our Board. Our Board may take into account general and economic conditions, our financial condition and results of operations, our available cash and current and anticipated cash needs, capital requirements, contractual, legal, tax, and regulatory restrictions, implications on the payment of dividends by us to our stockholders or by our subsidiaries to us and such other factors as our Board may deem relevant. In addition, our ability to pay dividends is limited by covenants of our existing and outstanding indebtedness and may be limited by covenants of any future indebtedness we incur. As a result, you may not receive any return on an investment in our Class A Common Stock unless you sell our Class A Common Stock for a price greater than that which you paid for it.
Anti-takeover provisions in our organizational documents and applicable insurance laws could delay or prevent a change of control.
Certain provisions of our Amended and Restated Charter and Amended and Restated Bylaws may have an anti-takeover effect and may delay, defer or prevent a merger, acquisition, tender offer, takeover attempt or other change of control transaction that a stockholder might consider in its best interest, including those attempts that might result in a premium over the market price for the shares held by our stockholders.
These provisions provide for, among other things:
•the ability of our Board to issue one or more series of preferred stock;
•advance notice for nominations of directors by stockholders and for stockholders to include matters to be considered at our annual meetings;
•certain limitations on convening special stockholder meetings; and
•limiting the ability of stockholders to act by written consent.
These anti-takeover provisions could make it more difficult for a third party to acquire us, even if the third party's offer may be considered beneficial by many of our stockholders. As a result, our stockholders may be limited in their ability to obtain a premium for their shares. These provisions could also discourage proxy contests and make it more difficult for you and other stockholders to elect directors of your choosing and to cause us to take other corporate actions you desire.
Further, the insurance laws applicable to our regulated insurance subsidiaries prohibit any person from acquiring direct or indirect control of us or our regulated insurance subsidiaries, generally defined as owning or having the power to vote 10% or more of our outstanding voting stock, without the prior written approval of state regulators.
Our Amended and Restated Charter designates the Court of Chancery of the State of Delaware as the sole and exclusive forum for certain types of actions and proceedings that may be initiated by our stockholders, which could limit our stockholders' ability to obtain a favorable judicial forum for disputes with us or our directors, officers, employees, or stockholders.
Our Amended and Restated Charter provides that, subject to limited exceptions, any (i) derivative action or proceeding brought on behalf of us under Delaware law; (ii) action asserting a claim of breach of a fiduciary duty owed by any current or former director, officer, or other employee to us or our stockholders; (iii) action asserting a claim against us, our directors, officers or other employees arising under the Delaware General Corporation Law ("DGCL"), our Amended and Restated Charter or our Amended and Restated Bylaws (in each case, as may be amended from time to time); (iv) action asserting a claim against us or any of our directors, officers or other employees governed by the internal affairs doctrine of the State of Delaware; or (v) other action asserting an "internal corporate claim," as defined in Section 115 of the DGCL, in all cases subject to the court having personal jurisdiction over all indispensable parties named as defendants shall, to the fullest extent permitted by law, be exclusively brought in the Court of Chancery of the State of Delaware or, if such court does not have subject matter jurisdiction thereof, another state or federal court located within the State of Delaware. Any person or entity purchasing or otherwise acquiring any interest in shares of our capital stock shall be deemed to have notice of and to have consented to the provisions of our Amended and Restated Charter described above. This choice of forum provision may limit a stockholder's ability to bring a claim in a judicial forum that it finds favorable for disputes with us or our directors, officers or other employees, which may discourage such lawsuits against us and our directors, officers and employees. Alternatively, if a court were to find these provisions of our Amended and Restated Charter inapplicable to, or unenforceable in respect of, one or more of the specified types of actions or proceedings, we may incur additional costs associated with resolving such matters in other jurisdictions, which could adversely affect our business and financial condition.
There is no public market for our Series A Convertible Preferred Stock.
There is no established public trading market for the Series A Convertible Preferred Stock, and we do not expect a market to develop. The Series A Convertible Preferred Stock is not currently listed on any securities exchange or nationally recognized trading system, including the NYSE, and we may choose not to apply to list it in the future. Without an active market, the liquidity of the Series A Convertible Preferred Stock will be limited.
The price of our securities may be volatile or may decline regardless of our operating performance and you could lose all or part of your investment as a result.
The trading price of our common stock is likely to be volatile. The stock market has experienced volatility, often unrelated or disproportionate to the operating performance of particular companies. You may not be able to resell your shares at an attractive price due to a number of factors such as those listed elsewhere in this "Risk Factors" section and this Annual Report, as well as the following:
•results of operations that vary from the expectations of securities analysts and investors;
•results of operations that vary from those of our competitors;
•public float and trading volume of our securities is low;
•changes in expectations as to our future financial performance, including financial estimates and investment recommendations by securities analysts and investors;
•announcements by us or our competitors of significant contracts, acquisitions, joint ventures, other strategic relationships or capital commitments;
•changes in general economic or market conditions or trends in our industry or markets;
•changes in business or regulatory conditions, including new laws or regulations or new interpretations of existing laws or regulations applicable to our business;
•future sales of our Common Stock or other securities;
•the public's response to press releases or other public announcements by us or third parties, including our filings with the SEC; and
•changes in accounting standards, policies, guidelines, interpretations or principles.
These broad market and industry fluctuations may adversely affect the market price of our Class A Common Stock regardless of our actual operating performance.
In the past, following periods of market volatility, stockholders have instituted securities class action litigation. If we were involved in securities litigation, it could have a substantial cost and divert resources and the attention of executive management from our business regardless of the outcome of such litigation.
If securities or industry analysts do not publish research or publish inaccurate or unfavorable research reports about our business, or if they downgrade our stock or our sector, our stock price and trading volume could decline.
The trading market for our Class A Common Stock will rely in part on the research and reports that industry or financial analysts publish about us or our business. We will not control these analysts. In addition, some financial analysts may have limited expertise with our business model and operations. Furthermore, if one or more of the analysts who do cover us downgrade our stock or industry, or the stock of any of our competitors, or publish inaccurate or unfavorable research about our business, the price of our stock could decline. If one or more of these analysts ceases coverage of us or fails to publish reports on it regularly, we could lose visibility in the market, which in turn could cause our stock price or trading volume to decline.
Risks Related to Tax
Hagerty, Inc. is a holding company, whose only material asset is its interest in THG. Hagerty, Inc. depends on THG distributions to pay taxes, make payments under the TRA, and pay other expenses.
Hagerty, Inc. is a holding company with no material assets other than its ownership of THG units and its managing member interest in THG. As a result, Hagerty, Inc. will have no independent means of generating revenue or cash flow. Its ability to pay taxes, make payments under the TRA and pay dividends (in the event that any dividends are declared) and other expenses will depend on the financial results and cash flows of THG and the distributions Hagerty, Inc. receives from THG. Deterioration in the financial condition, earnings, or cash flow of THG for any reason could limit or impair THG's ability to pay such distributions. Additionally, to the extent that Hagerty, Inc. needs funds and THG is restricted from making such distributions under applicable law or regulation or under the terms of any financing arrangements, or THG is otherwise unable to provide such funds, it could materially adversely affect Hagerty, Inc.'s liquidity and financial condition.
THG is treated as a partnership for U.S. federal income tax purposes and generally will not be subject to any entity-level U.S. federal or state income tax. Instead, the taxable income of THG will be allocated to its members, including Hagerty, Inc. Accordingly, Hagerty, Inc. will be required to pay income taxes on its allocable share of any net taxable income of THG.
Under the terms of the LLC Agreement, THG is obligated to make tax distributions to its members, including Hagerty, Inc., calculated at certain assumed tax rates. In addition to tax expenses, Hagerty, Inc. will also incur operational expenses including payment and administrative obligations under the TRA, which could be significant. Hagerty, Inc. intends to cause THG to make distributions to its members in amounts sufficient to cover all applicable taxes (calculated at certain assumed tax rates) and payments under the TRA; however, THG's ability to make such distributions may be subject to various limitations and restrictions including, but not limited to, restrictions on distributions in violation of its financing covenants that would have the effect of rendering THG insolvent, or pursuant to other applicable law. If our cash resources are insufficient to meet Hagerty, Inc.'s obligations under the TRA and to fund its obligations, Hagerty, Inc. (i) may be required to incur additional indebtedness to provide the liquidity needed to make such payments; or (ii) may be unable to make payments under the TRA, in which case such payments will be deferred and accrue interest until paid or constitute defaults for non-payment, any of which could materially adversely affect our liquidity and financial condition.
Hagerty, Inc. is required to pay Legacy Unit Holders and any other party to the TRA for certain tax benefits we may receive and the amounts payable may be substantial.
In connection with the consummation of the business combination that formed Hagerty, Inc. in 2021, Hagerty, Inc. entered into a TRA with HHC and Markel ("Legacy Unit Holders"). THG intends to have in effect an election under Section 754 of the Internal Revenue Code ("IRC") for each taxable year in which TRA exchanges occur, which is expected to result in adjustments to the tax basis of the assets of THG as a result of such TRA exchanges. The TRA generally provides for the payment by Hagerty, Inc. to Legacy Unit Holders of 85% of the cash tax benefits, if any, realized as a result of (i) tax basis adjustments resulting from TRA exchanges in connection with or following the business combination that formed Hagerty, Inc. in 2021; and (ii) certain other tax benefits related to entering into the TRA, including tax benefits attributable to making payments under the TRA. We expect that the payments required under the TRA could be substantial. Estimating the amount and timing of realization of tax benefits subject to the TRA is by its nature imprecise. As of December 31, 2025, the estimated value of the liability associated with the TRA (the "TRA Liability") was $39.8 million, which is reported within "Tax receivable agreement liability" on the Consolidated Balance Sheets.
Payments under the TRA will be based on the tax reporting positions determined, and the Internal Revenue Service ("IRS") or another tax authority may challenge all or a part of the existing tax basis, tax basis increases, or other tax attributes subject to the TRA, and a court could sustain such challenge. The parties to the TRA will not reimburse Hagerty, Inc. for any payments previously made if such tax basis or other tax benefits are subsequently disallowed, except that any excess payments made to a party under the TRA will be netted against future payments otherwise to be made under the TRA, if any, after the determination of such excess. In addition, the TRA provides that if Hagerty, Inc. (i) breaches any material obligations under the TRA (including making late payments, subject to certain exceptions); (ii) is subject to bankruptcy, insolvency or similar proceedings; or (iii) elects an early termination of the TRA, the obligations under the TRA with respect to all THG units, whether or not such units have been exchanged or redeemed before or after such transaction, would accelerate and become payable in a lump sum, in an amount equal to the present value of the anticipated future tax benefits calculated based on certain assumptions, including that Hagerty, Inc. would have sufficient taxable income to fully utilize the deductions arising from the tax deductions, tax basis and other tax attributes subject to the TRA.
The TRA also provides that, upon certain changes of control or other significant transactions, at the discretion of the Legacy Unit Holders, obligations under the TRA may be accelerated and become payable in a lump sum, calculated as described above. As a result, upon any acceleration of the obligations under the TRA (including a change of control), Hagerty, Inc. could be required to make payments under the TRA that are greater than 85% of actual cash tax savings, which could negatively impact liquidity. The change of control provisions in the TRA may also result in situations where The Legacy Unit Holders have interests that differ from or are in addition to those of our Class A Common Stock stockholders.
To the extent we receive tax distributions in excess of our actual tax liabilities and retain such excess cash, the Legacy Unit Holders may benefit from such accumulated cash balances if they exercise their exchange rights.
Under the terms of the LLC Agreement, THG is obligated to make tax distributions to its members calculated at certain assumed tax rates. Tax distributions will generally be made pro rata based on ownership; however, tax distributions may significantly exceed the actual tax liability for certain members in certain circumstances including, but not limited to, (i) due to differences between tax rates applicable to us and the assumed tax rates used for purposes of such distribution calculation; and (ii) by virtue of requirements under applicable tax rules that THG's net taxable income be allocated disproportionately to certain of its unit holders. If Hagerty, Inc. retains the excess cash we receive, the Legacy Unit Holders could benefit from any value attributable to such accumulated cash balances as a result of their rights under the Exchange Agreement.
THG does not intend to operate such that it would become treated as a publicly traded partnership taxable as a corporation for U.S. federal income tax purposes. A "publicly traded partnership" is a partnership the interests of which are listed for trading on an established securities market or are readily tradable on a secondary market or the substantial equivalent thereof. Applicable U.S. Treasury regulations provide for certain safe harbors from treatment as a publicly traded partnership and, although THG intends to operate to qualify under such safe harbors, there may be situations where it is unable to do so.
If THG were to become a publicly traded partnership taxable as a corporation for U.S. federal income tax purposes, we and THG might be subject to potentially significant tax inefficiencies, and we would not be able to recover payments previously made by us under the TRA even if the corresponding tax benefits were subsequently determined to have been unavailable due to such status.
We are subject to VAT and other indirect tax laws in multiple jurisdictions, and the complexity and interpretation of these rules could result in additional tax liabilities and compliance costs.
We are subject to VAT, sales, use, and other indirect tax laws in multiple jurisdictions, including the U.K. and the European Union, which are complex, evolving, and subject to differing interpretations by tax authorities. Determining the appropriate tax treatment of our cross-border transactions and intercompany service arrangements requires judgment, including the characterization of services, determination of place of supply, and application of reverse-charge mechanisms. Disagreements with tax authorities or changes in guidance or enforcement practices could result in additional VAT liabilities, penalties, interest, or the loss of input VAT recovery, which could adversely affect our financial condition, results of operations, and cash flows.
ITEM 1B. UNRESOLVED STAFF COMMENTS
None.
ITEM 1C. CYBERSECURITY
Risk Management and Strategy
Our cybersecurity strategy is predicated on a risk-based approach, which is continuously informed by the standards provided by organizations such as the American Institute of Certified Public Accountants, the National Institute of Standards and Technology ("NIST"), the International Organization for Standardization, the Payment Card Industry, and others. Cybersecurity represents an important input to our overall approach to enterprise risk management ("ERM").
Our cybersecurity program is based on a framework designed to safeguard the confidentiality, integrity, and availability of our information assets. This program encompasses enterprise security policies, procedures, and technical measures to manage risks, protect sensitive data, and ensure compliance with relevant regulations. Our information security program utilizes a layered defense approach where components such as risk assessments, access controls, network security, encryption, employee training, and continuous monitoring and response processes provide layers of protection for our systems and assets.
Our cybersecurity program also considers the evolving use of AI, including generative AI, by both threat actors and defenders. We assess and seek to mitigate AI-enabled attack techniques, such as the use of AI to discover vulnerabilities or generate targeted social engineering, and we are incorporating AI-driven tools and analytics into our security monitoring, threat-hunting, and response processes to enhance our ability to identify, investigate, and remediate potential cybersecurity events.
As part of our cybersecurity program, our information security team identifies and assesses material risks based on the NIST and the International Organization for Standardization ("ISO") 27001 and ISO 27002 risk assessment models and then collaborates with internal business and technical partners to proactively create internal risk treatment plans that address identified risk exposures. In addition, we assess and manage cybersecurity risks through an incident security program which consolidates input from three primary departments, including our ERM department, which operates out of the Office of the Chief Financial Officer, our Privacy department, which operates out of the Office of the Chief Legal Officer, and the Information Security department, which operates out of the Office of the Chief Information Officer ("CIO"). Together, these departments provide subject matter expertise and specialized resources to deliver concentric layers of risk management and defense against both internal and external threats.
In addition, our cybersecurity program includes third-party cyber risk assessments which evaluate the security posture of our vendors and partners to mitigate potential vulnerabilities introduced through external connections. Data loss prevention controls are systematically implemented to prevent unauthorized data exfiltration and to protect sensitive information from compromise.
Our information security program undergoes assessments conducted by both internal and external experts. The outcomes of these evaluations are communicated to senior management and the Board for review.
Governance
Our Board, through the Audit Committee, oversees our risk assessment and risk management activities, including our cybersecurity program. Our Audit Committee receives periodic reports from our CIO and is notified any time management determines that a cybersecurity incident may be material or may need to be reported to a regulatory body. Further, the Chair of our Audit Committee is regularly informed of cybersecurity risks and incidents that may be material, as well as those that are not.
Our cybersecurity program is led by an experienced CIO and an experienced Chief Information Security Officer ("CISO"). Our CIO has extensive experience in our industry with over 30 years of information technology experience, including extensive experience leading large global teams at several companies in his tenure. Our CISO has over 40 years of information technology experience, including 25 years of experience as a CISO leading large cybersecurity teams at four different insurance companies. Our CISO also has several industry-recognized designations.
As part of our cybersecurity risk management program, our information security department identifies, assesses, and manages cybersecurity risks, whether material or non-material. Through our Information Security department, the CIO and CISO work to ensure that key stakeholders are informed about the prevention, detection, mitigation, and remediation of cybersecurity risks and incidents.
We have established and maintain incident response and recovery plans that address the detection, reporting, analysis, response, recovery, communication, documentation, and post-incident review of cybersecurity incidents. We periodically test and evaluate such plans on a routine basis.
As of the date of this Annual Report, we are not aware of any material risks from cyber security threats, including as a result of previous cybersecurity incidents, that are reasonably likely to have a material adverse effect on us, our business strategy, financial condition, or results of operations. For more information regarding the risks we face from cybersecurity threats, see "Risk Factors — Risks Related to Our Business — Like others in our industry, we face potential exposures to operational disruptions caused by cyber breaches or resiliency failures impacting us or third party technology providers upon whom we rely, which could impair website availability and crucial technology operations."
ITEM 2. PROPERTIES
Our material properties include our corporate headquarters located in Traverse City, Michigan, which consists of approximately 109,500 square feet of office space under a lease agreement that expires in March 2036. We believe our facilities are adequate and suitable for our current needs and that, should it be needed, suitable additional or alternative space will be available to accommodate our operations.
ITEM 3. LEGAL PROCEEDINGS
From time to time, we are involved in various claims and legal actions that arise in the ordinary course of business. Although the results of litigation and claims cannot be predicted with certainty, we do not believe that the ultimate resolution of these actions will have a material adverse effect on our financial position, results of operations, liquidity or capital resources.
Future litigation may be necessary to defend ourselves and our partners by determining the scope, enforceability and validity of third party proprietary rights or to establish our proprietary rights. The results of any current or future litigation cannot be predicted with certainty, and regardless of the outcome, litigation can have an adverse impact on us because of defense and settlement costs, diversion of management resources and other factors.
Refer to Note 25 — Commitments and Contingencies in Item 8 of Part II of this Annual Report for additional information related to legal proceedings.
ITEM 4. MINE SAFETY DISCLOSURES
Not applicable.
PART II
ITEM 5. MARKET FOR REGISTRANT'S COMMON EQUITY, RELATED STOCKHOLDER MATTERS AND ISSUER PURCHASES OF EQUITY SECURITIES
Market Information
Our Class A Common Stock is traded on the NYSE under the symbol "HGTY".
Stockholders of Record
As of February 20, 2026, there were 15 holders of record of our Class A Common Stock and two holders of record of our Class V Common Stock. The number of record holders does not include persons who held shares of our common stock in nominee or "street name" accounts through brokers.
Dividend Policy
We do not currently intend to pay cash dividends on our Class A Common Stock. Any declaration and payment of dividends will be at the sole discretion of our Board, which may change our dividend policy at any time. Our Board will take into account:
•general economic and business conditions;
•our financial condition and results of operations;
•our available cash and current and anticipated cash needs;
•our capital requirements;
•contractual, legal, tax and regulatory restrictions and implications on the payment of dividends by us to our stockholders or by our subsidiaries (including THG) to us; and
•such other factors as our Board may deem relevant.
Hagerty, Inc. is a holding company and does not have material assets other than its ownership of THG units, and as a consequence, our ability to declare and pay dividends to holders of our Class A Common Stock is subject to the ability of THG to provide distributions to us. If THG makes such distributions, THG unit holders will be entitled to receive pro-rata distributions from THG. However, because we must pay taxes, make payments under the TRA, and pay our expenses, amounts ultimately distributed as dividends to holders of our Class A Common Stock would be less than the amounts distributed by THG to its unit holders. In addition, because our Board may determine to pay or not pay dividends, holders of our Class A Common Stock may not necessarily receive dividend distributions related to any excess distributions, even if THG makes such distributions to us.
Subject to funds being legally available, we intend to cause THG to make pro rata distributions to us and its other unit holders in an amount at least sufficient to allow us and the other unit holders to pay all applicable taxes, to make payments under the TRA and to pay our corporate and other overhead expenses. During the year ended December 31, 2025, THG made tax distributions of $30.3 million to non-controlling interest unit holders and $11.9 million of tax distributions to Hagerty, Inc. During the year ended December 31, 2024, THG made tax distributions of $6.7 million to non-controlling interest unit holders and $1.1 million of tax distributions to Hagerty, Inc.
The stock performance graph compares the cumulative total shareholder return of an investment in (i) our Class A Common Stock; (ii) the cumulative total returns of the Russell 2000; (iii) the cumulative total returns of the S&P 500 P&C Index; and (iv) our 2024 customized peer group. The graph assumes an initial investment of $100 and the reinvestment of dividends, if any. Such returns are based on historical results and are not indicative of future performance.
During 2025, we replaced our 2024 customized peer group with the S&P 500 P&C Index, which more closely aligns with our insurance-focused business model and financial profile following the expansion of our insurance operations.
Prior to this change in our peer group, our 2024 customized peer group consisted of the following companies:
The following table presents information regarding our repurchases of common stock made during the three months ended December 31, 2025:
Period
Total number of shares purchased
Weighted average price paid per share
Total number of shares purchased as part of publicly announced programs
Maximum number of shares that may yet be purchased under the programs
October 1 - 31, 2025
26,686
$
11.92
—
—
November 1 - 30, 2025
—
—
—
—
December 1 - 31, 2025
—
—
—
—
Total
26,686
$
11.92
—
—
During the three months ended December 31, 2025, we did not repurchase any shares of our Class A Common Stock pursuant to a publicly announced share repurchase program. The share amounts reflected in the table above represent shares of Class A Common Stock that were withheld by us to satisfy tax withholding obligations in connection with the vesting of restricted stock unit awards. Such share withholdings are permitted under the terms of the applicable equity compensation plans and award agreements, and the withheld shares are treated as repurchases for accounting purposes but were not acquired under any share repurchase authorization. We remitted the required tax withholdings in cash to the applicable taxing authorities.
ITEM 6. [ Reserved ]
Not applicable.
ITEM 7. MANAGEMENT'S DISCUSSION AND ANALYSIS OF FINANCIAL CONDITION AND RESULTS OF OPERATIONS
The following discussion and analysis of our financial condition and results of operations should be read in conjunction with our Consolidated Financial Statements and related Notes included in Item 8 of Part II of this Annual Report, including Note 4 — Segment Reporting and Disaggregated Revenue. Beginning with this Annual Report, our Consolidated Financial Statements are presented in accordance with Article 7 of Regulation S-X and reflect our new Insurance and Marketplace segments. This Management's Discussion and Analysis of Financial Condition and Results of Operations ("MD&A") contains forward-looking statements based upon current expectations that involve risks and uncertainties. Please refer to the section in this Annual Report entitled "Cautionary Statement Regarding Forward-Looking Statements".
The following discussion contains references to the years ended December 31, 2025 and 2024. A discussion of the Company's results of operations comparing results for the years ended December 31, 2024 and 2023 is included under the section entitled "Results of Operations" in Item 7 of Part II of the Annual Report on Form 10-K for the year ended December 31, 2024, and is incorporated by reference into this Annual Report.
Overview
We are a market leader in providing insurance for collector cars and enthusiast vehicles, helping the automotive enthusiast community protect and enjoy their special cars for more than 40 years. Our insurance products are complemented by HDC, our renowned car events, and our media and entertainment platforms. We also operate a trusted marketplace where collectors and enthusiasts can buy and sell a wide range of vehicles, from entry level enthusiast vehicles to high value collector cars, primarily though Broad Arrow live auctions and brokered private sales. In addition, through our marketplace, BAC provides financing solutions by structuring loans secured by collector cars. Together, our integrated automotive ecosystem fosters a vibrant community where enthusiasts connect, share their passion, and access resources that enhance their ownership experience. Our vision is to be the world's most trusted and preferred brand for automotive enthusiasts to insure, buy, sell, and enjoy their special cars.
Due to the continued revenue growth and recent geographic expansion of the marketplace business, beginning in the fourth quarter of 2025, we updated our segment reporting to reflect two operating and reportable segments: Insurance and Marketplace. Previously, we operated as a single operating and reportable segment. We have recast prior period segment information to conform to the current presentation in this Annual Report. For more information regarding segment reporting, refer to Note 4 — Segment Reporting and Disaggregated Revenue in Item 8 of Part II of this Annual Report.
Transition to Article 7 Reporting Framework
Beginning with this Annual Report, we present our Consolidated Financial Statements in accordance with Article 7 of Regulation S-X ("Article 7"), which governs financial reporting for insurance companies. In prior reporting periods, we presented our Consolidated Financial Statements in accordance with Article 5 of Regulation S-X ("Article 5"), which is applicable to entities operating in non-specialized industries. The adoption of Article 7 reflects the continued expansion of our insurance operations, including expanded risk assumption under the Markel Fronting Arrangement and the introduction of our Enthusiast+ product.
Investors should note that the transition to Article 7 results in presentation differences that may affect comparability when compared to the financial statements presented in prior SEC filings, including the discontinuation of a classified balance sheet and the reclassification of certain line items on the Consolidated Balance Sheets. In addition, "Net investment income" and "Net investment gains" are now reported as components of revenue within the Consolidated Statements of Operations. Prior period information has been recast in this Annual Report to conform to the requirements of Article 7.
Recent Developments
On December 31, 2025, we entered into new contractual arrangements and amended the terms of our existing contractual arrangements with Markel and its affiliates. These coordinated transactions form the Markel Fronting Arrangement, which became effective January 1, 2026. Under the Markel Fronting Arrangement: (i) we continue to issue policies through Essentia, with our underwriting authority (including pricing decisions, rate filing, insurance rating, and risk selections) and claims authority expanded to the maximum levels permitted by applicable law; (ii) we have assumed increased administrative responsibilities for the policies issued through Essentia; (iii) Hagerty Re controls 100% of the premium and assumes 100% of the risk for policies written through Essentia; and (iv) Hagerty Re pays an initial fronting fee, representing 2% of written premium, to Markel for administrative support, which incrementally decreases based on the level of written premium in each calendar year. We expect these changes to result in increased profitability and additional control, allowing for enhanced operational efficiencies.
Due to the expanded underwriting and claims authority granted to us under the Markel Fronting Arrangement, we now control the Markel book of business. While our U.S. MGA subsidiary and Hagerty Re will continue to operate in the same manner they have historically, beginning on January 1, 2026, the benefit of our MGA services will be received by Hagerty Re and not Markel. As a result, effective in the first quarter of 2026, we will not recognize commission revenue or the associated ceding commission expense for policies issued through the Markel Fronting Arrangement in our Consolidated Financial Statements. However, ceding commissions associated with Markel policies issued in 2025 will continue to be recognized as expense ratably over the remaining term of those policies throughout 2026. In addition, policy acquisition costs incurred by our U.S. MGA subsidiary for Markel policies issued in 2026 will be deferred and amortized over the policy term. Although we expect the Markel Fronting Arrangement to result in increased profitability, our reported commission revenue and policy acquisition costs, including ceding commission expense, will be lower than in prior periods, reflecting the new contractual terms governing our relationship with Markel.
Components of Our Results of Operations
Revenue
Commission and fee revenue
We generate commission and fee revenue through our MGA subsidiaries, primarily from the underwriting, sale, and servicing of collector car and enthusiast vehicle insurance policies on behalf of our insurance carrier partners. Commissions are earned for both new and renewed policies. Commission and fee revenue is earned when the policy becomes effective, net of allowances for policy changes and cancellations.
Under the terms of our contracts with certain insurance carrier partners, we have the opportunity to earn a contingent underwriting commission based on the results of the book of business, including the level of written or earned premium and loss ratio. CUCs are recognized in the period that the policy is issued based on our estimate of the commission we will become entitled to receive such that a significant reversal of revenue is not probable.
Earned premium, net represents the earned portion of written premiums that Hagerty Re has assumed under quota share reinsurance agreements with our insurance carrier partners, net of premiums ceded to various reinsurers. Premiums assumed and ceded are recognized on a pro-rata basis over the term of the reinsured policies, which is generally 12 months.
Membership and other revenue
We earn subscription revenue from the sale of HDC memberships, which are bundled with our insurance policies and give members access to an array of products and services, including emergency roadside assistance, Hagerty Drivers Club Magazine, special access to automotive enthusiast events, our proprietary vehicle valuation tool, and special vehicle-related discounts. Revenue from the sale of HDC memberships is recognized ratably over the period of the membership. The membership is treated as a single performance obligation to provide access to stated Member benefits over the life of the membership, which is currently one year.
Other revenue also includes sponsorship, admission, advertising, valuation, registration, and sublease income. Other revenue is recognized when the performance obligation for the related product or service is satisfied.
Net investment income
Net investment income primarily consists of interest earned on our cash, cash equivalents, and fixed maturity securities, and, to a lesser extent, dividends earned from equity securities. Net investment income is recorded net of related investment management expenses. The principal factors that influence net investment income are the size, composition, and yield of our investment portfolio.
Net investment gains
Net investment gains represents the cumulative difference between the cost basis (or carrying value) and the net proceeds received from the sale of investments during the period, as well as the change in fair value of our equity securities between periods.
Marketplace revenue
Our marketplace business earns commission and fee-based revenue primarily from the sale of collector cars and enthusiast vehicles through live auctions, time-based digital auctions, and brokered private sales. Through our marketplace business, we also earn revenue from the sale of collector cars and enthusiast vehicles that we have opportunistically acquired for resale. In addition, we earn finance revenue from loans made to qualified collectors and businesses secured by their collector cars.
Commission and fee-based marketplace revenue is recognized on a net basis when the underlying sale is completed, which is generally upon the matching of a seller and buyer in a legally binding sale transaction. Revenue from the sale of acquired collector cars and enthusiast vehicles is recognized on a gross basis at the point in time when title and control of the vehicle is transferred to the buyer, which is generally upon collection of the full purchase price. Finance revenue is recognized over time as earned based on the amount of the outstanding loan, the applicable interest rate on the loan, and the length of time the loan was outstanding during the period.
Operating Expenses
Losses and loss adjustment expenses
Losses and loss adjustment expenses represent our best estimate of the losses and associated settlement costs related to the risks we assume. Losses consist of claims paid, case reserves, and IBNR costs, which are recorded net of estimated recoveries from reinsurance, salvage, and subrogation. Loss adjustment expenses consist of the cost associated with processing and settling claims.
Throughout the year, we record an estimate of quarterly losses and loss adjustment expenses in the Consolidated Statements of Operations using an annual loss ratio, which is based on statistical analysis performed by our internal and external actuarial teams and considers several factors, including projected levels of catastrophe events and development patterns. The annual loss ratio is reviewed regularly and adjusted, as necessary. Management believes this approach provides a more consistent view of loss experience over the year given the seasonality of our business.
Ceding commissions, net represents the commissions paid by Hagerty Re to our insurance carrier partners for the risk assumed under the quota share agreements with those carriers. These commissions represent Hagerty Re's pro-rata share of the carrier's costs including (i) policy acquisition costs, which principally consist of the commissions earned by our MGA subsidiaries; (ii) general and administrative costs; and (iii) other costs. Ceding commissions are recorded net of commissions received by Hagerty Re from reinsurers related to ceded reinsurance premiums. Ceding commissions, net is recognized ratably over the term of the related policies, which is generally 12 months.
Sales expense
Sales expense includes costs related to the sale and servicing of insurance policies, as well as costs related to our membership and marketplace offerings, such as broker expense, cost of sales, promotion expense, and travel and entertainment expenses. Broker expense is the compensation paid to our agent partners and national broker partners when an insurance policy is written by our MGA subsidiaries through a broker relationship. Broker expense generally trends with written premium growth. Cost of sales includes payment processing fees, emergency roadside service costs, postage and other variable costs associated with the sale and servicing of a policy.
Cost of sales also represents direct costs associated with the sale of vehicles and memorabilia through auctions and private sales, including the purchase price and associated direct costs of inventory when Broad Arrow opportunistically purchases inventory to be sold through auctions or private sales, as well as interest expense and borrowing costs associated with the BAC Credit Facility. Promotion expense includes various costs related to branding, events, advertising, marketing, and customer acquisition.
Salaries and benefits
Salaries and benefits consists primarily of costs related to employee compensation, payroll taxes, employee benefits, and employee development costs. Salaries and benefits are expensed as incurred except for costs that are required to be capitalized, which are amortized over the useful life of the asset created, such as internally developed software and software-as-a-service ("SaaS") implementation costs.
General and administrative expenses
General and administrative expenses primarily consists of expenses related to non-capitalized hardware and software, professional services, and occupancy costs.
Depreciation and amortization
Depreciation and amortization reflects the recognition of the cost of our investments in various assets over their useful lives. Depreciation expense relates to computer hardware, furniture and equipment, and leasehold improvements. Amortization relates to internally developed software, SaaS implementation costs, and finite-lived intangible assets associated with acquisitions.
Other Items
Loss related to warrant liabilities, net
In July 2024, we completed an exchange offer under which holders of our warrants were issued 3,876,201 shares of Class A Common Stock in exchange for 19,483,539 warrants, with a nominal cash settlement paid in lieu of fractional shares (the "Warrant Exchange"). No warrants remained outstanding following the completion of the Warrant Exchange.
Prior to the Warrant Exchange, our warrants were accounted for as liabilities and were measured at fair value each reporting period, with changes in fair value recognized within "Loss (gain) related to warrant liabilities, net" in our Consolidated Statements of Operations. In general, under the fair value accounting model, in periods when our stock price increased, the warrant liability increased, and we recognized additional expense. In periods when our stock price decreased, the warrant liability decreased, and we recognized additional income.
Interest expense and other, net
Interest expense and other, net primarily includes interest expense related to outstanding borrowings, primarily related to our current and prior revolving credit facilities with JPMorgan Chase Bank, N.A. ("JPM"), as well as the State Farm Term Loan (as defined in Note 18 — Debt in Item 8 of Part II of this Annual Report). Interest expense and other, net also includes changes in the estimated value of the TRA Liability between periods. Refer to Note 23 — Taxation in Item 8 of Part II of this Annual Report for additional information related to the TRA.
THG is taxed as a pass-through ownership structure under provisions of the IRC and a similar section of state income tax law. As such, any taxable income or loss generated by THG is passed through to and included in the taxable income or loss of THG unit holders, including Hagerty, Inc.
Hagerty, Inc. is taxed as a corporation and pays corporate federal, state, and local taxes with respect to income allocated from THG. Hagerty, Inc., Hagerty Insurance Holdings, Inc., Broad Arrow, Hagerty Radwood, Inc., and various foreign subsidiaries are treated as taxable entities and income taxes are provided where applicable. Hagerty Insurance Holdings, Inc. files a consolidated tax return with its wholly owned corporate subsidiaries Hagerty Re and Drivers Edge.
Key Operating Metrics
In MD&A, we discuss certain key operating metrics for the Insurance and Marketplace segments, as described below. We use these key operating metrics to evaluate our business, measure our performance, identify trends against planned initiatives, prepare financial projections, and make strategic decisions.
Insurance Segment
Total Written Premium is the total amount of insurance premium written by our MGA subsidiaries on behalf of our insurance carrier partners during the period. Total Written Premium reflects the direct economic benefit of our policy acquisition efforts and is closely correlated with the growth of insurance commission revenue generated by our MGA subsidiaries and earned premium generated by Hagerty Re.
Hagerty Re Loss Ratio represents the ratio of (i) Hagerty Re's losses and loss adjustment expenses to (ii) its earned premium. This metric allows us to evaluate our historical loss patterns and make necessary and appropriate adjustments.
Hagerty Re Combined Ratio represents the ratio of (i) Hagerty Re's losses, loss adjustment expenses, and underwriting expenses to (ii) its earned premium. Hagerty Re's underwriting expenses primarily include ceding commissions and, to a lesser extent, certain administrative expenses. This metric provides a benchmark to evaluate underwriting profitability. A combined ratio under 100% indicates underwriting income while a combined ratio exceeding 100% indicates an underwriting loss.
New Business Count represents the number of new insurance policies issued by our MGA subsidiaries during the period. New Business Count is an important metric to assess our financial performance because policy growth is critical to our success. While we benefit from strong policy retention through renewals, new policies more than offset those cancelled or non-renewed at expiration. New policies also often mean new relationships and an opportunity to sell additional products and services.
Policies in Force ("PIF") represents the number of current and active insurance policies as of the end of the period. PIF is an important metric to assess our financial performance because policy growth drives revenue growth, increases brand awareness and market penetration, generates additional insight to improve the performance of our platform, and provides key data to assist us in strategic decision making.
PIF Retention represents the percentage of expiring insurance policies that are renewed on the renewal effective date, calculated on a rolling twelve months basis. PIF Retention is an important measurement of the number of policies retained each year, which contributes to our recurring revenue streams including commissions earned by our MGA subsidiaries, HDC membership fees, and earned premium generated by Hagerty Re.
Vehicles in Force represents the number of current insured vehicles as of the end of the period. Vehicles in Force is an important metric to assess our financial performance because insured vehicle growth drives revenue growth and increases market penetration.
HDC Paid Member Count represents the number of current Members who pay an annual membership subscription as of the end of the period. HDC Paid Member Count primarily includes Members whose HDC membership is bundled with their insurance policy and paid as part of their policy premium. HDC Paid Member Count is an important metric because it helps us measure membership revenue growth and provides an opportunity to cross-sell other products and services to our Members.
Marketplace Segment
Aggregate Auction Sales represents the total purchase price paid by buyers, including our buyer's premium and fees, for vehicles and memorabilia purchased through Broad Arrow's live and online auctions, as well as through Hagerty Marketplace's online sale platform.
Net Auction Sales represents the total purchase price paid by buyers, excluding buyer's premium and fees, for vehicles and memorabilia purchased through Broad Arrow's live and online auctions, as well as through Hagerty Marketplace's online sale platform.
Private Sales is a volume metric representing the total purchase price paid by buyers for all vehicles and memorabilia purchased through Broad Arrow's private sales business, including brokered sales and sales of our inventory.
BAC Loan Portfolio Balance represents the period end loan portfolio balance of BAC recorded on our Consolidated Balance Sheets.
BAC Average Loan Portfolio represents the monthly average loan portfolio balance of BAC during the period.
Financial Highlights
The table below presents a summary of key financial measures from our Consolidated Statements of Operations, which are prepared in accordance with accounting principles generally accepted in the United States of America ("GAAP"), as well as our non-GAAP financial measures.
Year ended December 31,
2025
2024
Change
GAAP Financial Measures
dollars in thousands (except per share amounts)
Total Revenue (1)
$
1,456,389
$
1,241,510
$
214,879
17.3
%
Income before taxes
$
139,182
$
93,682
$
45,500
48.6
%
Net Income
$
149,225
$
78,303
$
70,922
90.6
%
Basic Earnings Per Share ("EPS")
$
0.41
$
0.10
$
0.31
N/M
Diluted EPS
$
0.37
$
0.10
$
0.27
N/M
Non-GAAP Financial Measures
Adjusted EBITDA
$
236,791
$
161,662
$
75,129
46.5
%
Adjusted Net Income
$
132,577
$
76,204
$
56,373
74.0
%
Adjusted Diluted EPS
$
0.37
$
0.21
$
0.16
76.2
%
N/M = Not meaningful
(1) Refer to Note 2 — Summary of Significant Accounting Policies in Item 8 of Part II of this Annual Report for a reconciliation of prior year revenue to current year presentation.
For the year ended December 31, 2025, we reported Net income of $149.2 million, representing a $70.9 million, or 90.6%, increase compared to the prior year, and Adjusted EBITDA of $236.8 million, representing a $75.1 million, or 46.5%, increase compared to the prior year.
In our Insurance segment, we experienced 14.3% growth in Written Premium, which drove a 14.9% increase in Commission and fee revenue and a 13.0% increase in Earned premium, net. The comparison to the prior year is also favorably impacted by a lower level of losses and loss adjustment expenses, driven by a decrease in catastrophe losses, as prior year results included $26.7 million of pre-tax losses related to hurricane activity, as well as a $20.5 million reserve reduction primarily related to favorable development for the 2024 accident year and improvement in current accident year experience.
In our Marketplace segment, current year results reflect significantly higher levels of Broad Arrow inventory sales and private sale commissions, as well as results from Broad Arrow's inaugural European auctions at Concorso d’Eleganza Villa d’Este Auction on the shores of Lake Como in Italy, the Zoute Concours Auction held in Knokke-Heist, Belgium, the Zürich Auction held in Zürich, Switzerland, and an auction held at the Concours at Wynn Las Vegas.
Adjusted EBITDA, Adjusted Net Income, and Adjusted Diluted EPS are non-GAAP financial measures. Please see the section titled "Non-GAAP Financial Measures" below for a description of these non-GAAP financial measures and a reconciliation to the most comparable GAAP measure.
The following table summarizes Insurance segment results of operations for the years ended December 31, 2025 and 2024, and the dollar and percentage change between the two periods:
Year ended December 31,
2025
2024
$ Change
% Change
Segment Results:
dollars in thousands
REVENUES:
Commission and fee revenue
$
486,376
$
423,240
$
63,136
14.9
%
Earned premium, net
726,726
643,324
83,402
13.0
%
Membership and other revenue
82,376
78,925
3,451
4.4
%
Net investment income
37,739
38,357
(618)
(1.6)
%
Net investment gains
3,064
2,223
841
37.8
%
Total revenue
1,336,281
1,186,069
150,212
12.7
%
EXPENSES:
Losses and loss adjustment expenses
285,394
298,593
(13,199)
(4.4)
%
Ceding commissions, net
337,087
301,719
35,368
11.7
%
Sales expense
165,894
151,295
14,599
9.6
%
Other expenses (1)
356,749
311,914
44,835
14.4
%
Total expenses
1,145,124
1,063,521
81,603
7.7
%
INCOME BEFORE TAXES
$
191,157
$
122,548
$
68,609
56.0
%
Operational Metrics:
Total Written Premium
$
1,193,548
$
1,044,492
$
149,056
14.3
%
Hagerty Re Loss Ratio
39.3
%
46.4
%
(7.1)
%
N/M
Hagerty Re Combined Ratio
86.6
%
94.1
%
(7.5)
%
N/M
New Business Count — Insurance
371,203
278,556
92,647
33.3
%
As of December 31, 2025
2025
2024
Change
Operational Metrics:
Policies in Force
1,684,935
1,506,451
178,484
11.8
%
Policies in Force Retention
88.7
%
89.0
%
(0.3)
%
N/M
Vehicles in Force
2,819,179
2,576,700
242,479
9.4
%
HDC Paid Member Count
929,895
875,822
54,073
6.2
%
N/M = Not meaningful
(1) Other expenses primarily includes Salaries and benefits, General and administrative expenses, Depreciation and amortization, and Interest expense related to the State Farm Term Loan (as defined in Note 18 — Debt in Item 8 of Part II of this Annual Report).
Commission and fee revenue
Commission and fee revenue was $486.4 million for the year ended December 31, 2025, an increase of $63.1 million, or 14.9%, compared to 2024. This increase was driven by policy renewals, which contributed $51.1 million to the year-over-year improvement, as well as an increase in new business count, which resulted in a $12.0 million increase in revenue.
The increase in revenue from policy renewals was primarily driven by a 14.7% increase in written premium from renewal policies, as well as continued strong policy retention. The increase in renewal policy premiums is the result of rate increases in several states due to inflation and higher vehicle repair costs, both of which contribute to higher premiums and, in turn, higher commission revenue.
The increase in revenue from new policies was primarily driven by a 33.3% increase in new policies written when compared to the prior year period, including business generated by the State Farm Master Alliance Agreement. Refer to Note 24 — Related-Party Transactions in Item 8 of Part II of this Annual Report for additional information with respect to the State Farm Master Alliance Agreement.
During the year ended December 31, 2025, Commission and fee revenue from agent sources increased $35.9 million, or 15.4%, and Commission and fee revenue from direct sources increased $27.2 million, or 14.3%, compared to 2024. Commission rates vary based on geography, but do not differ by distribution channel (i.e., whether they are direct-sourced or agent-sourced).
Earned premium, net
Earned premium, net was $726.7 million for the year ended December 31, 2025, an increase of $83.4 million, or 13.0%, compared to 2024. This increase was primarily due to continued growth of subject premiums written through our MGA subsidiaries, which increased $118.9 million, or 12.8%, compared to 2024.
The following tables present premiums assumed and earned, as well as the related quota share percentages for the years ended December 31, 2025 and 2024:
Year ended December 31, 2025
U.S.
Canada
U.K. (1)
Total
in thousands (except percentages)
Subject premium (2)
$
985,898
$
65,902
$
(37)
$
1,051,763
Quota share percentage
81.0
%
50.0
%
80.0
%
79.0
%
Assumed premium
797,723
32,951
(29)
830,645
Reinsurance premiums ceded
(53,308)
Net assumed premium
777,337
Change in unearned premiums
(54,021)
Change in deferred reinsurance premiums
3,410
Earned premium, net
$
726,726
(1) In 2025 and 2024, we did not reinsure classic auto risks produced by our U.K. MGA subsidiary, and the prior book of business is in run-off.
(2) Represents the portion of total written premium written by our MGA subsidiaries that is subject to reinsurance agreements with our insurance carrier partners.
Year ended December 31, 2024
U.S.
Canada
U.K. (1)
Total
in thousands (except percentages)
Subject premium (2)
$
873,364
$
59,664
$
(202)
$
932,826
Quota share percentage
81.0
%
35.0
%
80.0
%
77.9
%
Assumed premium
706,250
20,883
(162)
726,971
Reinsurance premiums ceded
(50,541)
Net assumed premium
676,430
Change in unearned premiums
(41,207)
Change in deferred reinsurance premiums
8,101
Earned premium, net
$
643,324
(1) In 2025 and 2024, we did not reinsure classic auto risks produced by our U.K. MGA subsidiary, and the prior book of business is in run-off.
(2) Represents the portion of total written premium written by our MGA subsidiaries that is subject to reinsurance agreements with our insurance carrier partners.
Membership and other revenue
Membership and other revenue was $82.4 million for the year ended December 31, 2025, an increase of $3.5 million, or 4.4%, compared to 2024.
Membership fee revenue was $63.0 million for the year ended December 31, 2025, an increase of $5.5 million, or 9.6%, compared to 2024, which was primarily due to a $5.1 million, or 9.6%, increase in revenue attributable to new insurance policies issued with a bundled HDC membership.
Other revenue, which primarily includes sponsorship, admission, advertising, valuation, and sublease revenue, was $19.4 million for the year ended December 31, 2025, a decrease of $2.1 million, or 9.7%, compared to 2024. This decrease was primarily attributable to the loss of registration fee revenue attributable to Motorsport Reg ("MSR"), which was sold in June 2024. Refer to Note 12 — Divestitures in Item 8 of Part II of this Annual Report for additional information related to the sale of MSR.
Net investment income and Net investment gains
The following table presents the components of Net investment income and Net investment gains for the years ended December 31, 2025 and 2024:
Year ended December 31,
2025
2024
$ Change
% Change
in thousands (except percentages)
Interest income
$
38,083
$
38,583
$
(500)
(1.3)%
Dividend income
218
98
120
122.4%
Investment management fees and expenses
(562)
(324)
(238)
73.5%
Net investment income
37,739
38,357
(618)
(1.6)%
Net investment gains
3,064
2,223
841
37.8%
Total
$
40,803
$
40,580
$
223
0.5%
Losses and loss adjustment expenses
Losses and loss adjustment expenses were $285.4 million for the year ended December 31, 2025, a decrease of $13.2 million, or 4.4%, compared to 2024. For the year ended December 31, 2025, our loss ratio was 39.3%, a decrease of 7.1% from 2024, when our loss ratio was 46.4%. These decreases were primarily driven by a decrease in catastrophe losses, as prior year results included $26.7 million of pre-tax losses related to hurricane activity. The comparison to the prior year is also favorably influenced by a $20.5 million reduction to reserves recorded in 2025 primarily due to favorable development for the 2024 accident year related to decreased severity and loss ratio trends in auto liability and physical damage claims. To a lesser extent, there was also an improvement in current accident year experience driven by favorable loss trends, mainly in auto liability. These factors were partially offset by an increase in Losses and loss adjustment expenses due to the 13.0% increase in Earned premium, net discussed above.
Ceding commissions, net
Ceding commissions, net was $337.1 million for the year ended December 31, 2025, an increase of $35.4 million, or 11.7%, compared to 2024. This increase is primarily attributable to the 13.0% increase in Earned premium, net discussed above.
The following table summarizes the components of Ceding commissions, net for the years ended December 31, 2025 and 2024:
Year ended December 31,
2025
2024
Ceding commission:
in thousands (except percentages)
Ceding commission – reinsurance assumed
$
357,686
$
317,648
Ceding commission – reinsurance ceded
(20,599)
(15,929)
Ceding commissions, net
$
337,087
$
301,719
Percentage of earned premium
46.4
%
46.9
%
Sales expense
Sales expense was $165.9 million for the year ended December 31, 2025, an increase of $14.6 million, or 9.6%, compared to 2024. This increase was primarily driven by broker expense, which increased $7.9 million, or 11.7%, consistent with the written premium growth in the agent insurance distribution channel. To a lesser extent, payment processing fees and postage costs increased by $2.1 million and $1.5 million, respectively, driven by policy count growth, as well as a shift in customer preference towards credit cards as a payment method within our MGA subsidiaries.
Salaries and benefits were $245.9 million for the year ended December 31, 2025, an increase of $37.0 million, or 17.7%, compared to 2024. This increase was primarily driven by higher accrued incentive compensation, reflecting stronger performance compared to the prior year, when losses related to hurricane activity significantly reduced achievement of the financial goals underlying accrued incentive compensation. To a lesser extent, Salaries and benefits increased as a result of increased headcount and merit increases year-over-year.
General and administrative expenses were $85.6 million for the year ended December 31, 2025, an increase of $9.3 million, or 12.2%, compared to 2024. This increase was primarily due to a $5.8 million increase in software-related costs, largely driven by costs related to our new insurance policy management system, and to a lesser extent, a $1.1 million increase in professional fees. The increase in professional fees was primarily driven by costs related to the Markel Fronting Arrangement.
Marketplace Segment
The following table summarizes Marketplace segment results of operations for the years ended December 31, 2025 and 2024, and the dollar and percentage change between the two periods:
Year ended December 31,
2025
2024
$ Change
% Change
Segment Results:
in thousands (except percentages)
REVENUES:
Marketplace revenue
$
120,108
$
55,441
$
64,667
116.6
%
EXPENSES:
Sales expense
92,307
39,226
53,081
135.3
%
Other expenses (1)
38,930
30,622
8,308
27.1
%
Total expenses
131,237
69,848
61,389
87.9
%
Loss before taxes
$
(11,129)
$
(14,407)
$
3,278
22.8
%
Operational Metrics:
Aggregate Auction Sales
$
278,694
$
178,199
$
100,495
56.4
%
Net Auction Sales
$
252,363
$
163,312
$
89,051
54.5
%
Private Sales
$
286,763
$
77,281
$
209,482
271.1
%
BAC Average Loan Portfolio
$
85,468
$
65,045
$
20,423
31.4
%
As of December 31, 2025
2025
2024
Change
Operational Metrics:
BAC Loan Portfolio Balance
$
103,338
$
56,972
$
46,366
81.4
%
(1) Other expenses primarily includes Salaries and benefits, General and administrative expenses, and Depreciation and amortization.
Marketplace revenue was $120.1 million for the year ended December 31, 2025, an increase of $64.7 million, or 116.6%, compared to 2024. This increase was principally due to a significantly higher private sale revenue, including commissions earned from brokered private sale transactions, proceeds from the sale of inventory, and the expansion of our live auction offerings in Europe, which led to three inaugural auctions for Broad Arrow in 2025: the Concorso d’Eleganza Villa d’Este Auction on the shores of Lake Como in Italy, the Zoute Auction held in Knokke-Heist, Belgium, and the Zürich Auction held in Zürich, Switzerland. In addition to Broad Arrow's European expansion, Broad Arrow became the official auction of Concours at Wynn Las Vegas, which resulted in a new auction in 2025.
Sales expense was $92.3 million for the year ended December 31, 2025, an increase of $53.1 million, or 135.3%, compared to 2024. This increase was primarily due to a $46.9 million increase in cost of sales, predominantly as a result of a higher level of inventory sales, as well as a $7.8 million increase in sales commissions, consistent with revenue growth within the Marketplace segment.
Other expenses totaled $38.9 million for the year ended December 31, 2025, an increase of $8.3 million, or 27.1%, compared to 2024. The higher level of expense in 2025 was primarily driven by a $5.4 million increase in Salaries and benefits and a $2.2 million increase in General and administrative expenses. These increases were primarily the result of Broad Arrow's global expansion, as well as higher accrued incentive compensation, reflecting stronger performance compared to the prior year.
In addition to segment operating results, the following items contributed to our overall financial position and results of operations:
Year ended December 31,
2025
2024
$ Change
% Change
in thousands (except percentages)
Loss related to warrant liabilities, net
$
—
$
8,544
$
(8,544)
(100.0)
%
Interest expense
$
5,440
$
1,396
$
4,044
N/M
Change in TRA Liability
$
32,235
$
1,602
$
30,633
N/M
Income tax (benefit) expense
$
(10,043)
$
15,379
$
(25,422)
(165.3)
%
N/M = Not meaningful
Loss related to warrant liabilities, net
During the year ended December 31, 2024, Loss related to warrant liabilities, net was $8.5 million, consisting of a $2.0 million loss related to the Warrant Exchange and a $6.5 million loss related to the change in fair value of our then outstanding warrant liabilities. There were no warrants outstanding during the year ended December 31, 2025 due to the Warrant Exchange. Refer to Note 6 — Fair Value Measurements in Item 8 of Part II of this Annual Report for additional information with respect to our warrants.
Interest expense
During the year ended December 31, 2025, Interest expense increased $4.0 million compared to 2024. This increase was driven by higher net borrowings under the 2025 JPM Credit Facility, as well as a $2.3 million non-recurring gain on the sale of an interest rate swap in the second quarter of 2024.
Change in TRA Liability
During the year ended December 31, 2025, we recorded $32.2 million of expense due to a change in the value of the TRA Liability, compared to $1.6 million recorded in 2024. During the third quarter of 2025, we determined it was appropriate to establish the TRA Liability related to current and prior year exchanges of THG units for shares of Class A Common Stock. The establishment of the TRA Liability is based on management's estimate of sufficient future taxable income to utilize the full amount of any tax benefits subject to the TRA over the period specified therein. The expense related to the remeasurement of the TRA Liability is recorded within "Interest expense and other, net" in the Consolidated Statements of Operations. Refer to Note 23 — Taxation in Item 8 of Part II of this Annual Report for additional information.
Income tax benefit (expense)
We are the sole managing member of THG, and as a result, consolidate its financial results. THG is treated as a partnership for U.S. federal and most applicable state and local income tax purposes. As a partnership, THG is not subject to U.S. federal and certain state and local income taxes. Any taxable income or loss generated by THG is passed through and included in the taxable income or loss of its members, including Hagerty, Inc., on a pro rata basis. Hagerty, Inc. is subject to U.S. federal, state and local income taxes with respect to its allocable share of any taxable income or loss of THG, as well as any of its stand-alone income or loss. In addition, Hagerty Insurance Holdings, Inc., Broad Arrow, Hagerty Radwood, Inc., and various foreign subsidiaries are treated as taxable entities. Hagerty Insurance Holdings, Inc. files a consolidated tax return with its wholly owned corporate subsidiaries Hagerty Re and Drivers Edge.
We have historically maintained a full valuation allowance on our deferred tax assets related to the difference between the outside tax basis and book basis of Hagerty, Inc.'s investment in the assets of THG. The realization of deferred tax assets is dependent upon the generation of future taxable income sufficient to utilize these deferred tax assets. As of each reporting date, we consider new evidence, both positive and negative, that could affect our view of the future realization of our deferred tax assets. As of December 31, 2024, we concluded that it was more likely than not that certain deferred tax assets, including the deferred tax asset for Hagerty, Inc.'s investment in the assets of THG, would not be realized because we were in a three-year cumulative loss position and the generation of sufficient future taxable income to utilize these deferred tax assets was uncertain.
As of each reporting period, we consider new evidence, both positive and negative, that could affect our view of the future realization of our deferred tax assets. In the third quarter of 2025, our continued assessment of the realizability of our deferred tax assets concluded that sufficient sources of future taxable income will be generated to realize a portion of the deferred tax assets related to the outside basis in Hagerty, Inc.'s investment in THG and other tax attributes of the Hagerty, Inc. filing entity. In assessing the realizability of these deferred tax assets, we considered all sources of positive and negative evidence, including (i) that we achieved cumulative three-year profitability during the quarter; (ii) that our forecasts indicated continued profitability; and (iii) other positive business factors. Based on this evaluation, we determined it was appropriate to release a portion of the valuation allowance previously recorded against our federal and state deferred tax assets. As a result, $41.8 million of this valuation allowance was released in 2025 with a corresponding income tax benefit recognized in the Consolidated Statements of Operations.
For the year ended December 31, 2025, income tax benefit was $10.0 million, representing a change of $25.4 million compared to 2024. This year-over-year change was primarily a result of a net decrease in the valuation allowance against our deferred tax assets, including the release of the valuation allowance discussed above. Refer to Note 23 — Taxation in Item 8 of Part II of this Annual Report for additional information with respect to items affecting our effective tax rate.
Non-GAAP Financial Measures
Adjusted EBITDA
We define EBITDA as consolidated Net income, excluding Interest expense and other, net, Income tax expense (benefit), and Depreciation and amortization. We define Adjusted EBITDA as EBITDA, further adjusted to (i) exclude net investment gains and losses; (ii) deduct interest expense related to the State Farm Term Loan; (iii) exclude net gains and losses related to our warrant liabilities prior to the Warrant Exchange; (iv) exclude share-based compensation expense; and when applicable, exclude (v) restructuring, impairment and related charges; (vi) gains, losses and impairments related to divestitures; and (vii) certain other unusual items. Refer to Note 6 — Fair Value Measurements in Item 8 of Part II of this Annual Report for additional information regarding the Warrant Exchange.
How This Measures is Useful
When used in conjunction with GAAP financial measures, Adjusted EBITDA is a supplemental measure of operating performance that we believe is a useful measure to evaluate our performance period over period and relative to our competitors and peers. Management uses Adjusted EBITDA to evaluate our operating performance on a consistent basis, as it removes the impact of items not directly resulting from our core operations. We believe the presentation of Adjusted EBITDA provides securities analysts, investors, and other interested parties with a supplemental view of our operating performance that enhances their understanding of our business and our results operations, as well as assisting investors in evaluating how well we are executing our strategic initiatives.
Limitations of the Usefulness of This Measure
Adjusted EBITDA may differ from similarly titled measures used by other companies due to different methods of calculation, which could reduce the usefulness of this non-GAAP financial measure when comparing our performance to that of other companies. Presentation of Adjusted EBITDA is not intended to be considered in isolation or a substitute for, or superior to, the financial information prepared in accordance with GAAP. A reconciliation of Adjusted EBITDA to Net income, the most directly comparable GAAP measure, is presented below.
Interest expense related to State Farm Term Loan (4)
(2,060)
(2,060)
Loss related to warrant liabilities, net
—
8,544
Share-based compensation expense
18,908
17,357
Gain related to divestiture
—
(87)
Other unusual items (5)
5,405
1,880
Adjusted EBITDA
$
236,791
$
161,662
(1) Excludes interest expense related to the BAC Credit Facility, which is recorded within "Sales expense" in the Consolidated Statements of Operations.
(2) Principally includes interest expense and changes in the value of the TRA liability, which totaled $32.2 million and $1.6 million during the years ended December 31, 2025 and 2024, respectively. Refer to Note 23 — Taxation in Item 8 of Part II of this Annual Report for additional information.
(3) Income tax (benefit) expense for the year ended December 31, 2025 includes a $41.8 million benefit related to the release of a portion of the valuation allowance against our deferred tax assets. Refer to Note 23 — Taxation in Item 8 of Part II of this Annual Report for additional information.
(4) Interest expense related to the State Farm Term Loan is charged against Adjusted EBITDA as it is directly attributable to the operations of Hagerty Re. Refer to Note 18 — Debt and Note 24 — Related-Party Transactions in Item 8 of Part II of this Annual Report for additional information.
(5) For the year ended December 31, 2025, other unusual items includes certain legal settlement expenses, professional fees associated with the THG Unit Exchange and related Secondary Offering, and certain material severance expenses. For the year ended December 31, 2024, other unusual items includes professional fees associated with the Warrant Exchange, as well as certain material severance expenses. Refer to Note 20 — Stockholders' Equity in Item 8 of Part II of this Annual Report for additional information with respect to the THG Unit Exchange and Note 6 — Fair Value Measurements in Item 8 of Part II of this Annual Report for additional information with respect to our warrants.
As a result of our transition to the Article 7 reporting standards, Net investment income is reported as a component of revenue and is no longer an adjustment in our reconciliation from Net income to Adjusted EBITDA. In addition, interest expense related to the State Farm Term Loan is now deducted from Adjusted EBITDA as it is directly attributable to Hagerty Re, which generates a significant portion of our net investment income. The following table presents a reconciliation of Adjusted EBITDA as presented in prior periods in accordance with Article 5, to the current presentation in accordance with Article 7:
Year ended December 31, 2024
in thousands
Prior presentation of Adjusted EBITDA
$
124,473
Net investment income
39,249
Interest expense related to State Farm Term Loan
(2,060)
Current presentation of Adjusted EBITDA
$
161,662
Adjusted Net Income and Adjusted Diluted EPS
Beginning with this Annual Report, Adjusted Net Income is presented as a non-GAAP financial measure, as we consider it to be an important supplemental measure of our performance and believe it is frequently used by securities analysts, investors, and other interested parties in the evaluation of companies in our industry. In addition, we revised and renamed our non-GAAP measure previously titled "Adjusted EPS" to "Adjusted Diluted EPS". The revised measure uses Adjusted Net Income as the numerator in the calculation and updated the most comparable GAAP measure from Basic EPS to Diluted EPS. We believe that the revised calculation better reflects the potential dilution from these securities and enhances comparability with industry peers.
Adjusted Net Income represents Net income attributable to Class A Common Stockholders, assuming the full exchange of all outstanding THG units and Series A Convertible Preferred Stock for shares of Class A Common Stock, adjusted to exclude (i) net investment gains and losses; (ii) changes in the fair value of warrant liabilities prior to the Warrant Exchange; (iii) changes in the TRA Liability; (iv) gains and losses related to divestitures; and (v) certain other unusual items, each of which we do not believe are directly related to our core operations and may not be indicative of our ongoing performance. Adjusted Diluted EPS is calculated by dividing Adjusted Net Income by the weighted average shares of Class A Common Stock outstanding, assuming the full exchange of all outstanding THG units, Series A Convertible Preferred Stock, and unvested share-based compensation awards. Refer to Note 6 — Fair Value Measurements in Item 8 of Part II of this Annual Report for additional information regarding the Warrant Exchange.
How These Measures Are Useful
When used in conjunction with GAAP financial measures, Adjusted Net Income and Adjusted Diluted EPS are supplemental measures of operating performance that we believe are useful measures to evaluate our performance period over period and relative to our competitors and peers. Management uses Adjusted Net Income and Adjusted Diluted EPS to evaluate our operating performance on a consistent basis to make strategic and operational decisions. We believe these measures provide management and investors with useful information regarding trends in our business that may not otherwise be apparent when relying solely on GAAP measures. By assuming the full exchange of all outstanding THG units and Series A Convertible Preferred Stock, we believe these measures facilitate comparisons with other companies that have different organizational and tax structures, as well as comparisons period over period because it eliminates the effect of any changes in Net income attributable to Class A Common Stockholders driven by increases in Hagerty, Inc.'s ownership in THG, which is unrelated to our operating performance, and excludes items that are unusual or may not be indicative of our ongoing performance.
Limitations of the Usefulness of These Measures
Adjusted Net Income and Adjusted Diluted EPS may differ from similarly titled measures used by other companies due to different methods of calculation. Presentation of Adjusted Net Income and Adjusted Diluted EPS should not be considered alternatives to Net income attributable to Class A Common Stockholders and Diluted EPS, as determined under GAAP. While these measures are useful in evaluating our performance, they assume the full exchange of all outstanding THG units and Series A Convertible Preferred Stock for shares of Class A Common Stock, which has not occurred and may not occur. Further, the adjustments made to arrive at Adjusted Net Income exclude certain expenses and income that may recur in the future. Adjusted Net Income and Adjusted Diluted EPS should be evaluated in conjunction with our GAAP financial results. A reconciliation of Adjusted Net Income to Net income attributable to Class A Common Stockholders, the most directly comparable GAAP measure, and the computation of Adjusted Diluted EPS are presented below.
Net income attributable to Class A Common Stockholders
$
41,463
$
9,590
Adjustments:
Accretion of Series A Convertible Preferred Stock
7,555
7,427
Net income attributable to non-controlling interest
100,207
61,286
Net investment gains
(3,064)
(2,223)
Loss related to warrant liabilities, net
—
8,544
Change in TRA Liability
32,235
1,602
Gain related to divestiture
—
(87)
Other unusual items (1)
5,405
1,880
Tax impact of above adjustments (2)
(51,224)
(11,815)
Adjusted Net Income
$
132,577
$
76,204
Denominator:
Weighted average shares of Class A Common Stock outstanding — Diluted
346,973
88,504
Adjustments:
Assumed exchange of non-controlling interest THG units for shares of Class A Common Stock
—
255,328
Assumed conversion of shares of Series A Convertible Preferred Stock into shares of Class A Common Stock
6,785
6,785
Assumed vesting of share-based compensation awards
7,062
7,162
Adjusted weighted average shares of Class A Common Stock outstanding — Diluted
360,820
357,779
Adjusted Diluted EPS
$
0.37
$
0.21
Year ended December 31,
2025
2024
Diluted earnings per share
$
0.37
$
0.10
Impact of assumed exchange, conversion, or vesting of remaining potentially dilutive securities (3)
0.05
0.12
Non-GAAP adjustments (4)
(0.05)
(0.01)
Adjusted Diluted EPS
$
0.37
$
0.21
(1) For the year ended December 31, 2025, other unusual items includes certain legal settlement expenses, professional fees associated with the THG Unit Exchange and related Secondary Offering, and certain material severance expenses. For the year ended December 31, 2024, other unusual items includes professional fees associated with the Warrant Exchange, as well as certain material severance expenses. Refer to Note 20 — Stockholders' Equity in Item 8 of Part II of this Annual Report for additional information with respect to the THG Unit Exchange and Note 6 — Fair Value Measurements in Item 8 of Part II of this Annual Report for additional information with respect to our warrants.
(2) Represents the tax effect of the aforementioned adjustments to reflect corporate income taxes at an estimated effective tax rate of 23.7% and 26.3% for the years ended December 31, 2025 and 2024, respectively, which considers the U.S. federal statutory rate of 21%, a combined state income tax rate of approximately 5% (net of federal benefits), and certain material permanent items.
(3)Assumes the exchange of all outstanding THG units, Series A Convertible Preferred Stock, and unvested share-based compensation awards for shares of Class A Common Stock, resulting in the elimination of the non-controlling interest and recognition of the Net income attributable to non-controlling interest, as well as elimination of the accretion of Series A Convertible Preferred Stock. Refer to Note 22 — Earnings Per Share in Item 8 of Part II of this Annual Report for additional information on Diluted EPS.
(4)Represents the per share impact of non-GAAP adjustments for each period. Refer to the reconciliation above for additional information.
Liquidity and Capital Resources
Maintaining a strong balance sheet and capital position is a top priority for us. As a holding company without direct operations, we manage liquidity globally and across all operating subsidiaries.
Our sources of liquidity include our: (i) balances of cash and cash equivalents; (ii) net working capital; (iii) cash flows from operations, including net investment income; (iv) borrowings from the 2025 JPM Credit Facility (as defined below) to fund the general corporate needs of THG and its subsidiaries; and (v) borrowings from the BAC Credit Facility (as defined below) to fund a portion of the lending activities of BAC.
Our primary liquidity needs and capital requirements include cash required for: (i) funding the business operations of THG and its subsidiaries; (ii) funding strategic investments and acquisitions; (iii) servicing and repayment of borrowings under the 2025 JPM Credit Facility, the BAC Credit Facility, and the unsecured term loan credit facility with State Farm (the "State Farm Term Loan"); (iv) funding potential cash dividend payments on the Series A Convertible Preferred Stock; (v) payment of income taxes; (vi) funding required distributions to the non-controlling interest unit holders of THG; and (vii) funding required payments to Legacy Unit Holders under the TRA.
As of December 31, 2025, we believe that our sources of liquidity will be sufficient to provide an adequate level of capital to support our anticipated short and long-term commitments, operating needs, and capital requirements.
Financing Arrangements
2025 JPM Credit Facility
In March 2025, THG entered into a credit agreement with JPM, as administrative agent, issuing bank and swingline lender, the foreign subsidiary borrowers thereto, and the other financial institutions party thereto as lenders (the "2025 JPM Credit Agreement").
The 2025 JPM Credit Agreement provides for a senior unsecured revolving credit facility (the "2025 JPM Credit Facility") with an aggregate borrowing capacity of $375.0 million. The 2025 JPM Credit Agreement matures in March 2030, but may be extended if agreed to by THG and the lenders party thereto. Any unpaid balance on the 2025 JPM Credit Facility is due at maturity. As of December 31, 2025, total outstanding borrowings under the 2025 JPM Credit Facility were $84.9 million.
The 2025 JPM Credit Agreement requires us to, among other things, meet certain financial covenants, including a minimum fixed charge coverage ratio test and a maximum leverage ratio test. As of December 31, 2025, we were in compliance with these financial covenants.
BAC Credit Facility
BAC and its wholly owned subsidiary BAC Funding 2023-1, LLC, as borrower, have a revolving credit agreement (the "BAC Credit Agreement") that provides for a revolving credit facility (the "BAC Credit Facility"). On November 4, 2025, BAC and BAC Funding 2023-1, LLC, as borrower, amended the BAC Credit Agreement to, among other things, increase the aggregate commitment under the BAC Credit Facility from $75.0 million to $150.0 million. The BAC Credit Facility's borrowing base is determined by the carrying value of certain BAC notes receivable, which is then limited by the amount of the aggregate commitment. As of December 31, 2025, the applicable borrowing base for the BAC Credit Agreement was $68.4 million.
The revolving borrowing period of the BAC Credit Facility expires in November 2027, followed by an amortization period until it ultimately matures in November 2028. The borrowing period and the maturity date of the BAC Credit Facility may be extended by one year if requested by BAC and agreed by the administrative agent. BAC is not a borrower or guarantor of the BAC Credit Facility.
BAC and certain of its subsidiaries may transfer notes receivable to wholly owned, bankruptcy remote special purpose entities (each, an "SPE") to secure borrowings, isolating these assets from our other obligations. Recourse is limited to (i) an obligation of the applicable seller to repurchase a note receivable if it is determined that there was a breach of any representation or warranty relating to such note receivable as of the relevant date specified in the related transfer agreement; and (ii) a limited guarantee for certain liabilities that may result under certain foreign exchange hedging activity of one of the SPEs.
BAC and BAC Funding 2023-1, LLC are required, among other things, to meet certain financial covenants including that BAC, as the servicer, maintain a minimum tangible net worth, minimum liquidity balances, and an indebtedness to tangible net worth ratio. As of December 31, 2025, we were in compliance with the financial covenants under the BAC Credit Agreement.
Refer to Note 18 — Debt in Item 8 of Part II of this Annual Report for additional information related to the 2025 JPM Credit Agreement and BAC Credit Agreement.
We are a holding company with no material assets other than our ownership interest in THG and its operating subsidiaries. Accordingly, our ability to meet our cash requirements depends on THG's financial performance and the distributions we receive from THG. Our subsidiaries' ability to make distributions, pay dividends and make other payments may be regulated by the states and territories where they are domiciled. For example, as described below, our ability to upstream capital from Hagerty Re is subject to Bermuda regulatory capital requirements and dividend restrictions administered by the BMA, which may limit distributions in certain periods.
For a discussion of the risks associated with our holding company structure, refer to Item 1A. Risk Factors — Risks Related to Tax — "Hagerty, Inc. is a holding company, whose only material asset is its interest in THG. Hagerty, Inc. depends on THG distributions to pay taxes, make payments under the TRA, and pay other expenses." in this Annual Report.
Capital Restrictions
Our reinsurance subsidiary, Hagerty Re, is subject to the Bermuda Solvency Capital Requirement ("BSCR"), which establishes a target capital level and enhanced capital requirements for each insurer. As of December 31, 2025, Hagerty Re maintained sufficient statutory capital and surplus to comply with the BSCR.
Similarly, our U.S. insurance company subsidiary, Drivers Edge, which holds certificates of authority in 41 states, is subject to state-specific minimum capital and surplus requirements, as well as risk-based capital ("RBC") requirements. RBC levels are reported on an annual basis. As of December 31, 2025, Drivers Edge maintained sufficient capital and surplus levels to comply with National Association of Insurance Commissioners ("NAIC") and state insurance regulations.
Dividend Restrictions
Under Bermuda law, Hagerty Re is prohibited from declaring or issuing a dividend if it fails to meet its minimum solvency margin or minimum liquidity ratio. Prior approval from the BMA is also required if Hagerty Re's proposed dividend payments would exceed 25% of its prior year-end total statutory capital and surplus. Based on these restrictions, during 2026, Hagerty Re can pay $95.4 million in dividends without prior BMA approval; however, the amount that Hagerty Re can pay in dividends is further limited by the amount of unrestricted cash and liquid investments held outside of restricted accounts, which totaled $65.6 million as of December 31, 2025. As of December 31, 2025, there were no plans to issue dividends from Hagerty Re.
Similarly, state statutes restrict the amount of dividends that Drivers Edge may pay without prior approval of state insurance regulators. As of December 31, 2025, there were no plans to issue dividends from Drivers Edge and a change in such plans may require regulatory approval.
Comparative Cash Flows
The following table summarizes our cash flow data for the years ended December 31, 2025 and 2024:
Year ended December 31,
2025
2024
$ Change
% Change
in thousands (except percentages)
Net Cash Provided by Operating Activities
$
218,986
$
177,024
$
41,962
23.7
%
Net Cash Used in Investing Activities
$
(185,197)
$
(618,564)
$
433,367
70.1
%
Net Cash Provided by (Used in) Financing Activities
Cash provided by operating activities primarily consists of Net income, adjusted for non-cash items, and changes in working capital balances. Net cash provided by operating activities for the years ended December 31, 2025 and 2024 is presented below:
Year ended December 31,
2025
2024
$ Change
% Change
in thousands (except percentages)
Net income
$
149,225
$
78,303
$
70,922
90.6
%
Non-cash adjustments to Net income
59,074
75,979
(16,905)
(22.2)
%
Changes in operating assets and liabilities
10,687
22,742
(12,055)
(53.0)
%
Net Cash Provided by Operating Activities
$
218,986
$
177,024
$
41,962
23.7
%
Net cash provided by operating activities for the year ended December 31, 2025 was $219.0 million, an increase of $42.0 million, or 23.7%, compared to 2024. This increase was due to a $54.0 million increase in Net income, net of non-cash adjustments, partially offset by a $12.1 million decrease in cash from operating assets and liabilities.
The $12.1 million decrease in net cash from operating assets and liabilities was primarily driven by the timing of the settlement of CUC receivables and payables, which resulted in a $29.0 million net decrease in operating cash flows, as well as claim payments made by Hagerty Re related to catastrophe events occurring in the second half of 2024 and first quarter of 2025, including Hurricane Helene, Hurricane Milton, and the Southern California wildfires. These factors were partially offset by written premium growth, which led to higher balances of Unearned premiums, Advanced premiums, and Due to insurers.
Investing Activities
Cash used in investing activities for the year ended December 31, 2025 decreased by $433.4 million when compared to 2024. This decrease was almost entirely due to the diversification of our investment portfolio during 2024, which resulted in the purchase of investment-grade fixed maturity securities and, to a much lesser extent, equity securities. This factor was partially offset by a $31.0 million increase in net fundings of BAC notes receivable in 2025.
Financing Activities
Cash from financing activities for the year ended December 31, 2025 increased $76.9 million when compared to 2024 primarily due to a $98.1 million increase in net proceeds received from credit facility borrowings. These financing proceeds were partially offset by a $23.6 million increase in required tax distributions to THG non-controlling interest unit holders.
Tax Receivable Agreement
In connection with the consummation of the business combination that formed Hagerty, Inc. in 2021, Hagerty, Inc.
entered into a TRA with the Legacy Unit Holders. The TRA requires us to pay the Legacy Unit Holders 85% of the U.S. federal, state, and local cash tax savings realized by Hagerty, Inc. resulting from increases in tax basis and certain other tax benefits, as outlined in the Business Combination Agreement, upon the exchange of THG units and shares of Hagerty, Inc. Class V Common Stock for shares of Hagerty, Inc. Class A Common Stock or cash.
The amount and timing of any payments under the TRA will vary depending on a number of factors, including, but not limited to, the increase in tax basis of THG's assets, the timing of any future redemptions, exchanges or purchases of THG units held by Legacy Unit Holders, the price of Hagerty, Inc. Class A Common Stock at the time of the redemption, exchange or purchase, the extent to which redemptions or exchanges are taxable, the amount and timing of the taxable income that Hagerty, Inc. generates in the future, the tax rates then applicable, and the portion of the payments under the TRA constituting imputed interest. We expect to have adequate capital resources to meet the requirements and obligations under the TRA entered into with the Legacy Unit Holders.
Refer to the section "Critical Accounting Estimates — Tax Receivable Agreement" and Note 23 — Taxation in Item 8 of Part II of this Annual Report for information related to the TRA.
Off-Balance Sheet Arrangements
We do not have any material off-balance sheet arrangements as of December 31, 2025.
The preparation of the Consolidated Financial Statements in accordance with GAAP requires management to make significant judgments, assumptions, and estimates that materially affect the amounts reported in the Company's Consolidated Financial Statements. Management's judgments, assumptions, and estimates are based on historical experience, future expectations, and other factors that are believed to be reasonable as of the date of the Consolidated Financial Statements. Actual results may ultimately differ from management's original estimates, as future events and circumstances sometimes do not develop as expected. The following is a discussion of the critical accounting estimates that may have a material impact on our Consolidated Financial Statements.
Reserves for Unpaid Losses and Loss Adjustment Expenses
Description
Reserves for unpaid losses and loss adjustment expenses represent management's best estimate of the ultimate unpaid costs of all reported and unreported losses and loss adjustment expenses incurred as of the balance sheet date.
Reserves are reviewed by management quarterly and periodically throughout the year by combining historical results and current actual results. When estimating reserves, our actuarial reserving group utilizes several actuarial reserving methods which consider historical claim reporting patterns, claim cycle time, claim frequency and severity, claims settlement practices, adequacy of case reserves over time, seasonality, and current economic conditions. Reserve estimates produced by various actuarial reserving methods are further analyzed to determine the actuarial central estimate which represents the expected value over the range of reasonably possible outcomes.
The following table presents our reserves for losses and loss adjustment expenses, both gross and net of reinsurance recoverables, as of December 31, 2025 and 2024:
The following table summarizes the (favorable) unfavorable development of management's estimate of gross and net ultimate losses and loss adjustment expenses for the 2021 to 2025 accident years:
Gross Ultimate Loss & Loss Adjustment Expenses
Net Ultimate Loss & Loss Adjustment Expenses
Accident Year
2025
2024
Change
2025
2024
Change
in thousands
2021
$
126,591
$
126,191
$
400
$
126,591
$
126,191
$
400
2022
$
185,556
$
184,425
$
1,131
$
180,573
$
179,463
$
1,110
2023
$
235,921
$
234,231
$
1,690
$
233,155
$
231,465
$
1,690
2024
$
300,812
$
314,348
$
(13,536)
$
286,166
$
299,703
$
(13,537)
2025
$
318,187
N/A
N/A
$
295,695
N/A
N/A
Judgments and Uncertainties
Estimating the ultimate cost of claims and claims expenses is an inherently complex and subjective process that involves many variables and a high degree of judgment. The factors considered by management in estimating its reserves for unpaid losses and loss adjustment expenses include the following:
•the views of our actuaries;
•historical trends in claim frequency and severity, including the impacts of adverse weather-related events;
•changes in claim cycle time and claim settlement practices;
•observed industry trends;
•the changing mix of business, predominantly due to the large growth in modern collectible cars which carry a different risk profile than the risks associated with collector cars;
•inflation or deflation;
•retention limits under current catastrophe and treaty reinsurance programs; and
•legislative and judicial changes in the jurisdictions in which we operate.
Claims are analyzed and reported based on the year in which the loss occurred - i.e., on an accident year basis. Accident year data is classified and utilized within actuarial models to prepare estimates of required reserves for payments to be made in the future. The timing of claim settlement varies and depends on the type of claim being reported. Claims involving property damage are generally settled faster than bodily injury claims. Historical loss patterns are then applied to actual paid losses and reported losses by accident year to develop expectations of future claim payments. Implicit within the actuarial models are estimates of the impacts of inflation, especially for claims with longer expected cycle times. Refer to Note 15 — Reserves for Unpaid Losses and Loss Adjustment Expenses in Item 8 of Part II of this Annual Report for additional information regarding the methodologies used to estimate loss and loss adjustment expense reserves.
Effect if Actual Results Differ From Estimates and Assumptions
Because actual experience can differ from key assumptions used in estimating reserves, there may be significant variation in the development of reserves and the amount of actual losses and loss adjustment expenses ultimately paid in the future. Any adjustments to our reserves for unpaid losses and loss adjustment expenses are recognized in our Consolidated Statements of Operations in the period in which management determines that an adjustment is required.
If the actual level of loss frequency and/or severity is higher or lower than our expectations, the ultimate cost of claims paid will differ from management's estimates. An illustration of the potential effect of higher or lower levels of loss frequency and severity on our ultimate cost of claims for the 2025 accident year is provided in the following table:
Change in both loss frequency and severity
Net Ultimate Cost of Claims Occurring in 2025
Change
in thousands
3% Higher
$
313,703
$
18,008
2% Higher
$
307,642
$
11,947
1% Higher
$
301,639
$
5,944
Base Scenario
$
295,695
$
—
1% Lower
$
289,811
$
(5,884)
2% Lower
$
283,986
$
(11,709)
3% Lower
$
278,220
$
(17,475)
Deferred Income Taxes
Description
Income taxes are accounted for under the asset and liability method. Deferred tax assets and liabilities are recognized for the future tax consequences attributable to (i) differences between the financial statement carrying values and tax bases of assets and liabilities; and (ii) operating loss and tax-credit carryforwards. Deferred tax assets and liabilities are measured using enacted tax rates expected to apply to taxable income in the years in which those temporary differences are expected to be recovered or settled. In determining the provision for income taxes for financial statement purposes, we make estimates and judgments which affect our evaluation of the carrying value of our deferred tax assets, as well as our calculation of certain tax liabilities.
Judgments and Uncertainties
We evaluate the carrying value of our deferred tax assets on a quarterly basis. In completing this evaluation, we consider all available positive and negative evidence. Such evidence includes historical operating results, the existence of cumulative earnings and losses in the most recent fiscal years, taxable income in prior carryback year(s) if permitted under the tax law, expectations for future taxable income, the time period over which temporary differences will reverse, and the implementation of feasible and prudent tax planning strategies. Estimating future taxable income is inherently uncertain and requires judgment. Deferred tax assets are reduced by a valuation allowance if, based on the weight of this evidence, it is more likely than not that all or a portion of the recorded deferred tax assets will not be realized in future periods.
As of December 31, 2025, our Consolidated Balance Sheets include deferred tax assets of $159.2 million related to the outside basis difference in Hagerty, Inc.'s investment in THG. A portion of the total outside basis difference is expected to reverse only upon the eventual sale of Hagerty, Inc.'s interest in THG, which would likely result in a capital loss. Accordingly, as of December 31, 2025, we maintained a corresponding valuation allowance of $133.2 million against the deferred tax assets associated with the outside basis difference.
Effect if Actual Results Differ From Estimates and Assumptions
If management's projections of future taxable income and other positive evidence considered in evaluating the need for the valuation allowance prove, with the benefit of hindsight, to be inaccurate, it could prove more difficult to support the realization of our net deferred tax assets. As a result, an additional valuation allowance could be required, which would have an adverse impact on our effective income tax rate and results. Conversely, if management determines that sufficient positive evidence exists in the jurisdiction in which a valuation allowance is recorded, we may reverse all or a portion of the valuation allowance in that jurisdiction. In such situations, the adjustment made to the deferred tax asset would have a favorable impact on our effective income tax rate and results in the period such determination was made.
Refer to Note 23 — Taxation in Item 8 of Part II of this Annual Report for additional information regarding our deferred tax assets, including information regarding changes in the related valuation allowance during the year ended December 31, 2025.
In connection with the consummation of the business combination that formed Hagerty, Inc. in 2021, Hagerty, Inc. entered into a TRA with the Legacy Unit Holders. The TRA provides for payment to the Legacy Unit Holders of 85% of the U.S. federal, state and local cash tax savings realized by Hagerty, Inc. as a result of the increases in tax basis and certain other tax benefits, as outlined in the Business Combination Agreement, upon the exchange of THG units and shares of Hagerty, Inc. Class V Common Stock for shares of Hagerty, Inc. Class A Common Stock or cash. The remaining 15% cash tax savings resulting from the basis adjustments are retained by Hagerty, Inc. The Business Combination Agreement is provided as Exhibit 2.1 to this Annual Report, which is incorporated by reference within Item 15. Exhibits, Financial Statement Schedules.
In connection with the filing of its 2019 income tax return, THG made an election under Section 754 of the IRC for each taxable year in which TRA exchanges occur. This election allows THG to adjust the tax basis of its assets when certain ownership changes or distributions occur. This election cannot be revoked without the permission of the IRS Commissioner and will be in place for any future exchange of THG units.
In general, under the TRA, cash tax savings result in a year when the tax liability of Hagerty, Inc. for the year, computed without regard to the deductions attributable to the amortization of the basis increase and other deductions that arise in connection with the payment of the cash consideration under the TRA or the exchange of THG units and shares of Hagerty, Inc. Class V Common Stock for shares of Hagerty, Inc. Class A Common Stock, would be more than the tax liability for the year taking into account such deductions. Payments under the TRA are due when the Company produces taxable income and the resulting cash tax liability is reduced by deducting the amortization of the basis increase on a filed tax return. The payments under the TRA are expected to be substantial.
Judgments and Uncertainties
The amount and timing of any payments under the TRA will vary depending on a number of factors, including, but not limited to, the increase in tax basis of THG's assets, the timing of any future redemptions, exchanges or purchases of THG units held by Legacy Unit Holders, the price of Hagerty, Inc. Class A Common Stock at the time of the redemption, exchange or purchase, the extent to which redemptions or exchanges are taxable, the amount and timing of the taxable income that Hagerty, Inc. generates in the future, the tax rates then applicable, and the portion of the payments under the TRA constituting imputed interest.
The estimation of the TRA Liability is, by its nature, imprecise and subject to significant assumptions regarding the amount and timing of Hagerty, Inc.'s future taxable income. If we do not generate sufficient taxable income in the aggregate over the term of the TRA to utilize the tax benefits, then we would not be required to make the related payment under the TRA. Therefore, we only recognize a liability for the TRA if we determine it is probable that we will generate sufficient future taxable income over the term of the TRA to utilize the related tax benefits. Estimating future taxable income is inherently uncertain and requires significant management judgment.
Based on Hagerty, Inc.'s forecast of future taxable income, as of December 31, 2025, the estimated value of the TRA Liability was $39.8 million, which is reported within "Tax receivable agreement liability" on the Consolidated Balance Sheets.
Effect if Actual Results Differ From Estimates and Assumptions
The estimated value of the TRA Liability may change in future periods due to changes in anticipated future taxable income, changes in applicable tax rates, and other changes in tax attributes that may occur and impact the expected future tax benefits to be received. Any such changes in these factors or changes in our determination of the need for a valuation allowance related to the tax benefits acquired under the TRA could result in a significant change to the estimated value of the TRA Liability recognized on our Consolidated Balance Sheets. Any such changes are recorded as a component of "Interest expense and other, net" in the Consolidated Statements of Operations each period.
Refer to Note 23 — Taxation in Item 8 of Part II of this Annual Report for additional information regarding the TRA Liability and changes in its recorded balance during the year ended December 31, 2025.
Goodwill represents the excess of the purchase price paid over the fair value of net assets acquired in a business combination. Goodwill is not amortized, but is tested annually for impairment at the reporting unit level as of October 1 and between annual tests if indicators of potential impairment exist. These indicators could include a significant decline in our stock price and market capitalization, a significant change in the outlook for a reporting unit, lower than expected reporting unit operating results, increased competition, legal factors, or the sale or disposition of a significant portion of a reporting unit. For reporting units with goodwill, an impairment loss is recognized for the amount by which the reporting unit's carrying value, including goodwill, exceeds its fair value.
Judgments and Uncertainties
Application of the goodwill impairment test requires judgment, including the identification of reporting units and the determination of the estimated fair value of reporting units. For reporting units with goodwill, we perform a qualitative analysis to determine whether it is more likely than not the fair value of the reporting unit is less than its carrying amount. When assessing goodwill for impairment, our decision to perform a qualitative assessment for an individual reporting unit is based on a number of factors, including the carrying value of the reporting unit's goodwill, the amount of time in between quantitative fair value assessments, macro-economic conditions, industry, and market conditions and the operating performance of the reporting unit. If it is determined, based on qualitative factors, that it is more likely than not that the fair value of the reporting unit is less than its carrying amount, a quantitative impairment test is performed, in which we determine the estimated fair value of the reporting unit using a discounted cash flow analysis. This analysis requires significant judgment, including the estimation of future cash flows, which is dependent on internal forecasts, available industry and market data, the estimation of the long-term rate of growth for the reporting unit including expectations and assumptions regarding the impact of general economic conditions on the reporting unit, the estimation of the useful life over which cash flows will occur (including terminal multiples), the determination of the respective weighted average cost of capital and market participant assumptions. Changes in these estimates and assumptions could materially affect the determination of estimated fair value and potential impairment for each reporting unit.
The Company did not recognize any goodwill impairments during the years ended December 31, 2025, 2024, and 2023. As of December 31, 2025, the Company has recorded goodwill of $114.2 million, including $103.6 million attributable to the Marketplace reporting unit.
Effect if Actual Results Differ from Estimates and Assumptions
Fair value determinations require considerable judgment and are sensitive to changes in underlying assumptions and factors. As a result, there can be no assurance that the estimates and assumptions made for purposes of the annual goodwill impairment test will prove to be an accurate prediction of the future. Examples of events or circumstances that could reasonably be expected to negatively affect the underlying key assumptions and ultimately impact the estimated fair value of our reporting units may include such items as: (i) failure to meet business plans; (ii) deterioration of the U.S. and global economies; (iii) an increase in competition; (iv) an increase in interest rates; or (v) other unanticipated events and circumstances that may decrease or delay the projected cash flows or increase the discount rates and could potentially result in an impairment charge.
While historical performance and current expectations have resulted in the conclusion that our goodwill is not impaired, if our assumptions are not realized, it is possible that an impairment charge may need to be recorded in the future. There can be no assurance that the estimates and assumptions made for purposes of the annual goodwill impairment tests will prove to be an accurate prediction of the future.
New Accounting Standards
New accounting standards are described in Note 2 — Summary of Significant Accounting Policies in Item 8 of Part II of this Annual Report, which are incorporated herein by reference.
ITEM 7A. QUANTITATIVE AND QUALITATIVE DISCLOSURES ABOUT MARKET RISK
Market risk is the risk of economic losses due to adverse changes in the estimated fair value of a financial instrument as a result of changes in interest rates, equity prices, foreign currency exchange rates and commodity prices. We are exposed to market risks primarily through the investment portfolio supporting our insurance operations, including interest rate risk in fixed maturity securities and credit risk. We do not enter into derivatives for trading purposes.
Interest rate risk
Interest rate risk is the risk that we will incur economic losses due to adverse changes in interest rates. Our available-for-sale securities, debt obligations, and loan portfolio secured by collector cars have interest rate risk.
Available-for-sale securities
The primary market risk to our investment portfolio is interest rate risk associated with investments in fixed maturity securities. Fluctuations in interest rates have a direct effect on the market valuation of these securities. When market interest rates increase, the fair value of our fixed maturity securities decreases. Conversely, as interest rates decrease, the fair value of our fixed maturity securities increases. We manage this interest rate risk by investing in securities with varied maturity dates and by managing the duration of our investment portfolio. The target duration of our investment portfolio is two to four years.
As of December 31, 2025, we held fixed maturity securities with a fair value of $696.3 million. The table below illustrates the sensitivity of the value of our fixed maturity securities with hypothetical changes in interest rates as of December 31, 2025:
December 31, 2025
Estimated Fair Value
Estimated Change in Fair Value
Estimated % Increase (Decrease) in Fair Value
in thousands (except percentages)
200 basis points increase
$
654,232
$
(42,039)
(6.0)
%
100 basis points increase
$
675,618
$
(20,653)
(3.0)
%
No change
$
696,271
$
—
—
%
100 basis points decrease
$
716,177
$
19,906
2.9
%
200 basis points decrease
$
735,574
$
39,303
5.6
%
Debt obligations
As of December 31, 2025, we had approximately $153.4 million of variable rate indebtedness, representing approximately 86% of our total debt outstanding, at an average interest rate during the year ended December 31, 2025 of approximately 5.57%. Based on variable-rate borrowings outstanding as of December 31, 2025, a 100-basis point (or 1.0%) change in our borrowing rates would result in our annual interest payments changing by approximately $1.5 million.
Loan portfolio
We also have a portfolio of loans secured by collector cars of approximately $113.9 million as of December 31, 2025, upon which interest is earned predominately at variable rates including the Prime Rate and Term Secured Overnight Financing Rate. Based on variable-rate loans outstanding as of December 31, 2025, a 100-basis point (or 1.0%) change in our variable rates would result in our annual interest income changing by approximately $0.9 million.
Credit risk
Available-for-sale securities
Credit risk is the potential loss resulting from adverse changes in an issuer's ability to repay its debt obligations. We have exposure to credit risk as a holder of fixed maturity securities. Our risk management strategy and investment policy are designed to invest primarily in investment grade debt and to limit the amount of credit exposure with respect to a single issuer.
All other schedules are omitted because they are not applicable or the required information is shown in the Consolidated Financial Statements or Notes thereto.
REPORT OF INDEPENDENT REGISTERED PUBLIC ACCOUNTING FIRM
To the stockholders and the Board of Directors of Hagerty, Inc.
Opinion on the Financial Statements
We have audited the accompanying consolidated balance sheets of Hagerty, Inc. and subsidiaries (the "Company") as of December 31, 2025 and 2024, the related consolidated statements of operations, comprehensive income, changes in temporary equity and stockholders’ equity, and cash flows, for each of the three years in the period ended December 31, 2025, and the related notes and the schedules listed in the Index at Item 8 (collectively referred to as the "financial statements"). In our opinion, the financial statements present fairly, in all material respects, the financial position of the Company as of December 31, 2025 and December 31, 2024, and the results of its operations and its cash flows for each of the three years in the period ended December 31, 2025, in conformity with accounting principles generally accepted in the United States of America.
We have also audited, in accordance with the standards of the Public Company Accounting Oversight Board (United States) (PCAOB), the Company's internal control over financial reporting as of December 31, 2025, based on criteria established in Internal Control — Integrated Framework (2013) issued by the Committee of Sponsoring Organizations of the Treadway Commission and our report dated February 26, 2026, expressed an unqualified opinion on the Company's internal control over financial reporting.
Basis for Opinion
These financial statements are the responsibility of the Company's management. Our responsibility is to express an opinion on the Company's financial statements based on our audits. We are a public accounting firm registered with the PCAOB and are required to be independent with respect to the Company in accordance with the U.S. federal securities laws and the applicable rules and regulations of the Securities and Exchange Commission and the PCAOB.
We conducted our audits in accordance with the standards of the PCAOB. Those standards require that we plan and perform the audit to obtain reasonable assurance about whether the financial statements are free of material misstatement, whether due to error or fraud. Our audits included performing procedures to assess the risks of material misstatement of the financial statements, whether due to error or fraud, and performing procedures that respond to those risks. Such procedures included examining, on a test basis, evidence regarding the amounts and disclosures in the financial statements. Our audits also included evaluating the accounting principles used and significant estimates made by management, as well as evaluating the overall presentation of the financial statements. We believe that our audits provide a reasonable basis for our opinion.
Critical Audit Matter
The critical audit matter communicated below is a matter arising from the current-period audit of the financial statements that was communicated or required to be communicated to the audit committee and that (1) relates to accounts or disclosures that are material to the financial statements and (2) involved our especially challenging, subjective, or complex judgments. The communication of critical audit matters does not alter in any way our opinion on the financial statements, taken as a whole, and we are not, by communicating the critical audit matter below, providing a separate opinion on the critical audit matter or on the accounts or disclosures to which it relates.
Reserves for Unpaid Losses and Loss Adjustment Expenses – Refer to Notes 2 and 15 to the financial statements
Critical Audit Matter Description
Reserves for unpaid losses and loss adjustment expenses represent management's best estimate of the ultimate unpaid costs of all reported and unreported losses and loss adjustment expenses incurred as of the balance sheet date. Reserves are reviewed by management quarterly and periodically throughout the year by combining historical results and current actual results.
Given the significant judgments made by management in estimating the ultimate cost of losses and loss adjustment expenses incurred, particularly related to those claims with longer expected cycle times, the related audit effort in evaluating the reserve required a high degree of auditor judgment and an increased extent of effort, including involvement of our actuarial specialists.
How the Critical Audit Matter Was Addressed in the Audit
Our audit procedures related to reserves for unpaid losses and loss adjustment expenses included the following, among others:
•We tested the effectiveness of controls related to the reserves for unpaid losses and loss adjustment expenses, including those over the Company’s actuarial estimate.
•We tested the completeness and accuracy of the underlying key data inputs that served as the basis for the actuarial estimate.
•With the assistance of our actuarial specialists, we used the Company’s claims data to develop a range of independent estimates for the reserve for unpaid losses and loss adjustment expenses. We used these independent estimates to assess the reasonableness of the Company’s reserve by comparing our estimates to the Company’s recorded reserve for unpaid losses and loss adjustment expenses.
•We compared the Company’s prior years’ estimates of expected losses and loss adjustment expenses to actual experience during the current year to identify potential bias in the determination of reserves for losses and loss adjustment expenses.
/s/ DELOITTE & TOUCHE LLP
Detroit, Michigan
February 26, 2026
We have served as the Company's auditor since 2019.
Fixed maturity securities available-for-sale, at fair value (amortized cost: $687,813 in 2025, $578,669 in 2024)
$
696,271
$
577,688
Equity securities, at fair value
34,871
11,839
Total investments
731,142
589,527
Cash and cash equivalents
160,177
104,784
Restricted cash and cash equivalents
138,823
128,061
Accounts receivable
96,205
84,763
Commissions receivable
28,904
20,430
Premiums receivable
180,529
153,748
Deferred acquisition costs, net
179,224
156,466
Reinsurance recoverables
15,296
11,927
Prepaid reinsurance premiums
21,950
18,521
Notes receivable
113,887
56,972
Intangible assets, net
88,915
90,107
Goodwill
114,164
114,123
Deferred tax assets
43,011
—
Other assets
181,749
179,909
TOTAL ASSETS
$
2,093,976
$
1,709,338
LIABILITIES, TEMPORARY EQUITY AND STOCKHOLDERS' EQUITY
Accounts payable and accrued expenses
$
111,947
$
58,892
Advance premiums and due to insurers
123,217
108,352
Losses payable
95,353
98,386
Reserves for unpaid losses and loss adjustment expenses
168,851
168,492
Unearned premiums
412,058
357,539
Ceding commissions payable
86,165
77,389
Debt, net
177,907
105,760
Contract liabilities
46,450
47,239
Deferred tax liability
23,489
18,065
Tax receivable agreement liability
39,829
2,180
Other liabilities
61,684
58,875
TOTAL LIABILITIES
1,346,950
1,101,169
Commitments and Contingencies (Note 25)
—
—
TEMPORARY EQUITY
Preferred stock, $0.0001 par value (20,000,000 shares authorized, 8,483,561 Series A Convertible Preferred Stock issued and outstanding as of December 31, 2025 and December 31, 2024)
86,618
84,663
STOCKHOLDERS' EQUITY
Class A Common Stock, $0.0001 par value (500,000,000 shares authorized, 100,706,893 and 90,032,391 issued and outstanding as of December 31, 2025 and December 31, 2024, respectively)
10
9
Class V Common Stock, $0.0001 par value (300,000,000 authorized, 241,552,156 and 251,033,906 shares issued and outstanding as of December 31, 2025 and December 31, 2024, respectively)
24
25
Additional paid-in capital
623,013
603,780
Accumulated earnings (deficit)
(402,960)
(451,978)
Accumulated other comprehensive income (loss)
1,229
(1,514)
Total stockholders' equity
221,316
150,322
Non-controlling interest
439,092
373,184
Total equity (Note 20)
660,408
523,506
TOTAL LIABILITIES, TEMPORARY EQUITY AND STOCKHOLDERS' EQUITY
$
2,093,976
$
1,709,338
The accompanying Notes are an integral part of these Consolidated Financial Statements.
See Note 24 for information regarding Related-Party Transactions.
Hagerty, Inc. is a holding company and the sole managing member of The Hagerty Group, LLC ("THG"). Hagerty, Inc.'s sole material asset is its ownership in THG, through which all of its business is conducted. In these Notes to the Consolidated Financial Statements, the terms "Hagerty" and the "Company" refer to Hagerty, Inc. and its consolidated subsidiaries unless the context requires otherwise.
Hagerty is a market leader in providing insurance for collector cars and enthusiast vehicles, helping the automotive enthusiast community protect and enjoy their special cars for over 40 years. Through Hagerty's insurance model, the Company operates as a Managing General Agent ("MGA") by underwriting, selling, and servicing collector car and enthusiast vehicle insurance policies on behalf of our insurance carrier partners. The Company then reinsures a significant portion of the risks written by its MGA subsidiaries through its wholly owned subsidiary, Hagerty Reinsurance Limited ("Hagerty Re"). Hagerty Re reinsures risks predominantly from policies issued by Essentia Insurance Company ("Essentia"), a subsidiary of Markel Group Inc. ("Markel"). Hagerty Re's quota share percentage for the risks that it assumes from Essentia has ranged from 25% at the program's inception to 80% as of December 31, 2025, and will increase to 100% in 2026. Markel is a related party to the Company. Refer to Note 24 — Related-Party Transactions for additional information on related parted transactions with Markel. Hagerty's insurance products are complemented by its membership product, Hagerty Drivers Club ("HDC"), its renowned car events, and its media and entertainment platforms.
Hagerty also operates a trusted marketplace where collectors and enthusiasts can buy and sell a wide range of vehicles, from entry level enthusiast vehicles to high value collector cars. Through its marketplace, Hagerty also provides financing solutions by structuring loans secured by collector cars.
Due to the continued revenue growth and recent geographic expansion of the Company's marketplace business, beginning in the fourth quarter of 2025, the Company updated its segment reporting to reflect two operating and reportable segments: Insurance and Marketplace. Previously, Hagerty operated as a single operating and reportable segment. For additional information regarding segment reporting, refer to Note 4 — Segment Reporting and Disaggregated Revenue.
On December 31, 2025, the Company entered into new contractual arrangements and amended the terms of its existing contractual arrangements with Markel and its affiliates. These coordinated transactions with Markel formed an arrangement that became effective January 1, 2026 (the "Markel Fronting Arrangement"). Under the Markel Fronting Arrangement: (i) the Company continues to issue policies through Essentia, with its underwriting authority (including pricing decisions, rate filing, insurance rating, and risk selections) and claims authority expanded to the maximum levels permitted by applicable law; (ii) the Company has assumed increased administrative responsibilities for the policies issued through Essentia; (iii) Hagerty Re controls 100% of the premium and assumes 100% of the risk for policies issued through Essentia; and (iv) Hagerty Re pays an initial fronting fee, representing 2% of written premium, to Markel for administrative support, which incrementally decreases based on the level of written premium in each calendar year.
2 — Summary of Significant Accounting Policies
Basis of Presentation — The Consolidated Financial Statements are prepared in accordance with accounting principles generally accepted in the United States of America ("GAAP") and pursuant to the regulations of the Securities and Exchange Commission. The Consolidated Financial Statements reflect all normal recurring adjustments and accruals that are, in the opinion of management, necessary for a fair statement of the Company's financial position and results of operations for periods presented.
Beginning with this Annual Report on Form 10-K (this "Annual Report"), the Company presents its Consolidated Financial Statements in accordance with Article 7 of Regulation S-X ("Article 7"), which governs financial reporting for insurance companies. In prior reporting periods, the Company presented its Consolidated Financial Statements in accordance with Article 5 of Regulation S-X ("Article 5"), which is applicable to entities operating in non-specialized industries. The adoption of Article 7 reflects the continued expansion of the Company's insurance operations, including expanded risk assumption under the Markel Fronting Arrangement and the introduction of the Enthusiast+ product.
The principal changes resulting from the transition to Article 7 include the discontinuation of a classified balance sheet and the reclassification of certain line items on the Consolidated Balance Sheets. In addition, "Net investment income" and "Net investment gains" are now reported as components of revenue within the Consolidated Statements of Operations. Prior period financial information has been recast to conform to the requirements of Article 7. The following table presents a reconciliation of Total revenue as presented in prior periods in accordance with Article 5, to the current presentation in accordance with Article 7:
Year ended December 31,
2024
2023
in thousands
Total revenue presented in accordance with Article 5
$
1,200,038
$
1,000,213
Net investment income
39,249
26,904
Net investment gains
2,223
—
Total revenue presented in accordance with Article 7
$
1,241,510
$
1,027,117
Principles of Consolidation — The Consolidated Financial Statements contain the accounts of Hagerty, Inc. and its majority-owned or controlled subsidiaries. All intercompany accounts and transactions have been eliminated in consolidation.
As the sole managing member of THG, Hagerty operates and controls all of the business affairs of THG and has the sole voting interest in, and controls the management of, THG. Accordingly, Hagerty consolidates THG in its consolidated financial statements, resulting in a non-controlling interest representing the economic interest in THG held by other parties. As of December 31, 2025 and 2024, Hagerty, Inc.'s economic ownership of THG was 29.1% and 26.1%, respectively. Refer to Note 20 — Stockholders' Equity for additional information related to the non-controlling interest in THG.
The financial statements of THG are consolidated by the Company under the voting interest method in accordance with Accounting Standards Codification ("ASC") Topic 810, Consolidations ("ASC 810"). Non-controlling interest is presented separately in the Consolidated Statements of Operations, the Consolidated Statements of Comprehensive Income, the Consolidated Balance Sheets, and the Consolidated Statements of Changes in Temporary Equity and Stockholders' Equity.
Use of Estimates — The preparation of the Consolidated Financial Statements in conformity with GAAP requires management to make estimates and assumptions that affect the reported amounts of assets and liabilities, and the disclosure of contingent assets and liabilities as of the date of the Consolidated Financial Statements, as well as the reported amounts of revenue and expenses during the reporting period. Although the estimates are considered reasonable, actual results could materially differ from those estimates.
Significant estimates made by management include, but are not limited to: (i) the reserves for unpaid losses and loss adjustment expenses, including incurred but not reported ("IBNR") claims (see Note 15); (ii) the valuation of deferred income tax assets (see Note 23); (iii) the amount of the liability associated with the tax receivable agreement entered into in connection with the consummation of the business combination that formed Hagerty, Inc. in 2021 (the "TRA") (the "TRA Liability") (see Note 23); and (iv) the fair values of the reporting units used in assessing the recoverability of goodwill. Although some variability is inherent in these estimates, management believes that the current estimates are reasonable in all material respects. These estimates are reviewed regularly and adjusted as necessary. Adjustments related to changes in estimates are reflected in the Company's results of operations in the period during which those estimates changed.
Foreign Currency Translation — The functional currency of entities operating outside of the United States ("U.S.") is the principal currency of the economic environment in which the entity primarily generates and expends cash, which is generally the local currency. Foreign currency denominated assets and liabilities are translated into U.S. dollars at current rates of exchange as of the balance sheet date. Foreign currency denominated income and expense items are translated into U.S. dollars at the average exchange rate for the reporting period. Translation adjustments resulting from exchange rate fluctuations are recorded in "Foreign currency translation adjustments" in the Consolidated Statements of Comprehensive Income. Foreign currency transaction gains and losses are recorded within "Interest expense and other, net" in the Consolidated Statements of Operations.
Investments — Fixed maturity securities are classified as available-for-sale under ASC Topic 320, Investments - Debt Securities. Equity securities are accounted for following ASC Topic 321, Investments - Equity Securities. Available-for-sale and equity securities are recorded on the Consolidated Balance Sheets at their fair value.
Interest and dividends are recognized when earned and recorded within "Net investment income" in the Consolidated Statements of Operations. Premiums and discounts are amortized or accreted, respectively, over the lives of the related fixed maturity securities using the effective interest method and recorded within "Net investment income" in the Consolidated Statements of Operations.
Realized investment gains and losses from sales of fixed maturity securities are recorded within "Net investment gains" in the Consolidated Statements of Operations. Realized and unrealized gains and losses on equity securities are recorded within "Net investment gains" in the Consolidated Statements of Operations. The Company uses the first in, first out method to determine the cost of the fixed maturity securities sold.
Unrealized gains and losses on fixed maturity securities, net of income taxes, are excluded from earnings and recorded within "Change in net unrealized gain (loss) on available-for-sale investments" in the Consolidated Statements of Comprehensive Income.
On a quarterly basis, fixed maturity securities with unrealized losses are reviewed to determine whether the decline in fair value is attributable to a material credit loss. The factors considered in this assessment include the extent to which the fair value has been less than amortized cost, current market interest rates, whether the unrealized loss is credit-driven or a result of changes in market interest rates, and the general financial condition of the issuer. If a material credit loss is noted, an allowance is established and the credit loss is recorded in the Consolidated Statements of Operations. There was no allowance for credit losses recorded for the Company's available-for-sale securities as of December 31, 2025 and 2024.
Refer to Note 5 — Investments and Note 6 — Fair Value Measurements for additional information regarding the Company's investment portfolio.
Cash and Cash Equivalents and Restricted Cash and Cash Equivalents — The Company holds unrestricted and restricted cash and cash equivalents at multiple financial institutions. The combined account balances at one or more of these financial institutions may exceed the Federal Depository Insurance Corporation ("FDIC") insurance coverage limit of $250,000. The Company is subject to a concentration of credit risk related to amounts on deposit in excess of FDIC insurance coverage limits. The Company believes the risk is not significant given the size and credit worthiness of the financial institutions at which the funds are held. Highly liquid investments convertible to a known amount of cash and with an original maturity of three months or less are considered to be cash equivalents.
Cash and cash equivalents that are restricted as to withdrawal or use are recorded as restricted cash and cash equivalents. The carrying value of the Company's restricted cash and cash equivalents approximates its fair value. Refer to Note 3 — Supplemental Balance Sheet and Cash Flow Information for additional information regarding the Company's restricted cash and cash equivalent balances.
The following table provides a reconciliation of cash and cash equivalents and restricted cash and cash equivalents as of December 31, 2025, 2024, and 2023:
December 31,
2025
2024
2023
in thousands
Cash and cash equivalents
$
160,177
$
104,784
$
108,326
Restricted cash and cash equivalents
138,823
128,061
615,950
Total cash and cash equivalents and restricted cash and cash equivalents
$
299,000
$
232,845
$
724,276
Receivables — Accounts receivable primarily consists of amounts due from customers for insurance policies sold by the Company's MGA subsidiaries that will ultimately be remitted to our insurance carrier partners. Premiums receivable consists of ceded premiums due to Hagerty Re from insurance carriers. Commissions receivable primarily consists of profit sharing commissions due to the Company's MGA subsidiaries from insurance carriers. As of December 31, 2025 and 2024, the allowance for expected credit losses related to the Company's receivable balances was not material based on management's quarterly risk assessment, which takes into consideration historical trends, the current economic environment, the creditworthiness of the debtor, and other relevant factors.
Deferred Acquisition Costs, net — Deferred acquisition costs include the ceding commissions paid by Hagerty Re to our insurance carrier partners for the risk assumed under quota share reinsurance agreements with those carriers. Deferred acquisition costs are recorded net of commissions received by Hagerty Re for the risk ceded to various reinsurers and the net acquisition costs are deferred and recognized ratably over the term of the related policies, which is generally 12 months.
Deferred acquisition costs are considered to be recoverable if the sum of expected future earned premiums exceeds expected future claims and expenses. Anticipated investment income is also a factor in the recoverability analysis. If, as a result of the recoverability analysis, a loss is determined to be probable, a premium deficiency reserve is recognized in the period in which such determination is made. At December 31, 2025 and 2024, deferred acquisition costs were considered fully recoverable and no premium deficiency reserve was recorded.
Reinsurance — Hagerty Re purchases catastrophe reinsurance to protect its capital from large catastrophic events. In addition, Hagerty Re enters into quota share reinsurance agreements with various reinsurers and purchases facultative reinsurance to cede a portion of its physical damage exposure related to certain policies and vehicles. Reinsurance recoverables are amounts due to Hagerty Re from reinsurers for paid and unpaid loss and loss adjustment expenses. The amount of any reinsurance recoverable is determined by applying the contract terms to incurred losses arising from a qualifying event.
Prepaid reinsurance premiums consists of the unearned portion of premiums ceded by Hagerty Re to various reinsurers and are initially recorded on the Consolidated Balance Sheets and subsequently recognized on a pro-rata basis over the term of the related reinsured policies as a reduction to "Earned premium, net" in the Consolidated Statements of Operations.
Refer to Note 16 — Reinsurance for additional information regarding the Company's reinsurance coverage.
Notes Receivable — Notes receivable primarily includes loans underwritten by Broad Arrow Capital LLC ("BAC") and its subsidiaries that are secured by collector cars, as well as accrued interest associated with the loans. Notes receivable are recorded on the date the loan is funded based on the amount stipulated in the underlying agreement. Finance revenue on the loans is recognized when earned based on the amount of the outstanding loan, the applicable interest rate on the loan, and the length of time the loan was outstanding during the period.
Notes receivable are recorded net of an allowance for expected credit losses, which is based on management's quarterly risk assessment and takes into consideration a number of factors including the level of historical losses for similar loans, the quality of the collateral, the loan-to-value ("LTV") ratio of each loan, management's overall assessment of the current circumstances and risks related to each loan, and, to a lesser extent, the circumstances related to each borrower. As of December 31, 2025 and 2024, the allowance for expected credit losses related to Notes receivable was not material. The valuation of collector cars is inherently subjective, and the realizable value of collector cars often fluctuates over time. Refer to Note 7 — Notes Receivable for additional information.
Costs to Obtain Contracts with Customers — The Company expects that commission costs incurred by its MGA subsidiaries in order to obtain new insurance policies are recoverable. As such, the incremental commission paid on new policies over renewal policies is recorded within "Other assets" on the Consolidated Balance Sheets when they are paid and are subsequently amortized to "Sales expense" in the Consolidated Statements of Operations based on the average expected life of the underlying insurance policy.
Inventory— Inventory primarily consists of vehicles that have been purchased opportunistically for resale by subsidiaries of the Broad Arrow Group, Inc. ("Broad Arrow"). Inventory is valued on a specific identification basis at the lower of cost or the Company's estimate of net realizable value (i.e., the expected sale price upon disposition). Inventory is recorded within "Other assets" on the Consolidated Balance Sheets. If there is evidence that the estimated net realizable value of a specific item held in inventory is less than its carrying value, a write down is recorded within "Sales expense" in the Consolidated Statements of Operations to reflect a revised estimate of net realizable value on the Consolidated Balance Sheets.
Software-as-a-Service— During the preliminary project stage, implementation costs related to software-as-a-service ("SaaS") arrangements are expensed as incurred to "Salaries and benefits" or "General and administrative expenses" in the Consolidated Statements of Operations. During the development phase, direct implementation costs related to SaaS arrangements are capitalized and recorded within "Other assets" on the Consolidated Balance Sheets. Capitalized SaaS implementation costs are amortized over the term of the underlying service agreement. The Company monitors SaaS implementation projects on an ongoing basis and capitalizes the costs of any major improvements or new functionality. Once the software is fully implemented, ongoing maintenance costs are expensed as incurred.
Property and Equipment — Property and equipment are recorded at cost and depreciated over the estimated useful life of each asset. Leasehold improvements are amortized over the shorter of the lease term or the estimated useful life of the improvement. Estimated useful lives range from three to seven years for computers, automobiles, and office furniture. Buildings and building improvements have an estimated useful life of 39 years. Upon sale or retirement, the cost and related accumulated depreciation of the assets disposed are derecognized, and any resulting gain or loss is reflected in the Consolidated Statements of Operations. Annual depreciation is calculated based on the straight-line method. Maintenance, repair costs and minor renovations are expensed as incurred, while expenditures that increase the asset's estimated useful life are capitalized.
Leases — A contract is or contains a lease if it conveys the right to control the use of identified property, plant or equipment in exchange for consideration. At commencement, leases are evaluated for classification as an operating lease or finance lease. For leases with a term greater than twelve months, a right-of-use ("ROU") asset and lease liability is recognized on the Consolidated Balance Sheets at the commencement date of the lease based on a calculation of the present value of lease payments over the lease term using an estimated incremental borrowing rate. The estimated incremental borrowing rate is determined based on several factors including company specific credit rating, lease term, impact of collateral, general economics and the interest rate environment. The Company's real estate leases contain both lease and non-lease components, which are accounted for as a single lease component. For leases containing fixed rent escalation clauses, the escalators are factored into the determination of future minimum lease payments. The Company has the option to extend most of its lease agreements, with renewals ranging from one to 20 years. As it is not reasonably certain that the Company will exercise these renewal options, they are not included in the lease terms for purposes of calculating the Company's lease liability.
The Company's lease agreements may contain variable costs such as common area maintenance, operating expenses, real estate taxes, or other costs. Variable lease costs are expensed as incurred within "General and administrative expenses" in the Consolidated Statements of Operations. The Company's lease agreements generally do not contain any residual value guarantees or restrictive covenants.
The Company's primary operating leases consist of office space. ROU assets and lease liabilities are recorded within "Other assets" and "Other liabilities", respectively, on the Consolidated Balance Sheets. ROU assets are amortized over the life of the lease to "General and administrative expenses" in the Consolidated Statements of Operations. Refer to Note 10 — Leases for additional information.
Intangible Assets — Intangible assets are recorded at cost, which represents their fair value as of the acquisition date. Fair value is estimated using generally accepted valuation methods appropriate for the type of intangible asset. Intangible assets are amortized over the estimated life of each intangible asset, unless the estimated life is deemed to be indefinite.
Intangible assets primarily consist of internally developed software, acquired insurance policy renewal rights, trade names, and acquired customer relationships, as well as indefinite lived state insurance licenses acquired in conjunction with the acquisition of Drivers Edge. Amortization is recorded using the straight-line method over the estimated life of the intangible asset as it approximates the pattern over which economic benefits are realized. The Company expenses internally developed software costs incurred during the preliminary project stage and, upon management approval, capitalizes direct development costs including the associated payroll and related costs for employees working on development, as well as third party contractor costs.
Refer to Note 14 — Goodwill and Intangible Assets for additional information regarding intangible assets and Note 11 — Acquisition for additional information regarding the acquisition of Drivers Edge.
Goodwill — Goodwill represents the excess of the cost of a business combination over the fair value of net assets acquired, including identifiable intangible assets. Goodwill is not amortized, but is tested annually for impairment at the reporting unit level as of October 1 and between annual tests if indicators of potential impairment exist.
For reporting units with goodwill, the Company performs a qualitative analysis to determine whether it is more likely than not that the fair value of the reporting unit is less than its carrying amount. When assessing goodwill for impairment, the Company's decision to perform a qualitative assessment for an individual reporting unit is based on a number of factors, including the carrying value of the reporting unit's goodwill, the amount of time in between quantitative fair value assessments, macro-economic conditions, industry and market conditions, and the operating performance of the reporting unit. If it is determined, based on qualitative factors, that it is more likely than not that the fair value of the reporting unit is less than its carrying amount, a quantitative impairment test is performed, in which the Company determines the estimated fair value of the reporting unit using a discounted cash flow analysis. This analysis requires significant judgment, including the estimation of future cash flows, which is dependent on internal forecasts, available industry and market data, the estimation of the long-term rate of growth for the reporting unit including expectations and assumptions regarding the impact of general economic conditions on the reporting unit, the estimation of the useful life over which cash flows will occur (including terminal multiples), the determination of the respective weighted average cost of capital, and market participant assumptions.
As of December 31, 2025, the Company had goodwill of $114.2 million, including $103.6 million attributable to the Marketplace reporting unit. The Company did not recognize any goodwill impairments during the years ended December 31, 2025, 2024, and 2023.
Impairment of Long-Lived Assets — The Company reviews all long-lived assets that have finite lives for impairment whenever events or changes in circumstances indicate that the carrying amount may not be recoverable in accordance with ASC Topic 360, Impairment and Disposal of Long-Lived Assets ("ASC 360"). If it is determined the carrying amount of the asset (or asset group) is not recoverable, an impairment loss is recognized within total expenses in the Consolidated Statements of Operations in the period in which such determination is made.
The determination of the recoverability of a long-lived asset (or asset group) is based on an estimate of the undiscounted cash flows resulting from the use of the asset (or asset group) and its eventual disposition. If the carrying value of the long-lived asset (or asset group) is not recoverable on an undiscounted cash flow basis, an impairment loss is recognized to the extent that the carrying value exceeds the fair value of the long-lived asset (or asset group). Fair value is determined through various valuation techniques including discounted cash flow models, quoted market values and third-party independent appraisals, as necessary.
Advance Premiums and Due to Insurers — Advance premiums represents the aggregate amount of gross written premium received by the Company's MGA subsidiaries prior to the effective date of the underlying policies. Due to insurers represents the amount of premium owed to the insurance carrier, net of the commission earned by the Company, after the policy becomes effective.
Losses Payable — Losses payable represents the amount due to insurance carriers by the Company for paid and billed losses as of the balance sheet date.
Reserves for Unpaid Losses and Loss Adjustment Expenses — Reserves for unpaid losses and loss adjustment expenses represents management's best estimate of the ultimate unpaid cost of all reported and unreported losses and loss adjustment expenses incurred as of the balance sheet date. The Company does not discount its reserves for unpaid losses and loss adjustment expenses to reflect the time value of money.
Estimating the ultimate cost of claims and claims expenses is an inherently complex and subjective process that involves many variables and a high degree of judgment. Reserves are reviewed by management quarterly and periodically throughout the year by combining historical results and current actual results. When estimating reserves, the Company's actuarial reserving group utilizes several actuarial reserving methods which consider historical claim reporting patterns, claim cycle time, claim frequency and severity, claims settlement practices, adequacy of case reserves over time, seasonality, and current economic conditions. Because actual experience can differ from key assumptions used in estimating reserves, there may be significant variation in the development of reserves and the amount of actual losses and loss adjustment expenses ultimately paid in the future. Any adjustments to the Company's reserves for unpaid losses and loss adjustment expenses, and any related reinsurance recoverables, are recognized in the Consolidated Statements of Operations in the period in which management makes the determination that an adjustment is required.
Refer to Note 15 — Reserves for Unpaid Losses and Loss Adjustment Expenses for additional information regarding the methodologies used to estimate loss and loss adjustment expense reserves.
Tax Receivable Agreement Liability — In connection with the consummation of the business combination that formed Hagerty, Inc. in 2021, Hagerty, Inc. entered into a TRA with Hagerty Holding Corp. ("HHC") and Markel (together, the "Legacy Unit Holders"). The TRA provides for payment to the Legacy Unit Holders of 85% of the U.S. federal, state and local cash tax savings realized by Hagerty, Inc. as a result of the increases in tax basis and certain other tax benefits as outlined in the Business Combination Agreement upon the exchange of THG units and shares of Hagerty, Inc. Class V Common Stock for shares of Hagerty, Inc. Class A Common Stock or cash. The remaining 15% cash tax savings resulting from the basis adjustments are retained by Hagerty, Inc. The Business Combination Agreement is provided as Exhibit 2.1 to this Annual Report, which is incorporated by reference within Item 15. Exhibits, Financial Statement Schedules.
The Company accounts for the TRA in accordance with ASC 450, Contingencies ("ASC 450"), with a liability recorded when it is probable that a payment under the TRA will be required and the amount of that payment can be reasonably estimated. The TRA Liability is measured on a gross, undiscounted basis based on projected future cash tax savings expected to be realized, multiplied by the contractual payment percentage. The estimated value of the TRA Liability is reassessed each reporting period. Changes in estimates of future taxable income, enacted tax rates, or the realization of related deferred tax assets are recognized in earnings in the period of change. Any such changes are recorded as a component of "Interest expense and other, net" in the Consolidated Statements of Operations in the period in which they occur.
Transactions with Legacy Unit Holders occurring after the date of the business combination that formed Hagerty, Inc. in 2021, including exchanges of THG units and shares of Class V Common Stock for shares of Class A Common Stock or cash, give rise to additional TRA liabilities. Consistent with ASC 450, these incremental obligations are recorded on a gross, undiscounted basis at the time of the exchange, with a corresponding adjustment to "Additional paid-in capital" on the Consolidated Balance Sheets. Payments under the TRA are classified as Financing Activities in the Consolidated Statements of Cash Flows.
Warrant Liabilities — Prior to the warrant exchange transaction that was completed in the third quarter of 2024, which resulted in the settlement of all outstanding warrants, the Company accounted for its warrants in accordance with ASC Topic 815, Derivatives and Hedging ("ASC 815"). The warrants did not meet the criteria for equity treatment and as such, were recorded as a liability at their fair value. The warrant liability was subject to remeasurement each reporting period with the change in fair value between reporting periods recorded within "Loss (gain) related to warrant liabilities, net" in the Consolidated Statements of Operations. Refer to Note 6 — Fair Value Measurements for additional information related to the Warrant Exchange.
Revenue Recognition
Commission and fee revenue
The Company's MGA subsidiaries earn commission and fee revenue primarily from the underwriting, sale, and servicing of collector car and enthusiast vehicle insurance policies on behalf of insurance carriers. Commission and fee revenue is recognized under ASC Topic 606, Revenue from Contracts with Customers ("ASC 606"). Approximately 90% of the Company's commission and fee revenue is earned through policies sold on behalf of wholly owned subsidiaries of Markel, which is a related party. Refer to Note 24 — Related-Party Transactions for additional information.
The Company has identified the insurance carrier as the customer when it operates as an MGA and determined that the transaction price is the estimated commission to be received over the term of the policy. The transaction price is determined based on an estimate of premiums written, net of a constraint for policy changes and cancellations. These commissions and fees, including those paid via installment plan, are earned when the policy becomes effective, as the Company's performance obligation is substantially complete when the policy is issued, as all rights are passed to the insured, and the obligation to pay a claim resides with the carrier.
Under the terms of the contracts with certain insurance carriers, the Company has the opportunity to earn a contingent underwriting commission ("CUC") based on the results of the book of business, including the level of written or earned premium and loss ratio. Each insurance carrier partner contract and related CUC is calculated independently. The CUCs represent a form of variable consideration associated with the placement of insurance coverage. Under ASC 606, the Company must estimate the amount of consideration that it will become entitled to receive during the calendar year such that a significant reversal of revenue is not probable. An estimate of the CUCs that the Company expects to be entitled to receive is recognized as a contract asset within "Commissions receivable" on the Consolidated Balance Sheets in the period that the policy is issued using the applicable premium, estimated loss ratio, and payout factors from the contract.
Earned premium, net
Written premiums are recorded at policy inception and are recognized to "Earned premium, net" in the Consolidated Statements of Operations on a pro rata basis over the Company's typical 12-month policy term in accordance with ASC Topic 944, Financial Services — Insurance ("ASC 944"). Written premiums that are not yet recognized as revenue are recorded as "Unearned premiums" on the Consolidated Balance Sheets. Earned premium is recorded net of premiums ceded to reinsurers.
Marketplace revenue
The Marketplace segment earns commission and fee-based revenue primarily from the sale of collector cars and enthusiast vehicles through live auctions, time-based digital auctions, and brokered private sales. From time-to-time, the Marketplace segment also earns revenue from the sale of collector cars and enthusiast vehicles that have been acquired opportunistically and placed in inventory. In addition, the Marketplace segment earns finance revenue from loans made to qualified collectors and businesses secured by their collector cars, which is recognized under ASC Topic 310, Receivables ("ASC 310").
Commission and fee-based marketplace revenue is recognized on a net basis when the underlying sale is completed, which is generally upon the matching of a seller and buyer in a legally binding sale transaction. Revenue from the sale of inventory is recognized on a gross basis at the point in time when title and control of the car is transferred to the buyer, which is generally upon collection of the full purchase price. Finance revenue is recognized over time as earned based on the amount of the outstanding loan, the applicable interest rate on the loan, and the length of time the loan was outstanding during the period.
Subscription revenue is earned from the sale of HDC memberships, which are primarily bundled with the Company's insurance policies and give subscribers access to an array of products and services, including emergency roadside assistance, Hagerty Drivers Club Magazine, special access to automotive enthusiast events, Hagerty's proprietary vehicle valuation tool, and special vehicle-related discounts. Revenue from the sale of HDC memberships is recognized ratably over the period of the membership. The membership is treated as a single performance obligation to provide access to stated Member benefits over the life of the membership, which is currently one year.
Other revenue includes sponsorship, admission, advertising, storage, valuation, registration, and sublease income. Other revenue is recognized when the performance obligation for the related product or service is satisfied.
Contract Assets
Contract assets, primarily consisting of CUC receivables, are reported within "Commissions receivable" on the Consolidated Balance Sheets. As of December 31, 2025 and 2024, the Company had contract assets of $20.8 million and $15.9 million, respectively.
Contract Liabilities
Contract liabilities consist of cash collected in advance of revenue recognition and primarily relates to the unrecognized portion of HDC membership fees, the unrecognized portion of the advanced commission payment received from State Farm Mutual Automobile Insurance Company ("State Farm"), and, to a much lesser extent, cash collected in advance of the completion of marketplace private sales. As of December 31, 2025 and 2024, the Company had contract liabilities of $46.5 million and $47.2 million, respectively.
Contract liabilities related to HDC membership fees and marketplace private sales have a duration of one year or less. For contracts that are long-term in nature, the Company recognized approximately $2.0 million of revenue during the year ended December 31, 2025, which represents revenue related to the advanced commission payment received from State Farm. Refer to Note 24 — Related-Party Transactions for additional information regarding the Company's master alliance agreement with State Farm.
Share-Based Compensation — The Company issues restricted stock units ("RSUs"), market condition performance restricted stock units ("PRSUs"), and performance condition PRSUs under the 2021 Stock Incentive Plan. Share-based compensation expense is measured at the grant date based upon the estimated fair value of the award and is recognized as expense over the applicable requisite service period of the award generally using the straight-line method. Forfeitures are recorded in the period in which they occur. Refer to Note 21 — Share-Based Compensation for additional information.
Self-Insurance — The Company has elected to self-insure certain costs related to U.S. employee health benefit and short-term disability programs. Costs resulting from self-insured losses are charged to expense when incurred. The Company has purchased insurance that limits its aggregate annual exposure for healthcare costs to approximately $20.8 million, $17.9 million, and $16.3 million for the years ended December 31, 2025, 2024, and 2023, respectively. Total expenses for healthcare claims incurred for the years ended December 31, 2025, 2024, and 2023 were approximately $18.6 million, $13.6 million, and $14.2 million, respectively. Healthcare claims are recorded within "Salaries and benefits" in the Consolidated Statements of Operations. As of December 31, 2025 and 2024, the Company has recorded approximately $2.1 million and $1.6 million as an estimate of IBNR claims, respectively. The amount of actual losses incurred could differ materially from the estimate reflected in these financial statements.
Postretirement Benefits — The Company offers postretirement benefits. In the U.S., the Company offers a 401(k) plan covering substantially all U.S. employees. The plan provides for 4.0% matching contributions. Contributions to the plan were $7.3 million, $6.5 million, and $6.0 million for the years ended December 31, 2025, 2024 and 2023, respectively.
Advertising — Advertising and sales promotion costs are expensed the first time the advertising or sales promotion takes place. Advertising costs were $27.2 million, $25.9 million, and $25.5 million for the years ended December 31, 2025, 2024, and 2023, respectively, and are reflected as a component of "Sales expense" in the Consolidated Statements of Operations.
Income Taxes — With the exception of certain U.S. corporate and foreign subsidiaries,THG is taxed as a pass-through ownership structure under the Internal Revenue Code ("IRC") and a similar section of state income tax law. As such, any taxable income or loss generated by THG is passed through to and included in the taxable income or loss of THG unit holders, including Hagerty, Inc.
Hagerty, Inc. is taxed as a corporation and pays corporate federal, state and local taxes with respect to income allocated from THG. Hagerty, Inc., Hagerty Insurance Holdings, Inc., Broad Arrow, Hagerty Radwood, Inc., and various foreign subsidiaries are treated as taxable entities and income taxes are provided where applicable. Hagerty Insurance Holdings, Inc. files a consolidated tax return that includes its wholly owned corporate subsidiaries, Hagerty Re and Drivers Edge.
Where applicable, income taxes are accounted for under the asset and liability method. Deferred tax assets and liabilities are recognized for the future tax consequences attributable to (i) differences between the financial statement carrying values and tax bases of assets and liabilities; and (ii) operating loss and tax-credit carryforwards. Deferred tax assets and liabilities are measured using enacted tax rates expected to apply to taxable income in the years in which those temporary differences are expected to be recovered or settled. The effect on deferred tax assets and liabilities of a change in tax rates is recognized in the Consolidated Statements of Operations in the period when the change is enacted.
The Company evaluates the carrying value of its deferred tax assets on a quarterly basis. In completing this evaluation, management considers all available positive and negative evidence. Such evidence includes historical operating results, the existence of cumulative earnings and losses in the most recent fiscal years, taxable income in prior carryback year(s) if permitted under the tax law, expectations for future taxable operating income, the time period over which temporary differences will reverse, and the implementation of feasible and prudent tax planning strategies. Estimating future taxable income is inherently uncertain and requires judgment. Deferred tax assets are reduced by a valuation allowance if, based on the weight of this evidence, it is more likely than not that all or a portion of the recorded deferred tax assets will not be realized in future periods.
Refer to Note 23 — Taxation for additional information.
Earnings Per Share — Basic and diluted earnings per share ("EPS") are calculated in accordance with ASC Topic 260, Earnings Per Share ("ASC 260"). Basic EPS is calculated under the Two-Class Method using basic Net income available to Class A Common Stockholders divided by the weighted average number of shares of Class A Common Stock outstanding during the period.
Diluted EPS is calculated using diluted Net income available to Class A Common Stockholders divided by the weighted average number of shares of Class A Common Stock outstanding during the period, adjusted to give effect to potentially dilutive securities.
The Company's potentially dilutive securities consist of (i) unvested RSUs, shares issuable under the employee stock purchase plan, and unexercised warrants (prior to completion of the Warrant Exchange), with the dilutive effect calculated using the Treasury Stock Method; (ii) unvested PRSUs, with the dilutive effect calculated using the Contingently Issuable Method; and (iii) non-controlling interest THG units and Series A Convertible Preferred Stock, with the dilutive effect calculated using the more dilutive of the If-Converted Method and the Two-Class Method.
In periods in which the Company reports a net loss attributable to Class A Common Stockholders, diluted net loss per share attributable to Class A Common Stockholders would be equal to basic net loss per share since potentially dilutive shares of Class A Common Stock are not assumed to be issued if their effect is anti-dilutive.
Recently Adopted Accounting Standards
Income Taxes — In December 2023, the Financial Accounting Standards Board ("FASB") issued Accounting Standards Update ("ASU") No. 2023-09 - Income Taxes (ASC 740), Improvements to Income Tax Disclosures ("ASU 2023-09"), which enhances the transparency and decision usefulness of income tax disclosures through changes to the rate reconciliation and income taxes paid information. ASU No. 2023-09 modifies the rules on income tax disclosures to require entities to disclose (i) specific categories in the rate reconciliation; (ii) the income or loss from continuing operations before income tax expense or benefit (separated between domestic and foreign); and (iii) income tax expense or benefit from continuing operations (separated by federal, state, and foreign). ASU No. 2023-09 also requires entities to disclose their income tax payments to international, federal, state, and local jurisdictions, among other changes. ASU No. 2023-09 is effective for annual periods beginning after December 15, 2024. The Company adopted ASU No. 2023-09 effective with this Annual Report, which has been applied on a prospective basis. Refer to Note 23 — Taxation for additional information.
Income Statement Expenses— In November 2024, the FASB issued ASU No. 2024-03, Disaggregation of Income Statement Expenses (ASC 220-40), which enables investors to better understand an entity's performance, assessing an entity's prospects for future cash flows, and comparing an entity's performance over time and with that of other entities. ASU No. 2024-03 primarily requires entities to disaggregate, in the notes to the financial statements, any relevant expense caption presented in the statement of operations within continuing operations into the following required natural expense categories: purchases of inventory, employee compensation, depreciation, and intangible asset amortization. The new standard does not change the presentation of expense information in the Consolidated Statements of Operations. ASU 2024-03 is effective for annual periods beginning after December 15, 2026. The Company is still assessing the impact of ASU No. 2024-03 and, upon adoption, the Company may be required to include certain additional disclosures in its Consolidated Financial Statements.
Internal-Use Software— In September 2025, the FASB issued ASU No. 2025-06, Targeted Improvements to the Accounting for Internal-Use Software (ASC 350-40), which modernizes the accounting guidance for the costs to develop software for internal use. The targeted improvements primarily introduce a new capitalization threshold based on management's commitment to funding and the probability of project completion. It removes all references to a sequential software development method. The new standard does not change the types of costs eligible for capitalization, the point at which capitalization ends, or the associated amortization and impairment guidance. ASU 2025-06 is effective for annual periods beginning after December 15, 2027 and the Company is still assessing its impact.
3 — Supplemental Balance Sheet and Cash Flow Information
Restricted Assets — The Company's MGA subsidiaries collect premiums from insureds on behalf of insurance carriers. Prior to remittance to the insurance carrier, these funds are required to be held in trust for the benefit of the insurance carriers and segregated from the Company's operating cash.
Hagerty Re maintains trust accounts for the benefit of various ceding insurers as security for its obligations for losses, loss expenses, unearned premium, and profit-sharing commissions.
The Company's wholly owned insurance carrier subsidiary, Drivers Edge, maintains assets on deposit with a number of regulatory authorities to support its insurance operations. Refer to Note 11 — Acquisition for additional information related to the acquisition of Drivers Edge.
BAC and its consolidated subsidiaries maintain bank accounts that are required for the operation of the BAC Credit Facility (as defined in Note 18 — Debt). The funds in these bank accounts represent security under the BAC Credit Facility and their use is restricted to the servicing of the debt outstanding under that facility.
The following table presents the components of the Company's restricted assets as of December 31, 2025 and 2024:
December 31,
2025
2024
in thousands
Restricted cash and cash equivalents
$
138,823
$
128,061
Fixed maturity securities
675,302
577,688
Equity securities
34,871
11,839
Total restricted assets
$
848,996
$
717,588
Variable Interest Entities — BAC and certain of its subsidiaries transfer notes receivable to wholly owned, bankruptcy-remote, special purpose entities (each, an "SPE") to secure borrowings under the BAC Credit Agreement (as defined in Note 18 — Debt).
These SPEs are considered to be variable interest entities (each, a "VIE") under GAAP and their financial statements are consolidated by BAC, which is the primary beneficiary of the SPEs and also a consolidated subsidiary of the Company. BAC is considered to be the primary beneficiary of the SPEs because it has (i) power over the significant activities of the SPEs through its role as servicer of the notes receivable used to secure borrowings under the BAC Credit Agreement; and (ii) the obligation to absorb losses or the right to receive returns that could be significant through its interest in the residual cash flows of the SPEs.
Refer to Note 7 — Notes Receivable and Note 18 — Debt for additional information.
Supplemental Cash Flow Information — The table below presents information regarding the Company's non-cash investing and financing activities, as well as the cash paid for interest and taxes for the years ended December 31, 2025, 2024, and 2023:
Year ended December 31,
2025
2024
2023
Non-cash investing activities:
in thousands
Issuance of notes receivable (1)
$
12,132
$
6,229
$
6,492
Collection of notes receivable (1)
$
4,669
$
8,084
$
6,094
Capital expenditures
$
1,693
$
723
$
282
Acquisitions and investments
$
—
$
—
$
2,142
Termination of MHH Joint Venture (Refer to Note 12)
$
—
$
—
$
2,929
Non-cash financing activities:
Loss on Warrant Exchange (Refer to Note 6)
$
—
$
2,006
$
—
Exchange of THG units for shares of Class A Common Stock (Refer to Note 20)
$
16,996
$
3,227
$
2,311
Deferred tax assets and TRA liabilities recorded upon exchange of THG units for shares of Class A Common Stock (Refer to Note 23)
$
1,318
$
—
$
—
Issuance of shares of Class A Common Stock resulting from the vesting of RSUs (Refer to Note 21)
$
12,101
$
18,621
$
9,975
Cash paid for interest
$
10,160
$
8,613
$
6,126
Cash paid for income taxes: (2)
Federal
$
15,900
N/A
N/A
State
447
N/A
N/A
Foreign
63
N/A
N/A
Total cash paid for income taxes
$
16,410
(1) In certain situations, BAC makes loans to refinance accounts receivable balances generated by Broad Arrow auctions and private sales. These loans are accounted for on the Consolidated Balance Sheets as non-cash reclassifications between "Accounts receivable" and "Notes receivable" and are not presented within Investing Activities in the Company's Consolidated Statements of Cash Flows. Upon repayment, the cash received in settlement of such loans is classified within Operating Activities in the Company's Consolidated Statements of Cash Flows.
(2) Beginning with the year ended December 31, 2025, the Company has adopted ASU 2023-09 and as a result, cash paid for taxes, net of refunds received, is disclosed by jurisdiction on a prospective basis. For the years ended December 31, 2024 and 2023, cash paid for taxes was $17.9 million and $10.5 million, respectively.
4 — Segment Reporting and Disaggregated Revenue
Segment Reporting
Due to the continued revenue growth and recent geographic expansion of Hagerty's marketplace business, beginning in the fourth quarter of 2025, the Company updated its segment reporting to reflect two operating and reportable segments: Insurance and Marketplace. Previously, the Company operated as a single operating and reportable segment. Prior period segment information has been recast to conform to the current presentation in this Annual Report.
The Insurance segment principally includes the Company's MGA and reinsurance operations, as well as its membership, events and media activities which support and enhance the Company's insurance offerings. The Marketplace segment offers a trusted marketplace where automotive enthusiasts can buy, sell, and finance collector cars.
The Company's Chief Executive Officer ("CEO") and Chairman of its Board of Directors ("the Board") acts as the Chief Operating Decision Maker ("CODM"). The CODM evaluates performance and makes resource allocation decisions about the Company's reportable segments using a number of measures, including income before taxes, which is the Company's measure of segment profitability.
The CODM regularly receives information about the significant expenses of each reportable segment, including (i) Losses and loss adjustment expenses; (ii) Ceding commissions, net; (iii) Sales expense; and (iv) other expenses, which is an aggregation of Salaries and benefits, General and administrative expenses, and Depreciation and amortization. These expenses are not regularly used by the CODM on a disaggregated basis for purposes of evaluating segment profitability. The Company does not report total assets by segment for internal or external reporting purposes as the Company's CODM does not receive segment balance sheets or assess performance, make strategic decisions, or allocate resources based on assets.
Income before taxes for each segment includes an allocation of attributable shared service expenses. Certain corporate expenses are excluded from segment income before taxes as they are not attributable to the operations of the reportable segments. These unallocated expenses are included in the reconciliation of total segment income before taxes to consolidated income before taxes below.
The table below presents the Company's segment information for the years ended December 31, 2025, 2024, and 2023:
The following tables present revenues from customer contracts that are recognized in accordance with ASC 606, disaggregated by geographic area, as well as a reconciliation to total revenue for the years ended December 31, 2025, 2024, and 2023:
Commission and fee revenue is earned through two distribution channels: direct and agent. Revenue earned from the direct distribution channel includes revenue generated by Hagerty's employee agents. Revenue earned from the agent distribution channel includes revenue generated through the Company's insurance distribution partnerships, as well as its relationships with independent agents and brokers. The tables below present the Company's revenue by distribution channel for the years ended December 31, 2025, 2024, and 2023:
Year ended December 31, 2025
Agent
Direct
Total
in thousands
Commission and fee revenue
$
241,080
$
192,611
$
433,691
Contingent commission
28,105
24,580
52,685
Total commission and fee revenue
$
269,185
$
217,191
$
486,376
Year ended December 31, 2024
Agent
Direct
Total
in thousands
Commission and fee revenue
$
210,052
$
171,252
$
381,304
Contingent commission
23,228
18,708
41,936
Total commission and fee revenue
$
233,280
$
189,960
$
423,240
Year ended December 31, 2023
Agent
Direct
Total
in thousands
Commission and fee revenue
$
158,354
$
131,178
$
289,532
Contingent commission
42,408
33,572
75,980
Total commission and fee revenue
$
200,762
$
164,750
$
365,512
Refer to Note 16 — Reinsurance for information regarding "Earned premium, net", Note 5 — Investments for information regarding "Net investment income" and "Net investment gains", and Note 7 — Notes Receivable for information regarding "Finance revenue".
5 — Investments
The Company holds a diversified investment portfolio, consisting of fixed maturity securities and, to a much lesser extent, equity securities, with the fixed maturity securities classified as available-for-sale.
The following tables summarize the Company's available-for-sale investments as of December 31, 2025 and 2024:
The following table summarizes gross unrealized losses and the estimated fair value of available-for-sale fixed maturity securities that have continuously been in an unrealized loss position, as well as the length of time that such securities were in an unrealized loss position, as of December 31, 2025:
December 31, 2025
Less than 12 months
12 months or longer
Total
Estimated fair value
Gross unrealized losses
Estimated fair value
Gross unrealized losses
Estimated fair value
Gross unrealized losses
Fixed maturity securities:
in thousands
Corporate
$
6,307
$
(7)
$
9,461
$
(108)
$
15,768
$
(115)
U.S. Treasury
35,150
(83)
14,948
(78)
50,098
(161)
States and municipalities
880
(3)
—
—
880
(3)
Foreign
17,009
(62)
—
—
17,009
(62)
Asset-backed securities
1,771
(5)
1,881
(37)
3,652
(42)
Mortgage-backed securities
10,312
(4)
20,889
(279)
31,201
(283)
Total fixed maturity securities
$
71,429
$
(164)
$
47,179
$
(502)
$
118,608
$
(666)
The Company regularly reviews all fixed maturity securities within its investment portfolio to determine whether a credit loss has occurred. Based on the Company's review as of December 31, 2025, unrealized losses were a result of interest rate changes, not a decline in the creditworthiness of the issuers. Accordingly, no allowance for credit loss was recorded as of December 31, 2025.
As of December 31, 2024, no credit loss allowance was recorded and all unrealized losses on available-for-sale fixed maturity securities were in such position for less than one year.
Contractual maturities of available-for-sale fixed maturity securities
The following table summarizes the contractual maturities of the Company's available-for-sale investments as of December 31, 2025:
Amortized Cost
Estimated Fair Value
in thousands
Due in one year or less
$
132,244
$
132,772
Due after one year through five years
272,887
276,170
Due after five years through ten years
99,958
101,510
Due after ten years
472
471
Mortgage-backed and asset-backed securities
182,252
185,348
Total fixed maturity securities
$
687,813
$
696,271
Expected maturities may differ from contractual maturities because borrowers may have the right to call or prepay obligations with or without call or prepayment penalties.
Net investment income
The following table presents the components of net investment income, which is recorded within "Net investment income" in the Consolidated Statements of Operations, for the years ended December 31, 2025, 2024, and 2023:
Year ended December 31,
2025
2024
2023
Interest income:
in thousands
Cash and cash equivalents and restricted cash and cash equivalents
$
9,585
$
22,080
$
26,457
Fixed maturity securities
29,407
17,395
447
Total interest income
38,992
39,475
26,904
Dividends on equity securities
218
98
—
Gross investment income
39,210
39,573
26,904
Investment expenses
(562)
(324)
—
Net investment income
$
38,648
$
39,249
$
26,904
Net realized and unrealized gains (losses) on investments
The table below presents the components of pre-tax "Net investment gains" in the Consolidated Statements of Operations, and the pre-tax change in net unrealized gains (losses) included in the Consolidated Statements of Comprehensive Income for the years ended December 31, 2025 and 2024. The gross amounts of realized investment gains and losses on fixed maturity securities were not material to the Consolidated Financial Statements and are presented on a net basis in the table below:
Year ended December 31,
2025
2024
Fixed maturity securities:
in thousands
Net realized investment gains
$
386
$
927
Equity securities:
Total change in fair value of equity securities
2,678
1,296
Net investment gains
$
3,064
$
2,223
Change in net unrealized gains (losses) on available-for-sale investments included in Other comprehensive income (loss):
Fair value measurements are classified within one of three levels in the fair value hierarchy. The level assigned to a fair value measurement is based on the lowest level input that management judges to be significant to the fair value measurement in its entirety.
The three levels of the fair value hierarchy are as follows:
•Level 1 — Quoted prices are available in active markets for identical assets or liabilities as of the reporting date. Active markets are those in which transactions for the asset or liability occur with sufficient frequency and volume to provide pricing information on an ongoing basis.
•Level 2 — Pricing inputs are other than quoted prices in active markets, which are either directly or indirectly observable as of the reporting date for substantially the full term of the asset or liability.
•Level 3 — Pricing inputs are unobservable, but management believes that such inputs are predicated on the assumptions market participants would use to measure the asset or liability at fair value.
The Company's policy is to recognize significant transfers between levels, if any, at the end of the reporting period. There were no transfers between levels during the current and prior reporting periods.
Investments
Fixed maturity securities are classified as Level 2 within the fair value hierarchy and equity securities are classified as Level 1. The fair value of these investments is determined after considering various sources of information, including information provided by a third-party pricing service, which provides prices for substantially all of the Company's fixed maturity securities and equity securities. In determining fair value, the Company generally does not adjust the prices obtained from the pricing service. The Company obtains an understanding of the pricing service's valuation methodologies and related inputs, which include, but are not limited to, reported trades, benchmark yields, issuer spreads, bids, offers, duration, credit ratings, estimated cash flows, and prepayment speeds.
Refer to Note 5 — Investments for additional information related to the Company's investment portfolio.
Interest rate swap
In December 2020, the Company entered into an interest rate swap with an original notional amount of $35.0 million, a fixed swap rate of 0.81%, and a maturity date in December 2025. The interest rate swap was designated as a cash flow hedge and the Company formally documented the relationship between the interest rate swap and its variable rate borrowings, as well as its risk management objective and strategy for undertaking the hedge transaction. The Company also assessed whether the interest rate swap was highly effective in offsetting variability in the cash flows of its variable rate borrowings. The hedge was deemed highly effective at inception and on an ongoing basis; therefore, any changes in fair value were recorded within "Change in unrealized loss on interest rate swap" in the Consolidated Statements of Comprehensive Income. The differential paid or received on the interest rate swap agreement was recognized as an adjustment to interest expense within "Interest expense and other, net" in the Consolidated Statements of Operations.
In the second quarter of 2024, the Company reduced its borrowings under the Prior JPM Credit Facility (as defined in Note 18 — Debt) below the $35.0 million notional amount of the interest rate swap and, as a result, the interest rate swap was settled prior to its maturity date.
The interest rate swap was classified as Level 2 within the fair value hierarchy. The significant inputs used to determine the fair value of the interest rate swap, such as the Secured Overnight Financing Rate ("SOFR") forward curve, are considered observable market inputs.
Warrant liabilities
The Company's Public Warrants were classified as Level 1 within the fair value hierarchy as they were measured utilizing quoted market prices. The Company's Private Warrants, Underwriter Warrants, OTM Warrants, and PIPE Warrants were classified as Level 3 within the fair value hierarchy. The Company utilized a Monte Carlo simulation model to measure the fair value of the Level 3 warrants. The Monte Carlo simulation model included assumptions related to the expected stock price volatility, expected term, dividend yield, and risk-free interest rate.
In July 2024, the Company completed an exchange offer under which holders of the Company's warrants were issued 3,876,201 shares of Class A Common Stock in exchange for 19,483,539 warrants, with a nominal cash settlement paid in lieu of fractional shares (the "Warrant Exchange"). No warrants remained outstanding following the completion of the Warrant Exchange.
The Company recorded increases to "Class A Common Stock" and "Additional paid-in capital" on the Consolidated Balance Sheets, representing the $42.6 million fair value of the Class A Common Stock that was issued in connection with the Warrant Exchange. The difference between the fair value of the warrants immediately prior to the Warrant Exchange and the fair value of Class A Common Stock issued resulted in a $2.0 million loss, which is reflected within "Loss (gain) related to warrant liabilities, net" in the Consolidated Statements of Operations.
The following table presents a reconciliation of the Company's warrant liabilities that were classified as Level 3 within the fair value hierarchy for the year ended December 31, 2024:
Private Warrants
Underwriter Warrants
OTM Warrants
PIPE Warrants
Total
in thousands
Balance at December 31, 2023
$
476
$
53
$
3,981
$
20,020
$
24,530
Change in fair value of warrant liabilities
55
5
546
4,056
4,662
Warrant Exchange
(531)
(58)
(4,527)
(24,076)
(29,192)
Balance at December 31, 2024
$
—
$
—
$
—
$
—
$
—
Summary of assets and liabilities measured at fair value
The fair values of the Company's financial assets as of December 31, 2025 and 2024 are shown in the following tables:
Estimated Fair Value as of December 31, 2025
Total
Level 1
Level 2
Level 3
in thousands
Investments:
Corporate
$
266,168
$
—
$
266,168
$
—
U.S. Treasury
181,617
—
181,617
—
States and municipalities
30,146
—
30,146
—
Foreign
32,992
—
32,992
—
Asset-backed securities
32,251
—
32,251
—
Mortgage-backed securities
153,097
—
153,097
—
Common stocks
34,871
34,871
—
—
Total
$
731,142
$
34,871
$
696,271
$
—
Estimated Fair Value as of December 31, 2024
Total
Level 1
Level 2
Level 3
in thousands
Investments:
Corporate
$
231,189
$
—
$
231,189
$
—
U.S. Treasury
145,875
—
145,875
—
States and municipalities
31,585
—
31,585
—
Foreign
21,057
—
21,057
—
Asset-backed securities
23,680
—
23,680
—
Mortgage-backed securities
124,302
—
124,302
—
Common stocks
11,839
11,839
—
—
Total
$
589,527
$
11,839
$
577,688
$
—
7 — Notes Receivable
Broad Arrow Capital
BAC provides financing solutions to qualified collectors and businesses by structuring loans secured by collector cars. The loans underwritten by BAC include term loans and short-term bridge loans. The loans underwritten by BAC are recorded within "Notes receivable" on the Consolidated Balance Sheets.
Loans carry either a fixed or variable rate of interest and typically require periodic interest payments over the life of the loan with the principal amount due at maturity. Loans have an initial maturity of up to two years, often with an option for the borrower to renew for one year increments, provided the borrower remains in good standing, including maintaining a specified targeted LTV ratio for the loan. As of December 31, 2025, the loans underwritten by BAC were classified as Level 3 within the fair value hierarchy, with the carrying values of the loans approximating their fair values due to the relatively short-term maturities and the variable interest rates associated with most loans. The lending activities of BAC are funded, in part, with borrowings drawn from the BAC Credit Facility, with the remainder funded by the Company's available liquidity. Refer to Note 18 — Debt for additional information regarding the BAC Credit Facility.
BAC aims to mitigate the risk associated with a potential devaluation in collateral by targeting an LTV ratio of 65% or less (i.e., the principal loan amount divided by the estimated value of the collateral at the time of underwriting). The LTV ratio is reassessed on a quarterly basis or if the loan is renewed. The LTV ratio is reassessed more frequently if there is a material change in the circumstances related to the loan, including if there is a material change in the value of the collateral, a material change in the borrower's disposal plans for the collateral, or if an event of default occurs. If, as a result of this reassessment, the LTV ratio increases above the target level, the borrower may be asked to make principal payments and/or post sufficient additional collateral to reduce the LTV ratio as a condition of future financing, renewal, or to avoid a default. In the event of a default by a borrower, BAC is entitled to sell the collateral to recover the outstanding principal, accrued interest balance, and any expenses incurred with respect to the recovery process.
Management considers the valuation of the underlying collateral and the LTV ratio to be the two most critical credit quality indicators for the loans made by BAC. In estimating the value of the underlying collateral for BAC's loans, management utilizes its expertise in the collector car market and considers an array of factors impacting the current and expected sale value of each car including the year, make, model, mileage, history, and in the case of classic cars, the provenance, quality of restoration (if applicable), the originality of the body, chassis, and mechanical components, and comparable market transaction values.
The repayment of BAC's loans can be adversely impacted by a borrower's deteriorating financial circumstances, a decline in the collector car market in general or in the value of the collateral, which may be concentrated within certain marques, vintages, or types of cars. In addition, in situations when BAC's claim on the collateral is subject to a legal dispute, the ability to realize proceeds from the collateral may be limited or delayed.
As of December 31, 2025 and 2024, BAC's netnotes receivable balance was approximately $104.3 million and $57.0 million, respectively, including accrued interest.
The table below provides the aggregate LTV ratio for BAC's loan portfolio as of December 31, 2025 and 2024:
December 31,
2025
2024
in thousands
Secured loans
$
103,338
$
56,972
Estimate of collateral value
$
199,628
$
95,778
Aggregate LTV ratio
51.8
%
59.5
%
Management considers a loan to be past due when an interest payment is not paid within 10 business days of the monthly due date, or if the principal amount is not repaid by the contractual maturity date. Typically, a loan becomes past due only for a short period of time during which the loan is renewed or collateral is sold to satisfy the borrower's obligations. As of December 31, 2025 and 2024, the amount of past due principal and interest payments was not material.
A non-accrual loan is a loan for which future finance revenue is not recorded due to management's determination that it is probable that future interest on the loan will not be collectible. When a loan is placed on non-accrual status, any accrued interest receivable deemed not collectible is reversed against finance revenue. Any cash receipts subsequently received on non-accrual loans are first applied to reduce the recorded principal balance of the loan, with any proceeds in excess of the principal balance then applied to interest and expenses owed by the borrower. As of December 31, 2025 and 2024, there were no non-accrual loans.
As of December 31, 2025 and 2024, the allowance for expected credit losses related to the BAC loan portfolio was not material based on management's quarterly evaluation, which takes into consideration a number of factors including the level of historical losses for similar loans, the quality of the collateral, the LTV ratio of the loans, management's overall assessment of the current circumstances and risks related to each loan, and, to a lesser extent, the circumstances related to each borrower.
From time-to-time, Broad Arrow provides short-term financing to its auction or private sale buyers where the terms or length of financing may not qualify and/or is too short to fund efficiently with a BAC loan. The resulting loans are typically interest-bearing with required periodic interest payments and, in certain cases, required periodic principal payments while retaining a security interest in the vehicle(s). As of December 31, 2025, the related outstanding Notes receivable balance was $8.9 million.
Broad Arrow also makes consignor advances secured by vehicle(s) that are contractually committed, in the near term, to be offered for sale at auction or as a private sale. Consignor advances allow sellers to receive funds upon consignment for an auction or for a private sale that will occur up to one year in the future and normally have short-term maturities. In the event the vehicle(s) are not successfully sold at auction or in a private sale, the consignor is required to repay the outstanding principal and accrued interest of the advance or convert the advance to a BAC loan. As of December 31, 2025, the outstanding Notes receivable balance associated with consignor advances was $0.1 million.
Under certain circumstances, Broad Arrow also provides loans to certain well-established car dealers to finance the purchase of vehicle(s), retaining a security interest in the purchased vehicle. In certain situations, Broad Arrow acquires a partial ownership interest in the vehicle(s) in addition to providing the loan. Upon the eventual sale of the acquired vehicle(s), the loan is repaid and Broad Arrow retains a pro rata share of the profit(s) or loss(es). As of December 31, 2025, this outstanding Notes receivable balance was $0.6 million.
These loans are classified in the Consolidated Statements of Cash Flows within Operating Activities as they are made in support of Broad Arrow's auction and private sale activities.
Concentration Risk
As of December 31, 2025, there was one borrower with a loan balance that exceeded 10% of the total notes receivable balance, with a loan of $13.8 million representing 12.1% of the total balance. As of December 31, 2025, the collateral value related to this loan was $23.9 million, with a LTV ratio of 57.6%.
8 — Deferred Acquisition Costs
The following table presents a reconciliation of the changes in deferred acquisition costs for the years ended December 31, 2025, 2024, and 2023:
As of December 31, 2025 and 2024, other assets consisted of:
December 31,
2025
2024
in thousands
Prepaid SaaS implementation costs
$
56,971
$
41,110
Prepaid sales, general and administrative expenses
20,707
20,134
Inventory (1)
12,410
18,484
Property and equipment, net
16,253
18,205
Lease right-of-use assets (2)
40,657
44,485
Other investments (3)
10,135
10,312
Contract costs
9,965
9,399
Accrued investment income
5,613
4,827
Deferred financing costs related to revolving credit facilities
3,707
3,489
Other (4)
5,331
9,464
Other assets
$
181,749
$
179,909
(1) Inventory primarily includes vehicles owned by Broad Arrow that have been purchased for resale purposes.
(2) Refer to Note 10 — Leases for additional information.
(3) Other investments includes strategic investments, which are classified as Level 3 within the fair value hierarchy. Based on the nature and size of these investments, the carrying values are approximately fair value.
(4) As of December 31, 2025, Other primarily included $2.7 million of collector vehicle investments, $1.4 million related to capitalized digital media content, and $1.0 million of business tax recoverables. As of December 31, 2024, Other primarily included $2.5 million of collector vehicle investments, $2.2 million related to capitalized digital media content, and a $2.0 million tax receivable.
10 — Leases
The following table summarizes the components of the Company's operating lease expense for the years ended December 31, 2025, 2024, and 2023:
Year ended December 31,
2025
2024
2023
in thousands
Operating lease expense (1)
$
8,911
$
8,053
$
11,681
Variable lease expense (1) (2)
3,641
3,570
4,685
Sublease revenue (3)
(1,062)
(1,283)
(704)
Lease cost, net
$
11,490
$
10,340
$
15,662
(1) Classified within "General and administrative expenses" in the Consolidated Statements of Operations.
(2) Includes maintenance, taxes, insurance, and payments affected by the CPI.
(3) Classified within "Membership and other revenue" in the Consolidated Statements of Operations.
The following table summarizes supplemental balance sheet information related to operating leases as of December 31, 2025 and 2024:
December 31,
2025
2024
in thousands
ROU assets obtained in exchange for new operating lease liabilities
The following table summarizes information about the amount and timing of the Company's future operating lease commitments as of December 31, 2025:
in thousands
2026
$
8,979
2027
8,526
2028
8,453
2029
6,672
2030
5,379
Thereafter
17,396
Total lease payments
55,405
Less: imputed interest
(9,723)
Total lease liabilities
$
45,682
11 — Acquisition
In September 2024, the Company's subsidiary, Hagerty Insurance Holdings, Inc., acquired all of the issued and outstanding capital stock of Consolidated National Insurance Company ("CNIC") for a purchase price of $19.3 million, including $0.9 million in direct and incremental transaction costs. CNIC was a shell company holding certain state licenses and was renamed Drivers Edge Insurance Company following the acquisition.
The acquisition of Drivers Edge was accounted for as an asset acquisition with the $19.3 million purchase price allocated to certain state licenses ($11.3 million), cash and cash equivalents ($3.9 million), restricted fixed maturity securities ($3.7 million), and restricted cash and cash equivalents ($0.4 million).
In the third quarter of 2025, Drivers Edge launched Enthusiast+ in Colorado. Enthusiast+ is a new insurance product tailored for modern enthusiast vehicles that are typically driven more frequently and stored more flexibly than traditional collector cars. This product evolved from the Company's growing exposure to modern enthusiast vehicles and is designed to broaden its addressable market by offering coverage to a wider range of vehicles and customer profiles. The entirety of the risk underwritten by our U.S. MGA subsidiary on behalf of Drivers Edge is ceded to Hagerty Re.
12 — Divestitures
In 2023, management began a review of certain components of the Company's operations which resulted in the sale or reorganization of certain businesses, including Hagerty Garage + Social, DriveShare, and Motorsport Reg ("MSR"), as discussed below. This initiative supports the Company's strategy to prioritize investments and resources in the areas of its business that offer the strongest growth and profit potential.
Hagerty Garage + Social
In the third quarter of 2023, Hagerty Ventures LLC ("HV"), a wholly owned subsidiary of THG, entered into an agreement with HGS Hub Holdings LLC ("H3") to terminate the joint venture agreement governing Member Hubs Holding, LLC ("MHH"), which operates as Hagerty Garage + Social. In connection with this agreement, H3's approximately 20% equity interest in MHH was redeemed and MHH's equity interests in the Palm Beach, Florida and Redmond, Washington locations of Hagerty Garage + Social were distributed to H3. Following the termination of the joint venture agreement, HV owns 100% of MHH and its remaining Hagerty Garage + Social locations in Delray Beach, Florida; Miami, Florida; Van Nuys, California; and Burlington, Ontario.
As a result of the joint venture termination, the Company recognized a loss of $2.9 million in the third quarter of 2023, representing the difference between the fair value of the approximately 20% equity interest in MHH received by HV and the carrying value of the equity interests distributed to H3. The fair value of the approximately 20% equity interest received by MHH is a Level 3 fair value measurement and was determined using a combination of a discounted cash flow model and the adjusted book value method. This loss is recorded within "Gains, losses, and impairments related to divestitures" in the Consolidated Statements of Operations.
Immediately prior to the joint venture termination, MHH entered into an agreement to terminate the real estate lease held by the Culver City, California location of Hagerty Garage + Social. In connection with this lease termination agreement, MHH paid a termination fee funded by the Company and H3 in exchange for the extinguishment of its remaining obligations under the lease. As a result of this lease termination, the Company recognized a loss of $0.6 million in the third quarter of 2023, consisting of the lease termination fee paid to the landlord, partially offset by the net effect of the derecognition of the assets and liabilities related to the lease. This loss is reported within "Gains, losses, and impairments related to divestitures" in the Consolidated Statements of Operations. Following this lease termination, MHH no longer operates a Hagerty Garage + Social location in Culver City, California.
Hagerty DriveShare
In the third quarter of 2023, THG entered into an agreement to sell Hagerty DriveShare, LLC ("DriveShare"), a peer-to-peer rental platform for collector vehicles, to a third party. The sale was completed on October 9, 2023. The Company recognized a $0.4 million loss related to this sale in the third quarter of 2023, which was recorded within "Gains, losses, and impairments related to divestitures" in the Consolidated Statements of Operations.
Motorsport Reg
In the second quarter of 2024, THG sold substantially all of the assets and liabilities of MSR, a motorsport membership, licensing and event online management system, to a third party. The material elements of the sale consideration include a fixed purchase price and a contingent payment opportunity, based on future performance. The Company recognized a $0.1 million gain related to the sale of MSR, which was recorded within "Gains, losses, and impairments related to divestitures" in the Consolidated Statements of Operations.
13 — Restructuring, Impairment, and Related Charges
In 2023, the Board approved a reduction in force (the "2023 RIF") following a strategic review of business processes as the Company focuses on driving efficiencies in order to achieve growth and profitability goals. As a result of these actions, the Company recognized $5.4 million of severance-related costs and a $0.4 million impairment charge to write-down the value of certain digital media content assets. In addition, the Company recognized $3.1 million of charges associated with operating lease ROU assets and leasehold improvements for office space that was vacated and listed for sublease in the period as a result of the actions taken by management. As of December 31, 2023, all liabilities associated with the 2023 RIF have been settled.
14 — Goodwill and Intangible Assets
Goodwill
As of December 31, 2025 and 2024 goodwill was $114.2 million and $114.1 million, respectively, with the year-over-year change the result of changes in foreign currency exchange rates.
Intangible Assets
The cost and accumulated amortization of intangible assets as of December 31, 2025 and 2024 are as follows:
December 31, 2025
Weighted average useful life
Gross carrying amount
Accumulated amortization
Net carrying amount
in thousands
Internally developed software
3.4
$
155,933
$
(102,326)
$
53,607
Renewal rights
10.0
21,740
(10,693)
11,047
Trade names and trademarks
14.2
11,867
(4,402)
7,465
State licenses (1)
Indefinite
11,263
—
11,263
Relationships and customer lists
15.5
7,913
(2,380)
5,533
Other
3.5
580
(580)
—
Total intangible assets
$
209,296
$
(120,381)
$
88,915
(1) Represents certain state licenses related to the acquisition of Drivers Edge. Refer to Note 11 — Acquisition for additional details.
(1) Represents certain state licenses related to the acquisition of Drivers Edge. Refer to Note 11 — Acquisition for additional details.
Intangible asset amortization expense was $23.5 million, $26.7 million, and $28.6 million for the years ended December 31, 2025, 2024, and 2023, respectively.
Estimated future aggregate amortization expense related to intangible assets as of December 31, 2025 is as follows:
in thousands
2026
$
23,559
2027
21,093
2028
15,450
2029
6,292
2030
2,615
Thereafter
8,643
Total
$
77,652
15 — Reserves for Unpaid Losses and Loss Adjustment Expenses
The following table presents reserves for unpaid losses and loss adjustment expenses as of December 31, 2025 and 2024:
December 31,
2025
2024
in thousands
Case reserves
$
90,992
$
94,489
IBNR
72,215
68,234
Net reserves for unpaid losses and loss adjustment expenses
163,207
162,723
Reinsurance recoverable on unpaid losses and loss adjustment expenses
5,644
5,769
Gross reserves for unpaid losses and loss adjustment expenses
The following table presents a reconciliation of the beginning and ending reserves for unpaid losses and loss adjustment expenses, net of amounts recoverable from various reinsurers:
Year ended December 31,
2025
2024
2023
in thousands
Gross reserves for unpaid losses and loss adjustment expenses, beginning
$
168,492
$
136,507
$
111,741
Less: Reinsurance recoverable on unpaid losses and loss adjustment expenses
5,769
2,235
843
Net reserves for unpaid losses and loss adjustment expenses, beginning
162,723
134,272
110,898
Incurred losses and loss adjustment expenses:
Current accident year
295,481
299,918
228,358
Prior accident years
(10,087)
(1,325)
(7,700)
Total incurred losses and loss adjustment expenses
285,394
298,593
220,658
Payments:
Current accident year
190,881
186,267
138,263
Prior accident years
94,244
83,660
59,128
Total payments
285,125
269,927
197,391
Effect of foreign currency rate changes
215
(215)
107
Net reserves for unpaid losses and loss adjustment expenses, ending
163,207
162,723
134,272
Reinsurance recoverable on unpaid losses and loss adjustment expenses
5,644
5,769
2,235
Gross reserves for unpaid losses and loss adjustment expenses, ending
$
168,851
$
168,492
$
136,507
During the year ended December 31, 2025, loss experience developed favorably, driven by reductions in severity of U.S. auto liability claims, and lower frequency of claims, which is in-part driven by lower catastrophe losses as compared to previous years. In addition, in 2025, accident year 2024 developed favorably by $13.6 million due to favorable loss development in severity of both U.S. auto physical damage and liability claims. This favorable development was partially offset by $3.1 million of unfavorable development which was spread across accident years prior to 2024.
During the year ended December 31, 2024, losses and loss adjustment expenses include $23.0 million of pre-tax losses related to Hurricane Helene and $3.7 million of pre-tax losses related to Hurricane Milton. However, in 2024, accident years 2017 through 2022 developed favorably by $4.3 million primarily due to better than expected loss development in U.S. auto physical damage claims. This favorable development was partially offset by $3.0 million of adverse development for the 2023 accident year due to the reevaluation and adjustment of certain actuarial assumptions based on observed trends.
Reserving Methodology
The Company records an estimate of quarterly losses and loss adjustment expenses in the Consolidated Statements of Operations using an annual loss ratio, which is based on statistical analysis performed by the Company's internal and external actuarial teams that consider several factors, including projected levels of catastrophe events. The annual loss ratio is reviewed throughout the year and adjusted, as necessary. Management believes this approach provides a more consistent view of loss experience over the year given the seasonality of the Company's business.
The reserves for unpaid losses and loss adjustment expenses recorded on the Consolidated Balance Sheets represents (i) the difference between management's estimate of the ultimate cost of losses and loss adjustment expenses incurred by the Company; and (ii) the amount of paid losses as of the reporting date. These reserves reflect management's best estimate of unpaid losses related to reported claims and IBNR claims and also include management's best estimate of all expenses associated with processing and settling reported and unreported claims.
Reserves are reviewed by management quarterly and periodically throughout the year by combining historical results and current actual results. Claims are analyzed and reported based on the year in which the loss occurred (i.e., on an accident year basis). Accident year data is classified and utilized within actuarial models to prepare estimates of required reserves for payments to be made in the future.
When estimating reserves, the Company utilizes several actuarial reserving methods which consider historical claim reporting patterns, claim cycle time, claim frequency and severity, claims settlement practices, adequacy of case reserves over time, seasonality, and current economic conditions. Reserve estimates produced by various actuarial reserving methods are further analyzed to determine the actuarial central estimate which represents the expected value over the range of reasonably possible outcomes.
The factors considered by management in estimating the provision for unpaid losses and loss adjustment expenses as of December 31, 2025 and 2024 include the following:
•the views of the Company's actuaries;
•historical trends in claim frequency and severity, including the impacts of adverse weather-related events;
•changes in claim cycle time and claim settlement practices;
•observed industry trends;
•the changing mix of business, predominantly due to the large growth in modern collectible cars which carry a different risk profile than the risks associated with collector cars;
•inflation or deflation;
•retention limits under current catastrophe and treaty reinsurance programs; and
•legislative and judicial changes in the jurisdictions in which the Company operates.
The following factors are relevant to the additional information included in the tables below:
•Table organization: The tables are organized by accident year and include policies written on an occurrence basis.
•Groupings: Reserves for losses and loss adjustment expenses are grouped by line of business. The Company believes that losses included in each line of business have homogenous risk characteristics with similar development patterns and would generally be subject to similar trends.
•Claim counts: The Company considers a reported claim to be one claim for each claimant for each loss occurrence.
•Limitations: There are limitations that should be considered on the reported claim count data in the tables below, including that claim counts are presented only on a reported (not an ultimate) basis.
The following table presents auto insurance incurred losses and loss adjustment expenses, by accident year, undiscounted and net of reinsurance recoveries:
Reserves for Losses and Loss Adjustment Expenses Incurred But Not Reported
Cumulative Number of Reported Claims
Reporting Years Ended December 31,
Accident Year
2021*
2022*
2023*
2024*
2025
As of December 31, 2025
dollars in thousands
2021
$
131,643
$
129,259
$
125,634
$
125,434
$
125,834
$
683
35,529
2022
186,073
182,783
179,096
180,218
2,379
39,488
2023
228,071
231,209
232,748
5,205
42,459
2024
299,766
286,194
15,098
43,735
2025
295,130
47,149
39,860
Total
1,120,124
70,514
201,071
Cumulative paid losses and loss adjustment expenses from the table below
(959,584)
—
Reserves for losses and loss adjustment expenses before 2021, net of reinsurance
2,247
1,478
Cumulative effect of foreign currency rate changes
91
—
Reserves for losses and loss adjustment expenses, undiscounted and net of reinsurance
$
162,878
$
71,992
* Unaudited required supplemental information.
The following table presents auto insurance cumulative paid losses and loss adjustment expenses by accident year:
As of December 31,
Accident Year
2021*
2022*
2023*
2024*
2025
in thousands
2021
$
75,933
$
105,475
$
114,884
$
120,094
$
123,029
2022
109,255
155,157
167,200
174,400
2023
138,102
202,501
219,217
2024
186,165
252,153
2025
190,785
Total
$
959,584
* Unaudited required supplemental information.
The following table presents supplementary information about average historical claims duration as of December 31, 2025 based on the cumulative incurred and paid losses and allocated loss adjustment expenses presented above:
Average Annual Percentage of Payout of Incurred Claims by Age (in Years), Net of Reinsurance (Unaudited)
Hagerty Re assumes risk through quota share reinsurance agreements with various insurance carriers, including a subsidiary of Markel, a related party. Separately, the Company purchases excess-of-loss ("XOL") reinsurance to manage risk exposure and safeguard capital. In addition, the Company enters into quota share reinsurance agreements under which it cedes a portion of its underwriting risk to highly rated reinsurers, thereby limiting the financial impact of potential losses. These reinsurance arrangements do not relieve the Company of its primary obligations to policyholders under the terms of its insurance contracts. The Company partners with reinsurers that are rated A- (Excellent) or better by A.M. Best or that fully collateralize their maximum obligations under the applicable agreements.
In an XOL agreement, the Company retains losses for any occurrence up to a specified amount (its "retention"), with reinsurers covering any losses exceeding that threshold up to a defined limit. In a quota share agreement, the Company transfers, or cedes, a percentage of its premiums to reinsurers and, in return, the assuming reinsurer must share an equal percentage of losses and pay a ceding commission to the Company consistent with the terms of the agreement. Ceding commissions are recognized ratably over the terms of the related policies, which are generally 12 months, and are recorded within "Ceding commissions, net" in the Consolidated Statements of Operations. Deferred portions of ceding commissions received are included in "Deferred acquisition costs, net" on the Consolidated Balance Sheets.
Hagerty Re renegotiated its catastrophe reinsurance coverage effective January 1, 2026, with terms similar to 2025. The 2026 catastrophe reinsurance program affords coverage for policies with total insured values ("TIV") of up to $5.0 million in excess of a per event retention of $35.0 million in two layers; $35.0 million excess of $35.0 million, and $63.0 million excess of $70.0 million.
In addition to the Company's XOL reinsurance, Hagerty Re cedes 100% of its physical damage exposure on U.S. policies written or renewed with TIV equal to or greater than $5.0 million ("High-Net-Worth Accounts") via quota share agreements with various reinsurers. Hagerty Re receives ceding commissions related to premiums ceded under reinsurance contracts related to these High-Net-Worth Accounts. These High-Net-Worth Accounts are assumed 100% from a wholly owned subsidiary of Markel. Certain reinsurers involved in these quota share agreements are related parties. Hagerty Re also purchases facultative reinsurance to cede a portion of the physical damage exposure related to certain high value vehicles.
Refer to Note 24 — Related-Party Transactions for additional information on reinsurance transactions with Markel and State Farm.
The following table presents the Company's total premiums assumed and ceded on a written and earned basis for the years ended December 31, 2025, 2024, and 2023:
Year ended December 31,
2025
2024
2023
Premiums written:
in thousands
Assumed
$
830,645
$
726,971
$
636,366
Ceded
(53,308)
(50,541)
(33,070)
Net
$
777,337
$
676,430
$
603,296
Premiums earned:
Assumed
$
776,625
$
685,763
$
554,553
Ceded
(49,899)
(42,439)
(22,687)
Net
$
726,726
$
643,324
$
531,866
The following table presents total loss and loss adjustment expenses assumed and ceded for the years ended December 31, 2025, 2024, and 2023:
The following table presents the reinsurance recoverable on paid and unpaid losses and loss adjustment expenses as of December 31, 2025 and 2024:
December 31,
2025
2024
in thousands
Reinsurance recoverable on paid losses and loss adjustment expenses
$
9,652
$
6,158
Reinsurance recoverable on unpaid losses and loss adjustment expenses
5,644
5,769
Total reinsurance recoverable
$
15,296
$
11,927
17 — Statutory Capital and Surplus
Hagerty Re
Dividend Restrictions — Under Bermuda law, Hagerty Re is prohibited from declaring or issuing a dividend if it fails to meet its minimum solvency margin or minimum liquidity ratio. Prior approval from the Bermuda Monetary Authority ("BMA") is also required if Hagerty Re's proposed dividend payments would exceed 25% of its prior year-end total statutory capital and surplus. The amount of dividends which could be paid in 2026 without prior BMA approval is $95.4 million; however, the amount that Hagerty Re can pay in dividends is further limited by the amount of unrestricted cash and liquid investments held outside of restricted accounts, which totaled $65.6 million as of December 31, 2025.
Capital Restrictions — In Bermuda, Hagerty Re is subject to the Bermuda Solvency Capital Requirement ("BSCR"), which is administered by the BMA. No regulatory action is taken by the BMA if an insurer's capital and surplus is equal to or in excess of its enhanced capital requirement, as determined by the BSCR model. In addition, the BMA has established a target capital level for each insurer, which is 120% of the enhanced capital requirement. Hagerty Re maintained sufficient statutory capital and surplus to comply with the BCSR as of December 31, 2025.
Statutory Financial Information — Hagerty Re prepares its statutory financial statements in conformity with the accounting principles set forth in the Bermuda Insurance Act 1978, amendments thereto and related regulations. As of December 31, 2025 and 2024, the general business statutory capital and surplus of Hagerty Re was $381.6 million and $271.5 million, respectively. Statutory capital and surplus as of December 31, 2025 and 2024 included $24.5 million of "Other Fixed Capital" represented by the State Farm Term Loan to Hagerty Re (as defined in Note 18 — Debt). The general business statutory Net income of Hagerty Re was $110.1 million, $53.1 million, and $62.3 million for the years ended December 31, 2025, 2024, and 2023, respectively.
Drivers Edge
Dividend Restrictions — Drivers Edge is subject to the dividend restrictions set forth by the Colorado Division of Insurance (the "CDOI"). The CDOI limits the distribution of dividends to stockholders by property and casualty insurance companies in any year, without prior regulatory approval, to the lessor of (i) 10% of policyholders' surplus of the previous year-end; or (ii) net income for the prior year, minus realized capital gains, and minus any extraordinary dividends paid in the preceding twelve months. The amount of dividends which could be paid in 2026 without prior CDOI approval is $0.3 million.
Capital Restrictions — Drivers Edge is subject to National Association of Insurance Commissioners ("NAIC") Risk-Based Capital ("RBC") requirements, as adopted by the CDOI. The RBC requirements impose minimum statutory capital levels on insurance companies to ensure solvency for their policyholders. As of December 31, 2025, Drivers Edge exceeded its minimum statutory capital levels by $5.4 million.
Statutory Financial Information — In the U.S., state insurance laws and regulations prescribe accounting practices for determining statutory Net Income and Capital and Surplus for insurance companies. The CDOI has adopted the NAIC accounting practices as the basis of its Statutory Accounting Practices ("SAP"). No differences exist between the CDOI and NAIC guidance. Drivers Edge's statutory capital and surplus was $7.4 million and $7.1 million for the years ended December 31, 2025 and 2024, respectively. Statutory net income was $0.3 million and Statutory net loss was $3.0 million for the years ended December 31, 2025 and 2024, respectively.
As of December 31, 2025 and 2024, "Debt, net" consisted of the following:
December 31,
Maturity
2025
2024
in thousands
2025 JPM Credit Facility
March 2030
$
84,945
$
—
Prior JPM Credit Facility (1)
October 2026
—
50,296
BAC Credit Facility
December 2028
68,423
30,193
State Farm Term Loan
September 2033
25,000
25,000
Notes payable
—
792
Total debt
178,368
106,281
Less: Unamortized debt issuance costs related to the State Farm Term Loan
(461)
(521)
Debt, net
$
177,907
$
105,760
(1) The Prior JPM Credit Facility, originally scheduled to mature in October 2026, was terminated upon the execution of the 2025 JPM Credit Facility.
2025 JPM Credit Facility
In March 2025, THG entered into a credit agreement with JPMorgan Chase Bank, N.A. ("JPM"), as administrative agent, issuing bank and swingline lender, the foreign subsidiary borrowers thereto, and the other financial institutions party thereto as lenders (the "2025 JPM Credit Agreement").
The 2025 JPM Credit Agreement provides for a senior unsecured revolving credit facility (the "2025 JPM Credit Facility") with an aggregate borrowing capacity of $375.0 million. The 2025 JPM Credit Agreement includes (i) a $175.0 million sublimit for letters of credit; (ii) a $100.0 million sublimit for foreign currency borrowings; and (iii) an uncommitted accordion feature of $75.0 million, plus an unlimited amount so long as THG's net leverage ratio is below 3.25. The 2025 JPM Credit Agreement matures in March 2030, but may be extended if agreed to by THG and the lenders party thereto. Any unpaid balance on the 2025 JPM Credit Facility is due at maturity.
THG used borrowings from the 2025 JPM Credit Facility to repay in full all indebtedness, liabilities and other obligations outstanding under, and terminated, THG's prior credit agreement with JPM, as administrative agent, issuing bank and swingline lender, the foreign subsidiary borrowers party thereto, and the other financial institutions party thereto as lenders (the "Prior JPM Credit Agreement"). THG incurred approximately $1.0 million in fees for the 2025 JPM Credit Agreement, which, along with the remaining unamortized fees associated with the Prior JPM Credit Agreement, are being amortized over the agreement's five-year term.
Borrowings from the 2025 JPM Credit Facility accrue interest at the applicable reference rate, primarily Term SOFR, depending on the currency of the borrowing plus an applicable margin determined by the Company's net leverage ratio for the preceding period (as defined in the 2025 JPM Credit Facility). The effective interest rates related to the 2025 JPM Credit Agreement and the Prior JPM Credit Agreement were 5.57% and 6.75% for the years ended December 31, 2025 and 2024, respectively.
The 2025 JPM Credit Agreement requires THG to, among other things, meet certain financial covenants, including a minimum fixed charge coverage ratio test and a maximum leverage ratio test. As of December 31, 2025, THG was in compliance with these financial covenants.
As of December 31, 2025, the carrying value of the outstanding borrowings under the 2025 JPM Credit Facility approximated its fair value due to the variable interest rates associated with the outstanding borrowings.
BAC Credit Facility
BAC and its wholly owned subsidiary BAC Funding 2023-1, LLC, as borrower, have a revolving credit agreement (the "BAC Credit Agreement") that provides for a revolving credit facility (the "BAC Credit Facility"). On November 4, 2025, BAC and BAC Funding 2023-1, LLC, as borrower, amended the BAC Credit Agreement to, among other things, increase the aggregate commitment under the BAC Credit Facility from $75.0 million to $150.0 million. The BAC Credit Facility's borrowing base is determined by the carrying value of certain BAC notes receivable, which is then limited by the amount of the aggregate commitment. As of December 31, 2025, the applicable borrowing base for the BAC Credit Agreement was $68.4 million.
The revolving borrowing period of the BAC Credit Facility expires in November 2027, followed by an amortization period until it ultimately matures in November 2028. The borrowing period and the maturity date of the BAC Credit Facility may be extended by one year if requested by BAC and agreed by the administrative agent. BAC is not a borrower or guarantor of the BAC Credit Facility.
BAC and certain of its subsidiaries may transfer notes receivable to wholly owned, bankruptcy remote SPEs to secure borrowings under the BAC Credit Facility, isolating these assets from the Company's other obligations. Recourse is limited to (i) an obligation of the applicable seller to repurchase a note receivable if it is determined that there was a breach of any representation or warranty relating to such note receivable as of the relevant date specified in the related transfer agreement; and (ii) a limited guarantee for certain liabilities that may result under certain foreign exchange hedging activity of one of the SPEs.
BAC and BAC Funding 2023-1, LLC are required, among other things, to meet certain financial covenants including that BAC, as the servicer, maintain a minimum tangible net worth, minimum liquidity balances, and an indebtedness to tangible net worth ratio.As of December 31, 2025, the Company was in compliance with the financial covenants under the BAC Credit Agreement.
As of December 31, 2025, the carrying value of the outstanding borrowings under the BAC Credit Facility approximated its fair value due to the variable interest rates associated with the outstanding borrowings.
State Farm Term Loan
In September 2023, Hagerty Re entered into an unsecured term loan credit facility with State Farm in the aggregate principal amount of $25.0 million (the "State Farm Term Loan"). The State Farm Term Loan bears interest at a rate of 8.0% per annum and will mature in September 2033. State Farm is a related party to the Company. Refer to Note 24 — Related-Party Transactions for additional information.
Notes Payable
As of December 31, 2024, the Company had $0.8 million of outstanding notes payable, which were used to fund certain loans made by BAC in the United Kingdom ("U.K."). There were no notes payable outstanding as of December 31, 2025. Refer to Note 7 — Notes Receivable for additional information on the lending activities of BAC.
Letters of Credit
As of December 31, 2025, the Company has authorized three letters of credit for a total of $10.8 million for operational purposes, primarily related to Hagerty Re's Section 953(d) tax structuring election, and to a much lesser extent, a requirement under a quota share agreement, and lease down payment support.
19 — Convertible Preferred Stock
In June 2023, the Company entered into a Securities Purchase Agreement (the "Purchase Agreement") with certain accredited investors (the "Investors"), pursuant to which it closed, issued and sold (the "Closing") to the Investors an aggregate of 8,483,561 shares of the Company's newly-designated Series A Convertible Preferred Stock, par value $0.0001 per share, for an aggregate purchase price of $80.0 million, at a per-share purchase price of $9.43 (the "Series A Purchase Price" and the transaction, the "Private Placement").
The Investors include State Farm, Markel, and individuals related to HHC. State Farm and Markel each own over 5% of the Company's outstanding common stock. McKeel Hagerty, the Company's CEO and the Chairman of its Board, along with Tammy Hagerty, may be deemed to control HHC, the controlling stockholder of the Company. Both State Farm and Markel can nominate one director to the Board, while HHC can nominate two directors. Refer to Note 20 — Stockholders' Equity and Note 24 — Related-Party Transactions for additional information.
The net proceeds from the Private Placement after deducting issuance costs of approximately $0.8 million were $79.2 million, which was recorded within Temporary Equity on the Consolidated Balance Sheets. The Company used the net proceeds from the Private Placement for general corporate purposes.
As of December 31, 2025, the estimated redemption value of the Series A Convertible Preferred Stock was $109.2 million, which represents the maximum cash payment, including cumulative dividends, that would be required to be paid if the Optional Term Redemption provision in the Certificate of Designations, as summarized below, is exercised as of the earliest possible redemption date of June 23, 2028. The decision to redeem the Series A Convertible Preferred Stock for cash is made at the discretion of the Company; however, the Company is controlled by HHC through its voting control of the Company. Accordingly, the redemption of the Series A Convertible Preferred Stock is considered outside the control of the Company and, as a result, the Series A Convertible Preferred Stock is recorded within Temporary Equity on the Consolidated Balance Sheets.
The Company has elected to apply the accretion method to adjust the carrying value of the Series A Convertible Preferred Stock to its estimated redemption value. Amounts recognized to accrete the Series A Convertible Preferred Stock to its estimated redemption value are treated as a deemed dividend and are recorded as a reduction to "Additional paid-in capital" on the Consolidated Balance Sheets. The estimated redemption value may vary in subsequent periods and the Company has elected to recognize such changes prospectively.
The captioned sections below provide a summary of the material terms of the Series A Convertible Preferred Stock, as set forth in the Certificate of Designations, Preferences and Rights of the Series A Convertible Preferred Stock (the "Certificate of Designations").
Ranking — The Series A Convertible Preferred Stock ranks senior to the Class A Common Stock, the Class V Common Stock, and each other class or series of shares of the Company that the Company may issue in the future the terms of which do not expressly provide that such class or series ranks equally with, or senior to, the Series A Convertible Preferred Stock, with respect to dividend rights and/or rights upon liquidation, winding up or dissolution.
Dividends — Dividends on the Series A Convertible Preferred Stock are cumulative and accrue from the date of issuance at the rate per annum of 7% of the Series A Purchase Price of each share, plus the amount of previously accrued dividends, compounded annually (the "Accruing Dividends"). The Company may elect to pay the Accruing Dividends either in cash or in additional shares of Series A Convertible Preferred Stock. Prior to the third anniversary of the Closing, the Series A Convertible Preferred Stock will participate on an as-converted basis in dividends declared and paid on the Class A Common Stock. In each of June 2025 and 2024, the Company paid $5.6 million, respectively, of cash dividends on the Series A Convertible Preferred Stock to the Investors.
Conversion — Any shares of Series A Convertible Preferred Stock may, at the option of the holder, be converted at any time into shares of Class A Common Stock. The conversion price for the Series A Convertible Preferred Stock is initially $11.79 and is subject to adjustment upon certain events, including a stock split, a reverse stock split, or a dividend of the Class A Common Stock or Class V Common Stock to the Company's common stockholders (as adjusted, the "Conversion Price"). The Company may require such conversion (i) if the closing price per share of Class A Common Stock, for at least twenty (20) of any thirty (30) consecutive trading days, exceeds: (a) on or after the third and prior to the seventh anniversary of the Closing, 150% of the Conversion Price; or (b) on or after the seventh and prior to the tenth anniversary of the Closing, 100% of the Conversion Price; and (ii) on or after the tenth anniversary of the Closing. The conversion rate in effect at any applicable time (the "Conversion Rate") is the quotient obtained by dividing the Series A Purchase Price by the Conversion Price.
As of December 31, 2025, no shares of Series A Convertible Preferred Stock had been converted and the outstanding shares of Series A Convertible Preferred Stock were convertible into 6,785,410 shares of Class A Common Stock.
Voting — The Series A Convertible Preferred Stock votes together with the Class A Common Stock on an as-converted basis, and not as a separate class. The Investors have veto rights over (i) changes to the terms of the Certificate of Designations or the Company's certificate of incorporation or bylaws that adversely impact the Series A Convertible Preferred Stock; and (ii) the issuance of equity securities senior to the Series A Convertible Preferred Stock or other securities convertible thereto.
Liquidation Preference — In the event of any liquidation, dissolution or winding up of the Company, each share of Series A Convertible Preferred Stock will be paid the greater of (i) the Series A Purchase Price plus any Accruing Dividends accrued but unpaid thereon; and (ii) the amount that such share of Series A Convertible Preferred Stock would have received had it converted into the Class A Common Stock immediately prior to such liquidation, dissolution or winding up of the Company (the "Liquidation Preference"). After payment of the Liquidation Preference, the Series A Convertible Preferred Stock will no longer be convertible and will not participate in any distribution made to the holders of the Class A Common Stock or Class V Common Stock.
Change of Control — Upon a merger, consolidation, sale or other change of control transaction as described in the Certificate of Designations (a "Change of Control"), either (i) the Company may elect to redeem the Series A Convertible Preferred Stock; or (ii) each holder of Series A Convertible Preferred Stock, individually, may require the Company to redeem all or any portion of the Series A Convertible Preferred Stock. The redemption price per share to be paid by the Company would be the greater of: (a) the Series A Purchase Price plus any accrued but unpaid Accruing Dividends multiplied by (i) if prior to or on the third anniversary of the Closing, 120%; (ii) if after the third but prior to or on the fifth anniversary of the Closing, 110%; (iii) if after the fifth anniversary of the Closing, 100%; and (b) the amount such share of Series A Convertible Preferred Stock would have received had it converted into the Class A Common Stock prior to the Change of Control. Any shares of Series A Convertible Preferred Stock that are not so redeemed will automatically convert into shares of Class A Common Stock and be paid in connection with the Change of Control.
Fundamental Transaction — In the event of any acquisition by the Company with a transaction value of at least $500.0 million or any equity or debt financing by the Company that raises at least $500.0 million, either (i) the Company may elect to redeem the Series A Convertible Preferred Stock; or (ii) each holder of Series A Convertible Preferred Stock, individually, may require the Company to redeem all or any portion of its Series A Convertible Preferred Stock. The redemption price per share to be paid by the Company would be the Series A Convertible Preferred Stock plus any accrued but unpaid Accruing Dividends multiplied by: (a) if prior to or on the third anniversary of the Closing, 120%; (b) if after the third but prior to or on the fifth anniversary of the Closing, 110%; (c) if after the fifth but prior to or on the sixth anniversary of the Closing, 108%; (d) if after the sixth but prior to or on the seventh anniversary of the Closing, 106%; (e) if after the seventh but prior to or on the eighth anniversary of the Closing, 104%; (f) if after the eighth but prior to or on the ninth anniversary of the Closing, 102%; or (g) if after the ninth anniversary of the Closing, 100%.
Optional Term Redemption — Any time after the fifth anniversary of the Closing, the Company may redeem all or any portion of the then-outstanding shares of the Series A Convertible Preferred Stock for cash (a "Term Redemption"). The redemption price per share to be paid by the Company would be equal to the greater of: (i) the Series A Purchase Price plus any accrued but unpaid Accruing Dividends multiplied by: (a) if after the fifth but prior to the sixth anniversary of the Closing, 110%; (b) if on or after the sixth but prior to the seventh anniversary of the Closing, 108%; (c) if on or after the seventh but prior to the eighth anniversary of the Closing, 106%; (d) if on or after the eighth but prior to the ninth anniversary of the Closing, 104%; (e) if on or after the ninth but prior to tenth anniversary of the Closing, 102%; or (f) if on or after the tenth anniversary of the Closing, 100%; and (ii) the amount such share of Series A Convertible Preferred Stock would have received had it converted into Class A Common Stock prior to the Term Redemption.
Registration Rights Agreement — In connection with the Private Placement, the Company entered into a registration rights agreement with the Investors (the "Registration Rights Agreement") pursuant to which, the Investors will be entitled to certain demand, shelf and piggyback registration rights with respect to the Series A Convertible Preferred Stock and shares of the Class A Common Stock issuable upon conversion thereof.
20 — Stockholders' Equity
Class A Common Stock
Hagerty, Inc. is authorized to issue 500,000,000 shares of Class A Common Stock with a par value of $0.0001 per share. Holders of Class A Common Stock are entitled to one vote for each share. As of December 31, 2025 and 2024, there were 100,706,893 and 90,032,391 shares of Class A Common Stock issued and outstanding, respectively.
Class V Common Stock
Hagerty, Inc. is authorized to issue 300,000,000 shares of Class V Common Stock with a par value of $0.0001 per share. Class V Common Stock represents voting, non-economic interests in Hagerty, Inc. Holders of Class V Common Stock are entitled to 10 votes for each share. In connection with the business combination that formed Hagerty, Inc. in 2021, shares of Class V Common Stock were issued to the Legacy Unit Holders along with an equivalent number of THG units. Each share of Class V Common Stock, together with the corresponding THG unit, is exchangeable for one share of Class A Common Stock. As of December 31, 2025 and 2024, there were 241,552,156 and 251,033,906 shares of Class V Common Stock issued and outstanding, respectively. Refer to "Exchange of THG Units" below for additional information.
Preferred Stock
Hagerty, Inc. is authorized to issue 20,000,000 shares of Preferred Stock with a par value of $0.0001 per share. The Board has the authority to issue shares of Preferred Stock with such designations, voting and other rights and preferences as may be determined from time to time.
As of December 31, 2025 and 2024, there were 8,483,561 shares of Preferred Stock issued and outstanding, which may, at the option of the holder, be converted at any time into shares of Class A Common Stock. Refer to Note 19 — Convertible Preferred Stock for additional information.
Hagerty, Inc. owns one THG unit for each share of Class A Common Stock outstanding, and is the sole managing member of THG. As a result, Hagerty, Inc. consolidates the financial statements of THG into its Consolidated Financial Statements. The Company reports a non-controlling interest representing the economic interest in THG held by other unit holders of THG.
The following table summarizes the changes in ownership of THG units for the periods presented:
Year ended December 31,
2025
2024
THG units held by Hagerty, Inc.
Beginning of period
90,032,391
84,588,536
Issuance of shares under employee plans
916,950
1,246,836
Exchange of THG units for Class A Common Stock
9,757,552
320,818
Warrant Exchange (refer to Note 6)
—
3,876,201
End of period
100,706,893
90,032,391
Ownership percentage
Beginning of period
26.1
%
24.9
%
End of period
29.1
%
26.1
%
THG units held by other unit holders
Beginning of period
255,178,346
255,499,164
Exchange of THG units for Class A Common Stock
(9,757,552)
(320,818)
End of period
245,420,794
255,178,346
Ownership percentage
Beginning of period
73.9
%
75.1
%
End of period
70.9
%
73.9
%
Total THG units outstanding
346,127,687
345,210,737
At the end of each reporting period, THG equity attributable to Hagerty, Inc. and the non-controlling interest unit holders, respectively, is reallocated to reflect their current ownership in THG.
Shares Issued Under Employee Plans
Certain employees of THG subsidiaries are awarded share-based compensation in the form of RSUs and PRSUs under the 2021 Stock Incentive Plan. Upon the vesting of these awards, the employees receive shares of Class A Common Stock and the Company is issued an equivalent number of THG units, thereby increasing its ownership interest in THG. Employees of THG subsidiaries may also participate in the 2021 Employee Stock Purchase Plan (the "ESPP") under which these employees may purchase shares of Class A Common Stock at a discounted price and the Company is issued an equivalent number of THG units.
During the years ended December 31, 2025 and 2024, the Company received 860,238 and 1,216,339 THG units, respectively, in connection with shares of Class A Common Stock that were issued as a result of share-based compensation awards vesting under the 2021 Stock Incentive Plan. In addition, during the years ended December 31, 2025 and 2024, the Company received 56,712 and 30,497 THG units, respectively, in connection with shares of Class A Common Stock that were issued related to the ESPP.
Each THG unit and, if applicable, the associated share of Class V Common Stock, are exchangeable for, at the Company's option, one share of Class A Common Stock or cash. If the Company elects for an exchange to be settled in cash, the cash used to settle the exchange must be funded through a new equity offering of Class A Common Stock. Upon completion of any THG unit exchange, shares of any exchanged Class V Common Stock are cancelled and Hagerty, Inc. retains the exchanged THG units. Changes in Hagerty, Inc.'s ownership interest in THG while retaining its controlling interest are accounted for as equity transactions. Accordingly, exchanges of THG units by unit holders other than Hagerty, Inc. increase Hagerty, Inc.'s ownership in THG, thereby reducing the amount recorded as "Non-controlling interest" and increasing "Additional paid-in capital" on the Consolidated Balance Sheets.
In the third quarter of 2025, HHC completed an exchange of 9,481,750 THG units, together with the corresponding shares of Class V Common Stock, for 9,481,750 shares of Class A Common Stock (the "THG Unit Exchange"). Upon the consummation of the THG Unit Exchange, the exchanged shares of Class V Common Stock were cancelled. In addition, during the years ended December 31, 2025 and 2024, certain other holders of THG units that do not hold corresponding shares of Class V Common Stock exchanged approximately 275,802 and 320,818, respectively, THG units for an equal number of shares of Class A Common Stock.
Immediately following the THG Unit Exchange, pursuant to an underwriting agreement dated as of August 7, 2025, (the "Underwriting Agreement"), by and among the Company, THG, the Underwriters and the Selling Stockholders named therein, HHC sold 9,481,750 shares of Class A Common Stock to the Underwriters (the "Secondary Offering"). The Company did not sell any securities in the Secondary Offering and did not receive any proceeds from the sale of shares by the Selling Stockholders in the Secondary Offering. The Company incurred $1.5 million in expenses associated with the THG Unit Exchange and Secondary Offering, which were recorded within "General and administrative expenses" in the Consolidated Statements of Operations.
These exchanges resulted in reductions to "Non-controlling interest" and corresponding increases to "Additional paid-in capital" of $17.0 million and $3.2 million, during the years ended December 31, 2025 and 2024, respectively.
THG Preferred Units
In connection with the Private Placement, the Fourth Amended and Restated Limited Liability Company Agreement of THG was amended and restated in the form of a Fifth Amended and Restated Limited Liability Company Agreement (as subsequently amended and restated, the "THG LLC Agreement"), to, among other things, create a new series of preferred units within THG (the "THG Preferred Units"). The terms of the THG Preferred Units parallel the terms of the Series A Convertible Preferred Stock and are held entirely by Hagerty, Inc.
The THG Preferred Units are recorded on the financial statements of THG based on their estimated redemption value, which represents the maximum cash payment, including cumulative dividends, that would be required to be paid to Hagerty, Inc. if the Optional Term Redemption of the Series A Convertible Preferred Stock is exercised. Amounts recognized to accrete the THG Preferred Units to their estimated redemption value are treated as a deemed dividend due to Hagerty, Inc. The amount of this deemed dividend is attributed entirely to Hagerty, Inc. prior to allocating the remainder of THG's consolidated net income between controlling and non-controlling interests. In each of June 2025 and 2024, THG paid $5.6 million of cash dividends to Hagerty, Inc. on the THG Preferred Units. Refer to Note 19 — Convertible Preferred Stock for additional information on the Private Placement and the Series A Convertible Preferred Stock.
Distributions to Unit Holders of THG
Under the terms of the THG LLC Agreement, THG is obligated to make tax distributions to its unit holders. During the years ended December 31, 2025 and 2024, THG made tax distributions of $30.3 million and $6.7 million, respectively, to non-controlling interest unit holders and $11.9 million and $1.1 million, respectively, of tax distributions to Hagerty, Inc.
21 — Share-Based Compensation
The 2021 Stock Incentive Plan provides for the issuance of up to approximately 38.3 million shares of Class A Common Stock to certain employees and non-employee directors. The 2021 Stock Incentive Plan allows for the issuance of incentive stock options, non-qualified stock options, restricted stock awards, stock appreciation rights, RSUs, and PRSUs. As of December 31, 2025, there were approximately 25.9 million shares available for future grants under the 2021 Stock Incentive Plan.
Share-based compensation expense related to employees is recognized within "Salaries and benefits" in the Consolidated Statements of Operations. Share-based compensation expense related to non-employee directors is recognized within "General and administrative expenses" in the Consolidated Statements of Operations. The Company recognizes forfeitures of share-based compensation awards in the period in which they occur.
The following table summarizes share-based compensation expense recognized during the years ended December 31, 2025, 2024, and 2023:
Year ended December 31,
2025
2024
2023
in thousands
Restricted stock units
$
13,458
$
13,142
$
14,991
Performance restricted stock units
5,450
4,215
2,861
Employee stock purchase plan
—
—
165
Total share-based compensation expense
$
18,908
$
17,357
$
18,017
Restricted Stock Units
RSUs typically vest over a two to five-year period based on the requisite service period. The grant date fair value is determined based on the closing market price of the Class A Common Stock on the business day prior to the grant date and the related share-based compensation expense is recognized over the requisite service period on a straight-line basis.
The following table provides a summary of RSU activity during the year ended December 31, 2025:
Restricted Stock Units
Weighted Average Grant Date Fair Value
Unvested balance as of January 1, 2025
3,682,679
$
9.65
Granted
1,255,586
9.28
Vested (1)
(1,263,332)
9.58
Forfeited
(126,842)
9.20
Unvested balance as of December 31, 2025
3,548,091
$
9.56
(1) For the year ended December 31, 2025, 860,238 shares of Class A Common Stock were issued related to the vesting of RSUs in the period, net of shares withheld for the funding of employee tax obligations.
The following table provides additional data related to RSU activity during the years ended December 31, 2025 and 2024:
Year ended December 31,
2025
2024
in thousands (except years)
Total fair value of shares vested (1)
$
12,101
$
18,621
Unrecognized compensation expense
$
23,198
$
26,640
Weighted average period awards are expected to be recognized (in years)
2.42
2.88
(1) The tax impact related to vested RSUs for the years ended December 31, 2025 and 2024 was not material to the Consolidated Financial Statements.
In April 2022, the Company's CEO was granted 3,707,136 market condition PRSUs, which provide him the opportunity to receive up to 3,707,136 shares of Class A Common Stock. The award had a grant date fair value of approximately $19.2 million, which was estimated using a Monte Carlo simulation model. These PRSUs have both market-based and service-based vesting conditions. Shares of Class A Common Stock issuable under this award can be earned based on the achievement of the following stock price targets: (i) 25% of the shares can be earned when the stock price of the Class A Common Stock exceeds $20.00 per share for 60 consecutive days; (ii) 25% of the shares can be earned when the stock price of the Class A Common Stock exceeds $25.00 per share for 60 consecutive days; and (iii) 50% of the shares can be earned when the stock price of the Class A Common Stock exceeds $30.00 per share for 60 consecutive days. These market-based conditions must be met in order for the PRSUs to vest; therefore, it is possible that no shares will ultimately vest. If any of the market-based conditions are met, the PRSUs will vest contingent upon continued service through the earlier of three years after achievement of the stock price target or the end of the seven-year performance period. As of December 31, 2025, no market condition PRSUs had vested.
The Company will recognize the entire $19.2 million of compensation expense for this award over the requisite service period, regardless of whether such market-based conditions are met. As of December 31, 2025, unrecognized compensation expense related to this award was $8.5 million, which the Company expects to recognize over a period of 3.25 years.
The following table summarizes the assumptions and related information used to determine the grant-date fair value of the market condition PRSUs awarded in April 2022:
Inputs
Performance Restricted Stock Units
Weighted average grant-date fair value per share
$5.19
Expected stock volatility
35%
Expected term (in years)
7.0
Risk-free interest rate
2.5%
Dividend yield
—%
Performance Condition PRSUs
In March 2024, the Talent, Culture, and Compensation Committee (the "Compensation Committee") of the Board adopted another form of PRSU award agreement (the "Performance Condition PRSU Agreement") to be used for awards of PRSUs to certain employees under the 2021 Stock Incentive Plan.
PRSUs granted under the Performance Condition PRSU Agreement will be eligible to vest subject to the satisfaction of both performance-based and service-based conditions. The performance-based vesting condition will be satisfied contingent upon the Company's level of performance over the designated performance period (the "Performance Period") as measured against a financial performance target (the "Performance Target"), each as determined by the Compensation Committee. Following the end of the Performance Period, the Compensation Committee will determine the applicable attained performance level with payout percentages ranging from 35% to 200% (each, a "Payout Percentage") of the target number of PRSUs awarded. In the event of a Change in Control (as defined in the Performance Condition PRSU Agreement) before the end of a scheduled Performance Period, the Compensation Committee retains discretion to end the Performance Period early and measure performance levels as of a revised measurement date.
If both the service-based and performance-based vesting conditions are satisfied, the PRSU holder will be entitled to receive the number of shares of Class A Common Stock, if any, determined by multiplying the aggregate number of PRSUs subject to the applicable PRSU Agreement by the applicable Payout Percentage that corresponds to the level of achievement of the Performance Target pursuant to the payout formula approved by the Compensation Committee.
The amount of compensation expense ultimately recognized for PRSUs issued under the Performance Condition PRSU Agreement will be based on the Company's ultimate performance relative to the Performance Target. The amount of compensation expense recognized prior to the end of the Performance Period is dependent upon management's assessment of the likelihood of achieving the applicable payout levels. If, as a result of management's assessment, it is projected that a greater number of PRSUs will vest than previously anticipated, a life-to-date adjustment to increase compensation expense is recorded in the period when such determination is made. Conversely, if, as a result of management's assessment, it is projected that a lower number of PRSUs will vest than previously anticipated, a life-to-date adjustment to decrease compensation expense is recorded in the period when such determination is made.
The following table provides a summary of the activity related to PRSUs granted under the Performance Condition PRSU Agreement during the year ended December 31, 2025:
Performance Restricted Stock Units
Weighted Average Grant Date Fair Value
Unvested balance as of January 1, 2025
295,166
$
9.33
Granted
243,365
9.04
Unvested balance as of December 31, 2025
538,531
$
9.20
As of December 31, 2025, the maximum number of shares of Class A Common Stock that may be issued with respect to PRSUs granted under the Performance Condition PRSU Agreement is 1,077,062, assuming full achievement of the Performance Target.
The following table provides additional data related to performance condition PRSU award activity during the years ended December 31, 2025 and 2024:
Year ended December 31,
2025
2024
in thousands (except years)
Unrecognized compensation expense
$
4,401
$
4,165
Weighted average period awards are expected to be recognized (in years)
1.76
2.25
Employee Stock Purchase Plan
The ESPP allows substantially all of the Company's employees to purchase shares of Class A Common Stock at a discount. As of December 31, 2025, 285,028 shares had been purchased under the ESPP and there were approximately 11.2 million shares available for future purchases.
The following table summarizes the basic and diluted earnings per share calculations for the years ended December 31, 2025, 2024, and 2023:
Year ended December 31,
2025
2024
2023
in thousands (except per share amounts)
Basic Earnings per Share
Net income available to Class A Common Stockholders
$
38,683
$
8,900
$
15,881
Weighted average shares of Class A Common Stock outstanding
94,404
87,529
84,180
Basic earnings per share
$
0.41
$
0.10
$
0.19
Diluted Earnings per Share
Net income available to Class A Common Stockholders
$
127,480
$
8,944
$
31,769
Weighted average shares of Class A Common Stock outstanding
346,973
88,504
340,323
Diluted earnings per share
$
0.37
$
0.10
$
0.09
Net income available to Class A Common Stockholders
Net income
$
149,225
$
78,303
$
28,179
Net income attributable to non-controlling interest
(100,207)
(61,286)
(7,948)
Accretion of Series A Convertible Preferred Stock
(7,555)
(7,427)
(3,677)
Undistributed earnings allocated to Series A Convertible Preferred Stock
(2,780)
(690)
(673)
Net income available to Class A Common Stockholders, Basic
38,683
8,900
15,881
Undistributed earnings reallocated to Series A Convertible Preferred Stock
287
—
347
Adjustment for potentially dilutive THG units
88,431
—
15,526
Adjustment for potentially dilutive Series A Convertible Preferred Stock
—
—
—
Adjustment for potentially dilutive share-based compensation awards
79
44
15
Net income available to Class A Common Stockholders, Diluted
$
127,480
$
8,944
$
31,769
Weighted Average Shares of Class A Common Stock Outstanding
Weighted average shares of Class A Common Stock outstanding, Basic
94,404
87,529
84,180
Adjustment for potentially dilutive THG units
251,394
—
255,559
Adjustment for potentially dilutive Series A Convertible Preferred Stock
—
—
—
Adjustment for potentially dilutive share-based compensation awards
1,175
975
584
Weighted average shares of Class A Common Stock outstanding, Diluted
346,973
88,504
340,323
The following table summarizes the weighted average potential shares of Class A Common Stock excluded from diluted earnings per share of Class A Common Stock as their effect would be anti-dilutive for the years ended December 31, 2025, 2024, and 2023:
Year ended December 31,
2025
2024
2023
in thousands
THG units
—
255,328
—
Series A Convertible Preferred Stock
6,785
6,785
3,569
Unvested shares associated with share-based compensation awards
The Company's U.S. federal and state income tax expense relates to its wholly owned U.S. corporate subsidiaries, which are separately taxed as corporations for U.S. federal and state income tax purposes, and Hagerty, Inc.'s allocable share of any taxable income from THG. The Company also owns foreign subsidiaries that file and pay income taxes in their local jurisdictions.
THG is treated as a partnership for U.S. federal and most applicable state and local income tax purposes. As a partnership, THG is not subject to U.S. federal and certain state and local taxes. Any taxable income or loss generated by THG is passed through to and included in the taxable income or loss of its partners, including Hagerty, Inc., on a pro-rata basis.
In addition, Hagerty Re, a Bermuda corporation, made an irrevocable election under Section 953(d) of the IRC, as amended, to be taxed as a U.S. domestic corporation. As a result, Hagerty Re is subject to U.S. taxation on its world-wide income as if it were a U.S. corporation. In accordance with an agreement between Hagerty Re and the Internal Revenue Service ("IRS"), Hagerty Re established an irrevocable letter of credit with the IRS in 2021.
Tax Legislation — On July 4, 2025, the One Big Beautiful Bill Act ("OBBBA") was enacted. The law contains several key provisions including the reinstatement of immediate expensing of qualifying research and development expenses and permanent extensions of certain provisions within the Tax Cuts and Jobs Act. The immediate expensing provisions of the OBBBA reduced the Company's cash taxes payable by $0.5 million for the 2025 tax year. Additionally, the OBBBA enacted changes to the entity aggregation rule, which ensures that all related companies within a corporate group are treated as one single entity when applying the limitations on deductibility of executive compensation. These changes resulted in a $1.1 million reduction to Company's deferred tax assets related to share-based compensation and the recording of a corresponding income tax expense in 2025.
The Organisation for Economic Co-operation and Development has a framework to implement a global minimum corporate tax rate of 15% for companies with global revenues and profits above certain thresholds (referred to as "Pillar 2"). Certain aspects of Pillar 2 became effective on January 1, 2024 and other aspects became effective on January 1, 2025. The U.S. has not enacted legislation to adopt Pillar 2; however, certain countries in which the Company operates have adopted such legislation. While the Company's effective income tax rate and cash income tax payments could increase in future years as a result of the global minimum tax, management does not expect a material impact to the Company's effective tax rate or its results of operations. This assessment could be affected by legislative guidance and the future enactment of additional provisions within the Pillar 2 framework.
Income Tax Expense — For the years ended December 31, 2025, 2024, and 2023, income before taxes includes the following components:
Year ended December 31,
2025
2024
2023
in thousands
United States
$
24,050
$
108,589
$
62,030
Foreign (1)
115,132
(14,907)
(17,258)
Total
$
139,182
$
93,682
$
44,772
(1) The Company adopted ASU 2023-09 on a prospective basis, and as a result, for year ended December 31, 2025, foreign income is presented based on the country of domicile which results in Hagerty Re's income before taxes included in the Foreign jurisdiction. For the years ended December 31, 2024 and 2023, Hagerty Re's income was included in the United States based on country of tax jurisdiction.
Beginning with the year ended December 31, 2025, the Company has adopted ASU 2023-09 and, as a result, the reconciliation of income tax expense has been updated on a prospective basis. For the year ended December 31, 2025, the income tax benefit reflected in the Consolidated Statements of Operations differs from the tax computed by applying the statutory U.S. federal rate of 21% to "Income tax benefit (expense)" as follows:
Year ended December 31, 2025
in thousands (except percentages)
Income tax expense at U.S. federal statutory rate
$
29,228
21.0
%
State and local income taxes, net of federal income tax effect (1)
(5,098)
(3.7)
%
Tax credits
(588)
(0.4)
%
Nontaxable and nondeductible items:
Net impact of noncontrolling interest and non-partnership operations on partnership outside basis
(2,424)
(1.7)
%
Other
404
0.3
%
Effect of cross-border tax laws:
U.S. tax on foreign insurance income
27,087
19.5
%
Other
40
—
%
Foreign branch income
(2,136)
(1.5)
%
Changes in valuation allowance
(33,280)
(23.9)
%
Changes in unrecognized tax benefits
123
0.1
%
Effect of changes in tax laws or rates enacted in the current period
1,109
0.8
%
Other
(628)
(0.5)
%
Foreign tax effects:
Bermuda:
Statutory tax exemption
(27,087)
(19.5)
%
Canada
1,670
1.2
%
U.K.:
Valuation allowance
1,931
1.4
%
Other
(832)
(0.6)
%
Other foreign jurisdictions
438
0.3
%
Income tax benefit
$
(10,043)
(7.2)
%
(1) California, New York, Florida, Pennsylvania, and Michigan represent the majority of the tax effect in this category.
For the years ended December 31, 2024 and 2023, income tax expense reflected in the Consolidated Statements of Operations differs from the tax computed by applying the statutory U.S. federal rate of 21% to "Income tax benefit (expense)" as follows:
Year ended December 31,
2024
2023
in thousands (except percentages)
Income tax expense at U.S. federal statutory rate
$
19,673
21.0
%
$
9,402
21.0
%
State taxes
659
0.7
%
(232)
(0.5)
%
Net impact of noncontrolling interest and non-partnership operations on partnership outside basis
(8,759)
(9.3)
%
5,000
11.2
%
Foreign rate differential
2,407
2.6
%
(529)
(1.2)
%
Change in valuation allowance
3,485
3.7
%
393
0.9
%
Loss (gain) related to warrant liabilities, net
1,794
1.9
%
(2,424)
(5.4)
%
Permanent items
89
0.1
%
914
2.0
%
Effect of changes in tax rates
(4,400)
(4.7)
%
4,018
9.0
%
Other, net
431
—
%
51
—
%
Income tax expense
$
15,379
16.0
%
$
16,593
37.0
%
Deferred Tax Assets and Liabilities — Deferred tax assets and liabilities reflect temporary differences between the carrying amounts of assets and liabilities for financial reporting purposes and the amount recognized for tax purposes, as adjusted for foreign currency translation. At December 31, 2025 and 2024, the tax effects of temporary differences that give rise to significant portions of the deferred tax provision are as follows:
December 31,
2025
2024
Deferred tax assets:
in thousands
Discount on provision for losses and loss adjustment expenses
$
1,442
$
1,343
Unearned premiums
16,385
14,239
Tax receivable agreement
10,110
—
Unrealized foreign currency gain
190
597
Excess tax basis
159,189
148,089
Net operating loss ("NOL") and other carryforwards
The Company has historically maintained a full valuation allowance on its deferred tax assets related to the difference between the outside tax basis and book basis of Hagerty, Inc.'s investment in the assets of THG. The realization of deferred tax assets is dependent upon the generation of future taxable income sufficient to utilize these deferred tax assets. As of December 31, 2024, management concluded that it was more likely than not that certain deferred tax assets, including the deferred tax asset for Hagerty, Inc.'s investment in the assets of THG, would not be realized because the Company was in a three-year cumulative loss position and the generation of sufficient future taxable income to utilize these deferred tax assets was uncertain.
As of each reporting period, management considers new evidence, both positive and negative, that could affect its view of the future realization of its deferred tax assets. In the third quarter of 2025, management's continued assessment of the realizability of the Company's deferred tax assets concluded that sufficient future taxable income will be generated to realize a portion of the deferred tax assets related to the outside basis in Hagerty, Inc.'s investment in THG and other tax attributes of the Hagerty, Inc. filing entity. In assessing the realizability of these deferred tax assets, management considered all sources of positive and negative evidence, including (i) that the Company had achieved cumulative three-year profitability during the quarter; (ii) that the Company's forecasts indicated continued profitability; and (iii) other positive business factors. Based on this evaluation, management determined it was appropriate to release a portion of the valuation allowance previously recorded against the federal and state deferred tax assets related to the outside basis in Hagerty, Inc.'s investment in THG and other tax attributes of the Hagerty, Inc. filing entity. As a result, $41.8 million of this valuation allowance was released in 2025 with a corresponding income tax benefit recognized in the Consolidated Statements of Operations.
In addition, during the year ended December 31, 2025, the Company recorded $31.4 million in deferred tax assets and a corresponding valuation allowance primarily due to (i) $24.1 million associated with changes to the outside basis difference in Hagerty, Inc.'s investment in THG and (ii) $7.3 million related to certain federal, state and foreign net operating losses.
During the year ended December 31, 2025, the Company's total valuation allowance decreased by $10.4 million consisting of a $24.5 million net income tax benefit recorded through the Consolidated Statements of Operations, partially offset by $14.1 million recorded through Stockholders' Equity on the Consolidated Balance Sheets related to exchanges of THG units for Class A Common Stock and stock-based compensation activity.
As of December 31, 2025 and December 31, 2024, the Company had deferred tax assets of $159.2 million and $148.1 million, respectively, related to the outside basis difference in Hagerty, Inc.'s investment in THG. A portion of the total outside basis difference is expected to reverse only upon the eventual sale of Hagerty, Inc.'s interest in THG, which would likely result in a capital loss. Accordingly, as of December 31, 2025 and December 31, 2024, the Company maintained a corresponding valuation allowance of $133.2 million and $148.1 million, respectively, against the deferred tax assets associated with the outside basis difference.
As of December 31, 2025, the Company had $87.8 million of gross federal NOLs that can be carried forward indefinitely. The Company also had $55.9 million of state NOLs, of which $12.3 million can be carried forward indefinitely and $43.6 million that expires in taxable years 2026 through 2045, if unused. The Company also had $110.9 million of gross foreign NOLs, of which $14.4 million can be carried forward indefinitely and $96.5 million that expires in taxable years 2036 through 2045, if unused. In addition, the Company had $0.6 million of federal research and development credits that expires in taxable years 2044 through 2045.
As of each of the periods presented above, the Company did not provide deferred income taxes on the outside book-tax basis difference on its foreign subsidiaries or any undistributed retained earnings which are indefinitely reinvested. The reversal of these temporary differences or distributions could result in additional tax; however, it is not practicable to estimate the amount of any unrecognized deferred tax liabilities at this time.
Tax Examinations — The Company is subject to taxation and files income tax returns in the U.S. federal jurisdiction, as well as many state and foreign jurisdictions. As of December 31, 2025, tax years 2021 to 2024 are subject to examination by various tax authorities. With few exceptions, as of December 31, 2025, the Company is no longer subject to U.S. federal, state, local or foreign examinations for years before 2021. THG is currently under audit by the IRS for the 2021 tax year.
The Canadian Revenue Agency closed its examinations of the Company for the 2018 tax year in March 2024 and for the 2020-2022 tax years in February 2025, with no changes to previously filed tax returns.
Uncertain Tax Positions — The calculation of the Company's tax liabilities involves uncertainties in the application of complex tax laws and regulations in a multitude of jurisdictions across its global operations. ASC 740 states that a tax benefit from an uncertain tax position may be recognized when it is more likely than not that the position will be sustained upon examination, including resolutions of any related appeals or litigation processes, on the basis of the technical merits.
The Company records uncertain tax benefits ("UTB") as liabilities in accordance with ASC 740 and adjusts these liabilities when management's conclusion changes as a result of the evaluation of new information not previously available. Because of the complexity of some of these uncertainties, the ultimate resolution may result in a payment that is materially different from the current estimate of the UTB liabilities. These differences will be reflected as increases or decreases to Income tax benefit (expense) in the period in which new information is available.
As of December 31, 2025, total gross unrecognized tax benefits were $0.1 million. As of December 31, 2024, the Company had nounrecognized tax benefits. The Company recognizes interest and penalties related to unrecognized tax benefits within "Income tax benefit (expense)" in the Consolidated Statements of Operations. As of December 31, 2025, there were no amounts of gross interest and penalties accrued.
December 31,
2025
2024
in thousands
Beginning of period
$
—
$
—
Additions based on tax positions related to the current year
57
—
Additions for tax positions of prior years
66
—
End of period
$
123
$
—
TRA Liability — In connection with the consummation of the business combination that formed Hagerty, Inc. in 2021, Hagerty, Inc. entered into a TRA with the Legacy Unit Holders. The TRA provides for payment to the Legacy Unit Holders of 85% of the U.S. federal, state and local cash tax savings realized by Hagerty, Inc. as a result of the increases in tax basis and certain other tax benefits, as outlined in the Business Combination Agreement, upon the exchange of THG units and shares of Hagerty, Inc. Class V Common Stock for shares of Hagerty, Inc. Class A Common Stock or cash. The remaining 15% cash tax savings resulting from the basis adjustments are retained by Hagerty, Inc. The Business Combination Agreement is provided as Exhibit 2.1, incorporated by reference within Item 15. Exhibits, Financial Statement Schedules, in this Annual Report.
In connection with the filing of its 2019 income tax return, THG made an election under Section 754 of the IRC for each taxable year in which TRA exchanges occur. This election allows THG to adjust the tax basis of its assets when certain ownership changes or distributions occur. This election cannot be revoked without the permission of the IRS Commissioner and will be in place for any future exchange of THG units.
In general, under the TRA, cash tax savings result in a year when the tax liability of Hagerty, Inc. for the year, computed without regard to the deductions attributable to the amortization of the basis increase and other deductions that arise in connection with the payment of the cash consideration under the TRA or the exchange of THG units and shares of Hagerty, Inc. Class V Common Stock for shares of Hagerty, Inc. Class A Common Stock, would be more than the tax liability for the year taking into account such deductions. Payments under the TRA are due when the Company produces taxable income and the resulting cash tax liability is reduced by deducting the amortization of the basis increase on a filed tax return. The payments under the TRA are expected to be substantial.
The amount and timing of any payments under the TRA will vary depending on a number of factors, including, but not limited to, the increase in tax basis of THG's assets, the timing of any future redemptions, exchanges or purchases of THG units held by Legacy Unit Holders, the price of Hagerty, Inc. Class A Common Stock at the time of the redemption, exchange or purchase, the extent to which redemptions or exchanges are taxable, the amount and timing of the taxable income that Hagerty, Inc. generates in the future, the tax rates then applicable, and the portion of the payments under the TRA constituting imputed interest.
The estimation of the TRA Liability is, by its nature, imprecise and subject to significant assumptions regarding the amount and timing of Hagerty, Inc.'s future taxable income. If the Company does not generate sufficient taxable income in the aggregate over the term of the TRA to utilize the tax benefits, then it would not be required to make the related payment under the TRA. Therefore, the Company only recognizes a liability for the TRA if it determines it is probable that it will generate sufficient future taxable income over the term of the TRA to utilize the related tax benefits. Estimating future taxable income is inherently uncertain and requires significant management judgment.
As of December 31, 2024, the estimated value of the TRA Liability was $2.2 million. As of December 31, 2025, based on Hagerty, Inc.'s forecast of future taxable income, the estimated value of the TRA Liability was $39.8 million. The $37.6 million increase recorded in 2025 includes $34.8 million recorded in the third quarter of 2025, consisting of (i) $5.6 million related to the THG Unit Exchange and recorded as an increase to "Additional paid-in capital" on the Consolidated Balance Sheets; and (ii) $29.2 million related to prior THG unit exchanges within "Interest expense and other, net" in the Consolidated Statements of Operations. Refer to Note 20 — Stockholders' Equity for additional information about the THG Unit Exchange.
For the years ended December 31, 2025 and 2024, changes in the estimated value of the TRA Liability recorded within "Interest expense and other, net" in the Consolidated Statements of Operations resulted in an expense of $32.2 million and $1.6 million, respectively.
During the year ended December 31, 2025, Hagerty, Inc. made TRA payments of $0.2 million to the Legacy Unit Holders. There were no such TRA payments during the year ended December 31, 2024.
24 — Related-Party Transactions
As of December 31, 2025, Markel and State Farm had the following equity interests in Hagerty and, as a result, are considered related parties:
Markel
State Farm
Equity Interest
Shares/Units
Percentage of total outstanding (1)
Shares/Units
Percentage of total outstanding (1)
Hagerty, Inc. Class A Common Stock
3,108,000
3.1
%
51,800,000
51.4
%
Hagerty, Inc. Class V Common Stock
75,000,000
31.0
%
—
—
%
Hagerty, Inc. Series A Convertible Preferred Stock
1,590,668
18.8
%
5,302,226
62.5
%
THG units
75,000,000
21.7
%
—
—
%
Controlling interest
3,108,000
3.1
%
51,800,000
51.4
%
Non-controlling interest
75,000,000
30.6
%
—
—
%
(1) The percentages reflected represent only the ownership of the specific security identified in each row, and are not reflective of the total economic ownership in Hagerty.
Refer to Note 20 — Stockholders' Equity and Note 19 — Convertible Preferred Stock for a description of each equity interest in the table above.
Markel
Alliance Agreement
For the years ended December 31, 2025, 2024, and 2023, the Company and Markel were parties to an alliance agreement (the "Markel Alliance Agreement") and associated agency agreement pursuant to which policies sold by Hagerty's U.S. MGAs were underwritten by Essentia and reinsured with Evanston Insurance Company ("Evanston"), both of which are wholly owned subsidiaries of Markel.
Refer to 1 — Description of Business for information regarding the Markel Fronting Arrangement, which was entered into on December 31, 2025 and became effective on January 1, 2026.
The following tables provide information related to Markel-affiliated "Commission revenue" and "Due to insurer" liabilities associated with the Markel Alliance Agreement:
Refer to Note 2 — Summary of Significant Accounting Policies for information on related party balances within "Commissions receivable," which primarily consist of CUC receivables due from Markel.
Reinsurance Agreement
For the years ended December 31, 2025, 2024, and 2023, Hagerty Re was party to a quota share agreement with Evanston to assume approximately 80% of the risks written through the Company's U.S. MGAs, with the exception of High-Net-Worth Accounts, in which Hagerty Re assumed 100% of the risk.
Refer to 1 — Description of Business for information on the Markel Fronting Arrangement, which was entered into on December 31, 2025 and became effective on January 1, 2026, and Note 16 — Reinsurance for additional information on the Company's reinsurance programs.
The following tables summarize all balances related to the Company's reinsurance business with Markel subsidiaries:
Year ended December 31,
2025
2024
2023
Revenue:
in thousands
Earned premium, net
$
745,669
$
662,791
$
535,352
Expenses:
Losses and loss adjustment expenses
$
293,268
$
302,088
$
214,401
Ceding commission, net
344,208
307,759
247,918
Total expenses
$
637,476
$
609,847
$
462,319
December 31,
2025
2024
Assets:
in thousands
Commissions receivable
$
1,321
$
489
Premiums receivable
174,169
150,436
Deferred acquisition costs, net
181,972
160,360
Reinsurance recoverable
1,958
1,215
Prepaid reinsurance premium
2,376
1,711
Total assets
$
361,796
$
314,211
Liabilities:
Losses payable
$
92,001
$
95,906
Provision for unpaid losses and loss adjustment expenses
155,757
158,516
Ceding commissions payable
83,494
76,001
Unearned premiums
395,239
347,501
Other liabilities
2,470
806
Total liabilities
$
728,961
$
678,730
Pursuant to the terms of the quota share agreement with Evanston, Hagerty Re maintains assets in trust for the benefit of Evanston. These assets are included within "Restricted cash and cash equivalents", "Fixed maturity securities" and "Equity securities" on the Consolidated Balance Sheets. The assets held in trust for the benefit of Evanston totaled $680.4 million and $589.2 million as of December 31, 2025 and 2024, respectively.
Hagerty has a 10-year master alliance agreement and associated managing general underwriter agreement with State Farm, under which State Farm Classic+ policies are offered to State Farm's customers through State Farm agents. This program began issuing policies in September 2023. As of December 31, 2025, State Farm Classic+ policies were being offered in 27 states, with conversions of their existing book of business occurring in seven of these states and plans to offer such policies in additional states in 2026 and 2027. Under the master alliance agreement, State Farm paid Hagerty an advanced commission of $20.0 million in 2020, which is being recognized as "Commission and fee revenue" over the remaining life of the arrangement. In addition, the Company is paid a commission for underwriting, binding coverage, and issuing State Farm Classic+ policies and can offer HDC memberships to State Farm Classic+ customers, providing Hagerty with an additional revenue opportunity.
Reinsurance Agreement
Hagerty Re has a quota share agreement to cede 50% of the risk assumed from a subsidiary of Markel in relation to High-Net-Worth Accounts to Oglesby Reinsurance Company, a wholly owned subsidiary of State Farm. Refer to Note 16 — Reinsurance for additional information on the Company's reinsurance programs.
The following tables summarize all balances related to the risk ceded by Hagerty Re to State Farm subsidiaries:
Year ended December 31,
2025
2024
2023
Revenue:
in thousands
Earned premium, net (1)
$
(19,442)
$
(15,950)
$
(5,883)
Expenses:
Losses and loss adjustment expenses (3)
$
(11,256)
$
(7,502)
$
(1,877)
Ceding commission, net (2)
(10,110)
(8,294)
(3,059)
Total expenses
$
(21,366)
$
(15,796)
$
(4,936)
(1) Represents premiums ceded to State Farm subsidiaries, which are accounted for as a reduction to "Earned premium, net".
(2) Represents commissions earned from State Farm subsidiaries related to ceded reinsurance, which are accounted for as a reduction to "Ceding commissions, net".
(3) Represents loss recoveries associated with reinsurance ceded to State Farm subsidiaries, which are accounted for as a reduction to "Losses and loss adjustment expenses".
December 31,
2025
2024
Assets:
in thousands
Commissions receivable
$
2,716
$
2,095
Deferred acquisition costs, net (1)
(5,400)
(4,448)
Reinsurance recoverable
6,668
6,205
Prepaid reinsurance premium
10,385
8,554
Total assets
$
14,369
$
12,406
Liabilities:
Other liabilities (2)
$
5,224
$
4,028
Total liabilities
$
5,224
$
4,028
(1) Represents unearned ceding commission received from State Farm subsidiaries.
(2) Represents reinsurance premiums due to State Farm subsidiaries.
State Farm Term Loan
In September 2023, Hagerty Re entered into an unsecured term loan facility with State Farm in an aggregate principal amount of $25.0 million and an interest rate of 8.0% per annum. The State Farm Term Loan will mature in September 2033. Refer to Note 18 — Debt for additional information.
From time-to-time, in the ordinary course of business, related parties, such as members of the Board and management, purchase insurance policies from the Company, receive payments on claims required by the Company's insurance policies, and buy and sell collector cars and enthusiast vehicles through marketplace auctions or in private transactions.
25 — Commitments and Contingencies
Employee Compensation Agreements — In the ordinary course of conducting its business, the Company enters into certain employee compensation agreements from time to time which commit it to severance obligations in the event an employee terminates employment with the Company. If applicable, these obligations are recorded as accrued expenses on the Consolidated Balance Sheets.
Litigation — From time to time, the Company is involved in various claims and legal actions that arise in the ordinary course of business. Management is required to assess the likelihood of any adverse judgments or outcomes related to these legal contingencies, as well as potential ranges of probable or reasonably possible losses. The determination of the amount of any losses to be recorded or disclosed as a result of these contingencies is based on a careful analysis of each individual exposure with, in some cases, the assistance of outside legal counsel. The amount of losses recorded or disclosed for such contingencies may change in the future due to new developments in each matter or a change in legal or settlement strategy. While the impact of any one or more legal claims or proceedings could be material to the Company's operating results in any period, management does not believe that the outcome of any of these pending claims or proceedings (including the data security incident discussed below), individually or in the aggregate, will have a material adverse effect on the Company's consolidated financial condition or liquidity.
Data Security Incident — In 2021, the Company experienced an unauthorized access into its online insurance quote feature whereby attackers used personal information already in their possession to obtain additional consumer data, including driver's license numbers. The unauthorized access issue has been remediated; however, the incident became the subject of coordinated industry-wide regulatory investigations. In October 2025, the Company entered into consent orders with each of the New York Department of Financial Services (the "NY DFS") and the New York Attorney General (the "NY AG") to settle all claims related to these investigations. Pursuant to the consent orders, the Company agreed to pay $1.85 million to the NY DFS and $1.3 million to the NY AG, respectively and to perform certain assessments of its privacy and cybersecurity programs and develop action plans to implement recommended enhancements. These amounts, which were recorded as a liability in the Consolidated Financial Statements prior to the third quarter of 2025, were paid in the fourth quarter of 2025.
26 — Subsequent Events
Management has evaluated subsequent events through February 26, 2026, which is the date these Consolidated Financial Statements were issued, and no material subsequent events were identified that are required to be reported.
LIABILITIES, TEMPORARY EQUITY AND STOCKHOLDERS' EQUITY
Accounts payable and accrued expenses
$
18
$
89
Intercompany payable (1)
846
831
Tax receivable agreement liability
39,829
2,180
TOTAL LIABILITIES
40,693
3,100
TEMPORARY EQUITY
Preferred stock, $0.0001 par value (20,000,000 shares authorized, 8,483,561 Series A Convertible Preferred Stock issued and outstanding as of December 31, 2025 and December 31, 2024)
86,618
84,663
STOCKHOLDERS' EQUITY
Class A Common Stock, $0.0001 par value (500,000,000 shares authorized, 100,706,893 and 90,032,391 issued and outstanding as of December 31, 2025 and December 31, 2024, respectively)
10
9
Class V Common Stock, $0.0001 par value (300,000,000 authorized, 241,552,156 and 251,033,906 shares issued and outstanding as of December 31, 2025 and December 31, 2024, respectively)
24
25
Additional paid-in capital
623,013
603,780
Accumulated earnings (deficit)
(402,960)
(451,978)
Accumulated other comprehensive income (loss)
1,229
(1,514)
Total stockholders' equity
221,316
150,322
Non-controlling interest
439,092
373,184
Total equity
660,408
523,506
TOTAL LIABILITIES, TEMPORARY EQUITY AND STOCKHOLDERS' EQUITY
Condensed Statements of Cash Flows (Parent Company Only)
Year ended December 31,
2025
2024
2023
OPERATING ACTIVITIES:
in thousands
Net income
$
149,225
$
78,303
$
28,179
Adjustments to reconcile net income to net cash from operating activities:
Equity in income of subsidiaries
(145,034)
(89,544)
(14,646)
Dividends received from subsidiaries
5,600
5,600
—
Tax distributions received from subsidiaries
11,799
1,104
—
Loss (gain) related to warrant liabilities, net
—
8,544
(11,543)
Change in TRA Liability
32,235
1,606
(2,636)
Provision for deferred taxes
(37,539)
—
—
Changes in operating assets and liabilities:
Prepaid expenses and other assets
520
329
478
Intercompany payable (1)
15
(15)
—
Accounts payable and accrued expenses
(20)
92
(32)
Net Cash Provided by (Used in) Operating Activities
16,801
6,019
(200)
INVESTING ACTIVITIES:
Investment in subsidiaries (1)
—
—
(102,635)
Net Cash Used in Investing Activities
—
—
(102,635)
FINANCING ACTIVITIES:
Proceeds from issuance of Series A Convertible Preferred Stock, net of issuance costs
—
—
79,262
Payment of Series A Convertible Preferred Stock dividends
(5,600)
(5,600)
—
Funding of TRA Liability payments
(223)
—
—
Net Cash Provided by (Used in) Financing Activities
(5,823)
(5,600)
79,262
Change in cash and cash equivalents and restricted cash and cash equivalents
10,978
419
(23,573)
Beginning cash and cash equivalents and restricted cash and cash equivalents
1,023
604
24,177
Ending cash and cash equivalents and restricted cash and cash equivalents
$
12,001
$
1,023
$
604
Cash paid for income taxes (2)
$
80
$
207
$
—
(1) Eliminated in consolidation.
(2) Beginning with the year ended December 31, 2025, the Company has adopted ASU 2023-09 and, as a result, cash paid for taxes, net of refunds received, is disclosed by jurisdiction on a prospective basis. For the year ended December 31, 2025, $45.6 thousand, $17.1 thousand, and $4.4 thousand of the cash paid for income taxes relates to California, Georgia, and New York state taxes, respectively. The remaining balance of cash paid for income taxes relates to immaterial balances to various states.
Notes to Condensed Financial Statements (Parent Company Only)
1 — Summary of Significant Accounting Policies
Nature of Operations — Hagerty, Inc. (the "Parent Company") was formed in 2020 as a Delaware corporation and is a holding company with no direct operations. The Parent Company's assets and liabilities primarily consist of its equity interest in THG and its consolidated subsidiaries.
Basis of Presentation — The Parent Company's Condensed Financial Statements have been prepared using the equity method, whereby the investment in consolidated subsidiaries is stated at cost plus equity in undistributed earnings of consolidated subsidiaries since the date of acquisition. These Condensed Financial Statements should be read in conjunction with the Consolidated Financial Statements and related notes thereto.
Use of Estimates — The preparation of the Parent Company's Condensed Financial Statements in conformity with GAAP requires management to make estimates and assumptions that affect the reported amounts of assets and liabilities, and the disclosure of contingent assets and liabilities as of the date of the Condensed Financial Statements, as well as the reported amounts of revenue and expenses during the reporting period. Although the estimates are considered reasonable, actual results could materially differ from those estimates.
ITEM 9. CHANGES IN AND DISAGREEMENTS WITH ACCOUNTANTS ON ACCOUNTING AND FINANCIAL DISCLOSURE
None.
ITEM 9A. CONTROLS AND PROCEDURES
Disclosure Controls and Procedures
Our management, including the Chief Executive Officer and Chief Financial Officer, evaluated the effectiveness of our disclosure controls and procedures (as such term is defined in Rules 13a-15(e) and 15d-15(e) under the Exchange Act) as of the end of the period covered by this Annual Report.
Based on this evaluation, our Chief Executive Officer and Chief Financial Officer concluded that our disclosure controls and procedures were effective as of December 31, 2025 to provide reasonable assurance that information required to be disclosed by us in reports that we file or submit under the Exchange Act is (i) recorded, processed, summarized and reported within the time periods specified in the rules and forms specified by the SEC; and (ii) accumulated and communicated to our management, including our Chief Executive Officer and Chief Financial Officer, as appropriate to allow timely decisions regarding required disclosure.
Changes in Internal Controls Over Financial Reporting
There were no changes to our internal control over financial reporting that occurred during the three months ended December 31, 2025, which were identified in connection with management's evaluation required by paragraph (d) of Rules 13a-15 and 15d-15 under the Exchange Act, that have materially affected, or are reasonably likely to materially affect, our internal control over financial reporting.
Management's Report on Internal Controls over Financial Reporting
Our management is responsible for establishing and maintaining adequate internal control over financial reporting as such term is defined in Rule 13a-15(f) under the Exchange Act. Our Chief Executive Officer and our Chief Financial Officer, with assistance from other members of management, assessed the effectiveness of our internal control over financial reporting as of December 31, 2025, based on the framework and criteria established in Internal Control—Integrated Framework (2013 Framework), issued by the Committee of Sponsoring Organizations of the Treadway Commission. Based on its evaluation, management has concluded that our internal control over financial reporting was effective as of December 31, 2025.
Our independent registered public accounting firm, Deloitte & Touche LLP, has audited our internal control over financial reporting as of December 31, 2025, and issued an attestation report, which is included below.
Our internal control over financial reporting is a process designed to provide reasonable assurance regarding the reliability of financial reporting and the preparation of financial statements for external purposes in accordance with U.S. GAAP. Our internal control over financial reporting includes those policies and procedures that (i) pertain to the maintenance of records that, in reasonable detail, accurately and fairly reflect the transactions and dispositions of our assets; (ii) provide reasonable assurance that transactions are recorded as necessary to permit preparation of financial statements in accordance with U.S. GAAP, and that our receipts and expenditures are being made only in accordance with authorizations of our management and directors; and (iii) provide reasonable assurance regarding prevention or timely detection of unauthorized acquisition, use, or disposition of our assets that could have a material effect on the financial statements.
Management, including our Chief Executive Officer and Chief Financial Officer, does not expect that the Company's internal controls will prevent or detect all errors and all fraud. A control system, no matter how well designed and operated, can provide only reasonable, not absolute, assurance that the objectives of the control system are met. Further, the design of a control system must reflect the fact that there are resource constraints, and the benefits of controls must be considered relative to their costs. Because of its inherent limitations, internal control over financial reporting may not prevent or detect misstatements. Also, projections of any evaluation of effectiveness to future periods are subject to the risk that controls may become inadequate because of changes in conditions, or that the degree of compliance with the policies or procedures may deteriorate.
REPORT OF INDEPENDENT REGISTERED PUBLIC ACCOUNTING FIRM
To the stockholders and the Board of Directors of Hagerty, Inc.
Opinion on Internal Control over Financial Reporting
We have audited the internal control over financial reporting of Hagerty, Inc. and subsidiaries (the “Company”) as of December 31, 2025, based on criteria established in Internal Control — Integrated Framework (2013) issued by the Committee of Sponsoring Organizations of the Treadway Commission (COSO). In our opinion, the Company maintained, in all material respects, effective internal control over financial reporting as of December 31, 2025, based on criteria established in Internal Control — Integrated Framework (2013) issued by COSO.
We have also audited, in accordance with the standards of the Public Company Accounting Oversight Board (United States) (PCAOB), the consolidated financial statements as of and for the year ended December 31, 2025, of the Company and our report dated February 26, 2026, an unqualified opinion on those financial statements.
Basis for Opinion
The Company’s management is responsible for maintaining effective internal control over financial reporting and for its assessment of the effectiveness of internal control over financial reporting, included in the accompanying Management's Report on Internal Controls over Financial Reporting. Our responsibility is to express an opinion on the Company’s internal control over financial reporting based on our audit. We are a public accounting firm registered with the PCAOB and are required to be independent with respect to the Company in accordance with the U.S. federal securities laws and the applicable rules and regulations of the Securities and Exchange Commission and the PCAOB.
We conducted our audit in accordance with the standards of the PCAOB. Those standards require that we plan and perform the audit to obtain reasonable assurance about whether effective internal control over financial reporting was maintained in all material respects. Our audit included obtaining an understanding of internal control over financial reporting, assessing the risk that a material weakness exists, testing and evaluating the design and operating effectiveness of internal control based on the assessed risk, and performing such other procedures as we considered necessary in the circumstances. We believe that our audit provides a reasonable basis for our opinion.
Definition and Limitations of Internal Control over Financial Reporting
A company’s internal control over financial reporting is a process designed to provide reasonable assurance regarding the reliability of financial reporting and the preparation of financial statements for external purposes in accordance with generally accepted accounting principles. A company’s internal control over financial reporting includes those policies and procedures that (1) pertain to the maintenance of records that, in reasonable detail, accurately and fairly reflect the transactions and dispositions of the assets of the company; (2) provide reasonable assurance that transactions are recorded as necessary to permit preparation of financial statements in accordance with generally accepted accounting principles, and that receipts and expenditures of the company are being made only in accordance with authorizations of management and directors of the company; and (3) provide reasonable assurance regarding prevention or timely detection of unauthorized acquisition, use, or disposition of the company’s assets that could have a material effect on the financial statements.
Because of its inherent limitations, internal control over financial reporting may not prevent or detect misstatements. Also, projections of any evaluation of effectiveness to future periods are subject to the risk that controls may become inadequate because of changes in conditions, or that the degree of compliance with the policies or procedures may deteriorate.
/s/ DELOITTE & TOUCHE LLP
Detroit, Michigan
February 26, 2026
ITEM 9B. OTHER INFORMATION
Trading Arrangements of Directors and Executive Officers
On November 10, 2025, Laurie Harris, a director, adopted a programmed plan of transactions intended to satisfy the affirmative defense provided by Rule 10b5-1(c) (the "10b5-1 Plan"). The 10b5-1 Plan provides for a first possible trade date of April 1, 2026, and terminates automatically on the earlier of the execution of all trades contemplated by the 10b5-1 Plan or November 10, 2026. The aggregate number of shares to be sold pursuant to the 10b5-1 Plan is 40% of the vested value of 13,828 shares of Class A Common Stock.
During the three months ended December 31, 2025, no director or executive officer of the Company, other than Ms. Harris, adopted or terminated a "Rule 10b5-1 trading arrangement" or "non-Rule 10b5-1 trading arrangement," as each term is defined in Item 408(a) of Regulation S-K.
ITEM 9C. DISCLOSURE REGARDING FOREIGN JURISDICTIONS THAT PREVENT INSPECTIONS
Not applicable.
PART III
ITEM 10. DIRECTORS, EXECUTIVE OFFICERS AND CORPORATE GOVERNANCE
The information required by this Item 10 is incorporated by reference to our Proxy Statement to be filed with the SEC in connection with the solicitation of proxies for our 2026 Annual Meeting of Stockholders to be filed with the SEC within 120 days after the end of the fiscal year ended December 31, 2025 ("2026 Proxy Statement").
ITEM 11. EXECUTIVE COMPENSATION
The information required by this Item 11 will be included in our 2026 Proxy Statement and is incorporated herein by reference.
ITEM 12. SECURITY OWNERSHIP OF CERTAIN BENEFICIAL OWNER AND MANAGEMENT AND RELATED STOCKHOLDER MATTERS
The information required by this Item 12 will be included in our 2026 Proxy Statement and is incorporated herein by reference.
ITEM 13. CERTAIN RELATIONSHIPS AND RELATED TRANSACTIONS, AND DIRECTOR INDEPENDENCE
The information required by this Item 13 will be included in our 2026 Proxy Statement and is incorporated herein by reference.
ITEM 14. PRINCIPAL ACCOUNTING FEES AND SERVICES
The information required by this Item 14 will be included in our 2026 Proxy Statement and is incorporated herein by reference.
(a) Financial statements and financial statement schedules filed as part of this report are listed in the index included in Item 8 of Part II Financial Statements and Supplementary Data of this report.
(b) Exhibits. The following exhibits, as required by Item 601 of Regulation S-K, are filed with or incorporated by reference in this report as stated below.
Cover Page Interactive Data File (formatted as Inline XBRL).
*
The schedules and exhibits to this agreement have been omitted pursuant to Item 601(a)(5) of Regulation S-K. A copy of any omitted schedule and/or exhibit will be furnished to the SEC upon request.
†
Indicates management contract or compensatory plan or arrangement.
#
This certification is deemed not filed for purpose of Section 18 of the Exchange Act or otherwise subject to the liability of that section, nor shall it be deemed incorporated by reference into any filing under the Securities Act or the Exchange Act.
Pursuant to the requirements of the Securities Exchange Act of 1934, the registrant has duly caused this report to be signed on its behalf by the undersigned, thereunto duly authorized, onFebruary 26, 2026.
KNOW ALL PERSONS BY THESE PRESENTS, that each person whose signature appears below constitutes and appoints McKeel O Hagerty and Patrick McClymont, jointly and severally, his or her attorneys-in-fact, each with the power of substitution, for him or her in any and all capacities, to sign any amendments to this Annual Report on Form 10-K, and to file the same with exhibits thereto and other documents in connection therewith, with the Securities and Exchange Commission, hereby ratifying and confirming all that each of said attorneys-in-fact, or his or her substitute or substitutes, may do or cause to be done by virtue hereof.
Pursuant to the requirements of the Securities Exchange Act of 1934, this report has been signed below by the following persons on behalf of the registrant and in the capacities indicated and on the dates indicated.
Name
Title
Date
/s/ McKeel O Hagerty
McKeel O Hagerty
Chairman of the Board and Chief Executive Officer (Principal Executive Officer)