.2 Second Quarter 2026 Earnings Call July 30, 2026 Bluestone
Gathering Lateral Pipeline NYSE: DTM
Safe Harbor Statement This presentation contains statements which, to the extent
they are not statements of historical or present fact, constitute “forward-looking statements” under the securities laws. These forward-looking statements are intended to provide management’s current expectations or plans for our future
operating and financial performance, business prospects, outcomes of regulatory proceedings, market conditions, and other matters, based on what we believe to be reasonable assumptions and on information currently available to
us. Forward-looking statements can be identified by the use of words such as “believe,” “expect,” “expectations,” “plans,” “strategy,” “prospects,” “estimate,” “project,” “target,” “anticipate,” “will,” “would,” “could,” “should,” “see,”
“guidance,” “outlook,” “confident,” “may,” “continue,” “intend,” “goal,” “potential,” and other words of similar meaning. The absence of such words, expressions or statements, however, does not mean that the statements are not forward-looking.
In particular, express or implied statements relating to future earnings, cash flow, results of operations, uses of cash, tax rates and other measures of financial performance, future actions, conditions or events, potential future plans,
strategies or transactions of DT Midstream, and other statements that are not historical facts, are forward- looking statements. Forward-looking statements are not guarantees of future results and conditions, but rather are subject to
numerous assumptions, risks, and uncertainties that may cause actual future results to be materially different from those contemplated, projected, estimated, or budgeted. Many factors may impact forward-looking statements of DT Midstream
including, but not limited to, the following: changes in general economic conditions, including increases in interest rates and associated Federal Reserve policies, a potential economic recession, and the impact of inflation on our business;
industry changes, including the impact of consolidations, alternative energy sources, technological advances, infrastructure constraints and changes in competition; changes in global trade policies and tariffs; global and domestic
supply chain disruptions; actions taken by third-party operators, producers, processors, transporters and gatherers; changes in expected production from Expand Energy and other third parties in our areas of operation; demand for natural gas
gathering, transmission, storage, transportation, sand mining, and water services; the availability and price of natural gas to the consumer compared to the price of alternative and competing fuels; our ability to successfully and timely
implement our business plan; our ability to complete organic growth projects on time and on budget; our ability to finance, complete, or successfully integrate acquisitions; our ability to realize the anticipated benefits from acquisitions and
our ability to manage the risks associated with acquisition activity; the price and availability of debt and equity financing; restrictions in our existing and any future credit facilities and indentures; the effectiveness of our information
technology and operational technology systems and practices to detect and defend against evolving cyber attacks on United States critical infrastructure; changing laws regarding cybersecurity and data privacy, and any cybersecurity threat or
event; operating hazards, environmental risks, and other risks incidental to gathering, storing and transporting natural gas; geologic and reservoir risks and considerations; natural disasters, adverse weather conditions, casualty losses and
other matters beyond our control; the impact of outbreaks of illnesses, epidemics and pandemics, and any related economic effects; the impacts of geopolitical events, including the conflicts in Ukraine and the Middle East; labor relations and
markets, including the ability to attract, hire and retain key employee and contract personnel; large customer defaults; changes in tax status, as well as changes in tax rates and regulations; the effects and associated cost of compliance with
existing and future laws and governmental regulations, such as the Inflation Reduction Act and the One Big Beautiful Bill Act; changes in environmental laws, regulations or enforcement policies, including laws and regulations relating to
pipeline safety, climate change and greenhouse gas emissions; changes in laws and regulations or enforcement policies, including those relating to construction and operation of new interstate gas pipelines, ratemaking to which our pipelines
may be subject, or other non-environmental laws and regulations; our ability to qualify for federal income tax credits; our ability to develop low carbon business opportunities and deploy greenhouse gas reducing technologies; changes in
insurance markets impacting costs and the level and types of coverage available; the timing and extent of changes in commodity prices; the success of our risk management strategies; the suspension, reduction or termination of our customers’
obligations under our commercial agreements; disruptions due to equipment interruption or failure at our facilities, or third-party facilities on which our business is dependent; the effects of future litigation; and the risks described in our
Annual Report on Form 10-K for the year ended December 31, 2025 and our reports and registration statements filed from time to time with the SEC. The above list of factors is not exhaustive. New factors emerge from time to time. We cannot
predict what factors may arise or how such factors may cause actual results to vary materially from those stated in forward-looking statements, see the discussion under the section entitled “Risk Factors” in our Annual Report for the year
ended December 31, 2025, filed with the SEC on Form 10-K and any other reports filed with the SEC. Given the uncertainties and risk factors that could cause our actual results to differ materially from those contained in any forward-looking
statement, you should not place undue reliance on any forward-looking statements. Any forward-looking statements speak only as of the date on which such statements are made. We are under no obligation to, and expressly disclaim any obligation
to, update or alter our forward-looking statements, whether as a result of new information, subsequent events or otherwise. 2
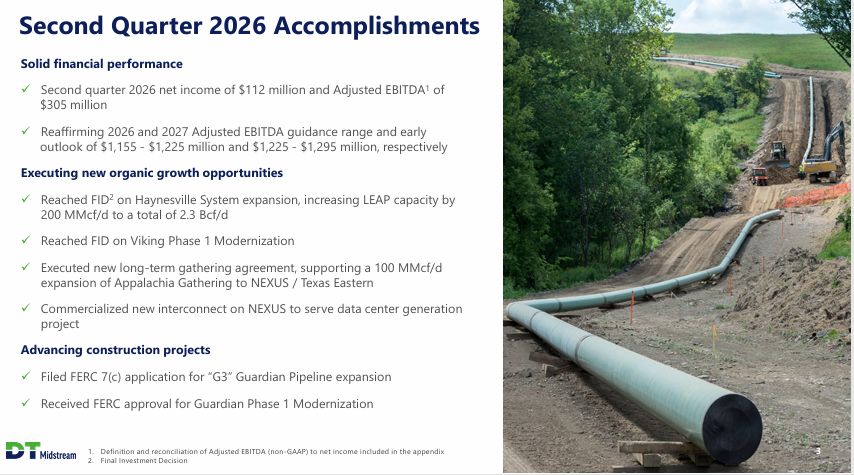
Second Quarter 2026 Accomplishments Solid financial performance ✓ Second quarter
2026 net income of $112 million and Adjusted EBITDA 1 of $305 million ✓ Reaffirming 2026 and 2027 Adjusted EBITDA guidance range and early outlook of $1,155 - $1,225 million and $1,225 - $1,295 million, respectively Executing new organic
growth opportunities ✓ Reached FID 2 on Haynesville System expansion, increasing LEAP capacity by 200 MMcf/d to a total of 2.3 Bcf/d ✓ Reached FID on Viking Phase 1 Modernization ✓ Executed new long-term gathering agreement, supporting a
100 MMcf/d expansion of Appalachia Gathering to NEXUS / Texas Eastern ✓ Commercialized new interconnect on NEXUS to serve data center generation project Advancing construction projects ✓ Filed FERC 7(c) application for “G3” Guardian
Pipeline expansion ✓ Received FERC approval for Guardian Phase 1 Modernization 3 1. Definition and reconciliation of Adjusted EBITDA (non-GAAP) to net income included in the appendix 2. Final Investment Decision
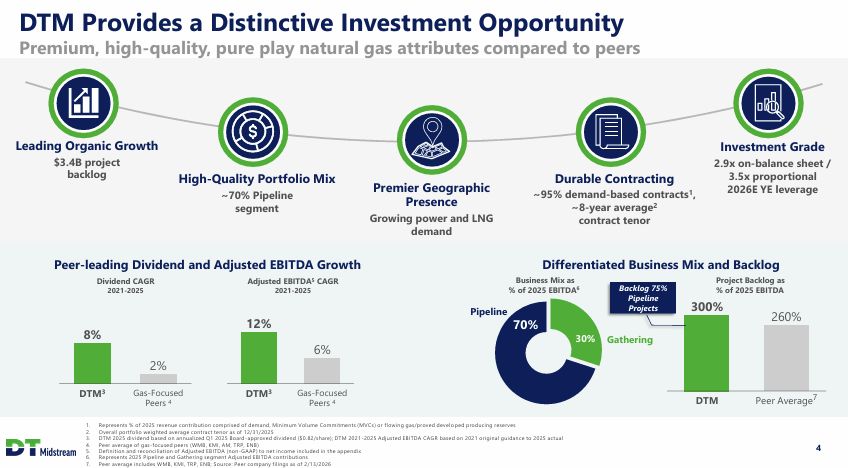
DTM Provides a Distinctive Investment Opportunity Premium, high-quality, pure
play natural gas attributes compared to peers Leading Organic Growth Investment Grade $3.4B project backlog 2.9x on-balance sheet / 3.5x proportional High-Quality Portfolio Mix Durable Contracting Premier Geographic Presence Growing
power and LNG demand 2026E YE leverage ~70% Pipeline segment ~95% demand-based contracts1, ~8-year average2 contract tenor Peer-leading Dividend and Adjusted EBITDA Growth Differentiated Business Mix and Backlog Dividend
CAGR 2021-2025 Adjusted EBITDA5 CAGR 2021-2025 Business Mix as Project Backlog as % of 2025 EBITDA Backlog 75% Pipeline % of 2025 EBITDA6 Projects 300% Pipeline 260% 12% 70% 8% 30% Gathering 6% 2% DTM3 Gas-Focused Peers
4 DTM3 Gas-Focused Peers 4 DTM Peer Average7 1. 2. 3. 4. 5. 6. 7. Represents % of 2025 revenue contribution comprised of demand, Minimum Volume Commitments (MVCs) or flowing gas/proved develo ped producing reserves Overall
portfolio weighted average contract tenor as of 12/31/2025 DTM 2025 dividend based on annualized Q1 2025 Board-approved dividend ($0.82/share); DTM 2021-2025 Adjusted EBITDA CAGR based on 2021 original guidance to 2025 actual Peer average of
gas-focused peers (WMB, KMI, AM, TRP, ENB) 4 Definition and reconciliation of Adjusted EBITDA (non-GAAP) to net income included in the appendix Represents 2025 Pipeline and Gathering segment Adjusted EBITDA contributions Peer average
includes WMB, KMI, TRP, ENB; Source: Peer company filings as of 2/13/2026
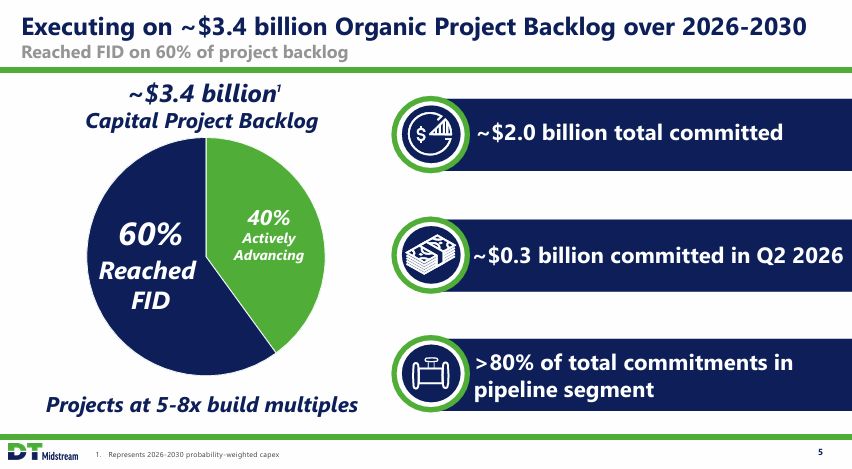
Executing on ~$3.4 billion Organic Project Backlog over 2026-2030 Reached FID on
60% of project backlog ~$3.4 billion1 Capital Project Backlog ~$2.0 billion total committed 40% Actively Advancing 60% ~$0.3 billion committed in Q2 2026 Reached R FID >80% of total commitments in pipeline segment Projects at
5-8x build multiples 5 1. Represents 2026-2030 probability-weighted capex
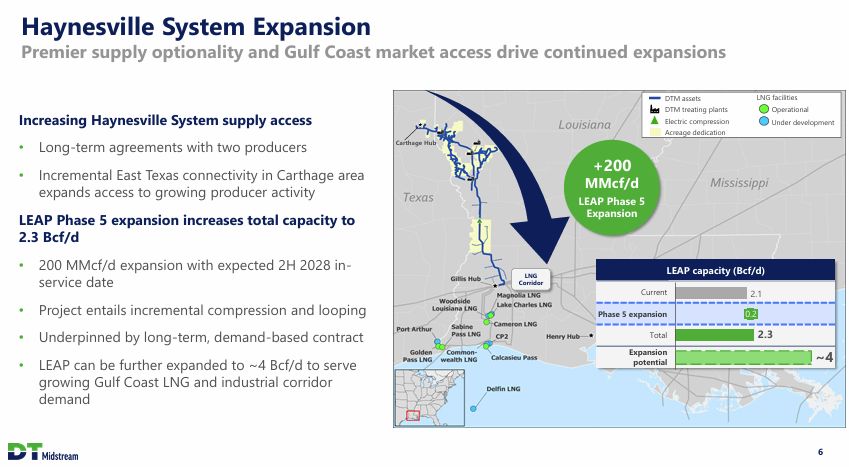
Haynesville System Expansion Premier supply optionality and Gulf Coast market
access drive continued expansions DTM assets LNG facilities Operational Under development DTM treating plants Electric compression Acreage dedication Increasing Haynesville System supply access • Long-term agreements with two
producers Carthage Hub +200 • Incremental East Texas connectivity in Carthage area MMcf/d expands access to growing producer activity LEAP Phase 5 Expansion LEAP Phase 5 expansion increases total capacity to 2.3 Bcf/d • 200 MMcf/d
expansion with expected 2H 2028 in- LEAP capacity (Bcf/d) service date LNG Corridor Current Phase 5 expansion 2.1 0.2 • Project entails incremental compression and looping Underpinned by long-term, demand-based
contract 2.3 • Total Expansion potential ~4 • LEAP can be further expanded to ~4 Bcf/d to serve growing Gulf Coast LNG and industrial corridor demand 6
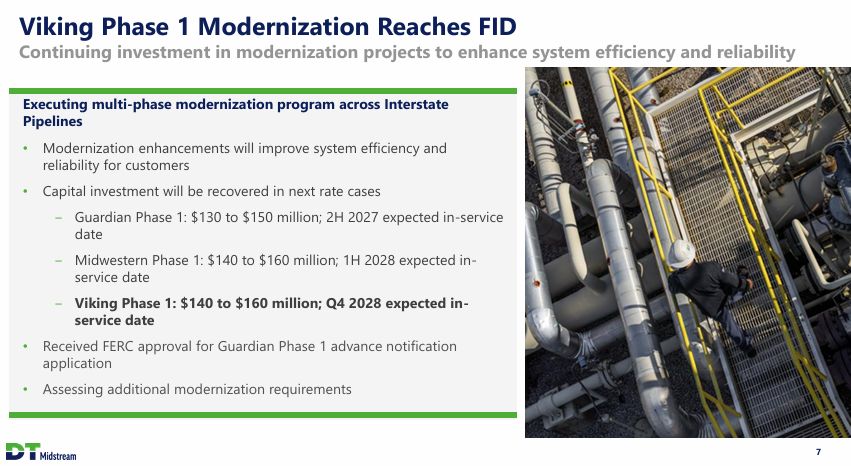
Viking Phase 1 Modernization Reaches FID Continuing investment in modernization
projects to enhance system efficiency and reliability Executing multi-phase modernization program across Interstate Pipelines • Modernization enhancements will improve system efficiency and reliability for customers • Capital investment
will be recovered in next rate cases ‒ Guardian Phase 1: $130 to $150 million; 2H 2027 expected in-service date ‒ Midwestern Phase 1: $140 to $160 million; 1H 2028 expected in- service date ‒ Viking Phase 1: $140 to $160 million; Q4 2028
expected in- service date • Received FERC approval for Guardian Phase 1 advance notification application • Assessing additional modernization requirements 7
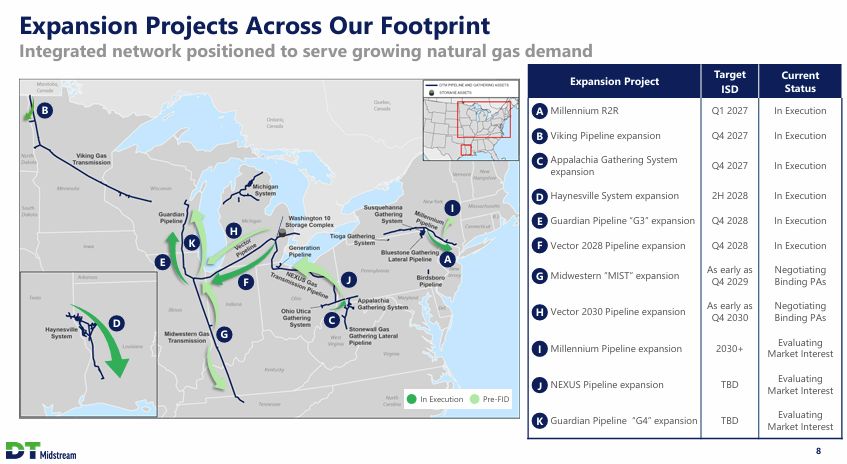
Expansion Projects Across Our Footprint Integrated network positioned to serve
growing natural gas demand Target ISD Current Status Expansion Project B A Millennium R2R Q1 2027 Q4 2027 In Execution In Execution B Viking Pipeline expansion C Appalachia Gathering System Q4 2027 In Execution expansion D
Haynesville System expansion E Guardian Pipeline “G3” expansion F Vector 2028 Pipeline expansion 2H 2028 Q4 2028 Q4 2028 In Execution In Execution In Execution I H K A E As early as Q4 2029 Negotiating Binding PAs G Midwestern
“MIST” expansion H Vector 2030 Pipeline expansion I Millennium Pipeline expansion J NEXUS Pipeline expansion J F As early as Q4 2030 Negotiating Binding PAs C D G Evaluating Market Interest 2030+ TBD Evaluating Market
Interest In Execution Pre-FID Evaluating Market Interest K Guardian Pipeline “G4” expansion TBD 8
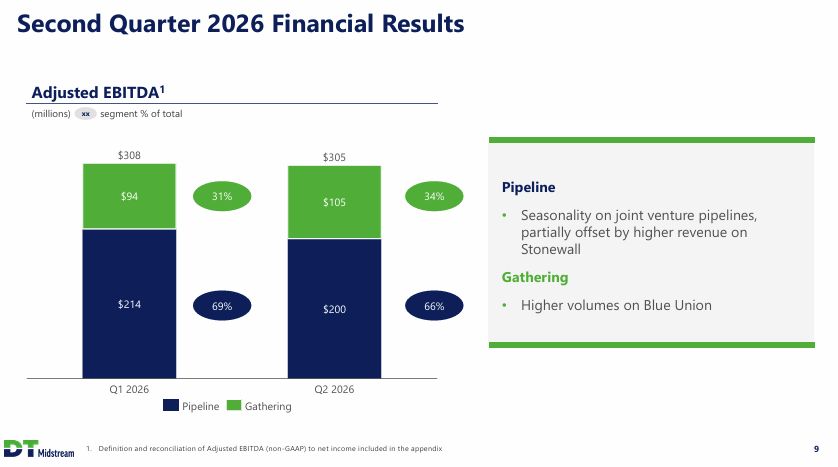
Second Quarter 2026 Financial Results Adjusted EBITDA1 (millions) segment % of
total xx $308 $94 $305 $105 Pipeline 31% 69% 34% 66% • Seasonality on joint venture pipelines, partially offset by higher revenue on Stonewall Gathering • Higher volumes on Blue Union $214 $200 Q1 2026 Q2
2026 Pipeline Gathering 1. Definition and reconciliation of Adjusted EBITDA (non-GAAP) to net income included in the appendix 9
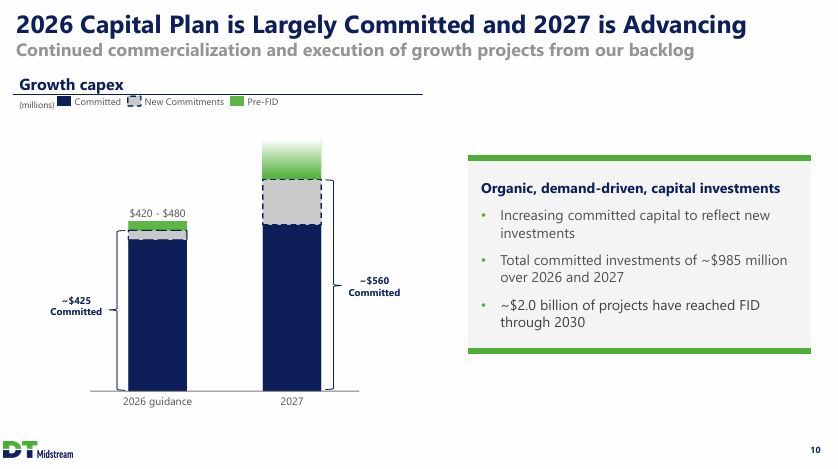
2026 Capital Plan is Largely Committed and 2027 is Advancing Continued
commercialization and execution of growth projects from our backlog Growth capex Committed New Commitments Pre-FID (millions) Organic, demand-driven, capital investments $420 - $480 Increasing committed capital to reflect
new investments • • Total committed investments of ~$985 million over 2026 and 2027 ~$560 Committed ~$425 Committed • ~$2.0 billion of projects have reached FID through 2030 2026 guidance 2027 10
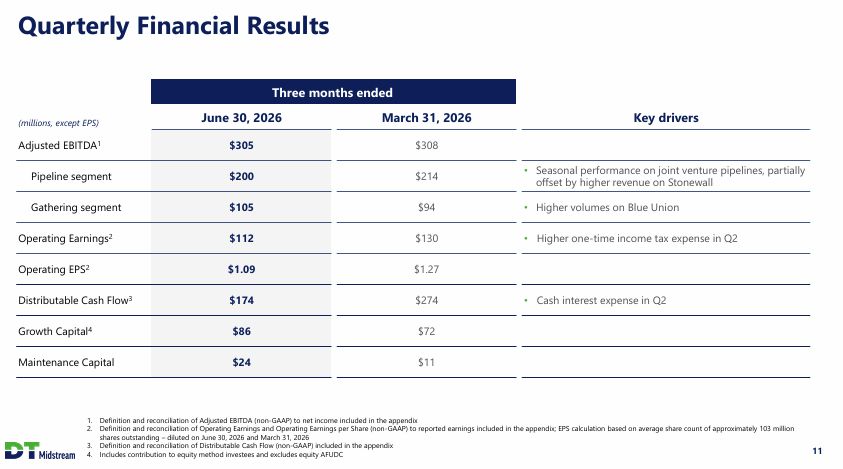
Quarterly Financial Results Three months ended June 30, 2026 March 31,
2026 Key drivers (millions, except EPS) Adjusted EBITDA1 $305 $308 • Seasonal performance on joint venture pipelines, partially Pipeline segment Gathering segment Operating Earnings2 Operating
EPS2 $200 $105 $112 $1.09 $174 $86 $214 $94 offset by higher revenue on Stonewall • Higher volumes on Blue Union $130 $1.27 $274 $72 • Higher one-time income tax expense in Q2 Distributable Cash Flow3 Growth Capital4 • Cash
interest expense in Q2 Maintenance Capital $24 $11 1. Definition and reconciliation of Adjusted EBITDA (non-GAAP) to net income included in the appendix 2. Definition and reconciliation of Operating Earnings and Operating Earnings per
Share (non-GAAP) to reported earnings included in the appendix; EPS calculation based on average share count of approximately 103 million shares outstanding – diluted on June 30, 2026 and March 31, 2026 3. Definition and reconciliation of
Distributable Cash Flow (non-GAAP) included in the appendix 4. Includes contribution to equity method investees and excludes equity AFUDC 11
Appendix 12
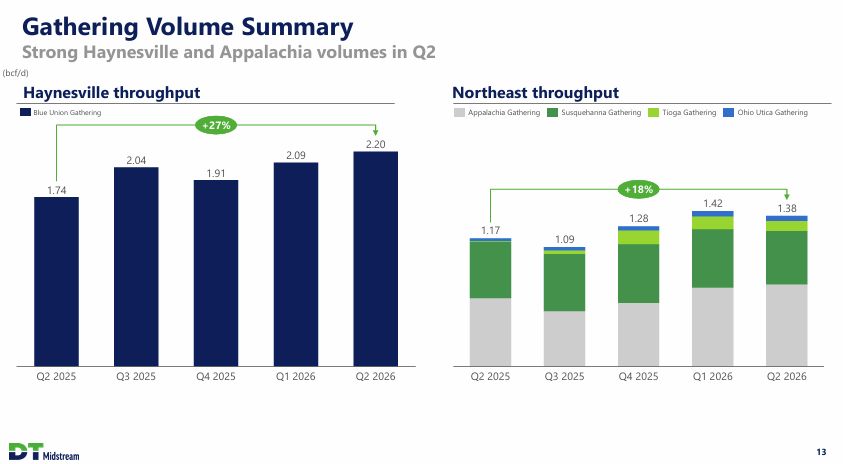
Gathering Volume Summary Strong Haynesville and Appalachia volumes in
Q2 (bcf/d) Haynesville throughput Northeast throughput Blue Union Gathering Appalachia Gathering Susquehanna Gathering Tioga Gathering Ohio Utica Gathering +27% 2.20 2.09 2.04 1.91 1.74 +18% 1.42 1.38 1.28 1.17 1.09 Q2
2025 Q3 2025 Q4 2025 Q1 2026 Q2 2026 Q2 2025 Q3 2025 Q4 2025 Q1 2026 Q2 2026 13
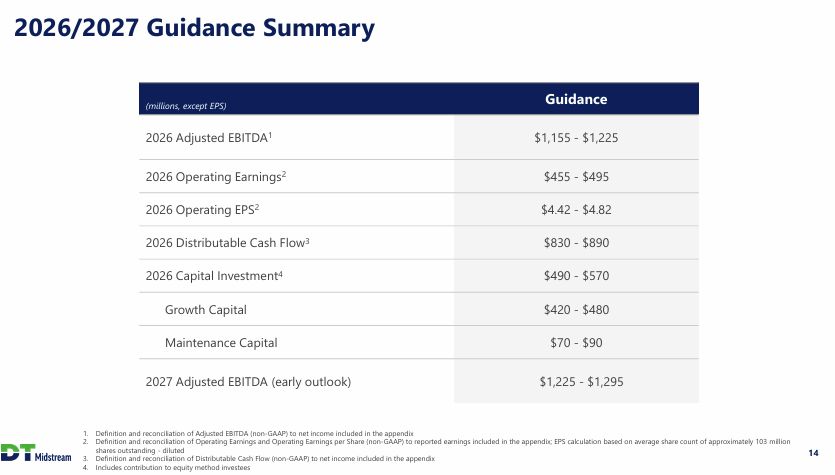
2026/2027 Guidance Summary Guidance (millions, except EPS) 2026 Adjusted
EBITDA1 $1,155 - $1,225 2026 Operating Earnings2 2026 Operating EPS2 $455 - $495 $4.42 - $4.82 $830 - $890 $490 - $570 $420 - $480 $70 - $90 2026 Distributable Cash Flow3 2026 Capital Investment4 Growth Capital Maintenance
Capital 2027 Adjusted EBITDA (early outlook) $1,225 - $1,295 1. Definition and reconciliation of Adjusted EBITDA (non-GAAP) to net income included in the appendix 2. Definition and reconciliation of Operating Earnings and Operating Earnings
per Share (non-GAAP) to reported earnings included in the appendix; EPS calculation based on average share count of approximately 103 million shares outstanding - diluted 3. Definition and reconciliation of Distributable Cash Flow (non-GAAP)
to net income included in the appendix 4. Includes contribution to equity method investees 14
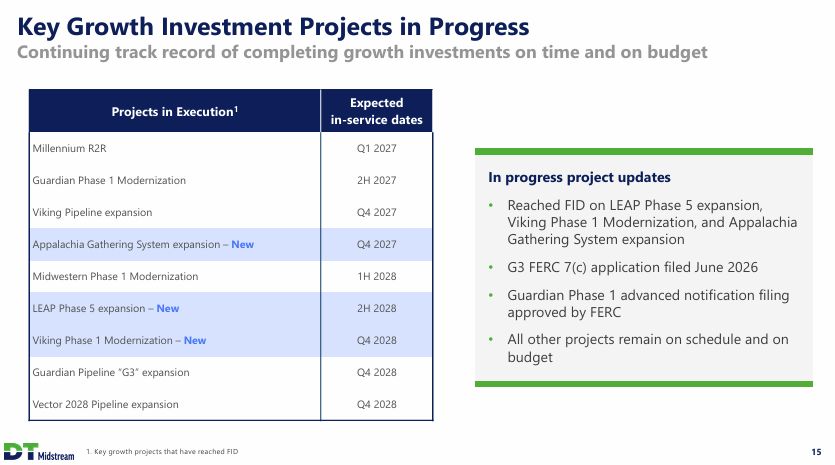
Key Growth Investment Projects in Progress Continuing track record of completing
growth investments on time and on budget Expected in-service dates Projects in Execution1 Millennium R2R Q1 2027 In progress project updates Guardian Phase 1 Modernization Viking Pipeline expansion 2H 2027 Q4 2027 Q4 2027 1H
2028 2H 2028 Q4 2028 Q4 2028 Q4 2028 • Reached FID on LEAP Phase 5 expansion, Viking Phase 1 Modernization, and Appalachia Gathering System expansion Appalachia Gathering System expansion – New Midwestern Phase 1 Modernization LEAP
Phase 5 expansion – New Viking Phase 1 Modernization – New Guardian Pipeline “G3” expansion Vector 2028 Pipeline expansion • G3 FERC 7(c) application filed June 2026 • Guardian Phase 1 advanced notification filing approved by FERC • All
other projects remain on schedule and on budget 1. Key growth projects that have reached FID 15
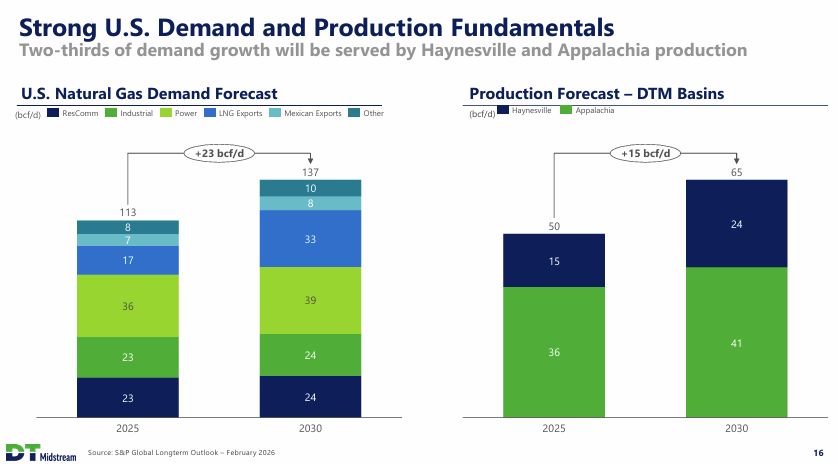
Strong U.S. Demand and Production Fundamentals Two-thirds of demand growth will
be served by Haynesville and Appalachia production U.S. Natural Gas Demand Forecast Production Forecast – DTM Basins Haynesville Appalachia ResComm Industrial Power LNG Exports Mexican Exports Other (bcf/d) (bcf/d) +23 bcf/d +15
bcf/d 137 10 8 65 24 113 8 7 50 33 17 36 15 39 24 41 36 23 23 24 2025 2030 2025 2030 Source: S&P Global Longterm Outlook – February 2026 16
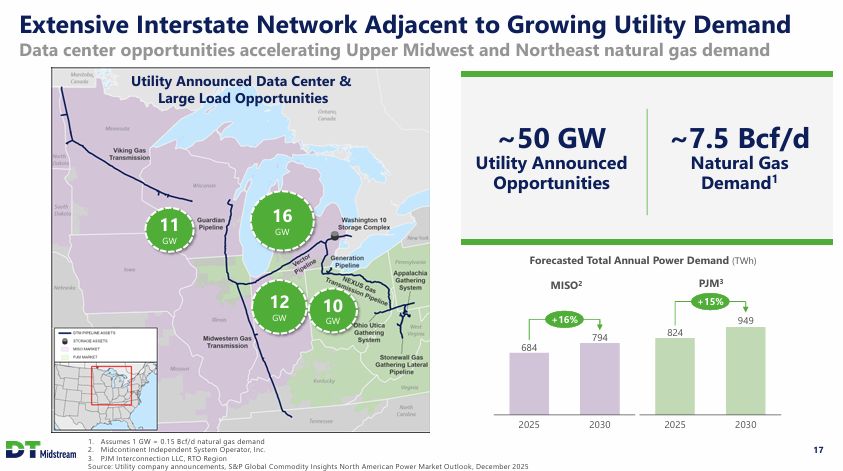
Extensive Interstate Network Adjacent to Growing Utility Demand Data center
opportunities accelerating Upper Midwest and Northeast natural gas demand Utility Announced Data Center & Large Load Opportunities ~50 GW ~7.5 Bcf/d Utility Announced Opportunities Natural Gas Demand1 16 GW 11 GW Forecasted
Total Annual Power Demand (TWh) PJM3 +15% MISO2 12 GW 10 GW +16% 949 824 794 684 2025 2030 2025 2030 1. Assumes 1 GW = 0.15 Bcf/d natural gas demand 2. Midcontinent Independent System Operator, Inc. 3. PJM Interconnection
LLC, RTO Region 17 Source: Utility company announcements, S&P Global Commodity Insights North American Power Market Outlook, December 2025
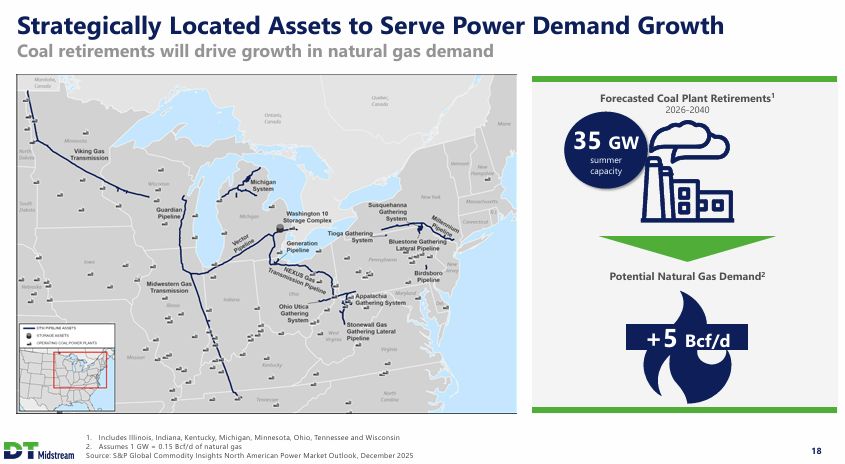
Strategically Located Assets to Ser ve Power Demand Growth Coal retirements will
drive growth in natural gas demand Forecasted Coal Plant Retirements1 2026-2040 35 GW summer capacity Potential Natural Gas Demand2 +5 Bcf/d 1. Includes Illinois, Indiana, Kentucky, Michigan, Minnesota, Ohio, Tennessee and Wisconsin 2.
Assumes 1 GW = 0.15 Bcf/d of natural gas Source: S&P Global Commodity Insights North American Power Market Outlook, December 2025 18
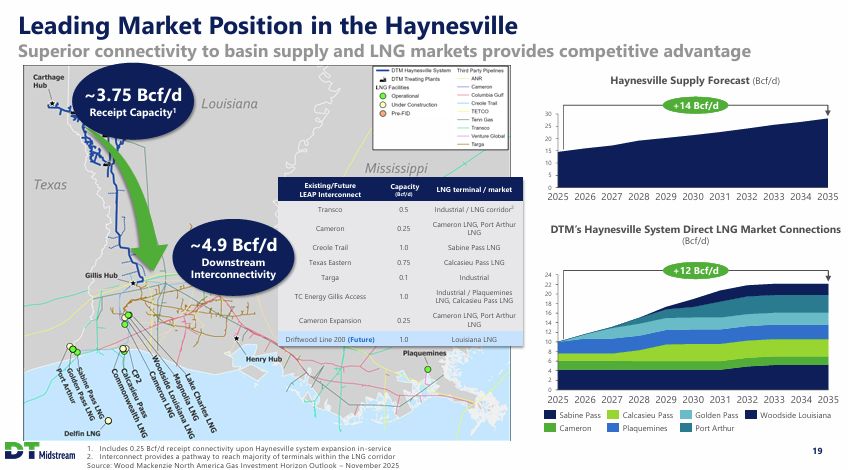
Leading Market Position in the Haynesville Superior connectivity to basin supply
and LNG markets provides competitive advantage Haynesville Supply Forecast (Bcf/d) ~3.75 Bcf/d Receipt Capacity1 +14 Bcf/d 30 25 20 15 10 5 Existing/Future LEAP Interconnect Capacity (Bcf/d) 0 LNG terminal / market 2025 2026
2027 2028 2029 2030 2031 2032 2033 2034 2035 Transco 0.5 Industrial / LNG corridor2 Cameron LNG, Port Arthur LNG DTM’s Haynesville System Direct LNG Market Connections Cameron 0.25 ~4.9 Bcf/d Downstream (Bcf/d) Creole Trail Texas
Eastern Targa 1.0 0.75 0.1 Sabine Pass LNG Calcasieu Pass LNG Industrial +12 Bcf/d Interconnectivity 24 22 20 18 16 14 12 10 8 Industrial / Plaquemines LNG, Calcasieu Pass LNG C Energy Gillis Access 1.0 Cameron LNG, Port
Arthur LNG Cameron Expansion 0.25 1.0 Driftwood Line 200 (Future) Louisiana LNG 6 4 2 0 2025 2026 2027 2028 2029 2030 2031 2032 2033 2034 2035 Sabine Pass Cameron Calcasieu Pass Plaquemines Golden Pass Port Arthur Woodside
Louisiana 1. Includes 0.25 Bcf/d receipt connectivity upon Haynesville system expansion in-service 19 2. Interconnect provides a pathway to reach majority of terminals within the LNG corridor Source: Wood Mackenzie North America Gas
Investment Horizon Outlook – November 2025
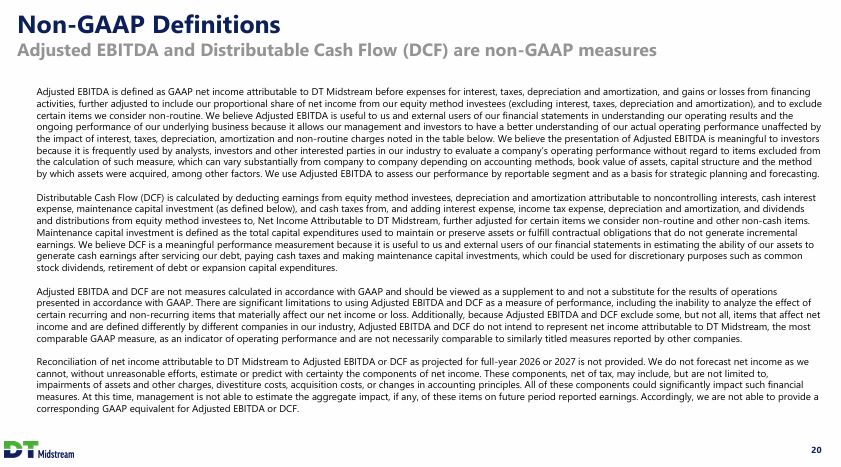
Non-GAAP Definitions Adjusted EBITDA and Distributable Cash Flow (DCF) are
non-GAAP measures Adjusted EBITDA is defined as GAAP net income attributable to DT Midstream before expenses for interest, taxes, depreciation and amortization, and gains or losses from financing activities, further adjusted to include our
proportional share of net income from our equity method investees (excluding interest, taxes, depreciation and amortization), and to exclude certain items we consider non-routine. We believe Adjusted EBITDA is useful to us and external users
of our financial statements in understanding our operating results and the ongoing performance of our underlying business because it allows our management and investors to have a better understanding of our actual operating performance
unaffected by the impact of interest, taxes, depreciation, amortization and non-routine charges noted in the table below. We believe the presentation of Adjusted EBITDA is meaningful to investors because it is frequently used by analysts,
investors and other interested parties in our industry to evaluate a company’s operating performance without regard to items excluded from the calculation of such measure, which can vary substantially from company to company depending on
accounting methods, book value of assets, capital structure and the method by which assets were acquired, among other factors. We use Adjusted EBITDA to assess our performance by reportable segment and as a basis for strategic planning and
forecasting. Distributable Cash Flow (DCF) is calculated by deducting earnings from equity method investees, depreciation and amortization attributable to noncontrolling interests, cash interest expense, maintenance capital investment (as
defined below), and cash taxes from, and adding interest expense, income tax expense, depreciation and amortization, and dividends and distributions from equity method investees to, Net Income Attributable to DT Midstream, further adjusted for
certain items we consider non-routine and other non-cash items. Maintenance capital investment is defined as the total capital expenditures used to maintain or preserve assets or fulfill contractual obligations that do not generate
incremental earnings. We believe DCF is a meaningful performance measurement because it is useful to us and external users of our financial statements in estimating the ability of our assets to generate cash earnings after servicing our debt,
paying cash taxes and making maintenance capital investments, which could be used for discretionary purposes such as common stock dividends, retirement of debt or expansion capital expenditures. Adjusted EBITDA and DCF are not measures
calculated in accordance with GAAP and should be viewed as a supplement to and not a substitute for the results of operations presented in accordance with GAAP. There are significant limitations to using Adjusted EBITDA and DCF as a measure of
performance, including the inability to analyze the effect of certain recurring and non-recurring items that materially affect our net income or loss. Additionally, because Adjusted EBITDA and DCF exclude some, but not all, items that affect
net income and are defined differently by different companies in our industry, Adjusted EBITDA and DCF do not intend to represent net income attributable to DT Midstream, the most comparable GAAP measure, as an indicator of operating
performance and are not necessarily comparable to similarly titled measures reported by other companies. Reconciliation of net income attributable to DT Midstream to Adjusted EBITDA or DCF as projected for full-year 2026 or 2027 is not
provided. We do not forecast net income as we cannot, without unreasonable efforts, estimate or predict with certainty the components of net income. These components, net of tax, may include, but are not limited to, impairments of assets and
other charges, divestiture costs, acquisition costs, or changes in accounting principles. All of these components could significantly impact such financial measures. At this time, management is not able to estimate the aggregate impact, if
any, of these items on future period reported earnings. Accordingly, we are not able to provide a corresponding GAAP equivalent for Adjusted EBITDA or DCF. 20
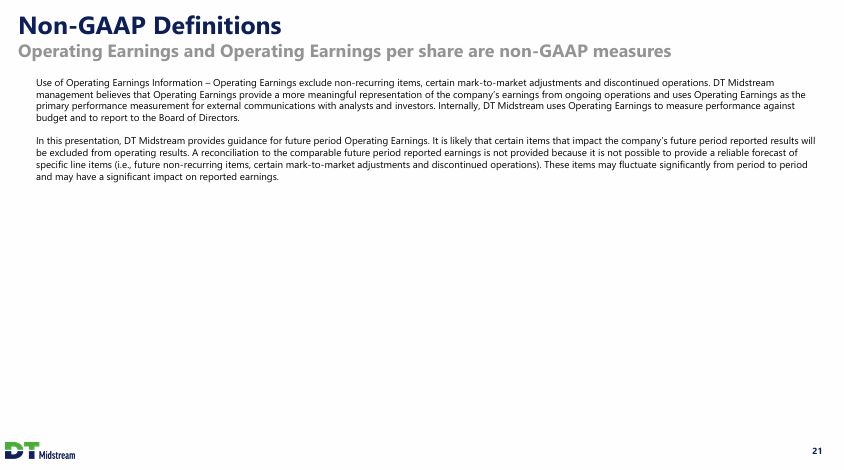
Non-GAAP Definitions Operating Earnings and Operating Earnings per share are
non-GAAP measures Use of Operating Earnings Information – Operating Earnings exclude non-recurring items, certain mark-to-market adjustments and discontinued operations. DT Midstream management believes that Operating Earnings provide a more
meaningful representation of the company’s earnings from ongoing operations and uses Operating Earnings as the primary performance measurement for external communications with analysts and investors. Internally, DT Midstream uses Operating
Earnings to measure performance against budget and to report to the Board of Directors. In this presentation, DT Midstream provides guidance for future period Operating Earnings. It is likely that certain items that impact the company’s
future period reported results will be excluded from operating results. A reconciliation to the comparable future period reported earnings is not provided because it is not possible to provide a reliable forecast of specific line items (i.e.,
future non-recurring items, certain mark-to-market adjustments and discontinued operations). These items may fluctuate significantly from period to period and may have a significant impact on reported earnings. 21
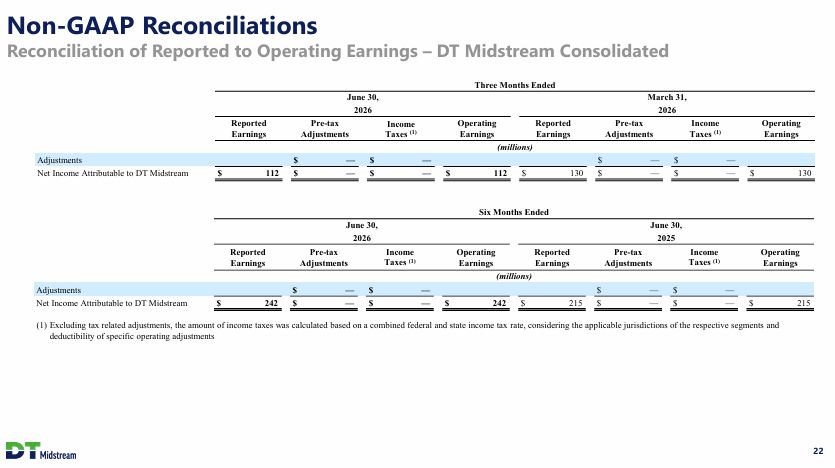
Non-GAAP Reconciliations Reconciliation of Reported to Operating Earnings – DT
Midstream Consolidated Three Months Ended June 30, 2026 March 31, 2026 Reported Earnings Pre-tax Adjustments Income Taxes (1) Operating Earnings Reported Earnings Pre-tax Adjustments Income Taxes
(1) Operating Earnings (millions) Adjustments $ $ — $ $ — — $ $ — $ $ — — Net Income Attributable to DT Midstream $ 112 — $ 112 $ 130 — $ 130 Six Months Ended June 30, 2026 June
30, 2025 Reported Earnings Pre-tax Adjustments Income Taxes (1) Operating Earnings Reported Earnings Pre-tax Adjustments Income Taxes
(1) Operating Earnings (millions) Adjustments $ $ — $ $ — — $ $ — $ $ — — Net Income Attributable to DT Midstream $ 242 — $ 242 $ 215 — $ 215 (1) Excluding tax related adjustments, the amount of income taxes was
calculated based on a combined federal and state income tax rate, considering the applicable jurisdictions of the respective segments and deductibility of specific operating adjustments 22
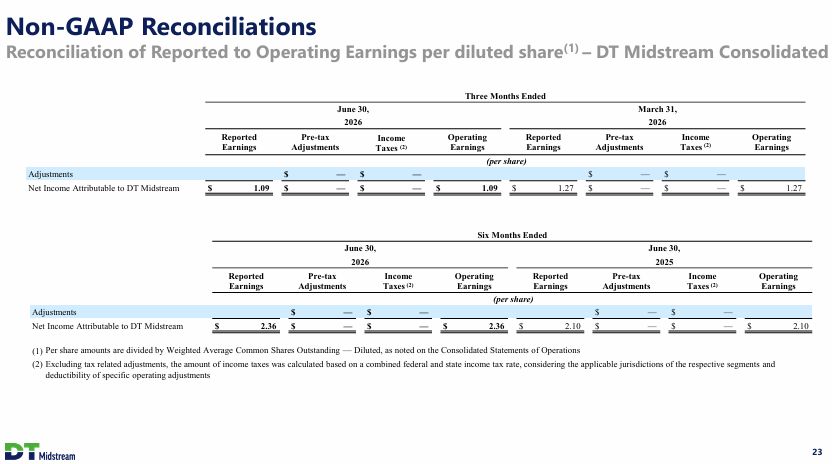
Non-GAAP Reconciliations Reconciliation of Reported to Operating Earnings per
diluted share(1) – DT Midstream Consolidated Three Months Ended June 30, 2026 March 31, 2026 Reported Earnings Pre-tax Adjustments Operating Earnings Reported Earnings Pre-tax Adjustments Income Taxes
(2) Operating Earnings Income Taxes (2) (per share) Adjustments $ $ — $ $ — — $ $ — $ $ — — Net Income Attributable to DT Midstream $ 1.09 — $ 1.09 $ 1.27 — $ 1.27 Six Months Ended June 30, 2026 June
30, 2025 Reported Earnings Pre-tax Adjustments Income Taxes (2) Operating Earnings Reported Earnings (per share) Pre-tax Adjustments Income Taxes
(2) Operating Earnings Adjustments $ $ — $ $ — — $ $ — $ $ — — Net Income Attributable to DT Midstream $ 2.36 — $ 2.36 $ 2.10 — $ 2.10 (1) Per share amounts are divided by Weighted Average Common Shares Outstanding
— Diluted, as noted on the Consolidated Statements of Operations (2) Excluding tax related adjustments, the amount of income taxes was calculated based on a combined federal and state income tax rate, considering the applicable jurisdictions
of the respective segments and deductibility of specific operating adjustments 23
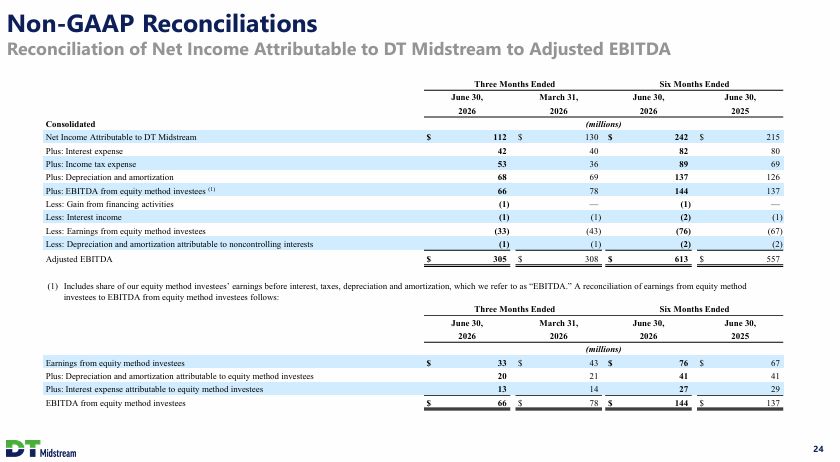
Non-GAAP Reconciliations Reconciliation of Net Income Attributable to DT
Midstream to Adjusted EBITDA Three Months Ended Six Months Ended June 30, 2026 March 31, 2026 June 30, 2026 June 30, 2025 Consolidated (millions) Net Income Attributable to DT Midstream Plus: Interest
expense $ 112 42 $ 130 40 36 69 78 — $ 242 82 $ 215 80 Plus: Income tax expense 53 89 69 Plus: Depreciation and amortization Plus: EBITDA from equity method investees (1) Less: Gain from financing activities Less:
Interest income 68 137 144 126 137 — 66 (1) (1) (1) (33) (1) (1) (2) (76) (2) (1) Less: Earnings from equity method investees Less: Depreciation and amortization attributable to noncontrolling
interests (43) (1) (67) (2) Adjusted EBITDA $ 305 $ 308 $ 613 $ 557 (1) Includes share of our equity method investees’ earnings before interest, taxes, depreciation and amortization, which we refer to as “EBITDA.” A reconciliation
of earnings from equity method investees to EBITDA from equity method investees follows: Three Months Ended Six Months Ended June 30, 2026 March 31, 2026 June 30, 2026 June 30, 2025 (millions) Earnings from equity method
investees $ $ 33 20 13 66 $ $ 43 21 14 78 $ 76 41 $ $ 67 41 Plus: Depreciation and amortization attributable to equity method investees Plus: Interest expense attributable to equity method investees EBITDA from equity
method investees 27 29 $ 144 137 24
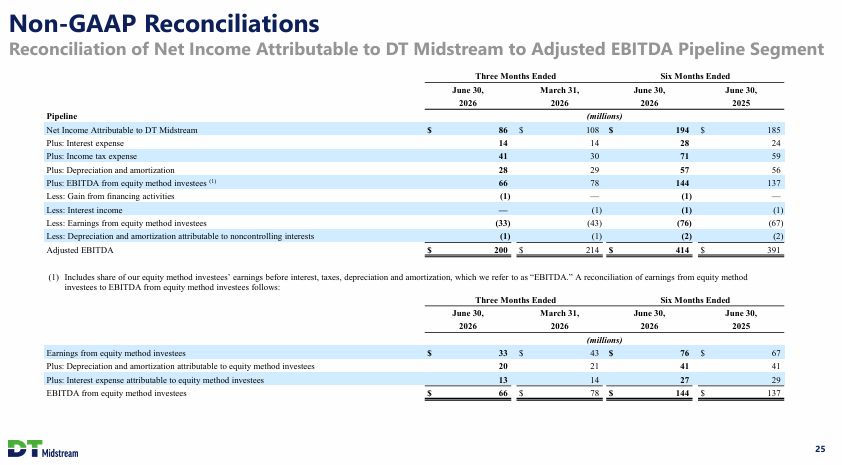
Non-GAAP Reconciliations Reconciliation of Net Income Attributable to DT
Midstream to Adjusted EBITDA Pipeline Segment Three Months Ended Six Months Ended June 30, 2026 March 31, 2026 June 30, 2026 June 30, 2025 Pipeline (millions) Net Income Attributable to DT Midstream Plus: Interest
expense $ 86 14 $ 108 14 30 29 78 — $ 194 28 $ 185 24 Plus: Income tax expense 41 71 59 Plus: Depreciation and amortization Plus: EBITDA from equity method investees (1) Less: Gain from financing activities Less:
Interest income 28 57 56 66 144 137 — (1) — (1) (1) (1) (76) (2) (1) Less: Earnings from equity method investees Less: Depreciation and amortization attributable to noncontrolling interests Adjusted
EBITDA (33) (1) 200 (43) (1) (67) (2) $ $ 214 $ 414 $ 391 (1) Includes share of our equity method investees’ earnings before interest, taxes, depreciation and amortization, which we refer to as “EBITDA.” A reconciliation of
earnings from equity method investees to EBITDA from equity method investees follows: Three Months Ended Six Months Ended June 30, 2026 March 31, 2026 June 30, 2026 June 30, 2025 (millions) Earnings from equity method
investees $ $ 33 20 13 66 $ $ 43 21 14 78 $ 76 41 $ $ 67 41 Plus: Depreciation and amortization attributable to equity method investees Plus: Interest expense attributable to equity method investees EBITDA from equity
method investees 27 29 $ 144 137 25
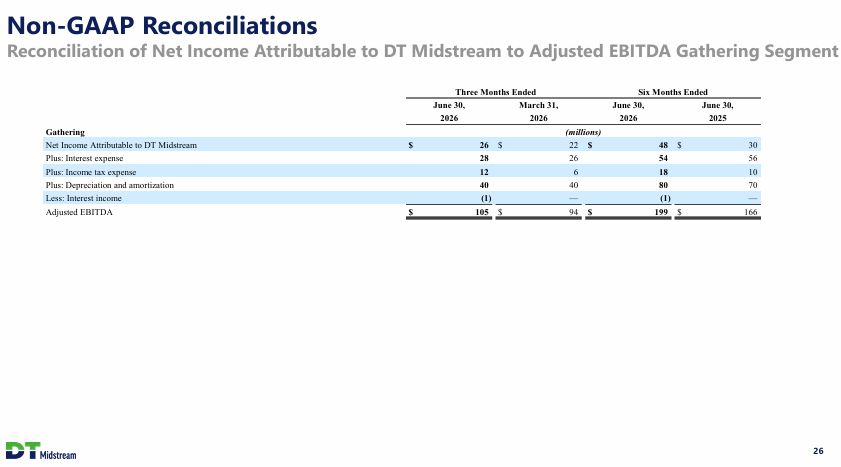
Non-GAAP Reconciliations Reconciliation of Net Income Attributable to DT
Midstream to Adjusted EBITDA Gathering Segment Three Months Ended Six Months Ended June 30, 2026 March 31, 2026 June 30, 2026 June 30, 2025 Gathering (millions) Net Income Attributable to DT Midstream Plus: Interest
expense $ $ 26 28 $ $ 22 26 6 $ 48 54 $ $ 30 56 Plus: Income tax expense Plus: Depreciation and amortization Less: Interest income 12 18 10 40 40 — 94 80 70 (1) 105 (1) 199 — Adjusted EBITDA $ 166 26
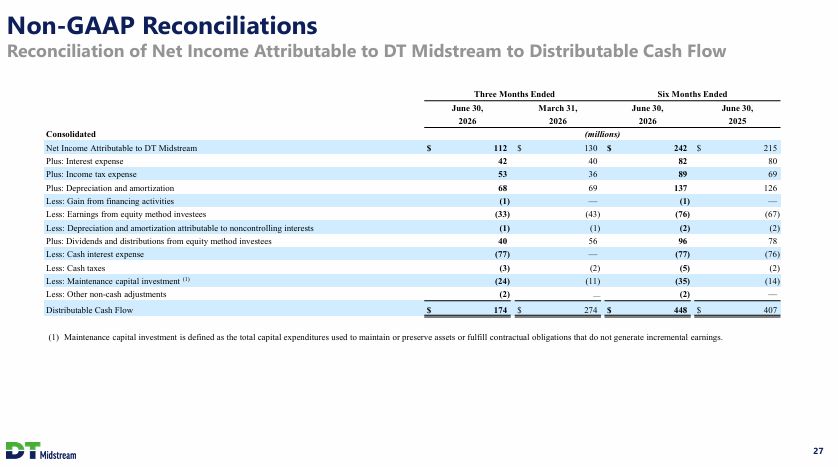
Non-GAAP Reconciliations Reconciliation of Net Income Attributable to DT
Midstream to Distributable Cash Flow Three Months Ended Six Months Ended June 30, 2026 March 31, 2026 June 30, 2026 June 30, 2025 Consolidated (millions) Net Income Attributable to DT Midstream Plus: Interest
expense $ 112 42 $ 130 40 $ 242 82 $ 215 80 Plus: Income tax expense 53 36 89 69 Plus: Depreciation and amortization Less: Gain from financing activities Less: Earnings from equity method investees Less: Depreciation and
amortization attributable to noncontrolling interests Plus: Dividends and distributions from equity method investees Less: Cash interest
expense 68 69 137 126 — (1) — (1) (33) (1) (43) (1) 56 (76) (2) (67) (2) 78 40 96 (77) (3) — (77) (5) (76) (2) (14) — Less: Cash taxes (2) (11) — Less: Maintenance capital investment (1) Less: Other non-cash
adjustments (24) (2) (35) (2) Distributable Cash Flow $ 174 $ 274 $ 448 $ 407 (1) Maintenance capital investment is defined as the total capital expenditures used to maintain or preserve assets or fulfill contractual obligations
that do not generate incremental earnings. 27