Please wait
UNITED STATES
SECURITIES AND EXCHANGE COMMISSION
Washington, D.C. 20549
FORM N-CSR
CERTIFIED SHAREHOLDER REPORT OF REGISTERED MANAGEMENT
INVESTMENT COMPANIES
Investment Company Act file number 811-23818
NC SLF INC.
(Exact name of registrant as specified in charter)
375 Park Avenue, 9th Floor
New York, NY 10152
(Address of Principal Executive Offices)
John D. McCally, Esq.
General Counsel
Churchill Asset Management LLC
8500 Andrew Carnegie Blvd
Charlotte, NC 28262
(Name and address of agent for service)
Registrant’s telephone number, including area code: (212) 478-9200
Date of fiscal year end: December 31, 2025
Date of reporting period: June 30, 2025
Item 1. Reports to Shareholders.
The semi-annual report to shareholders for the six months ended June 30, 2025 is filed herewith pursuant to Rule 30e-1 under the Investment Company Act of 1940, as amended.
NC SLF Inc.
Semi-Annual Report
June 30, 2025
TABLE OF CONTENTS
NC SLF INC.
Letter to Shareholders and Management’s Discussion of Company Performance (Unaudited)
August 11, 2025
Dear Shareholders:
Company Overview
We are pleased to submit to you the report of NC SLF Inc. (“we”, “us”, “our” or the “Company”) for the six months ended June 30, 2025. The net asset value (“NAV”) of our shares at that date was $9.63 per share. The total return for the six months ended June 30, 2025, as reflected in the Company’s consolidated financial highlights, was 3.72%. Please refer to “Note 9. Consolidated Financial Highlights” to the consolidated financial statements for further details. Investment Objective
Our investment objective is to generate current income and capital appreciation primarily by investing in or originating first lien and unitranche leveraged loans made to private equity-owned U.S. middle market companies that require capital for growth, acquisitions, recapitalizations, refinancings and leveraged buyouts, which we define as companies with approximately $10 million to $200 million of annual earnings before interest, taxes, depreciation, and amortization. We expect to make investments through both primary originations and open-market secondary purchases. We focus on making loans that we directly originate to U.S. middle market companies that operate in non-cyclical industries and demonstrate strong, consistent financial performance, market leadership, and are led by experienced management teams. Our portfolio is expected to comprise primarily first lien senior secured debt and unitranche loans.
Portfolio Review
As of June 30, 2025, we had investments in 94 portfolio companies across 37 industries. Based on fair value as of June 30, 2025, 100.0% of our portfolio was invested in debt bearing a floating interest rate. As of June 30, 2025, our weighted average total yield of investments in debt securities at fair value was 9.74%. The weighted average yield was computed using the effective interest rates as of June 30, 2025, including accretion of original issue discount, but excluding investments on non-accrual status, if any.
For the six months ended June 30, 2025, net investment income was approximately $27.2 million, or $0.50 per weighted average common share.
For the six months ended June 30, 2025, we recorded a net increase in net assets resulting from operations of approximately $19.3 million, or $0.35 per weighted average common share (inclusive of realized and unrealized gains and losses).
For the six months ended June 30, 2025, we made additional investments of approximately $150.4 million, and received approximately $51.3 million from repayments of our investments.
Capital Markets Overview
The second quarter of 2025 began with the market absorbing the news and related uncertainty regarding the U.S. global trade policy, which ultimately led to a temporary pause in transaction activity early in the quarter. After the initial, temporary pause, new LBOs for high quality assets in resilient, non-tariff exposed sectors continued to move forward, and the quarter ended with a steady, stable rebound in market sentiment and investment opportunities. By June, investment activity had returned to a more normalized level, similar to what we experienced in the first quarter of this year.
During the second quarter, the Churchill platform closed or committed $3.4 billion across 106 transactions, bringing our platform volume over the last twelve months (LTM) ended June 30, 2025, to $13.5 billion across 191 transactions.
As we enter the second half of the year, we continue to see positive momentum. While geopolitical uncertainty is likely to persist for the time being, Churchill remains relatively insulated due to our portfolio consisting of U.S-based middle market businesses. We are closely monitoring the impacts to our portfolio companies, and we will continue to seek
investments in defensive businesses with low levels of cyclicality, strong levels of free cash flow generation, and multiple channels to source products or materials.
Sincerely,
Kenneth Kencel
President and Chief Executive Officer
This letter is intended to assist shareholders in understanding the Company’s performance during the six months ended June 30, 2025. The views and opinions in this letter were current as of August 11, 2025. Statements other than those of historical facts included herein may constitute forward-looking statements and are not guarantees of future performance or results and involve a number of risks and uncertainties. Actual results may differ materially from those in the forward-looking statements as a result of a number of factors. See “Forward-Looking Statements” below for more information. The Company undertakes no duty to update any forward-looking statement made herein. Information contained on our website is not incorporated by reference into this shareholder letter and you should not consider information contained on our website to be part of this shareholder letter or any other report we file with the Securities and Exchange Commission (the “SEC”).
_____________________________________________________________________________________________
Important Information
This report is transmitted to the shareholders of the Company and is furnished pursuant to certain regulatory requirements. This report and the information and views herein do not constitute investment advice, or a recommendation or an offer to enter into any transaction with the Company or any of its affiliates. This report is provided for informational purposes only, does not constitute an offer to sell securities of the Company and is not a prospectus.
An investment in the Company is not appropriate for all investors. Shares of closed-end investment companies, such as the Company, frequently trade at a discount from their NAV, which may increase investors’ risk of loss. Past performance is not indicative of, or a guarantee of, future performance. The performance and certain other portfolio information quoted herein represents information as of June 30, 2025. Nothing herein should be relied upon as a representation as to the future performance or portfolio holdings of the Company. Investment return and principal value of an investment will fluctuate, and shares, when sold, may be worth more or less than their original cost. The Company’s performance is subject to change since the end of the period noted in this Annual Report and may be lower or higher than the performance data shown herein.
About NC SLF Inc.
NC SLF Inc. is a registered closed-end management investment company. Its investment objective is to generate current income and capital appreciation primarily by investing in or originating first lien and unitranche leveraged loans made to private equity-owned U.S. middle-market companies that require capital for growth, acquisitions, recapitalizations, refinancings and leveraged buyouts.
Forward-Looking Statements
This report contains forward-looking statements that involve substantial risks and uncertainties. Such statements involve known and unknown risks, uncertainties and other factors and undue reliance should not be placed thereon. These forward-looking statements are not historical facts, but rather are based on our current expectations and estimates, our current and prospective portfolio investments, our industry, our beliefs and opinions, and our assumptions. Words such as “anticipates,” “expects,” “intends,” “plans,” “will,” “may,” “continue,” “believes,” “seeks,” “estimates,” “would,” “could,” “should,” “targets,” “projects,” “outlook,” “potential,” “predicts” and variations of these words and similar expressions are intended to identify forward-looking statements. These statements are not guarantees of future performance and are subject to risks, uncertainties and other factors, some of which are beyond our control and difficult to predict and could cause actual results to differ materially from those expressed or forecasted in the forward-looking statements, including, without limitation:
•our future operating results;
•our business prospects and the prospects of our portfolio companies;
•the dependence of our future success on the general economy and its impact on the industries in which we invest;
•changes in the markets in which we invest and changes in financial and lending markets generally;the impact of a protracted decline in the liquidity of credit markets on our business;
•the impact of increased competition;
•an economic downturn or recession and its impact on the ability of our portfolio companies to operate and the investment opportunities available to us;
•the impact of interest rate volatility on our business, our financial condition and our portfolio companies;
•the impact of supply chain constraints and labor difficulties on our portfolio companies and the global economy;
•the level of inflation and its impact on our portfolio companies and on the industries in which we invest;
•the uncertainty associated with the imposition of tariffs and trade barriers and changes in trade policies and its impact on our portfolio companies and the global economy;
•the impact of geopolitical conditions, including the conflict between Ukraine and Russia and the conflicts in the Middle East, and their impact on financial market volatility, global economic markets, and various sectors, industries and markets for commodities globally, such as oil and natural gas;
•our contractual arrangements and relationships with third parties;
•the valuation of our investments in portfolio companies, particularly those having no liquid trading market;
•actual and potential conflicts of interest with Churchill Asset Management LLC, our investment adviser (“Churchill” or the “Investment Adviser”) and/or its affiliates;
•the ability of our portfolio companies to achieve their objectives;
•the use of borrowed money to finance a portion of our investments;
•the adequacy of our financing sources and working capital;
•the timing of cash flows, if any, from the operations of our portfolio companies;
•the ability of the Investment Adviser to locate suitable investments for us and to monitor and administer our investments;
•the ability of the Investment Adviser or its affiliates to attract and retain highly talented professionals;
•our ability to qualify and maintain our qualification as a regulated investment company (a “RIC”); and
•the impact of future legislation and regulation on our business and our portfolio companies.
Although we believe that the assumptions on which these forward-looking statements are based on are reasonable, any of those assumptions could prove to be inaccurate, and as a result, the forward-looking statements based on those assumptions also could be inaccurate. Important assumptions include our ability to originate new loans and investments, certain margins and levels of profitability and the availability of additional capital. In light of these and other uncertainties, the inclusion of a forward-looking statement in this report should not be regarded as a representation by us that our plans and objectives will be achieved. These forward-looking statements apply only as of the date of this report. Moreover, we assume no duty and do not undertake to update the forward-looking statements except as otherwise provided by law.
Strategy and Performance Overview (Unaudited)
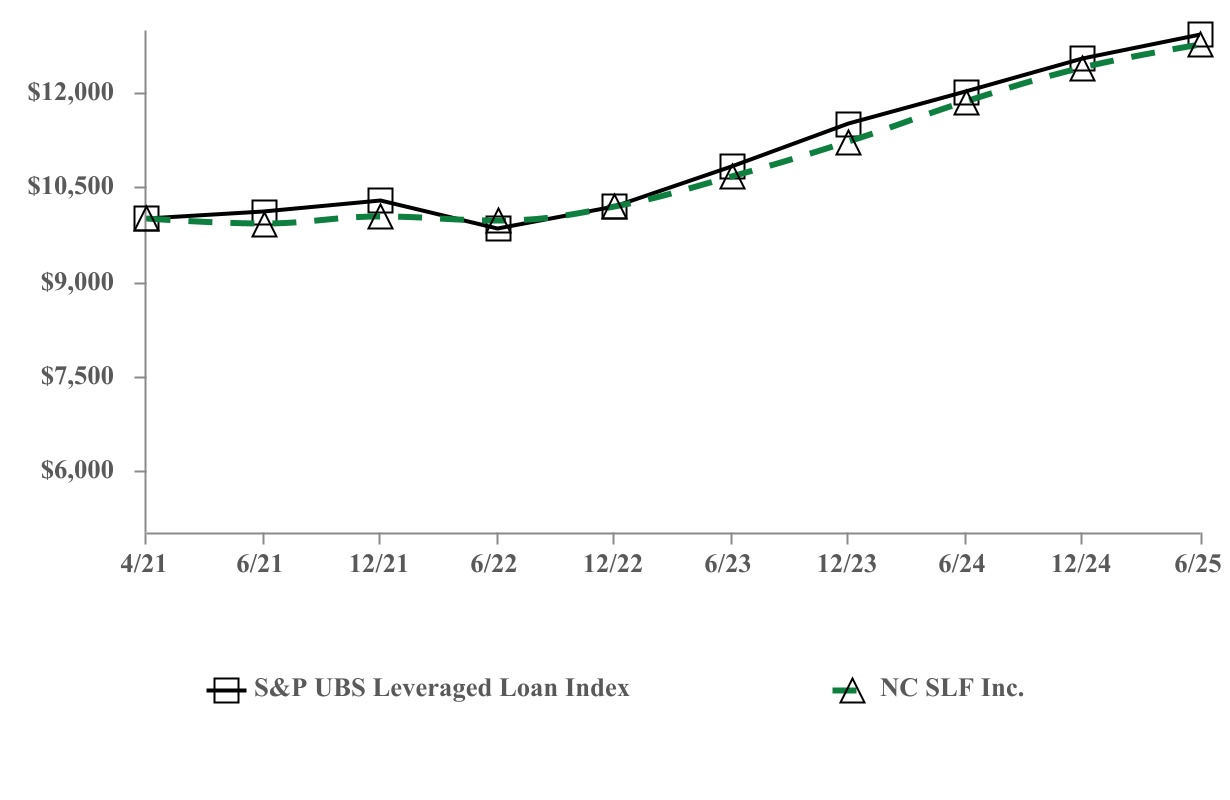
This graph compares the return on our common stock from April 16, 2021 (the inception date) to June 30, 2025 with that of S&P UBS Leveraged Loan Index. Prior to its registration as a closed-end fund under the 1940 Act on August 12, 2022, the Company operated as a business development company (“BDC”) from June 2, 2021 until August 12, 2022, whereupon it withdrew its election to be regulated as a BDC pursuant to Section 54(c) of the 1940 Act. The graph assumes that, on April 16, 2021 a person invested $10,000 in each of our common stock and the S&P UBS Leveraged Loan Index.
The graph measures total shareholder return, which takes into account changes in NAV and distributions. Distributions are assumed, for purposes of this calculation, to be reinvested at prices obtained under the Company’s distribution reinvestment plan (as applicable). Returns do not reflect the deduction of taxes that a shareholder would pay on Company distributions. Past performance is not indicative, or a guarantee, of future performance. Future results may vary and may be higher or lower than the data shown below.
COMPARISON OF INCEPTION TO DATE CUMULATIVE TOTAL RETURN*
NC SLF Inc. and the S&P UBS Leveraged Loan Index
*$10,000 invested on April 16, 2021 (the inception date) in stock or index, including reinvestment of dividends through June 30, 2025. Returns for NC SLF Inc. reflect the impact of waived management fees for the period from July 1, 2021 through October 4, 2022 (Refer to Note 5 to the consolidated financial statements for additional information).
| | | | | | | | | | | | | | | | | | | | |
| Total Return | | 1 Year | | 2 Year | | Since Inception
(April 16, 2021) |
NC SLF (1) | | 7.68 | % | | 9.83 | % | | 6.57 | % |
S&P UBS Leveraged Loan Index | | 7.50 | % | | 9.67 | % | | 6.94 | % |
(1) Return is calculated as the change in NAV per share during the period, plus distributions per share, if any, divided by the beginning NAV per share. Dividends and distributions, if any, are assumed for purposes of this calculation to be reinvested at the quarter end NAV per share preceding the distribution. Returns for NC SLF Inc. reflect the impact of waived management fees for the period from July 1, 2021 through October 4, 2022 (Refer to Note 5 to the consolidated financial statements for additional information). Returns longer than one year are annualized. Portfolio Composition
As of June 30, 2025, our investments consisted of the following (dollar amounts in thousands):
| | | | | | | | | | | | | | | | | |
| Amortized Cost | | Fair Value | | % of Fair Value |
| First-Lien Term Loans | $ | 805,603 | | | $ | 801,094 | | | 99.87 | % |
| Equity Investments | $ | 1,059 | | | $ | 1,059 | | | 0.13 | % |
| Total | $ | 806,662 | | | $ | 802,153 | | | 100.00 | % |
| Largest portfolio company investment | $ | 19,161 | | | $ | 19,443 | | | 2.42 | % |
| Average portfolio company investment | $ | 8,582 | | | $ | 8,534 | | | 1.06 | % |
The industry composition of our portfolio as a percentage of fair value as of June 30, 2025 was as follows:
| | | | | |
| Industry | |
| Aerospace & Defense | 2.42 | % |
| Air Freight & Logistics | 2.32 | % |
| Auto Components | 1.89 | % |
| Beverages | 0.52 | % |
| Building Products | 2.75 | % |
| Chemicals | 1.96 | % |
| Commercial Services & Supplies | 5.18 | % |
| Construction & Engineering | 4.91 | % |
| Construction Materials | 2.67 | % |
| Containers & Packaging | 3.25 | % |
| Distributors | 3.18 | % |
| Diversified Consumer Services | 1.49 | % |
| Diversified Financial Services | 6.10 | % |
| Diversified Telecommunication Services | 1.03 | % |
| Electrical Equipment | 1.50 | % |
| Electronic Equipment, Instruments & Components | 1.25 | % |
| Energy Equipment & Services | 2.17 | % |
| Food Products | 6.88 | % |
| Gas Utilities | 1.89 | % |
| Health Care Equipment & Supplies | 6.58 | % |
| Health Care Providers & Services | 9.00 | % |
| Hotels, Restaurants & Leisure | 0.17 | % |
| Household Durables | 0.71 | % |
| Household Products | 1.10 | % |
| Industrial Conglomerates | 2.30 | % |
| Insurance | 2.47 | % |
| Internet and Direct Marketing Retail | 1.23 | % |
| IT Services | 2.22 | % |
| Leisure Products | 0.90 | % |
| Machinery | 0.89 | % |
| Personal Products | 0.95 | % |
| Pharmaceuticals | 2.14 | % |
| Professional Services | 6.91 | % |
| Road & Rail | 0.63 | % |
| Software | 4.49 | % |
| Transportation Infrastructure | 2.60 | % |
| Wireless Telecommunication Services | 1.35 | % |
| Total | 100.00 | % |
The weighted average yield of our portfolio as of June 30, 2025 was as follows:
| | | | | |
Weighted average yield on debt and income producing investments, at cost (1) | 9.69 | % |
Weighted average yield on debt and income producing investments, at fair value (1) | 9.74 | % |
| Percentage of debt investments bearing a floating rate | 100.00 | % |
| Percentage of debt investments bearing a fixed rate | — | % |
_____________
(1) There were no investments on non-accrual status as of June 30, 2025.
The weighted average yield of our debt and income producing securities is not the same as a return on investment for our shareholders, but rather relates to our investment portfolio and is calculated before deduction of all of our fees and expenses. The weighted average yield was computed using the effective interest rates as of the reporting date, including accretion of original issue discount, but excluding investments on non-accrual status, if any. There can be no assurance that the weighted average yield will remain at its current level.
Asset Quality
In addition to various risk management and monitoring tools, we use the Investment Adviser’s investment rating system to characterize and monitor the credit profile and expected level of returns on each investment in our portfolio. Each investment team utilizes a systematic, consistent approach to credit evaluation, with a particular focus on an acceptable level of debt repayment and deleveraging under a “base case” set of projections (the “Base Case”), which generally reflects a more conservative estimate than the set of projections provided by a prospective portfolio company (the “Management Case”). The following is a description of the conditions associated with each investment rating:
1.Performing - Superior: Borrower is performing significantly above Management Case.
2.Performing - High: Borrower is performing at or near the Management Case (i.e., in a range slightly below to slightly above).
3.Performing - Low Risk: Borrower is operating well ahead of the Base Case to slightly below the Management Case.
4.Performing - Stable Risk: Borrower is operating at or near the Base Case (i.e., in a range slightly below to slightly above). This is the initial rating assigned to all new borrowers.
5.Performing - Management Notice: Borrower is operating below the Base Case. Adverse trends in business conditions and/or industry outlook are viewed as temporary. There is no immediate risk of payment default and only a low to moderate risk of covenant default.
6.Watch List - Low Maintenance: Borrower is operating below the Base Case, with declining margin of protection. Adverse trends in business conditions and/or industry outlook are viewed as probably lasting for more than a year. Payment default is still considered unlikely, but there is a moderate to high risk of covenant default.
7.Watch List - Medium Maintenance: Borrower is operating well below the Base Case, but has adequate liquidity. Adverse trends are more pronounced than in Internal Risk Rating 6 above. There is a high risk of covenant default, or it may have already occurred. Payments are current, although subject to greater uncertainty, and there is a moderate to high risk of payment default.
8.Watch List - High Maintenance: Borrower is operating well below the Base Case. Liquidity may be strained. Covenant default is imminent or may have occurred. Payments are current, but there is a high risk of payment default. Negotiations to restructure or refinance debt on normal terms may have begun. Further significant deterioration appears unlikely and no loss of principal is currently anticipated.
9.Watch List - Possible Loss: At the current level of operations and financial condition, the borrower does not have the ability to service and ultimately repay or refinance all outstanding debt on current terms. Liquidity is strained. Payment default may have occurred or is very likely in the short term unless creditors grant some relief. Loss of principal is possible.
10.Watch List - Probable Loss: At the current level of operations and financial condition, the borrower does not have the ability to service and ultimately repay or refinance all outstanding debt on current terms. Payment default is very likely or may have already occurred. Liquidity is extremely limited. The prospects for improvement in the borrower’s situation are sufficiently negative that loss of some or all principal is probable.
The Investment Adviser regularly monitors and, when appropriate, changes the investment rating assigned to each investment in our portfolio. Each investment team will review the investment ratings in connection with monthly or quarterly portfolio reviews.
The following table shows the investment ratings of the investments in our portfolio as of June 30, 2025 (dollar amounts in thousands):
| | | | | | | | | | | | | | | | | | | | |
| | Fair Value | | % of Portfolio | | Number of Portfolio Companies |
| 1 | | $ | — | | | — | % | | — | |
| 2 | | — | | | — | % | | — | |
| 3 | | 28,408 | | | 3.54 | % | | 2 | |
| 4 | | 682,091 | | | 85.03 | % | | 81 |
| 5 | | 57,528 | | | 7.17 | % | | 8 | |
| 6 | | 34,126 | | | 4.26 | % | | 3 | |
| 7 | | | | — | % | | — | |
| 8 | | — | | | — | % | | — | |
| 9 | | — | | | — | % | | — | |
| 10 | | — | | | — | % | | — | |
| Total | | $ | 802,153 | | | 100.00 | % | | 94 |
As of June 30, 2025, the weighted average Internal Risk Rating of our investment portfolio was 4.1.
Availability of Quarterly Portfolio Schedule
The Company files its complete schedule of portfolio holdings with the SEC for the first and third quarters of each fiscal year as an exhibit to its reports on Form N-PORT. The Company’s filings on Form N-PORT are available on the SEC’s website at www.sec.gov.
TOP TEN HOLDINGS
AS OF JUNE 30, 2025
(dollars in thousands)
(Unaudited)
| | | | | | | | | | | | | | | | | | | | | | | | | | |
| Investment | | Maturity | | Fair Value | | % Total Fair Value | | % of Net Assets |
| PAG Holding Corp. (Precision Aviation Group) | | 12/21/2029 | | $ | 19,443 | | | 2.42 | % | | 3.52 | % |
| Motion & Control Enterprises LLC | | 6/1/2028 | | 19,249 | | | 2.40 | % | | 3.49 | % |
| Nellson Nutraceutical, LLC | | 4/17/2031 | | 18,921 | | | 2.36 | % | | 3.43 | % |
| Heartland Paving Partners, LLC | | 8/9/2030 | | 18,845 | | | 2.35 | % | | 3.41 | % |
| Kenco PPC Buyer LLC | | 11/15/2029 | | 18,649 | | | 2.32 | % | | 3.38 | % |
| ISG Enterprises, LLC (Industrial Service Group) | | 12/7/2028 | | 18,436 | | | 2.30 | % | | 3.34 | % |
| Diligent Corporation (fka Diamond Merger Sub II, Corp.) | | 8/2/2030 | | 17,053 | | | 2.13 | % | | 3.09 | % |
| Olympus US Bidco LLC (Phaidon International) | | 8/22/2029 | | 16,800 | | | 2.09 | % | | 3.04 | % |
| FirstCall Mechanical Group, LLC | | 6/27/2030 | | 16,519 | | | 2.06 | % | | 2.99 | % |
| Redwood Services Group, LLC (Evergreen Services Group) | | 6/15/2029 | | 16,281 | | | 2.03 | % | | 2.95 | % |
| | | | | | 22.46 | % | | 32.64 | % |
NC SLF INC.
CONSOLIDATED STATEMENT OF ASSETS AND LIABILITIES (UNAUDITED)
(dollars in thousands, except share and per share data)
| | | | | |
| June 30, 2025 |
| |
| Assets | |
| Non-controlled/non-affiliated company investments, at fair value (amortized cost of $806,662) | $ | 802,153 | |
| Cash and cash equivalents | 14,613 | |
| Interest receivable | 4,630 | |
| Receivable for investments sold | 245 | |
| |
| Prepaid expenses | 107 | |
| Total assets | $ | 821,748 | |
| |
| Liabilities | |
| Secured borrowings (net of $3,385 deferred financing cost) | $ | 248,115 | |
| Payable for investments purchased | 3,044 | |
| Interest payable | 3,169 | |
| |
Management fees payable (See Note 5) | 903 | |
| Distributions payable | 13,757 | |
Directors' fees payable (See Note 5) | 15 | |
| Accounts payable and accrued expenses | 883 | |
| Total liabilities | 269,886 | |
| |
Commitments and contingencies (See Note 7) | |
| |
| |
| Common stock, par value $0.01 per share, 500,000,000 shares authorized, 57,322,385 shares issued and outstanding as of June 30, 2025 | 573 | |
| Paid-in-capital in excess of par value | 565,591 | |
| Total distributable earnings (loss) | (14,302) | |
| Total net assets | $ | 551,862 | |
| |
Net asset value per share (See Note 9) | $ | 9.63 | |
The accompanying notes are an integral part of these consolidated financial statements.
NC SLF INC.
CONSOLIDATED STATEMENT OF OPERATIONS (UNAUDITED)
(dollars in thousands, except share and per share data)
| | | | | |
| Six Months Ended June 30, 2025 |
| Investment income: | |
| Non-controlled/non-affiliated company investments: | |
| Interest income | $ | 37,608 | |
| Other income | 188 | |
| Total investment income | 37,796 | |
| |
| Expenses: | |
| Interest and debt financing expenses | 7,851 | |
| |
| 1,751 | |
| Professional fees | 343 | |
| 29 | |
Administration fees (See Note 5) | 412 | |
| Other general and administrative expenses | 208 | |
| Total expenses | 10,594 | |
| |
| |
| Net investment income (loss) | 27,202 |
| |
| Realized and unrealized gain (loss) on investments: | |
| Net realized gain (loss) on non-controlled/non-affiliated company investments | (6,787) | |
| Net change in unrealized appreciation (depreciation) on non-controlled/non-affiliated company investments | (1,111) | |
| Total net realized and unrealized gain (loss) on investments | (7,898) | |
| |
| Net increase (decrease) in net assets resulting from operations | $ | 19,304 | |
| |
| Per share data: | |
| Net investment income (loss) per share | $ | 0.50 | |
| Net increase (decrease) in net assets resulting from operations per share | $ | 0.35 | |
| Weighted average common shares outstanding | 54,560,031 | |
The accompanying notes are an integral part of these consolidated financial statements.
NC SLF INC.
CONSOLIDATED STATEMENTS OF CHANGES IN NET ASSETS
(dollars in thousands, except share and per share data)
| | | | | | | | | | | | | | | | |
| Six Months Ended June 30, | | Year Ended December 31, | | | | | |
| 2025 | | 2024 | | | | | |
| (UNAUDITED) | | | | | | | |
| Increase (decrease) in net assets resulting from operations: | | | | | | | | |
| Net investment income (loss) | $ | 27,202 | | | $ | 49,257 | | | | | | |
| Net realized gain (loss) on investments | (6,787) | | | (4,596) | | | | | | |
| Net change in unrealized appreciation (depreciation) on investments | (1,111) | | | 6,746 | | | | | | |
| Net increase (decrease) in net assets resulting from operations | 19,304 | | | 51,407 | | | | | | |
| Shareholder distributions: | | | | | | | | |
Distributions declared from distributable earnings | (26,830) | | | (48,761) | | | | | | |
| Net increase (decrease) in net assets resulting from shareholder distributions | (26,830) | | | (48,761) | | | | | | |
| Capital share transactions: | | | | | | | | |
| Issuance of common shares | 25,000 | | | 105,000 | | | | | | |
| Reinvestment of shareholder distributions | 25,889 | | | 45,645 | | | | | | |
| Net increase (decrease) in net assets resulting from capital share transactions | 50,889 | | | 150,645 | | | | | | |
| Total increase (decrease) in net assets | 43,363 | | | 153,291 | | | | | | |
| Net assets, beginning of period | 508,499 | | | 355,208 | | | | | | |
| Net assets, end of period | $ | 551,862 | | | $ | 508,499 | | | | | | |
The accompanying notes are an integral part of these consolidated financial statements.
NC SLF INC.
CONSOLIDATED STATEMENT OF CASH FLOWS (UNAUDITED)
(dollars in thousands, except share and per share data) | | | | | | | |
| Six Months Ended June 30, 2025 |
| Cash flows from operating activities: | | | |
| Net increase (decrease) in net assets resulting from operations | $ | 19,304 | | | |
| | | |
| Adjustments to reconcile net increase (decrease) in net assets resulting from operations to net cash provided by (used in) operating activities | | | |
| Purchase of investments | (150,427) | | | |
| Proceeds from principal repayments of investments and sales of investments | 51,299 | | | |
| Amortization of premium/accretion of discount, net | (922) | | | |
| Net realized (gain) loss on investments | 6,787 | | | |
| Net change in unrealized (appreciation) depreciation on investments | 1,111 | | | |
| Amortization of deferred financing costs | 469 | | | |
| Changes in operating assets and liabilities: | | | |
| Interest receivable | (234) | | | |
| Receivable for investments sold | (66) | | | |
| Prepaid expenses | (61) | | | |
| | | |
| | | |
| Payable for investments purchased | 3,044 | | | |
| Interest payable | 422 | | | |
| Management fees payable | 75 | | | |
| | | |
| Accounts payable and accrued expenses | 352 | | | |
| Net cash provided by (used in) operating activities | (68,847) | | | |
| | | |
| Cash flows from financing activities: | | | |
| Proceeds from issuance of common shares | 25,000 | | | |
| Shareholder distributions | (219) | | | |
| Proceeds from secured borrowings | 90,000 | | | |
| Repayments of secured borrowings | (49,500) | | | |
| Payments of deferred financing costs | (1,509) | | | |
| Net cash provided by (used in) financing activities | 63,772 | | | |
| | | |
| Net increase (decrease) in cash and cash equivalents | (5,075) | | | |
| Cash and cash equivalents, beginning of period | 19,688 | | | |
| Cash and cash equivalents, end of period | $ | 14,613 | | | |
| | | |
| Supplemental disclosure of cash flow Information: | | | |
| Cash paid during the period for interest | $ | 7,804 | | | |
| Taxes, including excise tax, paid during the period | $ | 44 | | | |
| Supplemental disclosure of non-cash flow information: | | | |
| Reinvestment of shareholder distributions | $ | 25,889 | | | |
| Distributions payable | $ | 13,757 | | | |
The accompanying notes are an integral part of these consolidated financial statements.
The following table provides a reconciliation of cash and cash equivalents reported on the consolidated statement of assets and liabilities that sum to the total of comparable amounts on the consolidated statement of cash flows (dollars in thousands):
| | | | | | | |
| June 30, 2025 | | |
| Cash | $ | 1,931 | | | |
| Cash Equivalents | 12,682 | | | |
| Total Cash and Cash Equivalents Shown on the Consolidated Statement of Cash Flows | $ | 14,613 | | | |
The accompanying notes are an integral part of these consolidated financial statements.
CONSOLIDATED SCHEDULE OF INVESTMENTS (UNAUDITED)
June 30, 2025
(dollar amounts in thousands, except shares)
| | | | | | | | | | | | | | | | | | | | | | | | | | | | | | | | | | | | | | | | | | | | | | | | | | | | | | | | |
Portfolio Company (1) (2) | | Footnotes | | Investment | | Spread Above Reference Rate (3) | | Interest Rate (3) | | Maturity Date | | Par Amount | | Amortized Cost | | Fair Value | | % of Net Assets (5) |
| | | | | | | | | | | | | | | | | | |
| Investments | | | | | | | | | | | | | | | | | | |
| Debt Investments | | | | | | | | | | | | | | | | | | |
| Aerospace & Defense | | | | | | | | | | | | | | | | | | |
| PAG Holding Corp. (Precision Aviation Group) | | (4) (10) | | First Lien Debt | | S + 4.75% | | 9.05 | % | | 12/21/2029 | | $ | 14,592 | | | $ | 14,360 | | | $ | 14,602 | | | 2.64 | % |
| PAG Holding Corp. (Precision Aviation Group) | | (4) | | First Lien Debt (Delayed Draw) | | S + 4.75% | | 9.04 | % | | 12/21/2029 | | 4,837 | | | 4,801 | | 4,841 | | 0.88 | % |
| Total Aerospace & Defense | | | | | | | | | | | | | | 19,161 | | 19,443 | | 3.52 | % |
| | | | | | | | | | | | | | | | | | |
| Air Freight & Logistics | | | | | | | | | | | | | | | | | | |
| Kenco PPC Buyer LLC | | (4) (10) | | First Lien Debt | | S + 4.75% | | 9.00 | % | | 11/15/2029 | | 16,236 | | | 16,040 | | 16,085 | | 2.91 | % |
| Kenco PPC Buyer LLC | | (4) | | First Lien Debt (Delayed Draw) | | S + 4.75% | | 8.98 | % | | 11/15/2029 | | 2,594 | | | 2,564 | | 2,569 | | 0.47 | % |
| Kenco PPC Buyer LLC | | (4) (6) | | First Lien Debt (Delayed Draw) | | S + 4.75% | | 9.05 | % | | 11/15/2029 | | 488 | | | (4) | | (5) | | — | % |
| Total Air Freight & Logistics | | | | | | | | | | | | | | 18,600 | | 18,649 | | 3.38 | % |
| | | | | | | | | | | | | | | | | | |
| Auto Components | | | | | | | | | | | | | | | | | | |
| Randys Holdings, Inc. (Randy's Worldwide Automotive) | | (4) (7) | | First Lien Debt | | S + 5.00% | | 9.29 | % | | 11/1/2029 | | 12,797 | | | 12,638 | | 12,583 | | 2.28 | % |
| Randys Holdings, Inc. (Randy's Worldwide Automotive) | | (4) (6) (7) | | First Lien Debt (Delayed Draw) | | S + 5.00% | | 9.29 | % | | 11/1/2029 | | 4,359 | | | 2,683 | | 2,611 | | 0.47 | % |
| Total Auto Components | | | | | | | | | | | | | | 15,321 | | 15,194 | | 2.75 | % |
| | | | | | | | | | | | | | | | | | |
| Beverages | | | | | | | | | | | | | | | | | | |
| Refresh Buyer, LLC (Sunny Sky Products) | | (4) (10) | | First Lien Debt | | S + 4.75% | | 9.05 | % | | 12/23/2028 | | 3,374 | | | 3,350 | | 3,314 | | 0.60 | % |
| Refresh Buyer, LLC (Sunny Sky Products) | | (4) | | First Lien Debt (Delayed Draw) | | S + 4.75% | | 9.05 | % | | 12/23/2028 | | 854 | | | 854 | | 839 | | 0.15 | % |
| Total Beverages | | | | | | | | | | | | | | 4,204 | | 4,153 | | 0.75 | % |
| | | | | | | | | | | | | | | | | | |
| Building Products | | | | | | | | | | | | | | | | | | |
| Clean Solutions Buyer, Inc. | | (4) (10) | | First Lien Debt | | S + 4.50% | | 8.83 | % | | 9/9/2030 | | 4,240 | | | 4,203 | | 4,202 | | 0.76 | % |
| Cobalt Service Partners, LLC | | (4) (6) (7) | | First Lien Debt (Delayed Draw) | | S + 4.75% | | 9.05 | % | | 10/13/2031 | | 12,467 | | | 3,397 | | 3,336 | | 0.60 | % |
| Cobalt Service Partners, LLC | | (4) (7) (10) | | First Lien Debt | | S + 4.75% | | 9.05 | % | | 10/13/2031 | | 7,214 | | | 7,149 | | 7,146 | | 1.29 | % |
| Vertex Service Partners, LLC | | (4) (10) | | First Lien Debt | | S + 6.00% | | 10.30 | % | | 11/8/2030 | | 2,241 | | | 2,214 | | | 2,263 | | | 0.41 | % |
CONSOLIDATED SCHEDULE OF INVESTMENTS (UNAUDITED)
June 30, 2025
(dollar amounts in thousands, except shares)
| | | | | | | | | | | | | | | | | | | | | | | | | | | | | | | | | | | | | | | | | | | | | | | | | | | | | | | | |
Portfolio Company (1) (2) | | Footnotes | | Investment | | Spread Above Reference Rate (3) | | Interest Rate (3) | | Maturity Date | | Par Amount | | Amortized Cost | | Fair Value | | % of Net Assets (5) |
| Vertex Service Partners, LLC | | (4) (6) | | First Lien Debt (Delayed Draw) | | S + 6.00% | | 10.30 | % | | 11/8/2030 | | $ | 4,407 | | | $ | 845 | | | $ | 779 | | | 0.14 | % |
| Vertex Service Partners, LLC | | (4) | | First Lien Debt (Delayed Draw) | | S + 6.00% | | 10.30 | % | | 11/8/2030 | | 4,319 | | | 4,313 | | 4,363 | | 0.79 | % |
| Total Building Products | | | | | | | | | | | | | | 22,121 | | 22,089 | | 3.99 | % |
| | | | | | | | | | | | | | | | | | |
| Chemicals | | | | | | | | | | | | | | | | | | |
| Chroma Color Corporation | | (4) | | First Lien Debt | | S + 4.25% | | 8.53 | % | | 4/23/2029 | | 3,006 | | | 2,965 | | | 2,962 | | | 0.54 | % |
| Chroma Color Corporation | | (4) | | First Lien Debt (Delayed Draw) | | S + 4.25% | | 8.55 | % | | 4/23/2029 | | 664 | | | 659 | | 654 | | 0.12 | % |
| Olympic Buyer, Inc. (Ascensus) | | (4) (7) | | First Lien Debt | | S + 4.25% | | 8.68 | % | | 6/30/2028 | | 13,927 | | | 13,787 | | 12,099 | | 2.19 | % |
| Total Chemicals | | | | | | | | | | | | | | 17,411 | | 15,715 | | 2.85 | % |
| | | | | | | | | | | | | | | | | | |
| Commercial Services & Supplies | | | | | | | | | | | | | | | | | | |
| FirstCall Mechanical Group, LLC | | (4) (10) | | First Lien Debt | | S + 4.75% | | 9.05 | % | | 6/27/2030 | | 6,501 | | | 6,446 | | 6,443 | | 1.17 | % |
| FirstCall Mechanical Group, LLC | | (4) (6) | | First Lien Debt (Delayed Draw) | | S + 4.75% | | 9.05 | % | | 6/27/2030 | | 13,082 | | | 10,181 | | 10,076 | | 1.83 | % |
| Integrated Power Services Holdings, Inc. | | (4) | | First Lien Debt | | S + 4.50% | | 8.94 | % | | 11/22/2028 | | 4,915 | | | 4,898 | | 4,915 | | 0.89 | % |
| Olympus US Bidco LLC (Phaidon International) | | (4) (8) | | First Lien Debt | | S + 5.50% | | 9.93 | % | | 8/22/2029 | | 17,237 | | | 17,132 | | 16,800 | | 3.03 | % |
| Safety Infrastructure Services Intermediate LLC | | (4) (6) | | First Lien Debt (Delayed Draw) | | S + 5.00% | | 9.31 | % | | 7/21/2028 | | 1,727 | | | 306 | | 276 | | 0.05 | % |
| Safety Infrastructure Services Intermediate LLC | | (4) (10) | | First Lien Debt | | S + 5.00% | | 9.30 | % | | 7/21/2028 | | 3,077 | | | 3,053 | | 3,016 | | 0.55 | % |
| Total Commercial Services & Supplies | | | | | | | | | | | | | | 42,016 | | 41,526 | | 7.52 | % |
| | | | | | | | | | | | | | | | | | |
| Construction & Engineering | | | | | | | | | | | | | | | | | | |
| CLS Management Services, LLC (Contract Land Staff) | | (4) (10) | | First Lien Debt | | S + 5.00% | | 9.30 | % | | 3/27/2030 | | 3,251 | | | 3,224 | | 3,224 | | 0.58 | % |
| CLS Management Services, LLC (Contract Land Staff) | | (4) | | First Lien Debt (Delayed Draw) | | S + 5.00% | | 9.30 | % | | 3/27/2030 | | 1,307 | | | 1,305 | | 1,296 | | 0.23 | % |
| CLS Management Services, LLC (Contract Land Staff) | | (4) (6) | | First Lien Debt (Delayed Draw) | | S + 5.00% | | 9.30 | % | | 3/27/2030 | | 2,176 | | | (5) | | (18) | | — | % |
| ERA Industries, LLC (BTX Precision) | | (4) (10) | | First Lien Debt | | S + 4.75% | | 9.08 | % | | 7/25/2030 | | 679 | | | 671 | | 673 | | 0.12 | % |
| ERA Industries, LLC (BTX Precision) | | (4) (10) | | First Lien Debt | | S + 5.00% | | 9.28 | % | | 7/25/2030 | | 363 | | | 359 | | 360 | | 0.07 | % |
| ERA Industries, LLC (BTX Precision) | | (4) (6) | | First Lien Debt (Delayed Draw) | | S + 5.00% | | 9.33 | % | | 7/25/2030 | | 513 | | | (2) | | (5) | | — | % |
CONSOLIDATED SCHEDULE OF INVESTMENTS (UNAUDITED)
June 30, 2025
(dollar amounts in thousands, except shares)
| | | | | | | | | | | | | | | | | | | | | | | | | | | | | | | | | | | | | | | | | | | | | | | | | | | | | | | | |
Portfolio Company (1) (2) | | Footnotes | | Investment | | Spread Above Reference Rate (3) | | Interest Rate (3) | | Maturity Date | | Par Amount | | Amortized Cost | | Fair Value | | % of Net Assets (5) |
| ERA Industries, LLC (BTX Precision) | | (4) | | First Lien Debt (Delayed Draw) | | S + 4.75% | | 9.06 | % | | 7/25/2030 | | $ | 389 | | | $ | 388 | | | $ | 385 | | | 0.07 | % |
| Heartland Paving Partners, LLC | | (4) (10) | | First Lien Debt | | S + 4.75% | | 8.97 | % | | 8/9/2030 | | 8,380 | | | 8,307 | | 8,305 | | 1.50 | % |
| Heartland Paving Partners, LLC | | (4) (6) | | First Lien Debt (Delayed Draw) | | S + 4.75% | | 8.94 | % | | 8/9/2030 | | 5,629 | | | 5,005 | | | 4,967 | | | 0.90 | % |
| Heartland Paving Partners, LLC | | (4) | | First Lien Debt (Delayed Draw) | | S + 4.75% | | 8.89 | % | | 8/9/2030 | | 5,623 | | | 5,611 | | 5,573 | | 1.01 | % |
| ICE USA Infrastructure, Inc. | | (4) (10) | | First Lien Debt | | S + 5.75% | | 10.05 | % | | 3/15/2030 | | 793 | | | 786 | | 772 | | 0.14 | % |
| ICE USA Infrastructure, Inc. | | (4) (10) | | First Lien Debt | | S + 5.75% | | 10.05 | % | | 3/15/2030 | | 2,846 | | | 2,823 | | 2,770 | | 0.50 | % |
| MEI Buyer LLC | | (4) (10) | | First Lien Debt | | S + 5.00% | | 9.33 | % | | 6/29/2029 | | 5,443 | | | 5,363 | | 5,443 | | 0.99 | % |
| MEI Buyer LLC | | (4) | | First Lien Debt (Delayed Draw) | | S + 5.00% | | 9.31 | % | | 6/29/2029 | | 870 | | | 868 | | 870 | | 0.16 | % |
| WSB Engineering Holdings Inc. | | (4) (10) | | First Lien Debt | | S + 4.50% | | 8.83 | % | | 8/31/2029 | | 3,101 | | | 3,067 | | 3,070 | | 0.56 | % |
| WSB Engineering Holdings Inc. | | (4) (6) | | First Lien Debt (Delayed Draw) | | S + 4.50% | | 8.83 | % | | 8/31/2029 | | 14,508 | | | (54) | | (144) | | (0.03) | % |
| WSB Engineering Holdings Inc. | | (4) (6) | | First Lien Debt (Delayed Draw) | | S + 4.50% | | 8.78 | % | | 8/31/2029 | | 2,079 | | | 1,817 | | 1,806 | | 0.33 | % |
| Total Construction & Engineering | | | | | | | | | | | | | | 39,533 | | 39,347 | | 7.13 | % |
| | | | | | | | | | | | | | | | | | |
| Construction Materials | | | | | | | | | | | | | | | | | | |
| Java Buyer, Inc. (Sciens Building Solutions, LLC) | | (4) (7) | | First Lien Debt (Delayed Draw) | | S + 5.00% | | 9.28 | % | | 12/15/2027 | | 5,211 | | | 5,189 | | 5,189 | | 0.94 | % |
| Java Buyer, Inc. (Sciens Building Solutions, LLC) | | (4) (7) | | First Lien Debt | | S + 5.00% | | 9.28 | % | | 12/15/2027 | | 9,866 | | | 9,774 | | 9,824 | | 1.78 | % |
| SCIC Buyer, Inc. | | (4) (6) | | First Lien Debt (Delayed Draw) | | S + 5.00% | | 9.30 | % | | 3/28/2031 | | 1,352 | | | (3) | | (8) | | — | % |
| SCIC Buyer, Inc. | | (4) (10) | | First Lien Debt | | S + 5.00% | | 9.30 | % | | 3/28/2031 | | 6,432 | | | 6,369 | | 6,395 | | 1.16 | % |
| Total Construction Materials | | | | | | | | | | | | | | 21,329 | | 21,400 | | 3.88 | % |
| | | | | | | | | | | | | | | | | | |
| Containers & Packaging | | | | | | | | | | | | | | | | | | |
| Impact Parent Corporation (Impact Environmental Group) | | (4) (6) | | First Lien Debt (Delayed Draw) | | S + 5.25% | | 9.65 | % | | 3/23/2029 | | 2,755 | | | 393 | | 364 | | 0.07 | % |
| Impact Parent Corporation (Impact Environmental Group) | | (4) | | First Lien Debt | | S + 5.25% | | 9.65 | % | | 3/23/2029 | | 3,578 | | | 3,527 | | | 3,527 | | | 0.64 | % |
| Impact Parent Corporation (Impact Environmental Group) | | (4) (10) | | First Lien Debt | | S + 5.25% | | 9.65 | % | | 3/23/2029 | | 733 | | | 723 | | 723 | | 0.13 | % |
| Impact Parent Corporation (Impact Environmental Group) | | (4) | | First Lien Debt (Delayed Draw) | | S + 5.25% | | 9.65 | % | | 3/23/2029 | | 1,672 | | | 1,666 | | 1,648 | | 0.30 | % |
| Impact Parent Corporation (Impact Environmental Group) | | (4) | | First Lien Debt (Delayed Draw) | | S + 5.25% | | 9.65 | % | | 3/23/2029 | | 1,512 | | | 1,510 | | 1,491 | | 0.27 | % |
| Impact Parent Corporation (Impact Environmental Group) | | (4) | | First Lien Debt (Delayed Draw) | | S + 5.25% | | 9.65 | % | | 3/23/2029 | | 3,263 | | | 3,252 | | 3,217 | | 0.58 | % |
| New Spartech Holdings LLC | | (4) | | First Lien Debt | | S + 7.00% | | 11.31 | % | | 3/31/2030 | | 961 | | | 942 | | 961 | | 0.17 | % |
CONSOLIDATED SCHEDULE OF INVESTMENTS (UNAUDITED)
June 30, 2025
(dollar amounts in thousands, except shares)
| | | | | | | | | | | | | | | | | | | | | | | | | | | | | | | | | | | | | | | | | | | | | | | | | | | | | | | | |
Portfolio Company (1) (2) | | Footnotes | | Investment | | Spread Above Reference Rate (3) | | Interest Rate (3) | | Maturity Date | | Par Amount | | Amortized Cost | | Fair Value | | % of Net Assets (5) |
| New Spartech Holdings LLC | | (4) (7) | | First Lien Debt | | S + 5.25% | | 9.56 | % | | 9/30/2030 | | $ | 1,571 | | | $ | 1,571 | | | $ | 1,571 | | | 0.28 | % |
| Online Labels Group, LLC | | (4) (10) | | First Lien Debt | | S + 5.25% | | 9.55 | % | | 12/19/2029 | | 1,583 | | | 1,571 | | 1,583 | | 0.29 | % |
| Online Labels Group, LLC | | (4) (6) | | First Lien Debt (Delayed Draw) | | S + 5.25% | | 9.55 | % | | 12/19/2029 | | 195 | | | — | | — | | — | % |
| Online Labels Group, LLC | | (4) (6) | | First Lien Debt (Delayed Draw) | | S + 5.25% | | 9.55 | % | | 12/19/2029 | | 195 | | | 97 | | 97 | | 0.02 | % |
| Pelican Products, Inc. | | (7) (9) | | First Lien Debt | | S + 4.25% | | 8.81 | % | | 12/29/2028 | | 7,720 | | | 7,679 | | | 6,789 | | | 1.23 | % |
| Performance Packaging Buyer, LLC | | (4) (10) | | First Lien Debt | | S + 4.50% | | 8.63 | % | | 4/15/2031 | | 3,053 | | | 3,023 | | 3,024 | | 0.55 | % |
| Total Containers & Packaging | | | | | | | | | | | | | | 25,954 | | 24,995 | | 4.53 | % |
| | | | | | | | | | | | | | | | | | |
| Distributors | | | | | | | | | | | | | | | | | | |
| Motion & Control Enterprises LLC | | (4) (10) | | First Lien Debt | | S + 6.00% | | 10.32 | % | | 6/1/2028 | | 3,971 | | | 3,939 | | | 3,936 | | | 0.71 | % |
| Motion & Control Enterprises LLC | | (4) | | First Lien Debt (Delayed Draw) | | S + 6.00% | | 10.32 | % | | 6/1/2028 | | 10,932 | | | 10,929 | | 10,834 | | 1.96 | % |
| Motion & Control Enterprises LLC | | (4) | | First Lien Debt (Delayed Draw) | | S + 6.00% | | 10.32 | % | | 6/1/2028 | | 3,971 | | | 3,971 | | 3,936 | | 0.71 | % |
| Motion & Control Enterprises LLC | | (4) (10) | | First Lien Debt | | S + 6.00% | | 10.32 | % | | 6/1/2028 | | 548 | | | 544 | | 543 | | 0.10 | % |
| Rhino Intermediate Holding Company, LLC (Rhino Tool House) | | (4) (10) | | First Lien Debt | | S + 5.25% | | 9.69 | % | | 4/4/2029 | | 5,280 | | | 5,212 | | 5,204 | | 0.94 | % |
| Rhino Intermediate Holding Company, LLC (Rhino Tool House) | | (4) | | First Lien Debt (Delayed Draw) | | S + 5.25% | | 9.70 | % | | 4/4/2029 | | 1,058 | | | 1,055 | | 1,043 | | 0.19 | % |
| Total Distributors | | | | | | | | | | | | | | 25,650 | | 25,496 | | 4.61 | % |
| | | | | | | | | | | | | | | | | | |
| Diversified Consumer Services | | | | | | | | | | | | | | | | | | |
| Excel Fitness Holdings, Inc. | | (4) (10) | | First Lien Debt | | S + 5.25% | | 9.55 | % | | 4/27/2029 | | 11,760 | | | 11,673 | | 11,760 | | 2.13 | % |
| Excel Fitness Holdings, Inc. | | (4) (6) | | First Lien Debt (Delayed Draw) | | S + 5.50% | | 9.80 | % | | 4/27/2029 | | 1,031 | | | 199 | | 205 | | 0.04 | % |
| Total Diversified Consumer Services | | | | | | | | | | | | | | 11,872 | | 11,965 | | 2.17 | % |
| | | | | | | | | | | | | | | | | | |
| Diversified Financial Services | | | | | | | | | | | | | | | | | | |
| Ascend Partner Services LLC | | (4) (10) | | First Lien Debt | | S + 4.50% | | 8.75 | % | | 8/11/2031 | | 7,211 | | | 7,149 | | | 7,231 | | | 1.31 | % |
| Ascend Partner Services LLC | | (4) (6) | | First Lien Debt (Delayed Draw) | | S + 4.50% | | 8.74 | % | | 8/11/2031 | | 12,453 | | | 8,819 | | 8,905 | | 1.61 | % |
| Cohen Advisory, LLC | | (4) (6) | | First Lien Debt (Delayed Draw) | | S + 4.50% | | 8.78 | % | | 12/31/2031 | | 2,100 | | | 85 | | 79 | | 0.01 | % |
| Cohen Advisory, LLC | | (4) (10) | | First Lien Debt | | S + 4.50% | | 8.78 | % | | 12/31/2031 | | 3,762 | | | 3,728 | | | 3,734 | | | 0.68 | % |
| KRIV Acquisition, Inc. (Riveron) | | (4) (10) | | First Lien Debt | | S + 5.75% | | 10.05 | % | | 7/6/2029 | | 9,677 | | | 9,477 | | | 9,632 | | | 1.75 | % |
CONSOLIDATED SCHEDULE OF INVESTMENTS (UNAUDITED)
June 30, 2025
(dollar amounts in thousands, except shares)
| | | | | | | | | | | | | | | | | | | | | | | | | | | | | | | | | | | | | | | | | | | | | | | | | | | | | | | | |
Portfolio Company (1) (2) | | Footnotes | | Investment | | Spread Above Reference Rate (3) | | Interest Rate (3) | | Maturity Date | | Par Amount | | Amortized Cost | | Fair Value | | % of Net Assets (5) |
| KRIV Acquisition, Inc. (Riveron) | | (4) | | First Lien Debt (Delayed Draw) | | S + 5.75% | | 10.05 | % | | 7/6/2029 | | $ | 1,452 | | | $ | 1,439 | | | $ | 1,445 | | | 0.26 | % |
| Sagebrush Buyer, LLC (Province) | | (4) (10) | | First Lien Debt | | S + 5.00% | | 9.33 | % | | 7/1/2030 | | 2,034 | | | 2,017 | | | 2,016 | | | 0.37 | % |
| Smith & Howard Advisory LLC | | (4) (6) | | First Lien Debt (Delayed Draw) | | S + 5.00% | | 9.29 | % | | 11/26/2030 | | 1,023 | | | 481 | | | 474 | | | 0.09 | % |
| Smith & Howard Advisory LLC | | (4) (10) | | First Lien Debt | | S + 5.00% | | 9.29 | % | | 11/26/2030 | | 1,266 | | | 1,255 | | 1,254 | | 0.23 | % |
| Vensure Employer Services, Inc. | | (4) (7) (10) | | First Lien Debt | | S + 4.75% | | 9.08 | % | | 9/27/2031 | | 14,200 | | | 14,091 | | 14,178 | | 2.57 | % |
| Vensure Employer Services, Inc. | | (4) (6) (7) | | First Lien Debt (Delayed Draw) | | S + 4.75% | | 9.08 | % | | 9/27/2031 | | 1,431 | | | (6) | | (2) | | — | % |
| Total Diversified Financial Services | | | | | | | | | | | | | | 48,535 | | 48,946 | | 8.88 | % |
| | | | | | | | | | | | | | | | | | |
| Diversified Telecommunication Services | | | | | | | | | | | | | | | | | | |
| Sapphire Telecom, Inc. | | (4) (10) | | First Lien Debt | | S + 5.00% | | 9.30 | % | | 6/27/2029 | | 8,246 | | | 8,179 | | 8,247 | | 1.49 | % |
| Total Diversified Telecommunication Services | | | | | | | | | | | | | | 8,179 | | 8,247 | | 1.49 | % |
| | | | | | | | | | | | | | | | | | |
| Electrical Equipment | | | | | | | | | | | | | | | | | | |
| Matador US Buyer, LLC (Insulation Technology Group) | | (4) (8) (10) | | First Lien Debt | | S + 5.00% | | 9.33 | % | | 6/25/2030 | | 9,682 | | | 9,599 | | | 9,589 | | | 1.74 | % |
| Matador US Buyer, LLC (Insulation Technology Group) | | (4) (6) (8) | | First Lien Debt (Delayed Draw) | | S + 5.00% | | 9.33 | % | | 6/25/2030 | | 2,561 | | | 2,439 | | 2,414 | | 0.44 | % |
| Total Electrical Equipment | | | | | | | | | | | | | | 12,038 | | 12,003 | | 2.18 | % |
| | | | | | | | | | | | | | | | | | |
| Electronic Equipment, Instruments & Components | | | | | | | | | | | | | | | | | | |
| INS Intermediate II, LLC (Ergotech DBA Industrial Networking Solutions) | | (4) (10) | | First Lien Debt | | S + 5.50% | | 9.98 | % | | 1/19/2029 | | 8,403 | | | 8,304 | | 8,325 | | 1.51 | % |
| INS Intermediate II, LLC (Ergotech DBA Industrial Networking Solutions) | | (4) | | First Lien Debt (Delayed Draw) | | S + 5.50% | | 9.98 | % | | 1/19/2029 | | 1,708 | | | 1,687 | | | 1,692 | | | 0.31 | % |
| Total Electronic Equipment, Instruments & Components | | | | | | | | | | | | | | 9,991 | | 10,017 | | 1.82 | % |
| | | | | | | | | | | | | | | | | | |
| Energy Equipment & Services | | | | | | | | | | | | | | | | | | |
| Ovation Holdings, Inc | | (4) (6) | | First Lien Debt (Delayed Draw) | | S + 5.00% | | 9.30 | % | | 2/4/2030 | | 3,427 | | | 2,824 | | | 2,851 | | | 0.52 | % |
| Ovation Holdings, Inc | | (4) (10) | | First Lien Debt | | S + 5.00% | | 9.28 | % | | 2/4/2030 | | 411 | | | 407 | | 410 | | 0.07 | % |
| Ovation Holdings, Inc | | (4) | | First Lien Debt | | S + 5.00% | | 9.28 | % | | 2/4/2030 | | 6,924 | | | 6,826 | | | 6,918 | | | 1.25 | % |
| Ovation Holdings, Inc | | (4) | | First Lien Debt (Delayed Draw) | | S + 5.00% | | 9.28 | % | | 2/4/2030 | | 1,639 | | | 1,625 | | | 1,637 | | | 0.30 | % |
CONSOLIDATED SCHEDULE OF INVESTMENTS (UNAUDITED)
June 30, 2025
(dollar amounts in thousands, except shares)
| | | | | | | | | | | | | | | | | | | | | | | | | | | | | | | | | | | | | | | | | | | | | | | | | | | | | | | | |
Portfolio Company (1) (2) | | Footnotes | | Investment | | Spread Above Reference Rate (3) | | Interest Rate (3) | | Maturity Date | | Par Amount | | Amortized Cost | | Fair Value | | % of Net Assets (5) |
| SI Solutions, LLC | | (4) (6) | | First Lien Debt (Delayed Draw) | | S + 4.75% | | 9.06 | % | | 8/15/2030 | | $ | 2,438 | | | $ | 482 | | | $ | 478 | | | 0.09 | % |
| SI Solutions, LLC | | (4) (10) | | First Lien Debt | | S + 4.75% | | 8.88 | % | | 8/15/2030 | | 5,142 | | | 5,098 | | 5,122 | | 0.93 | % |
| Total Energy Equipment & Services | | | | | | | | | | | | | | 17,262 | | 17,416 | | 3.16 | % |
| | | | | | | | | | | | | | | | | | |
| Food Products | | | | | | | | | | | | | | | | | | |
| AmerCareRoyal, LLC | | (4) (10) | | First Lien Debt | | S + 5.00% | | 9.33 | % | | 9/10/2030 | | 14,113 | | | 13,991 | | 13,704 | | 2.48 | % |
| AmerCareRoyal, LLC | | (4) (6) | | First Lien Debt (Delayed Draw) | | S + 5.00% | | 9.33 | % | | 9/10/2030 | | 3,257 | | | — | | (94) | | (0.02) | % |
| AmerCareRoyal, LLC | | (4) | | First Lien Debt (Delayed Draw) | | S + 5.00% | | 9.33 | % | | 9/10/2030 | | 2,248 | | | 2,238 | | 2,182 | | 0.40 | % |
| Commercial Bakeries Corp. | | (4) (8) (10) | | First Lien Debt | | S + 5.50% | | 9.80 | % | | 9/25/2029 | | 7,301 | | | 7,194 | | 7,158 | | 1.30 | % |
| Commercial Bakeries Corp. | | (4) (8) (10) | | First Lien Debt | | S + 5.50% | | 9.80 | % | | 9/25/2029 | | 1,842 | | | 1,829 | | 1,806 | | 0.33 | % |
| Commercial Bakeries Corp. | | (4) (8) (10) | | First Lien Debt | | S + 5.50% | | 9.82 | % | | 9/25/2029 | | 877 | | | 871 | | 860 | | 0.16 | % |
| FoodScience, LLC | | (4) (6) | | First Lien Debt (Delayed Draw) | | S + 4.50% | | 8.67 | % | | 11/14/2031 | | 2,750 | | | 800 | | 758 | | 0.14 | % |
| FoodScience, LLC | | (4) (10) | | First Lien Debt | | S + 4.50% | | 8.72 | % | | 11/14/2031 | | 2,567 | | | 2,544 | | 2,522 | | 0.46 | % |
| Nellson Nutraceutical, LLC | | (4) (7) (10) | | First Lien Debt | | S + 5.75% | | 10.05 | % | | 4/17/2031 | | 11,493 | | | 11,381 | | | 11,386 | | | 2.06 | % |
| Nellson Nutraceutical, LLC | | (4) (6) (7) | | First Lien Debt (Delayed Draw) | | S + 5.75% | | 10.05 | % | | 4/17/2031 | | 595 | | | (1) | | | (6) | | | — | % |
| Nellson Nutraceutical, LLC | | (4) (7) (10) | | First Lien Debt | | S + 5.75% | | 10.05 | % | | 4/17/2031 | | 7,612 | | | 7,538 | | | 7,541 | | | 1.37 | % |
| Sugar PPC Buyer LLC (Sugar Foods) | | (4) (7) (10) | | First Lien Debt | | S + 5.25% | | 9.50 | % | | 10/2/2030 | | 5,796 | | | 5,690 | | | 5,796 | | | 1.05 | % |
| Sugar PPC Buyer LLC (Sugar Foods) | | (4) (7) | | First Lien Debt (Delayed Draw) | | S + 5.25% | | 9.55 | % | | 10/2/2030 | | 1,610 | | | 1,596 | | 1,610 | | 0.29 | % |
| Total Food Products | | | | | | | | | | | | | | 55,671 | | 55,223 | | 10.02 | % |
| | | | | | | | | | | | | | | | | | |
| Gas Utilities | | | | | | | | | | | | | | | | | | |
| DH United Holdings, LLC (D&H United Fueling Solutions) | | (4) (10) | | First Lien Debt | | S + 5.00% | | 9.46 | % | | 9/15/2028 | | 7,193 | | | 7,108 | | | 7,116 | | | 1.29 | % |
| DH United Holdings, LLC (D&H United Fueling Solutions) | | (4) (6) | | First Lien Debt (Delayed Draw) | | S + 5.00% | | 9.47 | % | | 9/15/2028 | | 1,402 | | | (6) | | (15) | | — | % |
| DH United Holdings, LLC (D&H United Fueling Solutions) | | (4) (10) | | First Lien Debt | | S + 5.00% | | 9.45 | % | | 9/15/2028 | | 2,374 | | | 2,342 | | 2,349 | | 0.43 | % |
| DH United Holdings, LLC (D&H United Fueling Solutions) | | (4) (6) (7) | | First Lien Debt (Delayed Draw) | | S + 5.00% | | 9.42 | % | | 9/15/2028 | | 2,844 | | | 2,389 | | 2,369 | | 0.43 | % |
| DH United Holdings, LLC (D&H United Fueling Solutions) | | (4) | | First Lien Debt (Delayed Draw) | | S + 5.00% | | 9.47 | % | | 9/15/2028 | | 2,289 | | | 2,277 | | | 2,265 | | | 0.41 | % |
| DH United Holdings, LLC (D&H United Fueling Solutions) | | (4) | | First Lien Debt (Delayed Draw) | | S + 5.00% | | 9.41 | % | | 9/15/2028 | | 1,076 | | | 1,073 | | 1,065 | | 0.19 | % |
| Total Gas Utilities | | | | | | | | | | | | | | 15,183 | | | 15,149 | | | 2.75 | % |
| | | | | | | | | | | | | | | | | | |
CONSOLIDATED SCHEDULE OF INVESTMENTS (UNAUDITED)
June 30, 2025
(dollar amounts in thousands, except shares)
| | | | | | | | | | | | | | | | | | | | | | | | | | | | | | | | | | | | | | | | | | | | | | | | | | | | | | | | |
Portfolio Company (1) (2) | | Footnotes | | Investment | | Spread Above Reference Rate (3) | | Interest Rate (3) | | Maturity Date | | Par Amount | | Amortized Cost | | Fair Value | | % of Net Assets (5) |
| Health Care Equipment & Supplies | | | | | | | | | | | | | | | | | | |
| ACP Maverick Holdings, Inc. | | (4) (6) (7) | | First Lien Debt (Delayed Draw) | | S + 4.75% | | 9.05 | % | | 3/18/2031 | | $ | 3,582 | | | $ | (17) | | | $ | (34) | | | (0.01) | % |
| ACP Maverick Holdings, Inc. | | (4) (7) (10) | | First Lien Debt | | S + 4.75% | | 9.05 | % | | 3/18/2031 | | 16,077 | | | 15,922 | | 15,923 | | 2.89 | % |
| Bridges Consumer Healthcare Intermediate LLC | | (4) (6) | | First Lien Debt (Delayed Draw) | | S + 5.25% | | 9.49 | % | | 12/22/2031 | | 2,099 | | | (10) | | (45) | | (0.01) | % |
| Bridges Consumer Healthcare Intermediate LLC | | (4) (6) | | First Lien Debt (Delayed Draw) | | S + 5.25% | | 9.49 | % | | 12/22/2031 | | 1,199 | | | 953 | | 933 | | 0.17 | % |
| Bridges Consumer Healthcare Intermediate LLC | | (4) (10) | | First Lien Debt | | S + 5.25% | | 9.49 | % | | 12/22/2031 | | 2,518 | | | 2,495 | | 2,464 | | 0.45 | % |
| HMN Acquirer Corp. | | (4) (6) | | First Lien Debt (Delayed Draw) | | S + 4.50% | | 8.80 | % | | 11/5/2031 | | 1,056 | | | (2) | | (16) | | — | % |
| HMN Acquirer Corp. | | (4) (10) | | First Lien Debt | | S + 4.50% | | 8.80 | % | | 11/5/2031 | | 2,858 | | | 2,832 | | 2,813 | | 0.51 | % |
| Impact Advisors, LLC | | (4) (6) | | First Lien Debt (Delayed Draw) | | S + 4.75% | | 9.05 | % | | 3/19/2032 | | 7,010 | | | (34) | | (68) | | (0.01) | % |
| Impact Advisors, LLC | | (4) (10) | | First Lien Debt | | S + 4.75% | | 9.05 | % | | 3/19/2032 | | 12,587 | | | 12,464 | | 12,464 | | 2.25 | % |
| Tidi Legacy Products, Inc. | | (4) (7) (10) | | First Lien Debt | | S + 4.50% | | 8.83 | % | | 12/19/2029 | | 7,383 | | | 7,326 | | 7,457 | | 1.35 | % |
| Tidi Legacy Products, Inc. | | (4) (6) (7) | | First Lien Debt (Delayed Draw) | | S + 4.50% | | 8.83 | % | | 12/19/2029 | | 1,972 | | | — | | | 20 | | | — | % |
| YI, LLC (Young Innovations) | | (4) (7) (10) | | First Lien Debt | | S + 5.75% | | 10.06 | % | | 12/3/2029 | | 11,105 | | | 11,021 | | 10,869 | | 1.97 | % |
| Total Health Care Equipment & Supplies | | | | | | | | | | | | | | 52,950 | | 52,780 | | 9.56 | % |
| | | | | | | | | | | | | | | | | | |
| Health Care Providers & Services | | | | | | | | | | | | | | | | | | |
| AB Centers Acquisition Corporation (Action Behavior Centers) | | (4) (10) | | First Lien Debt | | S + 5.00% | | 9.32 | % | | 7/2/2031 | | 6,788 | | | 6,729 | | 6,924 | | 1.25 | % |
| AB Centers Acquisition Corporation (Action Behavior Centers) | | (4) (10) | | First Lien Debt | | S + 5.00% | | 9.33 | % | | 7/2/2031 | | 1,664 | | | 1,657 | | | 1,697 | | | 0.31 | % |
| AB Centers Acquisition Corporation (Action Behavior Centers) | | (4) (6) | | First Lien Debt (Delayed Draw) | | S + 5.00% | | 9.32 | % | | 7/2/2031 | | 1,238 | | | 443 | | 470 | | 0.09 | % |
| Bluebird PM Buyer, Inc. | | (4) (6) | | First Lien Debt (Delayed Draw) | | S + 4.75% | | 9.05 | % | | 2/3/2032 | | 502 | | | (1) | | | (4) | | | — | % |
| Bluebird PM Buyer, Inc. | | (4) (10) | | First Lien Debt | | S + 4.75% | | 9.05 | % | | 2/3/2032 | | 3,672 | | | 3,638 | | 3,644 | | 0.66 | % |
| Dermatology Intermediate Holdings III, Inc. (Forefront Dermatology) | | (4) (7) (10) | | First Lien Debt | | S + 4.25% | | 8.53 | % | | 3/30/2029 | | 4,533 | | | 4,487 | | 4,314 | | 0.78 | % |
| Eyesouth Eye Care Holdco LLC | | (4) | | First Lien Debt | | S + 5.50% | | 9.93 | % | | 10/5/2029 | | 7,647 | | | 7,533 | | 7,518 | | 1.36 | % |
| Eyesouth Eye Care Holdco LLC | | (4) | | First Lien Debt (Delayed Draw) | | S + 5.50% | | 9.93 | % | | 10/5/2029 | | 2,507 | | | 2,507 | | 2,465 | | 0.45 | % |
| JKC Buyer, Inc. (J. Knipper and Company Inc) | | (4) (10) | | First Lien Debt | | S + 5.00% | | 9.31 | % | | 2/13/2032 | | 2,644 | | | 2,621 | | 2,629 | | 0.48 | % |
CONSOLIDATED SCHEDULE OF INVESTMENTS (UNAUDITED)
June 30, 2025
(dollar amounts in thousands, except shares)
| | | | | | | | | | | | | | | | | | | | | | | | | | | | | | | | | | | | | | | | | | | | | | | | | | | | | | | | |
Portfolio Company (1) (2) | | Footnotes | | Investment | | Spread Above Reference Rate (3) | | Interest Rate (3) | | Maturity Date | | Par Amount | | Amortized Cost | | Fair Value | | % of Net Assets (5) |
| JKC Buyer, Inc. (J. Knipper and Company Inc) | | (4) | | First Lien Debt (Delayed Draw) | | S + 5.00% | | 9.33 | % | | 2/13/2032 | | $ | 915 | | | $ | 911 | | | $ | 910 | | | 0.16 | % |
| OMERS Relief Acquisition, LLC (Gastro Health) | | (4) | | First Lien Debt | | S + 4.50% | | 8.94 | % | | 7/3/2028 | | 8,122 | | | 8,094 | | | 8,024 | | | 1.45 | % |
| Promptcare Infusion Buyer, Inc. | | (4) (7) | | First Lien Debt | | S + 6.00% | | 10.39 | % | | 9/1/2027 | | 9,073 | | | 9,049 | | | 8,890 | | | 1.61 | % |
| Promptcare Infusion Buyer, Inc. | | (4) (7) | | First Lien Debt (Delayed Draw) | | S + 6.00% | | 10.38 | % | | 9/1/2027 | | 1,413 | | | 1,412 | | 1,385 | | 0.25 | % |
| Promptcare Infusion Buyer, Inc. | | (4) (6) (7) | | First Lien Debt (Delayed Draw) | | S + 6.00% | | 10.38 | % | | 9/1/2027 | | 1,245 | | | 619 | | | 594 | | | 0.11 | % |
| Sandlot Buyer, LLC (Prime Time Healthcare) | | (4) | | First Lien Debt | | S + 6.25% | | 10.68 | % | | 9/19/2028 | | 15,666 | | | 15,375 | | 15,502 | | 2.81 | % |
| VMG Holdings LLC (VMG Health) | | (4) (10) | | First Lien Debt | | S + 5.00% | | 9.33 | % | | 4/16/2030 | | 494 | | | 490 | | 490 | | 0.09 | % |
| VMG Holdings LLC (VMG Health) | | (4) (10) | | First Lien Debt | | S + 5.00% | | 9.33 | % | | 4/16/2030 | | 6,883 | | | 6,826 | | | 6,823 | | | 1.24 | % |
| Total Health Care Providers & Services | | | | | | | | | | | | | | 72,390 | | 72,275 | | 13.10 | % |
| | | | | | | | | | | | | | | | | | |
| Hotels, Restaurants & Leisure | | | | | | | | | | | | | | | | | | |
| Davidson Hotel Company LLC | | (4) (6) | | First Lien Debt (Delayed Draw) | | S + 5.00% | | 9.33 | % | | 10/31/2031 | | 458 | | | 17 | | 16 | | — | % |
| Davidson Hotel Company LLC | | (4) (10) | | First Lien Debt | | S + 5.00% | | 9.33 | % | | 10/31/2031 | | 1,374 | | | 1,362 | | 1,368 | | 0.25 | % |
| Total Hotels, Restaurants & Leisure | | | | | | | | | | | | | | 1,379 | | 1,384 | | 0.25 | % |
| | | | | | | | | | | | | | | | | | |
| Household Durables | | | | | | | | | | | | | | | | | | |
| AMS Parent, LLC (All My Sons) | | (4) (10) | | First Lien Debt | | S + 4.75% | | 9.19 | % | | 10/25/2028 | | 5,756 | | | 5,726 | | 5,735 | | 1.04 | % |
| Total Household Durables | | | | | | | | | | | | | | 5,726 | | 5,735 | | 1.04 | % |
| | | | | | | | | | | | | | | | | | |
| Household Products | | | | | | | | | | | | | | | | | | |
| DRS Holdings III, Inc. | | (4) (7) (10) | | First Lien Debt | | S + 5.25% | | 9.58 | % | | 11/1/2028 | | 1,302 | | | 1,296 | | 1,296 | | 0.23 | % |
| MPG Parent Holdings, LLC (Market Performance Group) | | (4) (10) | | First Lien Debt | | S + 5.00% | | 9.30 | % | | 1/8/2030 | | 6,017 | | | 5,970 | | 6,048 | | 1.10 | % |
| MPG Parent Holdings, LLC (Market Performance Group) | | (4) (6) | | First Lien Debt (Delayed Draw) | | S + 5.00% | | 9.33 | % | | 1/8/2030 | | 2,165 | | | (5) | | 11 | | — | % |
| MPG Parent Holdings, LLC (Market Performance Group) | | (4) | | First Lien Debt (Delayed Draw) | | S + 5.00% | | 9.31 | % | | 1/8/2030 | | 1,477 | | | 1,477 | | | 1,485 | | | 0.27 | % |
| Total Household Products | | | | | | | | | | | | | | 8,738 | | 8,840 | | 1.60 | % |
| | | | | | | | | | | | | | | | | | |
| Industrial Conglomerates | | | | | | | | | | | | | | | | | | |
| ISG Enterprises, LLC (Industrial Service Group) | | (4) | | First Lien Debt | | S + 5.75% | | 10.03 | % | | 12/7/2028 | | 5,623 | | | 5,551 | | | 5,492 | | | 1.00 | % |
CONSOLIDATED SCHEDULE OF INVESTMENTS (UNAUDITED)
June 30, 2025
(dollar amounts in thousands, except shares)
| | | | | | | | | | | | | | | | | | | | | | | | | | | | | | | | | | | | | | | | | | | | | | | | | | | | | | | | |
Portfolio Company (1) (2) | | Footnotes | | Investment | | Spread Above Reference Rate (3) | | Interest Rate (3) | | Maturity Date | | Par Amount | | Amortized Cost | | Fair Value | | % of Net Assets (5) |
| ISG Enterprises, LLC (Industrial Service Group) | | (4) | | First Lien Debt (Delayed Draw) | | S + 5.75% | | 10.03 | % | | 12/7/2028 | | $ | 2,928 | | | $ | 2,920 | | | $ | 2,860 | | | 0.52 | % |
| ISG Enterprises, LLC (Industrial Service Group) | | (4) (6) | | First Lien Debt (Delayed Draw) | | S + 5.75% | | 10.03 | % | | 12/7/2028 | | 10,846 | | | 10,332 | | | 10,084 | | | 1.83 | % |
| Total Industrial Conglomerates | | | | | | | | | | | | | | 18,803 | | 18,436 | | 3.35 | % |
| | | | | | | | | | | | | | | | | | |
| Insurance | | | | | | | | | | | | | | | | | | |
| Accession Risk Management Group, Inc. (f/k/a RSC Acquisition Inc) | | (4) (7) | | First Lien Debt (Delayed Draw) | | S + 4.75% | | 9.06 | % | | 11/1/2029 | | 11,129 | | | 11,129 | | | 11,129 | | | 2.02 | % |
| Patriot Growth Insurance Services, LLC | | (4) (7) | | First Lien Debt (Delayed Draw) | | S + 5.00% | | 9.45 | % | | 10/16/2028 | | 8,830 | | | 8,781 | | 8,676 | | 1.57 | % |
| Total Insurance | | | | | | | | | | | | | | 19,910 | | 19,805 | | 3.59 | % |
| | | | | | | | | | | | | | | | | | |
| Internet and Direct Marketing Retail | | | | | | | | | | | | | | | | | | |
| XpressMyself.com LLC (SmartSign) | | (4) | | First Lien Debt | | S + 5.50% | | 9.91 | % | | 9/7/2028 | | 7,197 | | | 7,158 | | | 7,197 | | | 1.30 | % |
| XpressMyself.com LLC (SmartSign) | | (4) | | First Lien Debt | | S + 5.75% | | 10.17 | % | | 9/7/2028 | | 2,639 | | | 2,605 | | 2,639 | | 0.48 | % |
| Total Internet and Direct Marketing Retail | | | | | | | | | | | | | | 9,763 | | 9,836 | | 1.78 | % |
| | | | | | | | | | | | | | | | | | |
| IT Services | | | | | | | | | | | | | | | | | | |
| 360 Holdco, Inc. (360 Training) | | (4) (10) | | First Lien Debt | | S + 5.00% | | 9.33 | % | | 8/2/2028 | | 1,489 | | | 1,478 | | 1,489 | | 0.27 | % |
| 360 Holdco, Inc. (360 Training) | | (4) (6) | | First Lien Debt (Delayed Draw) | | S + 5.00% | | 9.33 | % | | 8/2/2028 | | 1,346 | | | — | | — | | — | % |
| Redwood Services Group, LLC (Evergreen Services Group) | | (4) (6) (7) | | First Lien Debt (Delayed Draw) | | S + 5.25% | | 9.56 | % | | 6/15/2029 | | 4,767 | | | 1,593 | | 1,575 | | 0.29 | % |
| Redwood Services Group, LLC (Evergreen Services Group) | | (4) (7) (10) | | First Lien Debt | | S + 5.25% | | 9.55 | % | | 6/15/2029 | | 12,686 | | | 12,536 | | | 12,581 | | | 2.27 | % |
| Redwood Services Group, LLC (Evergreen Services Group) | | (4) (7) | | First Lien Debt (Delayed Draw) | | S + 5.25% | | 9.55 | % | | 6/15/2029 | | 2,143 | | | 2,129 | | | 2,125 | | | 0.39 | % |
| Total IT Services | | | | | | | | | | | | | | 17,736 | | 17,770 | | 3.22 | % |
| | | | | | | | | | | | | | | | | | |
| Leisure Products | | | | | | | | | | | | | | | | | | |
| TouchTunes Music Group, LLC (TouchTunes Interactive Network) | | (9) | | First Lien Debt | | S + 4.75% | | 9.05 | % | | 4/2/2029 | | 7,461 | | | 7,414 | | 7,224 | | 1.31 | % |
| Total Leisure Products | | | | | | | | | | | | | | 7,414 | | 7,224 | | 1.31 | % |
| | | | | | | | | | | | | | | | | | |
CONSOLIDATED SCHEDULE OF INVESTMENTS (UNAUDITED)
June 30, 2025
(dollar amounts in thousands, except shares)
| | | | | | | | | | | | | | | | | | | | | | | | | | | | | | | | | | | | | | | | | | | | | | | | | | | | | | | | |
Portfolio Company (1) (2) | | Footnotes | | Investment | | Spread Above Reference Rate (3) | | Interest Rate (3) | | Maturity Date | | Par Amount | | Amortized Cost | | Fair Value | | % of Net Assets (5) |
| Machinery | | | | | | | | | | | | | | | | | | |
| Hyperion Materials & Technologies, Inc. | | (9) | | First Lien Debt | | S + 4.50% | | 9.02 | % | | 8/30/2028 | | $ | 4,185 | | | $ | 4,179 | | | $ | 4,047 | | | 0.73 | % |
| Jetson Buyer, Inc. (E-Technologies Group, Inc.) | | (4) (10) | | First Lien Debt | | S + 5.50% | | 9.80 | % | | 4/9/2030 | | 3,152 | | | 3,126 | | 3,066 | | 0.56 | % |
| Total Machinery | | | | | | | | | | | | | | 7,305 | | 7,113 | | 1.29 | % |
| | | | | | | | | | | | | | | | | | |
| Personal Products | | | | | | | | | | | | | | | | | | |
| Healthspan Buyer, LLC (Thorne HealthTech) | | (4) (10) | | First Lien Debt | | S + 5.25% | | 9.55 | % | | 10/16/2030 | | 5,066 | | | 5,026 | | | 4,991 | | | 0.90 | % |
| Healthspan Buyer, LLC (Thorne HealthTech) | | (4) (10) | | First Lien Debt | | S + 5.25% | | 9.55 | % | | 10/16/2030 | | 2,691 | | | 2,679 | | 2,651 | | 0.48 | % |
| Total Personal Products | | | | | | | | | | | | | | 7,705 | | 7,642 | | 1.38 | % |
| | | | | | | | | | | | | | | | | | |
| Pharmaceuticals | | | | | | | | | | | | | | | | | | |
| Lavie Group, Inc. | | (4) (6) (7) | | First Lien Debt (Delayed Draw) | | S + 5.25% | | 9.42 | % | | 10/10/2029 | | 321 | | | (1) | | (3) | | — | % |
| Lavie Group, Inc. | | (4) (7) (10) | | First Lien Debt | | S + 5.25% | | 9.42 | % | | 10/12/2029 | | 1,199 | | | 1,188 | | 1,188 | | 0.22 | % |
| Wellspring Pharmaceutical Corporation | | (4) | | First Lien Debt | | S + 5.00% | | 9.27 | % | | 8/22/2028 | | 3,222 | | | 3,184 | | 3,226 | | 0.58 | % |
| Wellspring Pharmaceutical Corporation | | (4) | | First Lien Debt | | S + 5.00% | | 9.27 | % | | 8/22/2028 | | 2,605 | | | 2,571 | | 2,609 | | 0.47 | % |
| Wellspring Pharmaceutical Corporation | | (4) (10) | | First Lien Debt | | S + 5.00% | | 9.27 | % | | 8/22/2028 | | 3,167 | | | 3,151 | | 3,171 | | 0.57 | % |
| Wellspring Pharmaceutical Corporation | | (4) | | First Lien Debt (Delayed Draw) | | S + 5.00% | | 9.27 | % | | 8/22/2028 | | 1,547 | | | 1,541 | | 1,549 | | 0.28 | % |
| Wellspring Pharmaceutical Corporation | | (4) | | First Lien Debt (Delayed Draw) | | S + 5.00% | | 9.27 | % | | 8/22/2028 | | 5,408 | | | 5,393 | | | 5,417 | | | 0.98 | % |
| Total Pharmaceuticals | | | | | | | | | | | | | | 17,027 | | 17,157 | | 3.10 | % |
| | | | | | | | | | | | | | | | | | |
| Professional Services | | | | | | | | | | | | | | | | | | |
| AG Group Holdings, Inc. (Addison Group) | | (4) | | First Lien Debt | | S + 4.25% | | 8.58 | % | | 12/29/2028 | | 5,491 | | | 5,489 | | | 5,140 | | | 0.93 | % |
| ALKU Intermediate Holdings, LLC | | (4) | | First Lien Debt | | S + 6.25% | | 10.47 | % | | 5/23/2029 | | 3,917 | | | 3,861 | | 3,901 | | 0.71 | % |
| All4 Buyer, LLC | | (4) (6) | | First Lien Debt (Delayed Draw) | | S + 4.50% | | 8.78 | % | | 1/23/2032 | | 1,038 | | | (5) | | (10) | | — | % |
| All4 Buyer, LLC | | (4) (10) | | First Lien Debt | | S + 4.50% | | 8.78 | % | | 1/23/2032 | | 1,243 | | | 1,231 | | 1,231 | | 0.22 | % |
| Archer Acquisition, LLC (ARMstrong) | | (4) (10) | | First Lien Debt | | S + 5.00% | | 9.40 | % | | 10/8/2029 | | 5,444 | | | 5,382 | | 5,396 | | 0.98 | % |
| Archer Acquisition, LLC (ARMstrong) | | (4) (6) | | First Lien Debt (Delayed Draw) | | S + 5.00% | | 9.39 | % | | 10/8/2029 | | 529 | | | 188 | | 186 | | 0.03 | % |
CONSOLIDATED SCHEDULE OF INVESTMENTS (UNAUDITED)
June 30, 2025
(dollar amounts in thousands, except shares)
| | | | | | | | | | | | | | | | | | | | | | | | | | | | | | | | | | | | | | | | | | | | | | | | | | | | | | | | |
Portfolio Company (1) (2) | | Footnotes | | Investment | | Spread Above Reference Rate (3) | | Interest Rate (3) | | Maturity Date | | Par Amount | | Amortized Cost | | Fair Value | | % of Net Assets (5) |
| Cornerstone Advisors of Arizona, LLC | | (4) (7) (10) | | First Lien Debt | | S + 4.75% | | 9.05 | % | | 5/13/2032 | | $ | 8,700 | | | $ | 8,657 | | | $ | 8,660 | | | 1.57 | % |
| KENG Acquisition, Inc. (Enagage PEO) | | (4) (7) (10) | | First Lien Debt | | S + 5.00% | | 9.28 | % | | 8/1/2029 | | 4,598 | | | 4,545 | | 4,559 | | 0.83 | % |
| KENG Acquisition, Inc. (Enagage PEO) | | (4) (6) (7) | | First Lien Debt (Delayed Draw) | | S + 5.00% | | 9.28 | % | | 8/1/2029 | | 4,469 | | | 2,772 | | 2,741 | | 0.50 | % |
| KENG Acquisition, Inc. (Enagage PEO) | | (4) (6) (7) | | First Lien Debt (Delayed Draw) | | S + 5.00% | | 9.28 | % | | 8/1/2029 | | 2,851 | | | (6) | | (24) | | — | % |
| KENG Acquisition, Inc. (Engage PEO) | | (4) (6) (7) | | First Lien Debt (Delayed Draw) | | S + 5.00% | | 9.28 | % | | 8/1/2029 | | 5,347 | | | (24) | | | (45) | | | (0.01) | % |
| LSCS Holdings, Inc. (Dohmen) | | (7) (9) (10) | | First Lien Debt | | S + 4.50% | | 8.80 | % | | 3/4/2032 | | 7,980 | | | 7,940 | | 7,845 | | 1.42 | % |
| Orion Group FM Holdings, LLC (Leo Facilities) | | (4) (10) | | First Lien Debt | | S + 5.50% | | 9.80 | % | | 7/3/2029 | | 7,635 | | | 7,549 | | 7,642 | | 1.38 | % |
| Orion Group FM Holdings, LLC (Leo Facilities) | | (4) (10) | | First Lien Debt | | S + 5.50% | | 9.80 | % | | 7/3/2029 | | 645 | | | 639 | | 646 | | 0.12 | % |
| Orion Group FM Holdings, LLC (Leo Facilities) | | (4) (6) | | First Lien Debt (Delayed Draw) | | S + 5.50% | | 9.77 | % | | 7/3/2029 | | 5,785 | | | 4,261 | | | 4,275 | | | 0.77 | % |
| Orion Group FM Holdings, LLC (Leo Facilities) | | (4) (6) | | First Lien Debt (Delayed Draw) | | S + 5.50% | | 9.82 | % | | 7/3/2029 | | 5,488 | | | — | | | 5 | | | — | % |
| Secretariat Advisors LLC | | (4) (10) | | First Lien Debt | | S + 4.00% | | 8.30 | % | | 2/28/2032 | | 3,278 | | | 3,263 | | | 3,258 | | | 0.59 | % |
| Secretariat Advisors LLC | | (4) (6) | | First Lien Debt (Delayed Draw) | | S + 4.00% | | 8.30 | % | | 2/28/2032 | | 396 | | | — | | (2) | | — | % |
| Total Professional Services | | | | | | | | | | | | | | 55,742 | | 55,404 | | 10.04 | % |
| | | | | | | | | | | | | | | | | | |
| Road & Rail | | | | | | | | | | | | | | | | | | |
| EVDR Purchaser, Inc. (Alternative Logistics Technologies Buyer, LLC) | | (4) (7) (10) | | First Lien Debt | | S + 5.50% | | 9.83 | % | | 2/14/2031 | | 5,073 | | | 5,033 | | | 5,029 | | | 0.91 | % |
| EVDR Purchaser, Inc. (Alternative Logistics Technologies Buyer, LLC) | | (4) (6) (7) | | First Lien Debt (Delayed Draw) | | S + 5.50% | | 9.83 | % | | 2/14/2031 | | 1,468 | | | — | | (13) | | — | % |
| Total Road & Rail | | | | | | | | | | | | | | 5,033 | | 5,016 | | 0.91 | % |
| | | | | | | | | | | | | | | | | | |
| Software | | | | | | | | | | | | | | | | | | |
| Businessolver.com, Inc. | | (4) (7) | | First Lien Debt | | S + 5.50% | | 9.90 | % | | 12/1/2027 | | 8,690 | | | 8,651 | | | 8,690 | | | 1.57 | % |
| Businessolver.com, Inc. | | (4) (6) (7) | | First Lien Debt (Delayed Draw) | | S + 5.50% | | 9.90 | % | | 12/1/2027 | | 1,304 | | | 1,066 | | 1,069 | | 0.19 | % |
| Diligent Corporation (fka Diamond Merger Sub II, Corp.) | | (4) (6) (7) | | First Lien Debt (Delayed Draw) | | S + 5.00% | | 9.33 | % | | 8/2/2030 | | 2,515 | | | (10) | | (17) | | — | % |
| Diligent Corporation (fka Diamond Merger Sub II, Corp.) | | (4) (7) (10) | | First Lien Debt | | S + 5.00% | | 9.33 | % | | 8/2/2030 | | 2,515 | | | 2,505 | | 2,498 | | 0.45 | % |
| Diligent Corporation (fka Diamond Merger Sub II, Corp.) | | (4) (7) (10) | | First Lien Debt | | S + 5.00% | | 9.33 | % | | 8/2/2030 | | 14,670 | | | 14,612 | | 14,572 | | 2.64 | % |
CONSOLIDATED SCHEDULE OF INVESTMENTS (UNAUDITED)
June 30, 2025
(dollar amounts in thousands, except shares)
| | | | | | | | | | | | | | | | | | | | | | | | | | | | | | | | | | | | | | | | | | | | | | | | | | | | | | | | |
Portfolio Company (1) (2) | | Footnotes | | Investment | | Spread Above Reference Rate (3) | | Interest Rate (3) | | Maturity Date | | Par Amount | | Amortized Cost | | Fair Value | | % of Net Assets (5) |
| Revalize Inc. (f/k/a AQ Holdco Inc.) | | (4) (7) | | First Lien Debt (Delayed Draw) | | S + 5.75% | | 10.20 | % | | 4/15/2027 | | $ | 4,910 | | | $ | 4,905 | | | $ | 4,673 | | | 0.85 | % |
| Revalize Inc. (f/k/a AQ Holdco Inc.) | | (4) (7) | | First Lien Debt (Delayed Draw) | | S + 5.75% | | 10.20 | % | | 4/15/2027 | | 1,261 | | | 1,257 | | 1,200 | | 0.22 | % |
| Revalize Inc. (f/k/a AQ Holdco Inc.) | | (4) (7) | | First Lien Debt (Delayed Draw) | | S + 5.75% | | 10.18 | % | | 4/15/2027 | | 280 | | | 279 | | | 266 | | | 0.05 | % |
| VALIDITY INC | | (4) (10) | | First Lien Debt | | S + 5.25% | | 9.58 | % | | 4/7/2032 | | 3,075 | | | 3,044 | | 3,044 | | 0.55 | % |
| Total Software | | | | | | | | | | | | | | 36,309 | | 35,995 | | 6.52 | % |
| | | | | | | | | | | | | | | | | | |
| Transportation Infrastructure | | | | | | | | | | | | | | | | | | |
| FSK Pallet Holding Corp. (Kamps Pallets) | | (4) (10) | | First Lien Debt | | S + 6.00% | | 10.43 | % | | 12/23/2026 | | 8,157 | | | 8,095 | | | 7,986 | | | 1.45 | % |
| Transit Buyer, LLC (Propark Mobility) | | (4) (6) | | First Lien Debt (Delayed Draw) | | S + 5.00% | | 9.33 | % | | 1/31/2029 | | 2,803 | | | (14) | | — | | — | % |
| Transit Buyer, LLC (Propark Mobility) | | (4) | | First Lien Debt | | S + 5.00% | | 9.33 | % | | 1/31/2029 | | 5,805 | | | 5,750 | | 5,805 | | 1.05 | % |
| Transit Buyer, LLC (Propark Mobility) | | (4) | | First Lien Debt (Delayed Draw) | | S + 5.00% | | 9.33 | % | | 1/31/2029 | | 2,671 | | | 2,638 | | 2,671 | | 0.48 | % |
| Transit Buyer, LLC (Propark Mobility) | | (4) | | First Lien Debt (Delayed Draw) | | S + 5.00% | | 9.31 | % | | 1/31/2029 | | 4,406 | | | 4,398 | | 4,406 | | 0.80 | % |
| Total Transportation Infrastructure | | | | | | | | | | | | | | 20,867 | | 20,868 | | 3.78 | % |
| | | | | | | | | | | | | | | | | | |
| Wireless Telecommunication Services | | | | | | | | | | | | | | | | | | |
| Mobile Communications America, Inc. | | (4) (6) | | First Lien Debt (Delayed Draw) | | S + 5.00% | | 9.28 | % | | 10/16/2029 | | 3,259 | | | — | | | (8) | | | — | % |
| Mobile Communications America, Inc. | | (4) (10) | | First Lien Debt | | S + 5.00% | | 9.28 | % | | 10/16/2029 | | 8,801 | | | 8,712 | | | 8,780 | | | 1.59 | % |
| Mobile Communications America, Inc. | | (4) | | First Lien Debt (Delayed Draw) | | S + 5.00% | | 9.28 | % | | 10/16/2029 | | 2,074 | | | 2,063 | | 2,069 | | 0.37 | % |
| Total Wireless Telecommunication Services | | | | | | | | | | | | | | 10,775 | | 10,841 | | 1.96 | % |
| | | | | | | | | | | | | | | | | | |
| Total Debt Investments | | | | | | | | | | | | | | $ | 805,603 | | | $ | 801,094 | | | 145.16 | % |
| | | | | | | | | | | | | | | | | | |
CONSOLIDATED SCHEDULE OF INVESTMENTS (UNAUDITED)
June 30, 2025
(dollar amounts in thousands, except shares)
| | | | | | | | | | | | | | | | | | | | | | | | | | | | | | | | | | | | | | | | | | | | | | | | |
Portfolio Company (1) (2) | | Footnotes | | Investment | | Acquisition Date | | Shares/Units | | Amortized Cost | | Fair Value | | % of Net Assets (5) | | | | |
| Equity Investments | | | | | | | | | | | | | | | | | | |
| Containers & Packaging | | | | | | | | | | | | | | | | | | |
| New Spartech Holdings LLC | | (4) | | Common Units | | 6/6/2025 | | 209,000 | | | $ | 1,059 | | | $ | 1,059 | | | 0.19 | % | | | | |
| Total Containers & Packaging | | | | | | | | | | 1,059 | | 1,059 | | 0.19 | % | | | | |
| | | | | | | | | | | | | | | | | | |
Total Equity Investments | | | | | | | | | | $ | 1,059 | | | $ | 1,059 | | | 0.19 | % | | | | |
| | | | | | | | | | | | | | | | | | | | | | | | | | | | | | | | | | | | | | | | | | | | | | | | | | | | | | | | |
Portfolio Company (1) (2) | | Footnotes | | Interest Rate | | Shares | | Amortized Cost | | Fair Value | | % of Net Assets (5) |
| Cash Equivalents | | | | | | | | | | | | |
| BlackRock Liquidity Funds T-Fund Institutional Class | | | | 4.21% | | 12,678,860 | | | $ | 12,679 | | | $ | 12,679 | | | 2.30 | % |
| U.S. Bank National Association Money Market Deposit Account | | | | 4.22% | | 2,689 | | 3 | | 3 | | — | % |
| Total Cash Equivalents | | | | | | | | $ | 12,682 | | | $ | 12,682 | | | 2.30 | % |
| | | | | | | | | | | | |
| Total Investments & Cash Equivalents | | | | | | | | $ | 819,344 | | | $ | 814,835 | | | 147.65 | % |
________
(1)All investments are non-controlled/non-affiliated investments as defined by the Investment Company Act of 1940, as amended (the "1940 Act"). The 1940 Act classifies investments based on the level of control that the Company maintains in a particular portfolio company. As defined in the 1940 Act, a company is generally presumed to be “non-controlled” when the Company owns 25% or less of the portfolio company’s voting securities and “controlled” when the Company owns more than 25% of the portfolio company’s voting securities. The 1940 Act also classifies investments further based on the level of ownership that the Company maintains in a particular portfolio company. As defined in the 1940 Act, a company is generally deemed as “non-affiliated” when the Company owns less than 5% of a portfolio company’s voting securities and “affiliated” when the Company owns 5% or more of a portfolio company’s voting securities.
(2)Refer to Note 3 for the geographic composition of investments at cost and fair value. (3)The majority of the investments bear interest at rates that may be determined by reference to Secured Overnight Financing Rate ("SOFR" or "S"), which reset monthly or quarterly. For each such investment, the Company has provided the spread over SOFR and the current contractual interest rate in effect at June 30, 2025. As of June 30, 2025, the rate for 1M S, 3M S, 6M S, 12M S was 4.32%, 4.29%, 4.15%, and 3.88% respectively. Certain investments are subject to a SOFR floor. For fixed rate loans, a spread above a reference rate is not applicable.
(4)Investment valued using unobservable inputs (Level 3), unless noted otherwise. See Note 4 “Fair Value Measurements” for more information. (5)Percentage is based on net assets of $551,862 as of June 30, 2025.
(6)Position or portion thereof is an unfunded loan commitment, and no interest is being earned on the unfunded portion. See Note 7 “Commitments and Contingencies” for more information. The investment may be subject to unused commitment fees. (7)Investment is a unitranche position.
(8)This portfolio company is not domiciled in the United States. See Note 3 “Investments” for more information. (9)Investment valued using observable inputs (Level 2).
(10)Denotes that all or a portion of the assets are owned by SPV I (as defined in Note 1 “Organization”), which entered into a loan and security agreement (the “ABL Facility”) on April 27, 2023. The lenders of the ABL Facility have a first lien security interest in substantially all of the assets of SPV I. Accordingly, such assets are not available to creditors of the Company. See Note 6 “Secured Borrowings” for more information.
NC SLF INC.
NOTES TO CONSOLIDATED FINANCIAL STATEMENTS (UNAUDITED)
(dollars amounts in thousands, except per share data)
1.ORGANIZATION
NC SLF Inc. (the “Company”, which refers to either NC SLF Inc. or NC SLF Inc. together with its consolidated subsidiary, as the context may require) is a Maryland corporation that registered under the Investment Company Act of 1940, as amended (the “1940 Act”), on August 12, 2022 as a non-diversified, closed-end management investment company. Prior to its registration as a closed-end fund under the 1940 Act, the Company was organized as a Maryland corporation on January 29, 2021 and was regulated as a business development company (“BDC”) from June 2, 2021 until August 12, 2022, whereupon it withdrew its election to be regulated as a BDC pursuant to Section 54(c) of the 1940 Act and filed a notice of registration under Section 8 of the 1940 Act in order to register as a closed-end fund (the “1940 Act Registration Statement”). The Company has elected, and intends to qualify annually, to be treated for U.S. federal income tax purposes as a regulated investment company (“RIC”) under subchapter M of the Internal Revenue Code of 1986, as amended (together with the rules and regulations promulgated thereunder, the “Code”).
Churchill Asset Management LLC (the “Investment Adviser” or “Churchill”), a Delaware limited liability company, registered as an investment adviser with the Securities and Exchange Commission (the “SEC”) under the Investment Advisers Act of 1940, as amended (the “Advisers Act”). The Investment Adviser manages the Company’s day-to-day operations and provides it with investment advisory and management services. Churchill BDC Administration LLC (f/k/a Nuveen Churchill Administration LLC) (the “Administrator”) provides the administrative services necessary to conduct the Company's day-to-day operations. Teachers Insurance and Annuity Association of America (“TIAA”) is the ultimate parent company of the Investment Adviser and the Administrator.
The Company's investment objective is to generate current income and capital appreciation primarily by investing in or originating first lien and unitranche leveraged loans made to private equity-owned U.S. middle market companies that require capital for growth, acquisitions, recapitalizations, refinancings and leveraged buyouts, which the Investment Adviser believes have sustainable, leading positions in their respective markets with scalable revenues and operating cash flow, experienced management teams, and other positive business characteristics. The Company defines middle market companies as companies with approximately $10 million to $200 million of annual earnings before interest, taxes, depreciation, and amortization. The Company makes investments through both primary originations and open-market secondary purchases. The Company focuses on making loans that it directly originates to U.S. middle market companies that operate in non-cyclical industries and demonstrate strong, consistent financial performance, market leadership, and are led by experienced management teams. Our portfolio is expected to comprise primarily first lien senior secured debt and unitranche loans.
NC SLF SPV I, LLC (“SPV I”) is a wholly owned subsidiary of the Company and is consolidated in these consolidated financial statements commencing from the date of its formation on August 10, 2021 in accordance with the Company's consolidation policy discussed in Note 2. SPV I commenced operations on May 15, 2023, the date of its first investment transaction.
The Company has entered into separate subscription agreements (the “Subscription Agreements”) with one or more investors providing for the private placement of the Company’s common stock pursuant to a private offering (the “Private Offering”). Each investor makes a “Capital Commitment” (as such term is defined in the subscription agreements executed by each of the shareholders) to purchase shares pursuant to a Subscription Agreement. Each prospective investor in the Company is required to certify that it is an "accredited investor" within the meaning of Rule 501(a) of Regulation D promulgated under the Securities Act of 1933, as amended (the “Securities Act”). Prior to the filing of the 1940 Act Registration Statement, the Company completed its initial closing of capital commitments on June 21, 2021 (the “Initial Closing Date”) and subsequently commenced investment operations. The Company’s investment period (“Investment Period”) commenced on the Initial Closing Date and initially continued through the 48-month anniversary of the Initial Closing Date (i.e., through June 21, 2025), subject to automatic extensions thereafter, each for an additional one-year period, unless the holders of a majority of the Company’s outstanding shares elected to forego any such extension upon not less than ninety days’ prior written notice. Upon the 48-month anniversary of the Initial Closing Date, on June 21, 2025, the Investment Period was automatically extended for an additional one-year period through June 21, 2026. Holders of a majority of the Company’s outstanding shares may also terminate the Investment Period as of any earlier anniversary of the Initial Closing Date upon not less than ninety days’ written notice. The Investment Adviser also may terminate the Investment Period of the Company as of an earlier date in its discretion.
NC SLF INC.
NOTES TO CONSOLIDATED FINANCIAL STATEMENTS (UNAUDITED)
(dollars amounts in thousands, except per share data)
2.SIGNIFICANT ACCOUNTING POLICIES
Basis of Presentation
The consolidated financial statements have been prepared on the accrual basis of accounting in accordance with accounting principles generally accepted in the United States (“U.S. GAAP”). The Company is an investment company for the purposes of accounting and financial reporting in accordance with Financial Accounting Standards Board (“FASB”) Accounting Standards Codification (“ASC”) Topic 946, Financial Services—Investment Companies (“ASC Topic 946”), and pursuant to Regulation S-X. In the opinion of management, all adjustments, which are of a normal recurring nature, considered necessary for the fair statement of the consolidated financial statements for the periods presented, have been included. Certain prior period amounts have been reclassified to conform to the current period presentation. U.S. GAAP for an investment company requires investments to be recorded at fair value. The carrying value for all other assets and liabilities approximates their fair value, unless otherwise disclosed within.
Consolidation
As provided under ASC Topic 946, the Company will generally not consolidate its investment in a company other than an investment company subsidiary or a controlled operating company whose business consists of providing services to the Company. Accordingly, the consolidated financial statements include the accounts of the Company and its wholly owned subsidiary, SPV I. All significant intercompany balances and transactions have been eliminated.
Use of Estimates
The preparation of the consolidated financial statements in conformity with U.S. GAAP requires the Company to make estimates and assumptions that affect the reported amounts of assets and liabilities and disclosure of contingent assets and liabilities at the date of the consolidated financial statements, as well as the reported amounts of revenue and expenses during the reporting period. Actual results could differ from those estimates.
Cash, Restricted Cash and Cash Equivalents
Cash and restricted cash represent cash deposits held at financial institutions, which at times may exceed U.S. federally insured limits. Cash equivalents include short-term highly liquid investments, such as money market funds and money market accounts that are readily convertible to cash and have original maturities of three months or less. Cash, restricted cash and cash equivalents are carried at cost, which approximates fair value. As of June 30, 2025, the Company did not hold any restricted cash.
Valuation of Portfolio Investments
Investments are valued in accordance with the fair value principles established by FASB ASC Topic 820, Fair Value Measurement (“ASC Topic 820”) and in accordance with the 1940 Act. ASC Topic 820’s definition of fair value focuses on the amount that would be received to sell the asset or paid to transfer the liability in the principal or most advantageous market, and prioritizes the use of market-based inputs (observable) over entity-specific inputs (unobservable) within a measurement of fair value.
ASC Topic 820 specifies a hierarchy of valuation techniques based on whether the inputs to those valuation techniques are observable or unobservable. ASC Topic 820 also provides guidance regarding a fair value hierarchy, which prioritizes information used to measure fair value and the effect of fair value measurements on earnings, and provides for enhanced disclosures determined by the level within the hierarchy of information used in the valuation. In accordance with ASC Topic 820, these inputs are summarized in the three levels listed below:
•Level 1 — Valuations are based on unadjusted, quoted prices in active markets for identical assets or liabilities that are accessible at the measurement date.
•Level 2 — Valuations are based on quoted prices in markets that are not active or for which all significant inputs are observable, either directly or indirectly.
•Level 3 — Valuations based on inputs that are unobservable and significant to the overall fair value measurement.
NC SLF INC.
NOTES TO CONSOLIDATED FINANCIAL STATEMENTS (UNAUDITED)
(dollars amounts in thousands, except per share data)
In certain cases, the inputs used to measure fair value may fall into different levels of the fair value hierarchy. In such cases, an investment’s level within the fair value hierarchy is based on the lowest level of observable input that is significant to the fair value measurement. The assessment of the significance of a particular input to the fair value measurement in its entirety requires judgment, and considers factors specific to the investment.
Active, publicly traded instruments are classified as Level 1 and their values are generally based on quoted market prices, even if both the market’s normal daily trading volume is not sufficient to absorb the quantity held and placing orders to sell the position in a single transaction might affect the quoted price.
Fair value is generally determined as the price that would be received for an investment in a current sale, which assumes an orderly market is available for the market participants at the measurement date. If available, fair value of investments is based on directly observable market prices or on market data derived from comparable assets. The Company’s valuation policy considers the fact that no ready market may exist for many of the securities in which it invests and that fair value for its investments must be determined using unobservable inputs.
Pursuant to Rule 2a-5 under the 1940 Act, the Company's board of directors (the “Board”) has designated the Investment Adviser as the Company's valuation designee (the “Valuation Designee”) to determine the fair value of the Company's investments that do not have readily available market quotations. Pursuant to the Company's valuation policy approved by the Board, a valuation committee comprised of employees of the Investment Adviser (the “Valuation Committee”) is responsible for determining the fair value of the Company’s assets for which market quotations are not readily available, subject to the oversight of the Board.
With respect to investments for which market quotations are not readily available (Level 3), the Valuation Designee, subject to the oversight of the Board as described below, defined further below in Note 4, undertakes a multi-step valuation process each quarter, as follows: i.the quarterly valuation process begins with each portfolio company or investment being initially valued by either the professionals of the applicable investment team that are responsible for the portfolio investment or an independent third-party valuation firm;
ii.to the extent that an independent third-party valuation firm has not been engaged by, or on behalf of, the Company to value 100% of the portfolio, then at a minimum, an independent third-party valuation firm will be engaged by, or on behalf of, the Company will provide positive assurance of the portfolio each quarter (such that each investment is reviewed by a third-party valuation firm at least once on a rolling 12-month basis and each watch-list investment will be reviewed each quarter), including a review of management’s preliminary valuation and recommendation of fair value;
iii.the Valuation Committee then reviews and discusses the valuations with any input, where appropriate, from the independent third-party valuation firm(s), and determine the fair value of each investment in good faith based on the Company’s valuation policy, subject to the oversight of the Board; and
iv.the Valuation Designee provides the Board with the information relating to the fair value determination pursuant to the Company’s valuation policy in connection with each quarterly Board meeting, comply with the periodic board reporting requirements set forth in the Company’s valuation policy, and discuss with the Board its determination of the fair value of each investment in good faith.
NC SLF INC.
NOTES TO CONSOLIDATED FINANCIAL STATEMENTS (UNAUDITED)
(dollars amounts in thousands, except per share data)
The Valuation Designee makes this fair value determination on a quarterly basis and in such other instances when a decision regarding the fair value of the portfolio investments is required. Factors considered by the Valuation Designee as part of the valuation of investments include each portfolio company’s credit ratings/risk, current and projected earnings, current and expected leverage, ability to make interest and principal payments, liquidity, compliance with applicable loan covenants, and price to earnings (or other financial) ratios and those of other comparable companies, as well as the estimated remaining life of the investment and current market yields and interest rate spreads of similar securities as of the measurement date. Other factors taken into account include changes in the interest rate environment and the credit markets that may affect the price at which similar investments would trade. The Valuation Designee also may base its valuation of an investment on recent investments and securities with similar structure and risk characteristics. The Valuation Designee obtains market data from its ongoing investment purchase efforts, in addition to monitoring transactions that have closed or are disclosed in industry publications. External information may include (but is not limited to) observable market data derived from the U.S. loan and equity markets. As part of compiling market data as an indication of current market conditions, management may utilize third-party sources.
The values assigned to investments are based on available information and may fluctuate from period to period. In addition, such values do not necessarily represent the amount that ultimately might be realized upon a portfolio investment's sale. Due to the inherent uncertainty of valuation, the estimated fair value of an investment may differ from the value that would have been used had a ready market for the security existed, and the difference could be material.
The Board is responsible for overseeing the Valuation Designee’s process for determining the fair value of the Company’s assets for which market quotations are not readily available, taking into account the Company’s valuation risks. To facilitate the Board’s oversight of the valuation process, the Valuation Designee provides the Board with quarterly reports, annual reports, and prompt reporting of material matters affecting the Valuation Designee’s determination of fair value. As part of the Board’s oversight role, the Board may request and review additional information to be informed of the Valuation Designee’s process for determining the fair value of the Company's investments.
Investment Transactions and Revenue Recognition
Investment transactions are recorded on the applicable trade date. Any amounts related to purchases, sales and principal paydowns that have traded, but not settled, are reflected as either a receivable for investments sold or payable for investments purchased on the consolidated statement of assets and liabilities. Realized gains or losses are measured by the difference between the net proceeds received from repayments and sales and the cost basis of the investment using the specific identification method without regard to unrealized appreciation or depreciation previously recognized and are included as net realized gain (loss) on investments in the consolidated statement of operations. Net change in unrealized appreciation (depreciation) on investments is recognized in the consolidated statement of operations and reflects the period-to-period change in fair value and cost of investments, including the reversal of previously recorded unrealized appreciation or depreciation when gains or losses are realized.
Interest income, including amortization of premium and accretion of discount on loans, and expenses are recorded on the accrual basis. The Company accrues interest income if it expects that ultimately it will be able to collect such income. Generally, when a payment default occurs on a loan in the portfolio, or if management otherwise believes that the issuer of the loan will not be able to make contractual interest payments or principal payments, the Investment Adviser will place the loan on non-accrual status and the Company will cease recognizing interest income on that loan until all principal and interest are current through receipt or until a restructuring occurs, such that the interest income is deemed to be collectible. Regardless, the Company remains contractually entitled to this interest income. The Company may make exceptions to this policy if the loan has sufficient collateral value and is in the process of collection. Accrued interest is written off when it becomes probable that the interest will not be collected and the amount of uncollectible interest can be reasonably estimated. As of June 30, 2025, there were no loans in the Company’s portfolio on non-accrual status.
From time to time, the Company may have loans in its portfolio that contain payment-in-kind (“PIK”) income provisions. PIK represents interest that is accrued and recorded as interest income at the contractual rates, increases the loan principal on the respective capitalization dates, and is generally due at maturity. As of June 30, 2025, no loans in the portfolio contained PIK income provisions.
Other income may include income such as consent, waiver, amendment, unused, and prepayment fees associated with the Company’s investment activities, as well as any fees for managerial assistance services rendered by the Company to its
NC SLF INC.
NOTES TO CONSOLIDATED FINANCIAL STATEMENTS (UNAUDITED)
(dollars amounts in thousands, except per share data)
portfolio companies. Such fees are recognized as income when earned or the services are rendered. For the six months ended June 30, 2025, the Company earned other income of $188, primarily related to amendment fees.
Deferred Financing Costs
Deferred financing costs include capitalized expenses related to the closing or amendments of borrowings. Amortization of deferred financing costs is computed on the straight-line basis over the term of the borrowings. The unamortized balance of such costs is included in deferred financing costs in the consolidated statement of assets and liabilities. The amortization of such costs is included in interest and debt financing expenses in the accompanying consolidated statement of operations.
Income Taxes
For U.S. federal income tax purposes, the Company has elected, and intends to qualify annually, to be treated as a RIC under the Code. In order to qualify as a RIC, the Company must meet certain minimum distribution, source-of-income and asset diversification requirements. If such requirements are met, then the Company is generally required to pay U.S. federal income taxes only on the portion of its taxable income and capital gains it does not distribute.
The minimum distribution requirements applicable to RICs require the Company to distribute to its shareholders at least 90% of its investment company taxable income (“ICTI”), as defined by the Code, each year. Depending on the level of ICTI earned in a tax year, the Company may choose to carry forward ICTI in excess of current year distributions into the next tax year. Any such carryover ICTI must be distributed before the end of that next tax year through a dividend declared prior to filing the final tax return related to the year which generated such ICTI.
In addition, based on the excise distribution requirements, the Company is subject to a 4% U.S. nondeductible federal excise tax on undistributed income unless the Company distributes in a timely manner an amount equal to at least the sum of (1) 98% of its ordinary income for each calendar year, (2) 98.2% of capital gain net income (both long-term and short-term) for the one-year period ending October 31 in that calendar year and (3) any income realized, but not distributed, in the preceding year. For this purpose, however, any ordinary income or capital gain net income retained by the Company that is subject to U.S. federal income tax at corporate rates is considered to have been distributed. The Company intends to timely distribute to its shareholders substantially all of its annual taxable income for each year, except that the Company may retain certain net capital gains for reinvestment and, depending upon the level of taxable income earned in a year, and may choose to carry forward ICTI for distribution in the following year and pay any applicable U.S. federal excise tax.
The Company evaluates tax positions taken or expected to be taken in the course of preparing its consolidated financial statements to determine whether the tax positions are “more-likely than not” to be sustained by the applicable tax authority. All penalties and interest associated with income taxes, if any, are included in income tax expense. For the six months ended June 30, 2025, the Company incurred no excise tax expense.
Dividends and Distributions to Common Shareholders
To the extent that the Company has taxable income available, the Company intends to continue to make quarterly distributions to its common shareholders. Dividends and distributions to common shareholders are recorded on the applicable record date. The amount to be distributed to common shareholders is determined by the Board each quarter and is generally based upon the taxable earnings estimated by management and available cash. Net realized capital gains, if any, will generally be distributed at least annually, although the Company may decide to retain such capital gains for investment.
The Company has adopted a distribution reinvestment plan under which shareholders will automatically receive dividends and other distributions in cash unless they elect to have their dividends and other distributions reinvested in additional shares. As a result of the foregoing, if the Board authorizes, and we declare, a cash dividend or distribution, shareholders that have “opted in” to our distribution reinvestment plan will have their cash distributions automatically reinvested in additional shares rather than receiving cash.
Functional Currency
The functional currency of the Company is the U.S. Dollar, and all transactions in the reported periods were in U.S. Dollars.
NC SLF INC.
NOTES TO CONSOLIDATED FINANCIAL STATEMENTS (UNAUDITED)
(dollars amounts in thousands, except per share data)
Segment Reporting
The Company is externally managed and has a single reportable segment in accordance with ASC Topic 280, Segment Reporting (“ASC 280”), which derives investment income from its portfolio of investments. The Company's accounting policies are further described above in Note 2, Significant Accounting Policies. The chief operating decision makers assess performance for the Company based on net investment income, net realized and unrealized gains (losses) from investments, and net increase (decrease) in net assets resulting from operations, which are reported on the consolidated statement of operations. The chief operating decision makers may also assess the Company's performance by completing an industry benchmarking analysis using the metrics disclosed in Note 9, Consolidated Financial Highlights. The Company's chief operating decision makers are the Company's investment committee, which is comprised of senior investment personnel of the Churchill investment teams, and the Chief Executive Officer and Chief Financial Officer. Subject to the overall supervision of the Company's Board, Churchill manages the day-to-day operations of, and provides investment advisory and management services to the Company. All investment decisions for the Company require the unanimous approval of the members of the investment committee. The information and operating expense categories included in the consolidated statement of operations are fully reflective of the significant expense categories and amounts that are regularly provided to the chief operating decision makers. Recent Accounting Pronouncement
In November 2024, the FASB issued Accounting Standard Update (“ASU”) No. 2024-03, Income Statement—Reporting Comprehensive Income—Expense Disaggregation Disclosures (Subtopic 220-40) (“ASU 2024-03”). The amendments in ASU 2024-03 improve financial reporting by requiring that public business entities disclose additional information about specific expense categories in the notes to financial statements at interim and annual reporting periods. This information is generally not presented in the consolidated financial statements today. The amendments in ASU 2024-03 are effective for annual reporting periods beginning after December 15, 2026, and interim reporting periods beginning after December 15, 2027. Early adoption is permitted. The Company does not expect the adoption of ASU 2024-03 to have a material impact on its consolidated financial statements.
3.INVESTMENTS
The composition of the Company’s investment portfolio at cost and fair value as of June 30, 2025 was as follows:
| | | | | | | | | | | | | | | | | |
| Amortized Cost | | Fair Value | | % of Fair Value |
| First-Lien Term Loans | $ | 805,603 | | | $ | 801,094 | | | 99.87 | % |
| Equity Investments | 1,059 | | | 1,059 | | | 0.13 | % |
| Total | $ | 806,662 | | | $ | 802,153 | | | 100.0 | % |
| Largest portfolio company investment | $ | 19,161 | | | $ | 19,443 | | | 2.42 | % |
| Average portfolio company investment | $ | 8,582 | | | $ | 8,534 | | | 1.06 | % |
The industry composition of the Company’s investments at fair value as of June 30, 2025 was as follows:
| | | | | |
| Industry | |
| Aerospace & Defense | 2.42 | % |
| Air Freight & Logistics | 2.32 | % |
| Auto Components | 1.89 | % |
| Beverages | 0.52 | % |
| Building Products | 2.75 | % |
| Chemicals | 1.96 | % |
| Commercial Services & Supplies | 5.18 | % |
| Construction & Engineering | 4.91 | % |
| Construction Materials | 2.67 | % |
| Containers & Packaging | 3.25 | % |
| Distributors | 3.18 | % |
NC SLF INC.
NOTES TO CONSOLIDATED FINANCIAL STATEMENTS (UNAUDITED)
(dollars amounts in thousands, except per share data)
| | | | | |
| Diversified Consumer Services | 1.49 | % |
| Diversified Financial Services | 6.10 | % |
| Diversified Telecommunication Services | 1.03 | % |
| Electrical Equipment | 1.50 | % |
| Electronic Equipment, Instruments & Components | 1.25 | % |
| Energy Equipment & Services | 2.17 | % |
| Food Products | 6.88 | % |
| Gas Utilities | 1.89 | % |
| Health Care Equipment & Supplies | 6.58 | % |
| Health Care Providers & Services | 9.00 | % |
| Hotels, Restaurants & Leisure | 0.17 | % |
| Household Durables | 0.71 | % |
| Household Products | 1.10 | % |
| Industrial Conglomerates | 2.30 | % |
| Insurance | 2.47 | % |
| Internet and Direct Marketing Retail | 1.23 | % |
| IT Services | 2.22 | % |
| Leisure Products | 0.90 | % |
| Machinery | 0.89 | % |
| Personal Products | 0.95 | % |
| Pharmaceuticals | 2.14 | % |
| Professional Services | 6.91 | % |
| Road & Rail | 0.63 | % |
| Software | 4.49 | % |
| Transportation Infrastructure | 2.60 | % |
| Wireless Telecommunication Services | 1.35 | % |
| Total | 100.00 | % |
NC SLF INC.
NOTES TO CONSOLIDATED FINANCIAL STATEMENTS (UNAUDITED)
(dollars amounts in thousands, except per share data)
The geographic composition of the Company’s investments at cost and fair value as of June 30, 2025 was as follows:
| | | | | | | | | | | | | | | | | | | | | | | |
| Amortized Cost | | Fair Value | | % of Total Investments at Fair value | | Fair Value as % of Net Assets |
| United States | $ | 767,598 | | | $ | 763,526 | | | 95.19 | % | | 138.35 | % |
| United Kingdom | 17,132 | | | 16,800 | | | 2.09 | % | | 3.04 | % |
| Germany | 12,038 | | | 12,003 | | | 1.50 | % | | 2.18 | % |
| Canada | 9,894 | | | 9,824 | | | 1.22 | % | | 1.78 | % |
| Total | $ | 806,662 | | | $ | 802,153 | | | 100.00 | % | | 145.35 | % |
As of June 30, 2025, on a fair value basis, 100.00% of our debt investments bear interest at a floating rate.
4.Fair Value Measurements
Fair Value Disclosures
The following tables present the fair value measurements of investments, by major class, and cash equivalents as of June 30, 2025, according to the fair value hierarchy:
| | | | | | | | | | | | | | | | | | | | | | | |
| Level 1 | | Level 2 | | Level 3 | | Total |
| Assets: | | | | | | | |
| First Lien Term Loans | $ | — | | | $ | 25,905 | | | $ | 775,189 | | | $ | 801,094 | |
| Equity Investments | — | | | — | | | 1,059 | | | 1,059 | |
| Cash Equivalents | 12,682 | | | — | | | — | | | 12,682 | |
| Total | $ | 12,682 | | | $ | 25,905 | | | $ | 776,248 | | | $ | 814,835 | |
The following table provides a reconciliation of the beginning and ending balances for investments that use Level 3 inputs for the six months ended June 30, 2025:
| | | | | | | | | | | | | | | | | |
| First Lien Term Loans | | Equity Investments | | Total |
| Balance as of December 31, 2024 | $ | 649,423 | | | $ | — | | | $ | 649,423 | |
| Purchase of investments | 142,467 | | | 1,059 | | | 143,526 | |
| Proceeds from principal repayments and sales of investments | (32,155) | | | — | | | (32,155) | |
| | | | | |
| Amortization of premium/accretion of discount, net | 895 | | | — | | | 895 | |
| Net realized gain on investments | (6,794) | | | — | | | (6,794) | |
| Net change in unrealized depreciation on investments | (262) | | | — | | | (262) | |
| | | | | |
| Transfers to Level 3 | 21,615 | | | — | | | 21,615 | |
| Balance as of June 30, 2025 | $ | 775,189 | | | $ | 1,059 | | | $ | 776,248 | |
| | | | | |
| Net change in unrealized appreciation (depreciation) on investments still held as of June 30, 2025 | $ | (2,615) | | | $ | — | | | $ | (2,615) | |
Transfers between levels, if any, are recognized at the beginning of the period in which the transfers occur. For the six months ended June 30, 2025, transfers into and out of Level 3 were a result of changes in the observability of significant inputs for certain portfolio companies.
NC SLF INC.
NOTES TO CONSOLIDATED FINANCIAL STATEMENTS (UNAUDITED)
(dollars amounts in thousands, except per share data)
Significant Unobservable Inputs
ASC Topic 820 requires disclosure of quantitative information about the significant unobservable inputs used in the valuation of assets and liabilities classified as Level 3 within the fair value hierarchy. The valuation techniques and significant unobservable inputs used in Level 3 fair value measurements of assets as of June 30, 2025 were as follows:
| | | | | | | | | | | | | | | | | | | | | | | | | | | | | | | | | | | |
| Investment Type | | Fair Value as of June 30, 2025 | | Valuation Techniques | | Unobservable Inputs | | Ranges | | Weighted Average |
| First Lien Term Loans | | $ | 703,715 | | | Yield Method | | Market Yield Discount Rate | | 5.31 | % | 14.46 | % | | 9.26 | % |
| First Lien Term Loans | | 2,532 | | | Market Approach | | EBITDA Multiple | | 4.75x | 4.75x | | 4.75x |
| | | | Market Approach | | Revenue Multiple | | 0.40x | 0.40x | | 0.40x |
| Equity Investments | | 1,059 | | | Market Approach | | EBITDA Multiple | | 4.75x | 4.75x | | 4.75x |
| | | | Market Approach | | Revenue Multiple | | 0.40x | 0.40x | | 0.40x |
| Total | | $ | 707,306 | | | | | | | | | | |
First Lien Term Loans in the amount of $68,942 at June 30, 2025 have been excluded from the table above as the investments are valued using a recent transaction price.
Debt investments are generally valued using a yield analysis. In a yield analysis, a price is ascribed for each investment based upon an assessment of current and expected market yields for similar investments and risk profiles. Additional consideration is given to the expected life, portfolio company performance since close, and other terms and risks associated with an investment. Among other factors, a determinant of risk is the amount of leverage used by the portfolio company relative to its total enterprise value, and the rights and remedies of the Company’s investment within the portfolio company’s capital structure. A recent market trade, if applicable, will also be factored into the valuation.
The significant unobservable input used in the yield method is a discount rate based on comparable market yields. Significant increases in discount rates in isolation would result in a significantly lower fair value measurement. The significant unobservable input used in the market approach is the performance multiple, which may include a revenue multiple, EBITDA multiple, or forward-looking metrics. The multiple is used to estimate the enterprise value of the underlying investment. An increase or decrease in the multiple would result in an increase or decrease, respectively, in the fair value. A recent transaction, if applicable, may also be factored into the valuation if the transaction price is believed to be an indicator of value.
Alternative valuation methodologies may be used as deemed appropriate and may include, but are not limited to, a market analysis, income analysis, or liquidation (recovery) analysis.
Weighted average inputs are calculated based on the relative fair value of the investments.
5.RELATED PARTY TRANSACTIONS
Investment Management Agreement
The Company entered into an investment advisory and management agreement (the “Prior Investment Management Agreement”) with the Investment Adviser, which became effective on May 31, 2021. In connection with the 1940 Act Registration, the Company entered into a new investment advisory and management agreement with the Investment Adviser, which became effective on October 4, 2022 (as amended on October 25, 2022, the “Investment Management Agreement”). Under the Investment Management Agreement, the Investment Adviser manages the day-to-day operations of, and provides investment advisory and management services to, the Company. On August 2, 2022, the Board, including all of the directors who are not “interested persons” (as defined in Section 2(a)(19) of the 1940 Act) of the Company (the “Independent Directors”), approved the Investment Management Agreement in accordance with, and on the basis of an evaluation satisfactory to such Independent Directors as required by, the 1940 Act. The Investment Management Agreement was unanimously approved by our shareholders on August 9, 2022 and became effective on October 4, 2022. Unless earlier terminated as described below, the Investment Management Agreement was effective for an initial period of two years from October 4, 2022, the date it first became effective, and will remain in effect from year to year thereafter if approved annually by (i) the affirmative vote of a majority of the Board, or by the affirmative vote of a majority of the
NC SLF INC.
NOTES TO CONSOLIDATED FINANCIAL STATEMENTS (UNAUDITED)
(dollars amounts in thousands, except per share data)
Company’s outstanding voting securities, and (ii) the affirmative vote of a majority of the Independent Directors. The Investment Management Agreement will automatically terminate in the event of an assignment by the Investment Adviser.
Effective October 4, 2022, the Company pays the Investment Adviser a fee for its services under the Investment Management Agreement consisting of an annual base management fee (the “Management Fee”). The Management Fee is payable quarterly in arrears.
During the Investment Period, the Management Fee is calculated at an annual rate with respect to the Company’s Average Total Assets (defined below), such rate being determined as follows: (i) 0.50% in respect of Average Total Assets equal to or less than $500 million, (ii) 0.40% in respect of the portion of Average Total Assets in excess of $500 million and equal to or less than $1 billion, and (iii) 0.35% in respect of the portion of Average Total Assets in excess of $1 billion. “Average Total Assets” shall mean the average of the Company’s total assets (which excludes cash and cash equivalents and undrawn Capital Commitments, but includes assets financed under leverage) as of the end of each of the two most recently completed calendar quarters. For purpose of this calculation, cash and cash equivalents include any temporary investments in cash-equivalents, U.S. government securities and other high quality investment grade debt investments that mature in 12 months or less from the date of investment.
After the Investment Period, the Management Fee shall be calculated at a rate equal to the Applicable Ratio (as defined below) per annum on the basis of the Company's Average Total Assets as of the end of the two most recently completed calendar quarters and shall be payable quarterly in arrears. The term "Applicable Ratio" shall mean a percentage calculated by (i) taking the sum of (A) the Average Total Assets equal to or less than $500 million multiplied by 0.50%, plus (B) the Average Total Assets greater than $500 million and equal to or less than $1 billion multiplied by 0.40%, plus (C) the Average Total Assets greater than $1 billion multiplied by 0.35% and dividing such total by (ii) the total Average Total Assets.
Under the Prior Investment Management Agreement, prior to the Investment Period, the Management Fee was calculated at an annual blended rate with respect to the Company’s Assets Invested (as defined below) at the end of each quarterly period by reference to (i) 0.75% in case of Assets Invested equal to or less than $500 million, (ii) 0.65% in case of Assets Invested greater than $500 million and equal to or less than $1 billion and (iii) 0.60% in case of Assets Invested greater than $1 billion. “Assets Invested” means, as of the end of each quarterly period, the sum of the Company’s (i) drawn Capital Commitments (as such term is defined in the subscription agreements executed by each of the Company’s shareholders), and (ii) outstanding principal on borrowings. For the avoidance of doubt, the quarterly Management Fees payable to the Investment Adviser shall be calculated based on the lower of the actual Assets Invested as of the end of any quarter and the target Assets Invested for that quarter as set forth in the Prior Investment Management Agreement.
Prior to the 1940 Act Registration, on November 3, 2021, the Company entered into a management fee waiver agreement (the “Fee Waiver Agreement”) with the Investment Adviser, pursuant to which the Investment Adviser agreed to waive 100% of the management fees payable to the Investment Adviser. The Fee Waiver Agreement did not amend the calculation of the Management Fee and was extended, from time to time, through October 4, 2022, the effective date of the Investment Management Agreement.
For the six months ended June 30, 2025, $1,751 of management fees were incurred by the Company. As of June 30, 2025, $903 was unpaid and is included in management fees payable in the accompanying consolidated statement of assets and liabilities.
The Investment Adviser and its affiliates manage other funds that have investment mandates that are similar, in whole or in part, to the Company's investment mandates. The Investment Adviser and its affiliates may determine that an investment is appropriate for the Company or for one or more of those other funds. In such event, depending on the availability of such investment and other appropriate factors, the Investment Adviser or its affiliates may determine that the Company should invest side-by-side with one or more of those other funds. Any such investments will be made only to the extent permitted by applicable law, interpretive positions of the SEC and the Investment Adviser's allocation procedures.
On August 5, 2025, the Company and certain of its affiliates were granted an order for co-investment exemptive relief by the SEC based on an updated model of co-investment order that was recently granted by the SEC (the “Order”). The Order supersedes the prior exemptive order granted on June 7, 2019 and amended on October 14, 2022. The Order permits the Company to participate in negotiated co-investment transactions with other funds managed by the Investment Adviser and certain other affiliates pursuant to the conditions of the Order. The Order requires that a “required majority” (as defined
NC SLF INC.
NOTES TO CONSOLIDATED FINANCIAL STATEMENTS (UNAUDITED)
(dollars amounts in thousands, except per share data)
in Section 57(o) of the 1940 Act) of the Board make certain findings with respect to the following, among other things: (1) when the Company co-invests with an affiliated entity (as defined in the exemptive application) in an issuer where an affiliated entity has an existing investment in the issuer under certain circumstances, and (2) if the Company disposes of an asset acquired in a co-investment transaction unless the disposition is done on a pro rata basis or the disposition is of a tradable security. Pursuant to the Order, the Board will oversee the Company’s participation in the co-investment program. As required by the Order, the Company has adopted, and the Board has approved, policies and procedures reasonably designed to ensure the Company’s compliance with the conditions of the Order, and the Investment Adviser and the Company’s Chief Compliance Officer will provide reporting to the Board.
Administration Agreement
The Company entered into an administration agreement (the “Administration Agreement”) with the Administrator. Pursuant to the Administration Agreement, the Administrator furnishes the Company with office facilities and equipment and provides clerical, bookkeeping and record keeping and other administrative services at such facilities. The Administrator performs, or oversees the performance of, the required administrative services, which include, among other things, assisting the Company with the preparation of the financial records that the Company is required to maintain and with the preparation of reports to shareholders and reports filed with the SEC. At the request of the Investment Adviser, the Administrator also may provide significant managerial assistance on the Company’s behalf to those portfolio companies that have accepted the Company’s offer to provide such assistance. The Administrator has entered into a sub-administration agreement with U.S. Bank National Association (“U.S. Bank”) to provide the Company with certain fund administration and bookkeeping services. For the six months ended June 30, 2025, the Company incurred $412 in administration fees. As of June 30, 2025, $373 was unpaid and is included in accounts payable and accrued expenses in the accompanying consolidated statement of assets and liabilities.
Directors’ Fees
The Board currently consists of three members, two of whom are Independent Directors. The Board has established an Audit Committee, a Nominating and Corporate Governance Committee, and a Co-Investment Committee, each solely consisting of the Independent Directors, and may establish additional committees in the future. For the six months ended June 30, 2025, the Company incurred $29 in fees which are included in directors’ fees in the accompanying consolidated statement of operations. As of June 30, 2025, $15 was unpaid and is included in directors’ fees payable in the accompanying consolidated statement of assets and liabilities.
Other Related Party Transactions
TIAA SMA Strategies LLC (“TIAA SMA”), an affiliate of the Company, owns shares of the Company’s common stock, see Note 8 for further discussion. From time to time, the Investment Adviser may pay amounts owed by the Company to third-party providers of goods or services and the Company will subsequently reimburse the Investment Adviser for such amounts paid on its behalf. Amounts payable to the Investment Adviser are settled in the normal course of business without formal payment terms. As of June 30, 2025, the Company owed the Investment Adviser $267 for reimbursements, which are included in accounts payable and accrued expenses in the accompanying consolidated statement of assets and liabilities.
NC SLF INC.
NOTES TO CONSOLIDATED FINANCIAL STATEMENTS (UNAUDITED)
(dollars amounts in thousands, except per share data)
6.SECURED BORROWINGS
In accordance with the 1940 Act, the Company is allowed to borrow amounts only to the extent that its asset coverage, as defined in the 1940 Act, is maintained at a level of at least 300% after such borrowings. As of June 30, 2025, asset coverage was 319.43%.
Subscription Facility
On September 9, 2021, the Company entered into a revolving credit agreement (as amended and modified from time to time, the “Credit Agreement” and the senior secured revolving credit facility thereunder, the “Subscription Facility”) with Wells Fargo Bank, National Association (“Wells Fargo”), as the administrative agent for certain secured parties, sole lead arranger, bookrunner, letter of credit issuer and the lender.
The Subscription Facility was subsequently amended on December 20, 2022, December 19, 2023, and December 17, 2024. The most recent amendment on December 17, 2024, among other things: (i) reduced the maximum amount available from up to $100,000 to up to $70,000, and further reduced the maximum amount available to up to $50,000 on or after January 15, 2025; (ii) reduced the applicable margin from 2.35% per annum to 2.15% per annum; and (iii) extended the maturity date under the Subscription Facility from December 17, 2024 to December 16, 2025.
The maximum amount available under the Subscription Facility is subject to availability under the Borrowing Base. The Borrowing Base is calculated based on the unfunded capital commitments of certain investors that have subscribed to purchase shares of the Company, to the extent the capital commitments of such investors have also been approved by Wells Fargo for inclusion in the borrowing base and meet certain additional criteria. The Company also pays an unused commitment fee of 0.25% per annum as of June 30, 2025.
The Subscription Facility is structured as a revolving credit facility secured by the capital commitments of certain of the Company’s subscribed investors. The Subscription Facility contains certain financial covenants and events of default. As of June 30, 2025, the Company was in compliance with all covenants and other requirements noted in the Credit Agreement.
As of June 30, 2025, the Subscription Facility bore interest at a rate of SOFR, reset daily plus 2.15%, per annum.
ABL Facility
On April 27, 2023, SPV I entered into a loan and security agreement with Wells Fargo as the administrative agent, U.S. Bank Trust Company, National Association, as collateral agent, and U.S. Bank National Association, as custodian, and the lenders party thereto (the “Loan and Security Agreement” and the facility thereunder, the “ABL Facility”, as amended on April 16, 2024, July 9, 2024, July 31, 2024, and January 17, 2025). The most recent amendment on January 17, 2025, among other things, (i) increased the maximum commitment amount from up to $250,000 to up to $300,000, (ii) extended the reinvestment period end date from April 27, 2026 to January 17, 2028, and (iii) extended the maturity date from April 27, 2028 to January 17, 2030. The ABL Facility contains certain financial covenants and events of default. As of June 30, 2025, the Company was in compliance with all covenants and other requirements noted in the Loan and Security Agreement.
As of June 30, 2025, the ABL Facility bore interest at a rate of SOFR, reset daily plus 1.95%, per annum.
NC SLF INC.
NOTES TO CONSOLIDATED FINANCIAL STATEMENTS (UNAUDITED)
(dollars amounts in thousands, except per share data)
The carrying amount of the Company’s debt obligations approximate fair value. These fair value measurements were based on significant inputs not observable and thus represent Level 3 measurements. The borrowings consisted of the following as of June 30, 2025:
| | | | | | | | | | | | | | | | | |
| Subscription Facility | | ABL Facility | | Total |
| Total Commitment | $ | 50,000 | | | $ | 300,000 | | | $ | 350,000 | |
Borrowings Outstanding (1) | 34,000 | | | 217,500 | | | 251,500 | |
Unused Portion (2) | 16,000 | | | 82,500 | | | 98,500 | |
Amount Available (3) | 16,000 | | | 82,500 | | | 98,500 | |
________________
(1)Borrowings outstanding on the consolidated statement of assets and liabilities are net of deferred financing costs.
(2)The unused portion is the amount upon which commitment fees are based.
(3)Available for borrowing based on the computation of collateral to support the borrowings and subject to compliance with applicable covenants and financial ratios.
For the six months ended June 30, 2025, the components of interest expense and debt financing expenses related to the Subscription Facility were as follows:
| | | | | |
| Six Months Ended June 30, 2025 |
| Borrowing interest expense | $ | 1,011 | |
| Unused fees | 29 | |
| Amortization of deferred financing costs | 114 | |
| Total interest and debt financing expenses | $ | 1,154 | |
| |
| |
For the six months ended June 30, 2025, the components of interest expense and debt financing expenses related to the ABL Facility were as follows:
| | | | | |
| Six Months Ended June 30, 2025 |
| Borrowing interest expense | $ | 6,081 | |
| Unused fees | 261 | |
| Amortization of deferred financing costs | 355 | |
| Total interest and debt financing expenses | $ | 6,697 | |
| |
| |
For the six months ended June 30, 2025, the components of interest expense and debt financing expenses related to the Company’s borrowings were as follows:
| | | | | |
| Six Months Ended June 30, 2025 |
| Borrowing interest expense | $ | 7,092 | |
| Unused fees | 290 | |
| Amortization of deferred financing costs | 469 | |
| Total interest and debt financing expenses | $ | 7,851 | |
Average interest rate (1) | 6.68 | % |
| Average daily borrowings | $ | 222,961 | |
______________
(1)Average interest rate includes borrowing interest expense and unused fees.
NC SLF INC.
NOTES TO CONSOLIDATED FINANCIAL STATEMENTS (UNAUDITED)
(dollars amounts in thousands, except per share data)
Contractual Obligations
The following tables shows the contractual maturities of our debt obligations as of June 30, 2025:
| | | | | | | | | | | | | | | | | | | | | | | | | | | | | |
| Payments Due by Period |
| Total | | Less Than 1 Year | | 1 to 3 Years | | 3 to 5 Years | | More than 5 Years |
| Subscription Facility | $ | 34,000 | | | $ | 34,000 | | | $ | — | | | $ | — | | | $ | — | |
| ABL Facility | 217,500 | | | — | | | — | | | 217,500 | | | — | |
| Total debt obligations | $ | 251,500 | | | $ | 34,000 | | | $ | — | | | $ | 217,500 | | | $ | — | |
7.COMMITMENTS AND CONTINGENCIES
In the ordinary course of its business, the Company enters into contracts or agreements that contain indemnification or warranties. Future events could occur that might lead to the enforcement of these provisions against the Company. The Company believes that the likelihood of such an event is remote; however, the maximum potential exposure is unknown. No accrual has been made in the consolidated financial statements as of June 30, 2025 for any such exposure.
As of June 30, 2025, the Company had the following unfunded investment commitments:
| | | | | | | | | |
| Portfolio Company | | | |
| 360 Holdco, Inc. (360 Training) - Delayed Draw Loan | | $ | 1,346 | | |
| AB Centers Acquisition Corporation (Action Behavior Centers) - Delayed Draw Loan | | 793 | | |
| ACP Maverick Holdings, Inc. - Delayed Draw Loan | | 3,582 | | |
| All4 Buyer, LLC - Delayed Draw Loan | | 1,038 | | |
| AmerCareRoyal, LLC - Delayed Draw Loan | | 3,257 | | |
| Archer Acquisition, LLC (ARMstrong) - Delayed Draw Loan | | 338 | | |
| Ascend Partner Services LLC - Delayed Draw Loan | | 3,581 | | |
| Bluebird PM Buyer, Inc. - Delayed Draw Loan | | 502 | | |
| Bridges Consumer Healthcare Intermediate LLC - Delayed Draw Loan | | 2,339 | | |
| Businessolver.com, Inc. - Delayed Draw Loan | | 235 | | |
| CLS Management Services, LLC (Contract Land Staff) - Delayed Draw Loan | | 2,176 | | |
| Cobalt Service Partners, LLC - Delayed Draw Loan | | 9,015 | | |
| Cohen Advisory, LLC - Delayed Draw Loan | | 2,006 | | |
| Davidson Hotel Company LLC - Delayed Draw Loan | | 440 | | |
| DH United Holdings, LLC (D&H United Fueling Solutions) - Delayed Draw Loan | | 1,847 | | |
| Diligent Corporation (fka Diamond Merger Sub II, Corp.) - Delayed Draw Loan | | 2,515 | | |
| ERA Industries, LLC (BTX Precision) - Delayed Draw Loan | | 513 | | |
| EVDR Purchaser, Inc. (Alternative Logistics Technologies Buyer, LLC) - Delayed Draw Loan | | 1,468 | | |
| Excel Fitness Holdings, Inc. - Delayed Draw Loan | | 826 | | |
| FirstCall Mechanical Group, LLC - Delayed Draw Loan | | 2,889 | | |
| FoodScience, LLC - Delayed Draw Loan | | 1,944 | | |
| Heartland Paving Partners, LLC - Delayed Draw Loan | | 611 | | |
| HMN Acquirer Corp. - Delayed Draw Loan | | 1,056 | | |
| Impact Advisors, LLC - Delayed Draw Loan | | 7,010 | | |
| Impact Parent Corporation (Impact Environmental Group) - Delayed Draw Loan | | 2,352 | | |
| ISG Enterprises, LLC (Industrial Service Group) - Delayed Draw Loan | | 510 | | |
| Kenco PPC Buyer LLC - Delayed Draw Loan | | 488 | | |
| KENG Acquisition, Inc. (Enagage PEO) - Delayed Draw Loan | | 4,542 | | |
| KENG Acquisition, Inc. (Engage PEO) - Delayed Draw Loan | | 5,347 | | |
NC SLF INC.
NOTES TO CONSOLIDATED FINANCIAL STATEMENTS (UNAUDITED)
(dollars amounts in thousands, except per share data)
| | | | | | | | | |
| Portfolio Company | | | |
| Lavie Group, Inc. - Delayed Draw Loan | | 321 | | |
| Matador US Buyer, LLC (Insulation Technology Group) - Delayed Draw Loan | | 123 | | |
| Mobile Communications America, Inc. - Delayed Draw Loan | | 3,259 | | |
| MPG Parent Holdings, LLC (Market Performance Group) - Delayed Draw Loan | | 2,165 | | |
| Nellson Nutraceutical, LLC - Delayed Draw Loan | | 595 | | |
| Online Labels Group, LLC - Delayed Draw Loan | | 292 | | |
| Orion Group FM Holdings, LLC (Leo Facilities) - Delayed Draw Loan | | 7,003 | | |
| Ovation Holdings, Inc - Delayed Draw Loan | | 573 | | |
| Promptcare Infusion Buyer, Inc. - Delayed Draw Loan | | 626 | | |
| Randys Holdings, Inc. (Randy's Worldwide Automotive) - Delayed Draw Loan | | 1,676 | | |
| Redwood Services Group, LLC (Evergreen Services Group) - Delayed Draw Loan | | 3,153 | | |
| Safety Infrastructure Services Intermediate LLC - Delayed Draw Loan | | 1,417 | | |
| SCIC Buyer, Inc. - Delayed Draw Loan | | 1,352 | | |
| Secretariat Advisors LLC - Delayed Draw Loan | | 396 | | |
| SI Solutions, LLC - Delayed Draw Loan | | 1,951 | | |
| Smith & Howard Advisory LLC - Delayed Draw Loan | | 540 | | |
| Tidi Legacy Products, Inc. - Delayed Draw Loan | | 1,972 | | |
| Transit Buyer, LLC (Propark Mobility) - Delayed Draw Loan | | 2,803 | | |
| Vensure Employer Services, Inc. - Delayed Draw Loan | | 1,431 | | |
| Vertex Service Partners, LLC - Delayed Draw Loan | | 3,543 | | |
| WSB Engineering Holdings Inc. - Delayed Draw Loan | | 14,760 | | |
| Total unfunded commitments | | $ | 114,517 | | |
The Company seeks to carefully consider its unfunded investment commitments for the purpose of planning its ongoing liquidity. As of June 30, 2025, the Company had adequate financial resources to satisfy the unfunded investment commitments.
8.NET ASSETS
The Company has the authority to issue 500,000,000 common shares at $0.01 per share par value. On April 16, 2021, the Company issued 100 common shares for $1 to the Investment Adviser in connection with its formation.
On June 21, 2021, the Company held its Initial Closing and entered into subscription agreements with a number of investors in connection with the Private Offering. Under the terms of the subscription agreements, investors are required to fund drawdowns to purchase the Company's shares of common stock up to the amount of their respective capital commitment each time the Company delivers a drawdown notice. On June 29, 2021, the Investment Adviser transferred its 100 common shares to an affiliated entity of the Company, TIAA SMA.
As of June 30, 2025, the Company had received capital commitments totaling $656,500 ($191,499 remaining undrawn), of which $6,500 ($1,896 remaining undrawn) is from TIAA SMA. As of June 30, 2025, TIAA SMA owned 464,089 shares of the Company's common stock, representing approximately 1% of the total outstanding shares of common stock.
NC SLF INC.
NOTES TO CONSOLIDATED FINANCIAL STATEMENTS (UNAUDITED)
(dollars amounts in thousands, except per share data)
The following table summarizes total shares issued and proceeds received related to capital activity from inception through June 30, 2025:
| | | | | | | | | | | | | | | | | | | | | | |
| Date | | Shares Issued | | Proceeds Received | | Issuance Price per Share | | |
| June 27, 2025 | | 1,524,390 | | $15,000 | | $9.84 | | |
| March 27, 2025 | | 1,003,009 | | $10,000 | | $9.97 | | |
| December 27, 2024 | | 2,002,002 | | $20,000 | | $9.99 | | |
| August 23, 2024 | | 3,039,514 | | $30,000 | | $9.87 | | |
| June 28, 2024 | | 3,009,027 | | $30,000 | | $9.97 | | |
| March 28, 2024 | | 2,507,523 | | $25,000 | | $9.97 | | |
| December 5, 2023 | | 2,553,626 | | $25,000 | | $9.79 | | |
| October 26, 2022 | | 7,150,153 | | $70,000 | | $9.79 | | |
| September 7, 2022 | | 7,591,093 | | $75,000 | | $9.88 | | |
| June 27, 2022 | | 3,015,076 | | $30,000 | | $9.95 | | |
| January 14, 2022 | | 7,477,568 | | $75,000 | | $10.03 | | |
| June 29, 2021 | | 6,000,000 | | $60,000 | | $10.00 | | |
| April 16, 2021 | | 100 | | $1 | | $10.00 | | |
The following table summarizes the Company's dividends declared from inception through June 30, 2025:
| | | | | | | | | | | | | | | | | | | | |
| Date Declared | | Record Date | | Payment Date | | Dividend per Share |
| June 26, 2025 | | June 27, 2025 | | July 11, 2025 | | $0.240 |
| March 27, 2025 | | March 28, 2025 | | April 11, 2025 | | $0.240 |
| December 23, 2024 | | December 31, 2024 | | January 10, 2025 | | $0.250 |
| September 27, 2024 | | September 27, 2024 | | October 11, 2024 | | $0.270 |
| June 28, 2024 | | June 27, 2024 | | July 12, 2024 | | $0.280 |
| March 28, 2024 | | March 28, 2024 | | April 12, 2024 | | $0.270 |
| December 28, 2023 | | December 29, 2023 | | January 10, 2024 | | $0.280 |
| September 29, 2023 | | September 29, 2023 | | October 12, 2023 | | $0.250 |
| June 28, 2023 | | June 28, 2023 | | July 12, 2023 | | $0.240 |
| March 30, 2023 | | March 31, 2023 | | April 12, 2023 | | $0.230 |
| December 29, 2022 | | December 29, 2022 | | January 17, 2023 | | $0.205 |
| September 28, 2022 | | September 28, 2022 | | October 12, 2022 | | $0.150 |
| June 30, 2022 | | June 30, 2022 | | July 12, 2022 | | $0.120 |
| March 30, 2022 | | March 31, 2022 | | April 12, 2022 | | $0.110 |
NC SLF INC.
NOTES TO CONSOLIDATED FINANCIAL STATEMENTS (UNAUDITED)
(dollars amounts in thousands, except per share data)
The following table reflects the shares issued pursuant to the distribution reinvestment plan from inception through June 30, 2025:
| | | | | | | | | | | | | | | | | | | | | | |
| Date Declared | | Record Date | | Payment Date | | Shares Issued | | |
| June 26, 2025 | | June 27, 2025 | | July 11, 2025 | | 1,411,166 | | |
| March 27, 2025 | | March 28, 2025 | | April 11, 2025 | | 1,329,704 | | |
| December 23, 2024 | | December 31, 2024 | | January 10, 2025 | | 1,326,981 | | |
| September 27, 2024 | | September 27, 2024 | | October 11, 2024 | | 1,343,703 | | |
| June 28, 2024 | | June 27, 2024 | | July 12, 2024 | | 1,187,958 | | |
| March 28, 2024 | | March 28, 2024 | | April 12, 2024 | | 1,122,412 | | |
| December 28, 2023 | | December 29, 2023 | | January 10, 2024 | | 1,059,984 | | |
| September 29, 2023 | | September 29, 2023 | | October 12, 2023 | | 862,151 | | |
| June 28, 2023 | | June 28, 2023 | | July 12, 2023 | | 809,141 | | |
| March 30, 2023 | | March 31, 2023 | | April 12, 2023 | | 755,726 | | |
| December 29, 2022 | | December 29, 2022 | | January 17, 2023 | | 651,544 | | |
| | | | | | | | |
9.CONSOLIDATED FINANCIAL HIGHLIGHTS
The following is a schedule of the Company's consolidated financial highlights for the six months ended June 30, 2025 and for the years ended December 31, 2024, 2023, and 2022, and for the period from April 16, 2021 (Commencement of Operations) through December 31, 2021:
| | | | | | | | | | | | | | | | | | | | | | | | | | | | | | |
| Six Months Ended June 30, | | For the Years Ended | |
| 2025 | | 2024 | | 2023 | | 2022 | | 2021(7) | |
| Per share data: | | | | | | | | | | |
| Net asset value, beginning of period | $ | 9.75 | | | $ | 9.64 | | | $ | 9.61 | | | $ | 10.03 | | | $ | 10.00 | | |
Net investment income (loss) (1) | 0.50 | | | 1.12 | | | 1.03 | | | 0.72 | | | 0.05 | | |
Net realized gain (loss) (1) | (0.13) | | | (0.10) | |
| 0.01 | | | — | | | — | | |
Net change in unrealized appreciation (depreciation) (1) | (0.02) | | | 0.14 | | | (0.01) | | | (0.54) | | | 0.05 | | |
Net increase (decrease) in net assets resulting from operations (1) | 0.35 | | | 1.16 | | | 1.03 | | | 0.18 | | | 0.10 | | |
Shareholder distributions (2) | (0.48) | | | (1.07) | | | (1.00) | | | (0.59) | | | — | | |
Other (3) | 0.01 | | | 0.02 | | | — | | | (0.01) | | | (0.07) | | |
| Net asset value, end of period | $ | 9.63 | | | $ | 9.75 | | | $ | 9.64 | | | $ | 9.61 | | | $ | 10.03 | | |
| | | | | | | | | | |
| Net assets, end of period | $551,862 | | $508,499 | | $355,208 | | $300,135 | | $60,197 | |
Shares outstanding, end of period | 57,322,385 | | 52,138,301 | | 36,866,178 | | 31,233,990 | | 6,000,100 | |
Total Return (4) | 3.72 | % | | 12.77 | % | | 11.16 | % | | 1.65 | % | | 0.33 | % | |
| | | | | | | | | | |
| Ratio to average net assets: | | | | | | | | | | |
Ratio of net expenses to average net assets (5) | 4.04 | % | | 4.69 | % | | 3.31 | % | | 1.62 | % | | 3.15 | % | |
Ratio of net investment income to average net assets (5) | 10.37 | % | | 11.38 | % | | 10.74 | % | | 7.46 | % | | 0.62 | % | |
Portfolio turnover rate (6) | 6.99 | % | | 11.80 | % | | 6.40 | % | | 2.98 | % | | 2.77 | % | |
Asset coverage ratio (8) | 319.43 | % | | 340.99 | % | | 322.70 | % | | 2828.50 | % | | 192.60 | % | |
__________________(1)The per share data was derived by using the weighted average shares outstanding during the period.
NC SLF INC.
NOTES TO CONSOLIDATED FINANCIAL STATEMENTS (UNAUDITED)
(dollars amounts in thousands, except per share data)
(2)The per share data for distributions reflects the actual amount of distributions declared during the period.
(3)Includes the effect of share issuances above (below) NAV and the impact of different share amounts used in calculating per share data as a result of calculating certain per share data based on weighted average shares outstanding during the period and certain per share data based on shares outstanding as of a period end or transaction date.
(4)Total return is calculated as the change in NAV per share during the period, plus distributions per share, if any, divided by the beginning NAV per share. Dividends and distributions, if any, are assumed for purposes of this calculation to be reinvested in accordance with the dividend reinvestment plan.
(5)Ratios are annualized except for amounts relating to organizational costs, and the management fee waiver for the period from April 16, 2021 (Commencement of Operations) through October 4, 2022. The ratio of total expenses to average net assets was 4.04%, 4.69%, 3.31%, 2.34%, and 3.65% for the six months ended June 30, 2025 and for the years and period ended December 31, 2024, 2023, 2022 and 2021, respectively, on an annualized basis (where applicable), excluding the effect of the management fee waiver which represented 0.00%, 0.00%, 0.00%, (0.72)%, and (0.51)% of average net assets, respectively. Average net assets is calculated utilizing quarterly net assets.
(6)Portfolio turnover rate is calculated using the lesser of year-to-date sales or year-to-date purchases over the average of the invested assets at fair value for the periods reported.
(7)Period from April 16, 2021 (Commencement of Operations) through December 31, 2021. Net asset value of $10.00 represents the issuance price per share of all shares issued and outstanding as of April 16, 2021.
(8)Asset coverage ratio is equal to (i) the sum of (a) net assets at the end of the period and (b) debt outstanding at the end of the period, divided by (ii) total debt outstanding at the end of the period.
10. SUBSEQUENT EVENTS
The Company’s management evaluated subsequent events through the date of issuance of the consolidated financial statements. There have been no subsequent events that occurred during such period that would require disclosure in, or would be required to be recognized in, the consolidated financial statements as of June 30, 2025.
DISTRIBUTION REINVESTMENT PLAN
The Company has adopted a distribution reinvestment plan pursuant to which shareholders may elect to have their cash dividends and other distributions automatically reinvested in additional shares, rather than receiving cash dividends and other distributions. As a result, if the Board authorizes, and we declare, a dividend or other distribution, then our shareholders who have opted in to our distribution reinvestment plan will have their dividend or other distribution automatically reinvested in additional shares rather than receiving the dividend or other distribution in cash. Any fractional share otherwise issuable to a participant in the distribution reinvestment plan will be paid in cash.
No action will be required on the part of a registered shareholder to receive his, her, or its dividend in cash. A registered shareholder that wishes to participate in the distribution reinvestment plan must notify us and U.S. Bank National Association (the “Plan Administrator”) in writing no later than ten calendar days prior to the record date for any dividend or other distribution and such election will remain in place until the shareholder notifies the Plan Administrator otherwise.
The number of shares to be issued to a shareholder under the distribution reinvestment plan will be determined by dividing the total dollar amount of the dividend or other distribution payable to such shareholder by the NAV per share, as of the last day of our fiscal quarter immediately preceding the date such dividend or other distribution was declared.
There are no brokerage charges or other charges to shareholders who participate in the distribution reinvestment plan.
The distribution reinvestment plan is terminable by us upon notice in writing mailed to each shareholder of record at least 30 days prior to any record date for the payment of any dividend or other distribution by us.
ADDITIONAL INFORMATION
Investment Objective
The Company’s investment objective is to generate current income and capital appreciation. The Company seeks to achieve its investment objective primarily by investing in or originating first lien and unitranche leveraged loans to private equity-owned U.S. middle market companies that require capital for growth, acquisitions, recapitalizations, refinancings and leveraged buyouts, which the Investment Adviser believes have sustainable, leading positions in their respective markets with scalable revenues and operating cash flow, experienced management teams, and other positive business characteristics. The Company makes investments through both primary originations and open-market secondary purchases. The Company defines U.S. middle market businesses as those businesses with annual EBITDA of approximately $10 million to $200 million. The Company focuses on privately originated debt to performing U.S. middle market companies, with a portfolio comprised primarily of Senior Loans. The Company plans to invest its available capital, which includes funds available for investment from time to time, including both drawn and undrawn Capital Commitments, but excluding funds set aside for distributions to the Company’s shareholders or reserved for estimated future expenses, in assets that would be considered Senior Loans.
The Company has elected to be treated, and intends to qualify annually, for U.S. federal income tax purposes as a RIC under subchapter M of the Code. To qualify as a RIC, the Company is required to comply with certain regulatory requirements. For example, because the Company intends to continue to qualify as a RIC under the Code, its portfolio will be subject to diversification and other requirements.
In addition to the diversification requirement under the Code, the Company will generally seek not to invest more than 2% of the sum of (i) its investors’ aggregate Capital Commitments plus (ii) Target Leverage (as defined below), as determined at the time of investment, in any single portfolio company. The 1940 Act generally limits the ability of the Company to leverage its investments. In general, the Company may not engage in transactions that result in the issuance of a “senior security” representing indebtedness, unless immediately after the issuance of the senior security, the Company maintains “asset coverage” of at least 300%. For this purpose, “asset coverage” means the ratio that the value of the Company’s total assets, less all liabilities and indebtedness not represented by senior securities (“total net assets”), bears to the aggregate amount of senior securities representing the Company’s indebtedness. This requirement effectively limits the Company’s ability to leverage its portfolio. Specifically, the Company cannot acquire senior securities representing indebtedness to one-third of its total net assets. We refer to this type of leverage as “Target Leverage.”
The Investment Adviser is a Delaware limited liability company registered as an investment adviser with the SEC under the Advisers Act. The Investment Adviser serves as the investment adviser to the Company and manages other middle market investment strategies for affiliated entities such as TIAA, as well as for private funds and accounts. All investment decisions for the Company require the unanimous approval of the Investment Adviser’s investment committee.
Investment Criteria
The Investment Adviser has identified the following investment criteria and guidelines for use in evaluating prospective portfolio companies in the Company’s portfolio. However, not all of these criteria and guidelines will be met in connection with each of the Company’s investments. The Company’s target portfolio companies will typically exhibit some or all of the following characteristics:
•EBITDA of $10 million to $200 million;
•significant cash equity capitalization supported by a private equity sponsor;
•sustainable leading positions in their respective markets;
•scalable revenues and operating cash flow;
•experienced management teams with successful histories and the ability to successfully operate in a leveraged environment and to adapt to challenging economic or business conditions;
•strong recurring revenue or “re-occurring” revenue, with good visibility of backlog and revenue;
•stable, predictable cash flows with low technology and market risks;
•diversified product offering and customer base;
•low capital expenditure requirements;
•a North American base of operations;
•strong customer relationships;
•products, services or distribution channels having distinctive competitive advantages; and
•a defensible niche strategy or other barriers to entry.
While the Investment Adviser believes that the criteria listed above is important in identifying and investing in prospective portfolio investments, not all of these criteria necessarily will be met by each prospective portfolio company. In addition, subject to its Charter and the bylaws, the Company may change its investment objective and/or investment criteria over time without notice to or consent from its shareholders, subject to the limitations under the 1940 Act.
Summary of Key Attributes of the Company’s Middle Market Senior Loans
The Investment Adviser believes that the Company’s investments in first-lien senior secured debt and unitranche loans (other than last-out positions in unitranche loans) (collectively, “Senior Loans”) of middle market corporate borrowers have attributes that offer attractive risk/reward characteristics, including:
•compelling economic and market fundamentals that support the need for Senior Loan capital and improved competitive dynamics for non-traditional lenders;
•“buy-and-hold” investments that emphasize a high-touch relationship alignment with sponsors;
•floating-rate loans that provide protection against increases in interest rates, with middle market loans typically containing floating rate floors in the event a lower interest rate environment returns;
•small lending groups to facilitate more effective restructurings when necessary; and
•higher proportion of sponsor equity and increased likelihood of sponsors supporting troubled situations, with additional equity as compared to public markets;
In assessing the middle market, we anticipate that traditional middle market Senior Loan opportunities will typically, but not exclusively, have the following characteristics relative to lower middle market opportunities and more broadly syndicated loans:
•attractive yield premiums relative to public market credit and broadly syndicated debt strategies;
•strong return potential relative to risk profile;
•significant downside protection due to capital structure seniority, tighter structures than publicly traded debt investments, private equity sponsor backing, and deep due diligence; and
•favorable supply/demand dynamics with strong sponsor relationships and high-hold capacities providing a steady flow of attractive opportunities for well-positioned lenders.
The Company’s Investment Structure
The Company will target debt investments that will yield current income that can support distributions to its shareholders. The Company’s debt investments will typically be structured with the maximum seniority and collateral that the Company can reasonably obtain while seeking to achieve its total return target. The terms of the Company’s debt investments will be tailored to the facts and circumstances of the transaction and prospective portfolio company and structured to protect the Company’s rights and manage its risk while creating incentives for the portfolio company to
achieve its business plan. The cash interest that the Company collects on its debt investments provides a substantial source of return.
First Lien Senior Secured Loans. The Company will typically obtain collateral from portfolio companies in support of the repayment of such loans. This collateral takes the form of first-priority liens on substantially all of the borrower’s assets, including the equity interests of its domestic subsidiaries. The Company’s first-lien senior secured loans may provide for loan amortization in the early years of a loan, with the majority of the amortization deferred until loan maturity, with the expectation, and often a contractual requirement, that the borrower will often pre-pay the loan from cash flows in excess of the scheduled amortization, which is known as an excess cash flow sweep. First-lien senior secured loans generally allow the borrower to make a large lump sum payment of principal at the end of the loan term, and there is a risk of loss if the borrower is unable to pay the lump sum or refinance the amount owed at maturity.
Unitranche Loans. In connection with the Company’s investments in unitranche loans, it is expected that it will obtain security interests in substantially all of the assets of these portfolio companies that will serve as collateral in support of the repayment of unitranche loans. This collateral takes the form of first-priority liens on substantially all of the borrower’s assets, including the equity interests of its domestic subsidiaries. Unitranche loans typically provide for loan amortization in the initial years of the facility, with the majority of the amortization deferred until loan maturity, with a contractual requirement for excess cash flow sweeps that reduce the average life of the loan. Unitranche loans generally allow the borrower to make a large lump sum payment of principal at the end of the loan term, and there is a risk of loss if the borrower is unable to pay the lump sum or refinance the amount owed at maturity. The Company’s investments in unitranche loans may be in participations across the entire loan or through an agreement among lenders in participations in first-out term loans.
When the Company makes a debt investment, it may be granted equity in the portfolio company in the same class of security as the sponsor receives upon funding.
Borrowings
From time to time, and subject to the applicable limitations under Section 18 of the 1940 Act, the Company may also enter into revolving credit facilities, bridge financing commitments, delayed draw commitments or other commitments which can result in providing future financing to a Portfolio Company.
For more information on our borrowings, see Note 6 to the consolidated financial statements in the Report to Shareholders included under Item 1 of this Semi-Annual Report on Form N-CSR. Investment Selection and Process
The Company utilizes the following four-phase investment process:
Origination. The Senior Loan Investment Team will source middle market investment opportunities through its network of relationships with private equity firms and other middle market lenders. The Senior Loan Investment Team believes that the strength and breadth of its relationships with numerous middle market private equity funds and overall deal sourcing capabilities should enable them to maximize deal flow, support a highly selective investment process, and afford the Company the opportunity to establish favorable portfolio diversification.
Investment Evaluation. The Senior Loan Investment Team intends to utilize a systematic, consistent approach to credit and portfolio company evaluation, with a particular focus on an acceptable level of debt repayment and deleveraging as well as accretive growth and exit assumptions under a “base case” set of projections (the “Base Case”); this Base Case generally reflects a more conservative estimate than the set of projections provided by a prospective portfolio company, which the Senior Loan Investment Team refers to as the “Management Case.” The key criteria that the Senior Loan Investment Team intends to consider include (i) strong and resilient underlying business fundamentals, (ii) a substantial equity cushion in the form of capital ranking junior in right of payment to the Company’s investment and (iii) a conclusion that the overall Base Case—and in most cases, a “downside case”—allows for adequate debt repayment and deleveraging. In evaluating a particular company, the Senior Loan Investment Team will put more emphasis on credit considerations (such as (i) debt repayment and deleveraging under a Base Case set of projections, (ii) the ability of the portfolio company to maintain a modest liquidity cushion under a Base Case set of projections, and (iii) the ability of the company to service its fixed charge obligations under a Base Case set of projections) than on profit potential and loan pricing (among other
considerations both quantitative and qualitative). The Senior Loan Investment Team’s due diligence process for middle market investments will typically entail:
•a thorough review of historical and pro forma financial information (including both performance metrics and proposed capital structure and growth prospects);
•meetings and discussions with management and financial sponsors and their advisors;
•a review of loan documents and material contracts impactful to the operation and profitability of the business in question;
•third-party “quality of earnings” accounting due diligence;
•when appropriate, background checks on key management and/or sponsors;
•third-party research relating to the company’s business, industry, markets, products and services, customers, competitors, and regulatory exposure/treatment;
•the commission of third-party analyses when appropriate;
•sensitivity of Management Case and “sponsor case” projections; and
•various comprehensive cash flow analyses and sensitivity.
Execution. In executing transactions, the Senior Loan Investment Team will apply what it believes is a thorough, consistent approach to credit evaluation, and maintain discipline with respect to credit, pricing and structure to ensure the ultimate success of the financing. Upon completion of due diligence, the investment professionals working on a proposed portfolio investment will deliver a memorandum to the Investment Committee for approval. Once an investment has been approved by a unanimous vote of the Investment Committee, it will move through a series of steps, including an in-depth review of documentation by deal teams, negotiation of final documentation, including resolution of business points and the execution of original documents held in escrow. Upon completion of final documentation, a portfolio investment is funded after execution of a final closing memorandum.
Monitoring. The Senior Loan Investment Team views active portfolio monitoring as a vital part of the investment process and further considers regular dialogue with company management and sponsors as well as detailed, internally generated monitoring reports to be critical to monitoring performance. The Senior Loan Investment Team will implement a monitoring template designed to reasonably ensure compliance with these standards. This template will be used as a tool by the Senior Loan Investment Team to assess investment performance relative to plan. As part of the monitoring process, the Senior Loan Investment Team has developed risk policies pursuant to which it will regularly assess the risk profile of each of the Company’s investments. The Senior Loan Investment Team will rate each investment based internal risk ratings.
Environmental, Social and Governance Policies
Churchill has established a Responsible Investing policy for its investment program. Churchill is focused on delivering attractive risk-adjusted returns to its clients, including the Company, while upholding the highest ethical standards. Churchill assesses material environmental, social and governance ("ESG") factors as part of its investment process, which Churchill believes helps both create and protect value for its clients and is consistent with its fiduciary duties and efforts to maximize returns.
As part of its investment process, Churchill evaluates ESG-related risks that Churchill believes have the potential to damage a company’s operations and reputation. During due diligence, Churchill’s responsible investing team performs an analysis of each proposed portfolio company's operating history to identify material ESG risk factors to potentially minimize defaults and losses in its portfolio. Churchill’s responsible investment team utilizes a proprietary ESG ratings template that applies a set of criteria against each proposed investment, the output of which helps to inform Churchill’s determination of portfolio company suitability.
Churchill's ESG ratings template is designed to provide an assessment of a portfolio company’s ESG risks and is intended to aid Churchill in evaluating the return and risk profile of a given investment. Using a proprietary ESG rating methodology, the template rates individual issuers based on its perceived level of ESG-related risks. Post-investment, portfolio companies are monitored on an ongoing basis. Churchill’s investment teams conduct reviews with management teams and investment partners to discuss developments at the portfolio company, which may include a discussion of legal claims, complaints, or environmental issues, should they arise. When necessary, ESG updates are discussed at periodic portfolio review meetings in order to perform an ongoing risk assessment.
Churchill’s Responsible Investing policy is updated as needed to reflect changing practices and industry standards. The consideration of ESG factors as part of Churchill’s underwriting and portfolio management process, however, does not mean that the Company will pursue a specific ESG investment strategy or that a portfolio company will be selected solely on the basis of ESG factors. Although Churchill believes that ESG considerations aid Churchill in evaluating the return and risk profile of a given investment, Churchill may make investment decisions for the Company other than on the basis of ESG considerations.
Brokerage Allocation and Other Practices
The Investment Adviser will generally acquire and dispose of investments in privately negotiated transactions; as a result, it will infrequently use brokers in the normal course of business. Although these transactions will not involve brokers or brokerage commissions, assignment fees are often charged by an administrative agent for particular loans. Fees may be payable when buying and selling loans. The Investment Adviser may buy or sell securities directly from or to a dealer acting as principal at prices that include markups or markdowns.
For the six months ended June 30, 2025, the Company paid $0 in brokerage commissions.
Valuation of Portfolio Investments
At all times consistent with U.S. GAAP and under the 1940 Act, the Company will conduct a valuation of its assets, pursuant to which its NAV is determined.
Portfolio investments are valued in accordance with the fair value principles established by FASB ASC Topic 820, Fair Value Measurement (“ASC Topic 820”) and in accordance with the 1940 Act. ASC Topic 820’s definition of fair value focuses on the amount that would be received to sell the asset or paid to transfer the liability in the principal or most advantageous market, and prioritizes the use of market-based inputs (observable) over entity-specific inputs (unobservable) within a measurement of fair value.
Our assets are valued on a quarterly basis, or more frequently if required under the 1940 Act. Pursuant to Rule 2a-5 under the 1940 Act, the Board has designated the Investment Adviser as the Company's valuation designee (the “Valuation Designee”) to determine the fair value of the Company's investments that do not have readily available market quotations. Pursuant to the Company's valuation policy approved by the Board, a valuation committee comprised of employees of the Investment Adviser (the “Valuation Committee”) is responsible for determining the fair value of the Company's assets for which market quotations are not readily available, subject to the oversight of the Board.
Investments for which market quotations are readily available are typically valued at those market quotations. Market quotations are obtained from independent pricing services, where available. Generally investments marked in this manner will be marked at the mean of the bid and ask of the quotes obtained. To validate market quotations, we utilize a number of factors to determine if the quotations are representative of fair value, including the source and number of the quotations.
With respect to investments for which market quotations are not readily available, we or an independent third-party valuation firm engaged by the Valuation Designee, will take into account relevant factors in determining the fair value of our investments, including and in combination of: comparison to publicly traded securities, including factors such as yield, maturity and measures of credit quality; the enterprise value of a portfolio company; the nature and realizable value of any collateral; the portfolio company's ability to make payments and its earnings and discounted cash flows; and the markets in which the portfolio company does business. Investment performance data utilized are the most recently available financial statements and compliance certificates received from the portfolio companies as of the measurement date which in many cases may reflect a lag in information. The independent third-party valuation firm provides a fair valuation report, a description of the methodology used to determine the fair value and their analysis and calculations to support their conclusion.
When an external event such as a purchase transaction, public offering or subsequent sale or paydown occurs, we use the pricing indicated by the external event to corroborate our valuation.
U.S. GAAP establishes a hierarchical disclosure framework which ranks the level of observability of market price inputs used in measuring investments at fair value. The observability of inputs is impacted by a number of factors, including the type of investment and the characteristics specific to the investment and state of the marketplace, including the existence and transparency of transactions between market participants. Investments with readily available quoted prices or for which fair value can be measured from quoted prices in active markets generally have a higher degree of market price observability and a lesser degree of judgment applied in determining fair value. We review pricing and methodologies in order to determine if observable market information is being used, versus unobservable inputs.
Our accounting policy on the fair value of our investments is critical because the determination of fair value involves subjective judgments and estimates. Accordingly, the notes to our consolidated financial statements express the uncertainty with respect to the possible effect of these valuations, and any change in these valuations, on the consolidated financial statements.
Fundamental Policies
The Company’s stated fundamental policies, which may only be changed by the affirmative vote of a majority of the outstanding voting securities of the Company (the “Shares”), are listed below. “Majority of the outstanding voting securities of the Company” means the vote, at an annual or special meeting of shareholders, duly called, (a) of 67% or more of the Shares present at such meeting, if the holders of more than 50% of the outstanding Shares are present or represented by proxy; or (b) of more than 50% of the outstanding Shares, whichever is less. The Company may not:
•Borrow money, except to the extent permitted by the 1940 Act (which currently limits borrowing to no more than 33 1/3% of the value of the Company’s total assets, including the value of the assets purchased with the proceeds of its indebtedness, if any). The Company may borrow for investment purposes, for temporary liquidity, or to finance repurchases of its shares.
•Issue senior securities, except to the extent permitted by Section 18 of the 1940 Act (which currently limits the issuance of a class of senior securities that is indebtedness to no more than 33 1/3% of the value of the Company’s total assets or, if the class of senior security is stock, to no more than 50% of the value of the Company’s total assets).
•Underwrite securities of other issuers, except insofar as the Company may be deemed an underwriter under the Securities Act in connection with the disposition of its portfolio securities. The Company may invest in restricted securities (those that must be registered under the Securities Act before they may be offered or sold to the public).
•Invest 25% or more of the market value of the Company’s total assets in the securities of companies or entities engaged in any one industry or group of industries. This limitation does not apply to investments in the securities of the U.S. Government, its agencies or instrumentalities.
•Purchase or sell commodities, unless acquired as a result of ownership of securities or other investments, except that the Company may purchase and sell forward and futures contracts and options to the full extent permitted under the 1940 Act, sell foreign currency contracts in accordance with any rules of the Commodity Futures Trading Commission, invest in securities or other instruments backed by or linked to commodities, and invest in companies that are engaged in a commodities business or have a significant portion of their assets in commodities, and may invest in commodity pools and other entities that purchase and sell commodities and commodity contracts.
•Make loans to others, except (a) where each loan is represented by a note executed by the borrower, (b) through the purchase of debt securities in accordance with its investment objectives and policies, and (c) to the extent the entry into a repurchase agreement, in a manner consistent with the Company’s investment policies or as otherwise permitted under the 1940 Act, is deemed to be a loan.
•Purchase or sell real estate or interests in real estate in amounts that would impact the Company’s ability to qualify as an “investment company” under the 1940 Act. This limitation is not applicable to investments in marketable securities that are secured by or represent interests in real estate. This limitation does not preclude the Company from investing in securities that are secured by or represent interests in real estate (e.g. mortgage loans evidenced by notes or other writings defined to be a type of security), mortgage-related securities or investing in companies engaged in the real estate business or that have a significant portion of their assets in real estate (including real estate investment trusts).
If a restriction on the Company’s investments is adhered to at the time an investment is made, a subsequent change in the percentage of Company assets invested in certain securities or other instruments, or change in average duration of the Company’s investment portfolio, resulting from changes in the value of the Company’s total assets, will not be considered a violation of the restriction; provided, however, that the asset coverage requirement applicable to borrowings shall be maintained in the manner contemplated by applicable law.
Non-Fundamental Policies
As noted in the Company’s fundamental policy above, the Company will not invest 25% or more of the market value of the Company’s total assets in the securities of companies or entities engaged in any one industry or group of industries. The Company will determine industries or groups of industries by reference to the S&P Global industry classification as it may be amended from time to time.
Principal Risks
Valuation Risk
We have invested, and plan to continue to invest, primarily in illiquid debt and equity securities of private companies. Most of our investments do not have a readily available market price, and we value these investments at fair value as determined in good faith by the Investment Adviser, as Valuation Designee, in accordance with our valuation policy subject to the oversight of the Board, based on, among other things, the input of independent third-party valuation firms engaged at the direction of the Valuation Designee, and in accordance with our valuation policy. There is no single standard for determining fair value. As a result, determining fair value requires that judgment be applied to the specific facts and circumstances of each portfolio investment while employing a consistently applied valuation process for the types of investments we make. If we were required to liquidate a portfolio investment in a forced or liquidation sale, we may realize amounts that are different from the amounts presented and such differences could be material.
Interest Rate Risk
We are subject to interest rate risk. Interest rate risk is defined as the sensitivity of our current and future earnings to interest rate volatility, variability of spread relationships, the difference in re-pricing internals between our assets and liabilities and the effect that interest rates may have on our cash flows. Because we fund a portion of our investments with borrowings, our net investment income is affected by the difference between the rate at which we invest and the rate at which we borrow. Our net investment income is also affected by fluctuations in various interest rates, including the replacement of LIBOR with alternate rates and prime rates, to the extent our debt investments include floating interest rates. As a result, there can be no assurance that a significant change in market interest rates will not have a material adverse effect on our net investment income.
The Federal Reserve held interest rates steady in the first and second quarters of 2025, following three consecutive rate reductions in the third and fourth quarter of 2024. The Federal Reserve has indicated that there may be additional rate cuts in the future; however, future reductions to benchmark rates are not certain. Additionally, there can be no assurance that the Federal Reserve will not make upward adjustments to the federal funds rate in the future. In a high interest rate environment, our cost of funds would increase, which could reduce our net investment income if there is not a corresponding increase in interest income generated by our investment portfolio. It is possible that the Federal Reserve's tightening cycle could result the United States into a recession, which would likely decrease interest rates. A prolonged reduction in interest rates will reduce our gross investment income and could result in a decrease in our net investment income if such decreases in base rates, such as SOFR or other alternate rates, are not offset by corresponding increases in the spread over such base rate that we earn on any portfolio investments, a decrease in our operating expenses, or a decrease in the interest rate associated with our borrowings.
As of June 30, 2025 on a fair value basis, 100.00% of our debt investments bear interest at a floating rate. As of June 30, 2025, 98.61% of our floating rate debt investments are subject to interest rate floors. Additionally our Subscription Facility and ABL bear interest at SOFR plus 2.15% per annum and Daily SOFR plus 1.95% per annum, respectively.
The following table estimates the potential changes in net cash flow generated from interest income and expenses, should interest rates increase by 100, 200 or 300 basis points, or decrease by 100, 200 or 300 basis points. Interest income is calculated as revenue from interest generated from our portfolio of investments held on June 30, 2025. Interest expense is calculated based on the terms of the Subscription Facility and ABL Facility, using the outstanding balance as of June 30, 2025. Interest expense on the Subscription Facility and ABL Facility is calculated using the interest rate as of June 30, 2025, adjusted for the impact of hypothetical changes in rates, as shown below. The base interest rate case assumes the rates on our portfolio investments remain unchanged from the actual effective interest rates as of June 30, 2025.
Actual results could differ significantly from those estimated in the table (dollar amounts in thousands).
| | | | | | | | | | | | | | | | | |
| Changes in Interest Rate | Interest Income | | Interest Expense | | Net Income |
| -300 Basis Points | $ | (12,086) | | | $ | (3,741) | | | $ | (8,345) | |
| -200 Basis Points | $ | (8,058) | | | $ | (2,494) | | | $ | (5,564) | |
| -100 Basis Points | $ | (4,029) | | | $ | (1,247) | | | $ | (2,782) | |
| | | | | |
| +100 Basis Points | $ | 4,029 | | | $ | 1,247 | | | $ | 2,782 | |
| +200 Basis Points | $ | 8,058 | | | $ | 2,494 | | | $ | 5,564 | |
| +300 Basis Points | $ | 12,086 | | | $ | 3,741 | | | $ | 8,345 | |
Risks Related to the General Economy
Our portfolio companies are susceptible to a wide range of risks depending on general economic conditions or related factors, including but not limited to the levels of economic activity, inflation or interest rates, which may affect a portfolio company's ability to service its debt obligations to us. Therefore, any non-performing assets are likely to increase and the value of our portfolio is likely to decrease during these periods. Adverse economic conditions may decrease the value of collateral securing some of our loans and the value of our equity investments and could lead to financial losses in our portfolio and a corresponding decrease in revenues, net income and assets.
Unfavorable economic conditions also could increase our funding costs, limit our access to the capital markets or result in a decision by lenders not to extend credit to us. These events could prevent us from increasing our investments and harm our operating results.
A portfolio company’s failure to satisfy financial or operating covenants imposed by us or other lenders could lead to defaults and, potentially, acceleration of its loans and foreclosure on its assets, which could trigger cross-defaults under other agreements and jeopardize our portfolio company’s ability to meet its obligations under the debt securities that we hold. We may incur expenses to the extent necessary to seek recovery upon default or to negotiate new terms with a defaulting portfolio company. It is possible that we could become subject to a lender liability claim, including as a result of actions taken if we or Churchill renders significant managerial assistance to the borrower. Furthermore, if one of our portfolio companies were to file for bankruptcy protection, even though we may have structured our investment as senior secured debt, depending on the facts and circumstances, including the extent to which we or Churchill provided managerial assistance to that portfolio company or otherwise exercise control over it, a bankruptcy court might re-characterize our debt as a form of equity and subordinate all or a portion of our claim to claims of other creditors.
Tax Information
For tax purposes, distributions to shareholders during the six months ended June 30, 2025 were approximately $26.8 million.
Changes in and Disagreements with Accountants on Accounting and Financial Disclosure
The Company did not have any changes in or disagreements with PricewaterhouseCoopers LLP on accounting and financial disclosure during the six months ended June 30, 2025.
Privacy Policy
We are committed to protecting your privacy. This privacy notice, which is required by federal law, explains privacy policies of NC SLF Inc. and its affiliated companies. This notice supersedes any other privacy notice you may have received from NC SLF Inc., and its terms apply both to our current shareholders and to former shareholders as well.
In order to provide investors with individualized service, the Company collects certain nonpublic personal information about potential and current investors from information they provide on their subscription agreement or other forms (such as their address and social security number), as well as information about their account transactions with the Company (such as purchases of shares and account balances). The Company may also collect such information through account inquiries by mail, email, telephone, or web site.
The Company does not disclose any nonpublic personal information about potential investors or shareholders to anyone, except as permitted by law. Specifically, so that the Company, the Investment Adviser and their affiliates may continue to offer services that best meet potential investors’ or shareholders’ investing needs, the Company may disclose the information it collects, as described above, to companies that perform administrative or marketing services on behalf of the Company, such as transfer agents, or printers and mailers that assist the Company in the distribution of investor materials. These companies will use this information only for the services for which they have been hired, and are not permitted to use or share this information for any other purpose.
The Company will continue to adhere to the privacy policies and practices described in this notice if you no longer hold shares of the Company.
The Company and the Investment Adviser maintain internal security procedures to restrict access to personal and account information to those officers and employees who need to know that information to service investors’ account. The Company maintains physical, electronic and procedural safeguards to protect nonpublic personal information.
Item 2. Code of Ethics.
The information required by this item is not required in a semi-annual report on Form N-CSR.
Item 3. Audit Committee Financial Expert.
The information required by this item is not required in a semi-annual report on Form N-CSR.
Item 4. Principal Accountant Fees and Services.
The information required by this item is not required in a semi-annual report on Form N-CSR.
Item 5. Audit Committee of Listed Registrants.
The information required by this item is not required in a semi-annual report on Form N-CSR.
Item 6. Investments.
a.Please see the schedule of investments contained in the Report to Shareholders included under Item 1 of this semi-annual report on Form N-CSR.
b. Not applicable due to no such divestments during the semi-annual period covered since the previous Form N-CSR filing.
Item 7. Financial Statements and Financial Highlights for Open-End Investment Companies.
Not applicable for closed-end investment companies.
Item 8. Changes in and Disagreements with Accountants for Open-End Investment Companies.
Not applicable for closed-end investment companies.
Item 9. Proxy Disclosure for Open-End Investment Companies.
Not applicable for closed-end investment companies.
Item 10. Remuneration Paid to Directors, Officers, and Others of Open-End Investment Companies.
Not applicable for closed-end investment companies.
Item 11. Statement Regarding Basis for Approval of Investment Advisory Contract.
See item 1(a).
Item 12. Disclosure of Proxy Voting Policies and Procedures for Closed-End Management Investment Companies.
The information required by this item is not required in a semi-annual report on Form N-CSR.
Item 13. Portfolio Managers of Closed-End Management Investment Companies.
a.The information required by this item is not required in a semi-annual report on Form N-CSR.
b.There has been no change, as of the date of the filing of this semi-annual report on Form N-CSR, to any of the portfolio managers identified in response to paragraph (a)(1) of this item in the Company’s most recent annual report on Form N-CSR.
Item 14. Purchases of Equity Securities by Closed-End Management Investment Company and Affiliated Purchasers.
None.
Item 15. Submission of Matters to a Vote of Security Holders.
The Company has not made any material changes to the procedures by which shareholders may recommend nominees to the registrant’s Board.
Item 16. Controls and Procedures.
(a) The Registrant’s Chief Executive Officer and Chief Financial Officer have reviewed the Registrant's disclosure controls and procedures (as defined in Rule 30a-3(c) under the Investment Company Act of 1940 (the “Act”)) as of a date within 90 days of the filing of this report, as required by Rule 30a-3(b) under the Act and Rules 13a-15(b) or 15d‑15(b) under the Securities Exchange Act of 1934, as amended. Based on their review, such officers have concluded that the disclosure controls and procedures are effective in ensuring that information required to be disclosed in this report is appropriately recorded, processed, summarized and reported and made known to them by others within the Registrant and by the Registrant’s service provider.
(b) There were no changes in the Registrant's internal control over financial reporting (as defined in Rule 30a-3(d) under the Act) that occurred during the period covered by this report that have materially affected, or are reasonably likely to materially affect, the Registrant's internal control over financial reporting.
Item 17. Disclosure of Securities Lending Activities for Closed-End Management Investment Companies.
The registrant did not engage in securities lending activities during the period reported on this semi-annual report on this Form N-CSR.
Item 18. Recovery of Erroneously Awarded Compensation.
a.Not applicable.
b.Not applicable.
Item 19. Exhibits.
(a)(1) Not applicable.
(2) Not applicable.
(4) Not applicable
(5) There was no change in the registrant’s independent public accountant for the period covered by this report.
* Filed herewith
SIGNATURES
Pursuant to the requirements of the Securities Exchange Act of 1934 and the Investment Company Act of 1940, the registrant has duly caused this report to be signed on its behalf by the undersigned, thereunto duly authorized.
| | | | | | | | |
| NC SLF Inc. |
| | |
| By: | /s/ Kenneth Kencel |
| | Name: Kenneth Kencel |
| | Title: President and Chief Executive Officer |
Date: August 11, 2025
Pursuant to the requirements of the Securities Exchange Act of 1934 and the Investment Company Act of 1940, this report has been signed below by the following persons on behalf of the registrant and in the capacities and on the dates indicated.
| | | | | | | | |
| By: | /s/ Kenneth Kencel |
| | Name: Kenneth Kencel |
| | Title: President and Chief Executive Officer |
| | | | | | | | |
| By: | /s/ Shai Vichness |
| | Name: Shai Vichness |
| | Title: Chief Financial Officer and Treasurer |
Date: August 11, 2025