Please wait
Management’s Discussion & Analysis
For the years ended October 31, 2025 and 2024
(Stated in thousands of Canadian dollars, except share and per share amounts)
| | | | | |
| High Tide Inc. |
| Management's Discussion and Analysis |
| For the years ended October 31, 2025 and 2024 |
| (In thousands of Canadian dollars, except share and per share amounts or otherwise stated) |
Established consumer brands of High Tide Inc.
| | | | | |
| High Tide Inc. |
| Management's Discussion and Analysis |
| For the years ended October 31, 2025 and 2024 |
| (In thousands of Canadian dollars, except share and per share amounts or otherwise stated) |
About this MD&A:
This management’s discussion and analysis (this “MD&A”) of High Tide Inc. (“High Tide”, “we”, “our” or the “Company”) for the years ended October 31, 2025 and 2024 is dated January 29, 2026. The financial information presented in this MD&A has been derived from the Consolidated Financial Statements which were prepared in accordance with International Financial Reporting Standards (“IFRS”) as issued by the International Accounting Standards Board (“IASB”). The Company’s continuous disclosure materials, including interim filings, audited annual consolidated financial statements, annual information form and annual report on Form 40-F can be found on SEDAR+ at www.sedarplus.ca, with the Company’s filings with the SEC at www.sec.gov/edgar.
This MD&A also refers to the Company’s three reportable operating segments: (i) the “bricks-and-mortar” segment, which includes the Company’s Canadian bricks-and-mortar locations, inclusive of the Canadian warehouse which supports the distribution of consumption accessories and related items to the Canadian stores; (ii) the “e-commerce” segment, which includes the Company’s U.S. and international subsidiaries, inclusive of the U.S. warehouse which supports the distribution of consumption accessories and related items to the U.S. and international subsidiaries; and (iii) the “medical cannabis distribution” segment, which includes the medical cannabis distribution operations acquired as part of the Company’s acquisition of Remexian.
The Company’s shares are listed on the Nasdaq Capital Market (“Nasdaq”) under the symbol “HITI”, the TSX Venture Exchange (“TSXV”) under the symbol “HITI”, and on the Frankfurt Stock Exchange (“FSE”) under the securities identification code ‘WKN: A2PBPS’ and the ticker symbol “2LYA”. The address of the Company’s corporate and registered office is # 112 – 11127 15 Street NE, Calgary, Alberta Canada T3K 2M4. High Tide does not engage in any U.S. cannabis-related activities as defined by the Canadian Securities Administrators Staff Notice 51-352.
Company overview:
Founded in 2009, High Tide through its subsidiary Canna Cabana is one of the largest cannabis retail chain in Canada. As of October 31, 2025, the Company operates 211 branded retail cannabis stores across Canada represented by 89 locations in Alberta, 89 locations in Ontario, 13 locations in Saskatchewan, 8 locations in British Columbia, and 12 locations in Manitoba. Included within the 211 stores, the Company has a 50% interest in a partnership that operates a branded retail Canna Cabana location in Sudbury, Ontario and two joint ventures that operate under the Meta Cannabis Supply Co brand with a 49% interest that operate in Manitoba.
High Tide sells cannabis and consumption accessories in Canada through its innovative Canna Cabana discount club. The Company sells hemp-derived products and consumption accessories through its various e-commerce platforms: NuLeaf Naturals, FAB-CBD, Blessed CBD, Grasscity, Smoke Cartel, Daily High Club and DankStop. High Tide imports and distributes medical cannabis to pharmacies in Germany through its 51% owned subsidiary Remexian Pharma GmbH.
Company outlook:
Bricks-and-mortar
High Tide’s wholly owned subsidiary, Canna Cabana, is the largest cannabis retail chain in Canada with 218 current operating locations as of the date of this MD&A. Following the opening of 27 new stores in the calendar year, the Company successfully reached the upper end of its previously stated target of 20–30 new locations in calendar 2025. The Company anticipates that it will advance toward its long-term goal of surpassing 350 locations nationwide by opening another 20-30 locations in calendar 2026, mostly through organic growth, while also evaluating supplemental M&A opportunities of varying sizes.
The Company continues to expand its white label cannabis product portfolio between its flagship Queen of Bud and Cabana Cannabis Co. brands, reaching 32 cannabis SKUs at the end of the 2025 fiscal year across the Canna Cabana store network. The Company continues to work on exciting new offerings to increase its white label product portfolio. The Company also notes that its white label cannabis brands currently represent only 1% of its total bricks-and-mortar cannabis sales. The Company anticipates significant growth in its cannabis white label product portfolio and anticipates sales of its higher-margin white label brands growing to 20% over the long term.
| | | | | |
| High Tide Inc. |
| Management's Discussion and Analysis |
| For the years ended October 31, 2025 and 2024 |
| (In thousands of Canadian dollars, except share and per share amounts or otherwise stated) |
Cabana Club & ELITE
The Company’s Cabana Club and ELITE loyalty programs, which remain the largest such cannabis loyalty programs in the world, continue to expand at a rapid pace across Canada. Cabana Club membership has now surpassed 2.50 million members in Canada, which is up 45% in the past year. Over the long term the Company anticipates exceeding 3 million Cabana Club members in Canada. Globally, the Company has now surpassed 6.56 million Cabana Club members. ELITE, the paid membership tier, continues to break quarterly and annual growth records and now exceeds 151,000 members in Canada and 160,400 worldwide, with additional members being onboarded daily. ELITE members tend to shop more frequently and in larger quantities than base tier members.
E-commerce in the United States
Consistent with its prior disclosure, the Company has been evaluating various alternatives regarding its e-commerce division, which currently represents 2% of its consolidated revenue. Such alternatives include entertaining divestitures, partnerships, and maintaining paired down versions of the related websites until U.S. federal reform occurs. The Company has been in discussions over the past several months with various counterparties pursuing these alternatives. On December 18, 2025, U.S. President Donald Trump signed an Executive Order issued by the White House advancing the rescheduling of cannabis and announced that the Centers for Medicare & Medicaid Services is expected to launch a pilot program allowing seniors, who are Medicare beneficiaries, to receive CBD products at no cost up to US$500 per year. The Company is monitoring these new developments, with the view that they may represent a meaningful opportunity for its leading CBD businesses in the U.S., NuLeaf Naturals and FAB CBD. Accordingly, the Company has decided to put potential major transactions regarding this business segment on hold, until such time as the new framework for U.S. CBD is established and it can evaluate its prospects for growth.
Medical cannabis distribution in Germany
High Tide entered the German medical cannabis distribution market during the year ended October 31, 2025 following the acquisition of a majority interest in Remexian Pharma GmbH. The Company is actively assessing its working capital requirements to support its international growth, including the expansion of Remexian in 2026.
Free Cash Flow
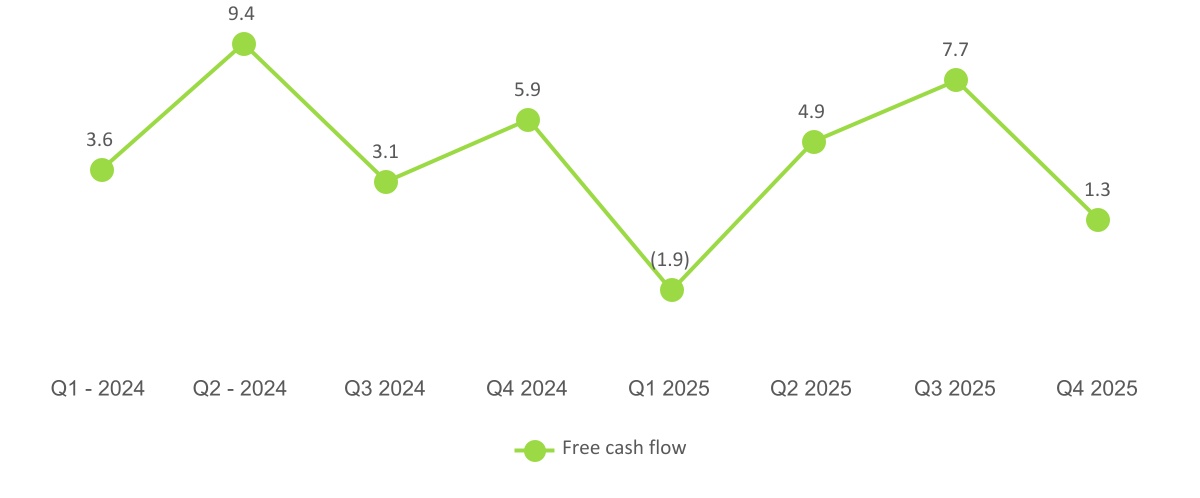
The Company also delivered on its previously stated objective of remaining free cash flow positive for the fiscal year, generating $12 million in fiscal 2025. The Company continues to gain strong traction in its strategic objective of procuring additional supply for Remexian and remains optimistic that sales will accelerate in the coming quarters, supported by continued momentum in the German medical cannabis market, and growing interest from other emerging international markets. The Company notes that there is a meaningful delay between paying deposits to suppliers, and when the Company receives cash from its customers in Germany. While the Company is still evaluating the potential working capital investments necessary to grow the Remexian business, it expects to remain free cash flow positive for the 2026 fiscal year.
| | | | | |
| High Tide Inc. |
| Management's Discussion and Analysis |
| For the years ended October 31, 2025 and 2024 |
| (In thousands of Canadian dollars, except share and per share amounts or otherwise stated) |
Selected financial highlights and operating performance
| | | | | | | | | | | | | | | | | | | | | | | | | | | | | | | | | | | | | | |
| | Three months ended October 31 | | Year Ended October 31 |
| | 2025 | | 2024 | | Change | | 2025 | | 2024 | | Change |
| | $ | | $ | | ∆ | | $ | | $ | | ∆ |
Free cash flow(i) | | 1,323 | | 5,908 | | (78)% | | 12,002 | | 21,991 | | (45) | % |
| Net cash provided by operating activities | | 4,278 | | 9,652 | | (56)% | | 23,866 | | 35,546 | | (33) | % |
| Revenue | | 164,031 | | 138,295 | | 19% | | 593,986 | | 522,306 | | 14 | % |
| Gross profit | | 42,528 | | 35,755 | | 19% | | 153,530 | | 142,502 | | 8 | % |
Gross profit margin(ii) | | 26% | | 26% | | —% | | 26% | | 27% | | (1) | % |
| Total expenses | | (61,714) | | (38,586) | | 60% | | (167,978) | | (137,499) | | 22 | % |
Total expenses excluding non-cash expenses(iii) | | (30,979) | | (27,510) | | 13% | | (116,187) | | (104,167) | | 11 | % |
Total expenses excluding non-cash expenses as a % of revenue(iv) | | 19% | | 20% | | (1)% | | 20% | | 20% | | — | % |
| (Loss) Income from operations | | (19,186) | | (2,831) | | 578% | | (14,448) | | 5,003 | | (389) | % |
Adjusted EBITDA(v) | | 12,414 | | 8,245 | | 51% | | 38,208 | | 38,335 | | — | % |
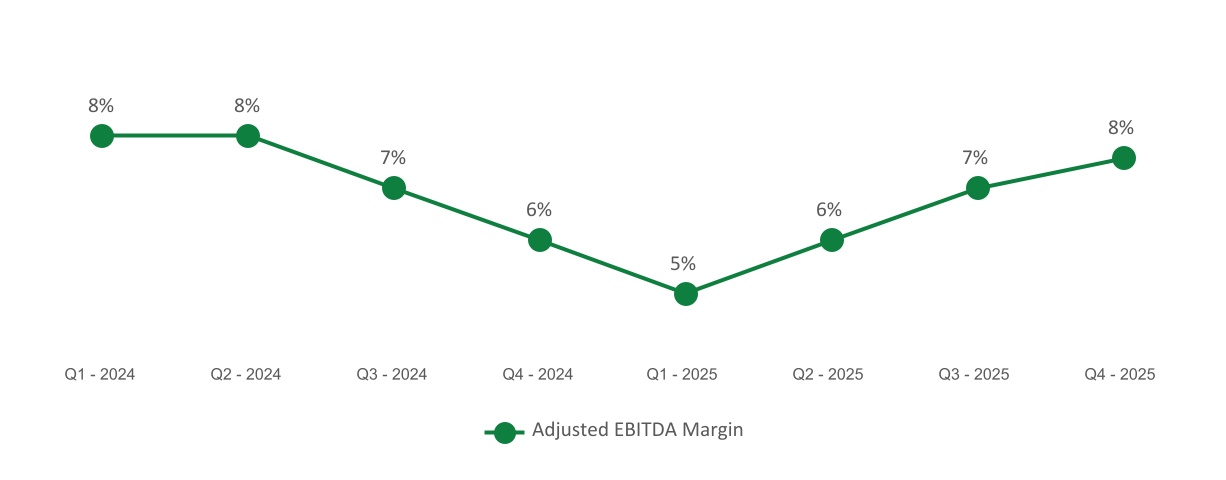
Adjusted EBITDA as a percentage of revenue(vi) | | 8% | | 6% | | 2% | | 6% | | 7% | | (1) | % |
| Net (loss) income | | (46,711) | | (4,802) | | 873% | | (51,404) | | (3,811) | | 1249 | % |
Adjusted net (loss) income before impairment & fair value change in derivative liability and excluding NCI(vii) | | 1,442 | | 186 | | 675% | | (3,623) | | (29) | | — | % |
Adjusted basic and diluted income (loss) per share(viii) | | 0.02 | | — | | —% | | (0.04) | | — | | —% |
(i)Free cash flow is a non-IFRS financial measure prepared based on the calculation mentioned in “Select financial highlights and operating performance".
(ii)Gross profit margin - a non-IFRS financial measure. Gross profit margin is calculated by dividing gross profit by revenue.
(iii)Total expenses excluding non-cash expenses - a non-IFRS financial measure. This metric is calculated as total expenses excluding impairment, depreciation, amortization and share based compensation.
(iv)Total expenses excluding non-cash expenses as a % of revenue - a non-IFRS financial measure. This metric is calculated as total expenses excluding impairment, depreciation, amortization and share based compensation divided by revenue.
(v)Adjusted EBITDA - a non-IFRS financial measure. A reconciliation of the Adjusted EBITDA to Net income (loss) is found under “Select financial highlights and operating performance" section.
(vi)Adjusted EBITDA as a percentage of revenue - a non-IFRS financial measure. This metric is calculated as adjusted EBITDA divided by revenue.
(vii)Adjusted net (loss) income before impairment and fair value change in derivative liability is a non-IFRS financial measure which is calculated by subtracting impairment and fair value change in derivative liability from net (loss) income.
(viii)Adjusted basic and diluted income (loss) per share is a non-IFRS financial measure and calculated as adjusted net (loss) income before impairment & fair value change in derivative liability divided by weighted average number of common shares.
The key factors affecting the results of the year ended October 31, 2025, were:
•Free cash flow – Free cash flow decreased by $9,989 year over year, primarily driven by higher transaction & acquisition costs and changes in working capital from organic growth.
•Revenue – Revenue increased $71,680 year over year. Bricks-and-mortar, which made up 95% of total revenue, contributed $17,420 in same store sales growth, $52,321 in growth from new store sales, and an $11,131 increase in data analytics, advertising, and other revenue. The new medical cannabis distribution segment contributed two months of revenue totaling $9,810. E-commerce revenue declined by $19,002.
•Expenses – Total expenses excluding non-cash expenses as a percentage of revenue was 20% which was consistent with the prior year reflecting continued cost discipline.
•Adjusted EBITDA – Adjusted EBITDA decreased by 1% to 6% of revenue primarily driven by e-commerce segment performance. The Company’s core bricks-and-mortar business, which contributed 95% of revenue for the year ended October 31, 2025, delivered Adjusted EBITDA margin of 8% which was consistent with the prior year.
| | | | | |
| High Tide Inc. |
| Management's Discussion and Analysis |
| For the years ended October 31, 2025 and 2024 |
| (In thousands of Canadian dollars, except share and per share amounts or otherwise stated) |
Revenue
| | | | | | | | | | | | | | | | | | | | | | | | | | | | | | | | | | | | | | |
| | Three months ended October 31 | | Year Ended October 31 |
| | 2025 | | 2024 | | Change | | 2025 | | 2024 | | Change |
| | $ | | $ | | ∆ | | $ | | $ | | ∆ |
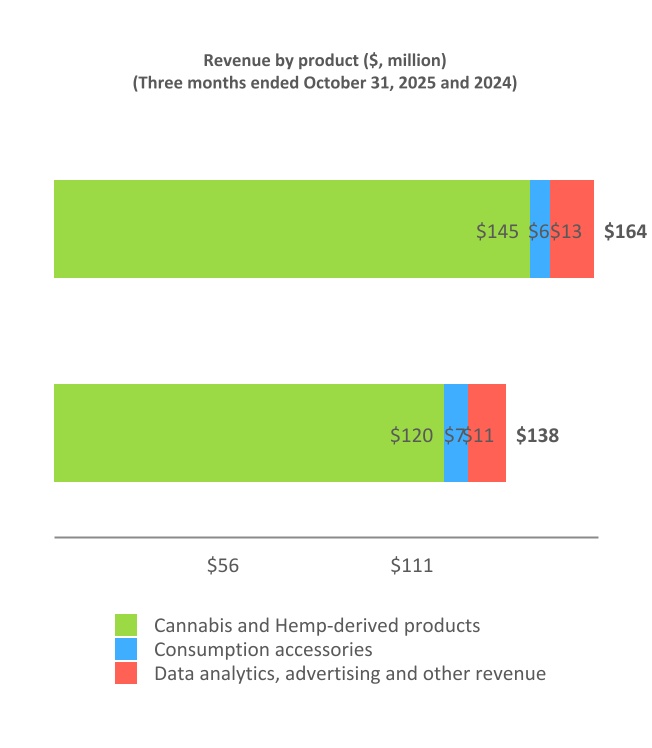
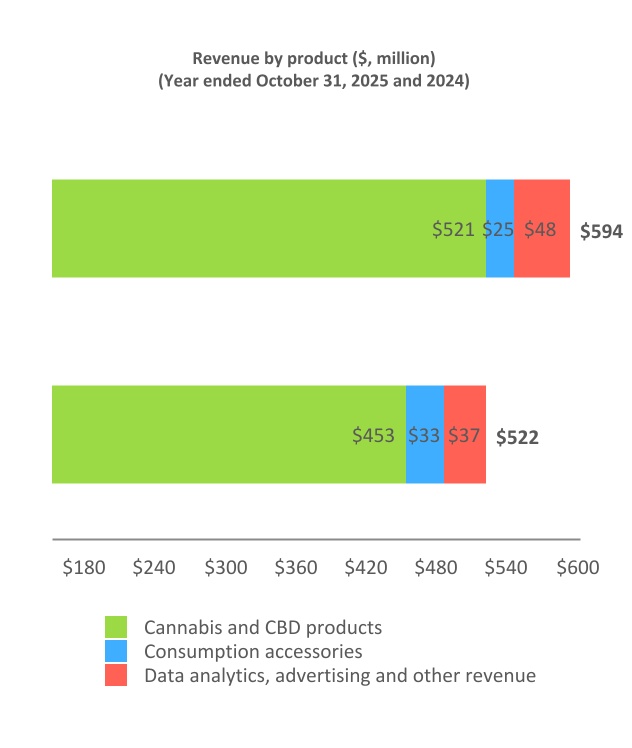
| Cannabis and Hemp-derived products | | 145,451 | | 120,259 | | 21% | | 521,084 | | 452,792 | | 15% |
| Consumption accessories | | 5,493 | | 7,128 | | (23)% | | 25,196 | | 32,801 | | (23)% |
| Data analytics, advertising and other revenue | | 13,087 | | 10,908 | | 20% | | 47,706 | | 36,713 | | 30% |
| | | | | | | | | | | | |
| Revenue | | 164,031 | | 138,295 | | 19% | | 593,986 | | 522,306 | | 14% |
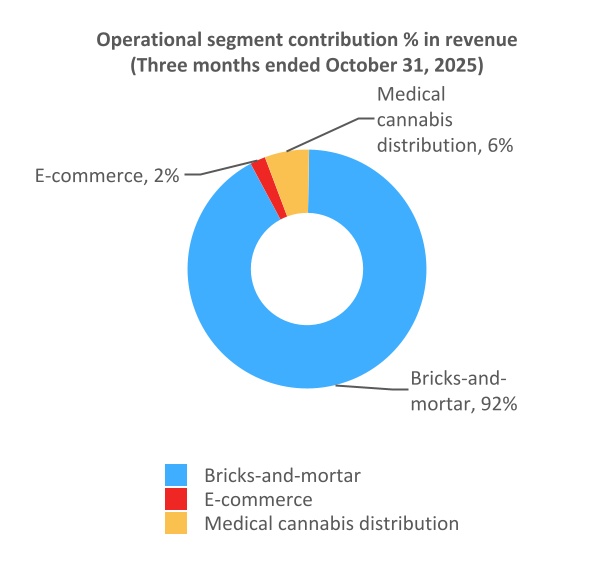
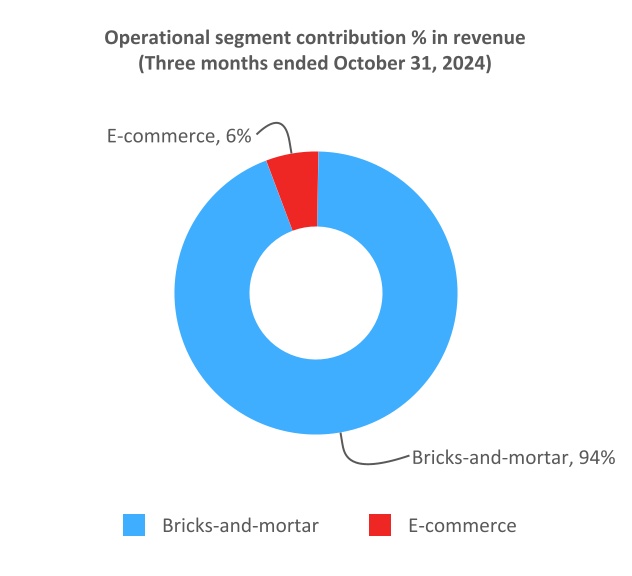
Revenue increased by 19% to $164,031 for the three months ended October 31, 2025 (October 31, 2024: $138,295) and increased by 14% to $593,986 for the year ended October 31, 2025 (October 31, 2024: $522,306). For the three months ended October 31, 2025 the bricks-and-mortar segment generated 92% of total revenue. For the year ended October 31, 2025 the bricks-and-mortar segment generated 95% of total revenue.
The 19% revenue increase of $25,736 for the three months ended October 31, 2025 is primarily driven by:
•$7,385 increase from organic same-store sales growth
•$10,840 increase from new store sales
•$1,972 increase from data analytics, advertising and other revenue
•$9,810 increase from two months of the new medical cannabis distribution segment
•$4,271 decrease from e-commerce
The 14% revenue increase of $71,680 for the year ended October 31, 2025 is primarily driven by:
•$17,420 increase from organic same-store sales growth
•$52,321 increase from new store sales
•$11,131 increase from data analytics, advertising and other revenue
•$9,810 increase from two months of the new medical cannabis distribution segment
•$19,002 decrease from e-commerce
Gross profit
| | | | | | | | | | | | | | | | | | | | | | | | | | | | | | | | | | | | | | |
| | Three months ended October 31 | | Year Ended October 31 |
| | 2025 | | 2024 | | Change | | 2025 | | 2024 | | Change |
| | $ | | $ | | ∆ | | $ | | $ | | ∆ |
| Revenue | | 164,031 | | 138,295 | | 19% | | 593,986 | | 522,306 | | 14% |
| Cost of sales | | (120,638) | | (102,540) | | 18% | | (439,591) | | (379,804) | | 16% |
| Inventory fair value | | (865) | | — | | | | (865) | | — | | |
| Gross profit | | 42,528 | | 35,755 | | 19% | | 153,530 | | 142,502 | | 8% |
Gross profit margin (i) | | 26% | | 26% | | —% | | 26% | | 27% | | (1)% |
(i) Gross profit margin is a non-IFRS financial measure. Gross profit margin is calculated by dividing gross profit by revenue.For the three months ended October 31, 2025, the gross profit margin was 26%, consistent with the prior-year period.
For the year ended October 31, 2025, the gross profit margin was 26%, down 1% from the prior year, primarily due to e-commerce segment performance.
| | | | | |
| High Tide Inc. |
| Management's Discussion and Analysis |
| For the years ended October 31, 2025 and 2024 |
| (In thousands of Canadian dollars, except share and per share amounts or otherwise stated) |
Total expenses | | | | | | | | | | | | | | | | | | | | | | | | | | | | | | | | | | | | | | |
| | Three months ended October 31 | | Year Ended October 31 |
| | 2025 | | 2024 | | Change | | 2025 | | 2024 | | Change |
| | $ | | $ | | ∆ | | $ | | $ | | ∆ |
| Salaries, wages and benefits | | 18,814 | | 17,083 | | 10% | | 72,159 | | 65,082 | | 11% |
| Share-based compensation | | 668 | | 750 | | (11)% | | 3,917 | | 2,975 | | 32% |
| General and administration | | 7,099 | | 5,856 | | 21% | | 26,053 | | 21,836 | | 19% |
| Professional fees | | 2,669 | | 1,919 | | 39% | | 8,469 | | 7,734 | | 10% |
| Advertising and promotion | | 651 | | 1,012 | | (36)% | | 3,185 | | 4,166 | | (24)% |
| Depreciation and amortization | | 6,503 | | 5,362 | | 21% | | 24,310 | | 25,393 | | (4)% |
| Impairment loss | | 23,564 | | 4,964 | | 375% | | 23,564 | | 4,964 | | 375% |
| Interest and bank charges | | 1,746 | | 1,640 | | 6% | | 6,321 | | 5,349 | | 18% |
| | | | | | | | | | | | |
| | | | | | | | | | | | |
| | | | | | | | | | | | |
| | | | | | | | | | | | |
| Total expenses | | 61,714 | | 38,586 | | 60% | | 167,978 | | 137,499 | | 22% |
| Total expenses as a % of revenue | | 38% | | 28% | | 10% | | 28% | | 26% | | 2% |
Total expenses excluding non-cash(i) | | 30,979 | | 27,510 | | 13% | | 116,187 | | 104,167 | | 12% |
Total expenses excluding non-cash as a % of revenue(ii) | | 19% | | 20% | | (1)% | | 20% | | 20% | | —% |
| | | | | | | | | | | | |
| | | | | | | | | | | | | | | | | | | | | | | | | | | | | | | | | | | | | | |
| | Three months ended October 31 | | Year Ended October 31 |
| As a percentage of revenue | | 2025 | | 2024 | | Change | | 2025 | | 2024 | | Change |
| | | | | | ∆ | | | | | | ∆ |
| Salaries, wages and benefits | | 11.5% | | 12.4% | | (0.9)% | | 12.1% | | 12.5% | | (0.4)% |
| Share-based compensation | | 0.4% | | 0.5% | | (0.1)% | | 0.7% | | 0.6% | | 0.1% |
| General and administration | | 4.3% | | 4.2% | | 0.1% | | 4.4% | | 4.2% | | 0.2% |
| Professional fees | | 1.6% | | 1.4% | | 0.2% | | 1.4% | | 1.5% | | (0.1)% |
| Advertising and promotion | | 0.4% | | 0.7% | | (0.3)% | | 0.5% | | 0.8% | | (0.3)% |
| Depreciation and amortization | | 4.0% | | 3.9% | | 0.1% | | 4.1% | | 4.9% | | (0.8)% |
| Impairment loss | | 14.4% | | 3.6% | | 10.8% | | 4.0% | | 1.0% | | 3.0% |
| Interest and bank charges | | 1.1% | | 1.2% | | (0.1)% | | 1.1% | | 1.0% | | 0.1% |
| | | | | | | | | | | | |
| | | | | | | | | | | | |
| | | | | | | | | | | | |
| | | | | | | | | | | | |
| | | | | | | | | | | | |
| Total expenses as a % of revenue | | 37.7% | | 27.9% | | 9.8% | | 28.3% | | 26.5% | | 1.8% |
Total expenses excluding non-cash as a % of revenue(i) | | 18.9% | | 19.9% | | (1.0)% | | 19.5% | | 20.0% | | (0.5)% |
| | | | | | | | | | | | |
| | | | | | | | | | | | |
| | | | | | | | | | | | |
| | | | | | | | | | | | |
(i)Total expense excluding non-cash - a non-IFRS financial measure and is calculated by dividing total expenses excluding depreciation, amortization, impairment and share based compensation by revenue.
(ii)Total expense excluding non-cash as a % of revenue - a non-IFRS financial measure and is calculated by dividing total expenses excluding non-cash by revenue.
Salaries, wages, and benefits as a percentage of revenue decreased by 0.9% and 0.4% for the three months and year ended October 31, 2025, respectively, reflecting strategic workforce management while ramping up stores.
Total expenses excluding non-cash expenses as a percentage of revenue decreased by 1% for the three months ended October 31, 2025 reflecting continued cost discipline. Total expenses excluding non-cash expenses as a percentage of revenue remained consistent for the year ended October 31, 2025 compared to the prior period.
| | | | | |
| High Tide Inc. |
| Management's Discussion and Analysis |
| For the years ended October 31, 2025 and 2024 |
| (In thousands of Canadian dollars, except share and per share amounts or otherwise stated) |
EBITDA and Adjusted EBITDA
The Company defines EBITDA and Adjusted EBITDA as per the table below. It should be noted that these performance measures are not defined under IFRS and may not be comparable to similar measures used by other entities. The Company believes that these measures are useful financial metrics as they assist in determining the ability to generate cash from operations. Investors should be cautioned that EBITDA and Adjusted EBITDA should not be construed as an alternative to net earnings or cash flows as determined under IFRS. Management defines “Adjusted EBITDA” as the net (loss) income for the period, before income/deferred tax (recovery) expense, accretion and interest expense, depreciation and amortization, inventory fair value, foreign exchange loss (gain), transaction and acquisition costs, other (gain) loss, impairment loss, share-based compensation, loss (gain) on revaluation of debentures, loss (gain) on fair value change in derivative liability, and loss (gain) on extinguishment of financial liability.
The reconciling items between net (loss) income, EBITDA, and Adjusted EBITDA are as follows:
| | | | | | | | | | | | | | | | | | | | | | | | | | | | | | |
| 2025 | 2024 | | | |
| Q4 | Q3 | Q2 | Q1 | Q4 | Q3 | Q2 | Q1 | | | | |
| Net (loss) Income | (46,711) | | 832 | | (2,836) | | (2,689) | | (4,802) | | 825 | | 171 | | (5) | | | | | |
| Income/deferred tax recovery (expense) | (178) | | 69 | | 46 | | 38 | | (153) | | 671 | | (878) | | (233) | | | | | |
| Accretion and interest | 1,213 | | 1,795 | | 1,950 | | 2,101 | | 2,308 | | 1,681 | | 1,712 | | 1,743 | | | | | |
| Depreciation and amortization | 6,503 | | 6,080 | | 5,880 | | 5,847 | | 5,362 | | 5,678 | | 7,505 | | 6,848 | | | | | |
EBITDA(i) | (39,173) | | 8,776 | | 5,040 | | 5,297 | | 2,715 | | 8,855 | | 8,510 | | 8,353 | | | | | |
| Inventory fair value | 865 | | — | | — | | — | | — | | — | | — | | — | | | | | |
| Foreign exchange loss (gain) | 333 | | 120 | | 114 | | (13) | | 5 | | 19 | | (5) | | 5 | | | | | |
| Transaction and acquisition costs | 2,682 | | 881 | | 1,616 | | 630 | | 773 | | 12 | | 1,314 | | 515 | | | | | |
| | | | | | | | | | | | |
| Other (gain) loss | (41) | | (1) | | 42 | | - | | (874) | | 6 | | 337 | | 77 | | | | | |
| Impairment loss | 23,564 | | — | | — | | — | | 4,964 | | — | | — | | — | | | | | |
| Share-based compensation | 668 | | 824 | | 1,250 | | 1,175 | | 750 | | 881 | | 549 | | 795 | | | | | |
| Loss (gain) on revaluation of debenture | — | | — | | — | | — | | — | | — | | (240) | | 755 | | | | | |
| Loss (gain) on fair value change in derivative liability | 23,516 | | 43 | | — | | — | | (88) | | (159) | | (110) | | (300) | | | | | |
| Loss (gain) on extinguishment of financial liability | — | | — | | — | | — | | — | | — | | (314) | | 235 | | | | | |
Adjusted EBITDA(i) | 12,414 | | 10,643 | | 8,062 | | 7,089 | | 8,245 | | 9,614 | | 10,041 | | 10,435 | | | | | |
(i) EBITDA and Adjusted EBITDA are non-IFRS financial measures.
| | | | | |
| High Tide Inc. |
| Management's Discussion and Analysis |
| For the years ended October 31, 2025 and 2024 |
| (In thousands of Canadian dollars, except share and per share amounts or otherwise stated) |
Free cash flow
The Company defines free cash flow as per the table below, which is calculated as net cash provided by operating activities, minus sustaining capex, minus lease liability payments. It should be noted that these performance measures are not defined under IFRS and may not be comparable to similar measures used by other entities. Sustaining Capex is defined as leasehold improvements and maintenance expenditure required in the existing business. The most directly comparable financial measure is net cash provided by operating activities, as disclosed in the consolidated statements of cash flows. It should not be viewed as a measure of liquidity or a substitute for comparable metrics prepared in accordance with IFRS.
| | | | | | | | | | | | | | | | | | | | | | | | | | | | | | | | | | | | | | | | | | | | | | | | | | |
| | 2025 | | 2024 |
| | Q4 | | Q3 | | Q2 | | Q1 | | Q4 | | Q3 | | Q2 | | Q1 |
| Cash flow from operating activities | | 6,599 | | | 8,231 | | | 4,686 | | | 4,644 | | | 6,179 | | | 8,928 | | | 8,032 | | | 9,363 | |
| Changes in non-cash working capital | | (2,321) | | | 2,419 | | | 3,569 | | | (3,961) | | | 3,473 | | | (2,715) | | | 4,777 | | | (2,490) | |
| Net cash provided by operating activities | | 4,278 | | | 10,650 | | | 8,255 | | | 683 | | | 9,652 | | | 6,213 | | | 12,809 | | | 6,873 | |
Sustaining capex(i) | | (345) | | | (460) | | | (692) | | | (361) | | | (533) | | | (279) | | | (528) | | | (511) | |
| Lease liability payments | | (2,610) | | | (2,508) | | | (2,667) | | | (2,222) | | | (3,211) | | | (2,842) | | | (2,898) | | | (2,754) | |
Free cash flow(ii) | | 1,323 | | | 7,682 | | | 4,896 | | | (1,900) | | | 5,908 | | | 3,092 | | | 9,383 | | | 3,608 | |
| | | | | | | | | | | | | | | | |
(i) Sustaining capex is a non-IFRS measure
(ii) Free cash flow is a non-IFRS measure
(iii) For the three months ended October 31, 2025, interest paid on right-of-use lease liabilities ($986) has been classified as a component of cash flow from operating activities within the consolidated financial statements in line with the entity's accounting policy. The three months ended October 31, 2024, include interest paid on right-of-use lease liabilities ($938) in cash used in financing activities. Periods prior to Q1 2025 have not been adjusted as the amounts are not material.
The Company achieved its stated goal of remaining cash flow positive for the year ended October 31, 2025 despite investing in working capital associated with new store openings.
Impairment loss
| | | | | | | | | | | | | | | | | | | | | | | | | | | | | | | | | | | |
| | Three months ended October 31 | Twelve months ended October 31 |
| | 2025 | | 2024 | | Change | 2025 | | 2024 | | Change |
| | $ | | $ | | ∆ | $ | | $ | | ∆ |
| | | | | | | | | | | |
| E-commerce retail goodwill | | (14,807) | | | (3,467) | | | 327 | % | (14,807) | | | (3,467) | | | 327 | % |
| Indefinite life intangible assets | | (7,656) | | | (1,497) | | | 411 | % | (7,656) | | | (1,497) | | | 411 | % |
| Finite life intangible assets | | (1,101) | | | — | | | — | % | (1,101) | | | — | | | — | % |
| Total Impairment loss | | (23,564) | | | (4,964) | | | 375 | % | (23,564) | | | (4,964) | | | 375 | % |
Management performed impairment testing of goodwill and intangible assets for the bricks-and-mortar and e-commerce cash-generating units (“CGUs”) as at August 1, 2025, consistent with prior years. The medical cannabis distribution business, acquired during the year ended October 31, 2025, was tested for impairment as at October 31, 2025.
CGU - Bricks-and-mortar
The bricks-and-mortar CGU comprises the Company’s Canadian retail cannabis locations. As at October 31, 2025, total goodwill allocated to this CGU amounted to $58,641 (October 31, 2024: $58,641).
The recoverable amount of the bricks-and-mortar CGU was determined using a fair value less costs of disposal (“FVLCD”) model. The fair value calculation requires level 3 inputs including forecasted future cashflows of the Company’s cash generating unit over a five-year period, growth rate assumptions, and terminal growth rates. Revenue for the first forecast year was based on actual operating results and observable industry and market trends. Revenues for subsequent forecast years were assumed to grow at 2% per annum, with a terminal growth rate of 2% applied to cash flows beyond the forecast period. Cash flows were discounted using an after-tax discount rate of 14%, reflecting a market participant weighted average cost of capital.
| | | | | |
| High Tide Inc. |
| Management's Discussion and Analysis |
| For the years ended October 31, 2025 and 2024 |
| (In thousands of Canadian dollars, except share and per share amounts or otherwise stated) |
Management considers the most sensitive assumptions in the valuation to be the discount rate and forecast revenue growth, including the assumptions underlying gross margin and operating costs. A reasonably possible adverse change in these assumptions would not result in an impairment. A 1% increase in the discount rate to 15% would decrease the recoverable amount by approximately $17,404, while a 1% decrease in the forecast revenue growth rate to 1% would decrease the recoverable amount by approximately $16,955.
Based on the impairment test performed, the recoverable amount exceeded the carrying amount of the bricks-and-mortar CGU, and no impairment loss was recognized for the year ended October 31, 2025 (October 31, 2024: $nil).
CGU - E-commerce
The e-commerce CGU comprises the Company’s e-commerce subsidiaries. As at October 31, 2025, total goodwill allocated to this CGU amounted to nil (October 31, 2024: $14,732).
In prior years, the Company tested indefinite-life brand intangible assets within individual e-commerce entities for impairment and tested goodwill at the e-commerce segment level. During the year ended October 31, 2025, the Company implemented a discount e-commerce pricing strategy and launched a global loyalty platform, aligning the e-commerce business with the existing Cabana Club program in the Canadian bricks-and-mortar operations. In addition, e-commerce personnel and the information technology platform are shared across the portfolio of webstores. As a result, management now monitors performance on a combined basis and concludes that cash inflows are generated largely from the e-commerce operations as a whole. Accordingly, the Company identified the e-commerce operations as a single CGU for impairment testing purposes.
The recoverable amount of the e-commerce CGU was determined using a fair value less costs of disposal model. The fair value calculation requires level 3 inputs including forecasted future cashflows of the Company’s cash generating unit over a five-year period, growth rate assumptions, and terminal growth rates. Revenue growth assumptions for the forecast period were 5% in each year, reflecting the planned gradual recovery of the business. A terminal growth rate of 2% was applied to cash flows beyond the forecast period. Cash flows were discounted using an after-tax discount rate of 15%, reflecting a market-participant weighted average cost of capital.
As a result of the impairment test performed as at August 1, 2025, the recoverable amount of the e-commerce CGU was determined to be zero. This reflects the fact that the revenue and cash flow recovery that was expected to happen nine months after the Company implemented its discount/loyalty strategy in December 2024 did not materialize. Since the recoverable amount of the CGU was lower than its carrying amount, the Company recognized an impairment loss of $23,564 for the year ended October 31, 2025 (October 31, 2024: $4,964).
The impairment loss was allocated first to goodwill, resulting in a goodwill impairment of $14,807 (October 31, 2024: $3,467). The remaining impairment was allocated on a pro-rata basis to the other assets of the CGU, resulting in an impairment of $7,657 to indefinite-life brand intangible assets (October 31, 2024: $1,497) and $1,101 to finite-life software assets (October 31, 2024: nil). Following recognition of the impairment, all goodwill and intangible assets within the e-commerce CGU were reduced to nil as at October 31, 2025.
Management considers the most sensitive assumptions in the valuation to be the discount rate and forecast revenue growth, including the assumptions underlying gross margin and operating costs. As goodwill and intangible assets of the e-commerce CGU were fully impaired as at October 31, 2025, a reasonably possible adverse change in these assumptions would not result in a material additional impairment.
CGU - Medical cannabis distribution
The medical cannabis distribution CGU comprises Remexian. As at October 31, 2025, goodwill allocated to this CGU totaled $31,479 (October 31, 2024: nil).
The recoverable amount of the medical cannabis distribution CGU was determined using a value-in-use (“VIU”) model. The value in use calculation requires level 3 inputs including five-year cash flow projections derived from historical performance, financial forecasts, and growth expectations. Revenue growth assumptions for the forecast period were 1% in the first year, 22% in the second year, 9% in the third year, 7% in the fourth year, and 3% in the fifth year. A terminal growth rate of 3% was applied to cash flows beyond the forecast period. Cash flows were discounted using an after-tax discount rate of 16%, reflecting a market participant weighted average cost of capital.
| | | | | |
| High Tide Inc. |
| Management's Discussion and Analysis |
| For the years ended October 31, 2025 and 2024 |
| (In thousands of Canadian dollars, except share and per share amounts or otherwise stated) |
Management considers the most sensitive assumptions in the valuation to be the discount rate and forecast revenue growth, including the assumptions underlying gross margin and operating costs. A reasonably possible adverse change in these assumptions would not result in an impairment. A 5% increase in the discount rate to 20.5% would decrease the recoverable amount by approximately $41,334, while a 5% decrease in forecast revenue growth rates would decrease the recoverable amount by approximately $38,291.
Based on the impairment test performed, the recoverable amount exceeded the carrying amount of the medical cannabis distribution CGU, and no impairment loss was recognized for the year ended October 31, 2025 (2024: nil).
Segmented operations:
During the year ended October 31, 2025, the Company updated its reporting segments to reflect its current operating structure following the acquisition of Remexian. The Company now reports the following three operating segments:
•Bricks-and-mortar, which include the Company’s Canadian and German bricks-and-mortar locations, inclusive of the Canadian warehouse which supports the distribution of consumption accessories and related items to the Canadian stores. In addition, corporate overhead has been allocated to this reporting segment.
•E-commerce, which include the Company’s U.S. and international e-commerce subsidiaries. In addition, corporate overhead has been allocated to this reporting segment.
•Medical cannabis distribution, which include the medical cannabis distribution activities acquired as part of the Remexian acquisition.
Corporate overhead is allocated to the bricks-and-mortar, medical cannabis distribution and e-commerce segments based on each segment’s percentage of revenue and number of months of results included in the consolidated financial statements in the current fiscal year.
These reporting segments have been identified because they are segments: (a) that engage in business activities from which revenues are earned and expenses are incurred; (b) whose operating results are regularly reviewed by the Company’s chief operating decision maker, identified as the Chief Executive Officer, to make decisions about the resources to be allocated to each segment and to assess performance; and (c) for which discrete financial information is available. In accordance with IFRS 8, the Company’s reporting segments are based on the similarity of goods and services provided and the economic characteristics exhibited by the operating segments.
The accounting policies used for segment reporting are consistent with those applied in the preparation of the Company’s annual audited consolidated financial statements. There have been no changes to the underlying data used to prepare the comparative reporting segments for the prior year.
| | | | | |
| High Tide Inc. |
| Management's Discussion and Analysis |
| For the years ended October 31, 2025 and 2024 |
| (In thousands of Canadian dollars, except share and per share amounts or otherwise stated) |
Performance by operational segment:
| | | | | |
| High Tide Inc. |
| Management's Discussion and Analysis |
| For the years ended October 31, 2025 and 2024 |
| (In thousands of Canadian dollars, except share and per share amounts or otherwise stated) |
| | | | | |
| High Tide Inc. |
| Management's Discussion and Analysis |
| For the years ended October 31, 2025 and 2024 |
| (In thousands of Canadian dollars, except share and per share amounts or otherwise stated) |
The following is a representation of these operational segments:
| | | | | | | | | | | | | | | | | | | | | | | | | | | | | | | | | | | | | | | | | | | | | | | |
| | | | | | | | | | | | | | | |
| | | | | | | | | | | | | | | |
| | | | | | | | | | | | | | | |
| | | | | | | | | | | | | | | |
| | | | | | | | | | | | | | | |
| | | | | | | | | | | | | | | |
| | | | | | | | | | | | | | | |
| | | | | | | | | | | | | | | |
| | | | | | | | | | | | | | | |
| | | | | | | | | | | | | | | |
| | Bricks-and-Mortar | | Bricks-and-Mortar | | E-commerce | | E-commerce | | Medical cannabis distribution | | | Total | | Total |
| For the three months ended October 31, | | 2025 | | 2024 | | 2025 | | 2024 | | 2025 | | | 2025 | | 2024 |
| | $ | | $ | | $ | | $ | | $ | | | $ | | $ |
| Revenue | | 150,719 | | 130,522 | | 3,502 | | 7,773 | | 9,810 | | | 164,031 | | 138,295 |
| Gross profit | | 41,266 | | 31,309 | | 874 | | 4,446 | | 388 | | | 42,528 | | 35,755 |
Gross profit margin(i) | | 27% | | 24% | | 25% | | 57% | | 4% | | | 26% | | 26% |
Adjusted gross profit margin(ii) | | 27% | | 24% | | 25% | | 57% | | 13% | | | 26% | | 26% |
| Income (loss) from operations | | 9,902 | | 5,446 | | (27,025) | | (8,277) | | (2,063) | | | (19,186) | | (2,831) |
Adjusted EBITDA(iii) | | 14,122 | — | 10,067 | | (1,690) | | (1,822) | | (18) | | | 12,414 | | 8,245 |
Adjusted EBITDA margin(iv) | | 9% | | 8% | | (48)% | | (23)% | | 0 | | | 8% | | 6% |
| | | | | | | | | | | | | | | | | | | | | | | | | | | | | | | | | | | | | | | | | | | | | | | |
| | | | | | | | | | | | | | | |
| | | | | | | | | | | | | | | |
| | | | | | | | | | | | | | | |
| | | | | | | | | | | | | | | |
| | | | | | | | | | | | | | | |
| | | | | | | | | | | | | | | |
| | | | | | | | | | | | | | | |
| | | | | | | | | | | | | | | |
| | | | | | | | | | | | | | | |
| | | | | | | | | | | | | | | |
| | Bricks-and-Mortar | | Bricks-and-Mortar | | E-commerce | | E-commerce | | Medical cannabis distribution | | | Total | | Total |
| For the year ended October 31, | | 2025 | | 2024 | | 2025 | | 2024 | | 2025 | | | 2025 | | 2024 |
| | $ | | $ | | $ | | $ | | $ | | | $ | | $ |
| Revenue | | 565,316 | | 484,444 | | 18,860 | | 37,862 | | 9,810 | | | 593,986 | | 522,306 |
| Gross profit | | 147,427 | | 124,651 | | 5,715 | | 17,851 | | 388 | | | 153,530 | | 142,502 |
Gross profit margin(i) | | 26% | | 26% | | 30% | | 47% | | 4% | | | 26% | | 27% |
| Adjusted gross profit margin | | 26% | | 26% | | 30% | | 47% | | 13% | | | 26% | | 27% |
| Income (loss) from operations | | 22,582 | | 12,180 | | (34,967) | | (7,177) | | (2,063) | | | (14,448) | | 5,003 |
Adjusted EBITDA(ii) | | 45,227 | | 36,618 | | (7,001) | | 1,717 | | (18) | | | 38,208 | | 38,335 |
Adjusted EBITDA margin(iii) | | 8% | | 8% | | (37)% | | 5% | | —% | | | 6% | | 7% |
| | | | | | | | | | | | | | | |
| | Bricks-and-Mortar | | Bricks-and-Mortar | | E-commerce | | E-commerce | | Medical cannabis distribution | | | Total | | Total |
| As at October 31, | | 2025 | | 2024 | | 2025 | | 2024 | | 2025 | | | 2025 | | 2024 |
| | $ | | $ | | $ | | $ | | $ | | | $ | | $ |
| Current assets | | 84,396 | | 75,161 | | 7,632 | | 10,628 | | 44,857 | | | 136,885 | | 85,789 |
| Non-current assets | | 143,861 | | 128,719 | | 2,765 | | 31,700 | | 65,551 | | | 212,177 | | 160,419 |
| Current liabilities | | 54,458 | | 56,741 | | 4,532 | | 4,739 | | 40,928 | | | 99,918 | | 61,480 |
| Non-current liabilities | | 131,594 | | 35,788 | | 4,504 | | 3,428 | | 10,258 | | | 146,356 | | 39,216 |
(i)Gross profit margin - a non-IFRS financial measure. Gross profit margin is calculated by dividing gross profit by revenue.
(ii)Adjusted gross profit margin - a non-IFRS measure. This metric is calculated as gross profit margin excluding non-cash inventory fair value related to Remexian inventory acquired.
(iii)Adjusted EBITDA - a non-IFRS financial measure. A reconciliation of the Adjusted EBITDA to Net loss is found under “Select financial highlights and operating performance".
(iv)Adjusted EBITDA margin - a non-IFRS financial measure. This metric is calculated as Adjusted EBITDA divided by revenue.
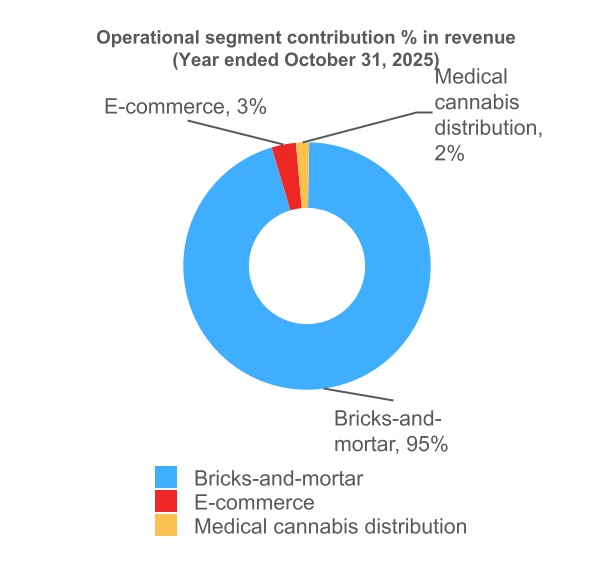
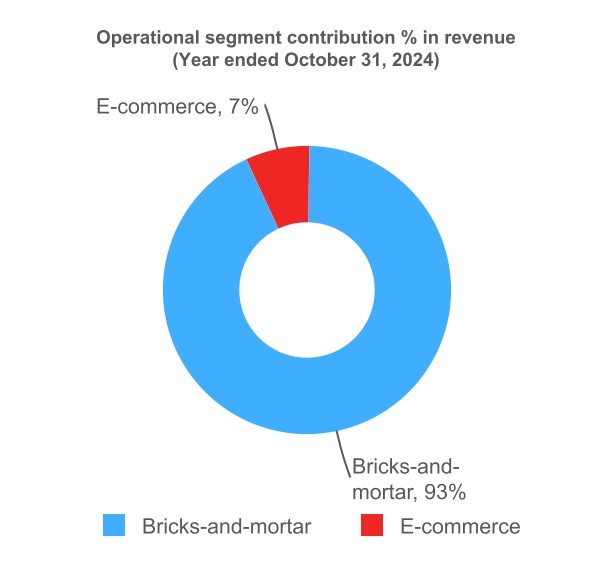
Corporate overhead is allocated to the bricks-and-mortar, medical cannabis distribution and e-commerce segments based on each segment’s percentage of revenue and number of months of results included in the consolidated financial statements in the current fiscal year. For the year ended October 31, 2025, allocations were 95% to bricks-and-mortar and 3% to e-commerce, and 2% to medical cannabis distribution (October 31, 2024 - 93% bricks-and-mortar, 7% e-commerce, and nil medical cannabis).
| | | | | |
| High Tide Inc. |
| Management's Discussion and Analysis |
| For the years ended October 31, 2025 and 2024 |
| (In thousands of Canadian dollars, except share and per share amounts or otherwise stated) |
Bricks-and-mortar performance
| | | | | | | | | | | | | | | | | | | | | | | | | | | | | | | | | | | |
| | Three months ended October 31 | Year months ended October 31 |
| | 2025 | | 2024 | | Change | 2025 | | 2024 | | Change |
| | $ | | $ | | ∆ | $ | | $ | | ∆ |
| Cannabis and Hemp-derived products | | 134,505 | | 116,313 | | 16% | 504,574 | | 435,642 | | 16% |
| Consumption accessories | | 3,416 | | 3,383 | | 1% | 13,573 | | 12,764 | | 6% |
| Data analytics, advertising and other revenue | | 12,798 | | 10,826 | | 18% | 47,169 | | 36,038 | | 31% |
| Revenue | | 150,719 | | 130,522 | | 15% | 565,316 | | 484,444 | | 17% |
| Cost of goods sold | | 109,453 | | 99,213 | | 10% | 417,889 | | 359,793 | | 16% |
| Gross profit | | 41,266 | | 31,309 | | 32% | 147,427 | | 124,651 | | 18% |
Gross profit margin(i) | | 27% | | 24% | | 3% | 26% | | 26% | | —% |
| Total expenses | | 31,365 | | 25,863 | | 21% | 124,846 | | 112,471 | | 11% |
| Income from operations | | 9,902 | | 5,446 | | 82% | 22,581 | | 12,180 | | 85% |
| Depreciation and amortization | | 3,568 | | 3,898 | | (9)% | 18,861 | | 21,664 | | (13)% |
| Share-based compensation | | 652 | | 723 | | (10)% | 3,785 | | 2,774 | | 36% |
Adjusted EBITDA(i) | | 14,122 | | 10,067 | | 40% | 45,227 | | 36,618 | | 24% |
Adjusted EBITDA margin(i) | | 9% | | 8% | | 1% | 8% | | 8% | | —% |
(i) Gross profit margin, Adjusted EBITDA and Adjusted EBITDA margin are non-IFRS measures
The revenue increase of 15% to $150,719 for the three months ended October 31, 2025 (October 31, 2024: $130,522) is driven by a $7,385 increase from organic same-store sales, a $10,840 increase from new store sales, and a $1,972 increase from data analytics, advertising and other revenue. The gross profit margin increase of 3% for the three months ended October 31, 2025 (October 31, 2024: 24%) reflects the strength of the Company's discount club model and disciplined execution. The adjusted EBITDA margin increase of 1% to 9% for the three months ended October 31, 2025 (October 31, 2024: 8%) reflects the resilience of the Company's prudent cost strategy while organically ramping up the segment.
The revenue increase of 17% to $565,316 for the year ended October 31, 2025 (October 31, 2024: $484,444) is driven by a $17,420 increase from organic same-store sales growth, a $52,321 increase from new store sales, and a $11,131 increase from data analytics, advertising and other revenue. Gross profit margin of 26% and Adjusted EBITDA margin of 8% for the year ended October 31, 2025 remained consistent with the prior year.
| | | | | |
| High Tide Inc. |
| Management's Discussion and Analysis |
| For the years ended October 31, 2025 and 2024 |
| (In thousands of Canadian dollars, except share and per share amounts or otherwise stated) |
E-commerce segment performance
| | | | | | | | | | | | | | | | | | | | | | | | | | | | | | | | | | | | | | |
| | Three months ended October 31 | | Year Ended October 31 |
| | 2025 | | 2024 | | Change | | 2025 | | 2024 | | Change |
| | $ | | $ | | ∆ | | $ | | $ | | ∆ |
| Cannabis and Hemp-derived products | | 1,236 | | 3,946 | | (69)% | | 6,800 | | 17,150 | | (60)% |
| Consumption accessories | | 2,077 | | 3,745 | | (45)% | | 11,623 | | 20,037 | | (42)% |
| Data analytics, advertising and other revenue | | 189 | | 82 | | 130% | | 437 | | 675 | | (35)% |
| Revenue | | 3,502 | | 7,773 | | (55)% | | 18,860 | | 37,862 | | (50)% |
| Cost of goods sold | | 2,628 | | 3,327 | | (21)% | | 13,145 | | 20,011 | | (34)% |
| Gross profit | | 874 | | 4,446 | | (80)% | | 5,715 | | 17,851 | | (68)% |
Gross profit margin(i) | | 25% | | 57% | | (32)% | | 30% | | 47% | | (17)% |
| Total expenses | | 27,898 | | 12,723 | | 119% | | 40,682 | | 25,028 | | 63% |
| Loss from operations | | (27,025) | | (8,277) | | 227% | | (34,967) | | (7,177) | | 387% |
| Adjusted loss from operations excluding impairment | | (3,461) | | (3,313) | | 4% | | (11,403) | | (2,213) | | 415% |
| Depreciation and amortization | | 1,768 | | 1,464 | | 21% | | 4,283 | | 3,729 | | 15% |
| Share-based compensation | | 3 | | 27 | | (89)% | | 119 | | 201 | | (41)% |
| Impairment | | 23,564 | | 4,964 | | 375% | | 23,564 | | 4,964 | | 375% |
Adjusted EBITDA(i) | | (1,690) | | (1,822) | | 7% | | (7,001) | | 1,717 | | (508)% |
Adjusted EBITDA margin(i) | | (48)% | | (23)% | | (25)% | | (37)% | | 5% | | (42)% |
(i) Gross profit margin, Adjusted EBITDA, Adjusted loss from operations excluding impairment and Adjusted EBITDA margin are non-IFRS measures.
The revenue decreases of 55% and 50% for the three months and the year ended October 31, 2025, respectively, are primarily driven by lower search volumes and increased competition in the hemp-derived products and consumption accessories categories. The Company is constantly monitoring the segment's performance and has been evaluating various strategic alternatives as discussed in the United States section of the Company Outlook.
| | | | | |
| High Tide Inc. |
| Management's Discussion and Analysis |
| For the years ended October 31, 2025 and 2024 |
| (In thousands of Canadian dollars, except share and per share amounts or otherwise stated) |
Medical cannabis distribution segment performance
| | | | | |
| |
| For the three months and the year ended October 31, 2025 |
| $ |
| Cannabis and Hemp-derived products | 9,710 |
| Consumption accessories | — |
| Data analytics, advertising and other revenue | 100 |
| Revenue | 9,810 |
| Cost of goods sold | 8,558 |
| Inventory fair value | 865 |
| Gross profit | 388 |
| Adjusted gross profit (i) | 1,253 |
| Adjusted gross profit margin(ii) | 13% |
| Total expenses | 2,449 |
| Loss from operations | (2,063) |
| Depreciation and amortization | 1,167 |
| Inventory fair value | 865 |
| Share-based compensation | 13 |
Adjusted EBITDA(iii) | (18) |
Adjusted EBITDA margin(iv) | —% |
(i) Adjusted gross profit is a non-IFRS financial measure. Adjusted gross profit is calculated by excluding inventory fair value from gross profit.
(ii) Adjusted gross profit margin is a non-IFRS financial measure. Adjusted gross profit margin is calculated by dividing adjusted gross profit by revenue.
(iii) Adjusted EBITDA is a non-IFRS financial measure. A reconciliation of the Adjusted EBITDA to Net income (loss) is found under “Select financial highlights and operating performance" section.
(iv) Adjusted EBITDA margin is a non-IFRS financial measure. This metric is calculated as adjusted EBITDA divided by revenue.
The year ended October 31, 2025 represents the initial period of operations for the segment following closing of the acquisition on September 2, 2025. As the segment did not operate in the prior year, the results for the year ended October 31, 2025 are not comparable to those of the year ended October 31, 2024.
For the three months and year ended October 31, 2025, the segment generated $9,810 in revenue, primarily from the sale of medical cannabis products, cost of goods sold totaled $8,558, resulting in an adjusted gross profit margin of 13%.
Beginning in July 2025, the supply chain experienced delays in product release from Portugal, where many distributors (including Remexian) ship biomass for processing. As a result, products have been taking months longer than usual to be released, which required the Company to sell the aging biomass at lower margins than was typical. Following the acquisition, the Company expanded its roster of potential processing partners to reduce reliance on any single partner. After these temporary supply chain issues play out, the Company expects Remexian to be a meaningful contributor to its consolidated financial profile.
| | | | | |
| High Tide Inc. |
| Management's Discussion and Analysis |
| For the years ended October 31, 2025 and 2024 |
| (In thousands of Canadian dollars, except share and per share amounts or otherwise stated) |
Performance by geographical market:
Geographical markets represent revenue based on the geographical locations of the customers who have contributed to the revenue. The following is a representation of these geographical markets. The Company's geographic segments are characterized as follows:
Canada: Within Canada, the Company operates retail cannabis stores under the Canna Cabana banner and maintains warehouse operations that primarily support and supply its retail locations.
USA: Within the USA the Company operates its e-commerce platforms including Smoke Cartel, Grasscity, Daily High Club, DankStop, NuLeaf Naturals and FABCBD. In addition, the Company operates a warehouse which primarily services the e-commerce consumption accessories operations.
International: Within the International market, the Company operates its Blessed CBD e-commerce platform which primarily serves the UK market. During the year ended October 31, 2025, the Company expanded its international presence through the acquisition of Remexian, which added medical cannabis distribution operations in Germany.
Geographic markets vs. operating segments
The Canada geographic market generally corresponds to the bricks-and-mortar operating segment, while the United States and International geographic markets primarily correspond to the e-commerce operating segment. The International geographic market consists of the Blessed CBD e-commerce business and the medical cannabis distribution business. The variances between geographic market and operating segment results primarily reflect differences in corporate overhead allocation, as overhead is allocated to operating segments based on revenue, but recorded by geographic market based on where costs are incurred, principally Canada.
| | | | | |
| High Tide Inc. |
| Management's Discussion and Analysis |
| For the years ended October 31, 2025 and 2024 |
| (In thousands of Canadian dollars, except share and per share amounts or otherwise stated) |
Geographical markets
The following presents information related to the Company’s geographical market.
| | | | | | | | | | | | | | | | | | | | | | | | | | | | | | | | | | | | | | | | | | | | | | | | | | |
| | Canada | | Canada | | USA | | USA | | International | | International | | Total | | Total |
| For the year ended October 31 | | 2025 | | 2024 | | 2025 | | 2024 | | 2025 | | 2024 | | 2025 | | 2024 |
| | $ | | $ | | $ | | $ | | $ | | $ | | $ | | $ |
| | | | | | | | | | | | | | | | |
| Revenue | | 565,316 | | | 484,444 | | | 18,127 | | | 36,061 | | | 10,543 | | | 1,801 | | | 593,986 | | | 522,306 | |
| Cost of goods sold | | 417,882 | | | 359,118 | | | 12,712 | | | 20,011 | | | 8,997 | | | 675 | | | 439,591 | | | 379,804 | |
| Inventory fair value | | — | | | — | | | — | | | — | | | 865 | | | — | | | 865 | | | — | |
| Gross profit | | 147,434 | | | 125,326 | | | 5,415 | | | 16,050 | | | 681 | | | 1,126 | | | 153,530 | | | 142,502 | |
Gross profit margin(i) | | 26% | | 26% | | 30% | | 45% | | 6% | | 63% | | 26% | | 27% |
| Total expenses | | 125,733 | | | 110,896 | | | 35,642 | | | 25,454 | | | 6,603 | | | 1,149 | | | 167,978 | | | 137,499 | |
| Income (loss) from operations | | 21,701 | | | 14,430 | | | (30,227) | | | (9,404) | | | (5,922) | | | (23) | | | (14,448) | | | 5,003 | |
| Depreciation and amortization | | 18,899 | | | 21,716 | | | 4,191 | | | 3,660 | | | 1,220 | | | 17 | | | 24,310 | | | 25,393 | |
| Share-based compensation | | 3,917 | | | 2,975 | | | — | | | — | | | — | | | — | | | 3,917 | | | 2,975 | |
| Inventory fair value | | — | | | — | | | — | | | — | | | 865 | | | — | | | 865 | | | — | |
| Impairment | | — | | | | | 20,349 | | | 4,176 | | | 3,215 | | | 788 | | | 23,564 | | | 4,964 | |
Adjusted EBITDA(i) | | 44,517 | | | 39,121 | | | (5,687) | | | (1,568) | | | (622) | | | 782 | | | 38,208 | | | 38,335 | |
(i) Gross profit margin and Adjusted EBITDA are non-IFRS measures.
| | | | | |
| High Tide Inc. |
| Management's Discussion and Analysis |
| For the years ended October 31, 2025 and 2024 |
| (In thousands of Canadian dollars, except share and per share amounts or otherwise stated) |
| | | | | | | | | | | | | | | | | | | | | | | | | | | | | | | | | | | | | | | | | | | | | | | | | | |
| | Canada | | Canada | | USA | | USA | | International | | International | | Total | | Total |
| As at October 31 | | 2025 | | 2024 | | 2025 | | 2024 | | 2025 | | 2024 | | 2025 | | 2024 |
| | $ | | $ | | $ | | $ | | $ | | $ | | $ | | $ |
| Current assets | | 84,442 | | | 77,037 | | | 6,824 | | | 7,940 | | | 45,619 | | | 812 | | | 136,885 | | | 85,789 | |
| Non-current assets | | 143,604 | | | 129,115 | | | 2,587 | | | 27,634 | | | 65,986 | | | 3,670 | | | 212,177 | | | 160,419 | |
| Current liabilities | | 55,763 | | | 57,692 | | | 2,832 | | | 3,580 | | | 41,323 | | | 208 | | | 99,918 | | | 61,480 | |
| Non-current liabilities | | 134,918 | | | 36,680 | | | 1,509 | | | 2,252 | | | 9,929 | | | 284 | | | 146,356 | | | 39,216 | |
Canada
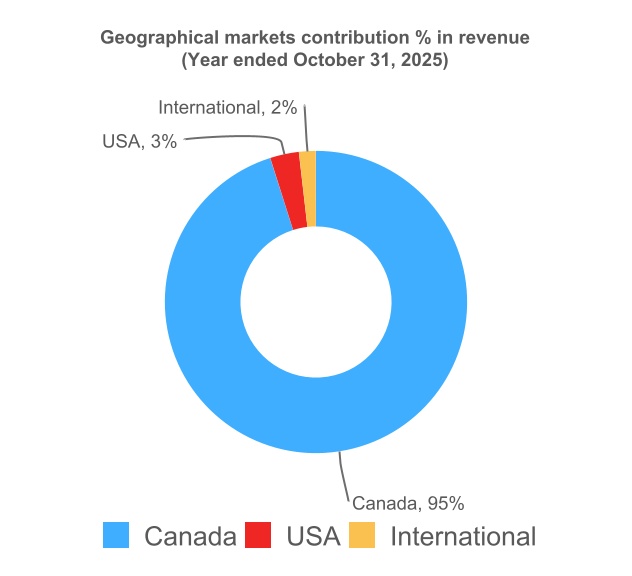
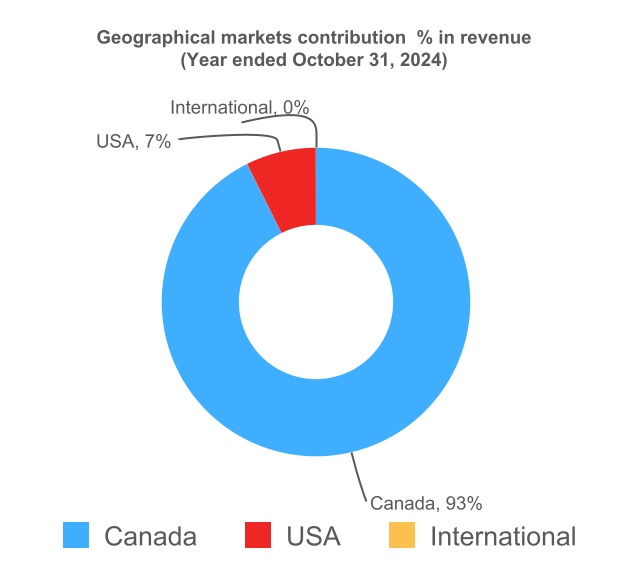
For the year ended October 31, 2025 Canada contributed 95% of total revenue (October 31, 2024: 93%). The Company continues to operate primarily in Canada and is expanding its footprint across provinces in which it operates. Canadian revenue increased 17% for the year ended October 31, 2025, compared with the prior year, driven by same-store sales growth and continued expansion. Over the 12 months ended October 31, 2025, the Company opened 25 stores.
USA
For the year ended October 31, 2025, the USA contributed 3% of total revenue (October 31, 2024: 7%). US revenue decreased 50% for the year ended October 31, 2025, compared with the prior year. The decrease in e-commerce revenue is primarily due to decreased traffic referred from search engines and increased competition within the hemp-derived products and consumption accessories markets, as well as the Company's international pricing strategy and debut of its Cabana Club loyalty program into existing markets outside Canada.
International
For the year ended October 31, 2025, the International market contributed 2% of total revenue (October 31, 2024: 0%).International revenue increased to $10,543, compared to $1,801 in the prior year. The increase was primarily attributable to the addition of medical cannabis distribution operations in Germany following the acquisition of Remexian.
| | | | | |
| High Tide Inc. |
| Management's Discussion and Analysis |
| For the years ended October 31, 2025 and 2024 |
| (In thousands of Canadian dollars, except share and per share amounts or otherwise stated) |
Summary of quarterly results:
| | | | | | | | | | | | | | | | | | | | | | | | | | | | | | |
| 2025 | 2024 | | | |
| Q4 | Q3 | Q2 | Q1 | Q4 | Q3 | Q2 | Q1 | | | | |
| Bricks-and-mortar store count | 211 | | 203 | | 195 | | 189 | | 186 | | 180 | | 166 | | 163 | | | | | |
| | | | | | | | | | | | |
Free cash flow(i) | 1,323 | 7,682 | 4,896 | (1,900) | 5,908 | 3,092 | 9,383 | 3,608 | | | | |
| Cash and cash equivalents | 47,883 | 63,809 | 34,692 | 33,341 | 47,267 | 35,254 | 34,540 | 28,685 | | | | |
| Cannabis and Hemp-derived products | 145,451 | 131,963 | 120,051 | 123,619 | 120,259 | 115,667 | 107,959 | 108,908 | | | | |
| Consumption accessories | 5,493 | 5,744 | 6,415 | 7,544 | 7,128 | 6,972 | 7,323 | 11,378 | | | | |
| Data analytics, advertising and other revenue | 13,087 | 11,983 | 11,338 | 11,298 | 10,908 | 9,046 | 8,977 | 7,782 | | | | |
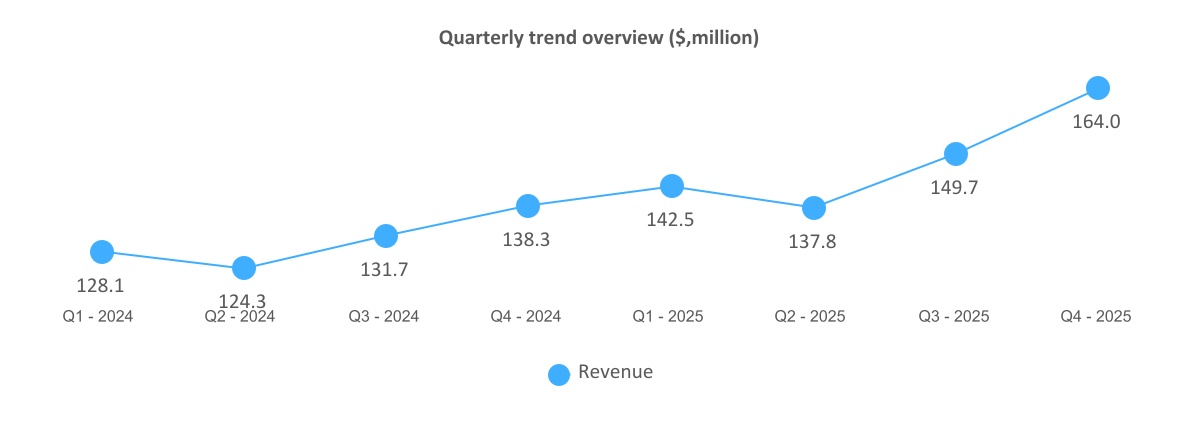
| Revenue | 164,031 | 149,690 | 137,804 | 142,461 | 138,295 | 131,685 | 124,259 | 128,068 | | | | |
Gross profit (i) | 42,528 | 40,091 | 35,471 | 35,440 | 35,755 | 35,454 | 35,299 | 35,994 | | | | |
| Gross profit margin | 26% | 27% | 26% | 25% | 26% | 27% | 28% | 28% | | | | |
Adjusted EBITDA (i) | 12,414 | 10,643 | 8,062 | 7,089 | 8,245 | 9,614 | 10,041 | 10,435 | | | | |
Adjusted EBITDA margin(i) | 8% | 7% | 6% | 5% | 6% | 7% | 8% | 8% | | | | |
| (Loss) income from operations | (19,186) | 3,739 | 932 | 67 | (2,831) | 3,055 | 1,987 | 2,792 | | | | |
| Net income (loss) | (46,711) | 832 | (2,836) | (2,689) | 4,802 | 825 | 171 | (5) | | | | |
| Basic and diluted income (loss) per share | (0.56) | 0.01 | (0.04) | (0.03) | (0.06) | 0.01 | 0.00 | 0.00 | | | | |
| | | | | | | | | | | | |
(i)Free cash flow, gross profit margin, Adjusted EBITDA and adjusted EBITDA Margin are non-IFRS financial measures, and accordingly, the Company’s use of such term may not be comparable to similarly defined measures presented by other entities. A reconciliation of the Adjusted EBITDA to Net (Loss) income is found under “EBITDA and Adjusted EBITDA of “Select Financial Highlights and Operating Performance” section.
| | | | | |
| High Tide Inc. |
| Management's Discussion and Analysis |
| For the years ended October 31, 2025 and 2024 |
| (In thousands of Canadian dollars, except share and per share amounts or otherwise stated) |
| | | | | |
| High Tide Inc. |
| Management's Discussion and Analysis |
| For the years ended October 31, 2025 and 2024 |
| (In thousands of Canadian dollars, except share and per share amounts or otherwise stated) |
Financial position, liquidity and capital resources:
| | | | | | | | | | | |
| Assets | October 31, 2025 | October 31, 2024 | Change |
| Current assets | 136,885 | | 85,789 | | 51,096 | |
| Non-current assets | 212,177 | | 160,419 | | 51,758 | |
| Total assets | 349,062 | | 246,208 | | 102,854 | |
| | | |
| Liabilities | | | |
| Current liabilities | 99,919 | | 61,480 | | 38,439 | |
| Non-current liabilities | 146,356 | | 39,216 | | 107,140 | |
| Total liabilities | 246,275 | | 100,696 | | 145,579 | |
| | | |
| Equity | 102,787 | | 145,512 | | (42,725) | |
| Total liabilities & equity | 349,062 | | 246,208 | | 102,854 | |
| | | |
| Working Capital | 36,966 | | 24,309 | | 12,657 | |
Financial position
Total assets increased primarily due to acquisition-related working capital. Total liabilities increased primarily due to acquisition-related working capital and financing, including new debt and the medical cannabis distribution put option derivative liability. Shareholders’ equity decreased primarily as a result of the year ended October 31, 2025 net loss (driven mainly by non-cash impairment charges and derivative revaluation), partially offset by equity issued as acquisition consideration and the recognition of non-controlling interest in Remexian. Working capital increased primarily due to the acquisition of the medical cannabis distribution business, which contributed increases in inventory and prepaid expenses.
Cash flow overview
During the year ended October 31, 2025, cash and cash equivalents increased by $616 to $47,883 (October 31, 2024: $47,267). Net cash provided by operating activities was $23,866 for the year ended October 31, 2025 (October 31, 2024: $35,546), with the decrease reflecting non-cash working capital changes and higher transaction & acquisition costs in 2025. Net cash used in investing activities for the year ended October 31, 2025 was $22,288 (October 31, 2024: $11,010), primarily reflecting the acquisition of Remexian. Net cash provided by financing activities for the year ended October 31, 2025 was $202 (October 31, 2024: net cash used of $7,723), driven by the financing inflows from convertible debt and secured debentures, which were largely offset by lease payments, partner distributions, and debt repayments.
Capital management
The Company’s objectives when managing capital resources are to:
(i) Explore profitable growth opportunities;
(ii) Deploy capital to provide an appropriate return on investment for shareholders;
(iii) Maintain financial flexibility to preserve the ability to meet financial obligations; and
(iv) Maintain a capital structure that provides financial flexibility to execute on strategic opportunities.
The Company’s strategy is formulated to maintain a flexible capital structure consistent with the objectives stated above as well to respond to changes in economic conditions and to the risks inherent in its underlying assets. The Board of Directors does not establish quantitative return on capital criteria for management, but rather promotes year-over-year sustainable profitable growth. The Company’s capital structure consists of debt, equity and working capital. To maintain or alter the capital structure, the Company may adjust capital spending, take on new debt and issue share capital. The Company anticipates that it will have adequate liquidity to fund future working capital, commitments, and forecasted capital expenditures through a combination of cash‐on‐hand and financing, as required.
| | | | | |
| High Tide Inc. |
| Management's Discussion and Analysis |
| For the years ended October 31, 2025 and 2024 |
| (In thousands of Canadian dollars, except share and per share amounts or otherwise stated) |
Liquidity and capital resources
The Company’s primary sources of liquidity and capital resources are cash on hand, cash generated from operations, and cash from debt & equity financing. As at October 31, 2025, the Company had cash and cash equivalents of $47,883 (October 31, 2024: $47,267), which included the $7,500 (October 31, 2024: $7,500) minimum deposit required to comply with Connect First Loan requirements. Management believes its liquidity is sufficient to meet working capital requirements, capital commitments, and debt obligations for at least the next twelve months.
Maturities of the Company’s financial liabilities are as follows:
| | | | | | | | | | | | | | | | | | | | | | | | | | | | | | | | | |
| | Contractual
Cash Flows | | | | 2026 | 2027-2028 | | 2029-2030 | | 2031 and beyond |
| | $ | | | | $ | $ | | $ | | $ |
| | | | | | | | | | | |
| | | | | | | | | | | |
| | | | | | | | | | | |
| | | | | | | | | | | |
| | | | | | | | | | | |
| | | | | | | | | | | |
| | | | | | | | | | | |
| | | | | | | | | | | |
| | | | | | | | | | | |
| | | | | | | | | | | |
| | | | | | | | | | | |
| Accounts payable and accrued liabilities | | 47,251 | | | | 47,251 | – | | – | | – |
| Income tax payable | | 7,189 | | | | 7,189 | – | | – | | – |
| Undiscounted lease obligations | | 65,128 | | | | 13,181 | 23,029 | | 14,682 | | 14,236 |
| Notes payable | | 20,258 | | | | 1,682 | 3,366 | | 14,949 | | 261 |
| Interest bearing loans and borrowings | | 16,189 | | | | 16,189 | – | | – | | – |
| Secured debentures | | 21,900 | | | | 1,800 | 3,600 | | 16,500 | | – |
| | | | | | | | | | | |
| | | | | | | | | | | |
| Convertible debt | | 35,749 | | | | 1,200 | 2,400 | | 32,149 | | – |
| Total | | 213,664 | | | | 88,492 | 32,395 | | 78,280 | | 14,497 |
Debt
During the year ended October 31, 2025, the Company accessed debt capital through additional secured debentures, a junior secured convertible loan, and a vendor loan to finance the Remexian acquisition. The Company also made principal repayments on its ConnectFirst credit facility and repaid certain notes payable during the year.
Management monitors covenant compliance and liquidity on both a standalone subsidiary and consolidated basis. As at October 31, 2025, the Company was in compliance with all covenants, including the requirement under the ConnectFirst Credit Facility to maintain a minimum $7.5 million deposit with ConnectFirst.
Certain financing arrangements assumed in connection with the Remexian acquisition are included in the Company’s consolidated liabilities, as Remexian is a 51%-owned subsidiary that is fully consolidated. The Company’s debt and financing facilities are summarized below in order of maturity date.
| | | | | | | | | | | | | | | | | | | | | |
| Facility | | Balance | | | Rate | | Maturity |
| | $ | | | | | |
| Interest bearing loan – German bank borrowing | | 4,851 | | | Variable: EURIBOR + 2.50% | | Dec 15, 2025 |
| Interest bearing loan – working capital loan | | 2,234 | | | Fixed: 1–5% transfer fee per invoice | | Jan 4, 2026 |
| Notes payable - Remexian unsecured loans | | 728 | | | Fixed: 10% average rate | | Oct. 31, 2026 |
| Interest bearing loan – Connect First | | 9,104 | | | Variable: Prime + 2.5% | | Sept. 5, 2027 |
| Secured debentures | | 12,536 | | | Fixed: 12% coupon; 10% OID | | July 31,2029 |
| Notes payable – vendor loan | | 9,007 | | | Fixed: 7% | | Dec. 31, 2029 |
| Notes payable – term loan | | 3,637 | | | Fixed: 4.82% | | Mar. 31, 2030 |
| Convertible debt – Cronos | | 17,877 | | | Fixed: 4% coupon; 16% OID | | July 16, 2030 |
| Notes payable – other loan | | 67 | | | Fixed: 3.75% | | May 19, 2050 |
| | 60,041 | | | | | |
Off Balance Sheet Transactions
The Company does not have any financial arrangements that are excluded from the financial statements as of October 31, 2025, nor are any such arrangements outstanding as of the date of this MD&A.
| | | | | |
| High Tide Inc. |
| Management's Discussion and Analysis |
| For the years ended October 31, 2025 and 2024 |
| (In thousands of Canadian dollars, except share and per share amounts or otherwise stated) |
Summary of Outstanding Share Data
The Company had the following securities issued and outstanding as at the date of this MD&A:
| | | | | | | | |
Securities (i) | | Units Outstanding |
| Common shares | | 87,839,735 | |
| Warrants | | 8,598,877 | |
| Stock options | | 2,380,082 | |
| RSUs | | 483,070 | |
(i)Refer to the Consolidated Financial Statements for a detailed description of these securities.
ATM Program
The Company has not issued equity via the ATM Program for the last three fiscal quarters.
Pursuant to the Company’s ATM Program that allowed the Company to issue up to $30 million (or the equivalent in U.S. dollars) of Common Shares from the treasury to the public from time to time, at the Company’s discretion and subject to regulatory requirements, as required pursuant to National Instrument 44-102 – Shelf Distributions and the policies of the TSXV.
During the year ended October 31, 2025, the Company issued an aggregate of 11,600 Common Shares over the Nasdaq or TSXV, for aggregate gross proceeds of $52. Pursuant to the Equity Distribution Agreement cash commission of $1 on the aggregate gross proceeds raised was paid to the Agents in connection with their services under the Equity Distribution Agreement during year ended October 31, 2025.
Common Shares issued pursuant to the ATM Program were issued pursuant to a prospectus supplement dated August 31, 2023 (the “Canadian Prospectus Supplement”) to the Company’s final base shelf prospectus dated August 3, 2023, filed with the securities commissions or similar regulatory authorities in each of the provinces and territories of Canada (the “Canadian Shelf Prospectus”) and pursuant to a prospectus supplement dated August 31, 2023 (the “U.S. Prospectus Supplement”) to the Company’s U.S. base prospectus dated August 3, 2023 (the “U.S. Base Prospectus”) included in its registration statement on Form F-10 (the “Registration Statement”) and filed with the U.S. Securities and Exchange Commission (the “SEC”). The Canadian Prospectus Supplement and Canadian Shelf Prospectus are available for download from SEDAR+ at www.sedarplus.ca, and the U.S. Prospectus Supplement, the U.S. Base Prospectus and Registration Statement are accessible via EDGAR on the SEC’s website at www.sec.gov.
The Company used the net proceeds of the ATM Program at the discretion of the Company, to fund strategic initiatives it was developing, to support the growth and development of the Company’s existing operations, funding future acquisitions as well as working capital and general corporate purposes.
The ATM Program was effective until until July 24, 2025, when the Canadian Shelf Prospectus was withdrawn in order to file a new base shelf prospectus.
On August 11, 2025, the Company filed a final short form base shelf prospectus in all Canadian provinces and territories and a corresponding shelf registration statement with the U.S. Securities and Exchange Commission. These filings allow the Company to offer, during the 25-month effective period, up to an aggregate of $100,000 in one or more offerings of equity, debt, warrants, subscription receipts, units, convertible securities, or combinations thereof. As at the date the financial statements were authorized for issue, no securities had been issued under the shelf and no at-the-market distribution agreement or prospectus supplement had been entered into.
| | | | | |
| High Tide Inc. |
| Management's Discussion and Analysis |
| For the years ended October 31, 2025 and 2024 |
| (In thousands of Canadian dollars, except share and per share amounts or otherwise stated) |
Transactions between related parties:
As of October 31, 2025, the Company had the following transactions with related parties as defined in IAS 24 – Related Party Disclosures, except those pertaining to transactions with key management personnel in the ordinary course of their employment and/or directorship arrangements and transactions with the Company’s shareholders in the form of various financing.
Operational transactions
An office and warehouse unit (27,000 sq ft) has been developed by Grover Properties Inc., a company that is related through a common controlling shareholder and the President & CEO of the Company. The office and warehouse space were leased to High Tide to accommodate the Company’s operational expansion. The lease was established by an independent real estate valuations services company at prevailing market rates and has annual lease payments totaling $386 per annum. The current lease term is 5 years that ends on December 31, 2028 with one additional 5-year term extension exercisable remaining at the option of the Company.
Following the acquisition of a controlling interest in Remexian on September 2, 2025, Remexian continued to receive facilities and operational support services from INOPHA under an existing service agreement, including seconded personnel support and the provision of Remexian managing director's time through INOPHA. For the period from September 2, 2025 to October 31, 2025, the Company recognized $175 of expense in respect of these services (October 31, 2024: $nil). Refer to the related party note in the consolidated financial statements which is hereby incorporated by reference to this MD&A.
Financing transactions
On August 15, 2022, the Company entered into a $19,000 demand term loan with Connect First credit union (the "Credit Facility") with Tranche 1 - $12,100 available in a single advance, and Tranche 2 - $6,900 available in multiple draws subject to pre-disbursement conditions set. To facilitate the credit facility, the president and CEO of the Company provided limited recourse guarantee against $5,000 worth of High Tide Inc. shares held by the CEO, and affiliates, to be pledged in favor of the Credit Union. The parties agree that this personal guarantee will only be available after all collection efforts against High Tide Inc. have been exhausted, including the sale of High Tide Inc.
Key management personnel:
Key management personnel is comprised of Company’s Executive Team and Board of Directors. Key management compensation for the years ended October 31 as follows:
| | | | | | | | | | | |
| 2025 | | 2024 |
| $ | | $ |
| Short-term compensation | 4,370 | | | 2,688 | |
| Termination benefits | - | | | 310 | |
| Share-based compensation | 3,486 | | | 2,070 | |
| | | |
| | | |
| | | |
| | | |
| | | |
| | | |
| | | |
| Total | 7,856 | | | 5,068 | |
Financial instruments:
The Company uses financial instruments in the normal course of business and is exposed to certain market risks, including interest rate risk, foreign exchange risk, and fair value risk related to instruments measured at fair value through profit or loss. Certain derivative instruments, including those associated with financing arrangements and non-controlling interest put options, may result in non-cash volatility in reported earnings due to changes in market conditions and valuation assumptions.
The Company is exposed to interest rate risk primarily through variable-rate borrowings and foreign exchange risk through its operations in the United States and Europe. Management monitors these exposures on an ongoing basis and manages risk primarily through operational and financing strategies. The Company did not utilize derivative instruments for hedging purposes during fiscal 2025.
Further information regarding the classification, measurement, fair values, and related risks of the Company’s financial instruments is provided in Note 25 to the consolidated financial statements, which is incorporated by reference into this MD&A.
| | | | | |
| High Tide Inc. |
| Management's Discussion and Analysis |
| For the years ended October 31, 2025 and 2024 |
| (In thousands of Canadian dollars, except share and per share amounts or otherwise stated) |
Critical Accounting Estimates and Judgements:
The preparation of the Company’s consolidated financial statements requires management to make estimates and judgements that affect the reported amounts of assets, liabilities, revenues, and expenses. Actual results may differ from these estimates due to changes in assumptions or circumstances. Management believes that the estimates and judgements described below are those that had the most significant impact on the Company’s results and financial position during the year ended October 31, 2025.
Impairment of non-financial assets
During the year ended October 31, 2025, management recognized a material impairment charge related to the e-commerce business. The impairment assessment required significant judgement, including assumptions regarding forecasted revenue growth, gross margins, discount rates, and terminal values. Changes in these assumptions could result in future impairment charges or reversals.
Business combinations
The acquisition of Remexian required management to estimate the fair value of identifiable assets acquired and liabilities assumed, including intangible assets and goodwill. These valuations are based on forecast cash flows, discount rates, and other assumptions and remain subject to measurement-period adjustments, which may result in changes to provisional amounts in future periods.
Fair value of financial instruments
Certain financial instruments, including detachable warrants issued in connection with the Company’s convertible debt and the put option derivative liability related to the Medical Cannabis distribution business, are measured at fair value. Valuation of these instruments requires the use of significant assumptions, such as expected volatility, discount rates, and forecast performance of the underlying business, which may result in non-cash volatility in reported earnings.
Further information regarding the Company’s accounting policies, significant estimates, judgements, and related sensitivities is included in note 4 to the consolidated financial statements for the year ended October 31, 2025 which is hereby incorporated by reference to this MD&A.
Disclosure controls and procedures and internal controls over financial reporting:
Disclosure controls and procedures and internal controls over financial reporting: The Chief Executive Officer and Chief Financial Officer of the Company have designed or caused to be designed under their supervision, disclosure controls and procedures which provide reasonable assurance that material information regarding the Company is accumulated and communicated to Management, including its Chief Executive Officer and Chief Financial Officer, in a timely manner. Under the supervision and with the participation of Management, including our Chief Executive Officer and Chief Financial Officer, we carried out an evaluation of the effectiveness of our disclosure controls and procedures (as defined in Canada by NI 52-109 and in the United States by the rules adopted by the SEC). In addition, the Chief Executive Officer and Chief Financial Officer of the Company are responsible for designing internal controls over financial reporting or causing them to be designed under their supervision in order to provide reasonable assurance regarding the reliability of financial reporting and the preparation of financial statements for external purposes in accordance with IFRS. Based on this evaluation, our Chief Executive Officer and Chief Financial Officer concluded that the design and operation of our disclosure controls and procedures were ineffective due to the material weakness identified in our internal control over financial reporting, as further described below.
Due to its inherent limitations, internal control over financial reporting may not prevent or detect misstatements on a timely basis. Also, projections of any evaluation of the effectiveness of internal control over financial reporting to future periods are subject to the risk that the controls may become inadequate because of changes in conditions, or that the degree of compliance with the policies or procedures may deteriorate.
Management assessed the effectiveness of the Company’s internal control over financial reporting as of October 31, 2025, based on the criteria set forth in Internal Control – Integrated Framework (2013 Framework) issued by the Committee of Sponsoring Organizations of the Treadway Commission. Based on that assessment, Management has concluded that our internal control over financial reporting (ICFR) was not effective as of October 31, 2025, due to a material weakness in our internal controls over financial reporting. A material weakness is a deficiency, or combination of deficiencies, in internal control over financial reporting, such that
| | | | | |
| High Tide Inc. |
| Management's Discussion and Analysis |
| For the years ended October 31, 2025 and 2024 |
| (In thousands of Canadian dollars, except share and per share amounts or otherwise stated) |
there is a reasonable possibility that a material misstatement of the Company’s annual or interim financial statements will not be prevented or detected on a timely basis. Management identified the following internal control deficiencies that constitute material weaknesses in the Company’s ICFR as of October 31, 2025.
The Company did not effectively design, implement, and operate effective controls over user access and change management for certain financial reporting systems, which affected the reliability of system-generated information used in financial reporting. In addition, controls over the preparation and review of financial information and related disclosures, primarily related to complex and non-routine transactions, were not designed or operating at a level sufficient to prevent or detect material misstatements on a timely basis. As of October 31, 2025, material weaknesses continue to exist in the operating effectiveness of IT general controls and controls over significant and non-routine accounting transactions because of insufficient capacity and expertise in its financial reporting function to identify and detect material misstatements.
Management has initiated remediation efforts to enhance IT general controls and hire qualified resources to increase capacity and strengthen review procedures over non-routine and certain period-end accounting matters; however, these actions were not fully implemented or operating effectively as of October 31, 2025.
| | | | | |
| High Tide Inc. |
| Management's Discussion and Analysis |
| For the years ended October 31, 2025 and 2024 |
| (In thousands of Canadian dollars, except share and per share amounts or otherwise stated) |
Cautionary note regarding forward-looking information:
Certain statements contained in this MD&A, and in the documents incorporated by reference in this MD&A, constitute “forward-looking information” and “forward-looking statements” (together “forward-looking statements”) within the meaning of Applicable Securities Laws and are based on assumptions, expectations, estimates and projections as at the date of this MD&A. Forward-looking statements relate to future events or future performance and reflect Management’s expectations or beliefs regarding future events. In certain cases, forward-looking statements can be identified by the use of words such as “plans”, “expects” or “does not expect”, “is expected”, “budget”, “scheduled”, “estimates”, “forecasts”, “intends”, “anticipates” or “does not anticipate”, or “believes”, or variations of such words and phrases or statements that certain actions, events or results “may”, “could”, “would”, “might” or “will be taken”, “occur” or “be achieved” or the negative of these terms or comparable terminology.
Forward-looking statements in this MD&A herein include, but are not limited to, statements with respect to:
•the Business objectives and milestones and the anticipated timing of, and costs in connection with, the execution or achievement of such objectives and milestones (including, without limitation proposed M&A);
•the Company’s future growth prospects and intentions to pursue one or more viable Business opportunities;
•the development of the Business and future activities following the date of this MD&A;
•the closing of announced acquisitions;
•expectations relating to market size and anticipated growth in the jurisdictions within which the Company may from time to time operate or contemplate future operations;
•the ability of the Company to enter into new markets following cannabis legalization, including the United States and Germany;
•expectations with respect to economic, Business, regulatory, or competitive factors related to the Company or the cannabis industry generally;
•the market for the Company’s current and proposed product offerings, as well as the Company’s ability to capture market share;
•the Company’s strategic investments and capital expenditures, and related benefits;
•the distribution methods expected to be used by the Company to deliver its product offerings;
•same-store sales and consolidated gross margins continuing to increase;
•the competitive landscape within which the Company operates and the Company’s market share or reach;
•the performance of Business operations and activities of the Company;
•the number of additional cannabis retail store locations the Company proposes to add to its Business, with Ontario representing the majority share of the increase;
•the Company’s ability to obtain, maintain, and renew or extend, applicable Authorizations, including the timing and impact of the receipt thereof;
•the realization of cost savings, synergies or benefits from the Company’s recent and proposed acquisitions, and the Company’s ability to successfully integrate the operations of any business acquired within the Business;
•the Company’s intention to devote resources to the protection of its intellectual property rights, including by seeking and obtaining registered protections and developing and implementing standard operating procedures;
•the anticipated sales from continuing operations;
•the intention of the Company to complete any additional offering of securities of the Company and the aggregate amount of the total proceeds that the Company will receive pursuant to the ATM Program, Credit Facility, Junior Secured Loan, or any future offering;
•the Company’s expected use of the net proceeds from the ATM Program, Credit Facility, Junior Secured Loan, or any future offering;
•the anticipated effects of the ATM Program, Credit Facility, Junior Secured Loan, or any future offering on the Business and operations of the Company;
•the listing of Common Shares offered in the ATM Program and/or any future offering;
•the Company’s ability to generate cash flow from operations and from financing activities and remain free cash flow positive;
•future initiatives to strengthen the performance of our e-commerce platforms;
•the Company continuing to increase its revenue;
•the Company continuing to integrate and expand its hemp-derived product brands;
•Whether the Company will need additional working capital for the expansion of Remexian;
•Cabana Club and Cabana ELITE loyalty programs membership continuing to increase;
•the Company continuing to increase its ELITE product offerings;
•the effects of the ELITE program on the business and operations of the Company;
•the ability of the Company to reach its goals of 350 stores nationwide and 3 million Cabana Club members;
| | | | | |
| High Tide Inc. |
| Management's Discussion and Analysis |
| For the years ended October 31, 2025 and 2024 |
| (In thousands of Canadian dollars, except share and per share amounts or otherwise stated) |
•the ability of the Company to open 20-30 locations in calendar 2026, mostly through organic growth, while also evaluating supplemental M&A opportunities of varying sizes;
•the timelines for its international launch to become revenue and EBITDA neutral;
•the ability of the Company to turn around its e-commerce brands using various alternatives;
•the rescheduling of cannabis in the U.S., the pilot project regarding CBD products for seniors through Medicare, and the Company’s decision to put related potential major transactions on hold;
•new white label products launching and sales of higher-margin white label brands growing to 20%;
•the ability to expand Remexian’s international footprint in 2026;
•the expectation that Remexian is nearing the end of supply disruptions in Portugal and that revenue will increase over the coming quarters and that Remexian will be a meaningful contributor to the consolidated financial profile;
•the ability of the Company to use cash generated from existing operations to fund future locations;
•the Company hitting its forecasted revenue and sales projections;
•changes in general and administrative expenses;
•future Business operations and activities and the timing thereof;
•the future tax liability of the Company;
•the estimated future contractual obligations of the Company; and
•the future liquidity and financial capacity of the Company; and its ability to fund its working capital requirements and forecasted capital expenditures.
Forward-looking statements are subject to certain risks and uncertainties. Although Management believes that the expectations reflected in these forward-looking statements are reasonable in light of, among other things, its perception of trends, current conditions and expected developments, as well as other factors that Management believes to be relevant and reasonable in the circumstances at the date that such statements are made, readers are cautioned not to place undue reliance on forward-looking statements, as forward-looking statements may prove to be incorrect. A number of factors could cause actual results to differ materially from a conclusion, forecast or projection contained in the forward-looking statements. Importantly, forward-looking statements contained in this MD&A and in documents incorporated by reference are based upon certain assumptions that Management believes to be reasonable based on the information currently available to Management.
By their very nature forward-looking statements involve known and unknown risks, uncertainties and other factors which may cause the actual results, performance or achievements of the Company to be materially different from any future results, performance or achievements expressed or implied by the forward-looking statements. Although Management believes that the expectations reflected in, and assumptions underlying, such forward-looking statements are reasonable, it can give no assurance that such expectations will prove to have been correct. New factors emerge from time to time, and it is not possible for Management to predict all of those factors or to assess in advance the impact of each such factor on the Business or the extent to which any factor, or combination of factors, may cause actual results to differ materially from those contained in any forward-looking statement.
Readers are cautioned that the foregoing is not exhaustive. The forward-looking statements contained in this MD&A and the documents incorporated by reference herein are expressly qualified by this cautionary statement. The forward-looking statements contained in this document speak only as of that date of this document and the Company does not assume any obligation to publicly update or revise them to reflect new events or circumstances, except as may be required pursuant to Applicable Securities Laws.
These forward-looking statements speak only as of the date of this MD&A or as of the date specified in the documents incorporated by reference into this MD&A. The actual results could differ materially from those anticipated in these forward-looking statements as a result of the risk factors set forth below and elsewhere in this MD&A: counterparty credit risk; access to capital; limitations on insurance; changes in environmental or legislation applicable to our operations, and our ability to comply with current and future environmental and other laws; changes in income tax laws or changes in tax laws and incentive programs relating to the cannabis industry; and the other factors discussed under “Financial Instruments” in this MD&A.
Additional risk factors that can cause results to differ materially from those expressed in forward-looking statements in this MD&A are discussed in greater detail in the “Non-Exhaustive List of Risk Factors” section in Schedule A to our current annual information form, and elsewhere in this MD&A, as such factors may be further updated from time to time in our periodic filings, available at www.sedarplus.com and www.sec.gov, which risk factors are incorporated herein by reference.
| | | | | |
| High Tide Inc. |
| Management's Discussion and Analysis |
| For the years ended October 31, 2025 and 2024 |
| (In thousands of Canadian dollars, except share and per share amounts or otherwise stated) |
Cautionary note regarding FOFI:
This MD&A, and documents incorporated by reference herein, may contain FOFI within the meaning of Applicable Securities Laws and analogous U.S. securities Laws, about prospective results of operations, financial position or cash flows, based on assumptions about future economic conditions and courses of action, which FOFI is not presented in the format of a historical balance sheet, income statement or cash flow statement. The FOFI has been prepared by Management to provide an outlook of the Company’s activities and results and has been prepared based on a number of assumptions including the assumptions discussed under the heading “Cautionary Note Regarding Forward-Looking Information” and assumptions with respect to the costs and expenditures to be incurred by the Company, capital expenditures and operating costs, taxation rates for the Company and general and administrative expenses. Management does not have, or may not have had at the relevant date, firm commitments for all of the costs, expenditures, prices or other financial assumptions which may have been used to prepare the FOFI or assurance that such operating results will be achieved and, accordingly, the complete financial effects of all of those costs, expenditures, prices and operating results are not, or may not have been at the relevant date of the FOFI, objectively determinable.
Importantly, the FOFI contained in this MD&A, and in documents incorporated by reference herein are, or may be, based upon certain additional assumptions that Management believes to be reasonable based on the information currently available to Management, including, but not limited to, assumptions about: (i) the future pricing for the Company’s products, (ii) the future market demand and trends within the jurisdictions in which the Company may from time to time conduct the Business, (iii) the Company’s ongoing inventory levels, and operating cost estimates, and (iv) the Company’s net proceeds from the ATM Program, Junior Secured Loan, and Credit Facility. The FOFI or financial outlook contained in MD&A, and in documents incorporated by reference herein do not purport to present the Company’s financial condition in accordance with IFRS as issued by the International Accounting Standards Board, and there can be no assurance that the assumptions made in preparing the FOFI will prove accurate. The actual results of operations of the Company and the resulting financial results will likely vary from the amounts set forth in the analysis presented in any such document, and such variation may be material (including due to the occurrence of unforeseen events occurring subsequent to the preparation of the FOFI). The Company and Management believe that the FOFI has been prepared on a reasonable basis, reflecting Management’s best estimates and judgments as at the applicable date. However, because this information is highly subjective and subject to numerous risks including the risks discussed under the heading “Risk Assessment”, FOFI or financial outlook within this MD&A, and in documents incorporated by reference herein, should not be relied on as necessarily indicative of future results.
Readers are cautioned not to place undue reliance on the FOFI, or financial outlook contained in this MD&A, and in documents incorporated by reference herein. Except as required by Applicable Securities Laws, the Company does not intend, and does not assume any obligation, to update such FOFI.
Non-IFRS Financial Measures
Throughout this MD&A, references are made to non-IFRS financial measures, including free cash flow, gross profit margin, sustaining capex, EBITDA and Adjusted EBITDA. These measures do not have a standardized meaning prescribed by IFRS and are therefore unlikely to be comparable to similar measures presented by other issuers. Non-IFRS measures provide investors with a supplemental measure of the Company’s operating performance and therefore highlight trends in Company’s core Business that may not otherwise be apparent when relying solely on IFRS measures. Management uses non-IFRS measures in measuring the financial performance of the Company.
Risk Assessment
Management defines risk as the evaluation of probability that an event might happen in the future that could negatively affect the financial condition, results of operations and/or reputation of the Company. Risks facing our business, and that could cause actual results to differ materially from current expectation, may include, but are not limited to, risks and uncertainties that are discussed in greater detail in Schedule A to our current Annual Information Form (AIF) for the fiscal year ended October 31, 2024, and elsewhere in this MD&A, and may be further updated from time to time in our periodic filings, available at www.sedar.com and www.sec.gov which risk factors are incorporated herein by reference.
The Company's bricks-and-mortar business which accounts for 95% of revenue is domestically sourced thus having no US tariff impact.The Company’s e-commerce business, which represents 3% of consolidated revenue, consists predominantly of domestically sourced products, with less than 1% of total products sourced through a broker that imports products both domestically and internationally. In addition, the Company’s medical cannabis distribution business, which represents 2% of consolidated revenue, is currently not exposed to U.S. tariff risk. Based on the Company’s current sourcing profile, management expects the impact of U.S. tariffs on consolidated operations to be immaterial..
| | | | | |
| High Tide Inc. |
| Management's Discussion and Analysis |
| For the years ended October 31, 2025 and 2024 |
| (In thousands of Canadian dollars, except share and per share amounts or otherwise stated) |
Glossary of terms:
In this MD&A, unless otherwise indicated or if the context otherwise requires, “Adjusted EBITDA” has the meaning ascribed thereto under the heading “EBITDA and Adjusted EBITDA”; “Agents” means collectively ATB Capital Markets Inc. and ATB Capital Markets USA Inc.; “Applicable Securities Laws” means, as applicable, the securities legislation, securities regulation and securities rules, and the policies, notices, instruments and blanket orders of each Canadian securities regulator having the force of applicable law and in force from time to time; “ATM Program” means the at-the-market equity offering program of the Company established pursuant to the Canadian Prospectus Supplement and U.S. Prospectus Supplement on August 31, 2023, which allowed the Company to issue up to $30,000,000 (or the equivalent in U.S. dollars) of Common Shares from its treasury to the public from time to time, at the Company’s discretion and subject to regulatory requirements; “Authorizations” means, collectively, all consents, licenses, registrations, permits, authorizations, permissions, orders, approvals, clearances, waivers, certificates, and declarations issued, granted, given or otherwise made available by or under the authority of any government entity or pursuant to any requirement under applicable law; “Blessed CBD” means Enigmaa Ltd., operating as ‘Blessed CBD’; “Board” means the board of directors of the Company, as constituted from time to time; “Business” means the business carried on by High Tide and its subsidiaries as at the date of this MD&A, and where the context so requires, includes the business carried on by High Tide and its subsidiaries prior to the date of this MD&A; “Canadian Shelf Prospectus” means the Company’s final base shelf prospectus dated August 3, 2023 filed with the securities commissions or similar regulatory authorities in each of the provinces and territories of Canada; “Cannabis” or “cannabis” means the plant Cannabis sativa L; “Common Shares” means the common shares in the capital of the Company; “ConnectFirst” means Connect First Credit Union Ltd.; Credit Facility” has the meaning ascribed thereto under the heading “ConnectFirst Credit Facility”; “DankStop” means DS Distribution Inc., operating as ‘Dankstop.com’; “Daily High Club” or “DHC” means DHC Supply LLC.; “EBITDA” means earnings before interest, taxes, depreciation and amortization; “Equity Distribution Agreement” means the equity distribution agreement dated August 31, 2023 entered into among the Company and Agents associated with the ATM Program; “FABCBD” means Fab Nutrition, LLC.; “FOFI” means future oriented financial information; “GBP” means British pound sterling; “Grasscity” means collectively, SJV B.V. and SJV2 B.V; “IAS” means International Accounting Standards; “Person” includes any individual, partnership, association, body corporate, organization, trust, estate, trustee, executor, administrator, legal representative or government (including any governmental entity), syndicate or other entity, whether or not having legal status; “M&A” means mergers and acquisitions; “Management” means the management of the Company, as constituted from time to time; “NI 52-109” means National Instrument 52-109 – Certification of Disclosure in Issuers’ Annual and Interim Filings; “Remexian” means Remexian Pharma GmbH; “SEC” means the U.S. Securities and Exchanges Commission; “NuLeaf Naturals” means NuLeaf Naturals, LLC; “Registration Statement” means the Company’s registration statement on Form F-10 in connection with the Company becoming a registrant effective June 2, 2021 with the SEC upon the Company’s Form 40-F registration statement becoming effective; “Smoke Cartel” means Smoke Cartel Inc.; “U.K.” means the United Kingdom; “U.S.” means United States of America; “U.S. Base Prospectus” means the Company’s U.S. base prospectus dated August 3, 2023 included in the Registration; “USD” United States dollars; and “Warrants” means the Common Share purchase warrants of the Company.
| | | | | |
| High Tide Inc. |
| Management's Discussion and Analysis |
| For the years ended October 31, 2025 and 2024 |
| (In thousands of Canadian dollars, except share and per share amounts or otherwise stated) |
High Tide is a high-impact, retail-forward enterprise built to deliver real-world value across every component of cannabis. The Company’s shares are listed on the Nasdaq Capital Market (“Nasdaq”) under the ticker symbol “HITI” as of June 2, 2021, the TSX Venture Exchange (“TSXV”) under the symbol “HITI”, and the Frankfurt Stock Exchange under the securities identification code ‘WKN: A2PBPS’ and the ticker symbol “2LYA”. The address of the Company’s corporate and registered office is # 112, 11127 15 Street NE, Calgary, Alberta, T3K 2M4.