Exhibit (c)(4)
January 16, 2026 Project Boson Discussion Materials CENTER,VIEW PARTNERS
Exhibit (c)(4)
January 16, 2026 Project Boson Discussion Materials CENTER,VIEW PARTNERS
1 This presentation has been prepared by Centerview Partners LLC (“Centerview”) for use solely by the Special Committee of the Board of Directors of Mister Car Wash, Inc. (the “Company”) (in its capacity as such) and for no other purpose. The information contained herein is based upon information supplied by or on behalf of the Company and publicly available information, and portions of the information contained herein may be based upon statements, estimates and forecasts provided by the Company. Centerview has relied upon the accuracy and completeness of the foregoing information, and has not assumed any responsibility for any independent verification of such information or for any independent evaluation or appraisal of any of the assets or liabilities (contingent or otherwise) of the Company or any other entity, or concerning the solvency or fair value of the Company or any other entity. With respect to financial forecasts, including with respect to estimates of potential synergies, Centerview has assumed that such forecasts have been reasonably prepared on bases reflecting the best currently available estimates and judgments of the management of the Company (“Management”) and as to the future financial performance of the Company, and at your direction Centerview has relied upon such forecasts, as provided by Management, with respect to the Company, including as to expected synergies. Centerview assumes no responsibility for and expresses no view as to such forecasts or the assumptions on which they are based. The information set forth herein is based upon economic, monetary, market and other conditions as in effect on, and the information made available to us as of, the date hereof, unless indicated otherwise and Centerview assumes no obligation to update or otherwise revise these materials. The financial analysis in this presentation is complex and is not necessarily susceptible to a partial analysis or summary description. In performing this financial analysis, Centerview has considered the results of its analysis as a whole and did not necessarily attribute a particular weight to any particular portion of the analysis considered. Furthermore, selecting any portion of Centerview’s analysis, without considering the analysis as a whole, would create an incomplete view of the process underlying its financial analysis. Centerview may have deemed various assumptions more or less probable than other assumptions, so the reference ranges resulting from any particular portion of the analysis described above should not be taken to be Centerview’s view of the actual value of the Company. These materials and the information contained herein are confidential, were not prepared with a view toward public disclosure, and may not be disclosed publicly or made available to third parties without the prior written consent of Centerview. These materials and any other advice, written or oral, rendered by Centerview are intended solely for the benefit and use of the Special Committee of the Board of Directors of the Company (in its capacity as such) in its consideration of the proposed transaction, and are not for the benefit of, and do not convey any rights or remedies for, any holder of securities of the Company or any other person. Centerview will not be responsible for and has not provided any tax, accounting, actuarial, legal or other specialist advice. These materials are not intended to provide the sole basis for evaluating the proposed transaction, and this presentation does not represent a fairness opinion, recommendation, valuation or opinion of any kind, and is necessarily incomplete and should be viewed solely in conjunction with the oral presentation provided by Centerview. Disclaimer CENTER,VIEW PARTNERS
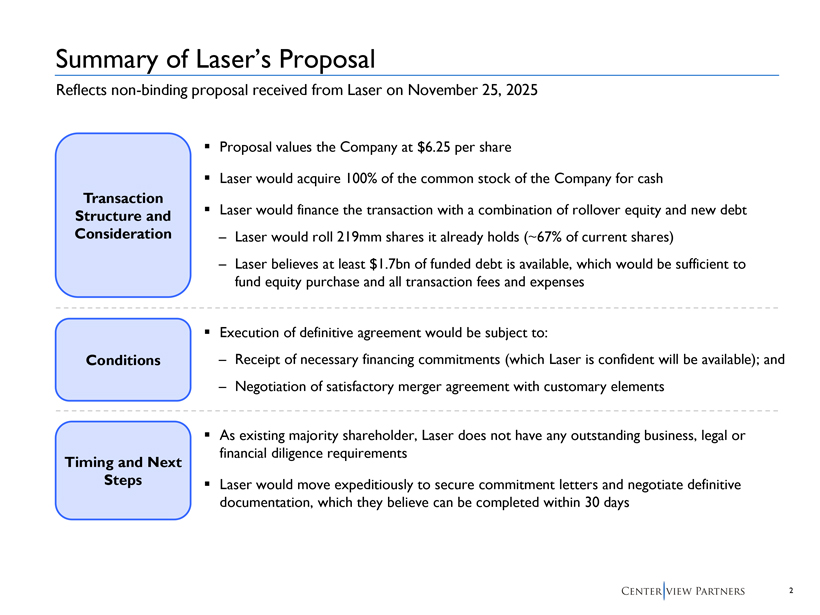
2 Summary of Laser’s Proposal Reflects non-binding proposal received from Laser on November 25, 2025 ▪ Proposal values the Company at $6.25 per share ▪ Laser would acquire 100% of the common stock of the Company for cash ▪ Laser would finance the transaction with a combination of rollover equity and new debt – Laser would roll 219mm shares it already holds (~67% of current shares) – Laser believes at least $1.7bn of funded debt is available, which would be sufficient to fund equity purchase and all transaction fees and expenses Transaction Structure and Consideration ▪ Execution of definitive agreement would be subject to: – Receipt of necessary financing commitments (which Laser is confident will be available); and – Negotiation of satisfactory merger agreement with customary elements Conditions ▪ As existing majority shareholder, Laser does not have any outstanding business, legal or financial diligence requirements ▪ Laser would move expeditiously to secure commitment letters and negotiate definitive documentation, which they believe can be completed within 30 days Timing and Next Steps r \.. CENTER,VIEW PARTNERS
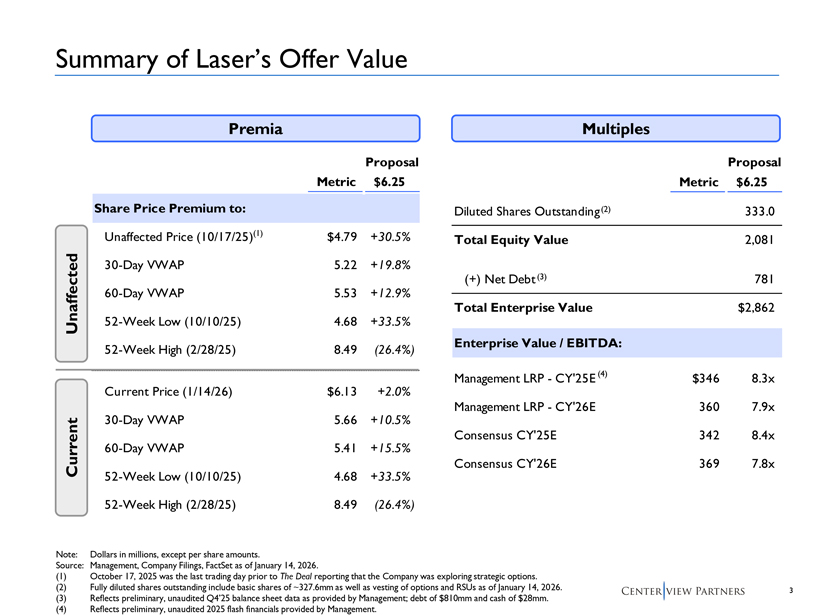
3 Summary of Laser’s Offer Value Note: Dollars in millions, except per share amounts. Source: Management, Company Filings, FactSet as of January 14, 2026. (1) October 17, 2025 was the last trading day prior to The Deal reporting that the Company was exploring strategic options. (2) Fully diluted shares outstanding include basic shares of ~327.6mm as well as vesting of options and RSUs as of January 14, 2026. (3) Reflects preliminary, unaudited Q4’25 balance sheet data as provided by Management; debt of $810mm and cash of $28mm. (4) Reflects preliminary, unaudited 2025 flash financials provided by Management. Multiples Proposal Metric $6.25 Diluted Shares Outstanding 333.0 Total Equity Value 2,081 (+) Net Debt 781 Total Enterprise Value $2,862 Enterprise Value / EBITDA: Management LRP—CY’25E $346 8.3x Management LRP—CY’26E 360 7.9x Consensus CY’25E 342 8.4x Consensus CY’26E 369 7.8x (2) (3) Premia Proposal Metric $6.25 Share Price Premium to: Unaffected Price (10/17/25) $4.79 +30.5% 30-Day VWAP 5.22 +19.8% 60-Day VWAP 5.53 +12.9% 52-Week Low (10/10/25) 4.68 +33.5% 52-Week High (2/28/25) 8.49 (26.4%) Current Price (1/14/26) $6.13 +2.0% 30-Day VWAP 5.66 +10.5% 60-Day VWAP 5.41 +15.5% 52-Week Low (10/10/25) 4.68 +33.5% 52-Week High (2/28/25) 8.49 (26.4%) (1) Current Unaffected (4) CENTER,VIEW PARTNERS
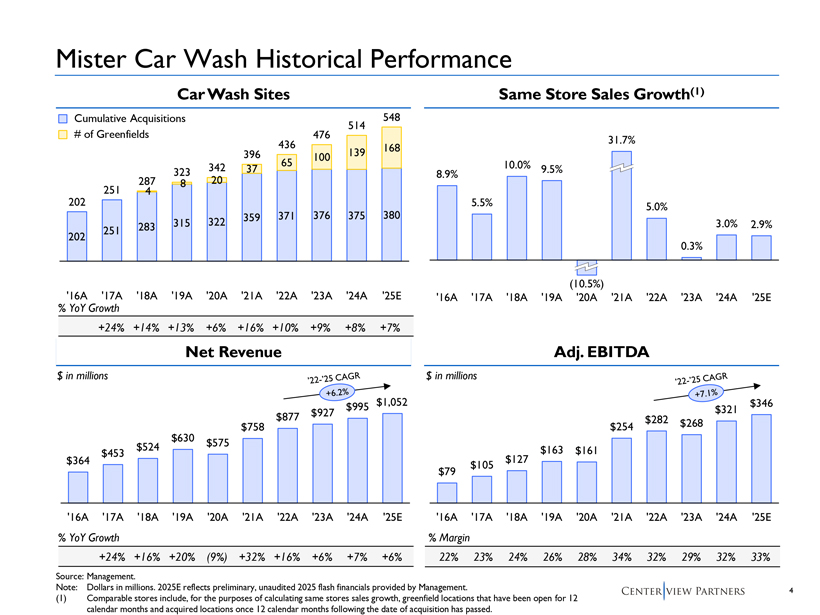
4 $79 $105 $127 $163 $161 $254 $282 $268 $321 $346 ‘16A ‘17A ‘18A ‘19A ‘20A ‘21A ‘22A ‘23A ‘24A ‘25E $364 $453 $524 $630 $575 $758 $877 $927 $995 $1,052 ‘16A ‘17A ‘18A ‘19A ‘20A ‘21A ‘22A ‘23A ‘24A ‘25E 8.9% 5.5% 10.0% 9.5% (10.5%) 31.7% 5.0% 0.3% 3.0% 2.9% ‘16A ‘17A ‘18A ‘19A ‘20A ‘21A ‘22A ‘23A ‘24A ‘25E Net Revenue Mister Car Wash Historical Performance Car Wash Sites Same Store Sales Growth(1) Adj. EBITDA Source: Management. Note: Dollars in millions. 2025E reflects preliminary, unaudited 2025 flash financials provided by Management. (1) Comparable stores include, for the purposes of calculating same stores sales growth, greenfield locations that have been open for 12 calendar months and acquired locations once 12 calendar months following the date of acquisition has passed. $ in millions $ in millions Cumulative Acquisitions # of Greenfields % YoY Growth +24% +14% +13% +6% +16% +10% +9% +8% % YoY Growth +24% +16% +20% (9%) +32% +16% +6% +7% % Margin 22% 23% 24% 26% 28% 34% 32% 29% 32% 202 251 283 315 322 359 371 376 375 380 4 8 20 37 65 100 139 168 202 251 287 323 342 396 436 476 514 548 ‘16A ‘17A ‘18A ‘19A ‘20A ‘21A ‘22A ‘23A ‘24A ‘25E +6% 33% +7% □ ~ □ ~ ~ ~ ~ •- ,_ ,_ ,_ .- ~ = •— ~ ~ ‘11-‘15 CAGR ~ CENTER,VIEW PARTNERS
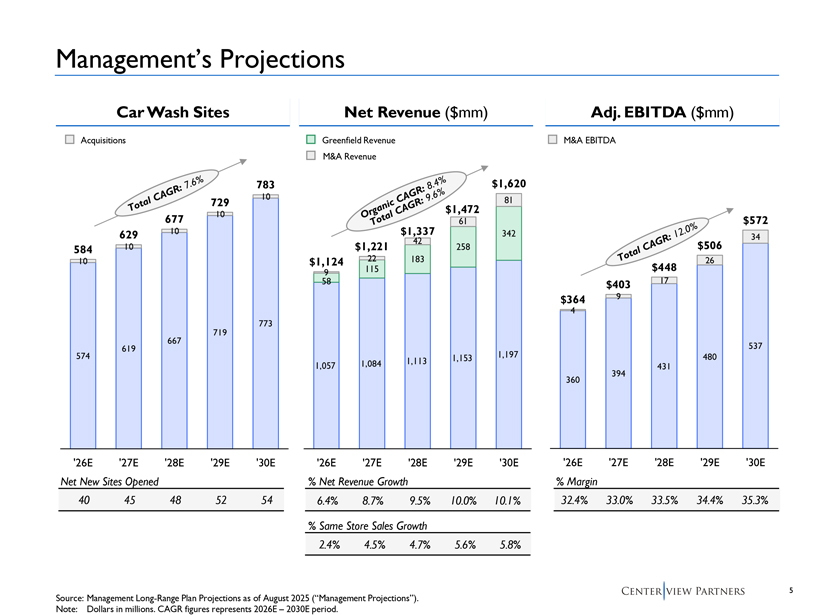
5 1,057 1,084 1,113 1,153 1,197 58 115 183 258 342 9 22 42 61 81 $1,124 $1,221 $1,337 $1,472 $1,620 ‘26E ‘27E ‘28E ‘29E ‘30E 574 619 667 719 773 10 10 10 10 10 584 629 677 729 783 ‘26E ‘27E ‘28E ‘29E ‘30E 360 394 431 480 537 4 9 17 26 34 $364 $403 $448 $506 $572 ‘26E ‘27E ‘28E ‘29E ‘30E Management’s Projections Car Wash Sites Net Revenue ($mm) Adj. EBITDA ($mm) Acquisitions Source: Management Long-Range Plan Projections as of August 2025 (“Management Projections”). Note: Dollars in millions. CAGR figures represents 2026E – 2030E period. 6.4% 8.7% 9.5% 10.0% 10.1% M&A Revenue Greenfield Revenue 2.4% 4.5% 4.7% 5.6% 5.8% 40 45 48 52 54 Net New Sites Opened % Net Revenue Growth 32.4% 33.0% 33.5% 34.4% 35.3% % Margin % Same Store Sales Growth □ □ M&A EBITDA □ □ CENTER,VIEW PARTNERS
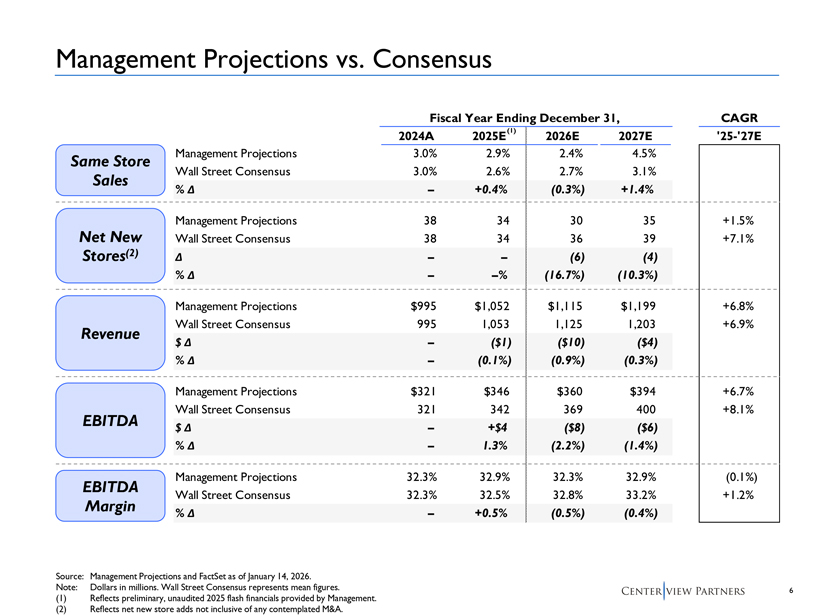
6 Fiscal Year Ending December 31, CAGR 2024A 2025E 2026E 2027E ‘25-‘27E Management Projections 3.0% 2.9% 2.4% 4.5% Wall Street Consensus 3.0% 2.6% 2.7% 3.1% % Δ – +0.4% (0.3%) +1.4% Management Projections 38 34 30 35 +1.5% Wall Street Consensus 38 34 36 39 +7.1% Δ – – (6) (4) % Δ – –% (16.7%) (10.3%) Management Projections $995 $1,052 $1,115 $1,199 +6.8% Wall Street Consensus 995 1,053 1,125 1,203 +6.9% $ Δ – ($1) ($10) ($4) % Δ – (0.1%) (0.9%) (0.3%) Management Projections $321 $346 $360 $394 +6.7% Wall Street Consensus 321 342 369 400 +8.1% $ Δ – +$4 ($8) ($6) % Δ – 1.3% (2.2%) (1.4%) Management Projections 32.3% 32.9% 32.3% 32.9% (0.1%) Wall Street Consensus 32.3% 32.5% 32.8% 33.2% +1.2% % Δ – +0.5% (0.5%) (0.4%) Management Projections vs. Consensus Same Store Sales Net New Stores(2) Revenue EBITDA EBITDA Margin Source: Management Projections and FactSet as of January 14, 2026. Note: Dollars in millions. Wall Street Consensus represents mean figures. (1) Reflects preliminary, unaudited 2025 flash financials provided by Management. (2) Reflects net new store adds not inclusive of any contemplated M&A. (1) [ ________ ] [ ________ ] CENTER,VIEW PARTNERS
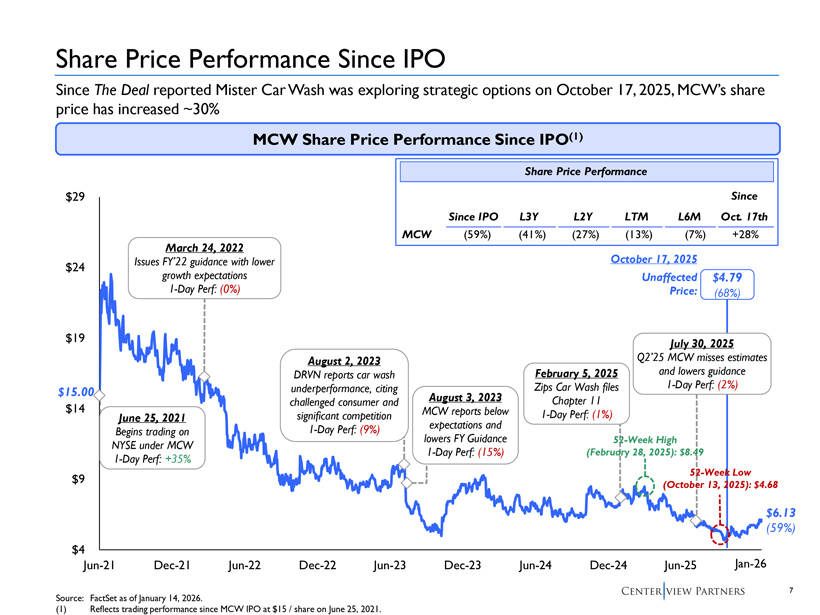
7 $4 $9 $14 $19 $24 $29 Jun-21 Dec-21 Jun-22 Dec-22 Jun-23 Dec-23 Jun-24 Dec-24 Jun-25 Dec-25 Share Price Performance Since IPO Since The Deal reported Mister Car Wash was exploring strategic options on October 17, 2025, MCW’s share price has increased ~30% October 17, 2025 Unaffected Price: $15.00 $6.13 (59%) $4.79 (68%) March 24, 2022 Issues FY’22 guidance with lower growth expectations 1-Day Perf: (0%) August 2, 2023 DRVN reports car wash underperformance, citing challenged consumer and significant competition 1-Day Perf: (9%) July 30, 2025 Q2’25 MCW misses estimates and lowers guidance 1-Day Perf: (2%) February 5, 2025 Zips Car Wash files Chapter 11 1-Day Perf: (1%) Source: FactSet as of January 14, 2026. (1) Reflects trading performance since MCW IPO at $15 / share on June 25, 2021. MCW Share Price Performance Since IPO(1) August 3, 2023 MCW reports below expectations and lowers FY Guidance 1-Day Perf: (15%) 52-Week Low (October 13, 2025): $4.68 52-Week High (February 28, 2025): $8.49 June 25, 2021 Begins trading on NYSE under MCW 1-Day Perf: +35% Share Price Performance Since Since IPO L3Y L2Y LTM L6M Oct. 17th MCW (59%) (41%) (27%) (13%) (7%) +28% Jan-26 [———————-] CENTER,VIEW PARTNERS
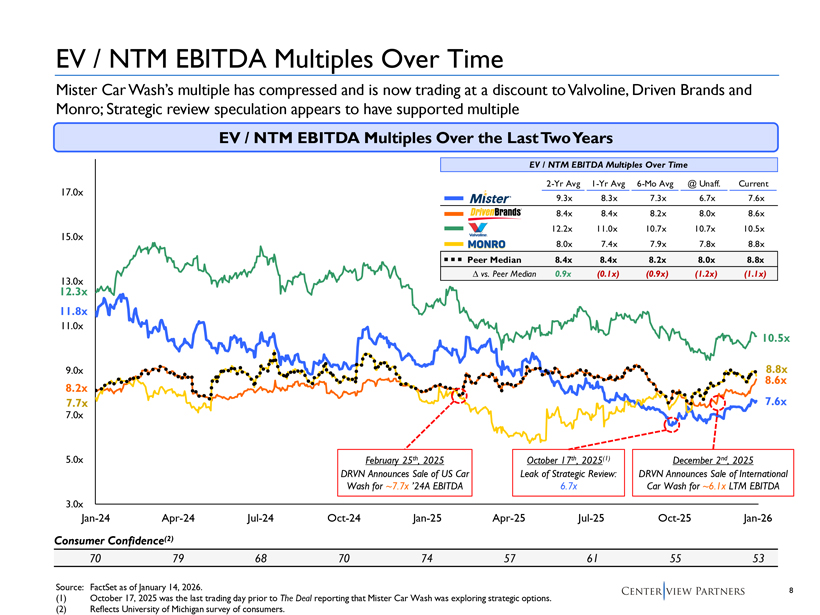
8 3.0x 5.0x 7.0x 9.0x 11.0x 13.0x 15.0x 17.0x Jan-24 Apr-24 Jul-24 Oct-24 Jan-25 Apr-25 Jul-25 Oct-25 Jan-26 EV / NTM EBITDA Multiples Over Time Source: FactSet as of January 14, 2026. (1) October 17, 2025 was the last trading day prior to The Deal reporting that Mister Car Wash was exploring strategic options. (2) Reflects University of Michigan survey of consumers. Mister Car Wash’s multiple has compressed and is now trading at a discount to Valvoline, Driven Brands and Monro; Strategic review speculation appears to have supported multiple 7.6x 8.6x 10.5x 11.8x 8.2x 12.3x October 17th, 2025(1) Leak of Strategic Review: 6.7x EV / NTM EBITDA Multiples Over the Last Two Years February 25th, 2025 DRVN Announces Sale of US Car Wash for ~7.7x ’24A EBITDA Consumer Confidence(2) 70 79 68 70 74 57 61 55 53 December 2nd, 2025 DRVN Announces Sale of International Car Wash for ~6.1x LTM EBITDA 7.7x 8.8x EV / NTM EBITDA Multiples Over Time 2-Yr Avg 1-Yr Avg 6-Mo Avg @ Unaff. Current 9.3x 8.3x 7.3x 6.7x 7.6x 8.4x 8.4x 8.2x 8.0x 8.6x 12.2x 11.0x 10.7x 10.7x 10.5x 8.0x 7.4x 7.9x 7.8x 8.8x Peer Median 8.4x 8.4x 8.2x 8.0x 8.8x Δ vs. Peer Median 0.9x (0.1x) (0.9x) (1.2x) (1.1x) - Mister _ a~arands· - v — - MONRO IL___======== 11 ‘’ I’ CENTER,VIEW PARTNERS
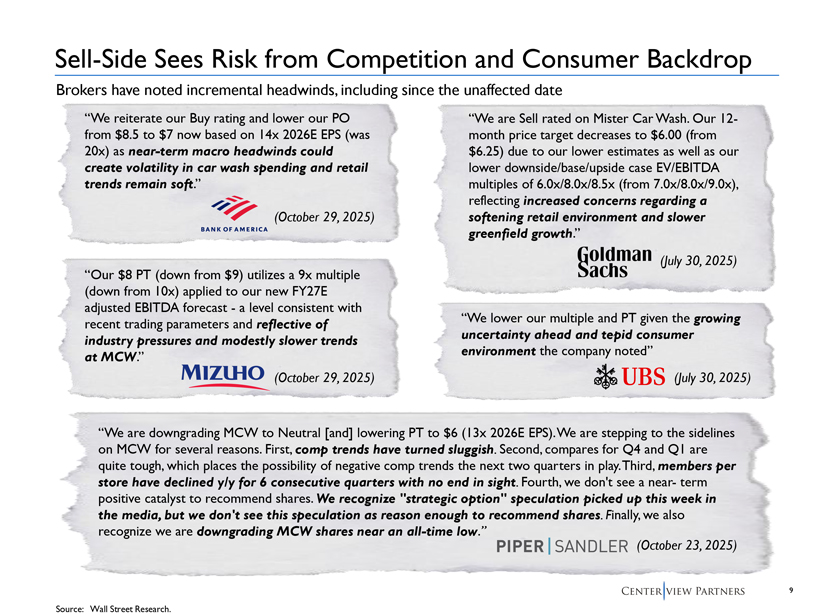
9 Sell-Side Sees Risk from Competition and Consumer Backdrop (October 23, 2025) “We are downgrading MCW to Neutral [and] lowering PT to $6 (13x 2026E EPS). We are stepping to the sidelines on MCW for several reasons. First, comp trends have turned sluggish. Second, compares for Q4 and Q1 are quite tough, which places the possibility of negative comp trends the next two quarters in play. Third, members per store have declined y/y for 6 consecutive quarters with no end in sight. Fourth, we don’t see a near- term positive catalyst to recommend shares. We recognize “strategic option” speculation picked up this week in the media, but we don’t see this speculation as reason enough to recommend shares. Finally, we also recognize we are downgrading MCW shares near an all-time low.” Source: Wall Street Research. “We lower our multiple and PT given the growing uncertainty ahead and tepid consumer environment the company noted” (July 30, 2025) “We are Sell rated on Mister Car Wash. Our 12- month price target decreases to $6.00 (from $6.25) due to our lower estimates as well as our lower downside/base/upside case EV/EBITDA multiples of 6.0x/8.0x/8.5x (from 7.0x/8.0x/9.0x), reflecting increased concerns regarding a softening retail environment and slower greenfield growth.” (July 30, 2025) “Our $8 PT (down from $9) utilizes a 9x multiple (down from 10x) applied to our new FY27E adjusted EBITDA forecast—a level consistent with recent trading parameters and reflective of industry pressures and modestly slower trends at MCW.” (October 29, 2025) (October 29, 2025) “We reiterate our Buy rating and lower our PO from $8.5 to $7 now based on 14x 2026E EPS (was 20x) as near-term macro headwinds could create volatility in car wash spending and retail trends remain soft.” Brokers have noted incremental headwinds, including since the unaffected date BANK OF AMERICA MIZlHO Goldman Sachs $ UBS PIPER I SANDLER CENTER,VIEW PARTNERS
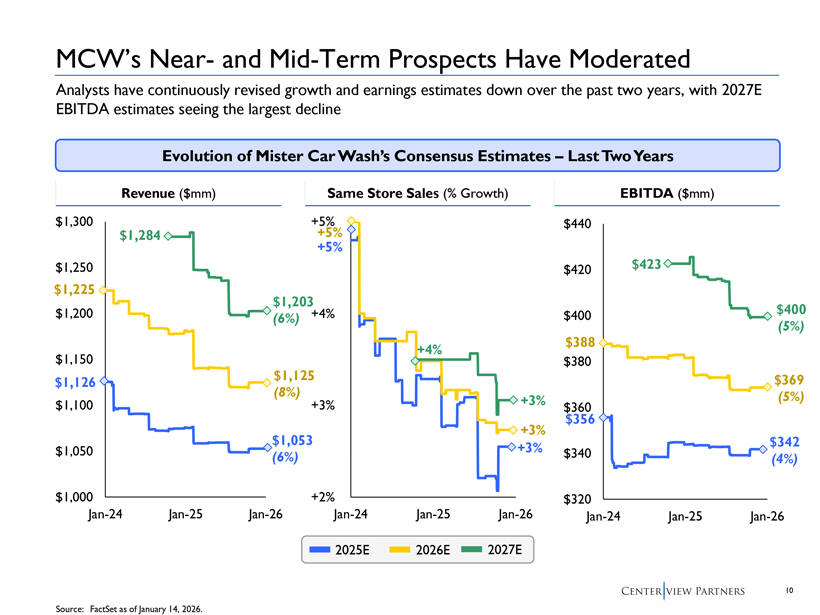
10 +2% +3% +4% +5% Jan-24 Jan-25 Jan-26 $320 $340 $360 $380 $400 $420 $440 Jan-24 Jan-25 Jan-26 MCW’s Near- and Mid-Term Prospects Have Moderated +5% +5% +3% +3% $388 $356 $342 (4%) Evolution of Mister Car Wash’s Consensus Estimates – Last Two Years Analysts have continuously revised growth and earnings estimates down over the past two years, with 2027E EBITDA estimates seeing the largest decline 2025E 2026E 2027E $423 $369 (5%) $400 (5%) +4% +3% Source: FactSet as of January 14, 2026. Revenue ($mm) Same Store Sales (% Growth) EBITDA ($mm) $1,000 $1,050 $1,100 $1,150 $1,200 $1,250 $1,300 Jan-24 Jan-25 Jan-26 $1,053 (6%) $1,125 (8%) $1,203 (6%) $1,284 $1,225 $1,126 [— - CENTER,VIEW PARTNERS
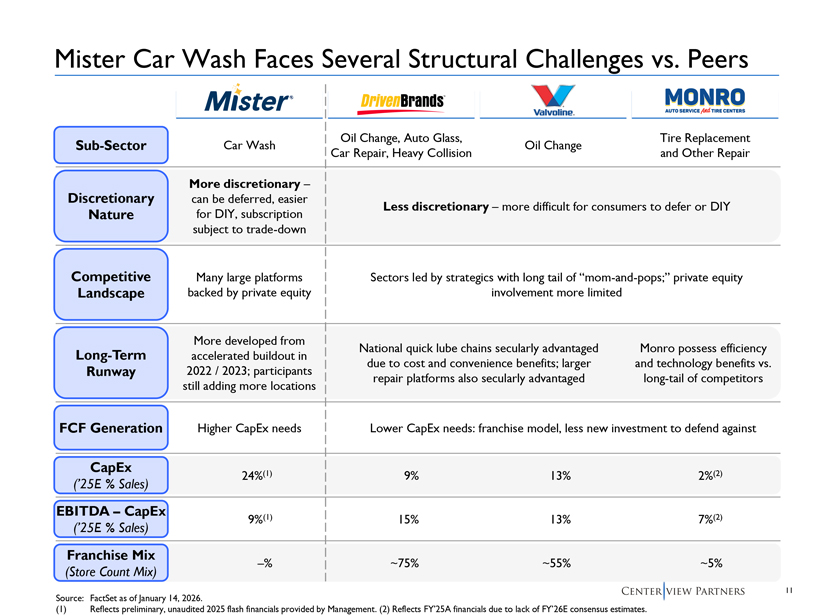
11 Mister Car Wash Faces Several Structural Challenges vs. Peers Discretionary Nature Competitive Landscape FCF Generation Long-Term Runway Many large platforms backed by private equity More discretionary – can be deferred, easier for DIY, subscription subject to trade-down Higher CapEx needs More developed from accelerated buildout in 2022 / 2023; participants still adding more locations Sectors led by strategics with long tail of “mom-and-pops;” private equity involvement more limited CapEx (’25E % Sales) Franchise Mix (Store Count Mix) 24%(1) –% ~75% ~55% Source: FactSet as of January 14, 2026. (1) Reflects preliminary, unaudited 2025 flash financials provided by Management. (2) Reflects FY’25A financials due to lack of FY’26E consensus estimates. Less discretionary – more difficult for consumers to defer or DIY Lower CapEx needs: franchise model, less new investment to defend against National quick lube chains secularly advantaged due to cost and convenience benefits; larger repair platforms also secularly advantaged Sub-Sector Car Wash Oil Change, Auto Glass, Car Repair, Heavy Collision Oil Change EBITDA – CapEx (’25E % Sales) 9%(1) Tire Replacement and Other Repair Monro possess efficiency and technology benefits vs. long-tail of competitors 2%(2) ~5% 7%(2) 9% 13% 15% 13% [ , \. , I,. r ( ( ( ( ] “I ~ ‘I ~ ) l l l i I Mister® :IL ~ l~rir~en:::B:=ra=nd=s-·_ Vatvollne. ~2.!t!2 I , __ _____:,,;=:..:::.;_ __ ———- 1 I I I I I I I I ‘ T CENTER,VIEW PARTNERS
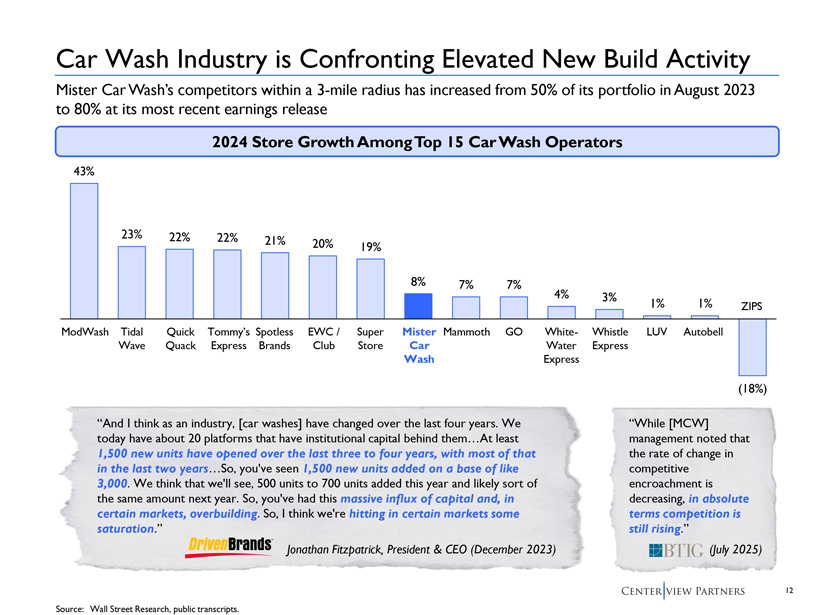
12 43% 23% 22% 22% 21% 20% 19% 8% 7% 7% 4% 3% 1% 1% (18%) Car Wash Industry is Confronting Elevated New Build Activity Source: Wall Street Research, public transcripts. 2024 Store Growth Among Top 15 Car Wash Operators Mister Car Wash’s competitors within a 3-mile radius has increased from 50% of its portfolio in August 2023 to 80% at its most recent earnings release “And I think as an industry, [car washes] have changed over the last four years. We today have about 20 platforms that have institutional capital behind them…At least 1,500 new units have opened over the last three to four years, with most of that in the last two years…So, you’ve seen 1,500 new units added on a base of like 3,000. We think that we’ll see, 500 units to 700 units added this year and likely sort of the same amount next year. So, you’ve had this massive influx of capital and, in certain markets, overbuilding. So, I think we’re hitting in certain markets some saturation.” “While [MCW] management noted that the rate of change in competitive encroachment is decreasing, in absolute terms competition is still rising.” Jonathan Fitzpatrick, President & CEO (December 2023) ModWash Tidal Wave Quick Quack Tommy’s Express Spotless Brands EWC / Club Super Store Mister Car Wash Mammoth GO White- Water Express Whistle Express LUV Autobell ZIPS IIBTIG (July 2025) CENTER,VIEW PARTNERS
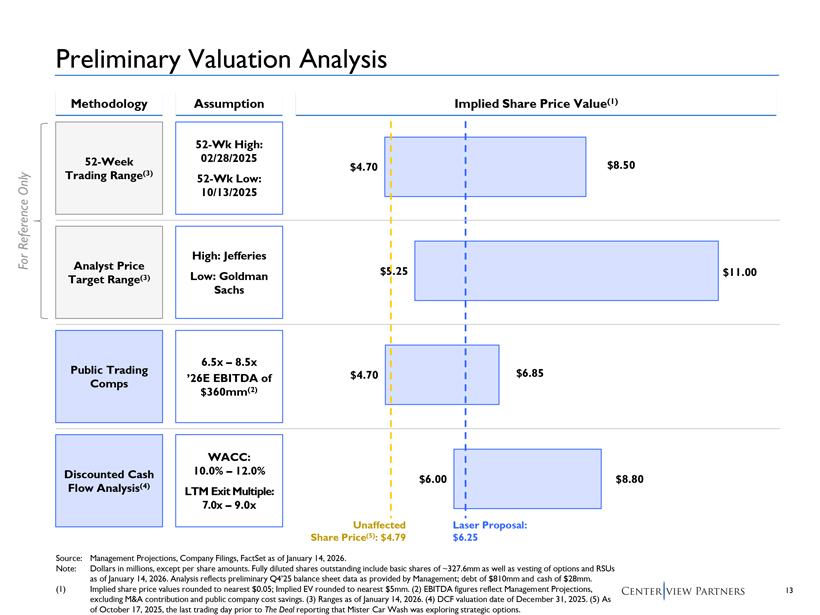
13 $4.70 $5.25 $4.70 $6.00 $8.50 $11.00 $6.85 $8.80 Preliminary Valuation Analysis Methodology Assumption Implied Share Price Value(1) Source: Management Projections, Company Filings, FactSet as of January 14, 2026. Note: Dollars in millions, except per share amounts. Fully diluted shares outstanding include basic shares of ~327.6mm as well as vesting of options and RSUs as of January 14, 2026. Analysis reflects preliminary Q4’25 balance sheet data as provided by Management; debt of $810mm and cash of $28mm. (1) Implied share price values rounded to nearest $0.05; Implied EV rounded to nearest $5mm. (2) EBITDA figures reflect Management Projections, excluding M&A contribution and public company cost savings. (3) Ranges as of January 14, 2026. (4) DCF valuation date of December 31, 2025. (5) As of October 17, 2025, the last trading day prior to The Deal reporting that Mister Car Wash was exploring strategic options. 52-Wk High: 02/28/2025 52-Wk Low: 10/13/2025 High: Jefferies Low: Goldman Sachs 6.5x – 8.5x ’26E EBITDA of $360mm(2) WACC: 10.0% – 12.0% LTM Exit Multiple: 7.0x – 9.0x Laser Proposal: $6.25 For Reference Only Unaffected Share Price(5): $4.79 52-Week Trading Range(3) Analyst Price Target Range(3) Public Trading Comps Discounted Cash Flow Analysis(4) I I [ ! I I I I I !. ‘—.—+——--I!- CENTER,VIEW PARTNERS
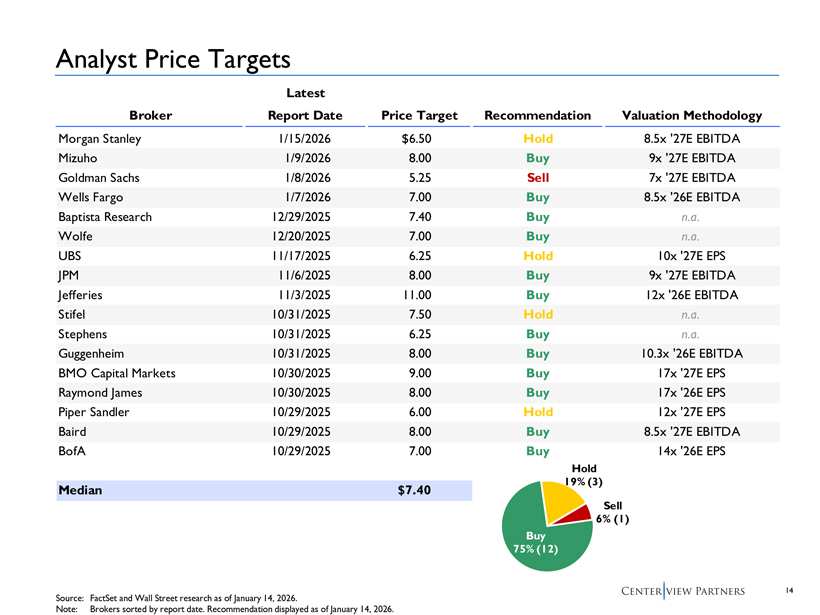
14 Analyst Price Targets Source: FactSet and Wall Street research as of January 14, 2026. Note: Brokers sorted by report date. Recommendation displayed as of January 14, 2026. Latest Broker Report Date Price Target Recommendation Valuation Methodology Morgan Stanley 1/15/2026 $6.50 Hold 8.5x ‘27E EBITDA Mizuho 1/9/2026 8.00 Buy 9x ‘27E EBITDA Goldman Sachs 1/8/2026 5.25 Sell 7x ‘27E EBITDA Wells Fargo 1/7/2026 7.00 Buy 8.5x ‘26E EBITDA Baptista Research 12/29/2025 7.40 Buy n.a. Wolfe 12/20/2025 7.00 Buy n.a. UBS 11/17/2025 6.25 Hold 10x ‘27E EPS JPM 11/6/2025 8.00 Buy 9x ‘27E EBITDA Jefferies 11/3/2025 11.00 Buy 12x ‘26E EBITDA Stifel 10/31/2025 7.50 Hold n.a. Stephens 10/31/2025 6.25 Buy n.a. Guggenheim 10/31/2025 8.00 Buy 10.3x ‘26E EBITDA BMO Capital Markets 10/30/2025 9.00 Buy 17x ‘27E EPS Raymond James 10/30/2025 8.00 Buy 17x ‘26E EPS Piper Sandler 10/29/2025 6.00 Hold 12x ‘27E EPS Baird 10/29/2025 8.00 Buy 8.5x ‘27E EBITDA BofA 10/29/2025 7.00 Buy 14x ‘26E EPS Median $7.40 Buy 75% (12) Hold 19% (3) Sell 6% (1) CENTER,VIEW PARTNERS
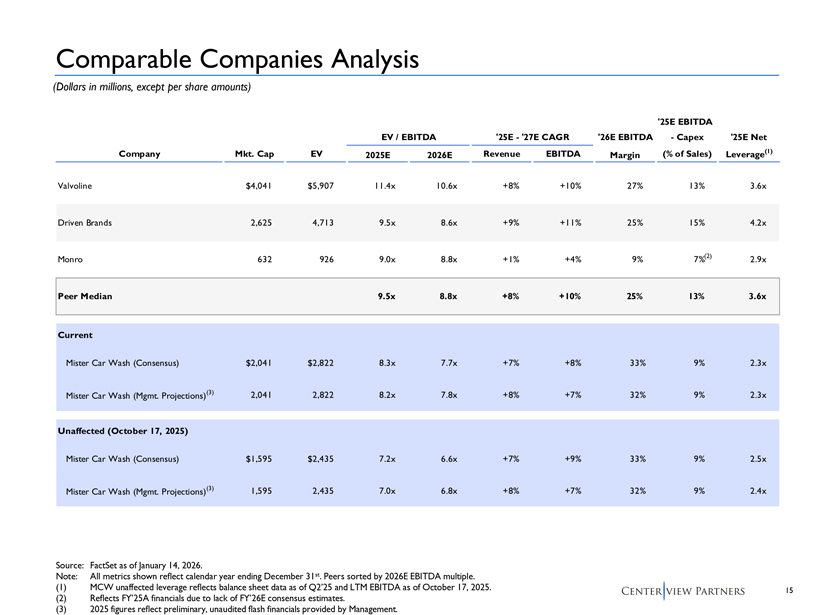
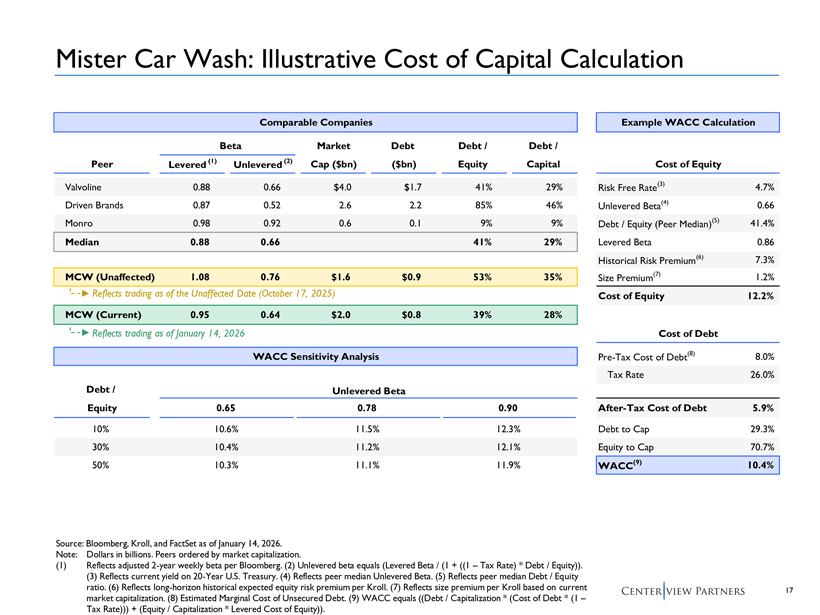
15 ‘25E EBITDA EV / EBITDA ‘25E—‘27E CAGR ‘26E EBITDA—Capex ‘25E Net Company Mkt. Cap EV 2025E 2026E Revenue EBITDA Margin (% of Sales) Leverage(1) Valvoline $4,041 $5,907 11.4x 10.6x +8% +10% 27% 13% 3.6x Driven Brands 2,625 4,713 9.5x 8.6x +9% +11% 25% 15% 4.2x Monro 632 926 9.0x 8.8x +1% +4% 9% 7% 2.9x Peer Median 9.5x 8.8x +8% +10% 25% 13% 3.6x Current Mister Car Wash (Consensus) $2,041 $2,822 8.3x 7.7x +7% +8% 33% 9% 2.3x Mister Car Wash (Mgmt. Projections)(3) 2,041 2,822 8.2x 7.8x +8% +7% 32% 9% 2.3x Unaffected (October 17, 2025) Mister Car Wash (Consensus) $1,595 $2,435 7.2x 6.6x +7% +9% 33% 9% 2.5x Mister Car Wash (Mgmt. Projections)(3) 1,595 2,435 7.0x 6.8x +8% +7% 32% 9% 2.4x Comparable Companies Analysis Source: FactSet as of January 14, 2026. Note: All metrics shown reflect calendar year ending December 31st. Peers sorted by 2026E EBITDA multiple. (1) MCW unaffected leverage reflects balance sheet data as of Q2’25 and LTM EBITDA as of October 17, 2025. (2) Reflects FY’25A financials due to lack of FY’26E consensus estimates. (3) 2025 figures reflect preliminary, unaudited flash financials provided by Management. (Dollars in millions, except per share amounts) (2) CENTER,VIEW PARTNERS
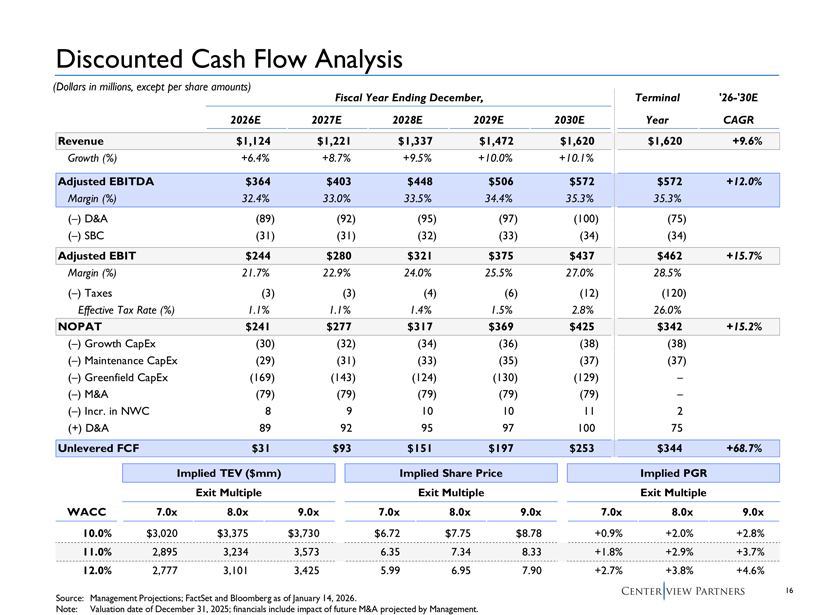
16 Discounted Cash Flow Analysis Fiscal Year Ending December, Terminal ‘26-‘30E 2026E 2027E 2028E 2029E 2030E Year CAGR Revenue $1,124 $1,221 $1,337 $1,472 $1,620 $1,620 +9.6% Growth (%) +6.4% +8.7% +9.5% +10.0% +10.1% Adjusted EBITDA $364 $403 $448 $506 $572 $572 +12.0% Margin (%) 32.4% 33.0% 33.5% 34.4% 35.3% 35.3% (–) D&A (89) (92) (95) (97) (100) (75) (–) SBC (31) (31) (32) (33) (34) (34) Adjusted EBIT $244 $280 $321 $375 $437 $462 +15.7% Margin (%) 21.7% 22.9% 24.0% 25.5% 27.0% 28.5% (–) Taxes (3) (3) (4) (6) (12) (120) Effective Tax Rate (%) 1.1% 1.1% 1.4% 1.5% 2.8% 26.0% NOPAT $241 $277 $317 $369 $425 $342 +15.2% (–) Growth CapEx (30) (32) (34) (36) (38) (38) (–) Maintenance CapEx (29) (31) (33) (35) (37) (37) (–) Greenfield CapEx (169) (143) (124) (130) (129) – (–) M&A (79) (79) (79) (79) (79) – (–) Incr. in NWC 8 9 10 10 11 2 (+) D&A 89 92 95 97 100 75 Unlevered FCF $31 $93 $151 $197 $253 $344 +68.7% Source: Management Projections; FactSet and Bloomberg as of January 14, 2026. Note: Valuation date of December 31, 2025; financials include impact of future M&A projected by Management. Implied TEV ($mm) Implied Share Price Implied PGR Exit Multiple Exit Multiple Exit Multiple WACC 7.0x 8.0x 9.0x 7.0x 8.0x 9.0x 7.0x 8.0x 9.0x 10.0% $3,020 $3,375 $3,730 $6.72 $7.75 $8.78 +0.9% +2.0% +2.8% 11.0% 2,895 3,234 3,573 6.35 7.34 8.33 +1.8% +2.9% +3.7% 12.0% 2,777 3,101 3,425 5.99 6.95 7.90 +2.7% +3.8% +4.6% (Dollars in millions, except per share amounts) CENTER,VIEW PARTNERS