Exhibit (c)(5)

January 16, 2026 Project Boson Discussion Materials for the Special Committee STRICTLY PRIVATE & CONFIDENTIAL — BofA SECURITIES~~
Exhibit (c)(5)
January 16, 2026 Project Boson Discussion Materials for the Special Committee STRICTLY PRIVATE & CONFIDENTIAL — BofA SECURITIES~~
These materials have been prepared by one or more affiliates of Bank of America Corporation (“BAC” and, together with its affiliates, the “BAC Group”) for the client or potential client to whom these materials are directly addressed and delivered (the “Company”) for discussion purposes only in connection with an actual or potential mandate or engagement and remain subject to verification and to our further review and assessment from, inter alia, a legal, tax, compliance, accounting policy and risk perspective, as appropriate. These materials were designed for discussion with and consideration by specific persons familiar with the business and affairs of the Company and are being furnished and should be considered only when taken together with any other information, oral or written, provided by us in connection herewith. These materials are not intended to provide the sole basis for evaluating, and should not be considered as, and are not intended to provide, any advice, recommendation or formal opinion with respect to, any transaction or any financial, strategic, business or other matter and do not constitute an offer or solicitation to sell or purchase any securities, nor do they constitute a commitment by BAC or any of its affiliates to provide, arrange, bookrun, underwrite or syndicate any financing for any transaction, to market, offer, place, sell, underwrite or purchase any security or to otherwise enter into any type of business relationship in connection herewith. None of BAC or its affiliates has provided or will provide legal, tax, compliance, accounting or risk advice to the Company or any recipient of these materials. These materials are not intended to provide any such advice or any consulting, rating agency or environmental, social and governance and sustainability (“ESG”) advice or ESG rating agency advice, nor are any materials provided by us intended to identify, evaluate or advise you as to any potential legal, reputational, regulatory compliance or other risks or as to the fairness, accuracy or completeness of your or any other party’s public disclosure. The information and any examples provided are illustrative, may not be reflected in the product or service you receive from BAC, and have not been evaluated or verified for effectiveness, quality, accuracy, completeness or risk and none of BAC or its affiliates is endorsing any particular approach to ESG, any particular ESG investment strategy or any particular ESG standards, ratings or metrics. These materials are subject to the Company’s own review and assessment from a legal, tax, compliance, accounting policy, financial, strategic, ESG, and risk perspective, as appropriate, and the Company should consult with its own legal, tax, compliance, accounting, financial, and ESG advisors prior to entering any transaction. The BAC Group may be engaged in certain business activities which could have increased investor, client, employee, regulatory scrutiny and/or scrutiny from other parties generally from an ESG perspective. Any ESG assessments or consideration of ESG factors by BAC in the services or information provided to you, will generally be reliant on data received from you or third parties (including ESG data vendors), which may be estimated or only consider certain ESG aspects and at certain points (rather than looking at the entire sustainability profile and actions of the Company/the BAC Group or its value chain). These materials are not intended to be legally binding or to give rise to any legal relationship between the recipient or any other person whatsoever and any person or entity within the BAC Group. No person or entity within the BAC Group will be responsible or liable (whether in tort, contract or otherwise) for any losses or damages, consequential or otherwise, that may be incurred or alleged by any person or entity as a result of these materials, any inaccurate, incomplete or misleading statement, error or omission in these materials, or any transaction (whether entered into or not) relating to or resulting from these materials, and these materials may not be used or relied upon for any purpose, other than as may be specifically agreed with us in writing. We assume no obligation to verify, update, correct or otherwise revise these materials. These materials have not been prepared with a view toward public disclosure (whether under any securities laws or otherwise), are intended solely for review and consideration by the Company, and may not be, in whole or in part, reproduced, disseminated, quoted or referred to, or shown, transmitted, or otherwise given to, any person other than the Company’s authorized representatives, without our prior written consent. These materials are based on information provided by or on behalf of the Company and/or other potential transaction participants, from public sources or otherwise reviewed by us. We assume no responsibility for independent investigation or verification of the information included in these materials (including, without limitation, data from third party suppliers) and have relied on such information being complete and accurate in all material respects. To the extent such information includes estimates and forecasts of future financial performance prepared by or reviewed with the managements of the Company and/or other potential transaction participants or obtained from public sources, we have assumed that such estimates and forecasts have been reasonably prepared on bases reflecting the best currently available estimates and judgments of such management or other parties (or, with respect to estimates and forecasts obtained from public sources, represent reasonable estimates). Any such estimates and forecasts may reflect assumptions and judgments that prove incorrect; there can be no assurance that any estimates or forecasts will be realized. No representation or warranty, express or implied, is made as to the accuracy or completeness of any such information, or of any other information in these materials, and nothing contained herein is, or shall be relied upon as, a representation, warranty or undertaking, whether as to the past, the present or the future. These materials may not reflect information known to other professionals in other business areas of the BAC Group. Any league tables referenced within these materials have been prepared using data sourced from external third-party providers as outlined in the relevant footnotes where applicable. The BAC Group comprises a full service securities firm and commercial bank engaged in securities, commodities and derivatives trading, foreign exchange and other brokerage activities, and principal investing as well as providing investment, corporate and private banking, asset and investment management, financing and strategic advisory services and other commercial services and products to a wide range of corporations, governments and individuals, in the United States and internationally, from which conflicting interests or duties, or a perception thereof, may arise. In the ordinary course of these activities, parts of the BAC Group at any time may invest on a principal basis or manage funds that invest, make or hold long or short positions, finance positions or trade or otherwise effect transactions, for their own accounts or the accounts of customers, in debt, equity or other securities or financial instruments (including derivatives, bank loans or other obligations) of the Company, potential counterparties or any other person that may be involved in a transaction. “Bank of America” and “BofA Securities” are the marketing names used by the Global Banking and Global Markets divisions of BAC. Lending, leasing, equipment finance, merchant services, derivatives and other commercial banking activities, and trading in certain financial instruments, are performed globally by banking affiliates or subsidiaries of BAC, including Bank of America, N.A., Member FDIC, or of the deposit protection scheme, if available, in the relevant jurisdiction, Equal Housing Lender. Trading in securities and financial instruments, and strategic advisory, and other investment banking activities, are performed globally by investment banking affiliates or subsidiaries of BAC (“Investment Banking Affiliates”), including, in the United States, BofA Securities, Inc which is a registered broker-dealer and Member of SIPC, and, in other jurisdictions, by locally registered entities (including Bank of America Europe Designated Activity Company, BofA Securities Europe SA and Merrill Lynch International). BofA Securities, Inc. is registered as a futures commission merchant with the CFTC and a member of the NFA. Bank of America Europe Designated Activity Company is a wholly-owned subsidiary of BAC and is regulated by the Central Bank of Ireland. Products and services that may be referenced in these materials may be provided through one or more affiliates of BAC. Bank of America and BofA Securities entities and branches provide financial services to the clients of Bank of America and BofA Securities and may outsource/delegate the marketing and/or provision of certain services or aspects of services to other branches or members of the BAC Group. Your service provider will remain the entity/branch specified in your onboarding documentation and/or other contractual or marketing documentation even where you communicate with staff that operate from a different entity or branch which is acting for and on behalf of your contractual service provider in their communications with you. Some or all products and services offered by the BAC Group may be unavailable in certain jurisdictions, or may be available only on an offshore and/or reverse solicitation basis, and availability is subject to change without notice. The BAC Group does not perform in any jurisdiction banking activities that are reserved by local law to licensed or approved banks, except in those jurisdictions where its banking affiliates or subsidiaries have procured the necessary licenses or approvals. For those jurisdictions where they are not licensed to perform banking activities, all services/products are conducted on an offshore basis for Latin America and the Caribbean. Some or all of the products may not be available in certain jurisdictions and are subject to change without notice. This document and its content are for information purposes and shall not be interpreted as banking or financial intermediation, business solicitation and/or public offering of any kind. Investment products offered by Investment Banking Affiliates: This document is NOT a research report and is NOT a product of a research department and the material in this communication is not investment research or a research recommendation. This document is not prepared as or intended to be investment advice, and the content is not and should not be considered as investment advice under any circumstances. The BAC Group has adopted policies and guidelines designed to preserve the independence of our research analysts. These policies prohibit employees from, directly or indirectly, offering research coverage, a favorable research rating or a specific price target or offering to change a research rating or price target as consideration for or an inducement to obtain business or other compensation and prohibit research analysts from being directly compensated for involvement in investment banking transactions. The views expressed herein are the views solely of the specific BAC Group line of business providing you with these materials and no inference should be made that the views expressed represent the view of the firm’s research department. Any statements contained herein as to tax matters were neither written nor intended by us to be used and cannot be used by any taxpayer for the purpose of avoiding tax penalties that may be imposed on such taxpayer. If any person uses or refers to any such tax statement in promoting, marketing or recommending a partnership or other entity, investment plan or arrangement to any taxpayer, then the statement expressed herein is being delivered to support the promotion or marketing of the transaction or matter addressed and the recipient should seek advice based on its particular circumstances from an independent tax advisor. Notwithstanding anything that may appear herein or in other materials to the contrary, the Company shall be permitted to disclose the tax treatment and tax structure of a transaction—including any materials, opinions or analyses relating to such tax treatment or tax structure, but without disclosure of identifying information or any non-public commercial or financial information (except to the extent any such information relates to the tax structure or tax treatment)—on and after the earliest to occur of the date of (i) public announcement of discussions relating to such transaction, (ii) public announcement of such transaction or (iii) execution of a definitive agreement (with or without conditions) to enter into such transaction; provided, however, that if such transaction is not consummated for any reason, the provisions of this sentence shall cease to apply. We are required to obtain, verify and record certain information that identifies the Company, which information includes the name and address of the Company and other information that will allow us to identify the Company in accordance, as applicable, with the USA Patriot Act (Title III of Pub. L. 107-56, as amended, which was signed into law October 26, 2001) and such other laws, rules and regulations as applicable within and outside the United States. For more information, including who your contractual service provider is or will be, the terms and conditions that apply to the service(s), and information regarding external third-party data providers and the criteria and methodology used to prepare a league table, please contact your Bank of America or BofA Securities representative or relationship manager. Notice regarding Bank of America or BofA Securities entities outside of the United States: For Bank of America or BofA Securities entities outside the United States, please see additional information via the following link: https://www.bofaml.com/en-us/content/baml-disclaimer.html. Notice regarding Bank of America or BofA Securities entities in the EEA and UK: For Bank of America or BofA Securities entities in the European Economic Area and the United Kingdom, please see additional information via the following link: www.bofaml.com/mifid2. Disclosure regarding BofA Securities Europe SA: BofA Securities Europe SA (“BofASE SA”), with registered address at 51, rue La Boétie, 75008 Paris is registered under n° 842 602 690 RCS Paris. In accordance with the provisions of French Code Monétaire et Financier (Monetary and Financial Code), BofASE SA is an établissement de crédit et d’investissement (credit and investment institution) that is authorised and supervised by the European Central Bank and the Autorité de Contrôle Prudentiel et de Résolution (ACPR) and regulated by the ACPR and the Autorité des Marchés Financiers. BofASE SA’s share capital can be found at www.bofaml.com/BofASEdisclaimer. Notice for Argentina: “Merrill Lynch” is the trademark that Bank of America Corporation uses in the Republic of Argentina for capital markets, financial advisory and investment businesses, which are conducted by and through Merrill Lynch Argentina S.A. This entity does not conduct any activities subject to banking license, such as capturing deposits from the public. Notice for Brazil: Bank of America and BofA Securities’ Ombudsman*| Toll Free: 0800 886 2000 “BofA Securities” is the marketing name of Merrill Lynch S.A. Corretora de Títulos e Valores Mobiliários*, which is a broker-dealer registered in Brazil of Bank of America Corporation. * Bank of America Merrill Lynch Banco Múltiplo S.A. (the banking affiliate in Brazil of Bank of America Corporation) and Merrill Lynch S.A. Corretora de Títulos e Valores Mobiliários (the registered broker dealer in Brazil). Notice for Chile: Bank of America N.A., Oficina de Representacion (Chile), is a representative office in Chile of Bank of America N.A., supervised by the Comisión para el Mercado Financiero and authorized to promote in Chile select products and services that Bank of America N.A. provides outside of Chile. Neither Bank of America, N.A., nor its representative office in Chile, is authorized to carry out in Chile any activities that are reserved by Chilean law to locally licensed banks. Notice for Colombia: Bank of America N.A., Oficina de Representacion (Colombia), is a representative office in Colombia of Bank of America N.A., supervised by the Superintendencia Financiera de Colombia and authorized to promote in Colombia select products and services that Bank of America N.A. and BofA Securities, Inc. provides outside of Colombia. Neither Bank of America, N.A., nor its representative office in Colombia, is authorized to carry out in Colombia any activities that are reserved by Colombian law to locally licensed banks. Notice for Dubai International Financial Centre: Merrill Lynch International is authorised and regulated by the Dubai Financial Services Authority. Principal address is ICD Brookfield Place, Level 46, Dubai International Financial Centre, Dubai, United Arab Emirates. License no. CL0322, P.O. Box 506576, Dubai, United Arab Emirates. This communication is not for distribution to the public or a large number of persons, but is personal to named recipients; it is directed to professional and market customers and not to retail customers. The financial products/financial services to which this marketing material relates is only made available to customers who in the view of Merrill Lynch International meet the regulatory criteria to be a Client under DFSA Conduct of Business rules (COB 2.3). Please note that Merrill Lynch International does not deal with retail clients. Notice for Hong Kong: Bank of America, National Association, Hong Kong Branch, is a branch of a national banking association organized and existing with limited liability under the laws of the United States of America. Notice for Kingdom of Saudi Arabia: This marketing communication is issued and approved by the Merrill Lynch Kingdom of Saudi Arabia Company which is authorised and regulated by the Kingdom of Saudi Arabia Capital Market Authority (“CMA”). Principal address is Kingdom Tower, 22 Floor, 2239 Al-Orouba Road, Olaya, Unit No: 50, Ar Riyadh 12214-9597, Saudi Arabia. This communication includes information given in compliance with the Regulations of the CMA. This communication may not be distributed in the Kingdom of Saudi Arabia except to such persons as are permitted under the regulations issued by the CMA. The CMA does not make any representation as to the accuracy or completeness of this communication, and expressly disclaims any liability whatsoever for any loss arising from, or incurred in reliance upon, any part of this communication. This material is not to be distributed to, nor to be read by, retail clients. Notice for Mexico: Bank of America México, S.A., Institución de Banca Múltiple is a banking affiliate in Mexico of Bank of America Corporation and Merrill Lynch México, S.A. de C.V., Casa de Bolsa is a registered broker dealer affiliate in Mexico of Bank of America Corporation. Bank of America, National Association, Charlotte, Carolina del Norte, Estados Unidos de Norteamérica, Representación en México is a representative office in Mexico of Bank of America, N.A., supervised by the Mexico National Commission on Banking and Securities. Notice for Peru: Bank of America N.A., Oficina de Representacion (Peru), is a representative office in Peru of Bank of America N.A., supervised by the Superintendencia de Banca, Seguros y Administradoras Privadas de Fondos de Pensiones and authorized to promote in Peru select products and services that Bank of America N.A. and its investment banking affiliates provide outside of Peru. Neither Bank of America, N.A., nor its representative office in Peru, is authorized to carry out in Peru any activities that are reserved by Peruvian law to locally licensed banks. Notice for Qatar Financial Centre: Merrill Lynch International (QFC) Branch is licensed by the Qatar Financial Centre Regulatory Authority. Principal address is Tornado Tower, Level 22, West Bay, Doha, Qatar. QFC License no. 00258, P.O. Box 27774, Doha, Qatar. This communication is not for distribution to the public or a large number of persons, but is personal to named recipients; it is directed to eligible counterparty or business customers and not to retail customers. The financial products/financial services to which this marketing material relates is only made available to customers who in the view of Merrill Lynch International (QFC) Branch meet the regulatory criteria to be a Client under QFCRA Customer and Investor Protection Rules 2019. Please note that Merrill Lynch International (QFC) Branch does not deal with retail customers. Bank of America Europe DAC (“BofA Europe”) is a designated activity company limited by shares. It is registered in Ireland with registered number no. 220165 and registered address at Two Park Place, Hatch Street, Dublin 2. BofA Europe is a credit institution and is authorised and supervised by the European Central Bank and the Central Bank of Ireland. BofA Europe is regulated by the Central Bank of Ireland.[List of branches is at https://business.bofa.com/content/dam/boamlimages/documents/articles/ID17_1174/bofaml_entities_list.pdf. Bank of America, N.A. (“BANA”) is a national banking association organised and existing under the laws of the USA with charter number 13044 and with its registered address at 100 North Tryon Street, Charlotte, North Carolina 28202, USA. BANA (member of Federal Deposit Insurance Corporation (FDIC)) is authorised and regulated by the Office of the Comptroller of the Currency, and is subject to the supervision and regulation of the Board of Governors of the Federal Reserve System and the FDIC, each in the USA. BANA has a London branch (“BANA London Branch”) with its principal place of business in the United Kingdom at 2 King Edward Street, London EC1A 1HQ, which is authorised by the Prudential Regulation Authority and subject to regulation by the Financial Conduct Authority and limited regulation by the Prudential Regulation Authority. Details about the extent of BANA London Branch’s regulation by the Prudential Regulation Authority are available from BANA London Branch on request. Notice for Indonesia: Bank of America, National Association, Jakarta Branch (“BANA Jakarta”), is a branch of a national banking association organized and existing with limited liability under the laws of the United States of America. In Indonesia, BANA Jakarta is licensed and under the supervision of the Indonesia Financial Services Authority (“Otoritas Jasa Keuangan” or“OJK”) and Bank Indonesia, and a participant of Deposit Insurance Corporation (“Lembaga Penjamin Simpanan” or “LPS”). PT Merrill Lynch Sekuritas Indonesia is licensed and supervised by OJK. Notice for Philippines: Bank of America, National Association, Manila Branch is regulated by Bangko Sentral ng Pilipinas. https://www.bsp.gov.ph. Deposits are insured by Philippine Deposit Insurance Corporation up to PHP 1,000,000 per depositor, per bank. For queries or concerns, please contact Client Service Team at (+632) 8815-5555 or asia.sseph@ bofa.com. ©2026 Bank of America Corporation. All rights reserved. 1/2026 Confidential Notice to Recipient Are Not FDIC Insured Are Not Bank Guaranteed May Lose Value
Situation Overview 1 Boson Public Markets Perspectives 2 Boson Preliminary Financial Analysis 6 Appendix 14 Table of Contents
Situation Overview 1 Background ▪ On November 25, 2025, LGP has submitted a preliminary proposal to acquire 100% of the common stock of MCW at $6.25 per share Purchase Price ▪ Offer Price: $6.25 per share ▪ Premium to 30-day trailing average price ($5.12 as of 11/24/25): 22% ▪ Premium to unaffected price ($4.79 as of 10/17/25): 30% ▪ Premium to closing price ($5.99 as of 01/13/26): 4% ▪ Equity Value: $2,081mm ▪ Implied Enterprise Value(1): $2,890mm Financing ▪ LGP would finance the transaction with a combination of rollover equity and new debt ▪ Under the proposal, LGP would roll its 219 million shares ▪ LGP believes that at least $1.7bn of funded debt is available to finance this transaction, and would be sufficient to buy out the public shareholders and to pay all related fees and expenses ▪ LGP does not anticipate this transaction will require any additional new equity capital Time to Sign ▪ 30 days Outstanding Diligence & Definitive Documentation ▪ No outstanding diligence given existing ownership ▪ Execution of definitive documentation would be subject to: (a) receipt of financing commitments necessary to complete this transaction (which LGP is confident will be available to them); and (b) negotiation of a satisfactory merger agreement with customary representations, warranties, covenants and conditions contained in acquisitions of public companies ____________________ (1) LGP bid calculated based on Boson net debt balance of $809mm, consisting of Q3 2025A total debt of $845mm and cash & cash equivalents of $36mm as of 9/30/2025.
Boson Public Markets Perspectives
Boson Core Comps (1) Other Reference Comps SP50 L1Y (28.0%) (10.8%) 22.5% 15.4% L2Y (39.4%) (5.9%) 55.5% 40.8% L3Y (51.0%) (28.5%) (34.6%) 68.4% Since IPO (70.5%) (27.1%) (13.9%) 62.7% Summary Performance Boson Core Comps (1) Other Reference Comps SP50 1-Month 6.6% 1.2% 0.6% 2.0% 6-Month (9.5%) (16.4%) 3.3% 11.2% L1Y (15.6%) (5.1%) 7.4% 19.3% Summary Performance 50% 60% 70% 80% 90% 100% 110% 120% 130% 140% Jan-25 Mar-25 Jun-25 Aug-25 Nov-25 Jan-26 0% 60% 120% 180% Jun-21 May-22 Apr-23 Mar-24 Feb-25 Jan-26 Mister Car Wash, Inc. Current Price (1/13/2026) $5.99 52-Week High (2/28/2025) 8.49 52-Week Low (10/13/2025) 4.68 Equity Value $1,994 (–) Cash & Equivalents (36) (+) Debt and Finance Leases 845 (+) NCI — Enterprise Value $2,803 Valuation Metrics CY Period 2025E 2026E 2027E EV / Adj. EBITDA 8.2x 7.6x 7.1x P / E 13.9x 12.7x 11.4x Leverage Ratio 2.3x 2.0x 1.7x 2 Public Market Overview LTM Share Price Performance Boson Public Market Overview (Indexed to 100) (Indexed to 100) Share Price Performance Since IPO (15.6%) +7.4% (5.1%) +19.3% (2) (70.5%) (13.9%) (27.1%) +62.7% (2) ____________________ Source: Company filings and FactSet as of January 13, 2026. Note: Adj. EBITDA figures unburdened for stock-based compensation and reconciled for interest expense, depreciation and amortization expense, gain/loss on sale, acquisition expenses, non-cash rent expense, loss on extinguishment of debt, employee retention credit, and other. Balance sheet as of 3Q25. (1) Peers include Valvoline (VVV) and Driven Brands (DRVN). (2) Peers include O’Reilly (ORLY), Boyd (BYD-CA), Autozone (AZO), Advance Auto Parts (AAP) and Monro (MNRO). Advance Auto Parts had +60% EPS beat in Q2 2025 which resulted in stock price jump. (3) Represents stock price performance during next and current trading session for Q3 earnings and sale leak report, respectively. (4) Valuation metrics based on street consensus. MCW delivered strong Q3’25 earnings, beating SSSg, Sales and Adj. EBITDA consensus estimates +8.5%(3) October 29, 2025 News reports hint at MCW sale amid potential strategic review process +6.5%(3) October 20, 2025 (4)
3 Historical Valuation Overview 5x 10x 15x 20x 25x 30x Jun-21 Mar-22 Dec-22 Oct-23 Jul-24 Apr-25 Jan-26 7.6x 8.8x EV / NTM Adj. EBITDA Since IPO (1) ____________________ Source: FactSet as of January 13, 2026. Note: Adj. EBITDA figures unburdened for stock-based compensation and reconciled for interest expense, depreciation and amortization expense, gain/loss on sale, acquisition expenses, non-cash rent expense, loss on extinguishment of debt, employee retention credit, and other. Figures on this page based on FactSet consensus estimates and using Boson’s reported Q3 net debt. (1) Peers include Valvoline (VVV) and Driven Brands (DRVN). Boson Core Comps Since IPO 12.9x 11.9x L4Y 11.5x 11.5x L3Y 10.0x 11.1x L2Y 9.3x 10.3x L1Y 8.3x 9.8x L6M 7.4x 9.3x L3M 7.1x 8.7x L1M 7.4x 8.6x Summary Averages
6x 13x 20x 27x Dec-21 Oct-22 Aug-23 May-24 Mar-25 Jan-26 4 8.2x 9.7x EV / LTM Adj. EBITDA (1) ____________________ Source: FactSet as of January 13, 2026. Note: LTM data only available up till September 2025 due to lack of actual LTM figures from quarterly releases after September 2025. Adj. EBITDA figures unburdened for stock-based compensation and reconciled for interest expense, depreciation and amortization expense, gain/loss on sale, acquisition expenses, non-cash rent expense, loss on extinguishment of debt, employee retention credit, and other. Figures on this page based on FactSet consensus estimates and using Boson’s reported Q3 net debt. (1) Peers include Valvoline (VVV) and Driven Brands (DRVN). Boson Core Comps Since IPO 12.7x 12.8x L4Y 12.5x 12.3x L3Y 10.8x 11.9x L2Y 10.1x 11.4x L1Y 8.9x 10.6x L6M 7.9x 10.3x L3M 7.6x 9.8x L1M 8.0x 9.6x Summary Averages Historical Valuation Overview (Cont’d)
69% 70% 72% 72% 68% 68% 68% 68% 67% 67% 66% 66% 25% 22% 22% 22% 26% 26% 26% 26% 28% 28% 26% 26% 6% 6% 6% 6% 5% 5% 6% 6% 6% 6% 5% 5% 0.00 4.00 8.00 12.00 0% 20% 40% 60% 80% 100% Feb-25 Mar-25 Apr-25 May-25 Jun-25 Jul-25 Aug-25 Sep-25 Oct-25 Nov-25 Dec-25 Jan-26 Price ($) 8.00 Share Price Target Price Buy Hold Sell 5 Boson Broker’s Outlook ____________________ Source: FactSet as of January 13, 2026. Note: * denotes sort order. Adj. EBITDA figures unburdened for stock-based compensation and reconciled for interest expense, depreciation and amortization expense, gain/loss on sale, acquisition expenses, non-cash rent expense, loss on extinguishment of debt, employee retention credit, and other. (1) Excludes BTIG as they do not report price targets. (2) Based on share price of $5.99 as of January 13, 2026. $5.99 $8.00 Stock FY 2025E FY 2026E Date* Select Brokers Rating Price Target Revenue Adj. EBITDA EPS Revenue Adj. EBITDA EPS 01/08/2026 Mizuho Securities USA Buy $8.00 $1,052 $341 $0.43 $1,126 $367 $0.47 01/06/2026 Wells Fargo Securities Buy $7.00 $1,050 $342 $0.43 $1,112 $364 $0.47 11/6/2025 JP Morgan Buy $8.50 $1,054 $342 $0.42 $1,115 $367 $0.46 10/31/2025 Stifel Nicolaus Hold $7.50 $1,053 $342 $0.43 $1,131 $373 $0.46 10/30/2025 Stephens Buy $6.25 $1,054 $340 $0.43 $1,138 $357 $0.47 10/30/2025 Morgan Stanley Hold $7.50 $1,052 $342 $0.43 $1,122 $371 $0.48 10/30/2025 William Blair Buy $10.00 $1,051 $343 $0.43 $1,128 $372 $0.49 10/30/2025 Jefferies Buy $11.00 $1,054 $342 $0.43 $1,134 $378 $0.50 10/30/2025 BMO Capital Markets Buy $9.00 $1,054 $343 $0.43 $1,135 $364 $0.47 10/30/2025 Guggenheim Securities Buy $8.00 $1,058 $342 — $1,133 $366 $0.41 10/30/2025 Raymond James Buy $8.00 $1,053 $343 $0.43 $1,125 $371 $0.47 10/30/2025 Piper Sandler Companies Hold $6.00 $1,054 $341 $0.43 $1,104 $353 $0.45 10/30/2025 BTIG Hold — $1,051 $342 $0.44 $1,129 $370 $0.51 10/30/2025 Goldman Sachs Sell $5.25 $1,051 $341 $0.42 $1,113 $362 $0.44 10/29/2025 Baird Buy $8.00 $1,052 $341 $0.42 $1,111 $360 $0.52 10/29/2025 UBS Hold $6.25 $1,051 $342 $0.43 $1,130 $406 $0.53 Median $8.00 $1,052 $342 $0.43 $1,128 $367 $0.47 % Upside to Current Share Price 33.6% (1) (1) (2) ==—=-==========================——-=-======== ==-=—_=_ -=_ -=== ==-=-=====——=-=—— =—=—= ==—=== ===============_== _=-== -=— ================
Boson Preliminary Financial Analysis
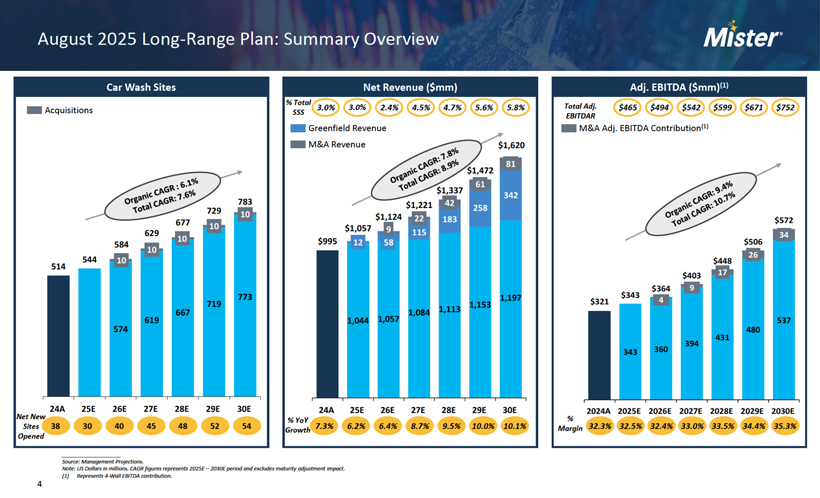
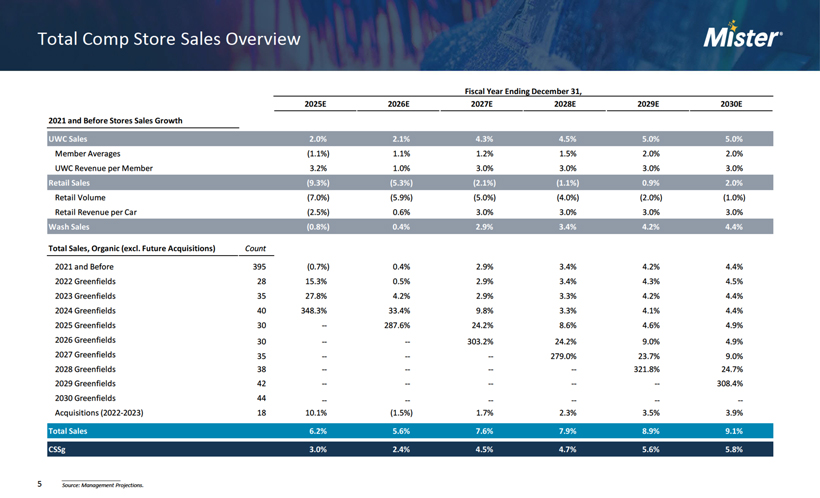
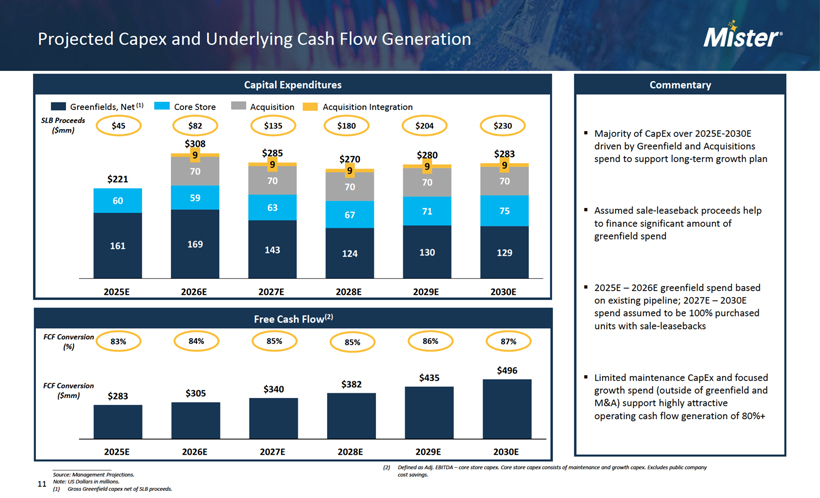
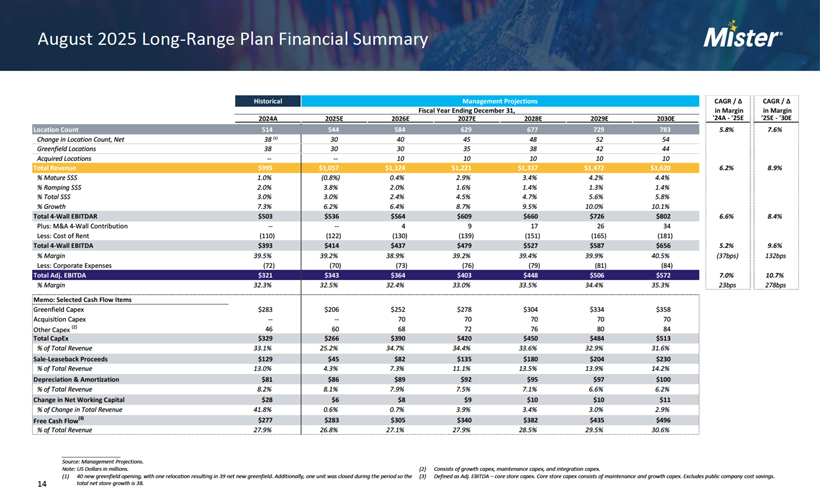
6 Boson Financial Summary Management Projections Historical Management Projections CAGR / Δ CAGR / Δ Fiscal Year Ending December 31, in Margin in Margin 2022A 2023A 2024A 2025E 2026E 2027E 2028E 2029E 2030E ‘22A—‘24A ‘25E—‘30E Location Count 436 476 514 544 584 629 677 729 783 8.6% 7.6% Change in Location Count, Net 40 40 38 30 40 45 48 52 54 Greenfield Locations 28 35 38 30 30 35 38 42 44 Acquired Locations 12 6 -—- 10 10 10 10 10 Total Revenue $877 $927 $995 $1,057 $1,124 $1,221 $1,337 $1,472 $1,620 6.5% 8.9% % Mature SSS 1.0% (0.8%) 0.4% 2.9% 3.4% 4.2% 4.4% % Ramping SSS 2.0% 3.8% 2.0% 1.6% 1.4% 1.3% 1.4% % Total SSS 5.0% 0.3% 3.0% 3.0% 2.4% 4.5% 4.7% 5.6% 5.8% % Growth 15.6% 5.8% 7.3% 6.2% 6.4% 8.7% 9.5% 10.0% 10.1% Total 4-Wall EBITDAR $438 $459 $503 $536 $564 $609 $660 $726 $802 7.2% 8.4% Plus: M&A 4-Wall Contribution — 4 9 17 26 34 Less: Cost of Rent (88) (100) (110) (122) (130) (139) (151) (165) (181) Total 4-Wall EBITDA $350 $358 $393 $414 $437 $479 $527 $587 $656 6.0% 9.6% % Margin 39.9% 38.7% 39.5% 39.2% 38.9% 39.2% 39.4% 39.9% 40.5% (36bps) 132bps Less: Corporate Expenses (68) (73) (72) (70) (73) (76) (79) (81) (84) Total Adj. EBITDA $282 $286 $321 $343 $364 $403 $448 $506 $572 6.7% 10.7% % Margin 32.1% 30.8% 32.3% 32.5% 32.4% 33.0% 33.5% 34.4% 35.3% 13bps 278bps Memo: Selected Cash Flow Items Greenfield Capex $146 $271 $283 $206 $252 $278 $304 $334 $358 Acquisition Purchase Price CapEx -———- 70 70 70 70 70 Other Capex (2) 45 60 46 60 68 72 76 80 84 Total CapEx $192 $331 $329 $266 $390 $420 $450 $484 $513 % of Total Revenue 21.9% 35.7% 33.1% 25.2% 34.7% 34.4% 33.6% 32.9% 31.6% Sale-Leaseback Proceeds $90 $120 $129 $45 $82 $135 $180 $204 $230 % of Total Revenue 10.3% 12.9% 13.0% 4.3% 7.3% 11.1% 13.5% 13.9% 14.2% Depreciation & Amortization (3) $62 $70 $81 $86 $89 $92 $95 $97 $100 % of Total Revenue 7.0% 7.5% 8.2% 8.1% 7.9% 7.5% 7.1% 6.6% 6.2% Change in Net Working Capital $19 $10 $28 $6 $8 $9 $10 $10 $11 % of Change in Total Revenue 16.3% 20.7% 41.8% 9.7% 12.2% 9.1% 8.3% 7.8% 7.7% Free Cash Flow (4) $236 $238 $277 $283 $305 $340 $382 $435 $496 % of Total Revenue 27.0% 25.6% 27.9% 26.8% 27.1% 27.9% 28.5% 29.5% 30.6% ____________________ Source: Boson Management and Public Filings as of September 2025. Boson Management projections. Note: U.S Dollars in millions. Adj. EBITDA figures unburdened for stock-based compensation and reconciled for interest expense, depreciation and amortization expense, gain/loss on sale, acquisition expenses, non-cash rent expense, loss on extinguishment of debt, employee retention credit, and other. (1) 40 new greenfield opening, with one relocation resulting in 39 net new greenfield. Additionally, one unit was closed during the period so the total net store growth is 38. (2) Consists of growth capex, maintenance capex, and integration capex. (3) Represents book Depreciation & Amortization and excludes bonus depreciation. (4) Free cash flow calculated as Total Adjusted EBITDA less core store capex. Core store capex consists of maintenance and growth capex. 2022 core store capex assumed equal to other capex. (1) ——-7 I II II II II 11 II II II 11 II II II II II 11 II II II II II II II II II 11 II II II 11 II II II II II II 11 II II II 11 II 11 II II II II 11 II II II II II 11 II II II II II II II ——-7 I I I I I I I J L ________ _
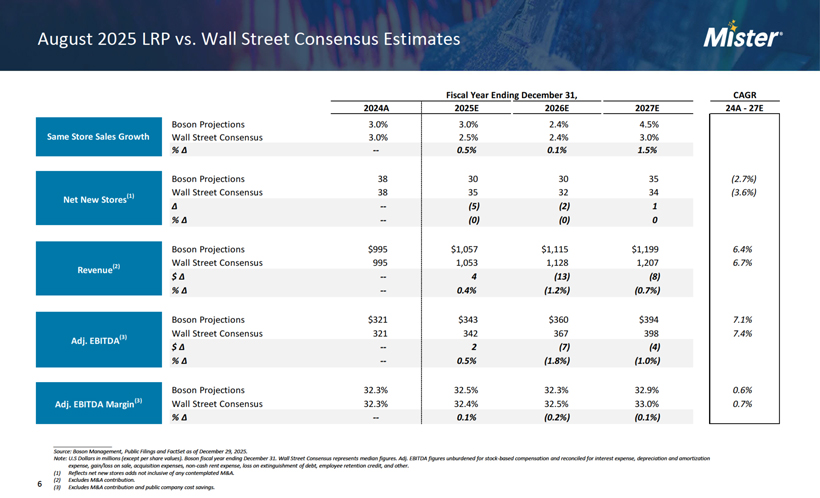
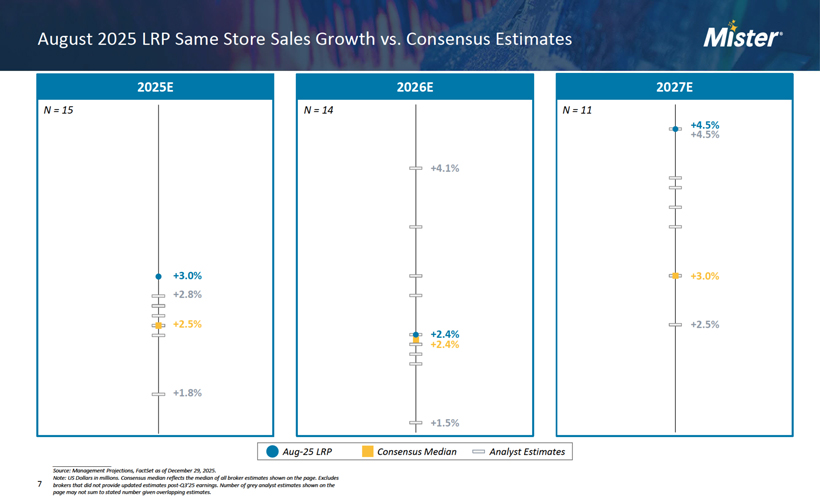
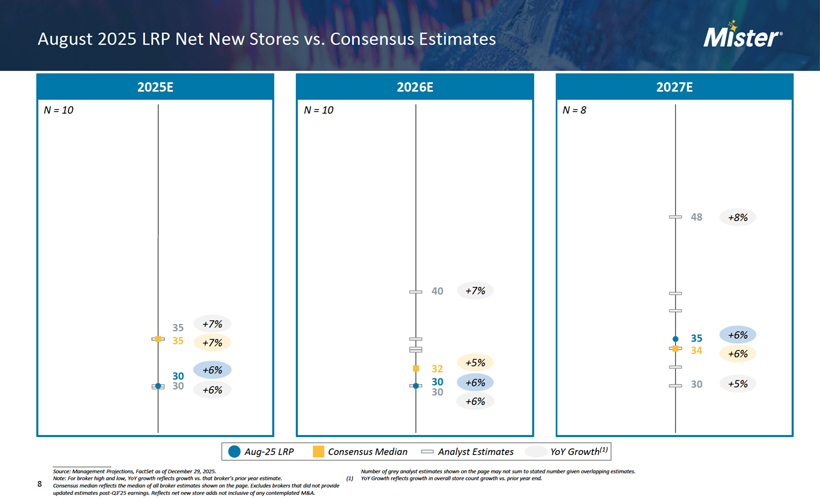
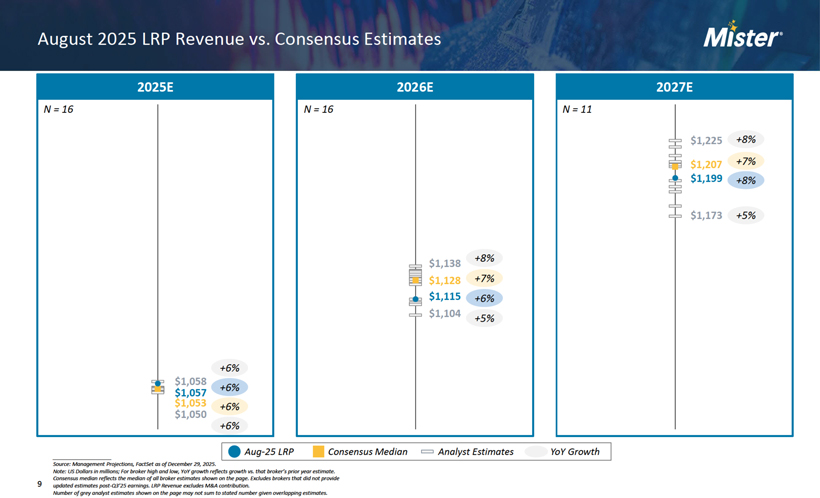
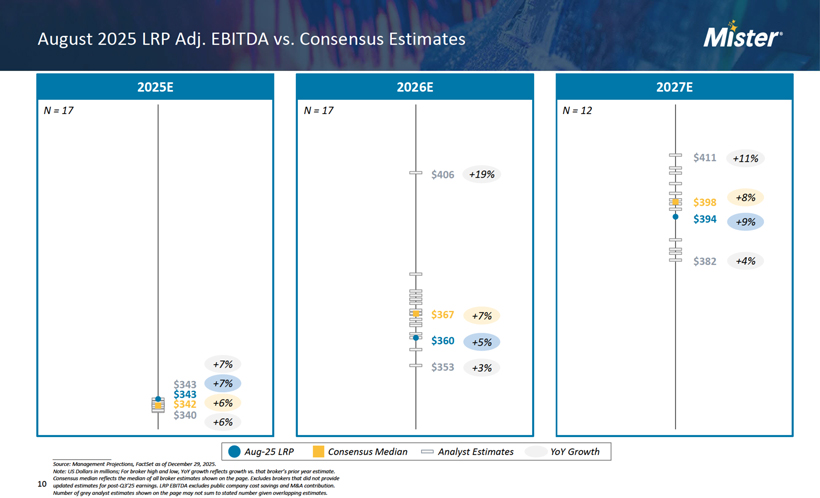
7 Management Case vs. Wall Street Consensus Estimates Fiscal Year Ending December 31, CAGR 2024A 2025E 2026E 2027E 24A—27E Boson Projections 3.0% 3.0% 2.4% 4.5% Wall Street Consensus 3.0% 2.5% 2.4% 3.0% % Δ — 0.5% 0.1% 1.5% Boson Projections 38 30 30 35 (2.7%) Wall Street Consensus 38 35 32 34 (3.6%) Δ — (5) (2) 1 % Δ — (0) (0) 0 Boson Projections $995 $1,057 $1,115 $1,199 6.4% Wall Street Consensus 995 1,053 1,128 1,207 6.7% $ Δ — 4 (13) (8) % Δ — 0.4% (1.2%) (0.7%) Boson Projections $321 $343 $360 $394 7.1% Wall Street Consensus 321 342 367 398 7.4% $ Δ — 2 (7) (4) % Δ — 0.5% (1.8%) (1.0%) Boson Projections 32.3% 32.5% 32.3% 32.9% 0.6% Wall Street Consensus 32.3% 32.4% 32.5% 33.0% 0.7% % Δ — 0.1% (0.2%) (0.1%) Adj. EBITDA Margin(2) Same Store Sales Growth Revenue (2) Adj. EBITDA(2) Net New Stores (1) ____________________ Source: Boson Management, Public Filings and FactSet as of December 29, 2025. Note: U.S Dollars in millions (except per share values). Boson fiscal year ending December 31. Wall Street Consensus represents mean figures. Adj. EBITDA figures unburdened for stock-based compensation and reconciled for interest expense, depreciation and amortization expense, gain/loss on sale, acquisition expenses, non-cash rent expense, loss on extinguishment of debt, employee retention credit, and other. (1) Reflects net new stores adds not inclusive of any contemplated M&A. (2) Excludes M&A contribution.
8 Boson Analysis at Various Prices ____________________ Source: Boson Management, Public Filings as of September 2025 and FactSet as of January 13, 2026. Note: U.S Dollars in millions (except per share values). Boson fiscal year ending December 31. Adj. EBITDA figures unburdened for stock-based compensation and reconciled for interest expense, depreciation and amortization expense, gain/loss on sale, acquisition expenses, non-cash rent expense, loss on extinguishment of debt, employee retention credit, and other. (1) Unaffected date as of October 17, 2025. (2) Based on closing price over the past 52 weeks. (3) Boson fully diluted share count based on 327.568 basic common shares outstanding, 10.506 stock options with a weighted average exercise price of $6.55, and 5.402 RSUs pursuant to the Treasury Stock Method as of 09/30/25. (4) Boson current net debt balance of $781mm based on FY2025A total debt of $810mm and cash & equivalents of $28mm estimates provided on 1/7/2026. Estimates are preliminary, subject to change and represent unaudited financials. (5) As per Boson management projections. Current LGP Offer Boson Share Price $5.99 $6.00 $6.25 $6.50 $6.75 $7.00 $7.25 $7.50 $7.75 Premium / (Discount) to: Metric Unaffected Price(1) $4.79 25.1% 25.3% 30.5% 35.7% 40.9% 46.1% 51.4% 56.6% 61.8% Current Price $5.99 — 0.2% 4.3% 8.5% 12.7% 16.9% 21.0% 25.2% 29.4% 52-Week High (2) $8.49 (29.4%) (29.3%) (26.4%) (23.4%) (20.5%) (17.6%) (14.6%) (11.7%) (8.7%) 52-Week Low (2) $4.68 28.0% 28.2% 33.5% 38.9% 44.2% 49.6% 54.9% 60.3% 65.6% 30-Day VWAP $5.63 6.4% 6.6% 11.0% 15.4% 19.9% 24.3% 28.8% 33.2% 37.6% 90-Day VWAP $5.34 12.2% 12.4% 17.1% 21.8% 26.5% 31.1% 35.8% 40.5% 45.2% Analyst Price Target (Median) $8.00 (25.1%) (25.0%) (21.9%) (18.8%) (15.6%) (12.5%) (9.4%) (6.3%) (3.1%) Implied Equity Value (3) $1,994 $1,998 $2,081 $2,164 $2,250 $2,336 $2,421 $2,507 $2,593 Plus: Net Debt (as of FY25) (4) 781 781 781 781 781 781 781 781 781 Implied Enterprise Value $2,776 $2,779 $2,862 $2,945 $3,031 $3,117 $3,203 $3,288 $3,374 Implied Multiples: Metric (5) FY 2025E 343 8.1 8.1 8.3 8.6 8.8 9.1 9.3 9.6 9.8 FY 2026E 364 7.6 7.6 7.9 8.1 8.3 8.6 8.8 9.0 9.3 EV / Adj. EBITDA
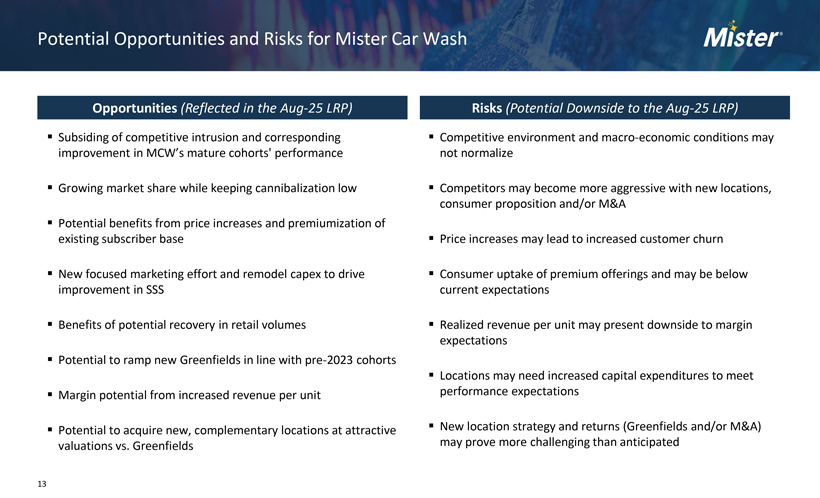
Potential Opportunities and Risks for Mister Car Wash Opportunities (Reflected in the Aug-25 LRP) Risks (Potential Downside to the Aug-25 LRP) ◾ Subsiding of competitive intrusion and corresponding improvement in MCW’s mature cohorts’ performance ◾ Growing market share while keeping cannibalization low ◾ Potential benefits from price increases and premiumization of existing subscriber base ◾ New focused marketing effort and remodel capex to drive improvement in SSS ◾ Benefits of potential recovery in retail volumes ◾ Potential to ramp new Greenfields in line with pre-2023 cohorts ◾ Margin potential from increased revenue per unit ◾ Potential to acquire new, complementary locations at attractive valuations vs. Greenfields ◾ Competitive environment and macro-economic conditions may not normalize ◾ Competitors may become more aggressive with new locations, consumer proposition and/or M&A ◾ Price increases may lead to increased customer churn ◾ Consumer uptake of premium offerings and may be below current expectations ◾ Realized revenue per unit may present downside to margin expectations ◾ Locations may need increased capital expenditures to meet performance expectations ◾ New location strategy and returns (Greenfields and/or M&A) may prove more challenging than anticipated 13 Mister
10 ____________________ Source: Based on public company filings, including most recently filed 10Q and 10K. Estimates per FactSet as of January 13, 2026. Note: * denotes sort order. Enterprise value includes finance leases and excludes operating leases. Metrics represent year ending December. Figures on this page (incl. Boson) based on FactSet consensus estimates. (1) Represents metrics converted from IFRS to GAAP. (2) Adj. EBITDA unburdened for SBC. (3) Adj. EBITDA unburdened for SBC by adding back average CY’23 and CY’24 SBC as % of sales. (4) Adj. EBITDA unburdened for SBC by adding back average CY’24 and CY’25 SBC as % of sales. (5) 2025E SLB proceeds interpolated from historical filings due to no projections available. (6) Represents Gross Capex. (7) NA due to lack of 2026E Capex estimates. (8) Pro forma for Breeze acquisition that closed November 2025. Selected Publicly Traded Companies Benchmarking Valuation Benchmarking Operational Benchmarking Equity Enterprise LTM Stock EV / Adj. EBITDA EV / (EBITDA—Net Capex) P/E Adj. EBITDA Margin Net Leverage Company Value Value Price Δ CY25E CY26E CY25E CY26E * CY 2026E CY26E CY25E $1,994 $2,803 (15.6%) 8.2x 7.6x 15.2x 13.8x 12.7x 32.5% 2.3x 3,997 5,863 (11.2%) 11.5 10.2 15.8 13.6 18.1 27.3% 2.5x 2,662 4,737 0.9% 8.8 8.4 12.7 11.1 10.6 24.8% 3.9 Median (5.1%) 10.2x 9.3x 14.3x 12.3x 14.4x 26.0% 3.2x 80,297 86,033 17.3% 21.5x 19.9x 30.0x 27.8x 28.6x 22.7% 1.4x $59,572 $68,332 8.2% 16.1 15.3 24.3 NA 22.3 21.3% 2.1 4,416 5,316 7.4% 25.8 15.6 27.1 16.2 39.6 8.1% 3.2 632 926 (4.9%) 8.7 8.8 9.9 NA 32.5 8.8% 2.8 2,683 2,959 (5.5%) 5.7 4.8 10.3 8.6 16.1 7.2% 0.5 Median 7.4% 16.1x 15.3x 24.3x 16.2x 28.6x 8.8% 2.1x Other Reference Comps Core Comps (* Based on unaffected stock price) $1,595* $2,404* (26.9%)* 7.1x* 6.6x* 13.2x* 12.0x* (3) (3) (3) (3) (3) (3) (3) (3) (3) (4) (7) (4) (6) (5) (4) (7) (8) ————————————————————————————————————————————————————————————————————————————————————- I I I I I I I ! Mister· ! I I I I I ————————————————————————————————————————————————-———————————————————————————————————————————————————————- . Valvoline. Drive Brands· D Avrozonti .,—....._ MONR01NG Advance/~ · AutoPartslX

Sales YoY Growth Adj. EBITDA YoY Growth EPS YoY Growth Free Cash Flow Margin Company ‘22A—‘23A ‘23A—‘24A ‘24A—‘25E ‘22A—‘23A ‘23A—‘24A ‘24A—‘25E ‘22A—‘23A ‘23A—‘24A ‘24A—‘25E 2023A 2024A 2025E* 5.8% 7.3% 5.8% 1.4% 12.2% 6.4% (20.0%) 15.6% 16.2% (4.5%) (0.9%) 7.8% 13.1% 1.7% (9.8%) 4.6% 3.2% (8.0%) (23.8%) 22.6% 8.2% (1.3%) 12.7% 16.0% 16.8% 13.8% 9.3% (34.4%) 13.4% 10.1% 93.4% 33.6% 2.0% 14.9% 13.9% 13.8% Median 15.0% 7.8% (0.2%) (14.9%) 8.3% 1.1% 34.8% 28.1% 5.1% 6.8% 13.3% 14.9% 9.7% 5.7% 6.2% 8.6% 4.3% 6.7% 15.0% 5.7% 9.6% 16.4% 16.3% 16.0% 21.1% 4.2% 2.8% 33.0% (3.9%) 8.4% 112.2% (65.6%) 26.0% 15.0% 13.1% 14.5% 6.1% 4.2% 5.8% 8.4% 5.2% (1.1%) 11.9% 6.6% 0.1% 18.1% 17.0% 14.5% 1.2% (19.4%) (5.7%) (65.2%) (24.9%) 42.5% (96.2%) (158.0%) 723.4% 2.2% 2.0% 3.1% (3.6%) (5.3%) (3.2%) (9.2%) (20.7%) (10.7%) (9.9%) (48.1%) (23.1%) NA NA NA Median 6.1% 4.2% 2.8% 8.4% (3.9%) 6.7% 11.9% (48.1%) 9.6% 15.7% 14.7% 14.5% Other Reference Comps Core Comps 11 Selected Publicly Traded Companies Historical Figures Benchmarking (2) (1) (5) (5) (5) (3) (3) (3) (3) (3) (3) (3) (3) (3) (4) (4) (4) ____________________ Source: Based on public company filings, including most recently filed 10Q and 10K. Estimates per FactSet as of January 13, 2026. Note: * denotes sort order. MCW figures based on consensus estimates. Adj. EBITDA figures reconciled for interest expense, depreciation and amortization expense, gain/loss on sale, acquisition expenses, non-cash rent expense, loss on extinguishment of debt, employee retention credit, and other. Figures on this page (incl. Boson) based on FactSet consensus estimates. (1) Adj. EBITDA unburdened for SBC. (2) Calculated as (Adj. EBITDA – CapEx) / Sales. (3) Adj. EBITDA unburdened for SBC by adding back average CY’23 and CY’24 SBC as % of sales. (4) Adj. EBITDA unburdened for SBC by adding back average CY’24 and CY’25 SBC as % of sales. (5) NA due to no available Capex information. Mister· Driri Brands· HAvrozone· AttVancef~ · AutoPartsl:.-. MONR01NC
12 Selected Precedent Transactions ____________________ Source: Company filings, press releases, SEC filings and investor presentations. Note: * denotes sort order. (1) Transaction value of $385mm per Driven Brands’ press release on February 25, 2025. $70.2mm adjusted EBITDA represents Driven Brands’ FY2024 Car Wash segment burdened by $6.7mm of Stock-based Compensation results in an unburdened adjusted EBITDA of $76.9mm, per March 12, 2025 8K. Stock-based Compensation was derived by taking the Driven Brands sales over total sales and applying that percentage to total Stock-based Compensation as the company didn’t disclose on a segment basis. (2) Transaction value of $625mm per Valvoline’s press release on February 20, 2025. EV / LTM EBITDA was also disclosed as 10.7x in Valvoline’s press release on February 20, 2025 noting the adjusted EBITDA used is a non-GAAP pro forma measure for the twelve-month period ended October 31, 2024 based upon reported results adjusted for certain normalizing and pro forma activity as a result of buy-side diligence. No mention of Stock-based Compensation in filings. (3) Transaction value of $310mm per Midas’ press release on May 3, 2012. Adjusted FY2012 EBITDA of $32mm per Midas’ Schedule 14D -9 on March 12, 2012. No value of Stock-based Compensation disclosed. (4) Transaction value of $1.0bn per Pep Boys’ press release on February 16, 2012. LTM EBITDA per fiscal year ending January 2011 10K as filed on April 11, 2011 and quarter ending October 2011 per 10Q filed on December 6, 2011. Stock-based compensation for Pep Boy’s was $3.3mm per fiscal year ending January 2011 10K as filed on April 11, 2011 and quarter ending October 2011 per 10Q filed on December 6, 2011 so EBITDA has been unburdened to reflect this amount. (5) Transaction value of $1.0bn per O’Reilly Auto Parts’ press release on April 1, 2008. LTM adjusted EBITDA per fiscal year ending February 2008 10K as filed on April 22, 2008 and quarter ending May 2008 per 8K filed on June 13, 2008. Stockbased compensation was $2.7mm per fiscal year ending February 2008 10K as filed on April 22, 2008 and quarter ending May 2008 per 8K filed on June 13, 2008 so EBITDA has been unburdened to reflect this amount. (6) Transaction value of $20.8mm per Midas’ press release on April 1, 2008. EV / LTM adjusted EBITDA disclosed in Midas’ Schedule 14D-9 on March 12, 2012. No mention of Stock-based Compensation in filings. (7) Transaction value of $170mm per CSK Auto Corp’s press release on December 1, 2005. FY2004 adjusted EBITDA of $20mm per CSK Auto Corp’s 8K on January 9, 2006. No mention of Stock-based Compensation in filings. Date* Target Acquirer EV / LTM Adj. EBITDA There have been a number of private car wash transactions, however, those terms are not publicly available Target Description (1) (2) (3) (4) (5) (6) (7) Feb-25 Feb-25 May-12 Feb-12 Apr-08 Apr-08 Dec-05 Car Wash Automotive Quick Lube & Maintenance Services Automotive Services Tire Shop, Auto Repair, Oil Changes & Maintenance Services Automotive Parts & Accessories Oil Change & Auto Services Aftermarket Auto Parts & Accessories 5.0x 10.7x 9.7x 6.1x 8.8x 10.4x 8.5x Car Wash Business Dr/renBrands· breeze... ~ & AUTO SERVICE” ~......... lCKAUTO
13 Boson Illustrative DCF Analysis Management Projections 2026E 2027E 2028E 2029E 2030E Terminal (1) Net Sales $1,124 $1,221 $1,337 $1,472 $1,620 $1,620 % Growth 6.4% 8.7% 9.5% 10.0% 10.1% Adj. EBITDA (2) $364 $403 $448 $506 $572 $572 % Margin 32.4% 33.0% 33.5% 34.4% 35.3% 35.3% Less: Stock-based Compensation ($31) ($31) ($32) ($33) ($34) ($34) Adj. EBITDA (Burdened for SBC) $333 $372 $416 $472 $537 $537 % Margin 29.7% 30.4% 31.1% 32.1% 33.2% 33.2% Less: Depreciation & Amortization(4) (89) (92) (95) (97) (100) (69) Adj. EBIT (Burdened for SBC) $244 $280 $321 $375 $437 $469 % Margin 21.7% 22.9% 24.0% 25.5% 27.0% 28.9% Less: Taxes (3) (3) (4) (6) (12) (122) Memo: Effective Tax Rate (Incl. of Tax Asset) (3) 1.1% 1.1% 1.4% 1.5% 2.8% 26.0% Tax-Effected Adj. EBIT (Burdened for SBC) $241 $277 $317 $369 $425 $347 Plus: Depreciation & Amortization (4) 89 92 95 97 100 69 Plus: Change in NWC 8 9 10 10 11 2 Less: Capital Expenditures (Excluding Acquisitions) (320) (350) (380) (414) (443) (75) Less: Acquisition Purchase Price CapEx (70) (70) (70) (70) (70) — Plus: Sale-Leaseback Proceeds 82 135 180 204 230 — Unlevered Free Cash Flow $31 $93 $151 $197 $253 $342 Terminal Multiple Method PV of PV of Terminal Value at Enterprise Value at Implied Perpetuity Growth Discount ‘26E—‘30E Adj. EBITDA Exit Multiple of Adj. EBITDA Exit Multiple of Rate at Adj. EBITDA Exit Multiple of Rate Cash Flows 7.00x 8.00x 9.00x 7.00x 8.00x 9.00x 7.00x 8.00x 9.00x 10.0% $535 $2,484 $2,839 $3,194 $3,020 $3,375 $3,730 1.0% 2.0% 2.8% 11.0% 520 + 2,375 2,714 3,053 = 2,895 3,234 3,573 1.8% 2.9% 3.7% 12.0% 506 2,270 2,595 2,919 2,777 3,101 3,425 2.7% 3.8% 4.6% Equity Value at Equity Value(5) per Share at Discount Less: Net Debt Adj. EBITDA Exit Multiple of Adj. EBITDA Exit Multiple of Rate (as of YE25E) (5) 7.00x 8.00x 9.00x 7.00x 8.00x 9.00x 10.0% ($781) $2,239 $2,594 $2,948 $6.70 $7.75 $8.80 11.0% (781) = 2,114 2,453 2,792 6.35 7.35 8.35 12.0% (781) 1,995 2,320 2,644 6.00 6.95 7.90 ____________________ Source: Boson Management and Public Filings as of September 2025. Boson Management projections. Note: U.S Dollars in millions (except per share values). Values discounted to 12/31/2025 using year-end convention. Equity value per share rounded to the nearest $0.05. (1) Terminal year assumes normalized depreciation and amortization equal to 90.7% of capital expenditures, capital expenditures limited to growth & maintenance, no sale-lease back proceeds and 26% marginal statutory tax rate, with no bonus tax depreciation. (2) Adj. EBITDA figures unburdened for stock-based compensation and reconciled for interest expense, depreciation and amortization expense, gain/loss on sale, acquisition expenses, non-cash rent expense, loss on extinguishment of debt, employee retention credit, and other. (3) Represents cash taxes inclusive of bonus tax depreciation and NOLs impact. (4) Represents book Depreciation & Amortization and excludes bonus depreciation. (5) Capital structure as of 12/31/2025 based on total debt of $810mm and cash & cash equivalents of $28mm estimates provided on 1/7/2026. Estimates are preliminary, subject to change and represent unaudited financials. (6) Boson fully diluted share count based on 327.568 basic common shares outstanding, 10.506 stock options with a weighted average exercise price of $6.55, and 5.402 RSUs pursuant to the Treasury Stock Method as of 09/30/2025.
Appendix
14 Boson Weighted Average Cost of Capital Range Cost of Equity Low High Source Risk Free Rate 4.8% Twenty year U.S. Government bond yield as of January 13, 2026 Levered Beta 1.22 Represents Company’s historical Bloomberg adjusted beta levered at the Company’s average capital structure since IPO. Bloomberg betas based on regression of weekly performance as compared to the broad U.S. equity market since IPO Equity Risk Premium 5.0% 7.0% Equity risk premium relative to twenty year U.S. Government bond yield per BofA Securities estimates, based upon analysis of long-term historical data of the broad U.S. equity market Cost of Equity 10.9% 13.3% Cost of Debt Pre-tax Cost of Debt 8.25% Based on market estimates for new unsecured 10-year debt Marginal Tax Rate 26.0% Marginal statutory tax rate After-tax Cost of Debt 6.1% Net Debt / Net Capital 22.4% Based on Boson’s Average Capital Structure Since IPO Weighted Average Cost of Capital 9.8% 11.7% ____________________ Source: FactSet and Bloomberg as of January 13, 2026. Note: USD in millions. Boson went public in June 2021.