
Exhibit (c)(iii) PRIVILEGED & CONFIDENTIAL PRELIMINARY DRAFT SUBJECT TO DUE DILIGENCE & SUBSTANTIAL REVISION Project Elegant Discussion Materials January 6, 2025 Content must not go below this line
PRIVILEGED & CONFIDENTIAL PRELIMINARY DRAFT SUBJECT TO DUE DILIGENCE & SUBSTANTIAL REVISION Executive Summary • On December 18, 2025, Elegant’s management team presented the Special Committee with their latest views on the business, including an updated financial forecast (the “Management LRP”) and details on the Company’s planned turnaround initiatives (the ativ es”) “LRP Initi • During the meeting, management noted that successfully implementing the LRP Initiatives is subject to meaningful execution risk • Moelis has continued to conduct diligence on the Management LRP and the LRP Initiatives • On December 23, 2025, the Special Committee reviewed and discussed the Management LRP, including comparisons to the forecast shared by Management with the Board of Directors in October, equity research forecasts and expected growth rates and margins of selected publicly traded companies. The Special Committee and Moelis noted the high execution risk related to the Management LRP and the LRP Initiatives, including but not limited to the below factors: • Franchisees are critical to successfully executing on the LRP Initiatives; implementing the LRP Initiatives therefore requires buy-in from franchisees • Many of the LRP Initiatives are related to waxers, and changing waxer behavior can be challenging for many reasons, including but not limited to the fact that waxers are not employees of the Company • There are several proposed LRP Initiatives and management intends to implement them simultaneously, with full roll-out at the March franchisee conference • The Management LRP assumes that current negative business trends will stabilize and reverse • The LRP Initiatives focus on reversing the decline in unit volume, and management does not intend to pursue in the near to medium term other potential growth levers like new product introductions or international expansion that are not available or not attractive to the Company • Key members of the management team have recently been hired and their ability to execute remains unproven • The Special Committee instructed Moelis to work with management to sensitize the forecast with respect to achievement of the LRP Initiatives and the Management LRP. Management has prepared four illustrative sensitivity analyses for the Specials C rev omm iew:i ttee’ 1. 50% Achievability: 50% achievement of the LRP Initiatives 2. 150% Achievability: 150% achievement of the LRP Initiatives 3. 6-Month Delay: 6-month delay of the realization of operational improvement from the LRP Initiatives 4. 12-Month Delay: 12-month delay of the realization of operational improvement from the LRP Initiatives • The primary purpose of today’s meeting is for the Special Committee to provide feedback on the Management LRP vian tiesd the sensiti Content must not go below this line Confidential | 1
PRIVILEGED & CONFIDENTIAL PRELIMINARY DRAFT SUBJECT TO DUE DILIGENCE & SUBSTANTIAL REVISION 1. Management LRP Review Content must not go below this line Confidential | 2
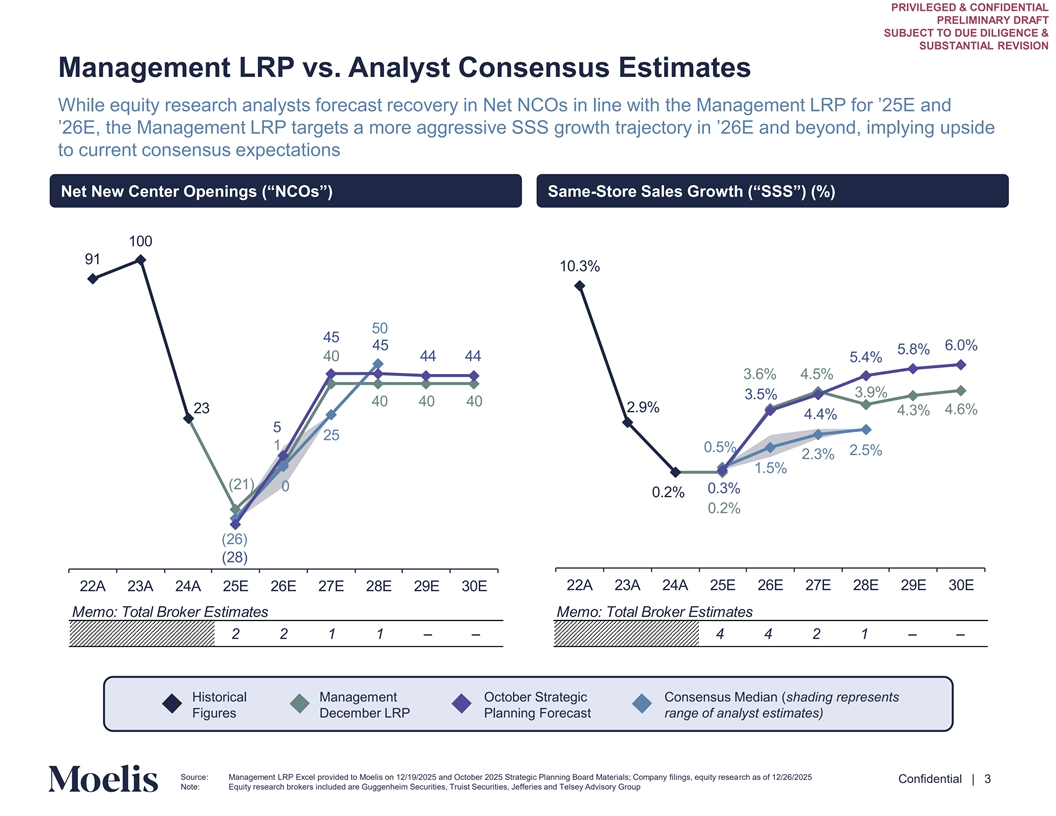
PRIVILEGED & CONFIDENTIAL PRELIMINARY DRAFT SUBJECT TO DUE DILIGENCE & SUBSTANTIAL REVISION Management LRP vs. Analyst Consensus Estimates While equity research analysts forecast recovery in Net NCOs in line with the Management LRP for ’ E and ’ E, the Management LRP targets a more aggressive SSS growth trajectory in ’ E and beyond, implying upside to current consensus expectations Net New Center Openings (“NCOs”) Same-Store Sales Growth (“SSS”) (%) . . . . . . . . . . . . . . . . ( ) . . . ( ) ( ) E E E E E E E E E E E E Memo: Total Broker Estimates Memo: Total Broker Estimates 2 2 1 1–– 4 4 2 1–– Historical Management October Strategic Consensus Median (shading represents Figures December LRP Planning Forecast range of analyst estimates) Content must not go below this line Source: Management LRP Excel provided to Moelis on 12/19/2025 and October 2025 Strategic Planning Board Materials; Company filings, equity research as of 12/26/2025 Confidential | 3 Note: Equity research brokers included are Guggenheim Securities, Truist Securities, Jefferies and Telsey Advisory Group
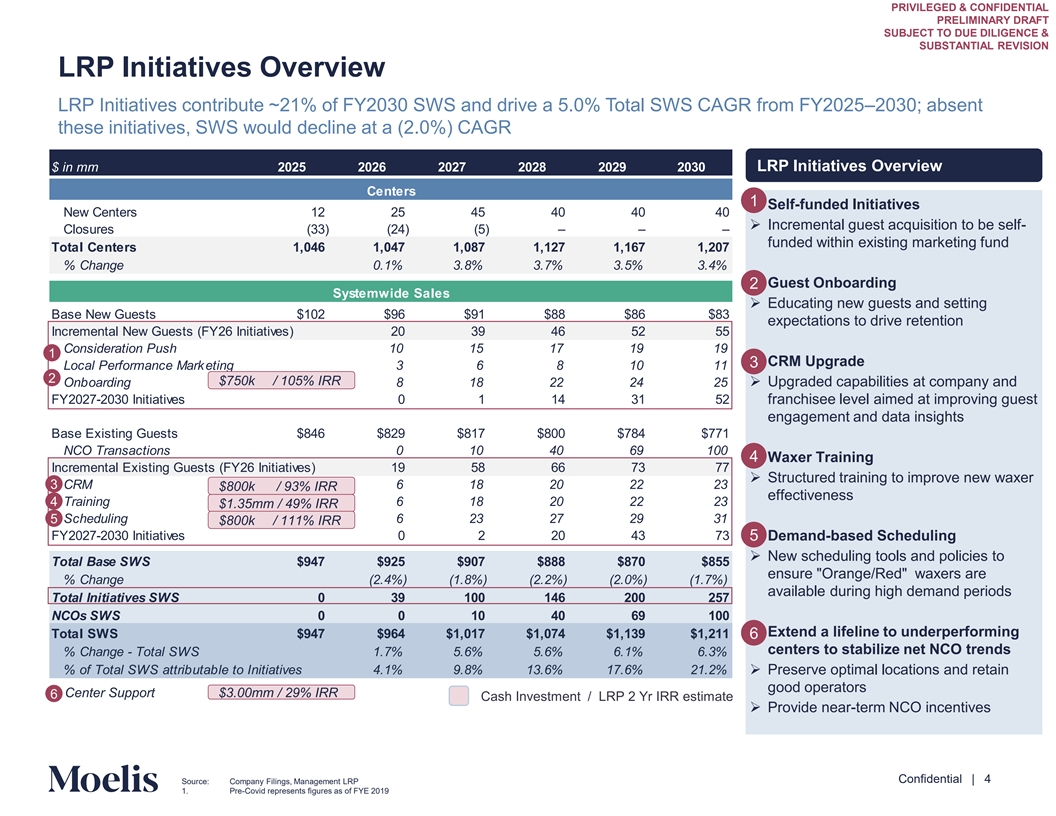
PRIVILEGED & CONFIDENTIAL PRELIMINARY DRAFT SUBJECT TO DUE DILIGENCE & SUBSTANTIAL REVISION LRP Initiatives Overview LRP Initiatives contribute ~21% of FY2030 SWS and drive a 5.0% Total SWS CAGR from FY2025–2030; absent these initiatives, SWS would decline at a (2.0%) CAGR $ in mm 2025 2026 2027 2028 2029 2030 LRP Initiatives Overview Centers 1 • Self-funded Initiatives New Centers 12 25 45 40 40 40 ➢ Incremental guest acquisition to be self- Closures (33) (24) (5) – – – funded within existing marketing fund Total Centers 1,046 1,047 1,087 1,127 1,167 1,207 % Change 0.1% 3.8% 3.7% 3.5% 3.4% • Guest Onboarding 2 Systemwide Sales ➢ Educating new guests and setting Base New Guests $102 $96 $91 $88 $86 $83 expectations to drive retention Incremental New Guests (FY26 Initiatives) 20 39 46 52 55 Consideration Push 10 15 17 19 19 1 • CRM Upgrade 3 Local Performance Marketing 3 6 8 10 11 2 $750k / 105% IRR Onboarding 8 18 22 24 25 ➢ Upgraded capabilities at company and FY2027-2030 Initiatives 0 1 14 31 52 franchisee level aimed at improving guest engagement and data insights Base Existing Guests $846 $829 $817 $800 $784 $771 NCO Transactions 0 10 40 69 100 4• Waxer Training Incremental Existing Guests (FY26 Initiatives) 19 58 66 73 77 ➢ Structured training to improve new waxer 3 CRM 6 18 20 22 23 $800k / 93% IRR effectiveness 4 Training 6 18 20 22 23 $1.35mm / 49% IRR Scheduling 6 23 27 29 31 5 $800k / 111% IRR FY2027-2030 Initiatives 0 2 20 43 73 5• Demand-based Scheduling ➢ New scheduling tools and policies to Total Base SWS $947 $925 $907 $888 $870 $855 ensure Orange/Red waxers are % Change (2.4%) (1.8%) (2.2%) (2.0%) (1.7%) available during high demand periods Total Initiatives SWS 0 39 100 146 200 257 NCOs SWS 0 0 10 40 69 100 • Extend a lifeline to underperforming Total SWS $947 $964 $1,017 $1,074 $1,139 $1,211 6 centers to stabilize net NCO trends % Change - Total SWS 1.7% 5.6% 5.6% 6.1% 6.3% % of Total SWS attributable to Initiatives 4.1% 9.8% 13.6% 17.6% 21.2% ➢ Preserve optimal locations and retain good operators Center Support $3.00mm / 29% IRR 6 Cash Investment / LRP 2 Yr IRR estimate ➢ Provide near-term NCO incentives Content must not go below this line Confidential | 4 Source: Company Filings, Management LRP 1. Pre-Covid represents figures as of FYE 2019
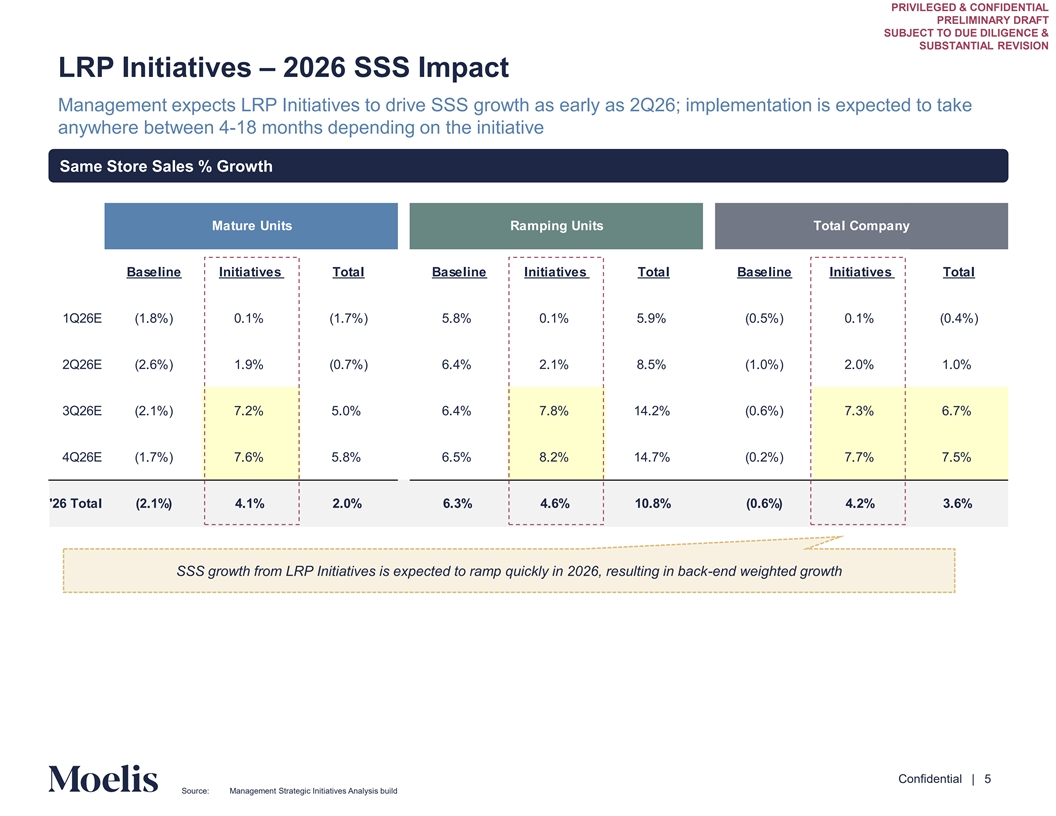
PRIVILEGED & CONFIDENTIAL PRELIMINARY DRAFT SUBJECT TO DUE DILIGENCE & SUBSTANTIAL REVISION LRP Initiatives – 2026 SSS Impact Management expects LRP Initiatives to drive SSS growth as early as 2Q26; implementation is expected to take anywhere between 4-18 months depending on the initiative Same Store Sales % Growth Mature Units Ramping Units Total Company Baseline Initiatives Total Baseline Initiatives Total Baseline Initiatives Total 1Q26E (1.8%) 0.1% (1.7%) 5.8% 0.1% 5.9% (0.5%) 0.1% (0.4%) 2Q26E (2.6%) 1.9% (0.7%) 6.4% 2.1% 8.5% (1.0%) 2.0% 1.0% 3Q26E (2.1%) 7.2% 5.0% 6.4% 7.8% 14.2% (0.6%) 7.3% 6.7% 4Q26E (1.7%) 7.6% 5.8% 6.5% 8.2% 14.7% (0.2%) 7.7% 7.5% '26 Total (2.1%) 4.1% 2.0% 6.3% 4.6% 10.8% (0.6%) 4.2% 3.6% SSS growth from LRP Initiatives is expected to ramp quickly in 2026, resulting in back-end weighted growth Content must not go below this line Confidential | 5 Source: Management Strategic Initiatives Analysis build
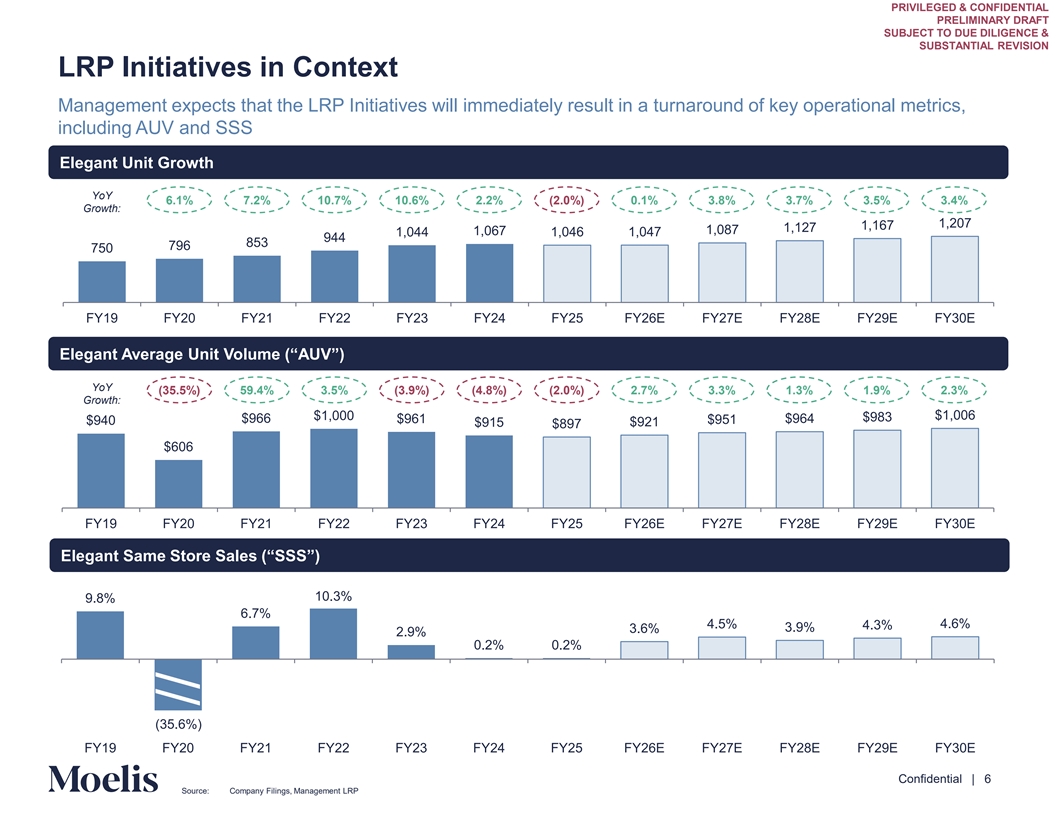
// PRIVILEGED & CONFIDENTIAL PRELIMINARY DRAFT SUBJECT TO DUE DILIGENCE & SUBSTANTIAL REVISION LRP Initiatives in Context Management expects that the LRP Initiatives will immediately result in a turnaround of key operational metrics, including AUV and SSS Elegant Unit Growth YoY 6.1% 7.2% 10.7% 10.6% 2.2% (2.0%) 0.1% 3.8% 3.7% 3.5% 3.4% Growth: n 1,207 1,167 1,127 1,087 1,067 1,046 1,047 1,044 944 853 796 750 FY19 FY20 FY21 FY22 FY23 FY24 FY25 FY26E FY27E FY28E FY29E FY30E Elegant Average Unit Volume (“AUV”) YoY (35.5%) 59.4% 3.5% (3.9%) (4.8%) (2.0%) 2.7% 3.3% 1.3% 1.9% 2.3% Growth: $1,000 $1,006 $983 $966 $964 $961 $951 $940 $915 $921 $897 $606 FY19 FY20 FY21 FY22 FY23 FY24 FY25 FY26E FY27E FY28E FY29E FY30E Elegant Same Store Sales (“SSS”) 10.3% 9.8% 6.7% 4.5% 4.6% 4.3% 3.9% 3.6% 2.9% 0.2% 0.2% (35.6%) FY19 FY20 FY21 FY22 FY23 FY24 FY25 FY26E FY27E FY28E FY29E FY30E Content must not go below this line Confidential | 6 Source: Company Filings, Management LRP
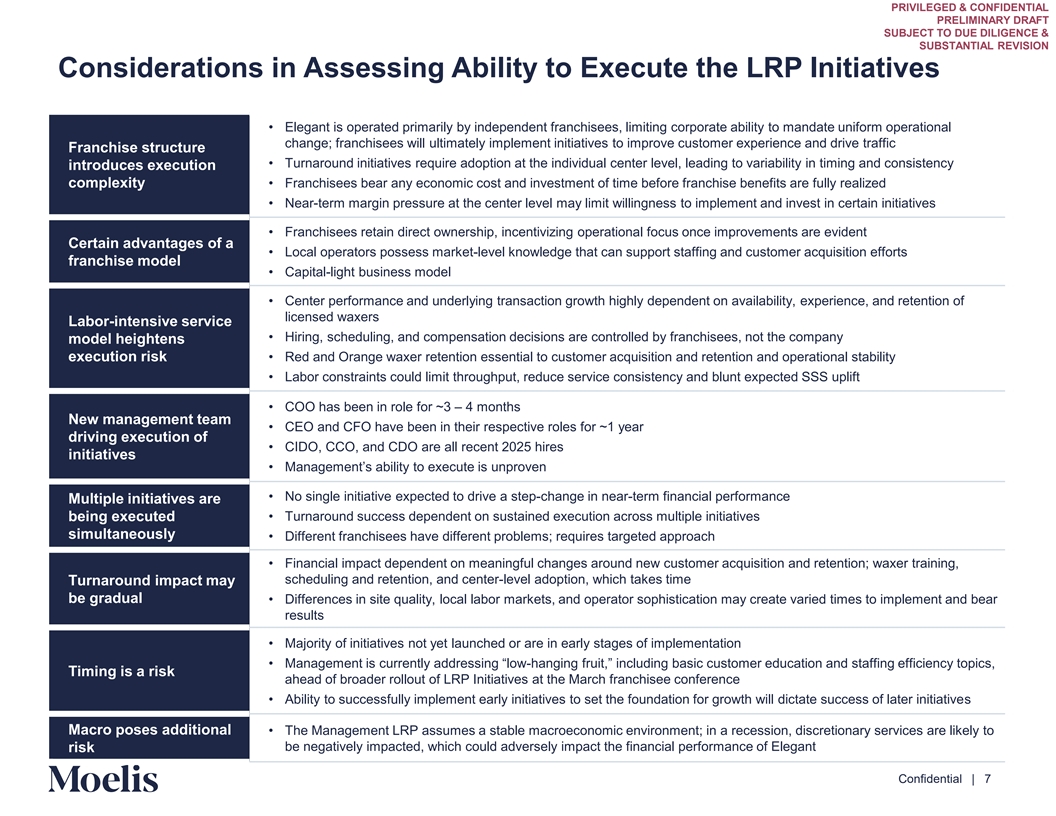
PRIVILEGED & CONFIDENTIAL PRELIMINARY DRAFT SUBJECT TO DUE DILIGENCE & SUBSTANTIAL REVISION Considerations in Assessing Ability to Execute the LRP Initiatives • Elegant is operated primarily by independent franchisees, limiting corporate ability to mandate uniform operational change; franchisees will ultimately implement initiatives to improve customer experience and drive traffic Franchise structure • Turnaround initiatives require adoption at the individual center level, leading to variability in timing and consistency introduces execution complexity • Franchisees bear any economic cost and investment of time before franchise benefits are fully realized • Near-term margin pressure at the center level may limit willingness to implement and invest in certain initiatives • Franchisees retain direct ownership, incentivizing operational focus once improvements are evident Certain advantages of a • Local operators possess market-level knowledge that can support staffing and customer acquisition efforts franchise model • Capital-light business model • Center performance and underlying transaction growth highly dependent on availability, experience, and retention of licensed waxers Labor-intensive service • Hiring, scheduling, and compensation decisions are controlled by franchisees, not the company model heightens execution risk • Red and Orange waxer retention essential to customer acquisition and retention and operational stability • Labor constraints could limit throughput, reduce service consistency and blunt expected SSS uplift • COO has been in role for ~3 – 4 months New management team • CEO and CFO have been in their respective roles for ~1 year driving execution of • CIDO, CCO, and CDO are all recent 2025 hires initiatives • Management’s ability to execute is unproven • No single initiative expected to drive a step-change in near-term financial performance Multiple initiatives are being executed • Turnaround success dependent on sustained execution across multiple initiatives simultaneously • Different franchisees have different problems; requires targeted approach • Financial impact dependent on meaningful changes around new customer acquisition and retention; waxer training, scheduling and retention, and center-level adoption, which takes time Turnaround impact may be gradual • Differences in site quality, local labor markets, and operator sophistication may create varied times to implement and bear results • Majority of initiatives not yet launched or are in early stages of implementation • Management is currently addressing “-low hanging fruit,” including basic customer education and staffing efficiency topics, Timing is a risk ahead of broader rollout of LRP Initiatives at the March franchisee conference • Ability to successfully implement early initiatives to set the foundation for growth will dictate success of later initiatives Macro poses additional • The Management LRP assumes a stable macroeconomic environment; in a recession, discretionary services are likely to be negatively impacted, which could adversely impact the financial performance of Elegant risk Content must not go below this line Confidential | 7
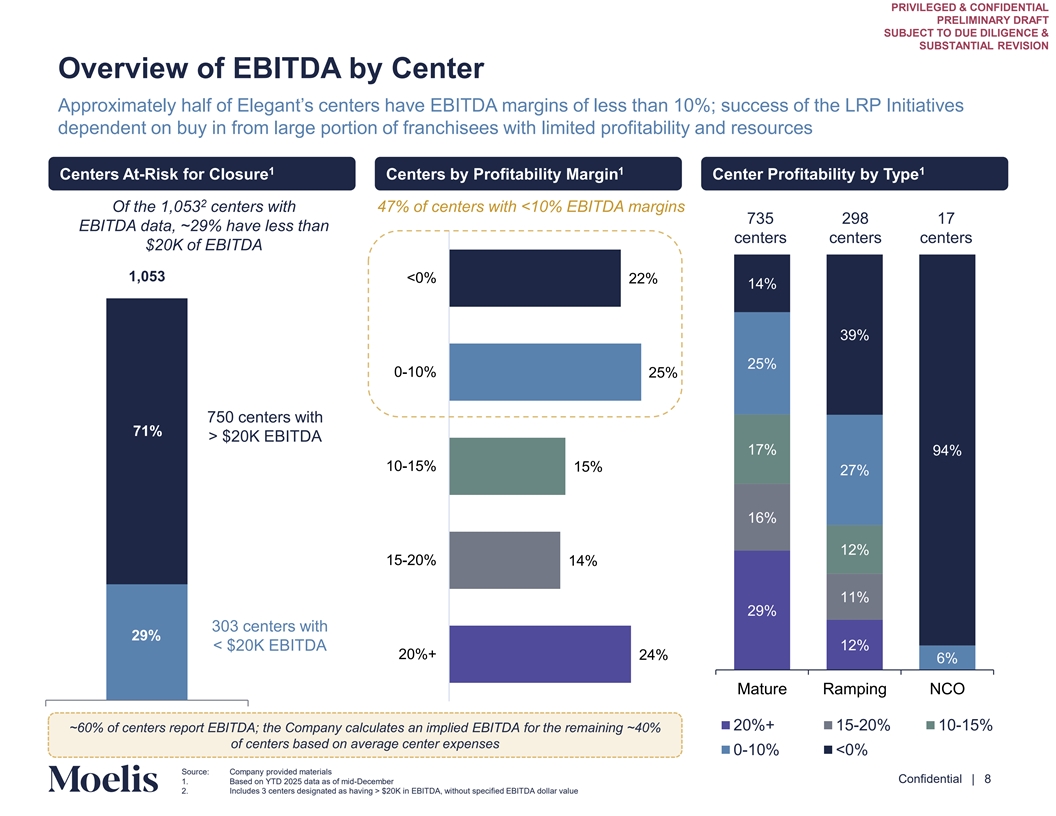
PRIVILEGED & CONFIDENTIAL PRELIMINARY DRAFT SUBJECT TO DUE DILIGENCE & SUBSTANTIAL REVISION Overview of EBITDA by Center Approximately half of Elegant’s centers have EBITDA margins of less than 10%; success of the LRP Initiatives dependent on buy in from large portion of franchisees with limited profitability and resources 1 1 1 Centers At-Risk for Closure Centers by Profitability Margin Center Profitability by Type 2 Of the 1,053 centers with 47% of centers with <10% EBITDA margins 735 298 17 EBITDA data, ~29% have less than centers centers centers $20K of EBITDA 1,053 <0% 22% 14% 39% 25% 0-10% 25% 750 centers with 71% > $20K EBITDA 747 17% 94% 10-15% 15% 27% 16% 12% 15-20% 14% 11% 29% 303 centers with 29% < $20K EBITDA 12% 20%+ 24% 6% Mature Ramping NCO 20%+ 15-20% 10-15% ~60% of centers report EBITDA; the Company calculates an implied EBITDA for the remaining ~40% of centers based on average center expenses Content must not 0-10% <0% go below this line Source: Company provided materials Confidential | 8 1. Based on YTD 2025 data as of mid-December 2. Includes 3 centers designated as having > $20K in EBITDA, without specified EBITDA dollar value

PRIVILEGED & CONFIDENTIAL PRELIMINARY DRAFT SUBJECT TO DUE DILIGENCE & SUBSTANTIAL REVISION 2. Illustrative Forecast Sensitivities Content must not go below this line Confidential | 9
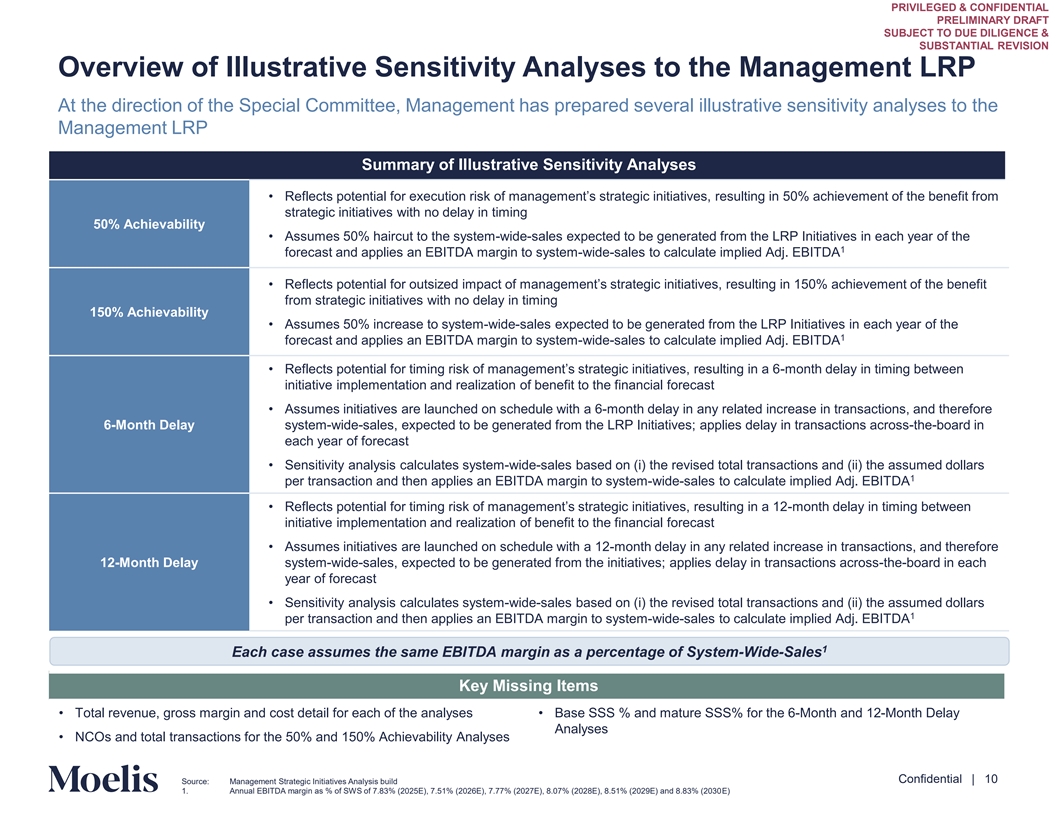
PRIVILEGED & CONFIDENTIAL PRELIMINARY DRAFT SUBJECT TO DUE DILIGENCE & SUBSTANTIAL REVISION Overview of Illustrative Sensitivity Analyses to the Management LRP At the direction of the Special Committee, Management has prepared several illustrative sensitivity analyses to the Management LRP Summary of Illustrative Sensitivity Analyses • Reflects potential for execution risk of management’s strategic initiatives, resulting in achievement of the benefit from strategic initiatives with no delay in timing 50% Achievability • Assumes 50% haircut to the system-wide-sales expected to be generated from the LRP Initiatives in each year of the 1 forecast and applies an EBITDA margin to system-wide-sales to calculate implied Adj. EBITDA • Reflects potential for outsized impact of management’s strategic initiatives, resulting in achievement of the benefit from strategic initiatives with no delay in timing 150% Achievability • Assumes 50% increase to system-wide-sales expected to be generated from the LRP Initiatives in each year of the 1 forecast and applies an EBITDA margin to system-wide-sales to calculate implied Adj. EBITDA • Reflects potential for timing risk of management’s strategic initiatives, resulting -m on in a th de lay in timing between initiative implementation and realization of benefit to the financial forecast • Assumes initiatives are launched on schedule with a 6-month delay in any related increase in transactions, and therefore 6-Month Delay system-wide-sales, expected to be generated from the LRP Initiatives; applies delay in transactions across-the-board in each year of forecast • Sensitivity analysis calculates system-wide-sales based on (i) the revised total transactions and (ii) the assumed dollars 1 per transaction and then applies an EBITDA margin to system-wide-sales to calculate implied Adj. EBITDA • Reflects potential for timing risk of management’s strategic initiatives, resulting- min a onth delay in timing between initiative implementation and realization of benefit to the financial forecast • Assumes initiatives are launched on schedule with a 12-month delay in any related increase in transactions, and therefore 12-Month Delay system-wide-sales, expected to be generated from the initiatives; applies delay in transactions across-the-board in each year of forecast • Sensitivity analysis calculates system-wide-sales based on (i) the revised total transactions and (ii) the assumed dollars 1 per transaction and then applies an EBITDA margin to system-wide-sales to calculate implied Adj. EBITDA 1 Each case assumes the same EBITDA margin as a percentage of System-Wide-Sales Key Missing Items • Total revenue, gross margin and cost detail for each of the analyses • Base SSS % and mature SSS% for the 6-Month and 12-Month Delay Analyses • NCOs and total transactions for the 50% and 150% Achievability Analyses Content must not go below this line Confidential | 10 Source: Management Strategic Initiatives Analysis build 1. Annual EBITDA margin as % of SWS of 7.83% (2025E), 7.51% (2026E), 7.77% (2027E), 8.07% (2028E), 8.51% (2029E) and 8.83% (2030E)
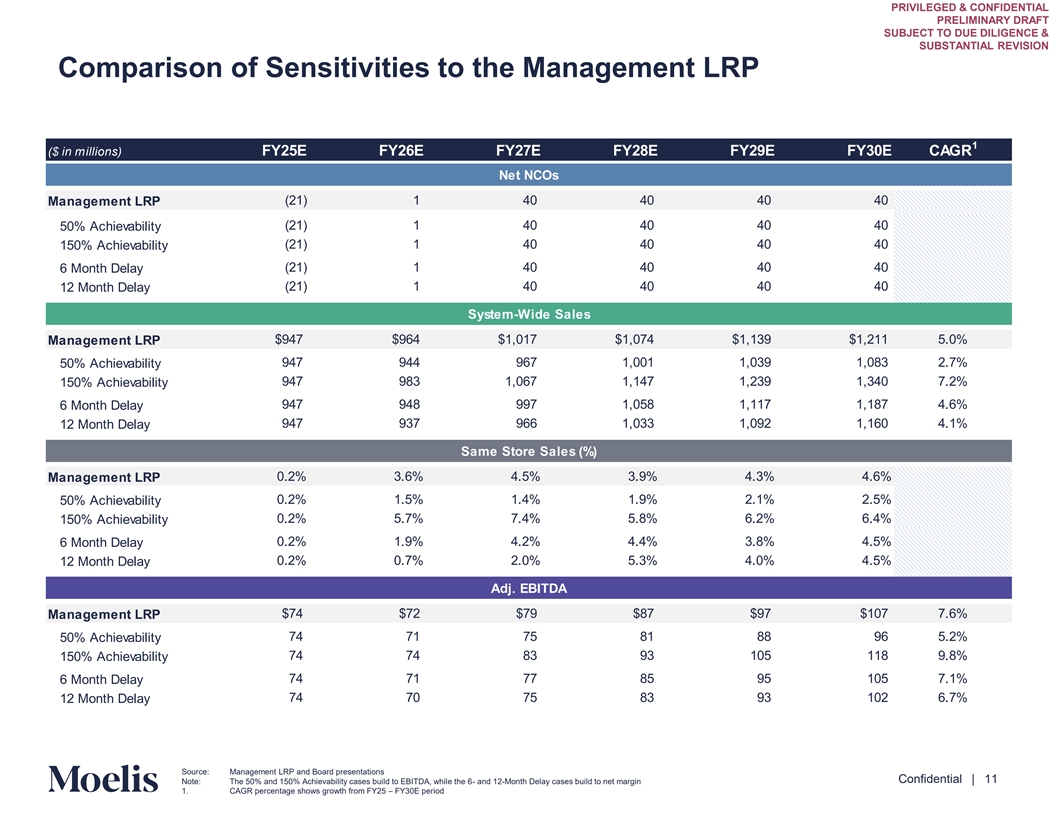
PRIVILEGED & CONFIDENTIAL PRELIMINARY DRAFT SUBJECT TO DUE DILIGENCE & SUBSTANTIAL REVISION Comparison of Sensitivities to the Management LRP 1 ($ in millions) FY25E FY26E FY27E FY28E FY29E FY30E CAGR Net NCOs Management LRP (21) 1 40 40 40 40 (21) 1 40 40 40 40 50% Achievability 150% Achievability ( 21) 1 40 40 40 40 ( 21) 1 40 40 40 40 6 Month Delay ( 21) 1 40 40 40 40 12 Month Delay System-Wide Sales $947 $964 $1,017 $1,074 $1,139 $1,211 5.0% Management LRP 947 944 967 1,001 1 ,039 1 ,083 2.7% 50% Achievability 150% Achievability 947 983 1,067 1,147 1 ,239 1,340 7.2% 947 948 997 1,058 1 ,117 1 ,187 4.6% 6 Month Delay 947 937 966 1 ,033 1,092 1,160 4.1% 12 Month Delay Same Store Sales (%) 0.2% 3.6% 4.5% 3.9% 4.3% 4.6% Management LRP 0.2% 1.5% 1.4% 1.9% 2.1% 2.5% 50% Achievability 0.2% 5.7% 7.4% 5.8% 6.2% 6.4% 150% Achievability 6 Month Delay 0.2% 1.9% 4.2% 4.4% 3.8% 4.5% 0.2% 0.7% 2.0% 5.3% 4.0% 4.5% 12 Month Delay Adj. EBITDA Management LRP $74 $72 $79 $87 $97 $107 7.6% 74 71 75 81 88 96 5.2% 50% Achievability 74 74 83 93 105 118 9.8% 150% Achievability 74 71 77 85 95 105 7.1% 6 Month Delay 12 Month Delay 74 70 75 83 93 102 6.7% Content must not go below this line Source: Management LRP and Board presentations Confidential | 11 Note: The 50% and 150% Achievability cases build to EBITDA, while the 6- and 12-Month Delay cases build to net margin 1. CAGR percentage shows growth from FY25 – FY30E period
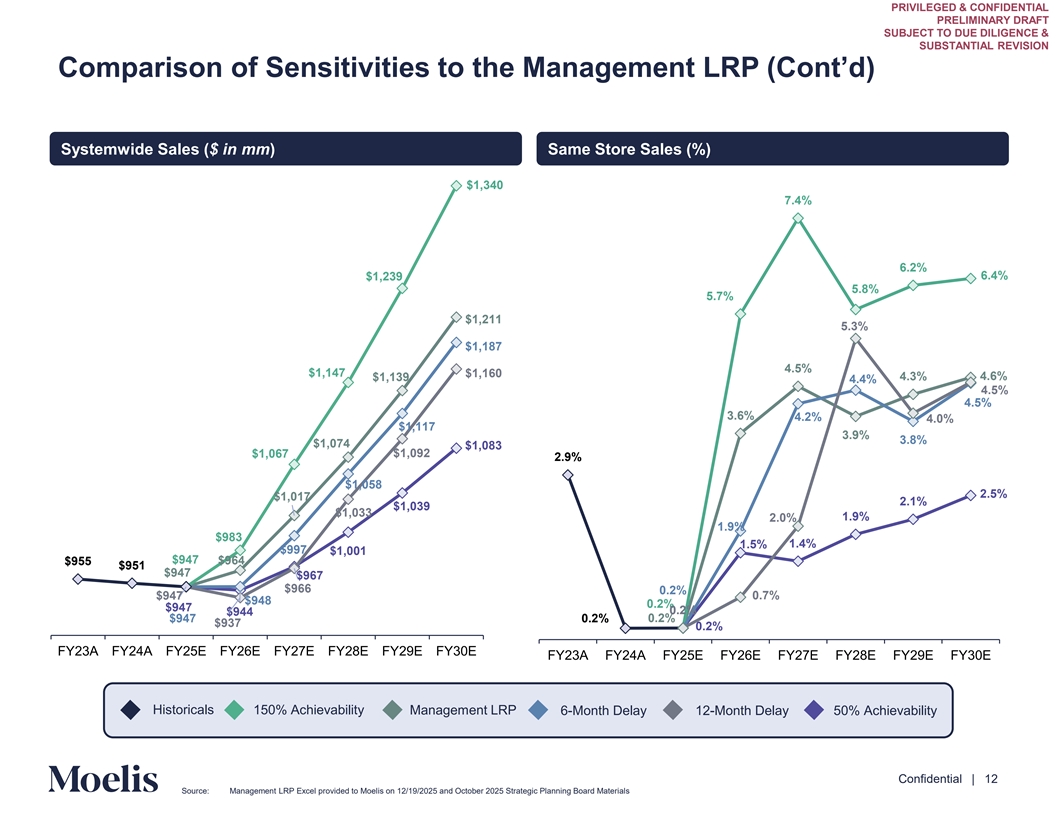
PRIVILEGED & CONFIDENTIAL PRELIMINARY DRAFT SUBJECT TO DUE DILIGENCE & SUBSTANTIAL REVISION Comparison of Sensitivities to the Management LRP (Cont’d) Systemwide Sales ($ in mm) Same Store Sales (%) $1,340 7.4% 6.2% 6.4% $1,239 5.8% 5.7% $1,211 5.3% $1,187 4.5% $1,147 $1,160 4.6% $1,139 4.3% 4.4% 4.5% 4.5% 3.6% 4.2% 4.0% $1,117 3.9% 3.8% $1,074 $1,083 $1,067 $1,092 2.9% $1,058 2.5% $1,017 2.1% $1,039 $1,033 1.9% 2.0% 1.9% $983 1.5% 1.4% $997 $1,001 $947 $964 $955 $951 $947 $967 $966 0.2% $947 0.7% $948 0.2% $947 0 0.2 .2% % $944 $947 0.2% 0.2% $937 0.2% FY23A FY24A FY25E FY26E FY27E FY28E FY29E FY30E FY23A FY24A FY25E FY26E FY27E FY28E FY29E FY30E Historicals 150% Achievability Management LRP 6-Month Delay 12-Month Delay 50% Achievability Content must not go below this line Confidential | 12 Source: Management LRP Excel provided to Moelis on 12/19/2025 and October 2025 Strategic Planning Board Materials
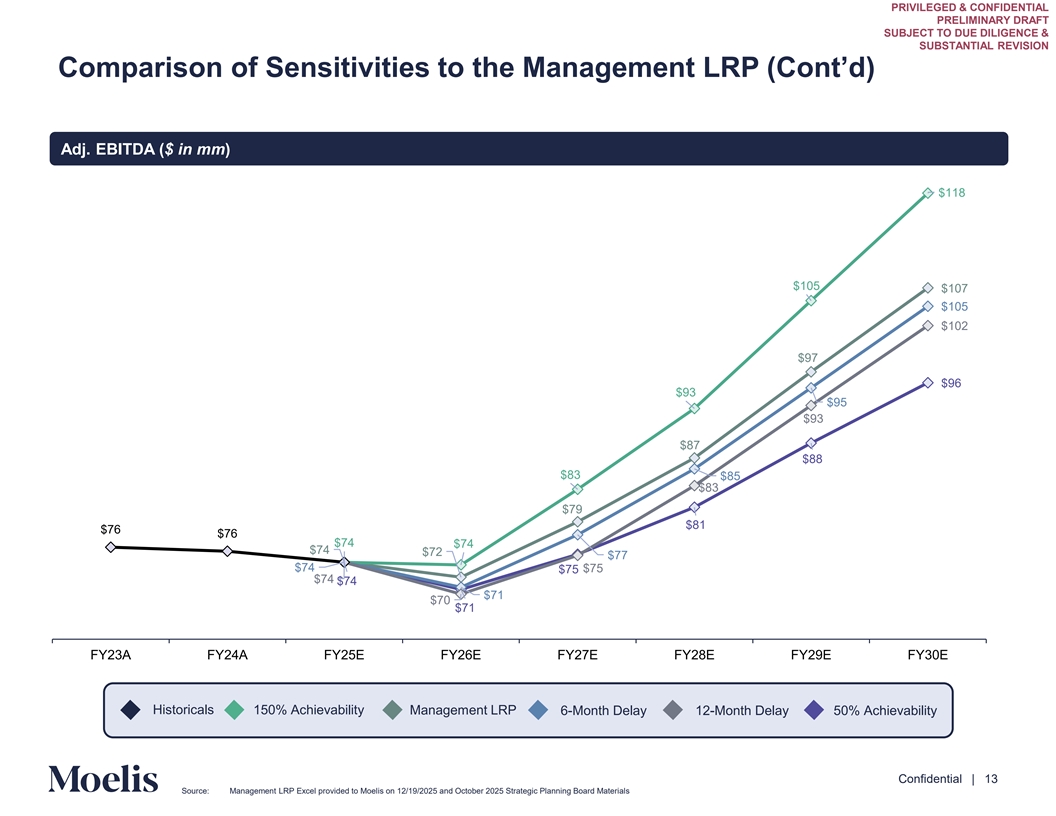
PRIVILEGED & CONFIDENTIAL PRELIMINARY DRAFT SUBJECT TO DUE DILIGENCE & SUBSTANTIAL REVISION Comparison of Sensitivities to the Management LRP (Cont’d) Adj. EBITDA ($ in mm) $118 $105 $107 $105 $102 $97 $96 $93 $95 $93 $87 $88 $83 $85 $83 $79 $81 $76 $76 $74 $74 $74 $72 $77 $74 $75 $75 $74 $74 $71 $70 $71 FY23A FY24A FY25E FY26E FY27E FY28E FY29E FY30E Historicals 150% Achievability Management LRP 6-Month Delay 12-Month Delay 50% Achievability Content must not go below this line Confidential | 13 Source: Management LRP Excel provided to Moelis on 12/19/2025 and October 2025 Strategic Planning Board Materials
PRIVILEGED & CONFIDENTIAL PRELIMINARY DRAFT SUBJECT TO DUE DILIGENCE & SUBSTANTIAL REVISION Appendix Content must not go below this line Confidential | 14

PRIVILEGED & CONFIDENTIAL PRELIMINARY DRAFT SUBJECT TO DUE DILIGENCE & SUBSTANTIAL REVISION Management LRP – 50% Achievability Sensitivity $ in mm FY25E FY26E FY27E FY28E FY29E FY30E Centers New Centers 12 25 45 40 40 40 Closures (33) (24) (5) – – – 1,207 Total Centers 1,046 1,047 1,087 1,127 1,167 % Change 0.1% 3.8% 3.7% 3.5% 3.4% Systemwide Sales Total Base SWS $947 $925 $907 $888 $870 $855 % Change (2.4%) (1.8%) (2.2%) (2.0%) (1.7%) Total Initiatives SWS – 20 50 73 100 128 NCOs SWS – – 10 40 69 100 Total SWS $947 $944 $967 $1,001 $1,039 $1,083 % Change (0.4%) 2.4% 3.5% 3.8% 4.2% Total EBITDA $74 $71 $75 $81 $88 $96 % Change (4.4%) 5.9% 7.5% 9.5% 8.2% % of SWS 7.8% 7.5% 7.8% 8.1% 8.5% 8.8% SSS % Change 0.2% 1.5% 1.4% 1.9% 2.1% 2.5% Mature SSS % Change 0.2% 1.1% 0.5% 0.3% 0.4% Content must not go below this line Confidential | 15 Source: Company Filings, Management LRP
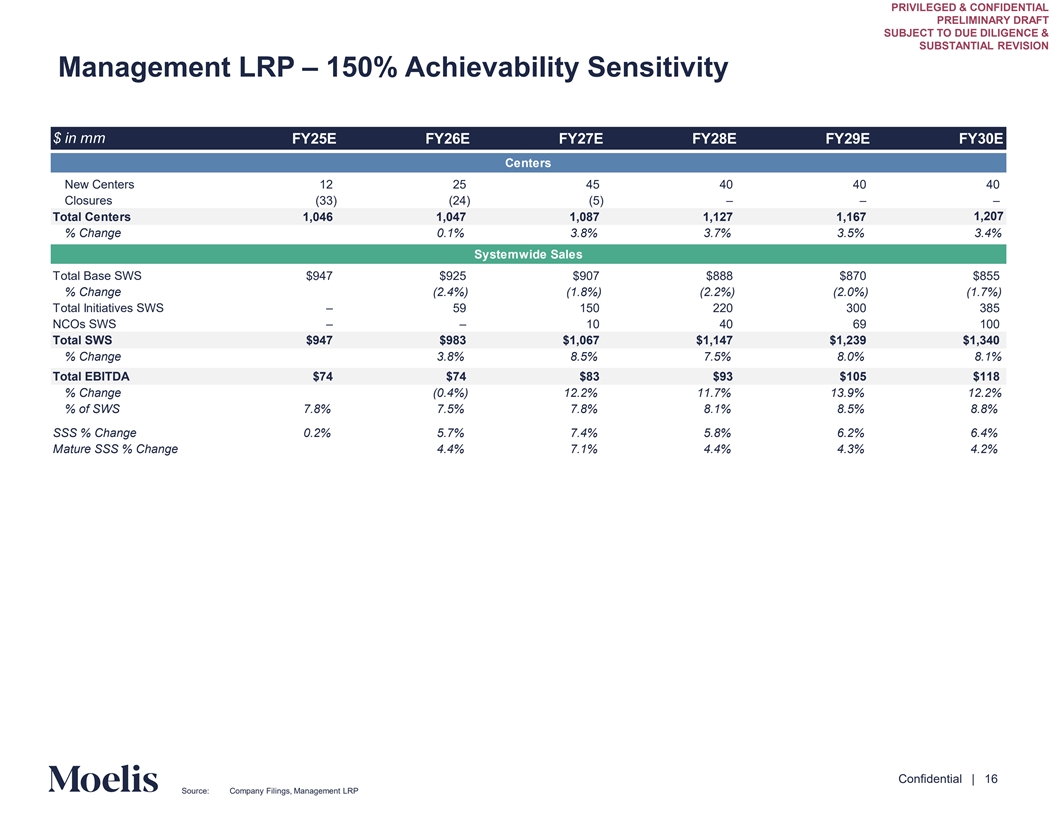
PRIVILEGED & CONFIDENTIAL PRELIMINARY DRAFT SUBJECT TO DUE DILIGENCE & SUBSTANTIAL REVISION Management LRP – 150% Achievability Sensitivity $ in mm FY25E FY26E FY27E FY28E FY29E FY30E Centers New Centers 12 25 45 40 40 40 Closures (33) (24) (5) – – – 1,207 Total Centers 1,046 1,047 1,087 1,127 1,167 % Change 0.1% 3.8% 3.7% 3.5% 3.4% Systemwide Sales Total Base SWS $947 $925 $907 $888 $870 $855 % Change (2.4%) (1.8%) (2.2%) (2.0%) (1.7%) Total Initiatives SWS – 59 150 220 300 385 NCOs SWS – – 10 40 69 100 Total SWS $947 $983 $1,067 $1,147 $1,239 $1,340 % Change 3.8% 8.5% 7.5% 8.0% 8.1% Total EBITDA $74 $74 $83 $93 $105 $118 % Change (0.4%) 12.2% 11.7% 13.9% 12.2% % of SWS 7.8% 7.5% 7.8% 8.1% 8.5% 8.8% SSS % Change 0.2% 5.7% 7.4% 5.8% 6.2% 6.4% Mature SSS % Change 4.4% 7.1% 4.4% 4.3% 4.2% Content must not go below this line Confidential | 16 Source: Company Filings, Management LRP
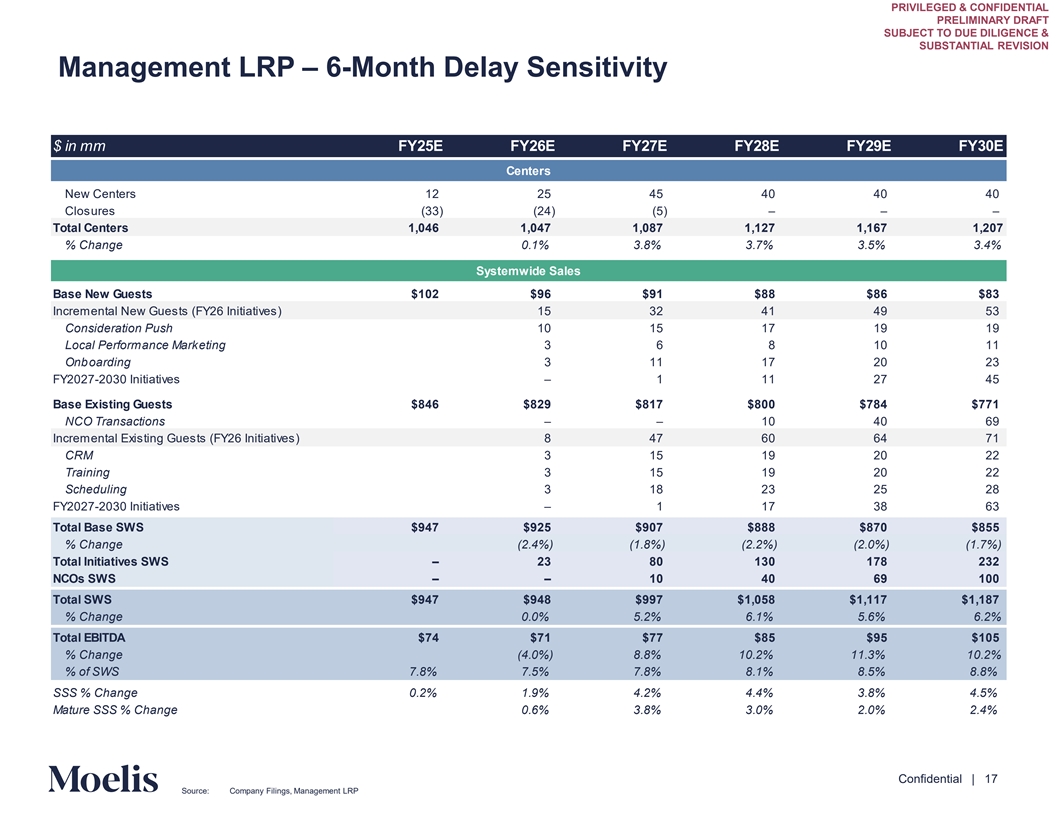
PRIVILEGED & CONFIDENTIAL PRELIMINARY DRAFT SUBJECT TO DUE DILIGENCE & SUBSTANTIAL REVISION Management LRP – 6-Month Delay Sensitivity $ in mm FY25E FY26E FY27E FY28E FY29E FY30E Centers New Centers 12 25 45 40 40 40 Closures (33) (24) (5) – – – Total Centers 1,046 1,047 1,087 1,127 1,167 1,207 % Change 0.1% 3.8% 3.7% 3.5% 3.4% Systemwide Sales Base New Guests $102 $96 $91 $88 $86 $83 Incremental New Guests (FY26 Initiatives) 15 32 41 49 53 Consideration Push 10 15 17 19 19 Local Performance Marketing 3 6 8 10 11 Onboarding 3 11 17 20 23 FY2027-2030 Initiatives – 1 11 27 45 Base Existing Guests $846 $829 $817 $800 $784 $771 NCO Transactions – – 10 40 69 Incremental Existing Guests (FY26 Initiatives) 8 47 60 64 71 CRM 3 15 19 20 22 Training 3 15 19 20 22 Scheduling 3 18 23 25 28 FY2027-2030 Initiatives – 1 17 38 63 Total Base SWS $947 $925 $907 $888 $870 $855 % Change (2.4%) (1.8%) (2.2%) (2.0%) (1.7%) Total Initiatives SWS – 23 80 130 178 232 NCOs SWS – – 10 40 69 100 Total SWS $947 $948 $997 $1,058 $1,117 $1,187 % Change 0.0% 5.2% 6.1% 5.6% 6.2% Total EBITDA $74 $71 $77 $85 $95 $105 % Change (4.0%) 8.8% 10.2% 11.3% 10.2% % of SWS 7.8% 7.5% 7.8% 8.1% 8.5% 8.8% SSS % Change 0.2% 1.9% 4.2% 4.4% 3.8% 4.5% Mature SSS % Change 0.6% 3.8% 3.0% 2.0% 2.4% Content must not go below this line Confidential | 17 Source: Company Filings, Management LRP
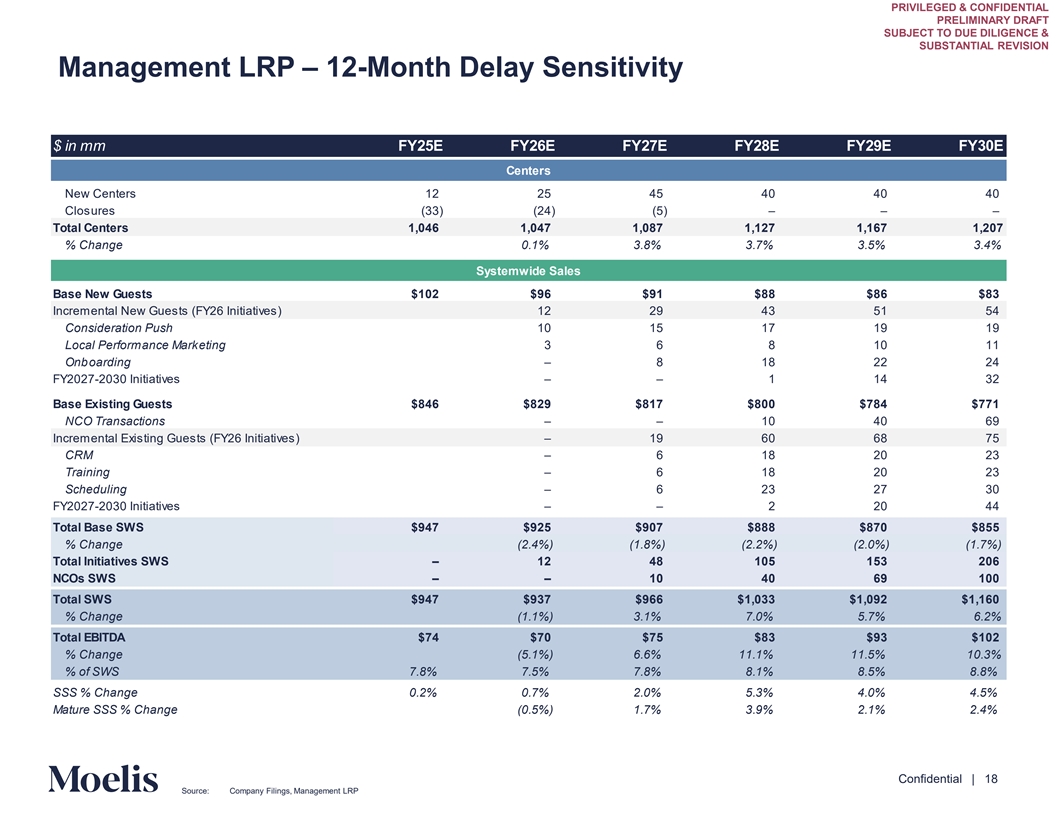
PRIVILEGED & CONFIDENTIAL PRELIMINARY DRAFT SUBJECT TO DUE DILIGENCE & SUBSTANTIAL REVISION Management LRP – 12-Month Delay Sensitivity $ in mm FY25E FY26E FY27E FY28E FY29E FY30E Centers New Centers 12 25 45 40 40 40 Closures (33) (24) (5) – – – Total Centers 1,046 1,047 1,087 1,127 1,167 1,207 % Change 0.1% 3.8% 3.7% 3.5% 3.4% Systemwide Sales Base New Guests $102 $96 $91 $88 $86 $83 Incremental New Guests (FY26 Initiatives) 12 29 43 51 54 Consideration Push 10 15 17 19 19 Local Performance Marketing 3 6 8 10 11 Onboarding – 8 18 22 24 FY2027-2030 Initiatives – – 1 14 32 Base Existing Guests $846 $829 $817 $800 $784 $771 NCO Transactions – – 10 40 69 Incremental Existing Guests (FY26 Initiatives) – 19 60 68 75 CRM – 6 18 20 23 Training – 6 18 20 23 Scheduling – 6 23 27 30 FY2027-2030 Initiatives – – 2 20 44 Total Base SWS $947 $925 $907 $888 $870 $855 % Change (2.4%) (1.8%) (2.2%) (2.0%) (1.7%) Total Initiatives SWS – 12 48 105 153 206 NCOs SWS – – 10 40 69 100 Total SWS $947 $937 $966 $1,033 $1,092 $1,160 % Change (1.1%) 3.1% 7.0% 5.7% 6.2% Total EBITDA $74 $70 $75 $83 $93 $102 % Change (5.1%) 6.6% 11.1% 11.5% 10.3% % of SWS 7.8% 7.5% 7.8% 8.1% 8.5% 8.8% SSS % Change 0.2% 0.7% 2.0% 5.3% 4.0% 4.5% Mature SSS % Change (0.5%) 1.7% 3.9% 2.1% 2.4% Content must not go below this line Confidential | 18 Source: Company Filings, Management LRP
PRIVILEGED & CONFIDENTIAL PRELIMINARY DRAFT SUBJECT TO DUE DILIGENCE & SUBSTANTIAL REVISION Disclaimer This presentation has been prepared by Moelis & Company LLC (“Moelis”) solely for the information and assistance al Cof omm theit tee Spe ofci the Board of Directors of the company codenamed “Elegant” (the “Company”) in considering the matters referred to erial in t s. he Thise s mat presentation is confidential and may not be disclosed (in whole or in part) or utilized for other purposes without the express prior written consent of Moelis. This presentation has been prepared based on information provided by the Company and/or from third party sources. Moelis assumed such information is complete and accurate in all material respects. Moelis has not independently verified such information (or assumed responsibility for the independent verification of such information). To the extent this presentation includes projections, forecasts or other forward-looking statements, Moelis has assumed that such information was reasonably prepared based on the best currently available estimates and judgments of the Company and/or other parties as to the future performance of the Company and/or such other parties. Moelis expresses no views as to the reasonableness of any such projections, forecasts or other forward-looking statements or the assumptions on which they are based. Moelis has not made any independent evaluation or appraisal of any of the assets or liabilities (contingent, derivative, off-balance-sheet, or otherwise) of the Company or any other party. Moelis’ participation in any due diligence review is solely for purposes of dvsup ice po anrtd ing an alits ysia s. This presentation is based on economic, monetary, market and other conditions as in effect on, and the information made available to us as of, the date hereof, and Moelis assumes no obligation to update this presentation or correct any information herein. No company or transaction used in this presentation is identical to the Company or any potential transaction. The analyses set forth in this presentation do not purport to be appraisals and such analyses do not reflect Moelis’ views of the prices at which businesses or actual secu ly mritay ies be sold. Because the analyses described in these materials (including the information used in such analyses) are inherently subject to uncertainty, Moelis does not assume responsibility if future results are materially different from those forecast. This presentation was designed for use by certain persons familiar with the business of the Company. This presentation is not intended to provide the sole basis for any decision on any transaction or strategic alternative and is not a recommendation with respect to any transaction or strategic alternative. This presentation does not address the Special Committee’s underlying business decision t o recomm explore end or any transaction or strategic alternative or the relative merits of any transaction or strategic alternative as compared to any alternative business strategies or transactions that might be available to the Company. Nothing contained in this presentation should be construed as legal, regulatory, tax or accounting advice. Moelis and its affiliates are engaged globally in a wide range of investment banking and other activities for their own account and otherwise. Moelis and its affiliates may have advised, may seek to advise and may in the future advise in companies referred to in this presentation. Personnel of Moelis or such affiliates may make statements or provide advice that is contrary to information included in this presentation. The proprietary interests of Moelis or its affiliates may conflict with your interests. In addition, Moelis and its affiliates and their personnel may from time to time have positions in or effect transactions in securities referred to in this material (or derivatives of such securities), or serve as a director of companies referred to in this presentation. Content must not go below this line Confidential | 19