Exhibit (c)(iv) PRIVILEGED & CONFIDENTIAL PRELIMINARY DRAFT SUBJECT TO DUE DILIGENCE & SUBSTANTIAL REVISION Project Elegant Discussion Materials January 13, 2026 PRELIMINARY DRAFT SUBJECT TO SUBSTANTIAL REVISION AND REVIEW BY MOELIS VALUATION COMMITTEE Content must not go below this line
PRIVILEGED & CONFIDENTIAL PRELIMINARY DRAFT SUBJECT TO DUE DILIGENCE & SUBSTANTIAL REVISION 1. Executive Summary Content must not go below this line Confidential | 1
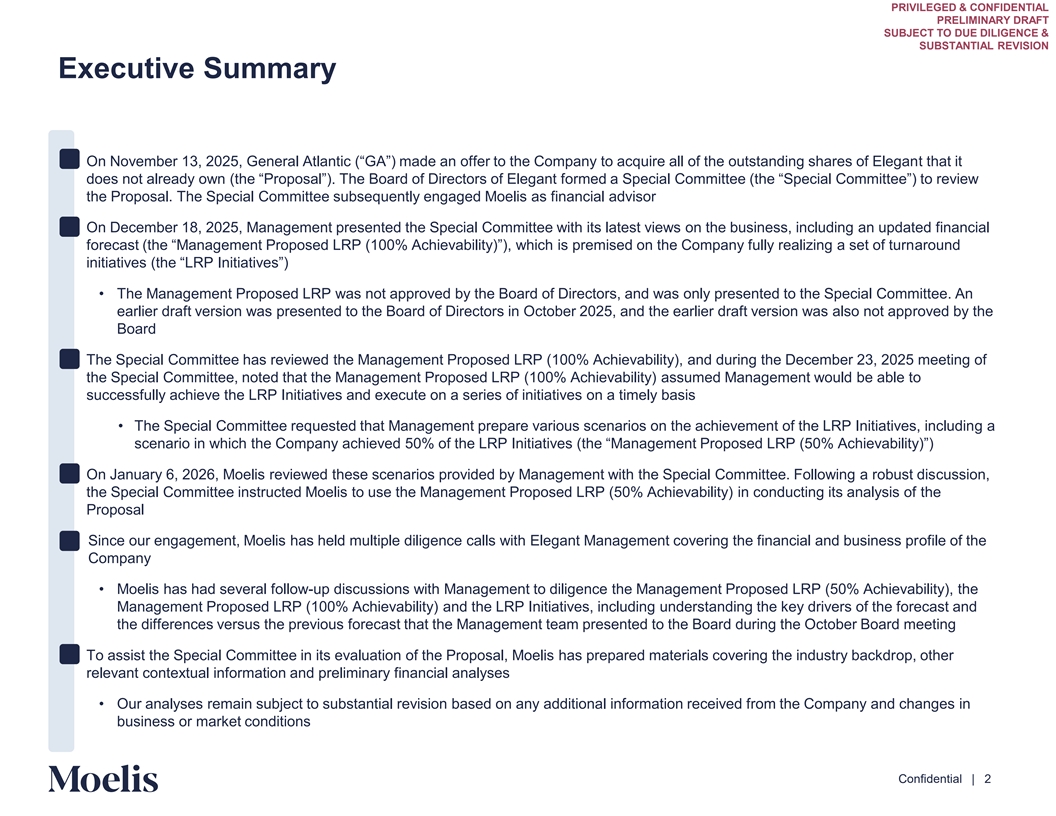
PRIVILEGED & CONFIDENTIAL PRELIMINARY DRAFT SUBJECT TO DUE DILIGENCE & SUBSTANTIAL REVISION Executive Summary • On November 13, 2025, General Atlantic (“GA”) made an offer to the Company to acquire all of the outstanding shares t tha oft itE legan does not already own (the “ProposalT”)he . Board of Directors of Elegant formed a Special Committee (the “Special Committee”) to review the Proposal. The Special Committee subsequently engaged Moelis as financial advisor • On December 18, 2025, Management presented the Special Committee with its latest views on the business, including an updated financial forecast (the “Management Proposed LRP (100% Achievability)”), which is premised on the Company fully realizing a set around of turn initiatives (the “LRP Initiatives”) • The Management Proposed LRP was not approved by the Board of Directors, and was only presented to the Special Committee. An earlier draft version was presented to the Board of Directors in October 2025, and the earlier draft version was also not approved by the Board • The Special Committee has reviewed the Management Proposed LRP (100% Achievability), and during the December 23, 2025 meeting of the Special Committee, noted that the Management Proposed LRP (100% Achievability) assumed Management would be able to successfully achieve the LRP Initiatives and execute on a series of initiatives on a timely basis • The Special Committee requested that Management prepare various scenarios on the achievement of the LRP Initiatives, including a scenario in which the Company achieved 50% of the LRP Initiatives (the “Management Proposed LRP (50% Achievability)”) • On January 6, 2026, Moelis reviewed these scenarios provided by Management with the Special Committee. Following a robust discussion, the Special Committee instructed Moelis to use the Management Proposed LRP (50% Achievability) in conducting its analysis of the Proposal • Since our engagement, Moelis has held multiple diligence calls with Elegant Management covering the financial and business profile of the Company • Moelis has had several follow-up discussions with Management to diligence the Management Proposed LRP (50% Achievability), the Management Proposed LRP (100% Achievability) and the LRP Initiatives, including understanding the key drivers of the forecast and the differences versus the previous forecast that the Management team presented to the Board during the October Board meeting • To assist the Special Committee in its evaluation of the Proposal, Moelis has prepared materials covering the industry backdrop, other relevant contextual information and preliminary financial analyses • Our analyses remain subject to substantial revision based on any additional information received from the Company and changes in business or market conditions Content must not go below this line Confidential | 2
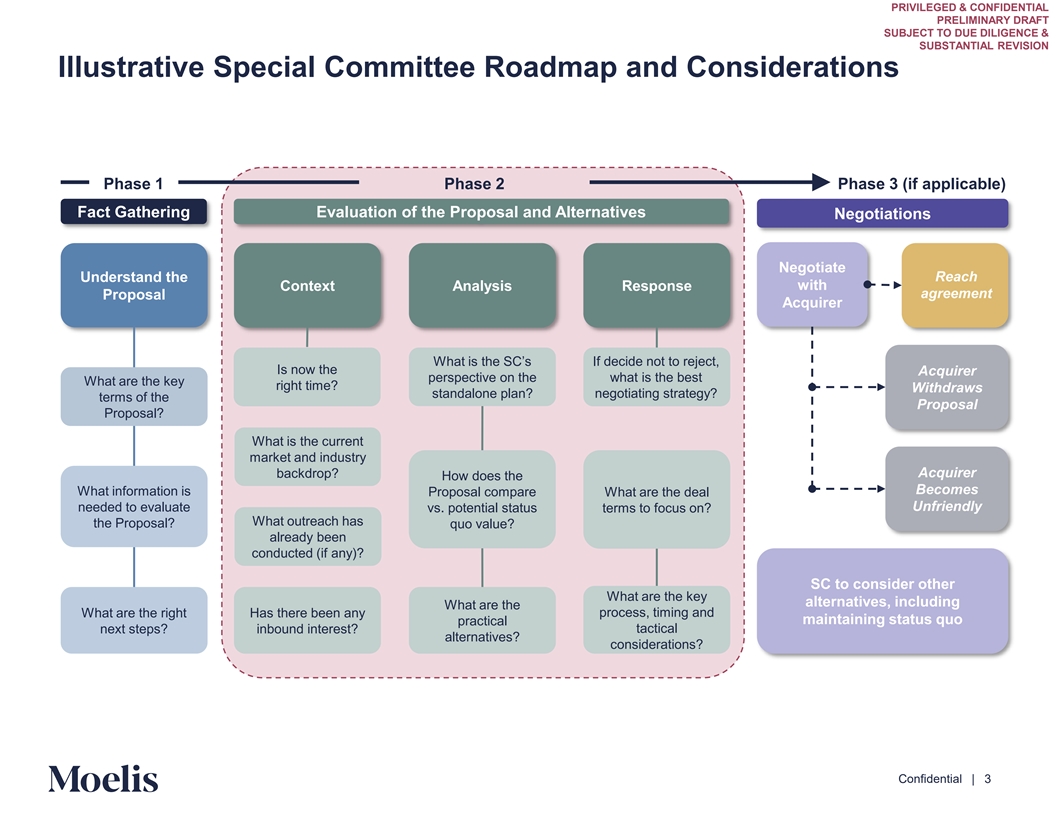
PRIVILEGED & CONFIDENTIAL PRELIMINARY DRAFT SUBJECT TO DUE DILIGENCE & SUBSTANTIAL REVISION Illustrative Special Committee Roadmap and Considerations Phase 1 Phase 2 Phase 3 (if applicable) Fact Gathering Evaluation of the Proposal and Alternatives Negotiations Negotiate Reach Understand the Context Analysis Response with agreement Proposal Acquirer What is the SC’s If decide not to reject, Is now the Acquirer perspective on the what is the best What are the key right time? Withdraws standalone plan? negotiating strategy? terms of the Proposal Proposal? What is the current market and industry Acquirer backdrop? How does the Becomes What information is Proposal compare What are the deal Unfriendly needed to evaluate vs. potential status terms to focus on? What outreach has the Proposal? quo value? already been conducted (if any)? SC to consider other What are the key alternatives, including What are the What are the right Has there been any process, timing and maintaining status quo practical next steps? inbound interest? tactical alternatives? considerations? Content must not go below this line Confidential | 3
PRIVILEGED & CONFIDENTIAL PRELIMINARY DRAFT SUBJECT TO DUE DILIGENCE & SUBSTANTIAL REVISION 2. Additional Context for Evaluating the Offer Content must not go below this line Confidential | 4
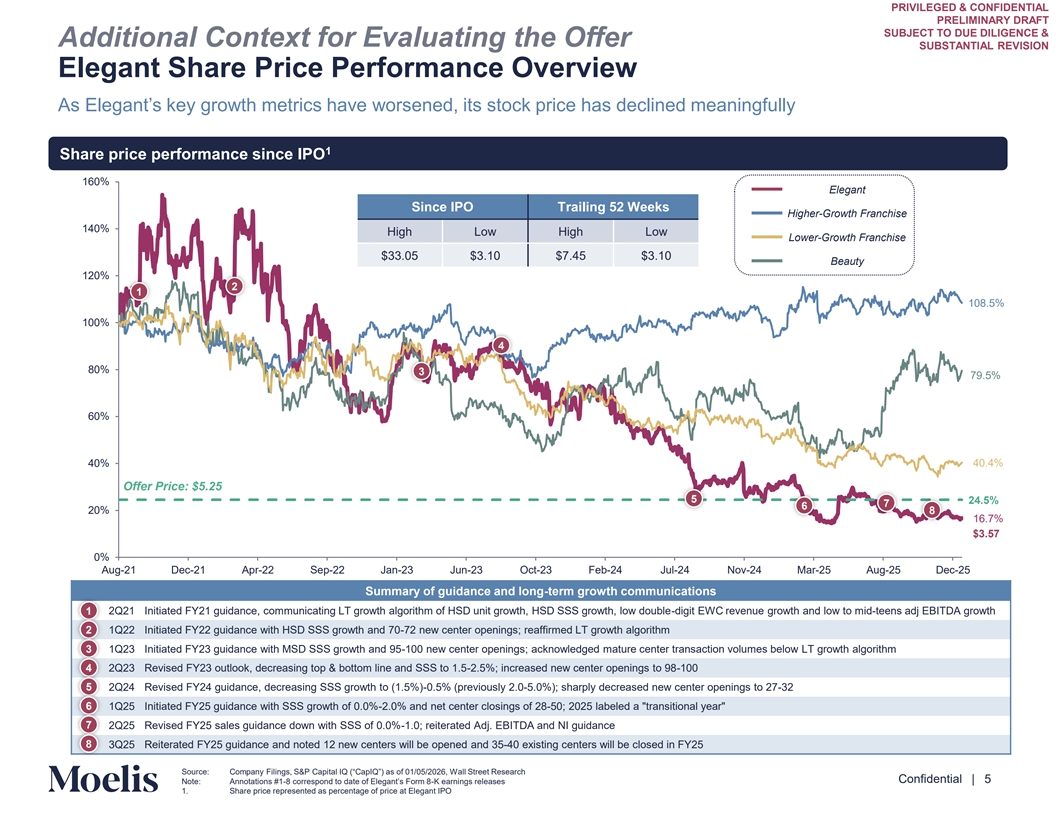
PRIVILEGED & CONFIDENTIAL PRELIMINARY DRAFT SUBJECT TO DUE DILIGENCE & Additional Context for Evaluating the Offer SUBSTANTIAL REVISION Elegant Share Price Performance Overview As Elegant’s key growth metrics have worsened, its stock price has declined meaningfully 1 Share price performance since IPO 160% Elegant Since IPO Trailing 52 Weeks Higher-Growth Franchise 140% High Low High Low Lower-Growth Franchise $33.05 $3.10 $7.45 $3.10 Beauty 120% 2 1 108.5% 100% 4 80% 3 79.5% 60% 40% 40.4% Offer Price: $5.25 5 24.5% 7 6 20% 8 16.7% $3.57 0% Aug-21 Dec-21 Apr-22 Sep-22 Jan-23 Jun-23 Oct-23 Feb-24 Jul-24 Nov-24 Mar-25 Aug-25 Dec-25 Summary of guidance and long-term growth communications 1 2Q21 Initiated FY21 guidance, communicating LT growth algorithm of HSD unit growth, HSD SSS growth, low double-digit EWC revenue growth and low to mid-teens adj EBITDA growth 2 1Q22 Initiated FY22 guidance with HSD SSS growth and 70-72 new center openings; reaffirmed LT growth algorithm 3 1Q23 Initiated FY23 guidance with MSD SSS growth and 95-100 new center openings; acknowledged mature center transaction volumes below LT growth algorithm 4 2Q23 Revised FY23 outlook, decreasing top & bottom line and SSS to 1.5-2.5%; increased new center openings to 98-100 5 2Q24 Revised FY24 guidance, decreasing SSS growth to (1.5%)-0.5% (previously 2.0-5.0%); sharply decreased new center openings to 27-32 6 1Q25 Initiated FY25 guidance with SSS growth of 0.0%-2.0% and net center closings of 28-50; 2025 labeled a transitional year 7 2Q25 Revised FY25 sales guidance down with SSS of 0.0%-1.0; reiterated Adj. EBITDA and NI guidance 8 3Q25 Reiterated FY25 guidance and noted 12 new centers will be opened and 35-40 existing centers will be closed in FY25 Content must not go below this line Source: Company Filings, S&P Capital IQ (“CapIQ”) as of 01/05/2026, Wall Street Research Confidential | 5 Note: Annotations #1-8 correspond to date of Elegant’s For-m K 8 earnings releases 1. Share price represented as percentage of price at Elegant IPO
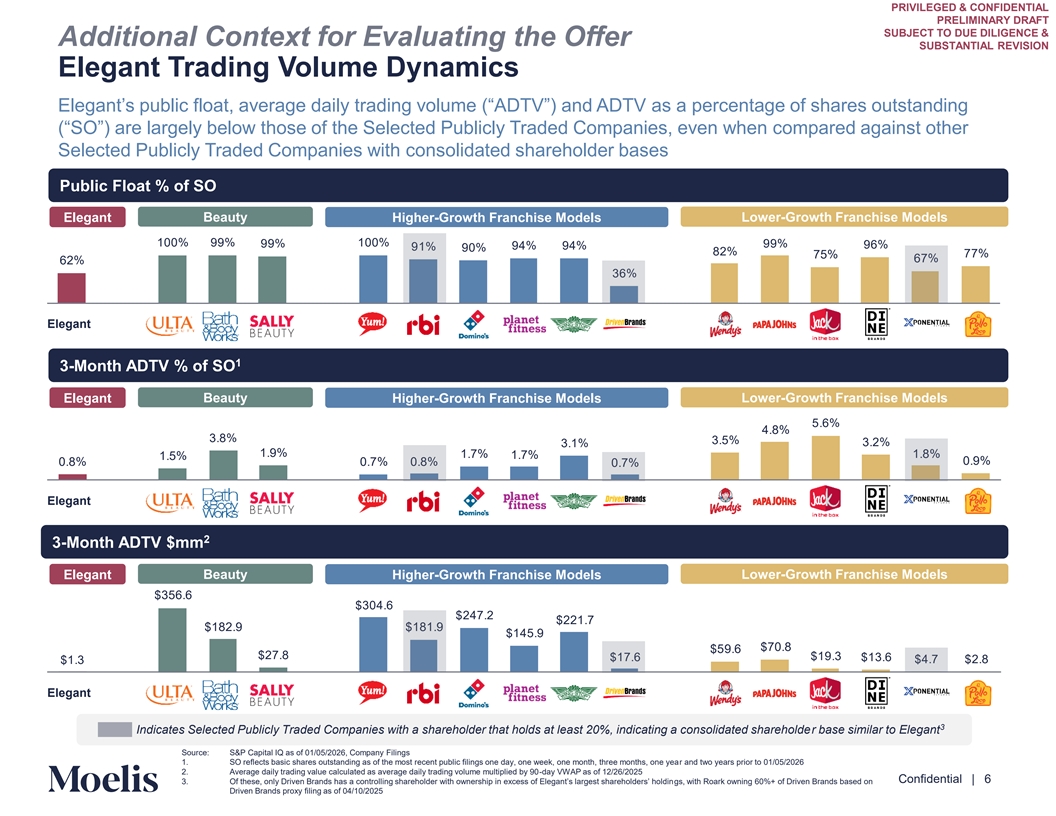
PRIVILEGED & CONFIDENTIAL PRELIMINARY DRAFT SUBJECT TO DUE DILIGENCE & Additional Context for Evaluating the Offer SUBSTANTIAL REVISION Elegant Trading Volume Dynamics Elegant’s public float, average daily trading volume (“ADTV”) and ADTV as a percentage of shares outstanding (“SO”) are largely below those of the Selected Publicly Traded Companies, even when compared against other Selected Publicly Traded Companies with consolidated shareholder bases Public Float % of SO Beauty Lower-Growth Franchise Models Elegant Higher-Growth Franchise Models 100% % 100% % % % % 6% 1% 0% 82% % 5% 6 % 62% 36% Elegant 1 3-Month ADTV % of SO Elegant Beauty Higher-Growth Franchise Models Lower-Growth Franchise Models 5.6% .8% 3.8% 3.5% 3.2% 3.1% 1. % 1. % 1. % 1.8% 1.5% 0. % 0.8% 0. % 0.8% 0. % Elegant 2 3-Month ADTV $mm Beauty Lower-Growth Franchise Models Elegant Higher-Growth Franchise Models 356.6 30 .6 2 .2 221. 182. 181. 1 5. 0.8 5 .6 2 .8 1 .3 1 .6 13.6 1.3 . 2.8 Elegant 3 Indicates Selected Publicly Traded Companies with a shareholder that holds at least 20%, indicating a consolidated shareholder base similar to Elegant Content must not Source: S&P Capital IQ as of 01/05/2026, Company Filings 1. SO reflects basic shares outstanding as of the most recent public filings one day, one week, one month, three months, one year and two years prior to 01/05/2026 go below this line 2. Average daily trading value calculated as average daily trading volume multiplied by 90-day VWAP as of 12/26/2025 Confidential | 6 3. Of these, only Driven Brands has a controlling shareholder with ownership in excess of Elegant’s largest shareholde grs, s’ h wio thld Ro in ark owning 60%+ of Driven Brands based on Driven Brands proxy filing as of 04/10/2025
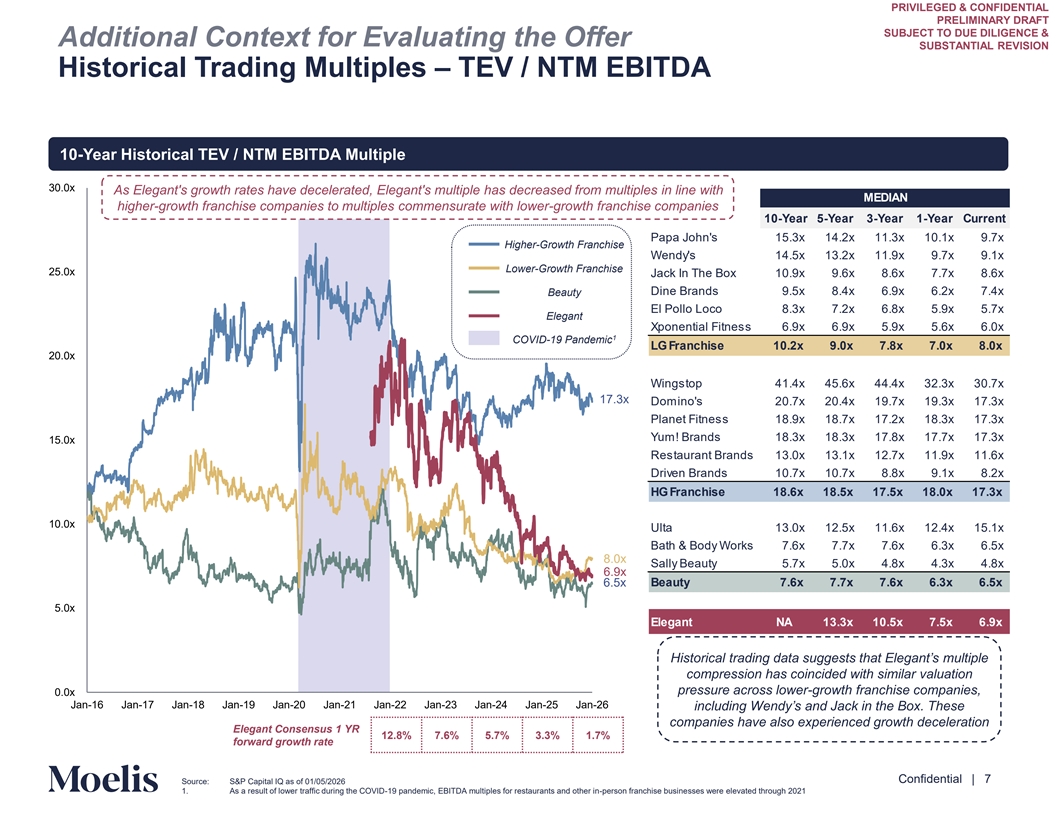
PRIVILEGED & CONFIDENTIAL PRELIMINARY DRAFT SUBJECT TO DUE DILIGENCE & Additional Context for Evaluating the Offer SUBSTANTIAL REVISION Historical Trading Multiples – TEV / NTM EBITDA 10-Year Historical TEV / NTM EBITDA Multiple 30.0x As Elegant's growth rates have decelerated, Elegant's multiple has decreased from multiples in line with MEDIAN higher-growth franchise companies to multiples commensurate with lower-growth franchise companies 10-Year 5-Year 3-Year 1-Year Current Papa John's 15.3x 14.2x 11.3x 10.1x 9.7x Higher-Growth Franchise Wendy's 14.5x 13.2x 11.9x 9.7x 9.1x Lower-Growth Franchise 25.0x Jack In The Box 10.9x 9.6x 8.6x 7.7x 8.6x Beauty Dine Brands 9.5x 8.4x 6.9x 6.2x 7.4x El Pollo Loco 8.3x 7.2x 6.8x 5.9x 5.7x Elegant Xponential Fitness 6.9x 6.9x 5.9x 5.6x 6.0x 1 COVID-19 Pandemic LG Franchise 10.2x 9.0x 7.8x 7.0x 8.0x 20.0x Wingstop 41.4x 45.6x 44.4x 32.3x 30.7x 17.3x Domino's 20.7x 20.4x 19.7x 19.3x 17.3x Planet Fitness 18.9x 18.7x 17.2x 18.3x 17.3x Yum! Brands 18.3x 18.3x 17.8x 17.7x 17.3x 15.0x Restaurant Brands 13.0x 13.1x 12.7x 11.9x 11.6x Driven Brands 10.7x 10.7x 8.8x 9.1x 8.2x HG Franchise 18.6x 18.5x 17.5x 18.0x 17.3x 10.0x Ulta 13.0x 12.5x 11.6x 12.4x 15.1x Bath & Body Works 7.6x 7.7x 7.6x 6.3x 6.5x 8.0x Sally Beauty 5.7x 5.0x 4.8x 4.3x 4.8x 6.9x 6.5x Beauty 7.6x 7.7x 7.6x 6.3x 6.5x 5.0x Elegant NA 13.3x 10.5x 7.5x 6.9x Historical trading data suggests that Elegant’s multiple compression has coincided with similar valuation pressure across lower-growth franchise companies, 0.0x Jan-16 Jan-17 Jan-18 Jan-19 Jan-20 Jan-21 Jan-22 Jan-23 Jan-24 Jan-25 Jan-26 including Wendy’s and Jack in the Box. These companies have also experienced growth deceleration Elegant Consensus 1 YR 12.8% 7.6% 5.7% 3.3% 1.7% forward growth rate Content must not go below this line Confidential | 7 Source: S&P Capital IQ as of 01/05/2026 1. As a result of lower traffic during the COVID-19 pandemic, EBITDA multiples for restaurants and other in-person franchise businesses were elevated through 2021
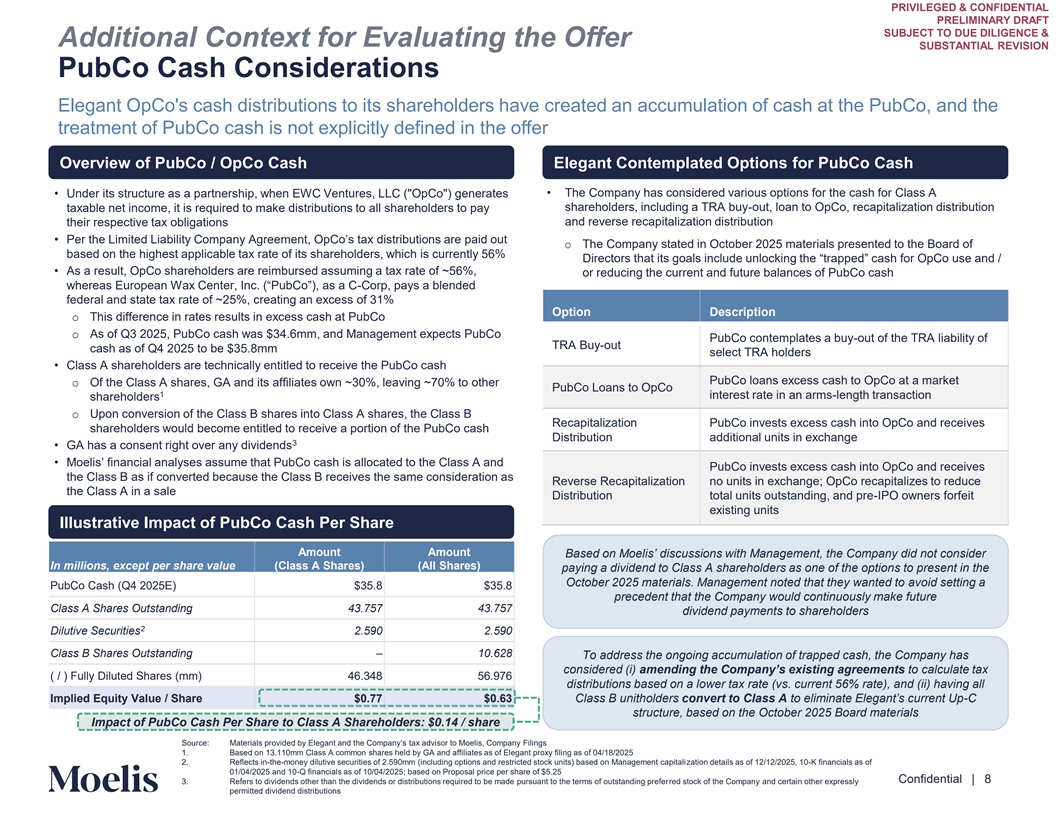
PRIVILEGED & CONFIDENTIAL PRELIMINARY DRAFT SUBJECT TO DUE DILIGENCE & Additional Context for Evaluating the Offer SUBSTANTIAL REVISION PubCo Cash Considerations Elegant OpCo's cash distributions to its shareholders have created an accumulation of cash at the PubCo, and the treatment of PubCo cash is not explicitly defined in the offer Overview of PubCo / OpCo Cash Elegant Contemplated Options for PubCo Cash • Under its structure as a partnership, when EWC Ventures, LLC ( OpCo ) generates • The Company has considered various options for the cash for Class A taxable net income, it is required to make distributions to all shareholders to pay shareholders, including a TRA buy-out, loan to OpCo, recapitalization distribution and reverse recapitalization distribution their respective tax obligations • Per the Limited Liability Company Agreement, OpCo’s tax distributions are paid out o The Company stated in October 2025 materials presented to the Board of based on the highest applicable tax rate of its shareholders, which is currently 56% Directors that its goals include unlocking the “trapped” cash for OpCo use and / • As a result, OpCo shareholders are reimbursed assuming a tax rate of ~56%, or reducing the current and future balances of PubCo cash whereas European Wax Center, Inc. (“PubCo”), as -Corp a C , pays a blended federal and state tax rate of ~25%, creating an excess of 31% Option Description o This difference in rates results in excess cash at PubCo o As of Q3 2025, PubCo cash was $34.6mm, and Management expects PubCo PubCo contemplates a buy-out of the TRA liability of TRA Buy-out cash as of Q4 2025 to be $35.8mm select TRA holders • Class A shareholders are technically entitled to receive the PubCo cash PubCo loans excess cash to OpCo at a market o Of the Class A shares, GA and its affiliates own ~30%, leaving ~70% to other PubCo Loans to OpCo 1 interest rate in an arms-length transaction shareholders o Upon conversion of the Class B shares into Class A shares, the Class B Recapitalization PubCo invests excess cash into OpCo and receives shareholders would become entitled to receive a portion of the PubCo cash Distribution additional units in exchange 3 • GA has a consent right over any dividends • Moelis’ financial analyses assume that PubCo cash is allocated to the Class A and PubCo invests excess cash into OpCo and receives the Class B as if converted because the Class B receives the same consideration as Reverse Recapitalization no units in exchange; OpCo recapitalizes to reduce the Class A in a sale Distribution total units outstanding, and pre-IPO owners forfeit existing units Illustrative Impact of PubCo Cash Per Share Amount Amount Based on Moelis’ discussions with Management, the Company did not consider In millions, except per share value (Class A Shares) (All Shares) paying a dividend to Class A shareholders as one of the options to present in the October 2025 materials. Management noted that they wanted to avoid setting a PubCo Cash (Q4 2025E) $35.8 $35.8 precedent that the Company would continuously make future Class A Shares Outstanding 43.757 43.757 dividend payments to shareholders 2 Dilutive Securities 2.590 2.590 Class B Shares Outstanding – 10.628 To address the ongoing accumulation of trapped cash, the Company has considered (i) amending the Company’s existing agreements to calculate tax ( / ) Fully Diluted Shares (mm) 46.348 56.976 distributions based on a lower tax rate (vs. current 56% rate), and (ii) having all Implied Equity Value / Share $0.77 $0.63 Class B unitholders convert to Class A to eliminate Elegant’s current Up-C structure, based on the October 2025 Board materials Impact of PubCo Cash Per Share to Class A Shareholders: $0.14 / share Source: Materials provided by Elegant and the Company’s tax advisor to Moelis, Company Filings Content must not 1. Based on 13.110mm Class A common shares held by GA and affiliates as of Elegant proxy filing as of 04/18/2025 2. Reflects in-the-money dilutive securities of 2.590mm (including options and restricted stock units) based on Management capitalization details as of 12/12/2025, 10-K financials as of go below this line 01/04/2025 and 10-Q financials as of 10/04/2025; based on Proposal price per share of $5.25 Confidential | 8 3. Refers to dividends other than the dividends or distributions required to be made pursuant to the terms of outstanding preferred stock of the Company and certain other expressly permitted dividend distributions
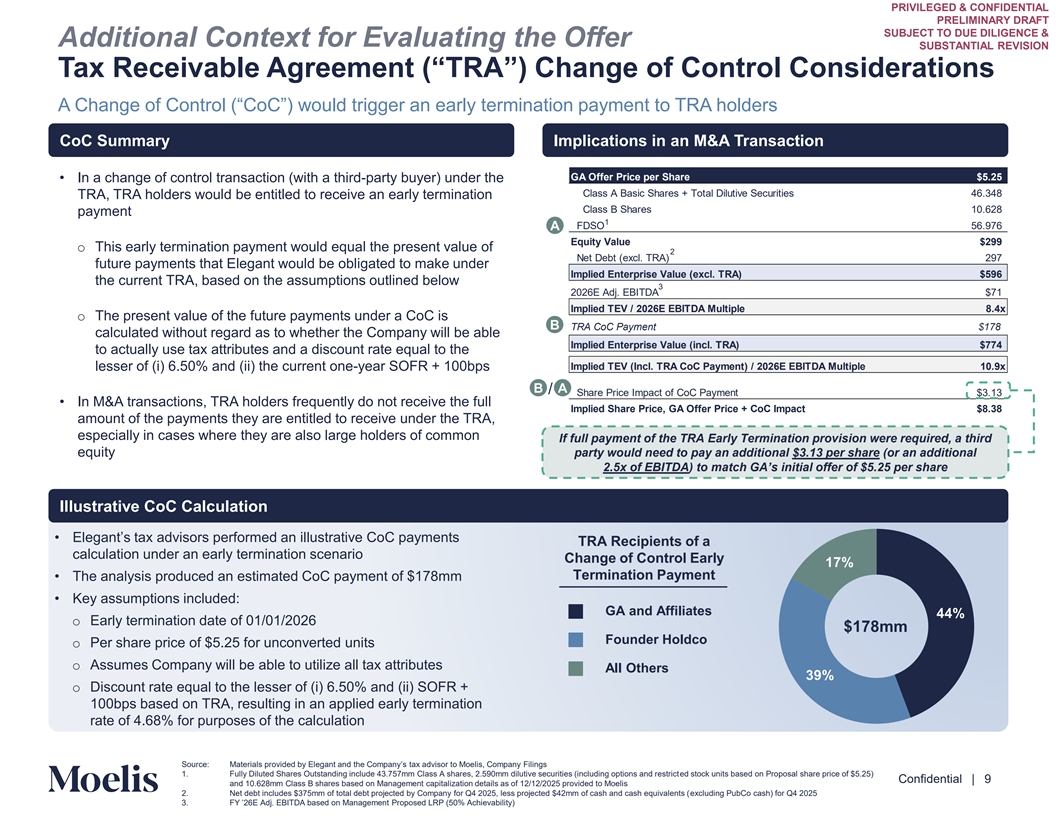
PRIVILEGED & CONFIDENTIAL PRELIMINARY DRAFT SUBJECT TO DUE DILIGENCE & Additional Context for Evaluating the Offer SUBSTANTIAL REVISION Tax Receivable Agreement (“TRA”) Change of Control Considerations A Change of Control (“CoC”) would trigger an early termination payment to TRA holders CoC Summary Implications in an M&A Transaction GA Offer Price per Share $5.25 • In a change of control transaction (with a third-party buyer) under the Class A Basic Shares + Total Dilutive Securities 46.348 TRA, TRA holders would be entitled to receive an early termination Class B Shares 10.628 payment 1 FDSO 56.976 A Equity Value $299 o This early termination payment would equal the present value of 2 Net Debt (excl. TRA) 297 future payments that Elegant would be obligated to make under Implied Enterprise Value (excl. TRA) $596 the current TRA, based on the assumptions outlined below 3 2026E Adj. EBITDA $71 Implied TEV / 2026E EBITDA Multiple 8.4x o The present value of the future payments under a CoC is B TRA CoC Payment $178 calculated without regard as to whether the Company will be able Implied Enterprise Value (incl. TRA) $774 to actually use tax attributes and a discount rate equal to the lesser of (i) 6.50% and (ii) the current one-year SOFR + 100bps Implied TEV (Incl. TRA CoC Payment) / 2026E EBITDA Multiple 10.9x B A / Share Price Impact of CoC Payment $3.13 • In M&A transactions, TRA holders frequently do not receive the full Implied Share Price, GA Offer Price + CoC Impact $8.38 amount of the payments they are entitled to receive under the TRA, especially in cases where they are also large holders of common If full payment of the TRA Early Termination provision were required, a third equity party would need to pay an additional $3.13 per share (or an additional 2.5x of EBITDA) to match GA’s initial offer of $5.25 per share Illustrative CoC Calculation • Elegant’s tax advisors performed an illustrative CoC payments TRA Recipients of a calculation under an early termination scenario Change of Control Early Termination Payment • The analysis produced an estimated CoC payment of $178mm • Key assumptions included: GA and Affiliates o Early termination date of 01/01/2026 $178mm Founder Holdco o Per share price of $5.25 for unconverted units o Assumes Company will be able to utilize all tax attributes All Others o Discount rate equal to the lesser of (i) 6.50% and (ii) SOFR + 100bps based on TRA, resulting in an applied early termination rate of 4.68% for purposes of the calculation Content must not Source: Materials provided by Elegant and the Company’s tax adviso to r Moelis, Company Filings go below this line 1. Fully Diluted Shares Outstanding include 43.757mm Class A shares, 2.590mm dilutive securities (including options and restricted stock units based on Proposal share price of $5.25) Confidential | 9 and 10.628mm Class B shares based on Management capitalization details as of 12/12/2025 provided to Moelis 2. Net debt includes $375mm of total debt projected by Company for Q4 2025, less projected $42mm of cash and cash equivalents (excluding PubCo cash) for Q4 2025 3. FY ’26E Adj. EBITDA based on Management Proposed LRP (50% Achievability)
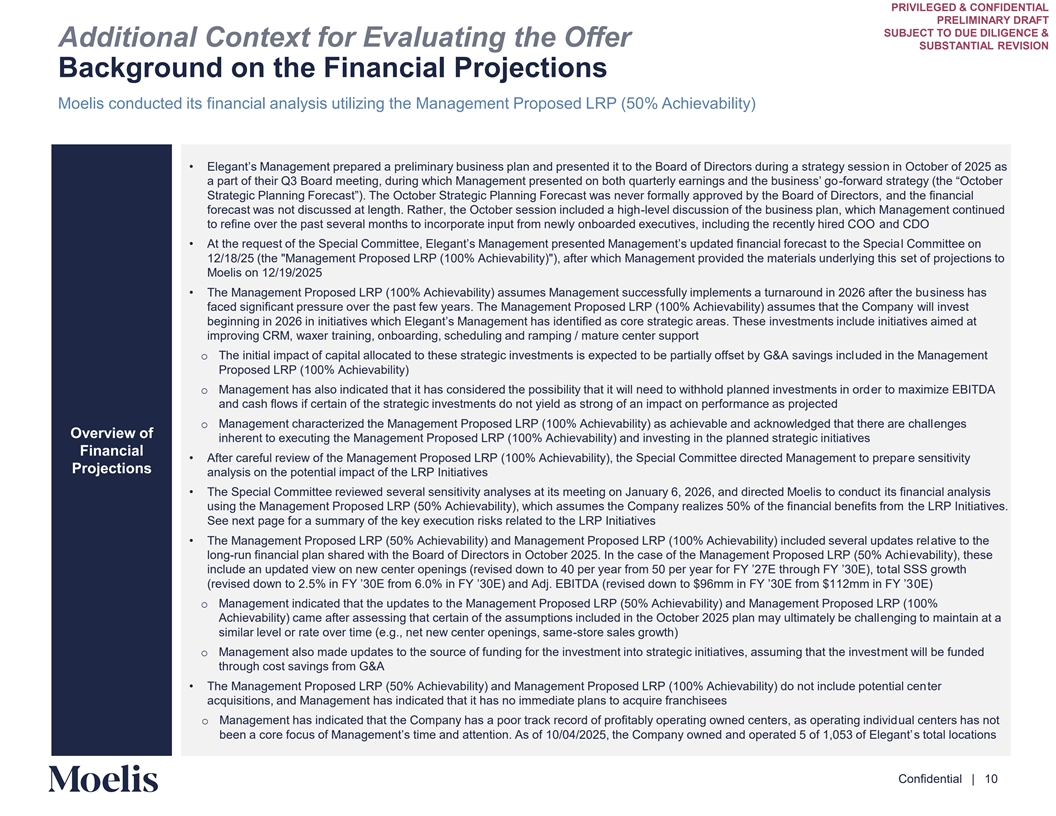
PRIVILEGED & CONFIDENTIAL PRELIMINARY DRAFT SUBJECT TO DUE DILIGENCE & Additional Context for Evaluating the Offer SUBSTANTIAL REVISION Background on the Financial Projections Moelis conducted its financial analysis utilizing the Management Proposed LRP (50% Achievability) • Elegant’s Management prepared a preliminary business plan and presented it to the Board of Directors during a strate ng iny Oc ses tosbio er of 2025 as a part of their Q3 Board meeting, during which Management presented on both quarterly earnings and the bu-s foin rw es as rd ’ g so trategy (the “October Strategic Planning Forecast”). The October Strategic Planning Forecast was never formally approved by the Board of Dir ane dc th toers fi,nancial forecast was not discussed at length. Rather, the October session included a high-level discussion of the business plan, which Management continued to refine over the past several months to incorporate input from newly onboarded executives, including the recently hired COO and CDO • At the request of the Special Committee, Elegant’s Management presented Management’s updated financial forecast to thle C oSp me mciittaee on 12/18/25 (the Management Proposed LRP (100% Achievability) ), after which Management provided the materials underlying this set of projections to Moelis on 12/19/2025 • The Management Proposed LRP (100% Achievability) assumes Management successfully implements a turnaround in 2026 after the business has faced significant pressure over the past few years. The Management Proposed LRP (100% Achievability) assumes that the Company will invest beginning in 2026 in initiatives which Elegant’s Management has identified as core strategic areas. These investments iniinc tiatilude ves aimed at improving CRM, waxer training, onboarding, scheduling and ramping / mature center support o The initial impact of capital allocated to these strategic investments is expected to be partially offset by G&A savings included in the Management Proposed LRP (100% Achievability) o Management has also indicated that it has considered the possibility that it will need to withhold planned investments in order to maximize EBITDA and cash flows if certain of the strategic investments do not yield as strong of an impact on performance as projected o Management characterized the Management Proposed LRP (100% Achievability) as achievable and acknowledged that there are challenges Overview of inherent to executing the Management Proposed LRP (100% Achievability) and investing in the planned strategic initiatives Financial • After careful review of the Management Proposed LRP (100% Achievability), the Special Committee directed Management to prepare sensitivity Projections analysis on the potential impact of the LRP Initiatives • The Special Committee reviewed several sensitivity analyses at its meeting on January 6, 2026, and directed Moelis to conduct its financial analysis using the Management Proposed LRP (50% Achievability), which assumes the Company realizes 50% of the financial benefits from the LRP Initiatives. See next page for a summary of the key execution risks related to the LRP Initiatives • The Management Proposed LRP (50% Achievability) and Management Proposed LRP (100% Achievability) included several updates relative to the long-run financial plan shared with the Board of Directors in October 2025. In the case of the Management Proposed LRP (50% Achievability), these include an updated view on new center openings (revised down to 0 per year from 50 per year for FY ’2 E throughta FY l SSS g ’30E), rowto th (revised down to 2.5% in FY ’30E from 6.0% in FY ’30E) and Adj. EBITDA (revised down to 6mm in FY ’30E from 11 02 E)mm in FY ’3 o Management indicated that the updates to the Management Proposed LRP (50% Achievability) and Management Proposed LRP (100% Achievability) came after assessing that certain of the assumptions included in the October 2025 plan may ultimately be challenging to maintain at a similar level or rate over time (e.g., net new center openings, same-store sales growth) o Management also made updates to the source of funding for the investment into strategic initiatives, assuming that the investment will be funded through cost savings from G&A • The Management Proposed LRP (50% Achievability) and Management Proposed LRP (100% Achievability) do not include potential center acquisitions, and Management has indicated that it has no immediate plans to acquire franchisees o Management has indicated that the Company has a poor track record of profitably operating owned centers, as operating individual centers has not been a core focus of Management’s time and attention. As of 10/0 /2025, the Company owned and operated 5 of 1,053s o tof taEl l le og ca an tit’ ons Content must not go below this line Confidential | 10
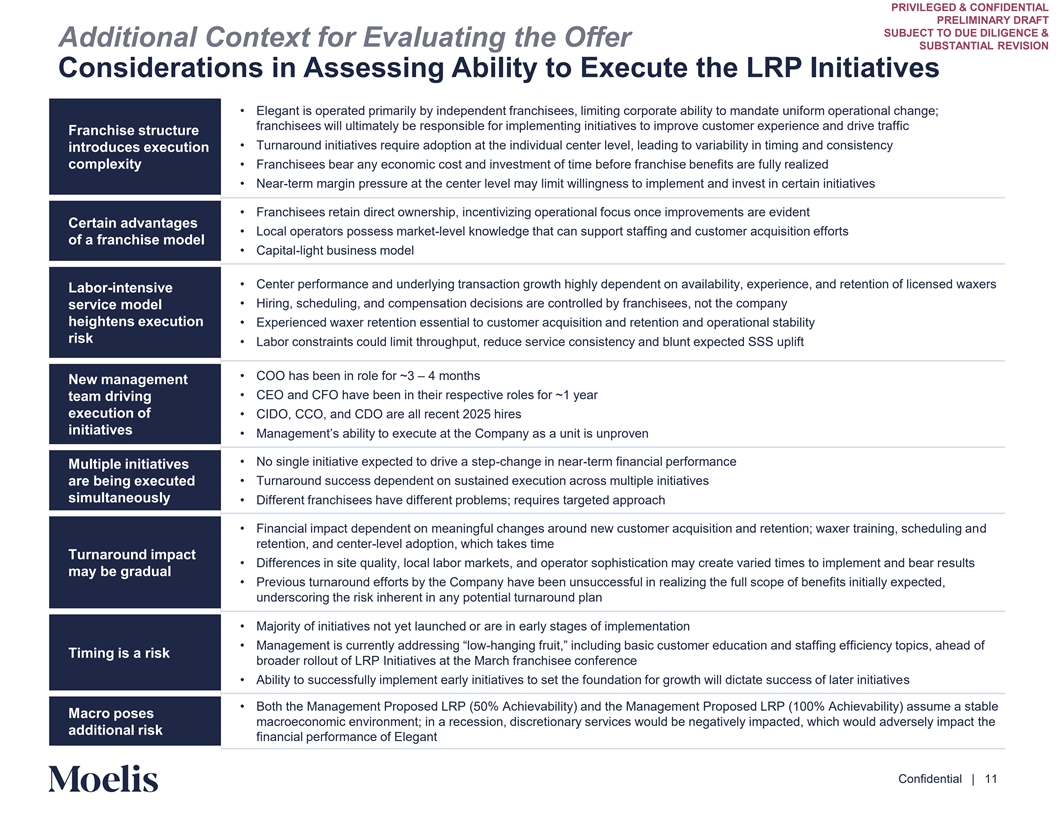
PRIVILEGED & CONFIDENTIAL PRELIMINARY DRAFT SUBJECT TO DUE DILIGENCE & Additional Context for Evaluating the Offer SUBSTANTIAL REVISION Considerations in Assessing Ability to Execute the LRP Initiatives • Elegant is operated primarily by independent franchisees, limiting corporate ability to mandate uniform operational change; franchisees will ultimately be responsible for implementing initiatives to improve customer experience and drive traffic Franchise structure • Turnaround initiatives require adoption at the individual center level, leading to variability in timing and consistency introduces execution complexity • Franchisees bear any economic cost and investment of time before franchise benefits are fully realized • Near-term margin pressure at the center level may limit willingness to implement and invest in certain initiatives • Franchisees retain direct ownership, incentivizing operational focus once improvements are evident Certain advantages • Local operators possess market-level knowledge that can support staffing and customer acquisition efforts of a franchise model • Capital-light business model • Center performance and underlying transaction growth highly dependent on availability, experience, and retention of licensed waxers Labor-intensive • Hiring, scheduling, and compensation decisions are controlled by franchisees, not the company service model heightens execution • Experienced waxer retention essential to customer acquisition and retention and operational stability risk • Labor constraints could limit throughput, reduce service consistency and blunt expected SSS uplift • COO has been in role for ~3 – 4 months New management • CEO and CFO have been in their respective roles for ~1 year team driving execution of • CIDO, CCO, and CDO are all recent 2025 hires initiatives • Management’s ability to execute at the Company as a unit is unproven • No single initiative expected to drive a step-change in near-term financial performance Multiple initiatives are being executed • Turnaround success dependent on sustained execution across multiple initiatives simultaneously • Different franchisees have different problems; requires targeted approach • Financial impact dependent on meaningful changes around new customer acquisition and retention; waxer training, scheduling and retention, and center-level adoption, which takes time Turnaround impact • Differences in site quality, local labor markets, and operator sophistication may create varied times to implement and bear results may be gradual • Previous turnaround efforts by the Company have been unsuccessful in realizing the full scope of benefits initially expected, underscoring the risk inherent in any potential turnaround plan • Majority of initiatives not yet launched or are in early stages of implementation • Management is currently addressing “low -hanging fruit,” including basic customer education and staffing efficiency topics, ahea of d Timing is a risk broader rollout of LRP Initiatives at the March franchisee conference • Ability to successfully implement early initiatives to set the foundation for growth will dictate success of later initiatives • Both the Management Proposed LRP (50% Achievability) and the Management Proposed LRP (100% Achievability) assume a stable Macro poses macroeconomic environment; in a recession, discretionary services would be negatively impacted, which would adversely impact the additional risk financial performance of Elegant Content must not go below this line Confidential | 11
PRIVILEGED & CONFIDENTIAL PRELIMINARY DRAFT SUBJECT TO DUE DILIGENCE & SUBSTANTIAL REVISION 3. Preliminary Financial Analysis Content must not go below this line Confidential | 12
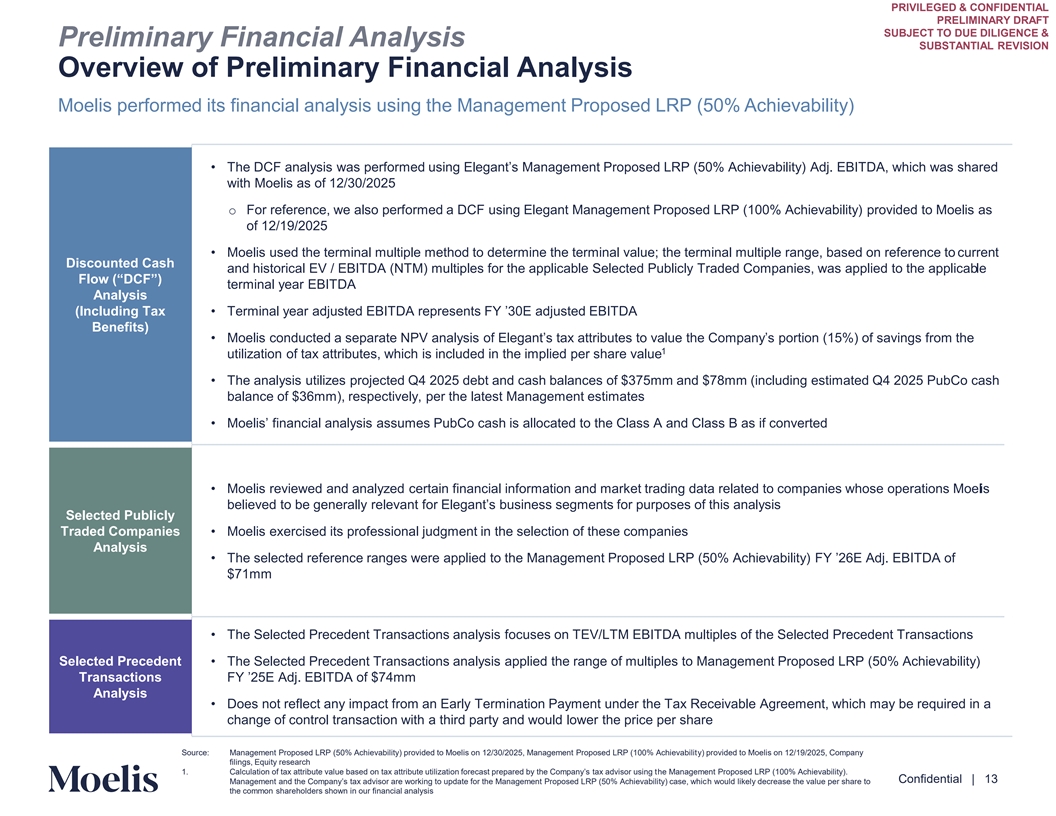
PRIVILEGED & CONFIDENTIAL PRELIMINARY DRAFT SUBJECT TO DUE DILIGENCE & Preliminary Financial Analysis SUBSTANTIAL REVISION Overview of Preliminary Financial Analysis Moelis performed its financial analysis using the Management Proposed LRP (50% Achievability) • The DCF analysis was performed using Elegant’s Management Proposed LRP (50% Achievability) Adj. EBITDA, which was shared with Moelis as of 12/30/2025 o For reference, we also performed a DCF using Elegant Management Proposed LRP (100% Achievability) provided to Moelis as of 12/19/2025 • Moelis used the terminal multiple method to determine the terminal value; the terminal multiple range, based on reference to current Discounted Cash and historical EV / EBITDA (NTM) multiples for the applicable Selected Publicly Traded Companies, was applied to the applicable Flow (“DCF”) terminal year EBITDA Analysis (Including Tax • Terminal year adjusted EBITDA represents FY ’30E adjusted EBITDA Benefits) • Moelis conducted a separate NPV analysis of Elegant’s tax attributes to value the Company’s portion (15%) of savings from the 1 utilization of tax attributes, which is included in the implied per share value • The analysis utilizes projected Q4 2025 debt and cash balances of $375mm and $78mm (including estimated Q4 2025 PubCo cash balance of $36mm), respectively, per the latest Management estimates • Moelis’ financial analysis assumes PubCo cash is allocated to the Class A and Class B as if converted • Moelis reviewed and analyzed certain financial information and market trading data related to companies whose operations Moelis believed to be generally relevant for Elegant’s business segments for purposes of this analysis Selected Publicly Traded Companies • Moelis exercised its professional judgment in the selection of these companies Analysis • The selected reference ranges were applied to the Management Proposed LRP (50% Achievability) FY ’26E Adj. EBITDA of $71mm • The Selected Precedent Transactions analysis focuses on TEV/LTM EBITDA multiples of the Selected Precedent Transactions Selected Precedent • The Selected Precedent Transactions analysis applied the range of multiples to Management Proposed LRP (50% Achievability) Transactions FY ’25E Adj. EBITDA of mm Analysis • Does not reflect any impact from an Early Termination Payment under the Tax Receivable Agreement, which may be required in a change of control transaction with a third party and would lower the price per share Content must not Source: Management Proposed LRP (50% Achievability) provided to Moelis on 12/30/2025, Management Proposed LRP (100% Achievability) provided to Moelis on 12/19/2025, Company filings, Equity research go below this line 1. Calculation of tax attribute value based on tax attribute utilization forecast prepared by the Company’s tax adviso her M uasinnagg etment Proposed LRP (100% Achievability). Confidential | 13 Management and the Company’s tax advisor are working to update for the Management Proposed LRP (50% Achievability) ca h wse o, uldw h liike c ly decrease the value per share to the common shareholders shown in our financial analysis
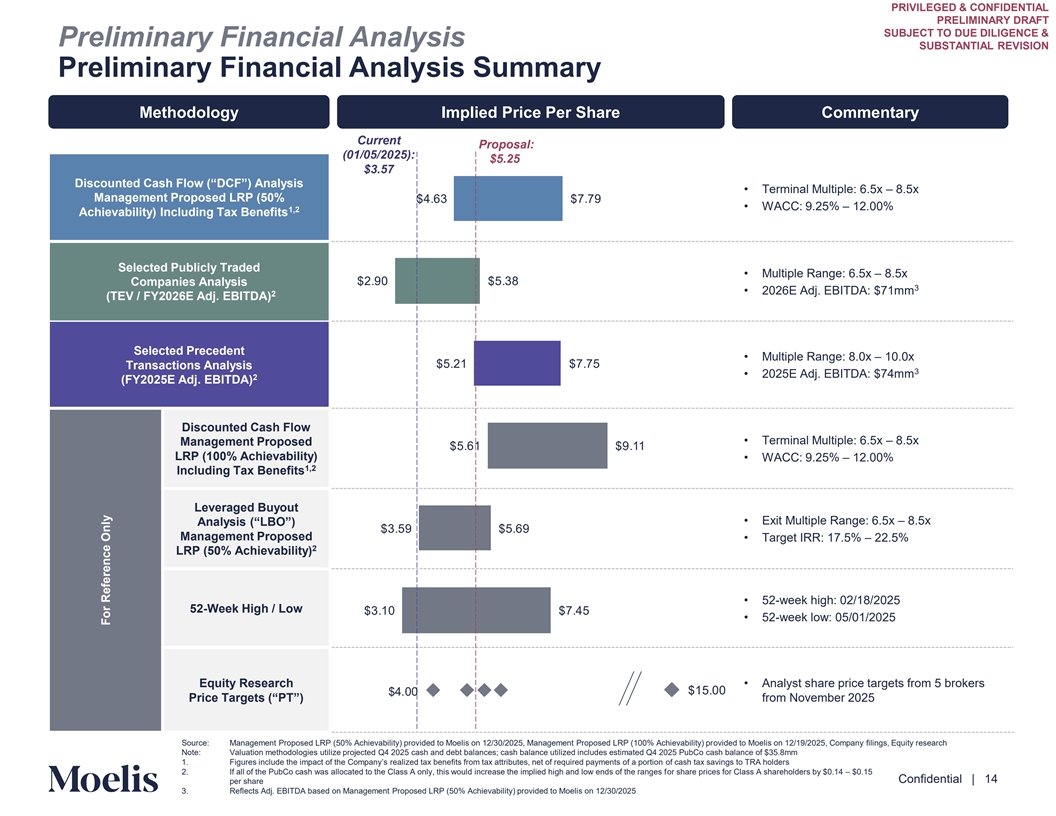
PRIVILEGED & CONFIDENTIAL PRELIMINARY DRAFT SUBJECT TO DUE DILIGENCE & Preliminary Financial Analysis SUBSTANTIAL REVISION Preliminary Financial Analysis Summary Methodology Implied Price Per Share Commentary Current Proposal: (01/05/2025): $5.25 $3.57 Discounted Cash Flow (“DCF”) Analysis • Terminal Multiple: 6.5x – 8.5x Management Proposed LRP (50% .63 . • WACC: 9.25% – 12.00% 1,2 Achievability) Including Tax Benefits Selected Publicly Traded • Multiple Range: 6.5x – 8.5x 2. 0 5.38 Companies Analysis 3 • 2026E Adj. EBITDA: $71mm 2 (TEV / FY2026E Adj. EBITDA) Selected Precedent • Multiple Range: 8.0x – 10.0x 5.21 . 5 Transactions Analysis 3 • 2025E Adj. EBITDA: $74mm 2 (FY2025E Adj. EBITDA) Discounted Cash Flow • Terminal Multiple: 6.5x – 8.5x Management Proposed 5.61 .11 LRP (100% Achievability) • WACC: 9.25% – 12.00% 1,2 Including Tax Benefits Leveraged Buyout • Exit Multiple Range: 6.5x – 8.5x Analysis (“LBO”) 3.5 5.6 Management Proposed • Target IRR: 17.5% – 22.5% 2 LRP (50% Achievability) • 52-week high: 02/18/2025 52-Week High / Low 3.10 . 5 • 52-week low: 05/01/2025 Equity Research • Analyst share price targets from 5 brokers 15.00 .00 Price Targets (“PT”) from November 2025 Source: Management Proposed LRP (50% Achievability) provided to Moelis on 12/30/2025, Management Proposed LRP (100% Achievability) provided to Moelis on 12/19/2025, Company filings, Equity research Content must not Note: Valuation methodologies utilize projected Q4 2025 cash and debt balances; cash balance utilized includes estimated Q4 2025 PubCo cash balance of $35.8mm 1. Figures include the impact of the Company’s realized tax benefits from tax attributes, net of required payments of of aca psh or ttiaoxn sa vings to TRA holders go below this line 2. If all of the PubCo cash was allocated to the Class A only, this would increase the implied high and low ends of the ranges for share prices for Class A shareholders by $0.14 – $0.15 Confidential | 14 per share 3. Reflects Adj. EBITDA based on Management Proposed LRP (50% Achievability) provided to Moelis on 12/30/2025 For Reference Only
PRIVILEGED & CONFIDENTIAL PRELIMINARY DRAFT SUBJECT TO DUE DILIGENCE & SUBSTANTIAL REVISION 4. Strategic Alternatives Content must not go below this line Confidential | 15
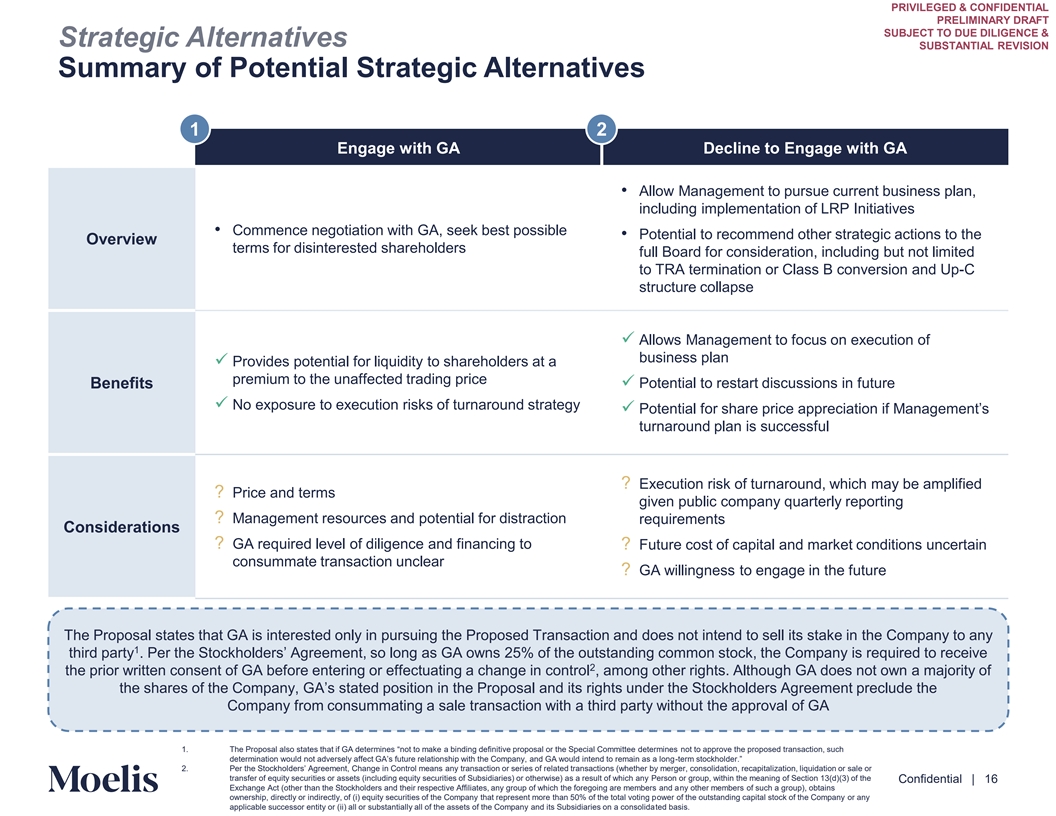
PRIVILEGED & CONFIDENTIAL PRELIMINARY DRAFT SUBJECT TO DUE DILIGENCE & Strategic Alternatives SUBSTANTIAL REVISION Summary of Potential Strategic Alternatives 1 2 Engage with GA Decline to Engage with GA • Allow Management to pursue current business plan, including implementation of LRP Initiatives • Commence negotiation with GA, seek best possible • Potential to recommend other strategic actions to the Overview terms for disinterested shareholders full Board for consideration, including but not limited to TRA termination or Class B conversion and Up-C structure collapse ✓ Allows Management to focus on execution of business plan ✓ Provides potential for liquidity to shareholders at a premium to the unaffected trading price ✓ Potential to restart discussions in future Benefits ✓ No exposure to execution risks of turnaround strategy ✓ Potential for share price appreciation if Management’s turnaround plan is successful ? Execution risk of turnaround, which may be amplified ? Price and terms given public company quarterly reporting ? Management resources and potential for distraction requirements Considerations ? GA required level of diligence and financing to ? Future cost of capital and market conditions uncertain consummate transaction unclear ? GA willingness to engage in the future The Proposal states that GA is interested only in pursuing the Proposed Transaction and does not intend to sell its stake in the Company to any 1 third party . Per the Stockholders’ Agreement, so long as GA owns 25% of the outstanding common stock, the Company is required to receive 2 the prior written consent of GA before entering or effectuating a change in control , among other rights. Although GA does not own a majority of the shares of the Company, GA’s stated position in the Proposal and its rights under the Stockholders Agreement preclude the Company from consummating a sale transaction with a third party without the approval of GA 1. The Proposal also states that if GA determines “not to make a binding definitive proposal or the Special Committee d no ete t to rm ain pe ps rove the proposed transaction, such Content must not determination would not adversely affect GA’s future relationship with the Company, and GA would intend to remain a -tes a rm sto lockh ng older.” go below this line 2. Per the Stockholders’ Agreement, Change in Control mea anns y transaction or series of related transactions (whether by merger, consolidation, recapitalization, liquidation or sale or transfer of equity securities or assets (including equity securities of Subsidiaries) or otherwise) as a result of which any Person or group, within the meaning of Section 13(d)(3) of the Confidential | 16 Exchange Act (other than the Stockholders and their respective Affiliates, any group of which the foregoing are members and any other members of such a group), obtains ownership, directly or indirectly, of (i) equity securities of the Company that represent more than 50% of the total voting power of the outstanding capital stock of the Company or any applicable successor entity or (ii) all or substantially all of the assets of the Company and its Subsidiaries on a consolidated basis.
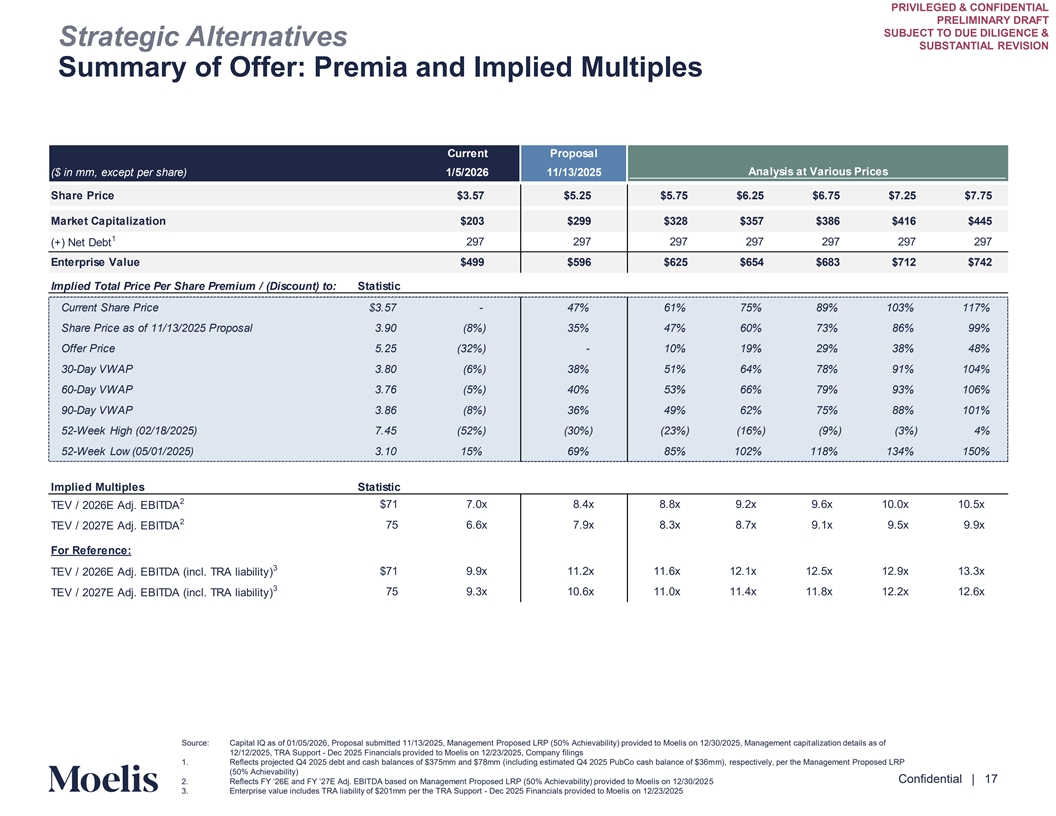
PRIVILEGED & CONFIDENTIAL PRELIMINARY DRAFT SUBJECT TO DUE DILIGENCE & Strategic Alternatives SUBSTANTIAL REVISION Summary of Offer: Premia and Implied Multiples Current Proposal ($ in mm, except per share) 1/5/2026 11/13/2025 Analysis at Various Prices Share Price $3.57 $5.25 $5.75 $6.25 $6.75 $7.25 $7.75 Market Capitalization $203 $299 $328 $357 $386 $416 $445 1 297 297 297 297 297 297 297 (+) Net Debt Enterprise Value $499 $596 $625 $654 $683 $712 $742 Implied Total Price Per Share Premium / (Discount) to: Statistic Current Share Price $3.57 - 47% 61% 75% 89% 103% 117% Share Price as of 11/13/2025 Proposal 3.90 (8%) 35% 47% 60% 73% 86% 99% Offer Price 5.25 (32%) - 10% 19% 29% 38% 48% 30-Day VWAP 3.80 (6%) 38% 51% 64% 78% 91% 104% 60-Day VWAP 3.76 (5%) 40% 53% 66% 79% 93% 106% 90-Day VWAP 3.86 (8%) 36% 49% 62% 75% 88% 101% 52-Week High (02/18/2025) 7.45 (52%) (30%) (23%) (16%) (9%) (3%) 4% 52-Week Low (05/01/2025) 3.10 15% 69% 85% 102% 118% 134% 150% Implied Multiples Statistic 2 $71 7.0x 8.4x 8.8x 9.2x 9.6x 10.0x 10.5x TEV / 2026E Adj. EBITDA 2 TEV / 2027E Adj. EBITDA 75 6.6x 7.9x 8.3x 8.7x 9.1x 9.5x 9.9x For Reference: 3 $71 9.9x 11.2x 11.6x 12.1x 12.5x 12.9x 13.3x TEV / 2026E Adj. EBITDA (incl. TRA liability) 3 TEV / 2027E Adj. EBITDA (incl. TRA liability) 75 9.3x 10.6x 11.0x 11.4x 11.8x 12.2x 12.6x Source: Capital IQ as of 01/05/2026, Proposal submitted 11/13/2025, Management Proposed LRP (50% Achievability) provided to Moelis on 12/30/2025, Management capitalization details as of Content must not 12/12/2025, TRA Support - Dec 2025 Financials provided to Moelis on 12/23/2025, Company filings 1. Reflects projected Q4 2025 debt and cash balances of $375mm and $78mm (including estimated Q4 2025 PubCo cash balance of $36mm), respectively, per the Management Proposed LRP go below this line (50% Achievability) Confidential | 17 2. Reflects FY ‘26E and FY ‘2 E Adj. EBITDA based on Management Proposed LRP (50% Achievability) provided to Moelis on5 12/30/202 3. Enterprise value includes TRA liability of $201mm per the TRA Support - Dec 2025 Financials provided to Moelis on 12/23/2025
PRIVILEGED & CONFIDENTIAL PRELIMINARY DRAFT SUBJECT TO DUE DILIGENCE & SUBSTANTIAL REVISION 5. Appendix Content must not go below this line Confidential | 18
PRIVILEGED & CONFIDENTIAL PRELIMINARY DRAFT SUBJECT TO DUE DILIGENCE & SUBSTANTIAL REVISION A. Discounted Cash Flow Analysis Content must not go below this line Confidential | 19
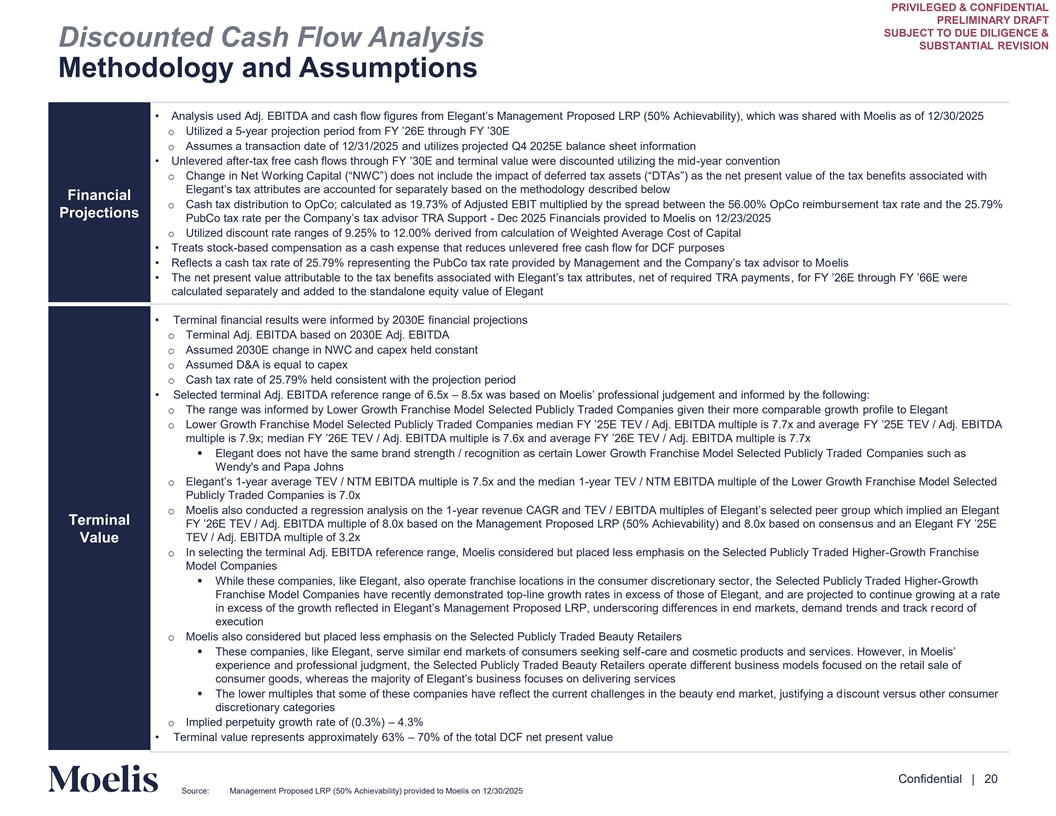
PRIVILEGED & CONFIDENTIAL PRELIMINARY DRAFT SUBJECT TO DUE DILIGENCE & Discounted Cash Flow Analysis SUBSTANTIAL REVISION Methodology and Assumptions • Analysis used Adj. EBITDA and cash flow figures from Elegant’s Management Proposed LRP (50% Achievability), which wa wit s s h Mo hare ed li s as of 12/30/2025 o Utilized a 5-year projection period from FY ’26E through FY ’30E o Assumes a transaction date of 12/31/2025 and utilizes projected Q4 2025E balance sheet information • Unlevered after-tax free cash flows through FY ’30E and terminal value were discounted utilizing -tyh ee a rmid convention o Change in Net Working Capital (“NWC”) does not include the impact of deferred tax assets (“DTAs”) as the net pres e thnet tvaaxlu bee no effits associated with Elegant’s tax attributes are accounted for separately based on the methodology described below Financial o Cash tax distribution to OpCo; calculated as 19.73% of Adjusted EBIT multiplied by the spread between the 56.00% OpCo reimbursement tax rate and the 25.79% Projections PubCo tax rate per the Company’s tax advisor TRA Sup - p Doertc 2025 Financials provided to Moelis on 12/23/2025 o Utilized discount rate ranges of 9.25% to 12.00% derived from calculation of Weighted Average Cost of Capital • Treats stock-based compensation as a cash expense that reduces unlevered free cash flow for DCF purposes • Reflects a cash tax rate of 25. % representing the PubCo tax rate provided by Management and the Company’s tax ad evliis sor to Mo • The net present value attributable to the tax benefits associated with Elegant’s tax attributes, net of required TRA, fpoary me FY nt’2s6E through FY ’66E were calculated separately and added to the standalone equity value of Elegant • Terminal financial results were informed by 2030E financial projections o Terminal Adj. EBITDA based on 2030E Adj. EBITDA o Assumed 2030E change in NWC and capex held constant o Assumed D&A is equal to capex o Cash tax rate of 25.79% held consistent with the projection period • Selected terminal Adj. EBITDA reference range of 6.5x – 8.5x was based on Moelis’ professional judgement and informed by lo thw e f ingo:l o The range was informed by Lower Growth Franchise Model Selected Publicly Traded Companies given their more comparable growth profile to Elegant o Lower Growth Franchise Model Selected Publicly Traded Companies median FY ’25E TEV / Adj. EBITDA multiple is . x an FY d a’2v5eE ra gTeEV / Adj. EBITDA multiple is 7.9x; median FY ’26E TEV / AdE j. BITDA multiple is .6x and average FY ’26E TEV / Adj. EBITDA multiple is . x ▪ Elegant does not have the same brand strength / recognition as certain Lower Growth Franchise Model Selected Publicly Traded Companies such as Wendy's and Papa Johns o Elegant’s 1 -year average TEV / NTM EBITDA multiple is 7.5x and the median 1-year TEV / NTM EBITDA multiple of the Lower Growth Franchise Model Selected Publicly Traded Companies is 7.0x o Moelis also conducted a regression analysis on the 1-year revenue CAGR and TEV / EBITDA multiples of Elegant’s selected pe ue pr wg hrio ch implied an Elegant Terminal FY ’26E TEV / Adj. EBITDA multiple of 8.0x based on the Management Proposed LRP (50% Achievability) and 8.0x based uo sn and con as ne E ns legant FY ’25E TEV / Adj. EBITDA multiple of 3.2x Value o In selecting the terminal Adj. EBITDA reference range, Moelis considered but placed less emphasis on the Selected Publicly Traded Higher-Growth Franchise Model Companies ▪ While these companies, like Elegant, also operate franchise locations in the consumer discretionary sector, the Selected Publicly Traded Higher-Growth Franchise Model Companies have recently demonstrated top-line growth rates in excess of those of Elegant, and are projected to continue growing at a rate in excess of the growth reflected in Elegant’s Management Proposed LRP, underscoring differences in end markets, demand trends an ec d otrrda c ok f r execution o Moelis also considered but placed less emphasis on the Selected Publicly Traded Beauty Retailers ▪ These companies, like Elegant, serve similar end markets of consumers seeking self-care and cosmetic products and services. However, in Moelis’ experience and professional judgment, the Selected Publicly Traded Beauty Retailers operate different business models focused on the retail sale of consumer goods, whereas the majority of Elegant’s business focuses on delivering services ▪ The lower multiples that some of these companies have reflect the current challenges in the beauty end market, justifying a discount versus other consumer discretionary categories o Implied perpetuity growth rate of (0.3%) – 4.3% • Terminal value represents approximately 63% – 70% of the total DCF net present value Content must not go below this line Confidential | 20 Source: Management Proposed LRP (50% Achievability) provided to Moelis on 12/30/2025
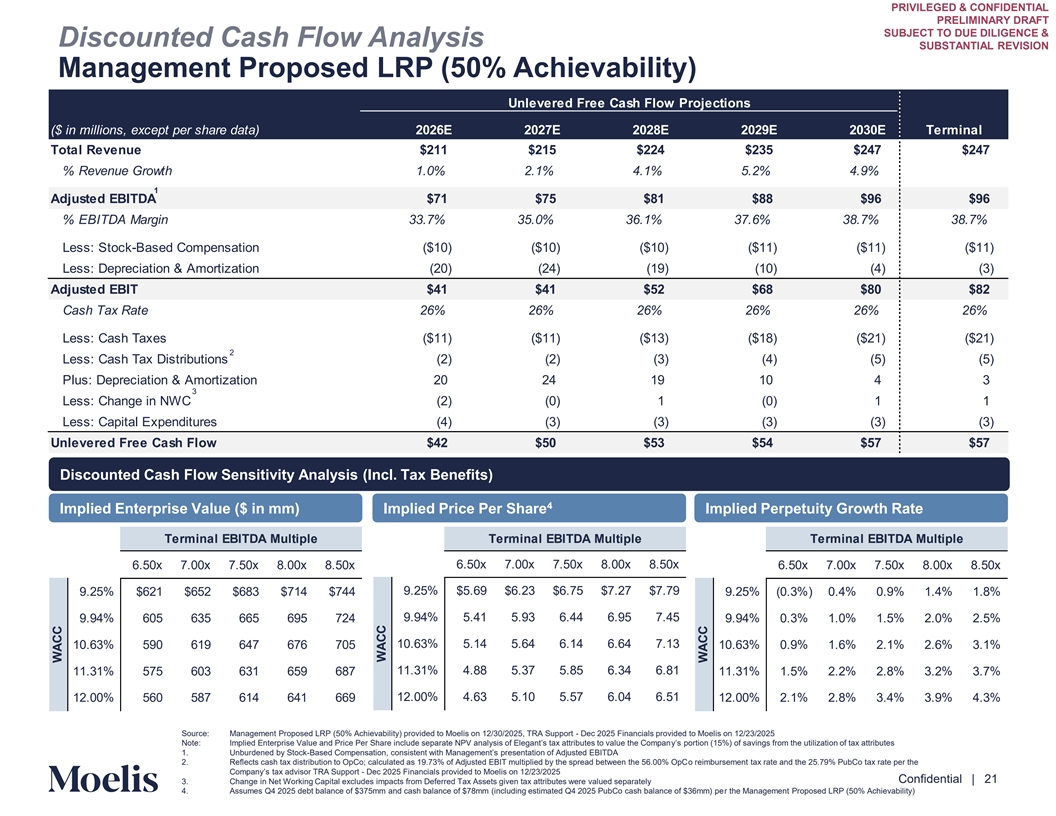
PRIVILEGED & CONFIDENTIAL PRELIMINARY DRAFT SUBJECT TO DUE DILIGENCE & Discounted Cash Flow Analysis SUBSTANTIAL REVISION Management Proposed LRP (50% Achievability) Unlevered Free Cash Flow Projections ($ in millions, except per share data) 2026E 2027E 2028E 2029E 2030E Terminal Total Revenue $211 $215 $224 $235 $247 $247 % Revenue Growth 1.0% 2.1% 4.1% 5.2% 4.9% 1 Adjusted EBITDA $71 $75 $81 $88 $96 $96 % EBITDA Margin 33.7% 35.0% 36.1% 37.6% 38.7% 38.7% Less: Stock-Based Compensation ($10) ($10) ($10) ($11) ($11) ($11) Less: Depreciation & Amortization (20) (24) (19) (10) (4) (3) Adjusted EBIT $41 $41 $52 $68 $80 $82 Cash Tax Rate 26% 26% 26% 26% 26% 26% Less: Cash Taxes ($11) ($11) ($13) ($18) ($21) ($21) 2 Less: Cash Tax Distributions (2) (2) (3) (4) (5) (5) Plus: Depreciation & Amortization 20 24 19 10 4 3 3 Less: Change in NWC (2) (0) 1 (0) 1 1 Less: Capital Expenditures (4) (3) (3) (3) (3) (3) Unlevered Free Cash Flow $42 $50 $53 $54 $57 $57 Discounted Cash Flow Sensitivity Analysis (Incl. Tax Benefits) 4 Implied Enterprise Value ($ in mm) Implied Price Per Share Implied Perpetuity Growth Rate Terminal EBITDA Multiple Terminal EBITDA Multiple Terminal EBITDA Multiple 6.50x 7.00x 7.50x 8.00x 8.50x 6.50x 7.00x 7.50x 8.00x 8.50x 6.50x 7.00x 7.50x 8.00x 8.50x 9.25% $5.69 $6.23 $6.75 $7.27 $7.79 9.25% $621 $652 $683 $714 $744 9.25% (0.3%) 0.4% 0.9% 1.4% 1.8% 9.94% 5.41 5.93 6.44 6.95 7.45 9.94% 605 635 665 695 724 9.94% 0.3% 1.0% 1.5% 2.0% 2.5% 10.63% 5.14 5.64 6.14 6.64 7.13 10.63% 590 619 647 676 705 10.63% 0.9% 1.6% 2.1% 2.6% 3.1% 11.31% 4.88 5.37 5.85 6.34 6.81 11.31% 575 603 631 659 687 11.31% 1.5% 2.2% 2.8% 3.2% 3.7% 12.00% 4.63 5.10 5.57 6.04 6.51 12.00% 560 587 614 641 669 12.00% 2.1% 2.8% 3.4% 3.9% 4.3% Source: Management Proposed LRP (50% Achievability) provided to Moelis on 12/30/2025, TRA Support - Dec 2025 Financials provided to Moelis on 12/23/2025 Note: Implied Enterprise Value and Price Per Share include separate NPV analysis of Elegant’s tax attributes to value thy’s e Com porptiaonn (15%) of savings from the utilization of tax attributes Content must not 1. Unburdened by Stock-Based Compensation, consistent with Management’s presentation of Adjusted EBITDA 2. Reflects cash tax distribution to OpCo; calculated as 19.73% of Adjusted EBIT multiplied by the spread between the 56.00% OpCo reimbursement tax rate and the 25.79% PubCo tax rate per the go below this line Company’s tax advisor TRA Suppo-r t Dec 2025 Financials provided to Moelis on 12/23/2025 Confidential | 21 3. Change in Net Working Capital excludes impacts from Deferred Tax Assets given tax attributes were valued separately 4. Assumes Q4 2025 debt balance of $375mm and cash balance of $78mm (including estimated Q4 2025 PubCo cash balance of $36mm) per the Management Proposed LRP (50% Achievability) WACC WACC WACC
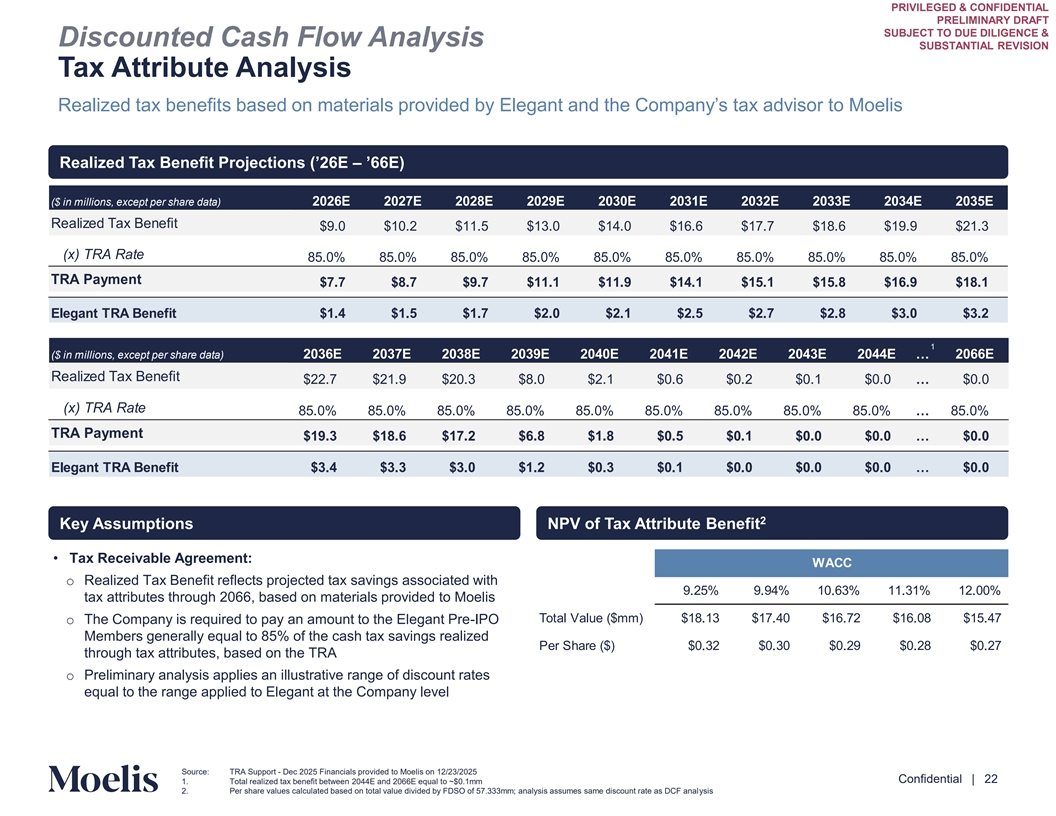
PRIVILEGED & CONFIDENTIAL PRELIMINARY DRAFT SUBJECT TO DUE DILIGENCE & Discounted Cash Flow Analysis SUBSTANTIAL REVISION Tax Attribute Analysis Realized tax benefits based on materials provided by Elegant and the Company’s tax advisor to Moelis Realized Tax Benefit Projections (’26–E ’66E) ($ in millions, except per share data) 2026E 2027E 2028E 2029E 2030E 2031E 2032E 2033E 2034E 2035E Realized Tax Benefit $9.0 $10.2 $11.5 $13.0 $14.0 $16.6 $17.7 $18.6 $19.9 $21.3 (x) TRA Rate 85.0% 85.0% 85.0% 85.0% 85.0% 85.0% 85.0% 85.0% 85.0% 85.0% TRA Payment $7.7 $8.7 $9.7 $11.1 $11.9 $14.1 $15.1 $15.8 $16.9 $18.1 Elegant TRA Benefit $1.4 $1.5 $1.7 $2.0 $2.1 $2.5 $2.7 $2.8 $3.0 $3.2 1 ($ in millions, except per share data) 2036E 2037E 2038E 2039E 2040E 2041E 2042E 2043E 2044E … 2066E Realized Tax Benefit $22.7 $21.9 $20.3 $8.0 $2.1 $0.6 $0.2 $0.1 $0.0 … $0.0 (x) TRA Rate 85.0% 85.0% 85.0% 85.0% 85.0% 85.0% 85.0% 85.0% 85.0% … 85.0% TRA Payment $19.3 $18.6 $17.2 $6.8 $1.8 $0.5 $0.1 $0.0 $0.0 … $0.0 Elegant TRA Benefit $3.4 $3.3 $3.0 $1.2 $0.3 $0.1 $0.0 $0.0 $0.0 … $0.0 2 Key Assumptions NPV of Tax Attribute Benefit • Tax Receivable Agreement: WACC o Realized Tax Benefit reflects projected tax savings associated with 9.25% 9.94% 10.63% 11.31% 12.00% tax attributes through 2066, based on materials provided to Moelis Total Value ($mm) $18.13 $17.40 $16.72 $16.08 $15.47 o The Company is required to pay an amount to the Elegant Pre-IPO Members generally equal to 85% of the cash tax savings realized Per Share ($) $0.32 $0.30 $0.29 $0.28 $0.27 through tax attributes, based on the TRA o Preliminary analysis applies an illustrative range of discount rates equal to the range applied to Elegant at the Company level Content must not go below this line Source: TRA Support - Dec 2025 Financials provided to Moelis on 12/23/2025 Confidential | 22 1. Total realized tax benefit between 2044E and 2066E equal to ~$0.1mm 2. Per share values calculated based on total value divided by FDSO of 57.333mm; analysis assumes same discount rate as DCF analysis
PRIVILEGED & CONFIDENTIAL PRELIMINARY DRAFT SUBJECT TO DUE DILIGENCE & SUBSTANTIAL REVISION B. Selected Publicly Traded Companies Analysis Content must not go below this line Confidential | 23
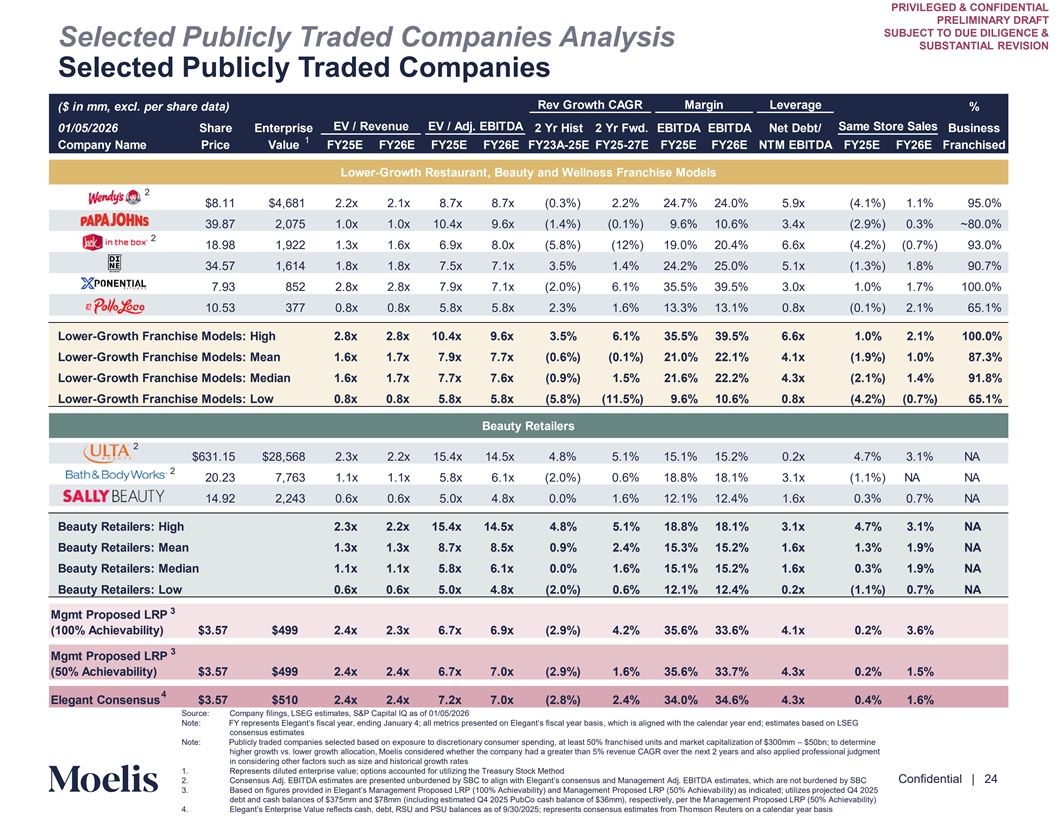
PRIVILEGED & CONFIDENTIAL PRELIMINARY DRAFT SUBJECT TO DUE DILIGENCE & Selected Publicly Traded Companies Analysis SUBSTANTIAL REVISION Selected Publicly Traded Companies Rev Growth CAGR Margin Leverage ($ in mm, excl. per share data) % EV / Revenue EV / Adj. EBITDA Same Store Sales 01/05/2026 Share Enterprise 2 Yr Hist 2 Yr Fwd. EBITDA EBITDA Net Debt/ Business 1 Company Name Price Value FY25E FY26E FY25E FY26E FY23A-25E FY25-27E FY25E FY26E NTM EBITDA FY25E FY26E Franchised Lower-Growth Restaurant, Beauty and Wellness Franchise Models 2 $8.11 $4,681 2.2x 2.1x 8.7x 8.7x (0.3%) 2.2% 24.7% 24.0% 5.9x (4.1%) 1.1% 95.0% 39.87 2,075 1.0x 1.0x 10.4x 9.6x (1.4%) (0.1%) 9.6% 10.6% 3.4x (2.9%) 0.3% ~80.0% 2 18.98 1,922 1.3x 1.6x 6.9x 8.0x (5.8%) (12%) 19.0% 20.4% 6.6x (4.2%) (0.7%) 93.0% 34.57 1,614 1.8x 1.8x 7.5x 7.1x 3.5% 1.4% 24.2% 25.0% 5.1x (1.3%) 1.8% 90.7% 7.93 852 2.8x 2.8x 7.9x 7.1x (2.0%) 6.1% 35.5% 39.5% 3.0x 1.0% 1.7% 100.0% 10.53 377 0.8x 0.8x 5.8x 5.8x 2.3% 1.6% 13.3% 13.1% 0.8x (0.1%) 2.1% 65.1% Lower-Growth Franchise Models: High 2.8x 2.8x 10.4x 9.6x 3.5% 6.1% 35.5% 39.5% 6.6x 1.0% 2.1% 100.0% Lower-Growth Franchise Models: Mean 1.6x 1.7x 7.9x 7.7x (0.6%) (0.1%) 21.0% 22.1% 4.1x (1.9%) 1.0% 87.3% Lower-Growth Franchise Models: Median 1.6x 1.7x 7.7x 7.6x (0.9%) 1.5% 21.6% 22.2% 4.3x (2.1%) 1.4% 91.8% Lower-Growth Franchise Models: Low 0.8x 0.8x 5.8x 5.8x (5.8%) (11.5%) 9.6% 10.6% 0.8x (4.2%) (0.7%) 65.1% Beauty Retailers 2 $631.15 $28,568 2.3x 2.2x 15.4x 14.5x 4.8% 5.1% 15.1% 15.2% 0.2x 4.7% 3.1% NA 2 20.23 7,763 1.1x 1.1x 5.8x 6.1x (2.0%) 0.6% 18.8% 18.1% 3.1x (1.1%) NA NA 14.92 2,243 0.6x 0.6x 5.0x 4.8x 0.0% 1.6% 12.1% 12.4% 1.6x 0.3% 0.7% NA Beauty Retailers: High 2.3x 2.2x 15.4x 14.5x 4.8% 5.1% 18.8% 18.1% 3.1x 4.7% 3.1% NA Beauty Retailers: Mean 1.3x 1.3x 8.7x 8.5x 0.9% 2.4% 15.3% 15.2% 1.6x 1.3% 1.9% NA Beauty Retailers: Median 1.1x 1.1x 5.8x 6.1x 0.0% 1.6% 15.1% 15.2% 1.6x 0.3% 1.9% NA Beauty Retailers: Low 0.6x 0.6x 5.0x 4.8x (2.0%) 0.6% 12.1% 12.4% 0.2x (1.1%) 0.7% NA 3 Mgmt Proposed LRP (100% Achievability) $3.57 $499 2.4x 2.3x 6.7x 6.9x (2.9%) 4.2% 35.6% 33.6% 4.1x 0.2% 3.6% 3 Mgmt Proposed LRP (50% Achievability) $3.57 $499 2.4x 2.4x 6.7x 7.0x (2.9%) 1.6% 35.6% 33.7% 4.3x 0.2% 1.5% 4 Elegant Consensus $3.57 $510 2.4x 2.4x 7.2x 7.0x (2.8%) 2.4% 34.0% 34.6% 4.3x 0.4% 1.6% Source: Company filings, LSEG estimates, S&P Capital IQ as of 01/05/2026 Note: FY represents Elegant’s fiscal year, ending January ; all metrics presented on Elegant’s f , isca which l ye is aar b liga nsi eds with the calendar year end; estimates based on LSEG consensus estimates Note: Publicly traded companies selected based on exposure to discretionary consumer spending, at least 50% franchised units and market capitalization of $300mm – $50bn; to determine higher growth vs. lower growth allocation, Moelis considered whether the company had a greater than 5% revenue CAGR over the next 2 years and also applied professional judgment Content must not in considering other factors such as size and historical growth rates go below this line 1. Represents diluted enterprise value; options accounted for utilizing the Treasury Stock Method Confidential | 24 2. Consensus Adj. EBITDA estimates are presented unburdened by SBC to align with Elegant’s consensus and Management Adj. estEiB mIT ate DA s, which are not burdened by SBC 3. Based on figures provided in Elegant’s Management Proposed LRP (100% Achievability) and Management Proposed LRP (50% iliAty) ch iaes i vanbdicated; utilizes projected Q4 2025 debt and cash balances of $375mm and $78mm (including estimated Q4 2025 PubCo cash balance of $36mm), respectively, per the Management Proposed LRP (50% Achievability) 4. Elegant’s Enterprise Value reflects cash, debt, RSU and PSU balances as of /30/2025; represents consensus estimates f mrso om n T Reu hoters on a calendar year basis
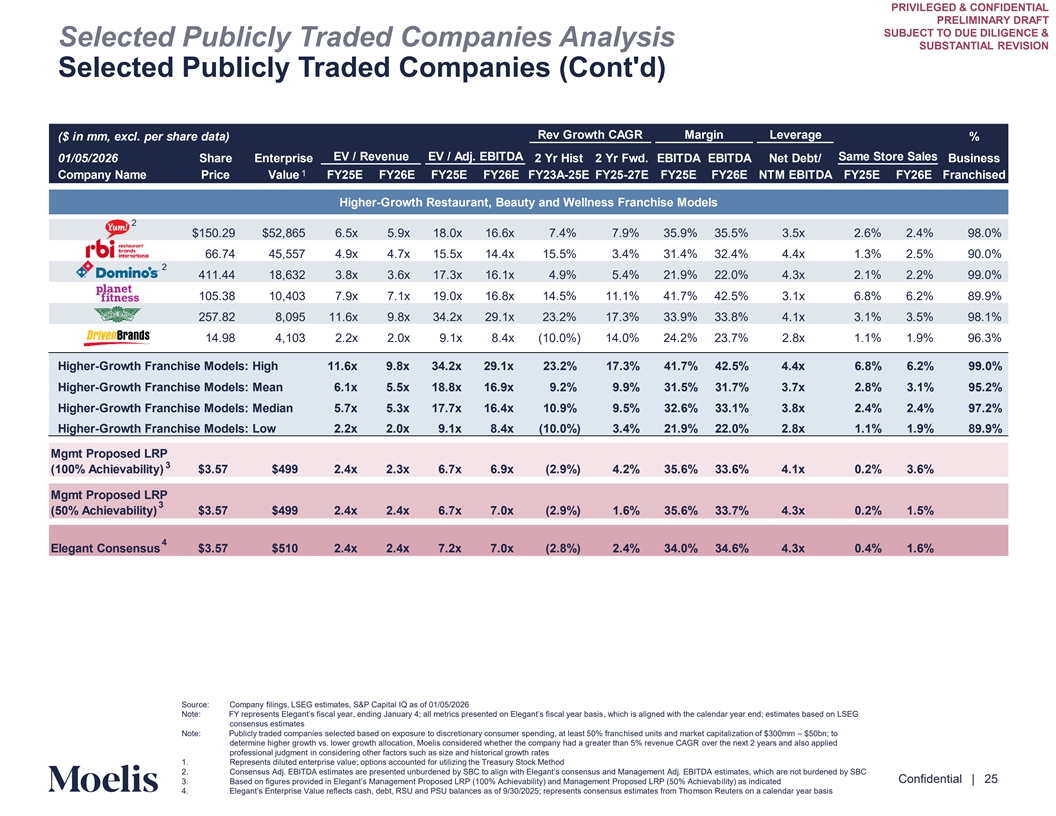
PRIVILEGED & CONFIDENTIAL PRELIMINARY DRAFT SUBJECT TO DUE DILIGENCE & Selected Publicly Traded Companies Analysis SUBSTANTIAL REVISION Selected Publicly Traded Companies (Cont'd) Rev Growth CAGR Margin Leverage ($ in mm, excl. per share data) % EV / Revenue EV / Adj. EBITDA Same Store Sales 01/05/2026 Share Enterprise 2 Yr Hist 2 Yr Fwd. EBITDA EBITDA Net Debt/ Business 1 Company Name Price Value FY25E FY26E FY25E FY26E FY23A-25E FY25-27E FY25E FY26E NTM EBITDA FY25E FY26E Franchised Higher-Growth Restaurant, Beauty and Wellness Franchise Models 2 $150.29 $52,865 6.5x 5.9x 18.0x 16.6x 7.4% 7.9% 35.9% 35.5% 3.5x 2.6% 2.4% 98.0% 66.74 45,557 4.9x 4.7x 15.5x 14.4x 15.5% 3.4% 31.4% 32.4% 4.4x 1.3% 2.5% 90.0% 2 411.44 18,632 3.8x 3.6x 17.3x 16.1x 4.9% 5.4% 21.9% 22.0% 4.3x 2.1% 2.2% 99.0% 105.38 10,403 7.9x 7.1x 19.0x 16.8x 14.5% 11.1% 41.7% 42.5% 3.1x 6.8% 6.2% 89.9% 257.82 8,095 11.6x 9.8x 34.2x 29.1x 23.2% 17.3% 33.9% 33.8% 4.1x 3.1% 3.5% 98.1% 14.98 4,103 2.2x 2.0x 9.1x 8.4x (10.0%) 14.0% 24.2% 23.7% 2.8x 1.1% 1.9% 96.3% Higher-Growth Franchise Models: High 11.6x 9.8x 34.2x 29.1x 23.2% 17.3% 41.7% 42.5% 4.4x 6.8% 6.2% 99.0% Higher-Growth Franchise Models: Mean 6.1x 5.5x 18.8x 16.9x 9.2% 9.9% 31.5% 31.7% 3.7x 2.8% 3.1% 95.2% Higher-Growth Franchise Models: Median 5.7x 5.3x 17.7x 16.4x 10.9% 9.5% 32.6% 33.1% 3.8x 2.4% 2.4% 97.2% Higher-Growth Franchise Models: Low 2.2x 2.0x 9.1x 8.4x (10.0%) 3.4% 21.9% 22.0% 2.8x 1.1% 1.9% 89.9% Mgmt Proposed LRP 3 (100% Achievability) $3.57 $499 2.4x 2.3x 6.7x 6.9x (2.9%) 4.2% 35.6% 33.6% 4.1x 0.2% 3.6% Mgmt Proposed LRP 3 (50% Achievability) $3.57 $499 2.4x 2.4x 6.7x 7.0x (2.9%) 1.6% 35.6% 33.7% 4.3x 0.2% 1.5% 4 Elegant Consensus $3.57 $510 2.4x 2.4x 7.2x 7.0x (2.8%) 2.4% 34.0% 34.6% 4.3x 0.4% 1.6% Source: Company filings, LSEG estimates, S&P Capital IQ as of 01/05/2026 Note: FY represents Elegant’s fiscal year, ending January ; all metrics presented on Elegant’s f , isca which l ye is aar b liga nsi eds with the calendar year end; estimates based on LSEG consensus estimates Note: Publicly traded companies selected based on exposure to discretionary consumer spending, at least 50% franchised units and market capitalization of $300mm – $50bn; to determine higher growth vs. lower growth allocation, Moelis considered whether the company had a greater than 5% revenue CAGR over the next 2 years and also applied Content must not professional judgment in considering other factors such as size and historical growth rates 1. Represents diluted enterprise value; options accounted for utilizing the Treasury Stock Method go below this line 2. Consensus Adj. EBITDA estimates are presented unburdened by SBC to align with Elegant’s consensus and Management Adj. estEiB mIT ate DA s, which are not burdened by SBC Confidential | 25 3. Based on figures provided in Elegant’s Management Proposed LRP (100% Achievability) and Management Proposed LRP (50% iliAty) ch iaes i vanbdicated 4. Elegant’s Enterprise Value reflects cash, debt, RSU and PSU balances as of /30/2025; represents consensus estimates f mrso om n T Reu hoters on a calendar year basis
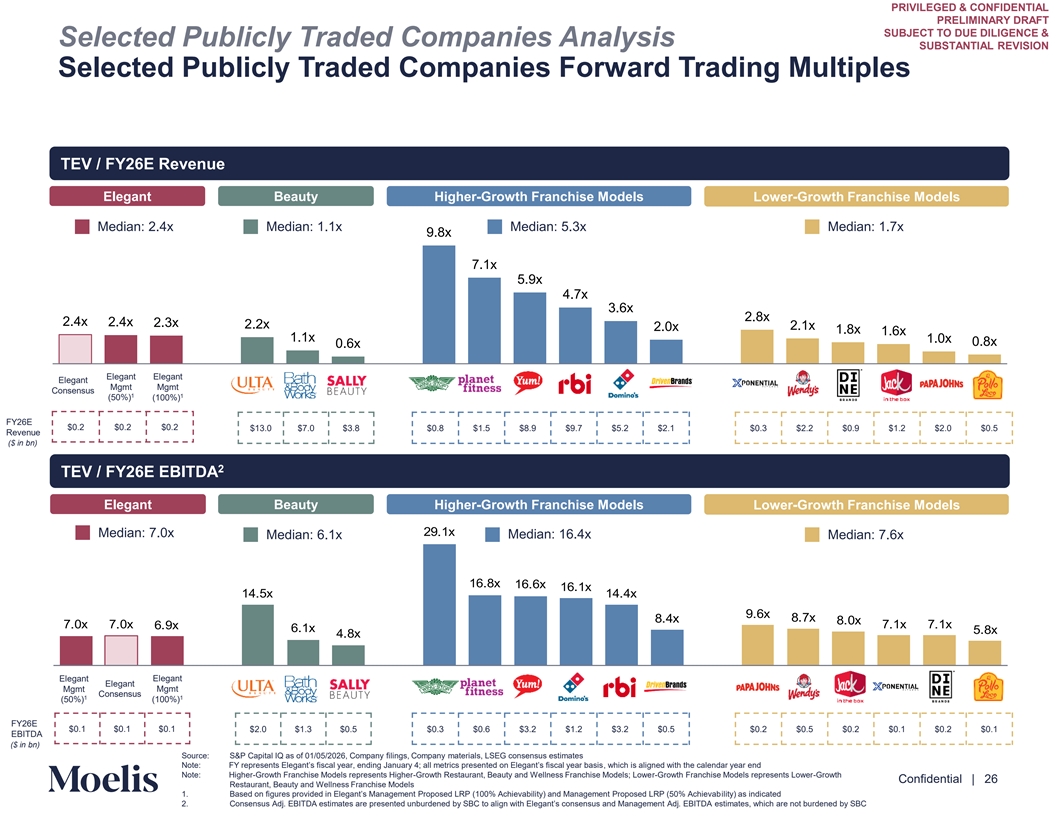
PRIVILEGED & CONFIDENTIAL PRELIMINARY DRAFT SUBJECT TO DUE DILIGENCE & Selected Publicly Traded Companies Analysis SUBSTANTIAL REVISION Selected Publicly Traded Companies Forward Trading Multiples TEV / FY26E Revenue Elegant Beauty Higher-Growth Franchise Models Lower-Growth Franchise Models Median: 2.4x Median: 1.1x Median: 5.3x Median: 1.7x 9.8x 7.1x 5.9x 4.7x 3.6x 2.8x 2.4x 2.4x 2.3x 2.2x 2.0x 2.1x 1.8x 1.6x 1.1x 1.0x 0.8x 0.6x Elegant Elegant Elegant Mgmt Mgmt Consensus 1 1 (50%) (100%) FY26E $0.2 $0.2 $0.2 $13.0 $7.0 $3.8 $0.8 $1.5 $8.9 $9.7 $5.2 $2.1 $0.3 $2.2 $0.9 $1.2 $2.0 $0.5 Revenue ($ in bn) 2 TEV Net Lev / FY er 2age 6E EBITDA Elegant Beauty Higher-Growth Franchise Models Lower-Growth Franchise Models 2 .1x Median: 7.0x Median: 16.4x Median: 6.1x Median: 7.6x 16.8x 16.6x 16.1x 1 .5x 1 . x .6x 8. x 8. x 8.0x .0x .0x .1x .1x 6. x 6.1x 5.8x .8x Elegant Elegant Elegant Mgmt Mgmt Consensus 1 1 (50%) (100%) FY26E $0.1 $0.1 $0.1 $2.0 $1.3 $0.5 $0.3 $0.6 $3.2 $1.2 $3.2 $0.5 $0.2 $0.5 $0.2 $0.1 $0.2 $0.1 EBITDA ($ in bn) Content must not Source: S&P Capital IQ as of 01/05/2026, Company filings, Company materials, LSEG consensus estimates Note: FY represents Elegant’s fiscal year, ending January ; all metrics presented on Elegant’s f , isca which l ye is aar b liga nsi eds with the calendar year end go below this line Note: Higher-Growth Franchise Models represents Higher-Growth Restaurant, Beauty and Wellness Franchise Models; Lower-Growth Franchise Models represents Lower-Growth Confidential | 26 Restaurant, Beauty and Wellness Franchise Models 1. Based on figures provided in Elegant’s Management Proposed LRP (100% Achievability) and Management Proposed LRP (50% iliAty) ch iaes i vanbdicated 2. Consensus Adj. EBITDA estimates are presented unburdened by SBC to align with Elegant’s consensus and Management Adj. estEiB mIT ate DA s, which are not burdened by SBC
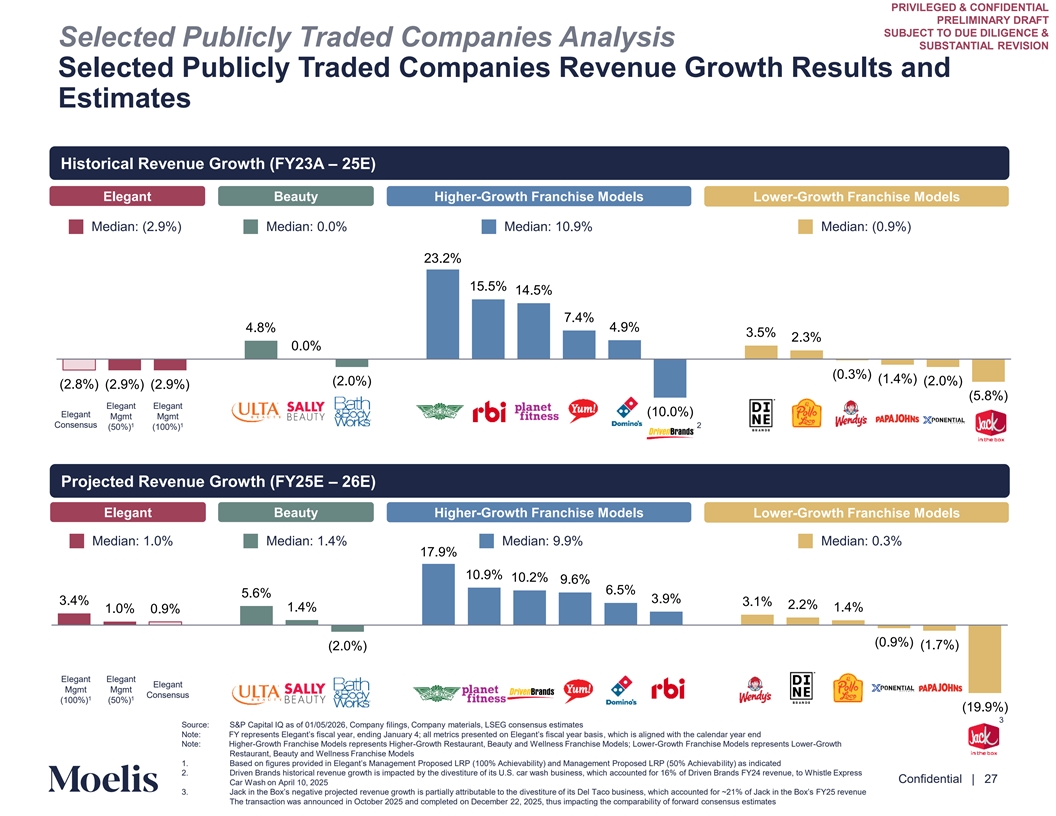
PRIVILEGED & CONFIDENTIAL PRELIMINARY DRAFT SUBJECT TO DUE DILIGENCE & Selected Publicly Traded Companies Analysis SUBSTANTIAL REVISION Selected Publicly Traded Companies Revenue Growth Results and Estimates Historical Revenue Growth (FY23A – 25E) Elegant Beauty Higher-Growth Franchise Models Lower-Growth Franchise Models Median: (2.9%) Median: 0.0% Median: 10.9% Median: (0.9%) 23.2% 15.5% 14.5% 7.4% 4.8% 4.9% 3.5% 2.3% 0.0% (0.3%) (1.4%) (2.0%) (2.0%) (2.8%) (2.9%) (2.9%) (5.8%) Elegant Elegant (10.0%) Elegant Mgmt Mgmt Consensus 1 1 2 (50%) (100%) P Net Le rojected veraRev ge enue Growth (FY25E – 26E) Elegant Beauty Higher-Growth Franchise Models Lower-Growth Franchise Models Median: 1.0% Median: 1.4% Median: 9.9% Median: 0.3% 17.9% 10.9% 10.2% 9.6% 6.5% 5.6% 3.9% 3.4% 3.1% 2.2% 1.4% 1.4% 1.0% 0.9% (0.9%) (1.7%) (2.0%) Elegant Elegant Elegant Mgmt Mgmt Consensus 1 1 (100%) (50%) (19.9%) 3 Source: S&P Capital IQ as of 01/05/2026, Company filings, Company materials, LSEG consensus estimates Note: FY represents Elegant’s fiscal year, ending January ; all metrics presented on Elegant’s f , isca which l ye is aar b liga nsi eds with the calendar year end Note: Higher-Growth Franchise Models represents Higher-Growth Restaurant, Beauty and Wellness Franchise Models; Lower-Growth Franchise Models represents Lower-Growth Content must not Restaurant, Beauty and Wellness Franchise Models 1. Based on figures provided in Elegant’s Management Proposed LRP (100% Achievability) and Management Proposed LRP (50% iliAty) ch iaes i vanbdicated go below this line 2. Driven Brands historical revenue growth is impacted by the divestiture of its U.S. car wash business, which accounted for 16% of Driven Brands FY24 revenue, to Whistle Express Confidential | 27 Car Wash on April 10, 2025 3. Jack in the Box’s negative projected revenue growth is partially attributable to the divestiture of its Del Taco bu ich sine accoun ss, whted for ~21% of Jack in the Box’s FY25 revenue The transaction was announced in October 2025 and completed on December 22, 2025, thus impacting the comparability of forward consensus estimates
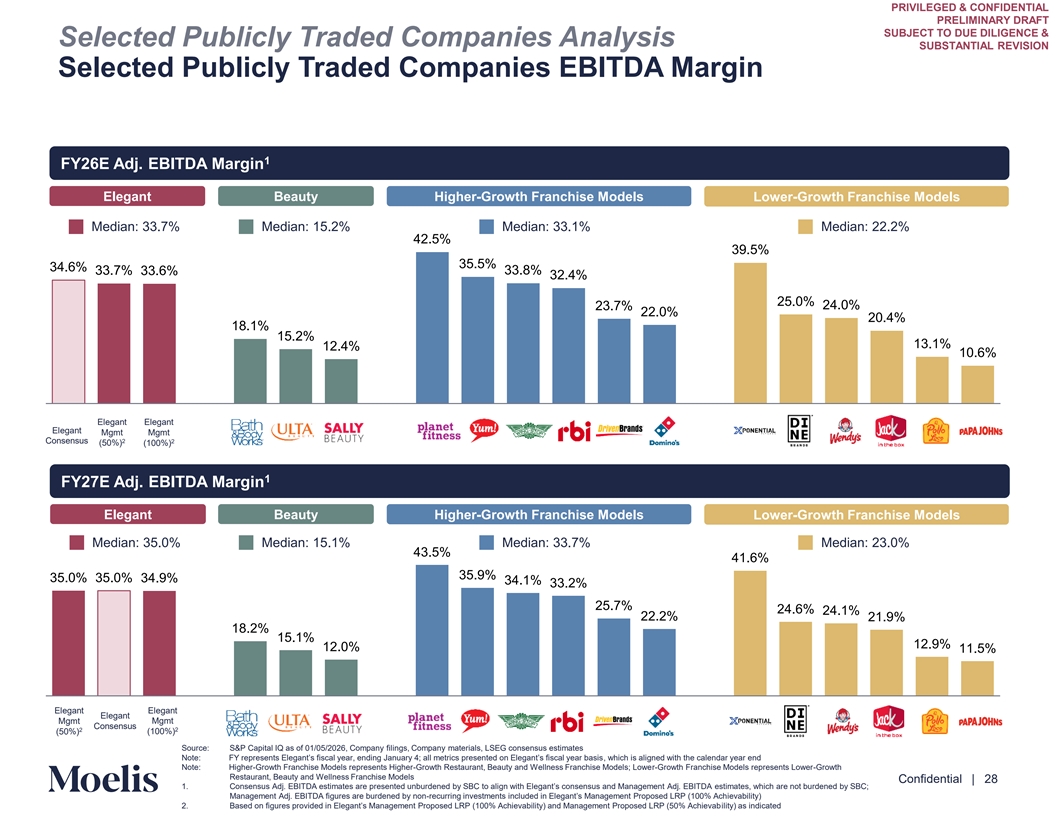
PRIVILEGED & CONFIDENTIAL PRELIMINARY DRAFT SUBJECT TO DUE DILIGENCE & Selected Publicly Traded Companies Analysis SUBSTANTIAL REVISION Selected Publicly Traded Companies EBITDA Margin 1 FY26E Adj. EBITDA Margin Elegant Beauty Higher-Growth Franchise Models Lower-Growth Franchise Models Median: 33.7% Median: 15.2% Median: 33.1% Median: 22.2% 42.5% 39.5% 35.5% 34.6% 33.7% 33.8% 33.6% 32.4% 25.0% 24.0% 23.7% 22.0% 20.4% 18.1% 15.2% 13.1% 12.4% 10.6% Elegant Elegant Elegant Mgmt Mgmt Consensus 2 2 (50%) (100%) 1 FY Net Le 27E v A edj ra. ge EBITDA Margin Elegant Beauty Higher-Growth Franchise Models Lower-Growth Franchise Models Median: 35.0% Median: 15.1% Median: 33.7% Median: 23.0% 43.5% 41.6% 35.9% 35.0% 35.0% 34.9% 34.1% 33.2% 25.7% 24.6% 24.1% 22.2% 21.9% 18.2% 15.1% 12.9% 12.0% 11.5% Elegant Elegant Elegant Mgmt Mgmt Consensus 2 2 (50%) (100%) a Source: S&P Capital IQ as of 01/05/2026, Company filings, Company materials, LSEG consensus estimates Content must not Note: FY represents Elegant’s fiscal year, ending January ; all metrics presented on Elegant’s f , isca which l ye is aar b liga nsi eds with the calendar year end Note: Higher-Growth Franchise Models represents Higher-Growth Restaurant, Beauty and Wellness Franchise Models; Lower-Growth Franchise Models represents Lower-Growth go below this line Restaurant, Beauty and Wellness Franchise Models Confidential | 28 1. Consensus Adj. EBITDA estimates are presented unburdened by SBC to align with Elegant’s consensus and Management Adj. estEiB mIT ate DA s, which are not burdened by SBC; Management Adj. EBITDA figures are burdened by non-recurring investments included in Elegant’s Management Proposed LRP (100%i A evab chility) 2. Based on figures provided in Elegant’s Management Proposed LRP (100% Achievability) and Management Proposed LRP (50% iliAty) ch iaes i vanbdicated
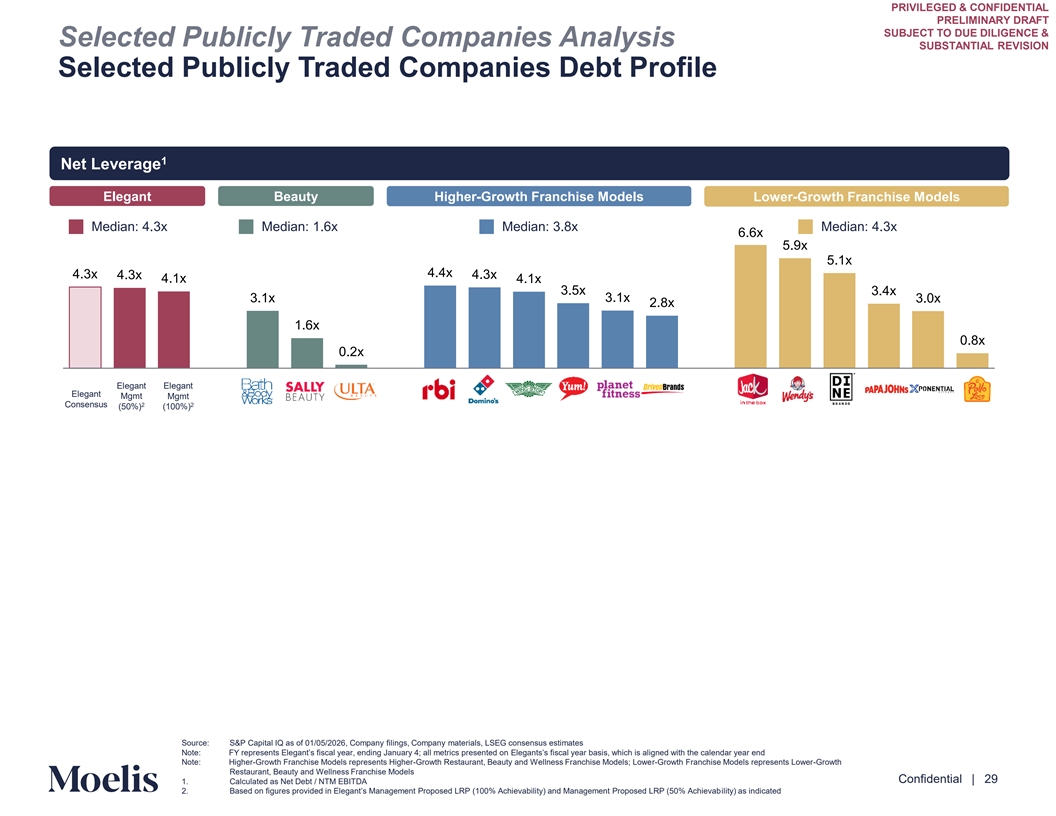
PRIVILEGED & CONFIDENTIAL PRELIMINARY DRAFT SUBJECT TO DUE DILIGENCE & Selected Publicly Traded Companies Analysis SUBSTANTIAL REVISION Selected Publicly Traded Companies Debt Profile 1 Net Leverage Elegant Beauty Higher-Growth Franchise Models Lower-Growth Franchise Models Median: 4.3x Median: 1.6x Median: 3.8x Median: 4.3x 6.6x 5.9x 5.1x 4.4x 4.3x 4.3x 4.3x 4.1x 4.1x 3.5x 3.4x 3.1x 3.1x 3.0x 2.8x 1.6x 0.8x 0.2x Elegant Elegant Elegant Mgmt Mgmt 2 2 Consensus (50%) (100%) Source: S&P Capital IQ as of 01/05/2026, Company filings, Company materials, LSEG consensus estimates Content must not Note: FY represents Elegant’s fiscal year, ending January ; all metrics p Elreegse annts’s ted o fisca n l year basis, which is aligned with the calendar year end Note: Higher-Growth Franchise Models represents Higher-Growth Restaurant, Beauty and Wellness Franchise Models; Lower-Growth Franchise Models represents Lower-Growth go below this line Restaurant, Beauty and Wellness Franchise Models Confidential | 29 1. Calculated as Net Debt / NTM EBITDA 2. Based on figures provided in Elegant’s Management Proposed LRP (100% Achievability) and Management Proposed LRP (50% iliAty) ch iaes i vanbdicated
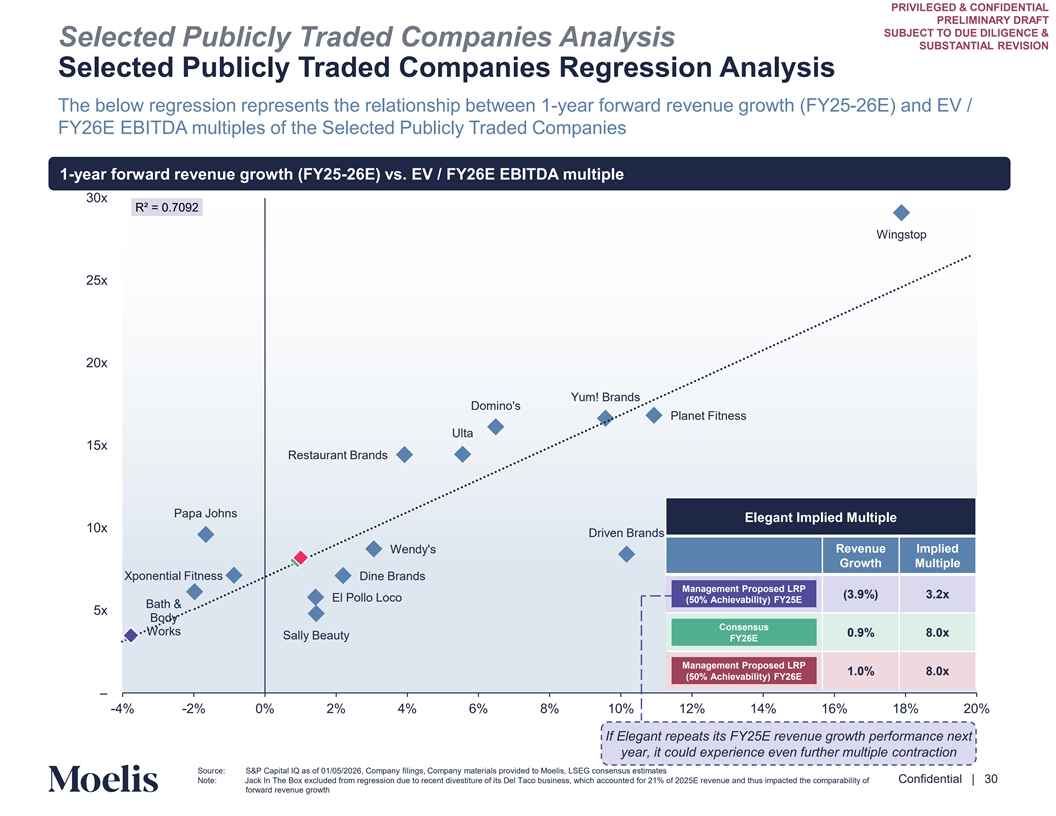
PRIVILEGED & CONFIDENTIAL PRELIMINARY DRAFT SUBJECT TO DUE DILIGENCE & Selected Publicly Traded Companies Analysis SUBSTANTIAL REVISION Selected Publicly Traded Companies Regression Analysis The below regression represents the relationship between 1-year forward revenue growth (FY25-26E) and EV / FY26E EBITDA multiples of the Selected Publicly Traded Companies 1-year forward revenue growth (FY25-26E) vs. EV / FY26E EBITDA multiple 30x R² = 0.7092 Wingstop 25x 20x Yum! Brands Domino's Planet Fitness Ulta 15x Restaurant Brands Papa Johns Elegant Implied Multiple 10x Driven Brands Wendy's Revenue Implied Growth Multiple Xponential Fitness Dine Brands Management Proposed LRP (3.9%) 3.2x El Pollo Loco (50% Achievability) FY25E Bath & 5x Body Consensus Works 0.9% 8.0x Sally Beauty FY26E Management Proposed LRP 1.0% 8.0x (50% Achievability) FY26E – -4% -2% 0% 2% 4% 6% 8% 10% 12% 14% 16% 18% 20% If Elegant repeats its FY25E revenue growth performance next Content must not year, it could experience even further multiple contraction go below this line Source: S&P Capital IQ as of 01/05/2026, Company filings, Company materials provided to Moelis, LSEG consensus estimates Confidential | 30 Note: Jack In The Box excluded from regression due to recent divestiture of its Del Taco business, which accounted for 21% of 2025E revenue and thus impacted the comparability of forward revenue growth
PRIVILEGED & CONFIDENTIAL PRELIMINARY DRAFT SUBJECT TO DUE DILIGENCE & SUBSTANTIAL REVISION C. Selected Precedent Transactions Analysis Content must not go below this line Confidential | 31
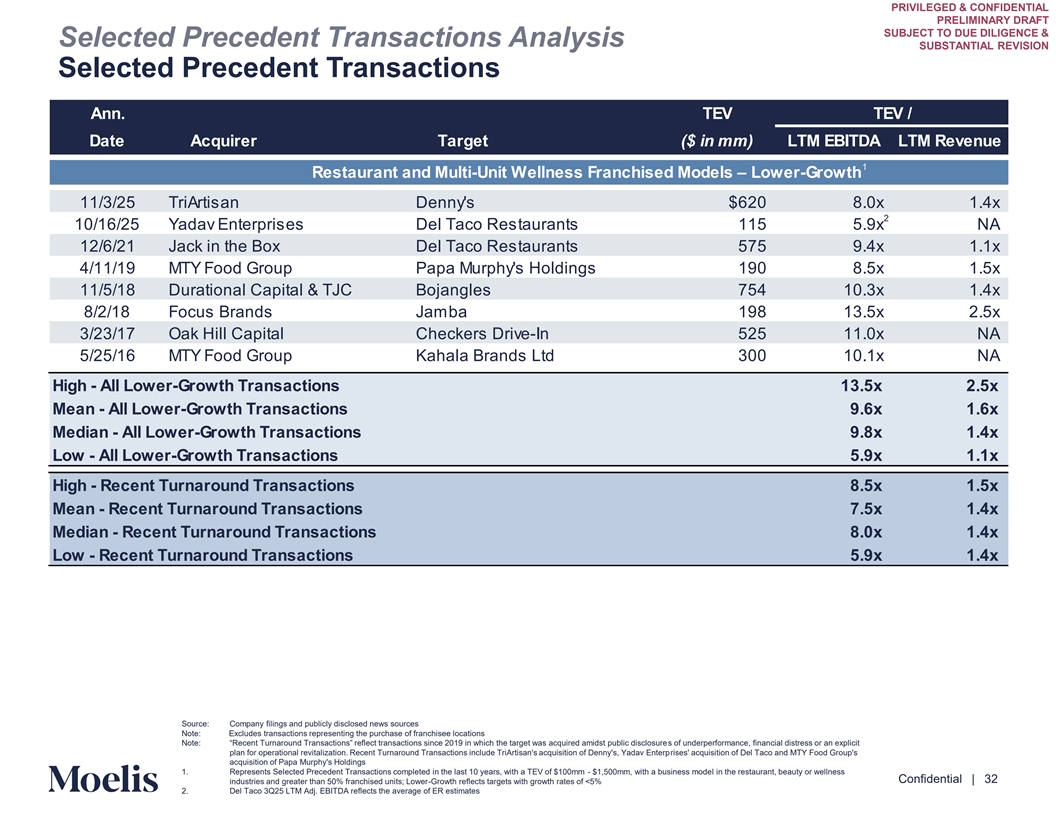
PRIVILEGED & CONFIDENTIAL PRELIMINARY DRAFT SUBJECT TO DUE DILIGENCE & Selected Precedent Transactions Analysis SUBSTANTIAL REVISION Selected Precedent Transactions Ann. TEV TEV / Date Acquirer Target ($ in mm) LTM EBITDA LTM Revenue 1 Restaurant and Multi-Unit Wellness Franchised Models – Lower-Growth 11/3/25 TriArtisan Denny's $620 8.0x 1.4x 2 10/16/25 Yadav Enterprises Del Taco Restaurants 115 5.9x NA 12/6/21 Jack in the Box Del Taco Restaurants 575 9.4x 1.1x 4/11/19 MTY Food Group Papa Murphy's Holdings 190 8.5x 1.5x 11/5/18 Durational Capital & TJC Bojangles 754 10.3x 1.4x 8/2/18 Focus Brands Jamba 198 13.5x 2.5x 3/23/17 Oak Hill Capital Checkers Drive-In 525 11.0x NA 5/25/16 MTY Food Group Kahala Brands Ltd 300 10.1x NA High - All Lower-Growth Transactions 13.5x 2.5x Mean - All Lower-Growth Transactions 9.6x 1.6x Median - All Lower-Growth Transactions 9.8x 1.4x Low - All Lower-Growth Transactions 5.9x 1.1x High - Recent Turnaround Transactions 8.5x 1.5x Mean - Recent Turnaround Transactions 7.5x 1.4x Median - Recent Turnaround Transactions 8.0x 1.4x Low - Recent Turnaround Transactions 5.9x 1.4x Source: Company filings and publicly disclosed news sources Note: Excludes transactions representing the purchase of franchisee locations Note: “Recent Turnaround Transactions” reflect transactions since 201 in which the target was acquired amidst public ds iscl of ousu ndre erperformance, financial distress or an explicit Content must not plan for operational revitalization. Recent Turnaround Transactions include TriArtisan's acquisition of Denny's, Yadav Enterprises' acquisition of Del Taco and MTY Food Group's acquisition of Papa Murphy's Holdings go below this line 1. Represents Selected Precedent Transactions completed in the last 10 years, with a TEV of $100mm - $1,500mm, with a business model in the restaurant, beauty or wellness Confidential | 32 industries and greater than 50% franchised units; Lower-Growth reflects targets with growth rates of <5% 2. Del Taco 3Q25 LTM Adj. EBITDA reflects the average of ER estimates
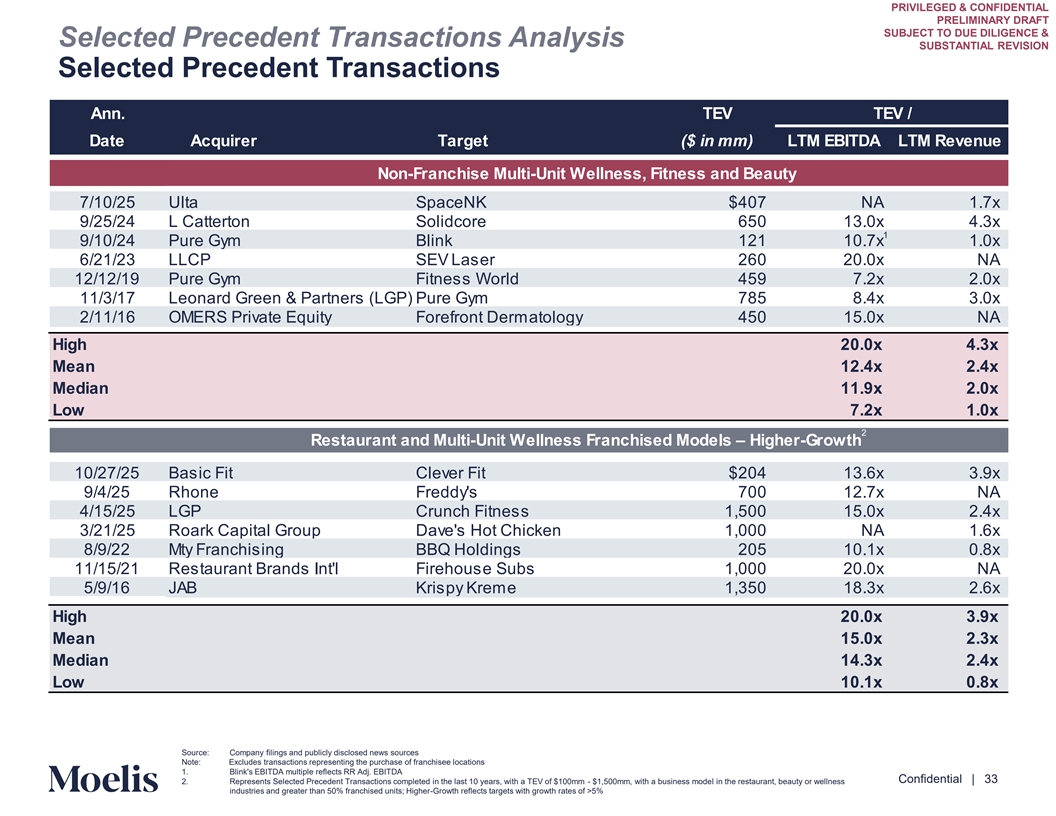
PRIVILEGED & CONFIDENTIAL PRELIMINARY DRAFT SUBJECT TO DUE DILIGENCE & Selected Precedent Transactions Analysis SUBSTANTIAL REVISION Selected Precedent Transactions Ann. TEV TEV / Date Acquirer Target ($ in mm) LTM EBITDA LTM Revenue Non-Franchise Multi-Unit Wellness, Fitness and Beauty 7/10/25 Ulta SpaceNK $407 NA 1.7x 9/25/24 L Catterton Solidcore 650 13.0x 4.3x 1 9/10/24 Pure Gym Blink 121 10.7x 1.0x 6/21/23 LLCP SEV Laser 260 20.0x NA 12/12/19 Pure Gym Fitness World 459 7.2x 2.0x 11/3/17 Leonard Green & Partners (LGP) Pure Gym 785 8.4x 3.0x 2/11/16 OMERS Private Equity Forefront Dermatology 450 15.0x NA High 20.0x 4.3x Mean 12.4x 2.4x Median 11.9x 2.0x Low 7.2x 1.0x 2 Restaurant and Multi-Unit Wellness Franchised Models – Higher-Growth 10/27/25 Basic Fit Clever Fit $204 13.6x 3.9x 9/4/25 Rhone Freddy's 700 12.7x NA 4/15/25 LGP Crunch Fitness 1,500 15.0x 2.4x 3/21/25 Roark Capital Group Dave's Hot Chicken 1,000 NA 1.6x 8/9/22 Mty Franchising BBQ Holdings 205 10.1x 0.8x 11/15/21 Restaurant Brands Int'l Firehouse Subs 1,000 20.0x NA 5/9/16 JAB Krispy Kreme 1,350 18.3x 2.6x High 20.0x 3.9x Mean 15.0x 2.3x Median 14.3x 2.4x Low 10.1x 0.8x Content must not Source: Company filings and publicly disclosed news sources Note: Excludes transactions representing the purchase of franchisee locations go below this line 1. Blink's EBITDA multiple reflects RR Adj. EBITDA Confidential | 33 2. Represents Selected Precedent Transactions completed in the last 10 years, with a TEV of $100mm - $1,500mm, with a business model in the restaurant, beauty or wellness industries and greater than 50% franchised units; Higher-Growth reflects targets with growth rates of >5%
PRIVILEGED & CONFIDENTIAL PRELIMINARY DRAFT SUBJECT TO DUE DILIGENCE & SUBSTANTIAL REVISION D. Discounted Cash Flow Analysis (For Reference Only) Content must not go below this line Confidential | 34
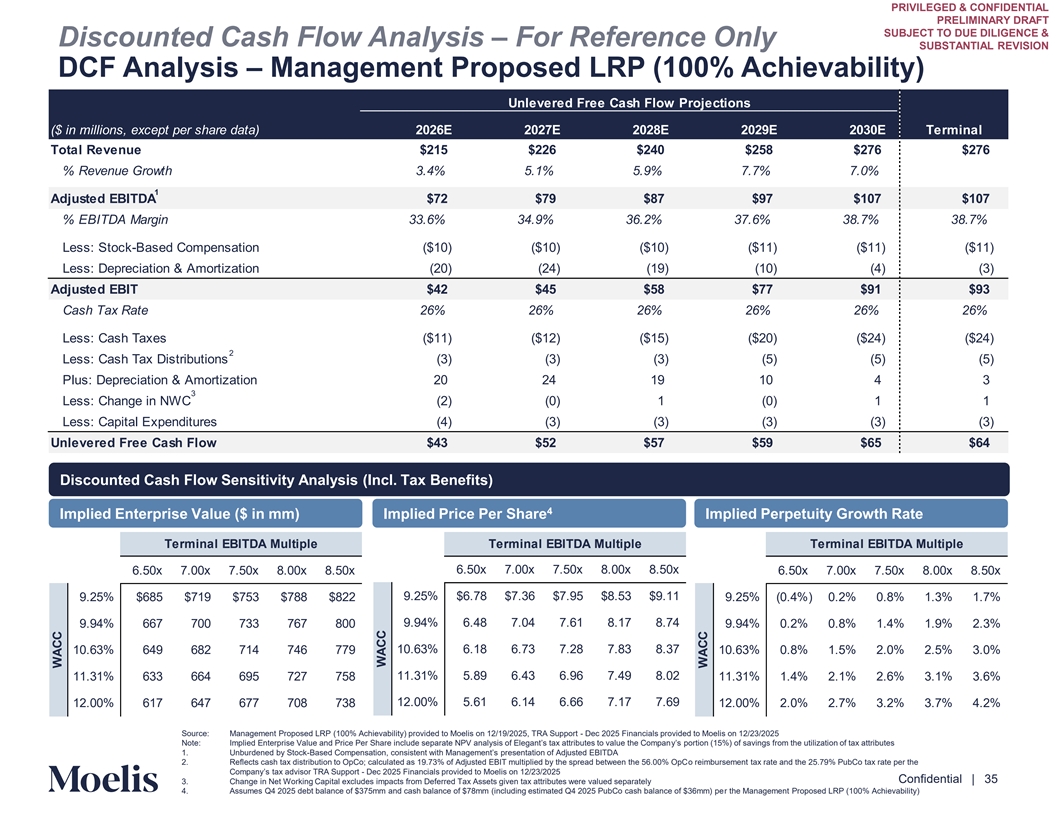
PRIVILEGED & CONFIDENTIAL PRELIMINARY DRAFT SUBJECT TO DUE DILIGENCE & Discounted Cash Flow Analysis – For Reference Only SUBSTANTIAL REVISION DCF Analysis – Management Proposed LRP (100% Achievability) Unlevered Free Cash Flow Projections ($ in millions, except per share data) 2026E 2027E 2028E 2029E 2030E Terminal Total Revenue $215 $226 $240 $258 $276 $276 % Revenue Growth 3.4% 5.1% 5.9% 7.7% 7.0% 1 Adjusted EBITDA $72 $79 $87 $97 $107 $107 % EBITDA Margin 33.6% 34.9% 36.2% 37.6% 38.7% 38.7% Less: Stock-Based Compensation ($10) ($10) ($10) ($11) ($11) ($11) Less: Depreciation & Amortization (20) (24) (19) (10) (4) (3) Adjusted EBIT $42 $45 $58 $77 $91 $93 Cash Tax Rate 26% 26% 26% 26% 26% 26% Less: Cash Taxes ($11) ($12) ($15) ($20) ($24) ($24) 2 Less: Cash Tax Distributions (3) (3) (3) (5) (5) (5) Plus: Depreciation & Amortization 20 24 19 10 4 3 3 Less: Change in NWC (2) (0) 1 (0) 1 1 Less: Capital Expenditures (4) (3) (3) (3) (3) (3) Unlevered Free Cash Flow $43 $52 $57 $59 $65 $64 Discounted Cash Flow Sensitivity Analysis (Incl. Tax Benefits) 4 Implied Enterprise Value ($ in mm) Implied Price Per Share Implied Perpetuity Growth Rate Terminal EBITDA Multiple Terminal EBITDA Multiple Terminal EBITDA Multiple 6.50x 7.00x 7.50x 8.00x 8.50x 6.50x 7.00x 7.50x 8.00x 8.50x 6.50x 7.00x 7.50x 8.00x 8.50x 9.25% $6.78 $7.36 $7.95 $8.53 $9.11 9.25% $685 $719 $753 $788 $822 9.25% (0.4%) 0.2% 0.8% 1.3% 1.7% 9.94% 6.48 7.04 7.61 8.17 8.74 9.94% 667 700 733 767 800 9.94% 0.2% 0.8% 1.4% 1.9% 2.3% 10.63% 6.18 6.73 7.28 7.83 8.37 10.63% 649 682 714 746 779 10.63% 0.8% 1.5% 2.0% 2.5% 3.0% 11.31% 5.89 6.43 6.96 7.49 8.02 11.31% 633 664 695 727 758 11.31% 1.4% 2.1% 2.6% 3.1% 3.6% 12.00% 5.61 6.14 6.66 7.17 7.69 12.00% 617 647 677 708 738 12.00% 2.0% 2.7% 3.2% 3.7% 4.2% Source: Management Proposed LRP (100% Achievability) provided to Moelis on 12/19/2025, TRA Support - Dec 2025 Financials provided to Moelis on 12/23/2025 Note: Implied Enterprise Value and Price Per Share include separate NPV analysis of Elegant’s tax attributes to value thy’s e Com porptiaonn (15%) of savings from the utilization of tax attributes Content must not 1. Unburdened by Stock-Based Compensation, consistent with Management’s presentation of Adjusted EBITDA 2. Reflects cash tax distribution to OpCo; calculated as 19.73% of Adjusted EBIT multiplied by the spread between the 56.00% OpCo reimbursement tax rate and the 25.79% PubCo tax rate per the go below this line Company’s tax advisor TRA Suppo-r t Dec 2025 Financials provided to Moelis on 12/23/2025 Confidential | 35 3. Change in Net Working Capital excludes impacts from Deferred Tax Assets given tax attributes were valued separately 4. Assumes Q4 2025 debt balance of $375mm and cash balance of $78mm (including estimated Q4 2025 PubCo cash balance of $36mm) per the Management Proposed LRP (100% Achievability) WACC WACC WACC
PRIVILEGED & CONFIDENTIAL PRELIMINARY DRAFT SUBJECT TO DUE DILIGENCE & SUBSTANTIAL REVISION E. Leverage Buyout Analysis (For Reference Only) Content must not go below this line Confidential | 36
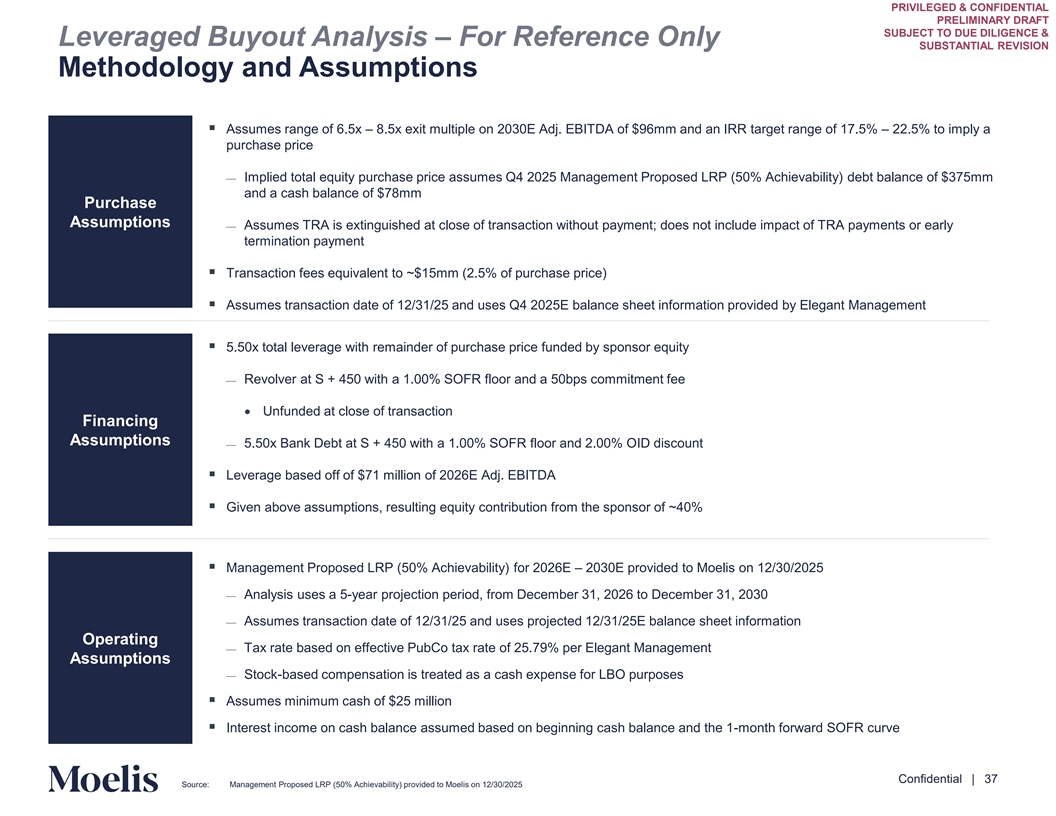
PRIVILEGED & CONFIDENTIAL PRELIMINARY DRAFT SUBJECT TO DUE DILIGENCE & Leveraged Buyout Analysis – For Reference Only SUBSTANTIAL REVISION Methodology and Assumptions ▪ Assumes range of 6.5x – 8.5x exit multiple on 2030E Adj. EBITDA of $96mm and an IRR target range of 17.5% – 22.5% to imply a purchase price ⎯ Implied total equity purchase price assumes Q4 2025 Management Proposed LRP (50% Achievability) debt balance of $375mm and a cash balance of $78mm Purchase Assumptions ⎯ Assumes TRA is extinguished at close of transaction without payment; does not include impact of TRA payments or early termination payment ▪ Transaction fees equivalent to ~$15mm (2.5% of purchase price) ▪ Assumes transaction date of 12/31/25 and uses Q4 2025E balance sheet information provided by Elegant Management ▪ 5.50x total leverage with remainder of purchase price funded by sponsor equity ⎯ Revolver at S + 450 with a 1.00% SOFR floor and a 50bps commitment fee • Unfunded at close of transaction Financing Assumptions ⎯ 5.50x Bank Debt at S + 450 with a 1.00% SOFR floor and 2.00% OID discount ▪ Leverage based off of $71 million of 2026E Adj. EBITDA ▪ Given above assumptions, resulting equity contribution from the sponsor of ~40% ▪ Management Proposed LRP (50% Achievability) for 2026E – 2030E provided to Moelis on 12/30/2025 ⎯ Analysis uses a 5-year projection period, from December 31, 2026 to December 31, 2030 ⎯ Assumes transaction date of 12/31/25 and uses projected 12/31/25E balance sheet information Operating ⎯ Tax rate based on effective PubCo tax rate of 25.79% per Elegant Management Assumptions ⎯ Stock-based compensation is treated as a cash expense for LBO purposes ▪ Assumes minimum cash of $25 million ▪ Interest income on cash balance assumed based on beginning cash balance and the 1-month forward SOFR curve Content must not go below this line Confidential | 37 Source: Management Proposed LRP (50% Achievability) provided to Moelis on 12/30/2025
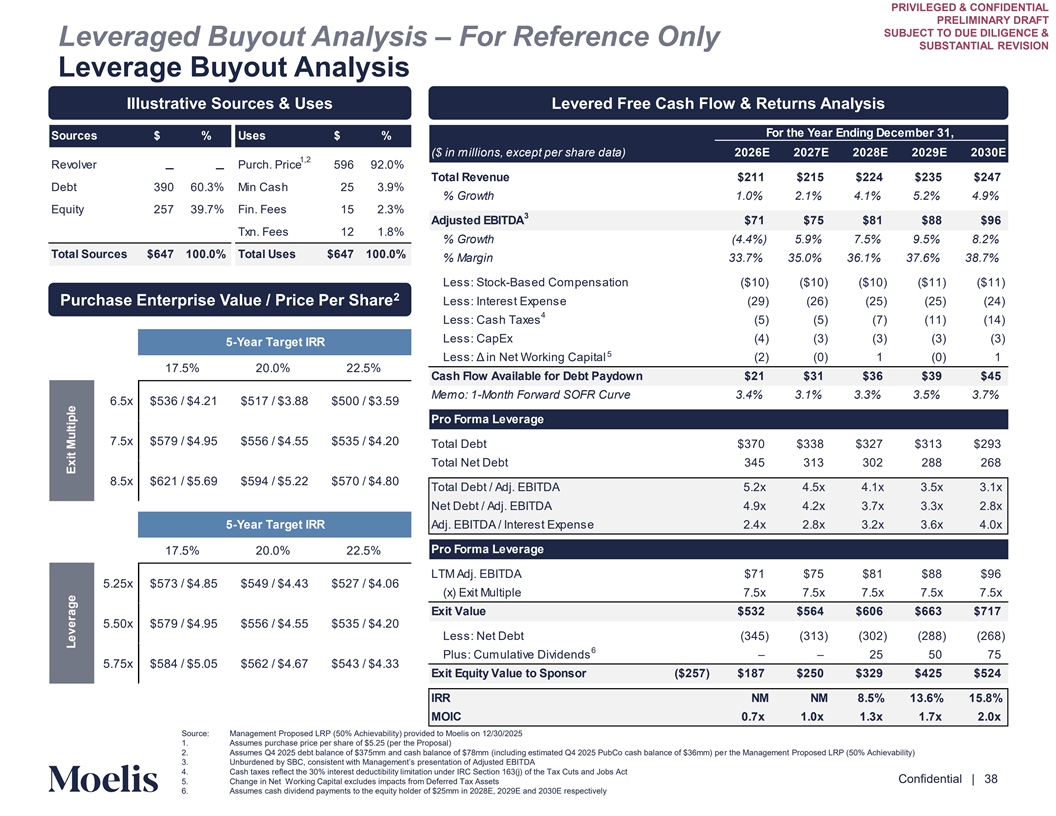
PRIVILEGED & CONFIDENTIAL PRELIMINARY DRAFT SUBJECT TO DUE DILIGENCE & Leveraged Buyout Analysis – For Reference Only SUBSTANTIAL REVISION Leverage Buyout Analysis Illustrative Sources & Uses Levered Free Cash Flow & Returns Analysis For the Year Ending December 31, Sources $ % Uses $ % ($ in millions, except per share data) 2026E 2027E 2028E 2029E 2030E 1,2 Revolver Purch. Price 596 92.0% – – Total Revenue $211 $215 $224 $235 $247 Debt 390 60.3% Min Cash 25 3.9% % Growth 1.0% 2.1% 4.1% 5.2% 4.9% Equity 257 39.7% Fin. Fees 15 2.3% 3 Adjusted EBITDA $71 $75 $81 $88 $96 Txn. Fees 12 1.8% % Growth (4.4%) 5.9% 7.5% 9.5% 8.2% Total Sources $647 100.0% Total Uses $647 100.0% % Margin 33.7% 35.0% 36.1% 37.6% 38.7% Less: Stock-Based Compensation ($10) ($10) ($10) ($11) ($11) 2 Purchase Enterprise Value / Price Per Share Less: Interest Expense (29) (26) (25) (25) (24) 4 Less: Cash Taxes (5) (5) (7) (11) (14) Less: CapEx (4) (3) (3) (3) (3) 5-Year Target IRR 5 Less: Δ in Net Working Capital (2) (0) 1 (0) 1 17.5% 20.0% 22.5% Cash Flow Available for Debt Paydown $21 $31 $36 $39 $45 Memo: 1-Month Forward SOFR Curve 3.4% 3.1% 3.3% 3.5% 3.7% 6.5x $536 / $4.21 $517 / $3.88 $500 / $3.59 Pro Forma Leverage 7.5x $579 / $4.95 $556 / $4.55 $535 / $4.20 Total Debt $370 $338 $327 $313 $293 Total Net Debt 345 313 302 288 268 8.5x $621 / $5.69 $594 / $5.22 $570 / $4.80 Total Debt / Adj. EBITDA 5.2x 4.5x 4.1x 3.5x 3.1x Net Debt / Adj. EBITDA 4.9x 4.2x 3.7x 3.3x 2.8x 5-Year Target IRR Adj. EBITDA / Interest Expense 2.4x 2.8x 3.2x 3.6x 4.0x Pro Forma Leverage 17.5% 20.0% 22.5% LTM Adj. EBITDA $71 $75 $81 $88 $96 5.25x $573 / $4.85 $549 / $4.43 $527 / $4.06 (x) Exit Multiple 7.5x 7.5x 7.5x 7.5x 7.5x Exit Value $532 $564 $606 $663 $717 5.50x $579 / $4.95 $556 / $4.55 $535 / $4.20 Less: Net Debt (345) (313) (302) (288) (268) 6 Plus: Cumulative Dividends – – 25 50 75 5.75x $584 / $5.05 $562 / $4.67 $543 / $4.33 Exit Equity Value to Sponsor ($257) $187 $250 $329 $425 $524 IRR NM NM 8.5% 13.6% 15.8% MOIC 0.7x 1.0x 1.3x 1.7x 2.0x Source: Management Proposed LRP (50% Achievability) provided to Moelis on 12/30/2025 1. Assumes purchase price per share of $5.25 (per the Proposal) Content must not 2. Assumes Q4 2025 debt balance of $375mm and cash balance of $78mm (including estimated Q4 2025 PubCo cash balance of $36mm) per the Management Proposed LRP (50% Achievability) 3. Unburdened by SBC, consistent with Management’s presentation of Adjusted EBITDA go below this line 4. Cash taxes reflect the 30% interest deductibility limitation under IRC Section 163(j) of the Tax Cuts and Jobs Act Confidential | 38 5. Change in Net Working Capital excludes impacts from Deferred Tax Assets 6. Assumes cash dividend payments to the equity holder of $25mm in 2028E, 2029E and 2030E respectively Leverage Exit Multiple

PRIVILEGED & CONFIDENTIAL PRELIMINARY DRAFT SUBJECT TO DUE DILIGENCE & SUBSTANTIAL REVISION F. Sensitivity Analysis Content must not go below this line Confidential | 39
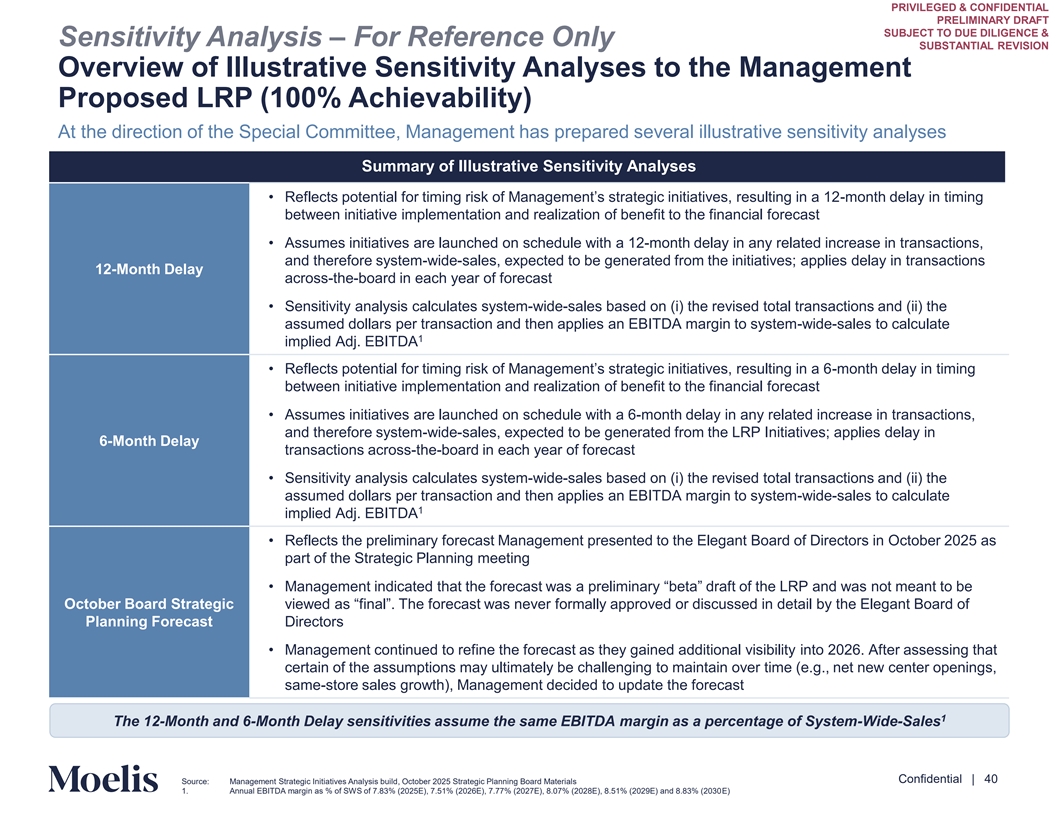
PRIVILEGED & CONFIDENTIAL PRELIMINARY DRAFT SUBJECT TO DUE DILIGENCE & Sensitivity Analysis – For Reference Only SUBSTANTIAL REVISION Overview of Illustrative Sensitivity Analyses to the Management Proposed LRP (100% Achievability) At the direction of the Special Committee, Management has prepared several illustrative sensitivity analyses Summary of Illustrative Sensitivity Analyses • Reflects potential for timing risk of Management’s strategic initiatives, resulting in a -mon12 th delay in timing between initiative implementation and realization of benefit to the financial forecast • Assumes initiatives are launched on schedule with a 12-month delay in any related increase in transactions, and therefore system-wide-sales, expected to be generated from the initiatives; applies delay in transactions 12-Month Delay across-the-board in each year of forecast • Sensitivity analysis calculates system-wide-sales based on (i) the revised total transactions and (ii) the assumed dollars per transaction and then applies an EBITDA margin to system-wide-sales to calculate 1 implied Adj. EBITDA • Reflects potential for timing risk of Management’s strategic initiatives, resulting -im n a onth 6delay in timing between initiative implementation and realization of benefit to the financial forecast • Assumes initiatives are launched on schedule with a 6-month delay in any related increase in transactions, and therefore system-wide-sales, expected to be generated from the LRP Initiatives; applies delay in 6-Month Delay transactions across-the-board in each year of forecast • Sensitivity analysis calculates system-wide-sales based on (i) the revised total transactions and (ii) the assumed dollars per transaction and then applies an EBITDA margin to system-wide-sales to calculate 1 implied Adj. EBITDA • Reflects the preliminary forecast Management presented to the Elegant Board of Directors in October 2025 as part of the Strategic Planning meeting • Management indicated that the forecast was a preliminary “beta” draft of the LRP and was not meant to be October Board Strategic viewed as “final”. The forecast was never formally approved or discussed in detail by the Elegant Board of Planning Forecast Directors • Management continued to refine the forecast as they gained additional visibility into 2026. After assessing that certain of the assumptions may ultimately be challenging to maintain over time (e.g., net new center openings, same-store sales growth), Management decided to update the forecast 1 The 12-Month and 6-Month Delay sensitivities assume the same EBITDA margin as a percentage of System-Wide-Sales Content must not go below this line Confidential | 40 Source: Management Strategic Initiatives Analysis build, October 2025 Strategic Planning Board Materials 1. Annual EBITDA margin as % of SWS of 7.83% (2025E), 7.51% (2026E), 7.77% (2027E), 8.07% (2028E), 8.51% (2029E) and 8.83% (2030E)
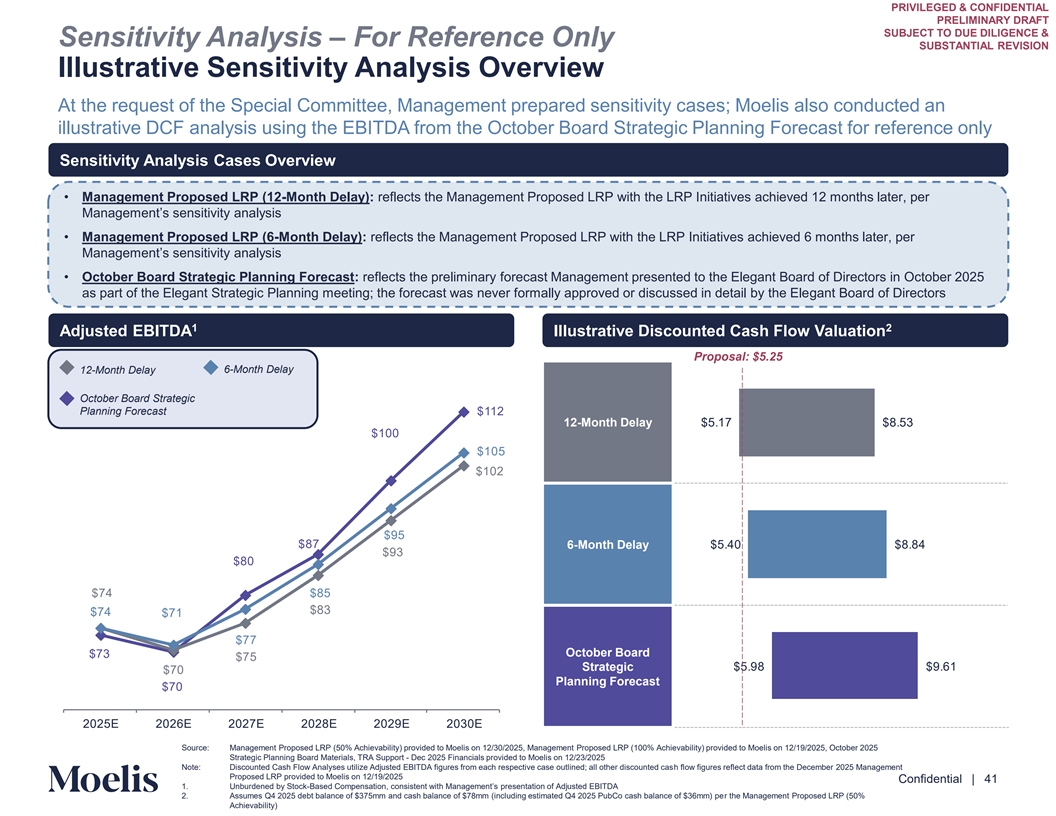
PRIVILEGED & CONFIDENTIAL PRELIMINARY DRAFT SUBJECT TO DUE DILIGENCE & Sensitivity Analysis – For Reference Only SUBSTANTIAL REVISION Illustrative Sensitivity Analysis Overview At the request of the Special Committee, Management prepared sensitivity cases; Moelis also conducted an illustrative DCF analysis using the EBITDA from the October Board Strategic Planning Forecast for reference only Sensitivity Analysis Cases Overview • Management Proposed LRP (12-Month Delay): reflects the Management Proposed LRP with the LRP Initiatives achieved 12 months later, per Management’s sensitivity analysis • Management Proposed LRP (6-Month Delay): reflects the Management Proposed LRP with the LRP Initiatives achieved 6 months later, per Management’s sensitivity analysis • October Board Strategic Planning Forecast: reflects the preliminary forecast Management presented to the Elegant Board of Directors in October 2025 as part of the Elegant Strategic Planning meeting; the forecast was never formally approved or discussed in detail by the Elegant Board of Directors 1 2 Adjusted EBITDA Illustrative Discounted Cash Flow Valuation Proposal: $5.25 12-Month Delay 6-Month Delay October Board Strategic Planning Forecast 112 12-Month Delay 5.1 8.53 100 105 102 5 8 6-Month Delay 5. 0 8.8 3 80 85 83 1 October Board 3 5 Strategic 5. 8 .61 0 Planning Forecast 0 2025E 2026E 202 E 2028E 202 E 2030E Source: Management Proposed LRP (50% Achievability) provided to Moelis on 12/30/2025, Management Proposed LRP (100% Achievability) provided to Moelis on 12/19/2025, October 2025 Content must not Strategic Planning Board Materials, TRA Support - Dec 2025 Financials provided to Moelis on 12/23/2025 Note: Discounted Cash Flow Analyses utilize Adjusted EBITDA figures from each respective case outlined; all other discounted cash flow figures reflect data from the December 2025 Management go below this line Proposed LRP provided to Moelis on 12/19/2025 Confidential | 41 1. Unburdened by Stock-Based Compensation, consistent with Management’s presentation of Adjusted EBITDA 2. Assumes Q4 2025 debt balance of $375mm and cash balance of $78mm (including estimated Q4 2025 PubCo cash balance of $36mm) per the Management Proposed LRP (50% Achievability)
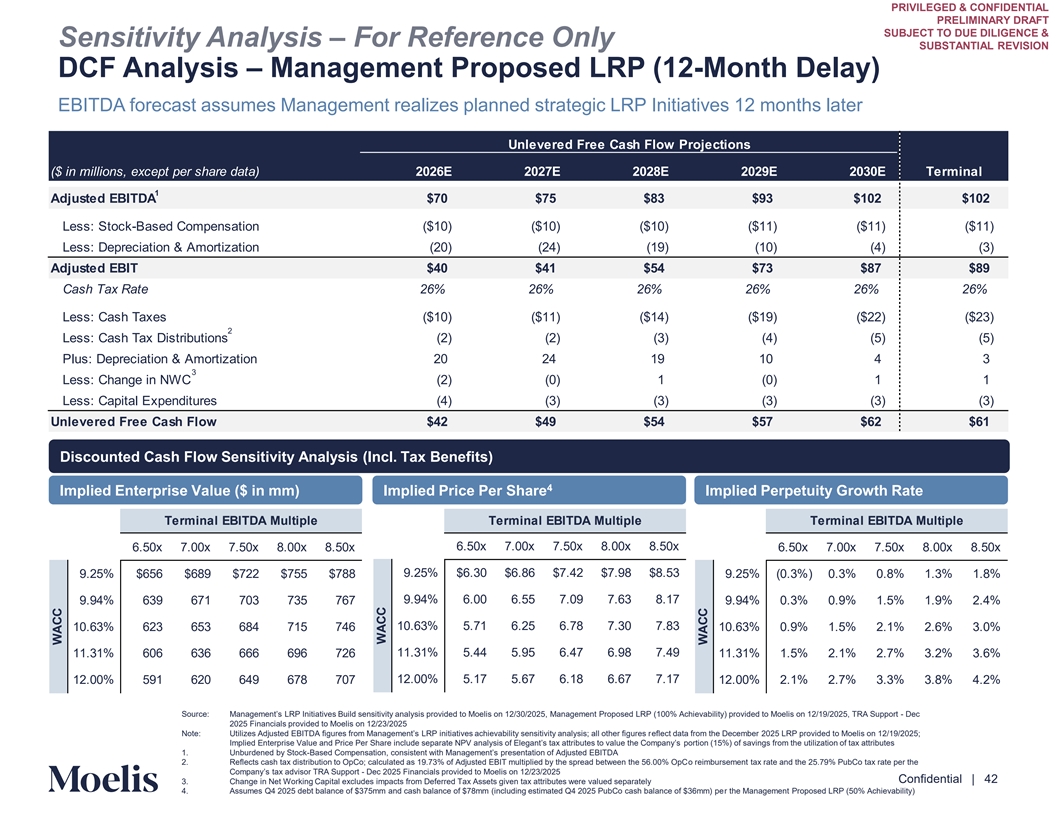
PRIVILEGED & CONFIDENTIAL PRELIMINARY DRAFT SUBJECT TO DUE DILIGENCE & Sensitivity Analysis – For Reference Only SUBSTANTIAL REVISION DCF Analysis – Management Proposed LRP (12-Month Delay) EBITDA forecast assumes Management realizes planned strategic LRP Initiatives 12 months later Unlevered Free Cash Flow Projections ($ in millions, except per share data) 2026E 2027E 2028E 2029E 2030E Terminal 1 Adjusted EBITDA $70 $75 $83 $93 $102 $102 Less: Stock-Based Compensation ($10) ($10) ($10) ($11) ($11) ($11) Less: Depreciation & Amortization (20) (24) (19) (10) (4) (3) Adjusted EBIT $40 $41 $54 $73 $87 $89 Cash Tax Rate 26% 26% 26% 26% 26% 26% Less: Cash Taxes ($10) ($11) ($14) ($19) ($22) ($23) 2 Less: Cash Tax Distributions (2) (2) (3) (4) (5) (5) Plus: Depreciation & Amortization 20 24 19 10 4 3 3 Less: Change in NWC (2) (0) 1 (0) 1 1 Less: Capital Expenditures (4) (3) (3) (3) (3) (3) Unlevered Free Cash Flow $42 $49 $54 $57 $62 $61 Discounted Cash Flow Sensitivity Analysis (Incl. Tax Benefits) 4 Implied Enterprise Value ($ in mm) Implied Price Per Share Implied Perpetuity Growth Rate Terminal EBITDA Multiple Terminal EBITDA Multiple Terminal EBITDA Multiple 6.50x 7.00x 7.50x 8.00x 8.50x 6.50x 7.00x 7.50x 8.00x 8.50x 6.50x 7.00x 7.50x 8.00x 8.50x 9.25% $6.30 $6.86 $7.42 $7.98 $8.53 9.25% $656 $689 $722 $755 $788 9.25% (0.3%) 0.3% 0.8% 1.3% 1.8% 9.94% 6.00 6.55 7.09 7.63 8.17 9.94% 639 671 703 735 767 9.94% 0.3% 0.9% 1.5% 1.9% 2.4% 10.63% 623 653 684 715 746 10.63% 5.71 6.25 6.78 7.30 7.83 10.63% 0.9% 1.5% 2.1% 2.6% 3.0% 11.31% 606 636 666 696 726 11.31% 5.44 5.95 6.47 6.98 7.49 11.31% 1.5% 2.1% 2.7% 3.2% 3.6% 12.00% 5.17 5.67 6.18 6.67 7.17 12.00% 591 620 649 678 707 12.00% 2.1% 2.7% 3.3% 3.8% 4.2% Source: Management’s LRP Initiatives Build sensitivity analysis provided to Moelis on 12/30/2 M0a2n5a, gement Proposed LRP (100% Achievability) provided to Moelis on 12/19/2025, TRA Support - Dec 2025 Financials provided to Moelis on 12/23/2025 Note: Utilizes Adjusted EBITDA figures from Management’s LRP initiatives achievability sensitivity analysis; all other fi eg flu erct es darta from the December 2025 LRP provided to Moelis on 12/19/2025; Implied Enterprise Value and Price Per Share include separate NPV analysis of Elegant’s tax attributes to value the Com portipoann (y’s 15%) of savings from the utilization of tax attributes Content must not 1. Unburdened by Stock-Based Compensation, consistent with Management’s presentation of Adjusted EBITDA 2. Reflects cash tax distribution to OpCo; calculated as 19.73% of Adjusted EBIT multiplied by the spread between the 56.00% OpCo reimbursement tax rate and the 25.79% PubCo tax rate per the go below this line Company’s tax advisor TRA Suppo-r t Dec 2025 Financials provided to Moelis on 12/23/2025 Confidential | 42 3. Change in Net Working Capital excludes impacts from Deferred Tax Assets given tax attributes were valued separately 4. Assumes Q4 2025 debt balance of $375mm and cash balance of $78mm (including estimated Q4 2025 PubCo cash balance of $36mm) per the Management Proposed LRP (50% Achievability) WACC WACC WACC
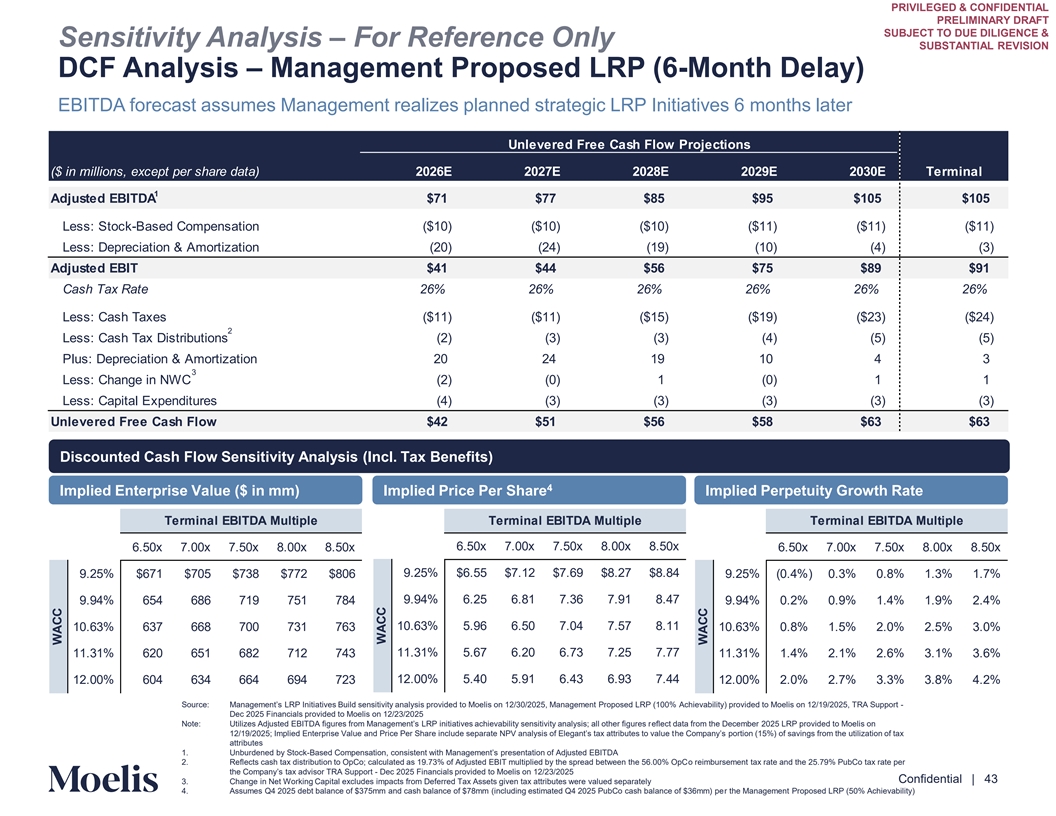
PRIVILEGED & CONFIDENTIAL PRELIMINARY DRAFT SUBJECT TO DUE DILIGENCE & Sensitivity Analysis – For Reference Only SUBSTANTIAL REVISION DCF Analysis – Management Proposed LRP (6-Month Delay) EBITDA forecast assumes Management realizes planned strategic LRP Initiatives 6 months later Unlevered Free Cash Flow Projections ($ in millions, except per share data) 2026E 2027E 2028E 2029E 2030E Terminal 1 Adjusted EBITDA $71 $77 $85 $95 $105 $105 Less: Stock-Based Compensation ($10) ($10) ($10) ($11) ($11) ($11) Less: Depreciation & Amortization (20) (24) (19) (10) (4) (3) Adjusted EBIT $41 $44 $56 $75 $89 $91 Cash Tax Rate 26% 26% 26% 26% 26% 26% Less: Cash Taxes ($11) ($11) ($15) ($19) ($23) ($24) 2 Less: Cash Tax Distributions (2) (3) (3) (4) (5) (5) Plus: Depreciation & Amortization 20 24 19 10 4 3 3 Less: Change in NWC (2) (0) 1 (0) 1 1 Less: Capital Expenditures (4) (3) (3) (3) (3) (3) Unlevered Free Cash Flow $42 $51 $56 $58 $63 $63 Discounted Cash Flow Sensitivity Analysis (Incl. Tax Benefits) 4 Implied Enterprise Value ($ in mm) Implied Price Per Share Implied Perpetuity Growth Rate Terminal EBITDA Multiple Terminal EBITDA Multiple Terminal EBITDA Multiple 6.50x 7.00x 7.50x 8.00x 8.50x 6.50x 7.00x 7.50x 8.00x 8.50x 6.50x 7.00x 7.50x 8.00x 8.50x 9.25% $6.55 $7.12 $7.69 $8.27 $8.84 9.25% $671 $705 $738 $772 $806 9.25% (0.4%) 0.3% 0.8% 1.3% 1.7% 9.94% 6.25 6.81 7.36 7.91 8.47 9.94% 654 686 719 751 784 9.94% 0.2% 0.9% 1.4% 1.9% 2.4% 10.63% 637 668 700 731 763 10.63% 5.96 6.50 7.04 7.57 8.11 10.63% 0.8% 1.5% 2.0% 2.5% 3.0% 11.31% 620 651 682 712 743 11.31% 5.67 6.20 6.73 7.25 7.77 11.31% 1.4% 2.1% 2.6% 3.1% 3.6% 12.00% 5.40 5.91 6.43 6.93 7.44 12.00% 604 634 664 694 723 12.00% 2.0% 2.7% 3.3% 3.8% 4.2% Source: Management’s LRP Initiatives Build sensitivity analysis provided to Moelis on 12/30/2025, Management Proposed LRPA ( ch 10 ie0va % bility) provided to Moelis on 12/19/2025, TRA Support - Dec 2025 Financials provided to Moelis on 12/23/2025 Note: Utilizes Adjusted EBITDA figures from Management’s LRP initiatives achievability sensitivity analysis; all other fi eg flu erct es darta from the December 2025 LRP provided to Moelis on 12/1 /2025; Implied Enterprise Value and Price Per Share include separate NPV analysis of Elegant’s tax attributes he to Com valupea tny’s portion (15%) of savings from the utilization of tax attributes Content must not 1. Unburdened by Stock-Based Compensation, consistent with Management’s presentation of Adjusted EBITDA 2. Reflects cash tax distribution to OpCo; calculated as 19.73% of Adjusted EBIT multiplied by the spread between the 56.00% OpCo reimbursement tax rate and the 25.79% PubCo tax rate per go below this line the Company’s tax advisor TRA Suppo - rDec t 2025 Financials provided to Moelis on 12/23/2025 Confidential | 43 3. Change in Net Working Capital excludes impacts from Deferred Tax Assets given tax attributes were valued separately 4. Assumes Q4 2025 debt balance of $375mm and cash balance of $78mm (including estimated Q4 2025 PubCo cash balance of $36mm) per the Management Proposed LRP (50% Achievability) WACC WACC WACC
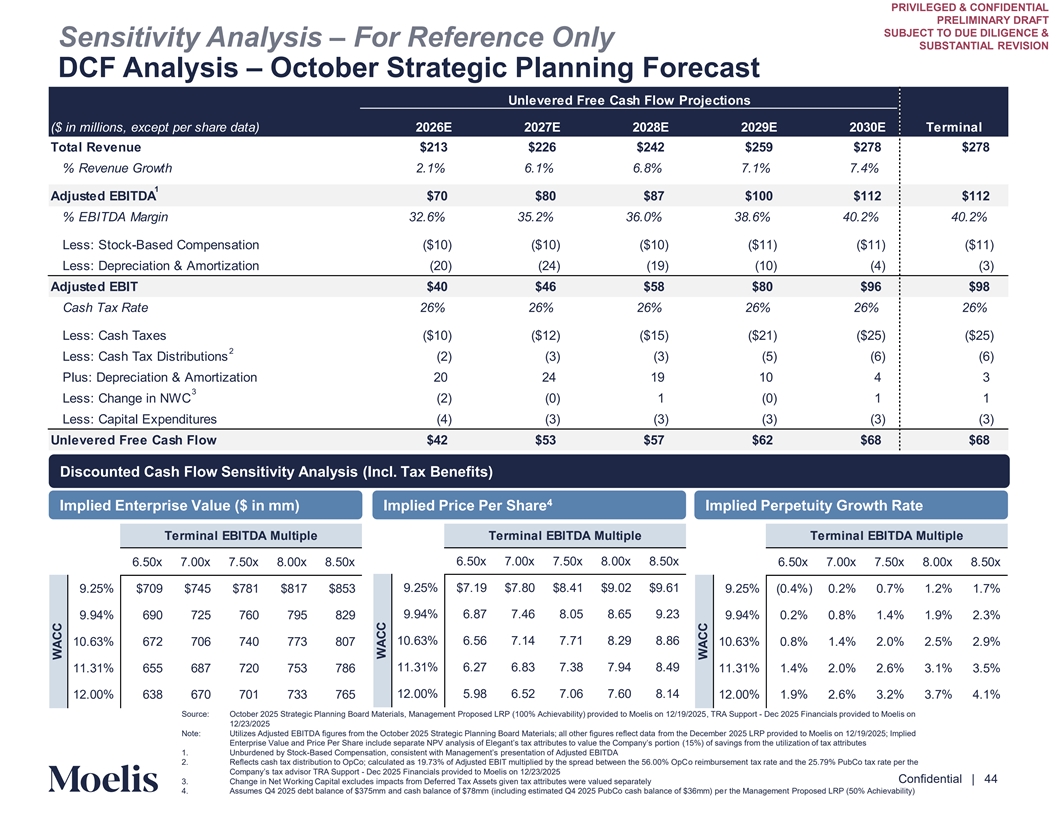
PRIVILEGED & CONFIDENTIAL PRELIMINARY DRAFT SUBJECT TO DUE DILIGENCE & Sensitivity Analysis – For Reference Only SUBSTANTIAL REVISION DCF Analysis – October Strategic Planning Forecast Unlevered Free Cash Flow Projections ($ in millions, except per share data) 2026E 2027E 2028E 2029E 2030E Terminal Total Revenue $213 $226 $242 $259 $278 $278 % Revenue Growth 2.1% 6.1% 6.8% 7.1% 7.4% 1 Adjusted EBITDA $70 $80 $87 $100 $112 $112 % EBITDA Margin 32.6% 35.2% 36.0% 38.6% 40.2% 40.2% Less: Stock-Based Compensation ($10) ($10) ($10) ($11) ($11) ($11) Less: Depreciation & Amortization (20) (24) (19) (10) (4) (3) Adjusted EBIT $40 $46 $58 $80 $96 $98 Cash Tax Rate 26% 26% 26% 26% 26% 26% Less: Cash Taxes ($10) ($12) ($15) ($21) ($25) ($25) 2 Less: Cash Tax Distributions (2) (3) (3) (5) (6) (6) Plus: Depreciation & Amortization 20 24 19 10 4 3 3 Less: Change in NWC (2) (0) 1 (0) 1 1 Less: Capital Expenditures (4) (3) (3) (3) (3) (3) Unlevered Free Cash Flow $42 $53 $57 $62 $68 $68 Discounted Cash Flow Sensitivity Analysis (Incl. Tax Benefits) 4 Implied Enterprise Value ($ in mm) Implied Price Per Share Implied Perpetuity Growth Rate Terminal EBITDA Multiple Terminal EBITDA Multiple Terminal EBITDA Multiple 6.50x 7.00x 7.50x 8.00x 8.50x 6.50x 7.00x 7.50x 8.00x 8.50x 6.50x 7.00x 7.50x 8.00x 8.50x 9.25% $7.19 $7.80 $8.41 $9.02 $9.61 9.25% $709 $745 $781 $817 $853 9.25% (0.4%) 0.2% 0.7% 1.2% 1.7% 9.94% 6.87 7.46 8.05 8.65 9.23 9.94% 690 725 760 795 829 9.94% 0.2% 0.8% 1.4% 1.9% 2.3% 10.63% 6.56 7.14 7.71 8.29 8.86 10.63% 672 706 740 773 807 10.63% 0.8% 1.4% 2.0% 2.5% 2.9% 11.31% 655 687 720 753 786 11.31% 6.27 6.83 7.38 7.94 8.49 11.31% 1.4% 2.0% 2.6% 3.1% 3.5% 12.00% 638 670 701 733 765 12.00% 5.98 6.52 7.06 7.60 8.14 12.00% 1.9% 2.6% 3.2% 3.7% 4.1% Source: October 2025 Strategic Planning Board Materials, Management Proposed LRP (100% Achievability) provided to Moelis on 12/19/2025, TRA Support - Dec 2025 Financials provided to Moelis on 12/23/2025 Note: Utilizes Adjusted EBITDA figures from the October 2025 Strategic Planning Board Materials; all other figures reflect data from the December 2025 LRP provided to Moelis on 12/19/2025; Implied Enterprise Value and Price Per Share include separate NPV analysis of Elegant’s tax attributes to value the Compan y’s (15% po ) o rtif osa n vings from the utilization of tax attributes Content must not 1. Unburdened by Stock-Based Compensation, consistent with Management’s presentation of Adjusted EBITDA 2. Reflects cash tax distribution to OpCo; calculated as 19.73% of Adjusted EBIT multiplied by the spread between the 56.00% OpCo reimbursement tax rate and the 25.79% PubCo tax rate per the go below this line Company’s tax advisor TRA Suppo-r t Dec 2025 Financials provided to Moelis on 12/23/2025 Confidential | 44 3. Change in Net Working Capital excludes impacts from Deferred Tax Assets given tax attributes were valued separately 4. Assumes Q4 2025 debt balance of $375mm and cash balance of $78mm (including estimated Q4 2025 PubCo cash balance of $36mm) per the Management Proposed LRP (50% Achievability) WACC WACC WACC

PRIVILEGED & CONFIDENTIAL PRELIMINARY DRAFT SUBJECT TO DUE DILIGENCE & SUBSTANTIAL REVISION G. Summary of Management Financial Projections Content must not go below this line Confidential | 45
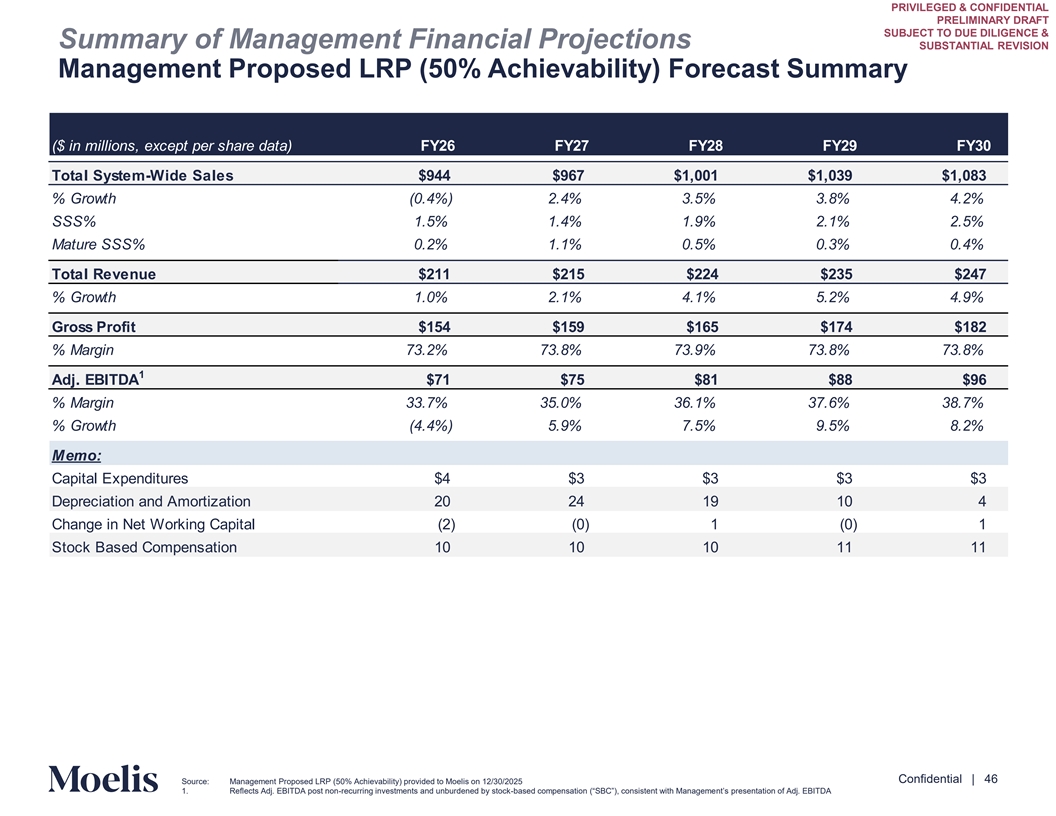
PRIVILEGED & CONFIDENTIAL PRELIMINARY DRAFT SUBJECT TO DUE DILIGENCE & Summary of Management Financial Projections SUBSTANTIAL REVISION Management Proposed LRP (50% Achievability) Forecast Summary ($ in millions, except per share data) FY26 FY27 FY28 FY29 FY30 Total System-Wide Sales $944 $967 $1,001 $1,039 $1,083 % Growth (0.4%) 2.4% 3.5% 3.8% 4.2% SSS% 1.5% 1.4% 1.9% 2.1% 2.5% Mature SSS% 0.2% 1.1% 0.5% 0.3% 0.4% Total Revenue $211 $215 $224 $235 $247 % Growth 1.0% 2.1% 4.1% 5.2% 4.9% Gross Profit $154 $159 $165 $174 $182 % Margin 73.2% 73.8% 73.9% 73.8% 73.8% 1 Adj. EBITDA $71 $75 $81 $88 $96 % Margin 33.7% 35.0% 36.1% 37.6% 38.7% % Growth (4.4%) 5.9% 7.5% 9.5% 8.2% Memo: Capital Expenditures $4 $3 $3 $3 $3 Depreciation and Amortization 20 24 19 10 4 Change in Net Working Capital (2) (0) 1 (0) 1 Stock Based Compensation 10 10 10 11 11 Content must not go below this line Confidential | 46 Source: Management Proposed LRP (50% Achievability) provided to Moelis on 12/30/2025 1. Reflects Adj. EBITDA post non-recurring investments and unburdened by stock-based compensation (“SBC”), consistent with Managem nt’s e presentation of Adj. EBITDA

PRIVILEGED & CONFIDENTIAL PRELIMINARY DRAFT SUBJECT TO DUE DILIGENCE & Summary of Management Financial Projections SUBSTANTIAL REVISION Management Proposed LRP (100% Achievability) Forecast Summary ($ in millions, except per share data) FY26 FY27 FY28 FY29 FY30 Total System-Wide Sales $964 $1,017 $1,074 $1,139 $1,211 % Growth 1.7% 5.6% 5.6% 6.1% 6.3% SSS% 3.6% 4.5% 3.9% 4.3% 4.6% Mature SSS% 2.3% 4.2% 2.5% 2.5% 2.5% Total Revenue $215 $226 $240 $258 $276 % Growth 3.4% 5.1% 5.9% 7.7% 7.0% Gross Profit $158 $167 $177 $190 $204 % Margin 73.2% 73.8% 73.9% 73.7% 73.8% 1 Adj. EBITDA $72 $79 $87 $97 $107 % Margin 33.6% 34.9% 36.2% 37.6% 38.7% % Growth (2.4%) 9.1% 9.7% 11.8% 10.3% Memo: Capital Expenditures $4 $3 $3 $3 $3 Depreciation and Amortization 20 24 19 10 4 Change in Net Working Capital (2) (0) 1 (0) 1 Stock Based Compensation 10 10 10 11 11 Content must not go below this line Confidential | 47 Source: Management Proposed LRP (100% Achievability) provided to Moelis on 12/19/2025 1. Reflects Adj. EBITDA post non-recurring investments and unburdened by stock-based compensation (“SBC”), consistent with Managem nt’s e presentation of Adj. EBITDA

PRIVILEGED & CONFIDENTIAL PRELIMINARY DRAFT SUBJECT TO DUE DILIGENCE & SUBSTANTIAL REVISION H. Additional Elegant Information Content must not go below this line Confidential | 48
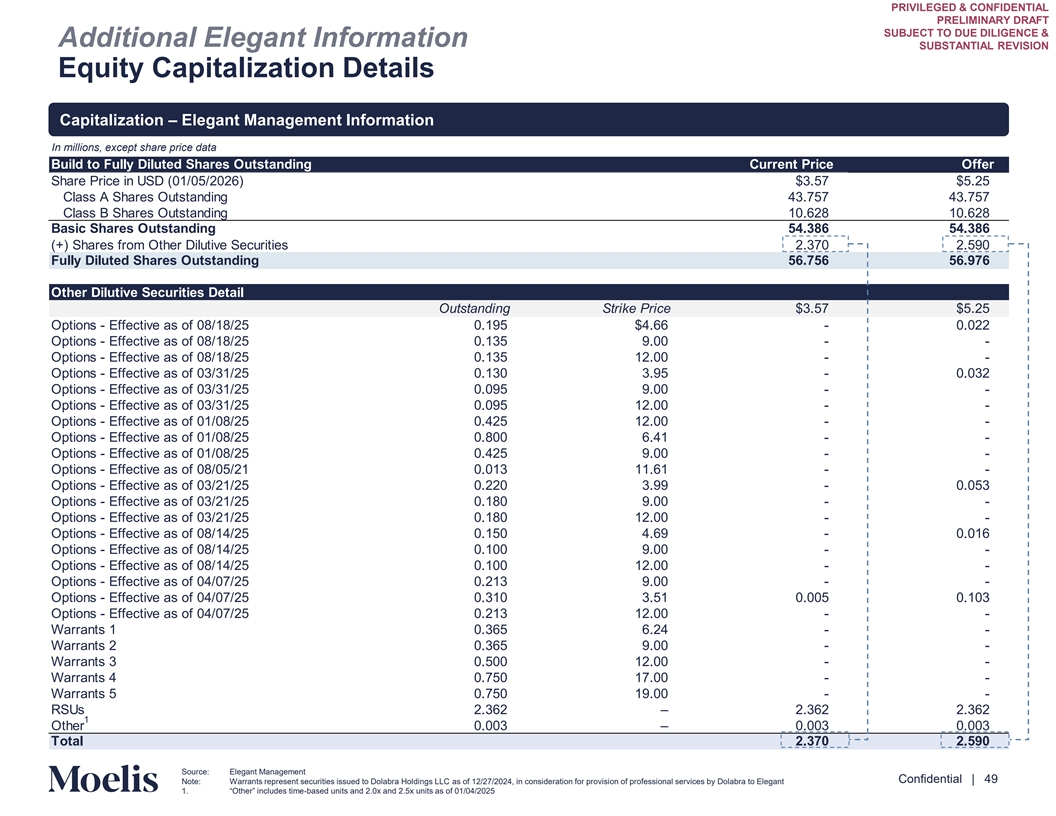
PRIVILEGED & CONFIDENTIAL PRELIMINARY DRAFT SUBJECT TO DUE DILIGENCE & Additional Elegant Information SUBSTANTIAL REVISION Equity Capitalization Details Capitalization – Elegant Management Information In millions, except share price data Build to Fully Diluted Shares Outstanding Current Price Offer Share Price in USD (01/05/2026) $3.57 $5.25 Class A Shares Outstanding 43.757 43.757 Class B Shares Outstanding 10.628 10.628 Basic Shares Outstanding 54.386 54.386 (+) Shares from Other Dilutive Securities 2.370 2.590 Fully Diluted Shares Outstanding 56.756 56.976 Other Dilutive Securities Detail Outstanding Strike Price $3.57 $5.25 Options - Effective as of 08/18/25 0.195 $4.66 - 0.022 Options - Effective as of 08/18/25 0.135 9.00 - - Options - Effective as of 08/18/25 0.135 12.00 - - Options - Effective as of 03/31/25 0.130 3.95 - 0.032 Options - Effective as of 03/31/25 0.095 9.00 - - Options - Effective as of 03/31/25 0.095 12.00 - - Options - Effective as of 01/08/25 0.425 12.00 - - Options - Effective as of 01/08/25 0.800 6.41 - - Options - Effective as of 01/08/25 0.425 9.00 - - Options - Effective as of 08/05/21 0.013 11.61 - - Options - Effective as of 03/21/25 0.220 3.99 - 0.053 Options - Effective as of 03/21/25 0.180 9.00 - - Options - Effective as of 03/21/25 0.180 12.00 - - Options - Effective as of 08/14/25 0.150 4.69 - 0.016 Options - Effective as of 08/14/25 0.100 9.00 - - Options - Effective as of 08/14/25 0.100 12.00 - - Options - Effective as of 04/07/25 0.213 9.00 - - Options - Effective as of 04/07/25 0.310 3.51 0.005 0.103 Options - Effective as of 04/07/25 0.213 12.00 - - Warrants 1 0.365 6.24 - - Warrants 2 0.365 9.00 - - Warrants 3 0.500 12.00 - - Warrants 4 0.750 17.00 - - Warrants 5 0.750 19.00 - - RSUs 2.362 – 2.362 2.362 1 Other 0.003 – 0.003 0.003 Total 2.370 2.590 Content must not go below this line Source: Elegant Management Confidential | 49 Note: Warrants represent securities issued to Dolabra Holdings LLC as of 12/27/2024, in consideration for provision of professional services by Dolabra to Elegant 1. “Other” includes time -based units and 2.0x and 2.5x units as of 01/04/2025
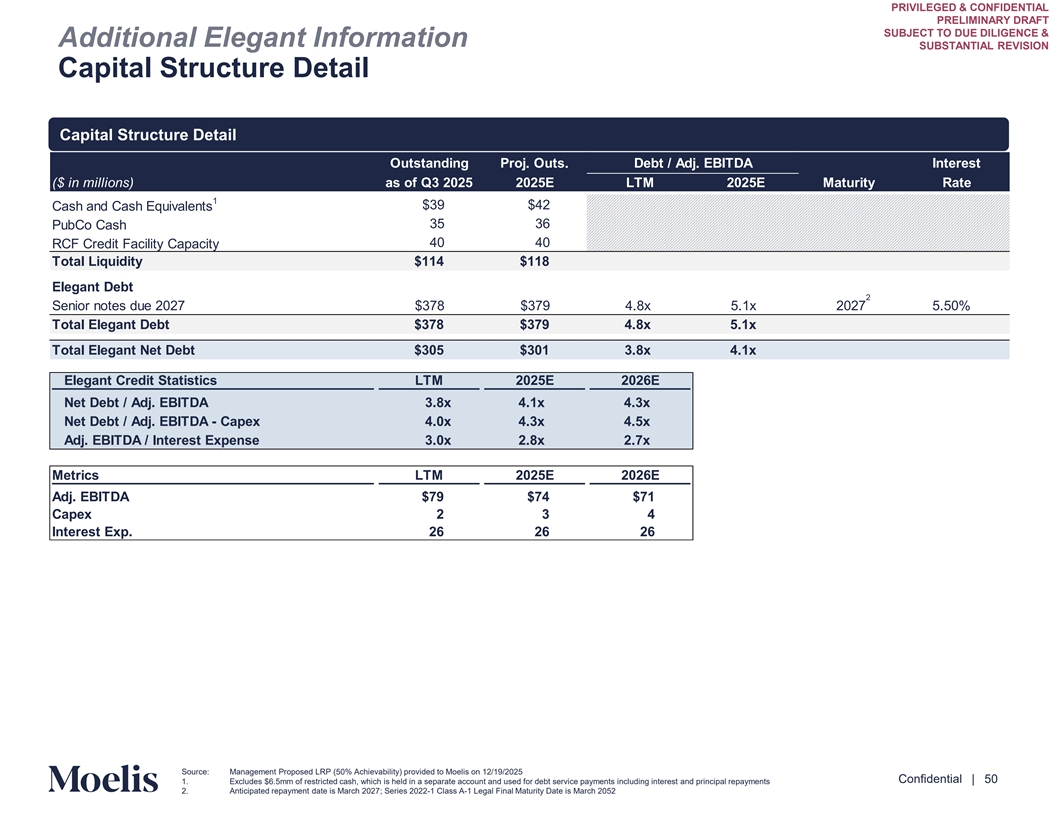
PRIVILEGED & CONFIDENTIAL PRELIMINARY DRAFT SUBJECT TO DUE DILIGENCE & Additional Elegant Information SUBSTANTIAL REVISION Capital Structure Detail Capital Structure Detail Outstanding Proj. Outs. Debt / Adj. EBITDA Interest ($ in millions) as of Q3 2025 2025E LTM 2025E Maturity Rate 1 $39 $42 Cash and Cash Equivalents 35 36 PubCo Cash 40 40 RCF Credit Facility Capacity Total Liquidity $114 $118 Elegant Debt 2 Senior notes due 2027 $378 $379 4.8x 5.1x 2027 5.50% Total Elegant Debt $378 $379 4.8x 5.1x Total Elegant Net Debt $305 $301 3.8x 4.1x Elegant Credit Statistics LTM 2025E 2026E Net Debt / Adj. EBITDA 3.8x 4.1x 4.3x Net Debt / Adj. EBITDA - Capex 4.0x 4.3x 4.5x Adj. EBITDA / Interest Expense 3.0x 2.8x 2.7x Metrics LTM 2025E 2026E Adj. EBITDA $79 $74 $71 Capex 2 3 4 Interest Exp. 26 26 26 Content must not go below this line Source: Management Proposed LRP (50% Achievability) provided to Moelis on 12/19/2025 Confidential | 50 1. Excludes $6.5mm of restricted cash, which is held in a separate account and used for debt service payments including interest and principal repayments 2. Anticipated repayment date is March 2027; Series 2022-1 Class A-1 Legal Final Maturity Date is March 2052
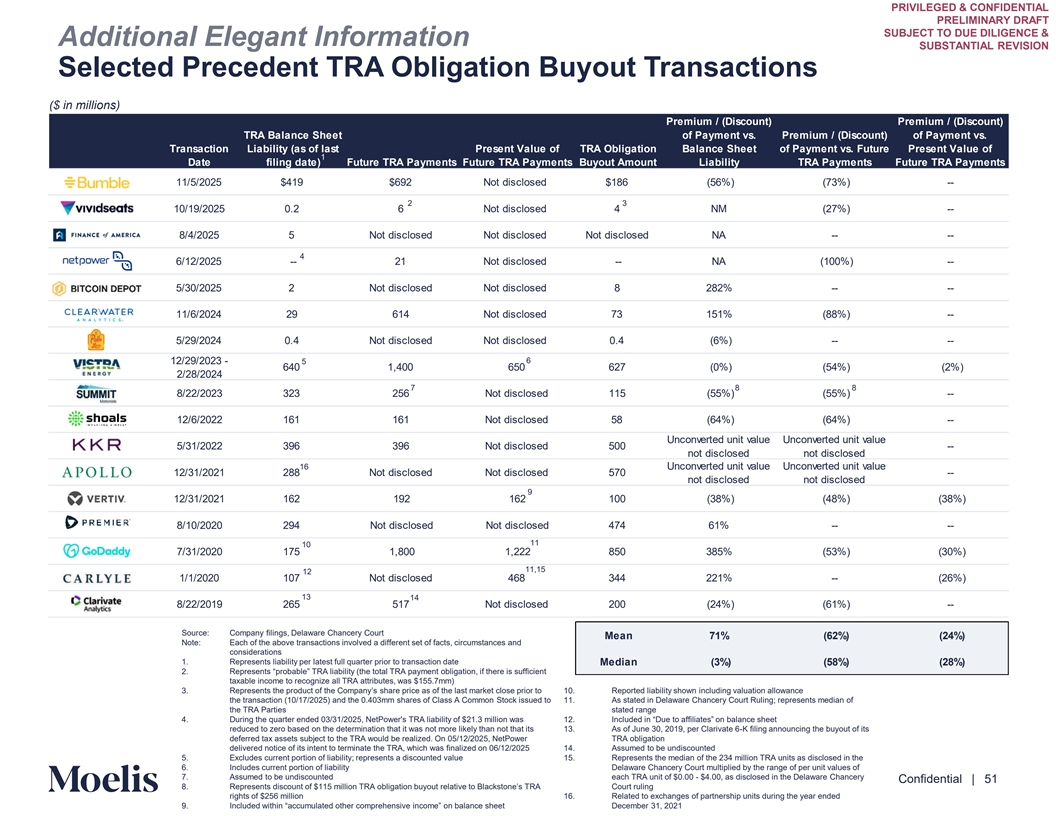
PRIVILEGED & CONFIDENTIAL PRELIMINARY DRAFT SUBJECT TO DUE DILIGENCE & Additional Elegant Information SUBSTANTIAL REVISION Selected Precedent TRA Obligation Buyout Transactions ($ in millions) Premium / (Discount) Premium / (Discount) TRA Balance Sheet of Payment vs. Premium / (Discount) of Payment vs. Transaction Liability (as of last Present Value of TRA Obligation Balance Sheet of Payment vs. Future Present Value of 1 Company Date filing date) Future TRA Payments Future TRA Payments Buyout Amount Liability TRA Payments Future TRA Payments 11/5/2025 $419 $692 Not disclosed $186 (56%) (73%) -- 2 3 10/19/2025 0.2 6 Not disclosed 4 NM (27%) -- 8/4/2025 5 Not disclosed Not disclosed Not disclosed NA -- -- 4 6/12/2025 -- 21 Not disclosed -- NA (100%) -- 5/30/2025 2 Not disclosed Not disclosed 8 282% -- -- 11/6/2024 29 614 Not disclosed 73 151% (88%) -- 5/29/2024 0.4 Not disclosed Not disclosed 0.4 (6%) -- -- 12/29/2023 - 5 6 640 1,400 650 627 (0%) (54%) (2%) 2/28/2024 7 8 8 8/22/2023 323 256 Not disclosed 115 (55%) (55%) -- 12/6/2022 161 161 Not disclosed 58 (64%) (64%) -- Unconverted unit value Unconverted unit value 5/31/2022 396 396 Not disclosed 500 -- not disclosed not disclosed 16 Unconverted unit value Unconverted unit value 12/31/2021 288 Not disclosed Not disclosed 570 -- not disclosed not disclosed 9 12/31/2021 162 192 162 100 (38%) (48%) (38%) 8/10/2020 294 Not disclosed Not disclosed 474 61% -- -- 11 10 7/31/2020 175 1,800 1,222 850 385% (53%) (30%) 11,15 12 1/1/2020 107 Not disclosed 468 344 221% -- (26%) 13 14 8/22/2019 265 517 Not disclosed 200 (24%) (61%) -- Source: Company filings, Delaware Chancery Court Mean 71% (62%) (24%) Note: Each of the above transactions involved a different set of facts, circumstances and considerations 1. Represents liability per latest full quarter prior to transaction date Median (3%) (58%) (28%) 2. Represents “probable” TRA liability (the total TRA payment obligation, if there is sufficient taxable income to recognize all TRA attributes, was $155.7mm) 3. Represents the product of the Company’s share price as of the last market close prior10. to Reported liability shown including valuation allowance the transaction (10/17/2025) and the 0.403mm shares of Class A Common Stock issued to 11. As stated in Delaware Chancery Court Ruling; represents median of the TRA Parties stated range 4. During the quarter ended 03/31/2025, NetPower's TRA liability of $21.3 million was 12. Included in “Due to affiliates” on balance sheet reduced to zero based on the determination that it was not more likely than not that its 13. As of June 30, 2019, per Clarivate 6-K filing announcing the buyout of its deferred tax assets subject to the TRA would be realized. On 05/12/2025, NetPower TRA obligation delivered notice of its intent to terminate the TRA, which was finalized on 06/12/2025 14. Assumed to be undiscounted Content must not 5. Excludes current portion of liability; represents a discounted value 15. Represents the median of the 234 million TRA units as disclosed in the 6. Includes current portion of liability Delaware Chancery Court multiplied by the range of per unit values of go below this line 7. Assumed to be undiscounted each TRA unit of $0.00 - $4.00, as disclosed in the Delaware Chancery Confidential | 51 8. Represents discount of 115 million TRA obligation buyout relative to Blackstone’s TRA Court ruling rights of $256 million 16. Related to exchanges of partnership units during the year ended 9. Included within “accumulated other comprehensive income” on balance sheet December 31, 2021
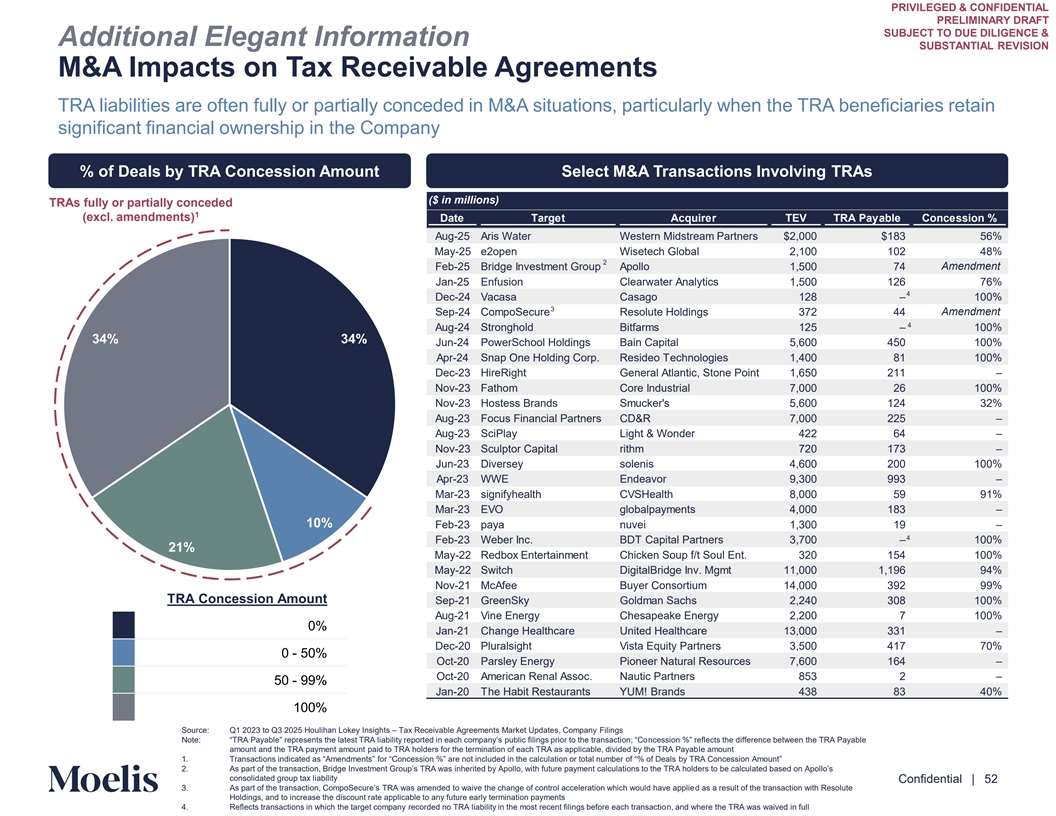
PRIVILEGED & CONFIDENTIAL PRELIMINARY DRAFT SUBJECT TO DUE DILIGENCE & Additional Elegant Information SUBSTANTIAL REVISION M&A Impacts on Tax Receivable Agreements TRA liabilities are often fully or partially conceded in M&A situations, particularly when the TRA beneficiaries retain significant financial ownership in the Company % of Deals by TRA Concession Amount Select M&A Transactions Involving TRAs ($ in millions) TRAs fully or partially conceded 1 (excl. amendments) Date Target Acquirer TEV TRA Payable Concession % Aug-25 Aris Water Western Midstream Partners $2,000 $183 56% May-25 e2open Wisetech Global 2,100 102 48% 2 Amendment Feb-25 Bridge Investment Group Apollo 1,500 74 Jan-25 Enfusion Clearwater Analytics 1,500 126 76% 4 Dec-24 Vacasa Casago 128 – 100% 3 Sep-24 CompoSecure Resolute Holdings 372 44 Amendment 4 Aug-24 Stronghold Bitfarms 125 – 100% 34% 34% Jun-24 PowerSchool Holdings Bain Capital 5,600 450 100% Apr-24 Snap One Holding Corp. Resideo Technologies 1,400 81 100% Dec-23 HireRight General Atlantic, Stone Point 1,650 211 – Nov-23 Fathom Core Industrial 7,000 26 100% Nov-23 Hostess Brands Smucker's 5,600 124 32% Aug-23 Focus Financial Partners CD&R 7,000 225 – Aug-23 SciPlay Light & Wonder 422 64 – Nov-23 Sculptor Capital rithm 720 173 – Jun-23 Diversey solenis 4,600 200 100% Apr-23 WWE Endeavor 9,300 993 – Mar-23 signifyhealth CVSHealth 8,000 59 91% Mar-23 EVO globalpayments 4,000 183 – 10% Feb-23 paya nuvei 1,300 19 – 4 Feb-23 Weber Inc. BDT Capital Partners 3,700 – 100% 21% May-22 Redbox Entertainment Chicken Soup f/t Soul Ent. 320 154 100% May-22 Switch DigitalBridge Inv. Mgmt 11,000 1,196 94% Nov-21 McAfee Buyer Consortium 14,000 392 99% TRA Concession Amount Sep-21 GreenSky Goldman Sachs 2,240 308 100% Aug-21 Vine Energy Chesapeake Energy 2,200 7 100% 0% Jan-21 Change Healthcare United Healthcare 13,000 331 – Dec-20 Pluralsight Vista Equity Partners 3,500 417 70% 0 - 50% Oct-20 Parsley Energy Pioneer Natural Resources 7,600 164 – Oct-20 American Renal Assoc. Nautic Partners 853 2 – 50 - 99% Jan-20 The Habit Restaurants YUM! Brands 438 83 40% 100% Source: Q1 2023 to Q3 2025 Houlihan Lokey Insights – Tax Receivable Agreements Market Updates, Company Filings Note: “TRA Payable” represents the latest TRA liability reported in each company’s public filings prior to the transancticeossi n; o“Co n %” reflects the difference between the TRA Payable amount and the TRA payment amount paid to TRA holders for the termination of each TRA as applicable, divided by the TRA Payable amount Content must not 1. Transactions indicated as “Amendments” for “Concession %” are not included in the calculation or total number of “% b o y Tf RA Dea Con ls cession Amount” go below this line 2. As part of the transaction, Bridge Investment Group’s TRA was inherited by Apollo, with future payment calculations Ato h oth ldee T rs Rto be calculated based on Apollo’s consolidated group tax liability Confidential | 52 3. As part of the transaction, CompoSecure’s TRA was amended to waive the change of control acceleration which would h da ave s a a rp ep su lielt of the transaction with Resolute Holdings, and to increase the discount rate applicable to any future early termination payments 4. Reflects transactions in which the target company recorded no TRA liability in the most recent filings before each transaction, and where the TRA was waived in full
PRIVILEGED & CONFIDENTIAL PRELIMINARY DRAFT SUBJECT TO DUE DILIGENCE & SUBSTANTIAL REVISION Disclaimer This presentation has been prepared by Moelis & Company LLC (“Moelis”) solely for the information and assistance of al tC he omm Spe ittci ee of the Board of Directors of the company codenamed “Elegant” (the “Company”) in considering the matters referred to in t erihe als. se Thi ms at presentation is confidential and may not be disclosed (in whole or in part) or utilized for other purposes without the express prior written consent of Moelis. This presentation has been prepared based on information provided by the Company and/or from third party sources. Moelis assumed such information is complete and accurate in all material respects. Moelis has not independently verified such information (or assumed responsibility for the independent verification of such information). To the extent this presentation includes projections, forecasts or other forward-looking statements, Moelis has assumed that such information was reasonably prepared based on the best currently available estimates and judgments of the Company and/or other parties as to the future performance of the Company and/or such other parties. Moelis expresses no views as to the reasonableness of any such projections, forecasts or other forward-looking statements or the assumptions on which they are based. Moelis has not made any independent evaluation or appraisal of any of the assets or liabilities (contingent, derivative, off-balance-sheet, or otherwise) of the Company or any other party. Moelis’ participation in any due diligence review is solely for purposes of supdv poir ce ting an id ts anaalysis. This presentation is based on economic, monetary, market and other conditions as in effect on, and the information made available to us as of, the date hereof, and Moelis assumes no obligation to update this presentation or correct any information herein. No company or transaction used in this presentation is identical to the Company or any potential transaction. The analyses set forth in this presentation do not purport to be appraisals and such analyses do not reflect Moelis’ views of the prices at which businesses or securities actually d. may Beca beuse sol the analyses described in these materials (including the information used in such analyses) are inherently subject to uncertainty, Moelis does not assume responsibility if future results are materially different from those forecast. This presentation was designed for use by certain persons familiar with the business of the Company. This presentation is not intended to provide the sole basis for any decision on any transaction or strategic alternative and is not a recommendation with respect to any transaction or strategic alternative. This presentation does not address the Special Committee’s underlying business decision to ex repl comm ore or end any transaction or strategic alternative or the relative merits of any transaction or strategic alternative as compared to any alternative business strategies or transactions that might be available to the Company. Nothing contained in this presentation should be construed as legal, regulatory, tax or accounting advice. Moelis and its affiliates are engaged globally in a wide range of investment banking and other activities for their own account and otherwise. Moelis and its affiliates may have advised, may seek to advise and may in the future advise in companies referred to in this presentation. Personnel of Moelis or such affiliates may make statements or provide advice that is contrary to information included in this presentation. The proprietary interests of Moelis or its affiliates may conflict with your interests. In addition, Moelis and its affiliates and their personnel may from time to time have positions in or effect transactions in securities referred to in this material (or derivatives of such securities), or serve as a director of companies referred to in this presentation. Content must not go below this line Confidential | 53