
Exhibit (c)(v) PRIVILEGED & CONFIDENTIAL PRELIMINARY DRAFT SUBJECT TO DUE DILIGENCE & SUBSTANTIAL REVISION Project Elegant Discussion Materials January 27, 2026 Content must not go below this line
PRIVILEGED & CONFIDENTIAL PRELIMINARY DRAFT SUBJECT TO DUE DILIGENCE & SUBSTANTIAL REVISION Executive Summary • In October 2025, Elegant’s management presented two sets of materials to Elegant’s Board of Directors: o One was an ordinary course quarterly presentation prepared for and presented to Elegant’s Board of Directors with key updates on recent performance o The second was a separate presentation outlining Elegant’s strategic plan (the “October 2025 Strategic Planning Materials”), which included an overview of Elegant management’s then-current views on the strategic landscape, value creation goals and strategic priorities • The October 2025 Strategic Planning materials included a preliminary financial forecast through FY ’30E, which was reviewed but not approved by Elegant’s Board of Directors o The preliminary financial forecast included the impact of potential strategic initiatives which management planned to deploy across its franchise network to strengthen Elegant’s financial performance and create value for shareholders • The October 2025 Strategic Planning Materials included two analyses that showed potential value creation for shareholders as a result of strategic initiatives o The first analysis (the “Future Share Price Analysis”) presented an illustrative path to a ~$15 per-share price, which was predicated on Elegant achieving certain organic growth targets for net NCO growth, same-store sales growth, adj. EBITDA margin, and adj. EBITDA multiple by 2028E o The second analysis (the “M&A Center Analysis”) presented potential value creation for shareholders via corporate center acquisitions • Since presenting the October 2025 Strategic Planning Materials, Management has continued to review and refine its financial forecast including the strategic initiatives, and, after assessing the execution risk associated with the achievability of the strategic initiatives presented in the October 2025 Strategic Planning Materials, shared a revised view on the forecast in December in the form of the Management Proposed LRP (100% Achievability), which was presented to the th Special Committee on December 18 . The Management Proposed LRP (100% Achievability) included downwardly revised sales and EBITDA estimates in certain years of the forecast period amid implementation of the strategic initiatives (the “LRP Initiatives”) rd • During a subsequent meeting on December 23 , after noting that the Management Proposed LRP (100% Achievability) assumed management would be able to successfully achieve the LRP Initiatives and execute on a series of initiatives on a timely basis, the Special Committee requested that management prepare various scenarios on the achievement of the LRP Initiatives, including a scenario in which the Company achieved 50% of the LRP Initiatives (the “Management Proposed LRP (50% Achievability)”) th • On January 6 , Moelis reviewed these scenarios provided by management with the Special Committee. The Special Committee directed Moelis to use the Management Proposed LRP (50% Achievability) in conducting its analysis of General Atlantic’s proposal to acquired all of the outstanding shares of Class A Common Stock and all of the outstanding common units of Elegant Ventures, LLC not held by General Atlantic or Elegant • In order to assist the Special Committee as it considers a potential sale and to support it in negotiations with General Atlantic, Moelis has reviewed the above referenced value creation analyses from the October 2025 Strategic Planning Materials o The Future Share Price Analysis assumes a successful implementation of strategic initiatives across a national franchisee base that Elegant does not directly control, including the re-ignition of mature Same-Store Sales (“SSS”) growth well in excess of what the Company has achieved in recent years and the continued expansion in the number of centers despite the fact that 20% of the company’s centers are at risk of closure and lenders have expressed hesitancy to lend to Elegant franchisees for new locations o The Future Share Price Analysis also assumes that the Company’s EBITDA multiple increases by more than 90%, from ~7.0x to 13.5x o The M&A Center Analysis assumes the Company is able to successfully acquire and operate franchise locations (which, per management, it struggles to do today; only 5 of the Company's approximately 1,000 centers are currently Company operated). Furthermore, General Atlantic has expressed hesitancy in pursuing M&A, preferring to focus on organic growth opportunities o Should management successfully implement the strategic initiatives included in the LRP, there is potential for meaningful value creation and future multiple expansion; however, it is unclear if management will be able to achieve the targets necessary to deliver the outcomes identified in the value creation analyses Content must not go below this line Confidential | 1 Source: October 2025 Strategic Planning Materials, Management Proposed LRP (50% Achievability) provided to Moelis on 12/30/2025, Management Proposed LRP (100% Achievability) provided to Moelis on 12/19/2025
PRIVILEGED & CONFIDENTIAL PRELIMINARY DRAFT SUBJECT TO DUE DILIGENCE & SUBSTANTIAL REVISION 1. Management's Future Share Price Analysis (October 2025) Content must not go below this line Confidential | 2
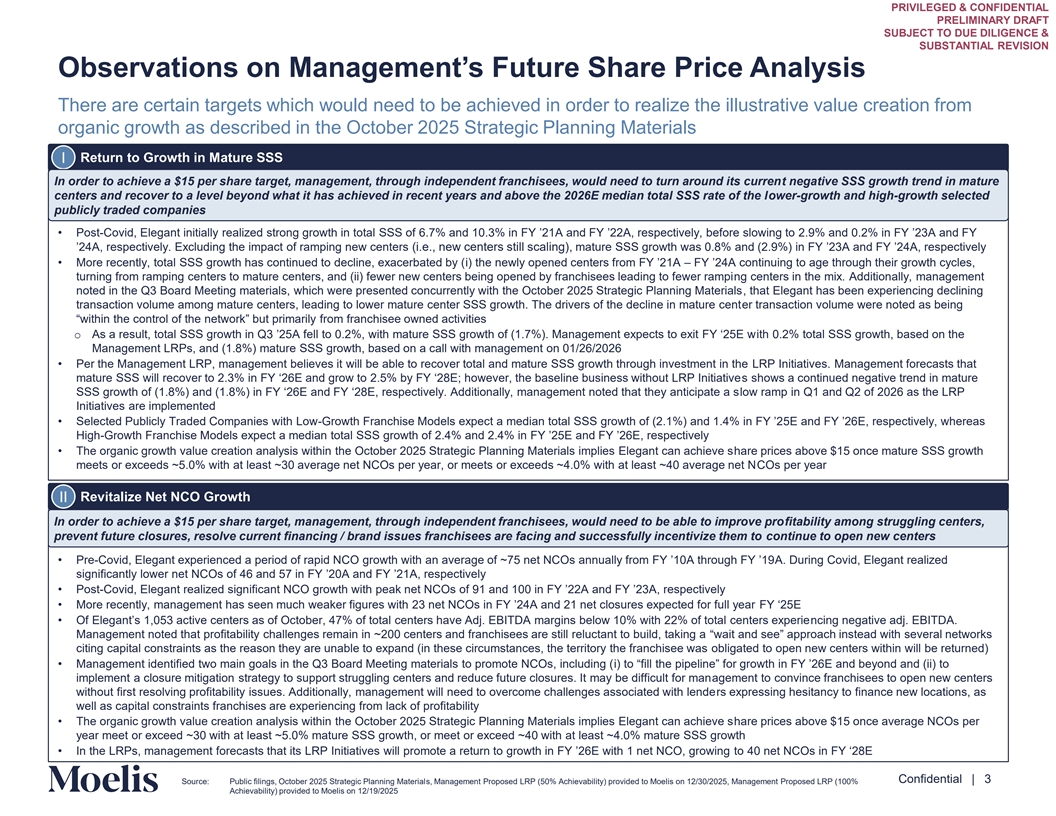
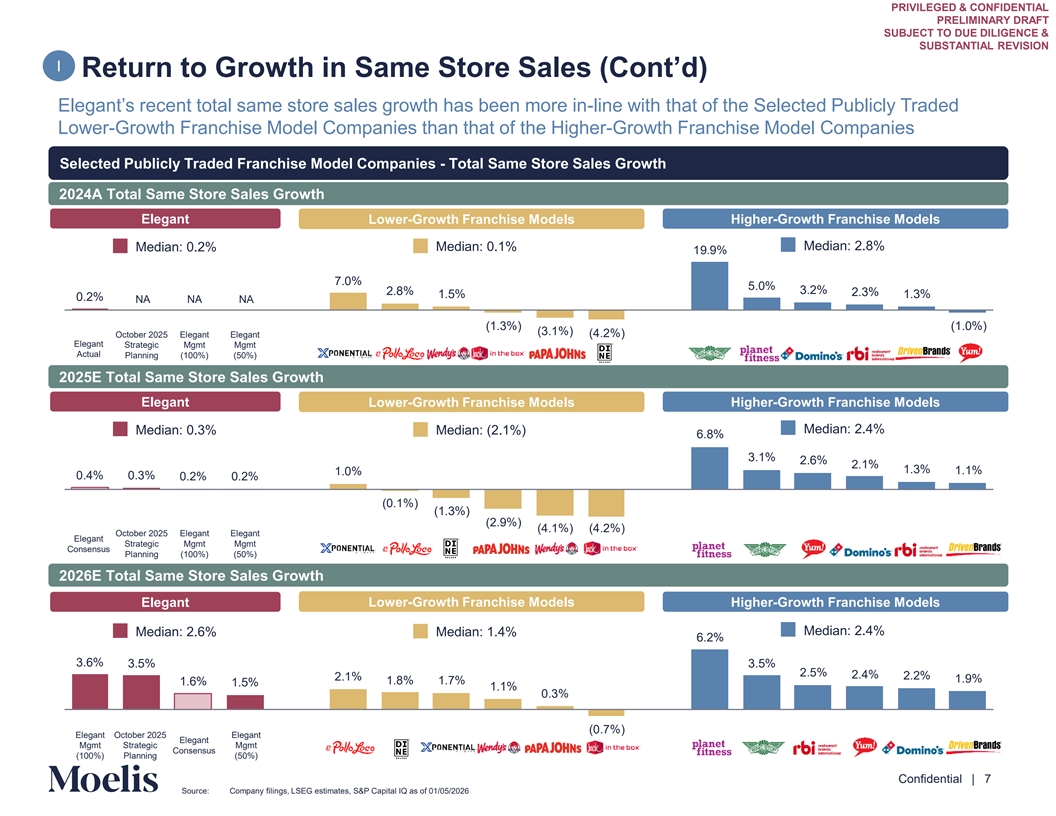
PRIVILEGED & CONFIDENTIAL PRELIMINARY DRAFT SUBJECT TO DUE DILIGENCE & SUBSTANTIAL REVISION Observations on Management’s Future Share Price Analysis There are certain targets which would need to be achieved in order to realize the illustrative value creation from organic growth as described in the October 2025 Strategic Planning Materials I Return to Growth in Mature SSS In order to achieve a $15 per share target, management, through independent franchisees, would need to turn around its current negative SSS growth trend in mature centers and recover to a level beyond what it has achieved in recent years and above the 2026E median total SSS rate of the lower-growth and high-growth selected publicly traded companies • Post-Covid, Elegant initially realized strong growth in total SSS of 6.7% and 10.3% in FY ’21A and FY ’22A, respectively, before slowing to 2.9% and 0.2% in FY ’23A and FY ’24A, respectively. Excluding the impact of ramping new centers (i.e., new centers still scaling), mature SSS growth was 0.8% and (2.9%) in FY ’23A and FY ’24A, respectively • More recently, total SSS growth has continued to decline, exacerbated by (i) the newly opened centers from FY ’21A – FY ’24A continuing to age through their growth cycles, turning from ramping centers to mature centers, and (ii) fewer new centers being opened by franchisees leading to fewer ramping centers in the mix. Additionally, management noted in the Q3 Board Meeting materials, which were presented concurrently with the October 2025 Strategic Planning Materials, that Elegant has been experiencing declining transaction volume among mature centers, leading to lower mature center SSS growth. The drivers of the decline in mature center transaction volume were noted as being “within the control of the network” but primarily from franchisee owned activities o As a result, total SSS growth in Q3 ’25A fell to 0.2%, with mature SSS growth of (1.7%). Management expects to exit FY ‘25E with 0.2% total SSS growth, based on the Management LRPs, and (1.8%) mature SSS growth, based on a call with management on 01/26/2026 • Per the Management LRP, management believes it will be able to recover total and mature SSS growth through investment in the LRP Initiatives. Management forecasts that mature SSS will recover to 2.3% in FY ‘26E and grow to 2.5% by FY ‘28E; however, the baseline business without LRP Initiatives shows a continued negative trend in mature SSS growth of (1.8%) and (1.8%) in FY ‘26E and FY ‘28E, respectively. Additionally, management noted that they anticipate a slow ramp in Q1 and Q2 of 2026 as the LRP Initiatives are implemented • Selected Publicly Traded Companies with Low-Growth Franchise Models expect a median total SSS growth of (2.1%) and 1.4% in FY ’25E and FY ’26E, respectively, whereas High-Growth Franchise Models expect a median total SSS growth of 2.4% and 2.4% in FY ’25E and FY ’26E, respectively • The organic growth value creation analysis within the October 2025 Strategic Planning Materials implies Elegant can achieve share prices above $15 once mature SSS growth meets or exceeds ~5.0% with at least ~30 average net NCOs per year, or meets or exceeds ~4.0% with at least ~40 average net NCOs per year Revitalize Net NCO Growth II In order to achieve a $15 per share target, management, through independent franchisees, would need to be able to improve profitability among struggling centers, prevent future closures, resolve current financing / brand issues franchisees are facing and successfully incentivize them to continue to open new centers • Pre-Covid, Elegant experienced a period of rapid NCO growth with an average of ~75 net NCOs annually from FY ’10A through FY ’19A. During Covid, Elegant realized significantly lower net NCOs of 46 and 57 in FY ’20A and FY ’21A, respectively • Post-Covid, Elegant realized significant NCO growth with peak net NCOs of 91 and 100 in FY ’22A and FY ’23A, respectively • More recently, management has seen much weaker figures with 23 net NCOs in FY ’24A and 21 net closures expected for full year FY ‘25E • Of Elegant’s 1,053 active centers as of October, 47% of total centers have Adj. EBITDA margins below 10% with 22% of total centers experiencing negative adj. EBITDA. Management noted that profitability challenges remain in ~200 centers and franchisees are still reluctant to build, taking a “wait and see” approach instead with several networks citing capital constraints as the reason they are unable to expand (in these circumstances, the territory the franchisee was obligated to open new centers within will be returned) • Management identified two main goals in the Q3 Board Meeting materials to promote NCOs, including (i) to “fill the pipeline” for growth in FY ’26E and beyond and (ii) to implement a closure mitigation strategy to support struggling centers and reduce future closures. It may be difficult for management to convince franchisees to open new centers without first resolving profitability issues. Additionally, management will need to overcome challenges associated with lenders expressing hesitancy to finance new locations, as well as capital constraints franchises are experiencing from lack of profitability • The organic growth value creation analysis within the October 2025 Strategic Planning Materials implies Elegant can achieve share prices above $15 once average NCOs per year meet or exceed ~30 with at least ~5.0% mature SSS growth, or meet or exceed ~40 with at least ~4.0% mature SSS growth • In the LRPs, management forecasts that its LRP Initiatives will promote a return to growth in FY ’26E with 1 net NCO, growing to 40 net NCOs in FY ‘28E Content must not go below this line Confidential | 3 Source: Public filings, October 2025 Strategic Planning Materials, Management Proposed LRP (50% Achievability) provided to Moelis on 12/30/2025, Management Proposed LRP (100% Achievability) provided to Moelis on 12/19/2025
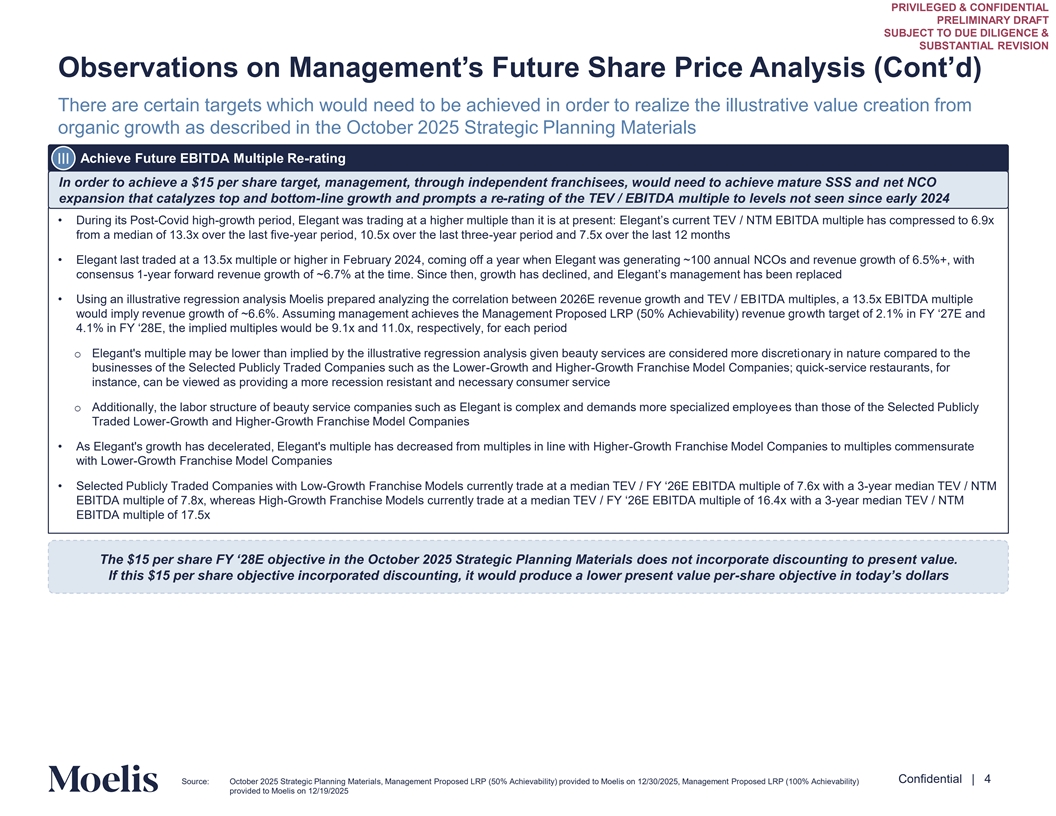
PRIVILEGED & CONFIDENTIAL PRELIMINARY DRAFT SUBJECT TO DUE DILIGENCE & SUBSTANTIAL REVISION Observations on Management’s Future Share Price Analysis (Cont’d) There are certain targets which would need to be achieved in order to realize the illustrative value creation from organic growth as described in the October 2025 Strategic Planning Materials Achieve Future EBITDA Multiple Re-rating III In order to achieve a $15 per share target, management, through independent franchisees, would need to achieve mature SSS and net NCO expansion that catalyzes top and bottom-line growth and prompts a re-rating of the TEV / EBITDA multiple to levels not seen since early 2024 • During its Post-Covid high-growth period, Elegant was trading at a higher multiple than it is at present: Elegant’s current TEV / NTM EBITDA multiple has compressed to 6.9x from a median of 13.3x over the last five-year period, 10.5x over the last three-year period and 7.5x over the last 12 months • Elegant last traded at a 13.5x multiple or higher in February 2024, coming off a year when Elegant was generating ~100 annual NCOs and revenue growth of 6.5%+, with consensus 1-year forward revenue growth of ~6.7% at the time. Since then, growth has declined, and Elegant’s management has been replaced • Using an illustrative regression analysis Moelis prepared analyzing the correlation between 2026E revenue growth and TEV / EBITDA multiples, a 13.5x EBITDA multiple would imply revenue growth of ~6.6%. Assuming management achieves the Management Proposed LRP (50% Achievability) revenue growth target of 2.1% in FY ‘27E and 4.1% in FY ‘28E, the implied multiples would be 9.1x and 11.0x, respectively, for each period o Elegant's multiple may be lower than implied by the illustrative regression analysis given beauty services are considered more discretionary in nature compared to the businesses of the Selected Publicly Traded Companies such as the Lower-Growth and Higher-Growth Franchise Model Companies; quick-service restaurants, for instance, can be viewed as providing a more recession resistant and necessary consumer service o Additionally, the labor structure of beauty service companies such as Elegant is complex and demands more specialized employees than those of the Selected Publicly Traded Lower-Growth and Higher-Growth Franchise Model Companies • As Elegant's growth has decelerated, Elegant's multiple has decreased from multiples in line with Higher-Growth Franchise Model Companies to multiples commensurate with Lower-Growth Franchise Model Companies • Selected Publicly Traded Companies with Low-Growth Franchise Models currently trade at a median TEV / FY ‘26E EBITDA multiple of 7.6x with a 3-year median TEV / NTM EBITDA multiple of 7.8x, whereas High-Growth Franchise Models currently trade at a median TEV / FY ‘26E EBITDA multiple of 16.4x with a 3-year median TEV / NTM EBITDA multiple of 17.5x The $15 per share FY ‘28E objective in the October 2025 Strategic Planning Materials does not incorporate discounting to present value. If this $15 per share objective incorporated discounting, it would produce a lower present value per-share objective in today’s dollars Content must not go below this line Confidential | 4 Source: October 2025 Strategic Planning Materials, Management Proposed LRP (50% Achievability) provided to Moelis on 12/30/2025, Management Proposed LRP (100% Achievability) provided to Moelis on 12/19/2025
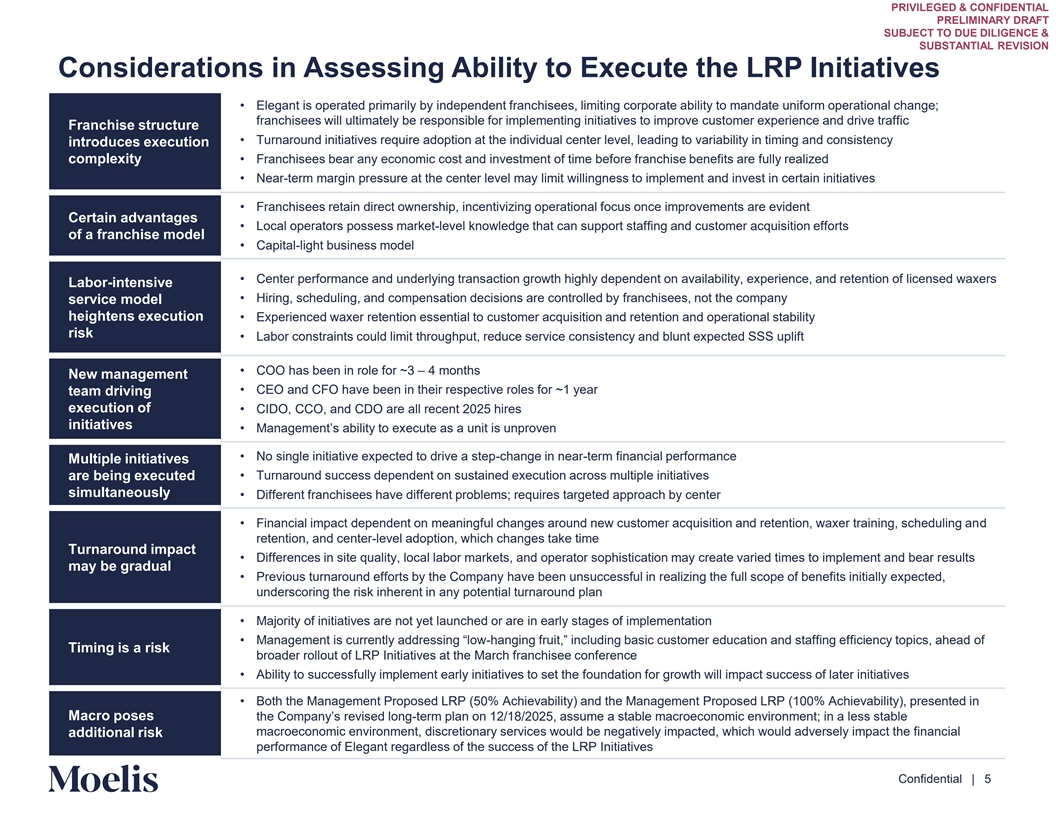
PRIVILEGED & CONFIDENTIAL PRELIMINARY DRAFT SUBJECT TO DUE DILIGENCE & SUBSTANTIAL REVISION Considerations in Assessing Ability to Execute the LRP Initiatives • Elegant is operated primarily by independent franchisees, limiting corporate ability to mandate uniform operational change; franchisees will ultimately be responsible for implementing initiatives to improve customer experience and drive traffic Franchise structure • Turnaround initiatives require adoption at the individual center level, leading to variability in timing and consistency introduces execution complexity • Franchisees bear any economic cost and investment of time before franchise benefits are fully realized • Near-term margin pressure at the center level may limit willingness to implement and invest in certain initiatives • Franchisees retain direct ownership, incentivizing operational focus once improvements are evident Certain advantages • Local operators possess market-level knowledge that can support staffing and customer acquisition efforts of a franchise model • Capital-light business model • Center performance and underlying transaction growth highly dependent on availability, experience, and retention of licensed waxers Labor-intensive • Hiring, scheduling, and compensation decisions are controlled by franchisees, not the company service model heightens execution • Experienced waxer retention essential to customer acquisition and retention and operational stability risk • Labor constraints could limit throughput, reduce service consistency and blunt expected SSS uplift • COO has been in role for ~3 – 4 months New management • CEO and CFO have been in their respective roles for ~1 year team driving execution of • CIDO, CCO, and CDO are all recent 2025 hires initiatives • Management’s ability to execute as a unit is unproven • No single initiative expected to drive a step-change in near-term financial performance Multiple initiatives are being executed • Turnaround success dependent on sustained execution across multiple initiatives simultaneously • Different franchisees have different problems; requires targeted approach by center • Financial impact dependent on meaningful changes around new customer acquisition and retention, waxer training, scheduling and retention, and center-level adoption, which changes take time Turnaround impact • Differences in site quality, local labor markets, and operator sophistication may create varied times to implement and bear results may be gradual • Previous turnaround efforts by the Company have been unsuccessful in realizing the full scope of benefits initially expected, underscoring the risk inherent in any potential turnaround plan • Majority of initiatives are not yet launched or are in early stages of implementation • Management is currently addressing “low-hanging fruit,” including basic customer education and staffing efficiency topics, ahead of Timing is a risk broader rollout of LRP Initiatives at the March franchisee conference • Ability to successfully implement early initiatives to set the foundation for growth will impact success of later initiatives • Both the Management Proposed LRP (50% Achievability) and the Management Proposed LRP (100% Achievability), presented in Macro poses the Company’s revised long-term plan on 12/18/2025, assume a stable macroeconomic environment; in a less stable macroeconomic environment, discretionary services would be negatively impacted, which would adversely impact the financial additional risk performance of Elegant regardless of the success of the LRP Initiatives Content must not go below this line Confidential | 5
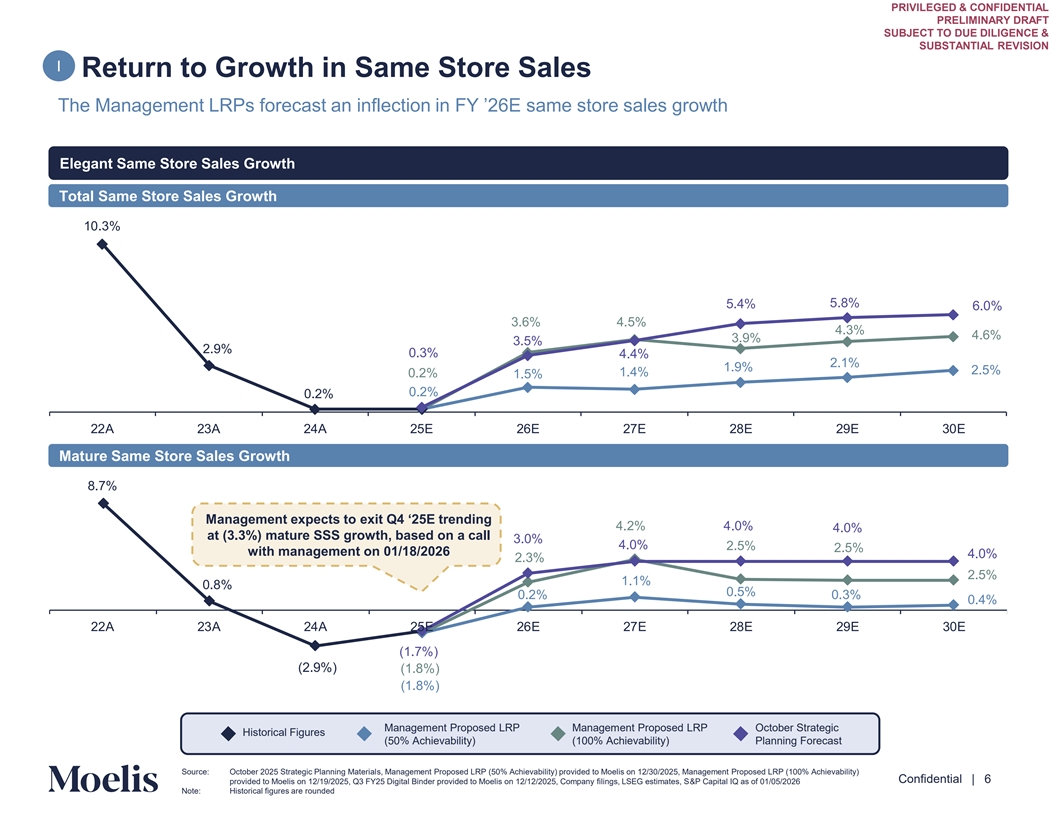
PRIVILEGED & CONFIDENTIAL PRELIMINARY DRAFT SUBJECT TO DUE DILIGENCE & SUBSTANTIAL REVISION I Return to Growth in Same Store Sales The Management LRPs forecast an inflection in FY ’26E same store sales growth Elegant Same Store Sales Growth Total Same Store Sales Growth 10.3% 5.4% 5.8% 6.0% 3.6% 4.5% 4.3% 4.6% 3.9% 3.5% 2.9% 0.3% 4.4% 2.1% 1.9% 2.5% 1.4% 0.2% 1.5% 0.2% 0.2% 22A 23A 24A 25E 26E 27E 28E 29E 30E Mature Same Store Sales Growth 8.7% Management expects to exit Q4 ‘25E trending 4.2% 4.0% 4.0% at (3.3%) mature SSS growth, based on a call 3.0% 4.0% 2.5% 2.5% with management on 01/18/2026 4.0% 2.3% 2.5% 1.1% 0.8% 0.5% 0.2% 0.3% 0.4% 22A 23A 24A 25E 26E 27E 28E 29E 30E (1.7%) (2.9%) (1.8%) (1.8%) Management Proposed LRP Management Proposed LRP October Strategic Historical Figures (50% Achievability) (100% Achievability) Planning Forecast Content must not go below this line Source: October 2025 Strategic Planning Materials, Management Proposed LRP (50% Achievability) provided to Moelis on 12/30/2025, Management Proposed LRP (100% Achievability) Confidential | 6 provided to Moelis on 12/19/2025, Q3 FY25 Digital Binder provided to Moelis on 12/12/2025, Company filings, LSEG estimates, S&P Capital IQ as of 01/05/2026 Note: Historical figures are rounded
PRIVILEGED & CONFIDENTIAL PRELIMINARY DRAFT SUBJECT TO DUE DILIGENCE & SUBSTANTIAL REVISION I Return to Growth in Same Store Sales (Cont’d) Elegant’s recent total same store sales growth has been more in-line with that of the Selected Publicly Traded Lower-Growth Franchise Model Companies than that of the Higher-Growth Franchise Model Companies Selected Publicly Traded Franchise Model Companies - Total Same Store Sales Growth 2024A Total Same Store Sales Growth Elegant Lower-Growth Franchise Models Higher-Growth Franchise Models Median: 0.1% Median: 2.8% Median: 0.2% 19.9% 7.0% 5.0% 2.8% 3.2% 2.3% 1.5% 1.3% 0.2% NA NA NA (1.3%) (1.0%) (3.1%) October 2025 Elegant Elegant (4.2%) Elegant Strategic Mgmt Mgmt Actual Planning (100%) (50%) 2025E Total Same Store Sales Growth Elegant Lower-Growth Franchise Models Higher-Growth Franchise Models Median: 2.4% Median: 0.3% Median: (2.1%) 6.8% 3.1% 2.6% 2.1% 1.3% 1.1% 1.0% 0.4% 0.3% 0.2% 0.2% (0.1%) (1.3%) (2.9%) (4.1%) (4.2%) October 2025 Elegant Elegant Elegant Strategic Mgmt Mgmt Consensus Planning (100%) (50%) 2026E Total Same Store Sales Growth Elegant Lower-Growth Franchise Models Higher-Growth Franchise Models Median: 2.6% Median: 1.4% Median: 2.4% 6.2% 3.6% 3.5% 3.5% 2.5% 2.4% 2.2% 2.1% 1.9% 1.6% 1.8% 1.7% 1.5% 1.1% 0.3% (0.7%) Elegant October 2025 Elegant Elegant Mgmt Strategic Mgmt Consensus Content must not (100%) Planning (50%) go below this line Confidential | 7 Source: Company filings, LSEG estimates, S&P Capital IQ as of 01/05/2026
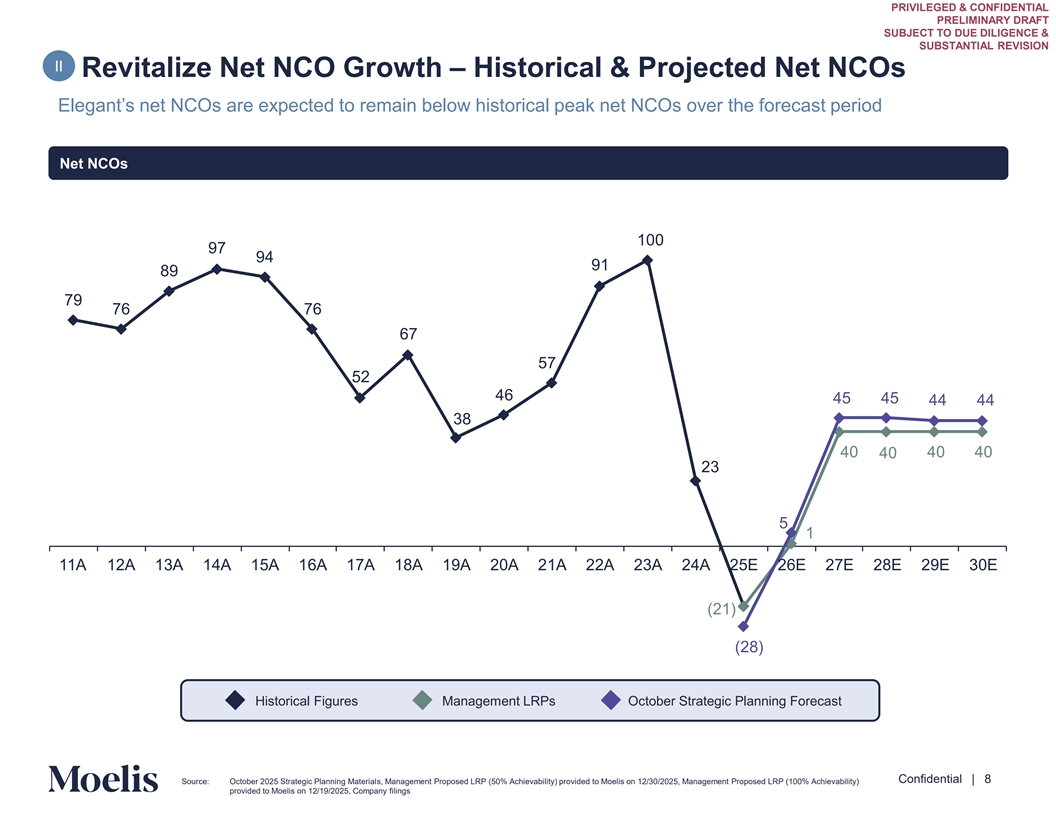
PRIVILEGED & CONFIDENTIAL PRELIMINARY DRAFT SUBJECT TO DUE DILIGENCE & SUBSTANTIAL REVISION II Revitalize Net NCO Growth – Historical & Projected Net NCOs Elegant’s net NCOs are expected to remain below historical peak net NCOs over the forecast period Net NCOs 100 97 94 91 89 79 76 76 67 57 52 46 45 45 44 44 38 40 40 40 40 23 5 1 11A 12A 13A 14A 15A 16A 17A 18A 19A 20A 21A 22A 23A 24A 25E 26E 27E 28E 29E 30E (21) (28) Historical Figures Management LRPs October Strategic Planning Forecast Content must not go below this line Confidential | 8 Source: October 2025 Strategic Planning Materials, Management Proposed LRP (50% Achievability) provided to Moelis on 12/30/2025, Management Proposed LRP (100% Achievability) provided to Moelis on 12/19/2025, Company filings
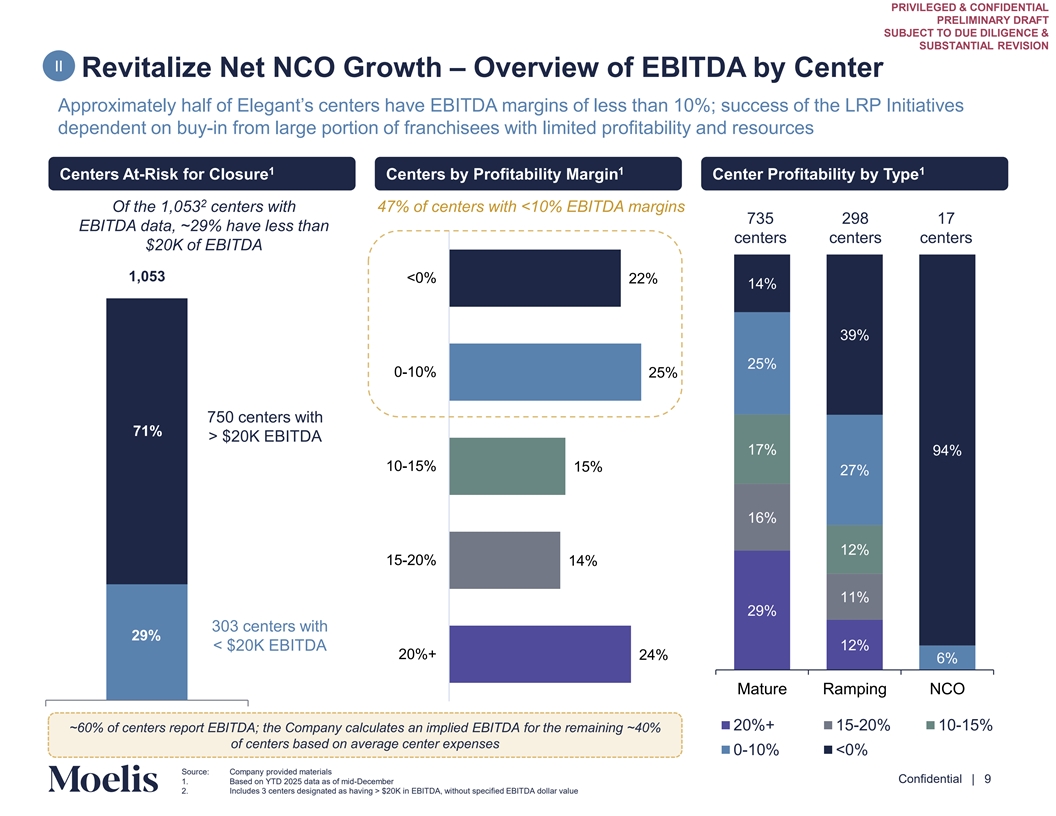
PRIVILEGED & CONFIDENTIAL PRELIMINARY DRAFT SUBJECT TO DUE DILIGENCE & SUBSTANTIAL REVISION II Revitalize Net NCO Growth – Overview of EBITDA by Center Approximately half of Elegant’s centers have EBITDA margins of less than 10%; success of the LRP Initiatives dependent on buy-in from large portion of franchisees with limited profitability and resources 1 1 1 Centers At-Risk for Closure Centers by Profitability Margin Center Profitability by Type 2 Of the 1,053 centers with 47% of centers with <10% EBITDA margins 735 298 17 EBITDA data, ~29% have less than centers centers centers $20K of EBITDA 1,053 <0% 22% 14% 39% 25% 0-10% 25% 750 centers with 71% > $20K EBITDA 747 17% 94% 10-15% 15% 27% 16% 12% 15-20% 14% 11% 29% 303 centers with 29% < $20K EBITDA 12% 20%+ 24% 6% Mature Ramping NCO 20%+ 15-20% 10-15% ~60% of centers report EBITDA; the Company calculates an implied EBITDA for the remaining ~40% of centers based on average center expenses Content must not 0-10% <0% go below this line Source: Company provided materials Confidential | 9 1. Based on YTD 2025 data as of mid-December 2. Includes 3 centers designated as having > $20K in EBITDA, without specified EBITDA dollar value
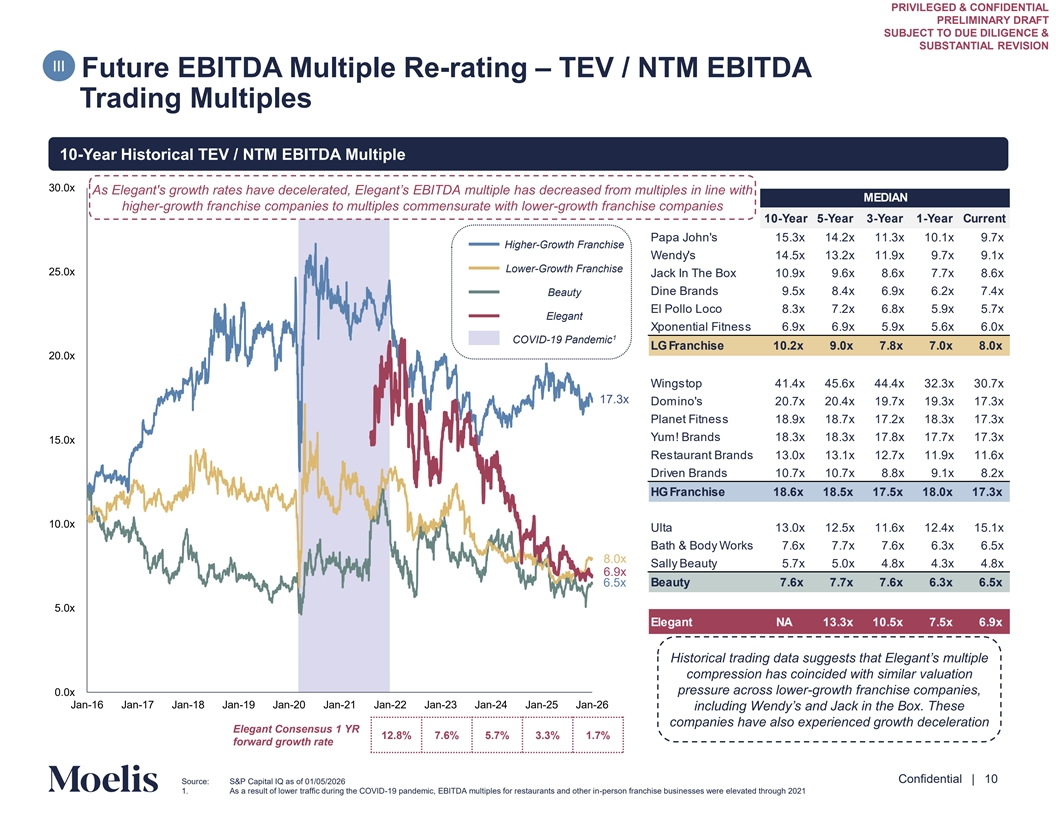
PRIVILEGED & CONFIDENTIAL PRELIMINARY DRAFT SUBJECT TO DUE DILIGENCE & SUBSTANTIAL REVISION III Future EBITDA Multiple Re-rating – TEV / NTM EBITDA Trading Multiples 10-Year Historical TEV / NTM EBITDA Multiple 30.0x As Elegant's growth rates have decelerated, Elegant’s EBITDA multiple has decreased from multiples in line with MEDIAN higher-growth franchise companies to multiples commensurate with lower-growth franchise companies 10-Year 5-Year 3-Year 1-Year Current Papa John's 15.3x 14.2x 11.3x 10.1x 9.7x Higher-Growth Franchise Wendy's 14.5x 13.2x 11.9x 9.7x 9.1x Lower-Growth Franchise 25.0x Jack In The Box 10.9x 9.6x 8.6x 7.7x 8.6x Beauty Dine Brands 9.5x 8.4x 6.9x 6.2x 7.4x El Pollo Loco 8.3x 7.2x 6.8x 5.9x 5.7x Elegant Xponential Fitness 6.9x 6.9x 5.9x 5.6x 6.0x 1 COVID-19 Pandemic LG Franchise 10.2x 9.0x 7.8x 7.0x 8.0x 20.0x Wingstop 41.4x 45.6x 44.4x 32.3x 30.7x 17.3x Domino's 20.7x 20.4x 19.7x 19.3x 17.3x Planet Fitness 18.9x 18.7x 17.2x 18.3x 17.3x Yum! Brands 18.3x 18.3x 17.8x 17.7x 17.3x 15.0x Restaurant Brands 13.0x 13.1x 12.7x 11.9x 11.6x Driven Brands 10.7x 10.7x 8.8x 9.1x 8.2x HG Franchise 18.6x 18.5x 17.5x 18.0x 17.3x 10.0x Ulta 13.0x 12.5x 11.6x 12.4x 15.1x Bath & Body Works 7.6x 7.7x 7.6x 6.3x 6.5x 8.0x Sally Beauty 5.7x 5.0x 4.8x 4.3x 4.8x 6.9x 6.5x Beauty 7.6x 7.7x 7.6x 6.3x 6.5x 5.0x Elegant NA 13.3x 10.5x 7.5x 6.9x Historical trading data suggests that Elegant’s multiple compression has coincided with similar valuation pressure across lower-growth franchise companies, 0.0x Jan-16 Jan-17 Jan-18 Jan-19 Jan-20 Jan-21 Jan-22 Jan-23 Jan-24 Jan-25 Jan-26 including Wendy’s and Jack in the Box. These companies have also experienced growth deceleration Elegant Consensus 1 YR 12.8% 7.6% 5.7% 3.3% 1.7% forward growth rate Content must not go below this line Confidential | 10 Source: S&P Capital IQ as of 01/05/2026 1. As a result of lower traffic during the COVID-19 pandemic, EBITDA multiples for restaurants and other in-person franchise businesses were elevated through 2021
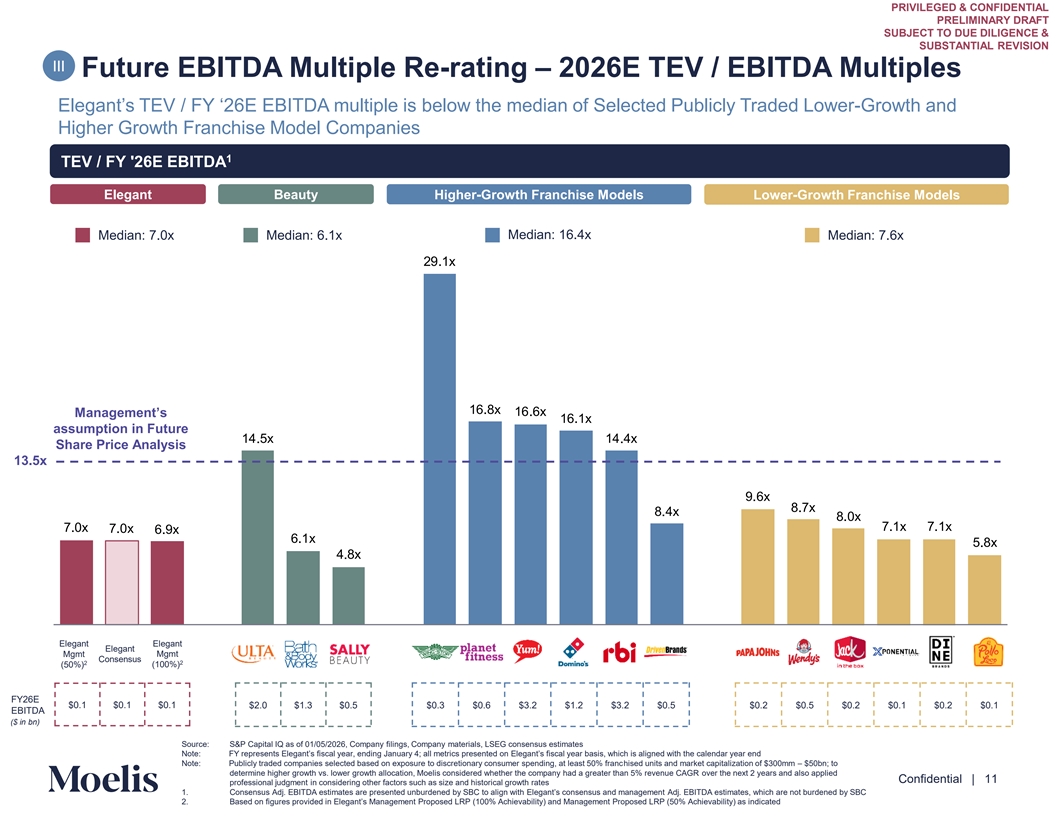
PRIVILEGED & CONFIDENTIAL PRELIMINARY DRAFT SUBJECT TO DUE DILIGENCE & SUBSTANTIAL REVISION III Future EBITDA Multiple Re-rating – 2026E TEV / EBITDA Multiples Elegant’s TEV / FY ‘26E EBITDA multiple is below the median of Selected Publicly Traded Lower-Growth and Higher Growth Franchise Model Companies 1 Net Leverage TEV / FY '26E EBITDA Elegant Beauty Higher-Growth Franchise Models Lower-Growth Franchise Models Median: 7.0x Median: 6.1x Median: 16.4x Median: 7.6x 29.1x 16.8x 16.6x Management’s 16.1x assumption in Future 14.5x 14.4x Share Price Analysis 13.5x 9.6x 8.7x 8.4x 8.0x 7.1x 7.1x 7.0x 7.0x 6.9x 6.1x 5.8x 4.8x Elegant Elegant Elegant Mgmt Mgmt Consensus 2 2 (50%) (100%) FY26E $0.1 $0.1 $0.1 $2.0 $1.3 $0.5 $0.3 $0.6 $3.2 $1.2 $3.2 $0.5 $0.2 $0.5 $0.2 $0.1 $0.2 $0.1 EBITDA ($ in bn) Source: S&P Capital IQ as of 01/05/2026, Company filings, Company materials, LSEG consensus estimates Content must not Note: FY represents Elegant’s fiscal year, ending January 4; all metrics presented on Elegant’s fiscal year basis, which is aligned with the calendar year end Note: Publicly traded companies selected based on exposure to discretionary consumer spending, at least 50% franchised units and market capitalization of $300mm – $50bn; to go below this line determine higher growth vs. lower growth allocation, Moelis considered whether the company had a greater than 5% revenue CAGR over the next 2 years and also applied Confidential | 11 professional judgment in considering other factors such as size and historical growth rates 1. Consensus Adj. EBITDA estimates are presented unburdened by SBC to align with Elegant’s consensus and management Adj. EBITDA estimates, which are not burdened by SBC 2. Based on figures provided in Elegant’s Management Proposed LRP (100% Achievability) and Management Proposed LRP (50% Achievability) as indicated
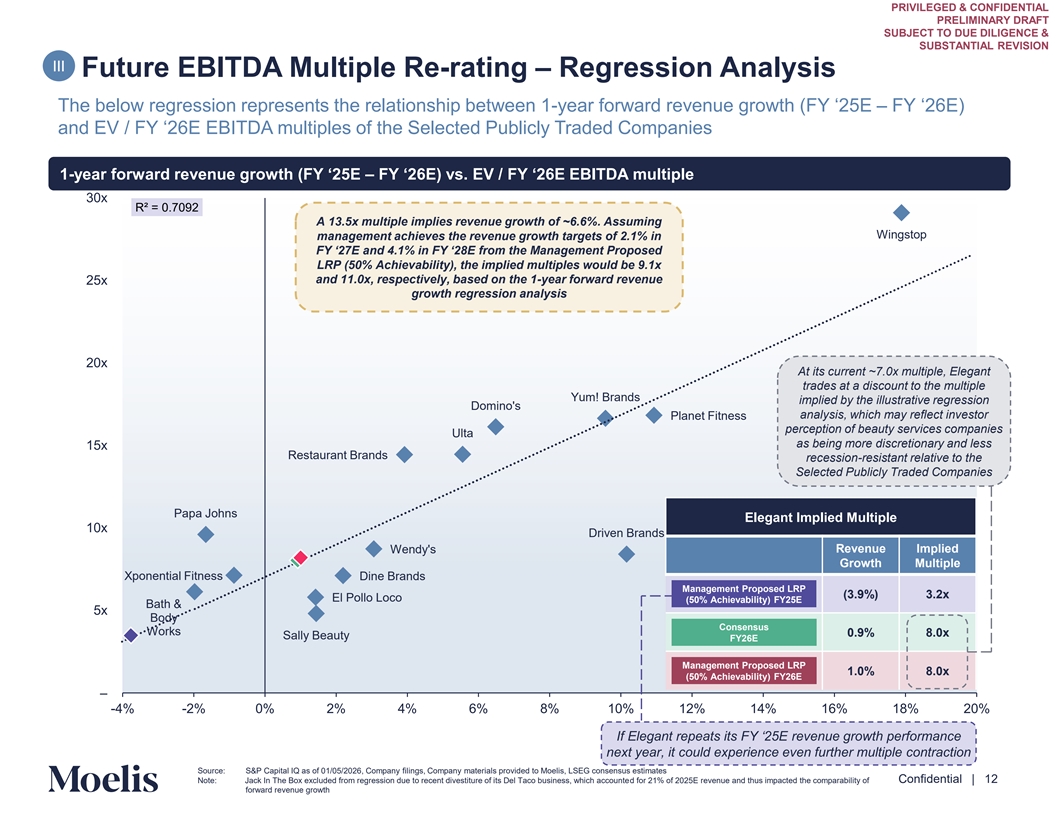
PRIVILEGED & CONFIDENTIAL PRELIMINARY DRAFT SUBJECT TO DUE DILIGENCE & SUBSTANTIAL REVISION III Future EBITDA Multiple Re-rating – Regression Analysis The below regression represents the relationship between 1-year forward revenue growth (FY ‘25E – FY ‘26E) and EV / FY ‘26E EBITDA multiples of the Selected Publicly Traded Companies 1-year forward revenue growth (FY ‘25E – FY ‘26E) vs. EV / FY ‘26E EBITDA multiple 30x R² = 0.7092 A 13.5x multiple implies revenue growth of ~6.6%. Assuming Wingstop management achieves the revenue growth targets of 2.1% in FY ‘27E and 4.1% in FY ‘28E from the Management Proposed LRP (50% Achievability), the implied multiples would be 9.1x and 11.0x, respectively, based on the 1-year forward revenue 25x growth regression analysis 20x At its current ~7.0x multiple, Elegant trades at a discount to the multiple Yum! Brands implied by the illustrative regression Domino's analysis, which may reflect investor Planet Fitness perception of beauty services companies Ulta as being more discretionary and less 15x Restaurant Brands recession-resistant relative to the Selected Publicly Traded Companies Papa Johns Elegant Implied Multiple 10x Driven Brands Wendy's Revenue Implied Growth Multiple Xponential Fitness Dine Brands Management Proposed LRP (3.9%) 3.2x El Pollo Loco (50% Achievability) FY25E Bath & 5x Body Consensus Works 0.9% 8.0x Sally Beauty FY26E Management Proposed LRP 1.0% 8.0x (50% Achievability) FY26E – -4% -2% 0% 2% 4% 6% 8% 10% 12% 14% 16% 18% 20% If Elegant repeats its FY ‘25E revenue growth performance Content must not next year, it could experience even further multiple contraction go below this line Source: S&P Capital IQ as of 01/05/2026, Company filings, Company materials provided to Moelis, LSEG consensus estimates Confidential | 12 Note: Jack In The Box excluded from regression due to recent divestiture of its Del Taco business, which accounted for 21% of 2025E revenue and thus impacted the comparability of forward revenue growth
PRIVILEGED & CONFIDENTIAL PRELIMINARY DRAFT SUBJECT TO DUE DILIGENCE & SUBSTANTIAL REVISION 2. Management's M&A Center Analysis (October 2025) Content must not go below this line Confidential | 13
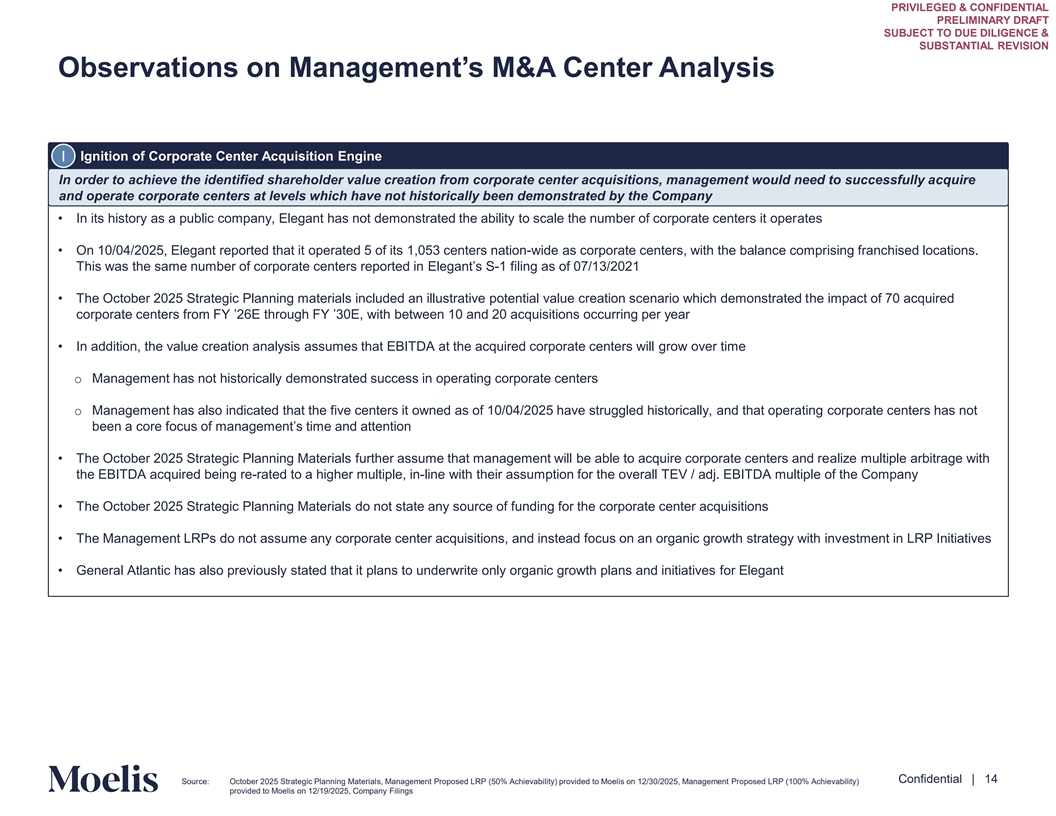
PRIVILEGED & CONFIDENTIAL PRELIMINARY DRAFT SUBJECT TO DUE DILIGENCE & SUBSTANTIAL REVISION Observations on Management’s M&A Center Analysis I Ignition of Corporate Center Acquisition Engine In order to achieve the identified shareholder value creation from corporate center acquisitions, management would need to successfully acquire and operate corporate centers at levels which have not historically been demonstrated by the Company • In its history as a public company, Elegant has not demonstrated the ability to scale the number of corporate centers it operates • On 10/04/2025, Elegant reported that it operated 5 of its 1,053 centers nation-wide as corporate centers, with the balance comprising franchised locations. This was the same number of corporate centers reported in Elegant’s S-1 filing as of 07/13/2021 • The October 2025 Strategic Planning materials included an illustrative potential value creation scenario which demonstrated the impact of 70 acquired corporate centers from FY ’26E through FY ’30E, with between 10 and 20 acquisitions occurring per year • In addition, the value creation analysis assumes that EBITDA at the acquired corporate centers will grow over time o Management has not historically demonstrated success in operating corporate centers o Management has also indicated that the five centers it owned as of 10/04/2025 have struggled historically, and that operating corporate centers has not been a core focus of management’s time and attention • The October 2025 Strategic Planning Materials further assume that management will be able to acquire corporate centers and realize multiple arbitrage with the EBITDA acquired being re-rated to a higher multiple, in-line with their assumption for the overall TEV / adj. EBITDA multiple of the Company • The October 2025 Strategic Planning Materials do not state any source of funding for the corporate center acquisitions • The Management LRPs do not assume any corporate center acquisitions, and instead focus on an organic growth strategy with investment in LRP Initiatives • General Atlantic has also previously stated that it plans to underwrite only organic growth plans and initiatives for Elegant Content must not go below this line Confidential | 14 Source: October 2025 Strategic Planning Materials, Management Proposed LRP (50% Achievability) provided to Moelis on 12/30/2025, Management Proposed LRP (100% Achievability) provided to Moelis on 12/19/2025, Company Filings
PRIVILEGED & CONFIDENTIAL PRELIMINARY DRAFT SUBJECT TO DUE DILIGENCE & SUBSTANTIAL REVISION Appendix Content must not go below this line Confidential | 15
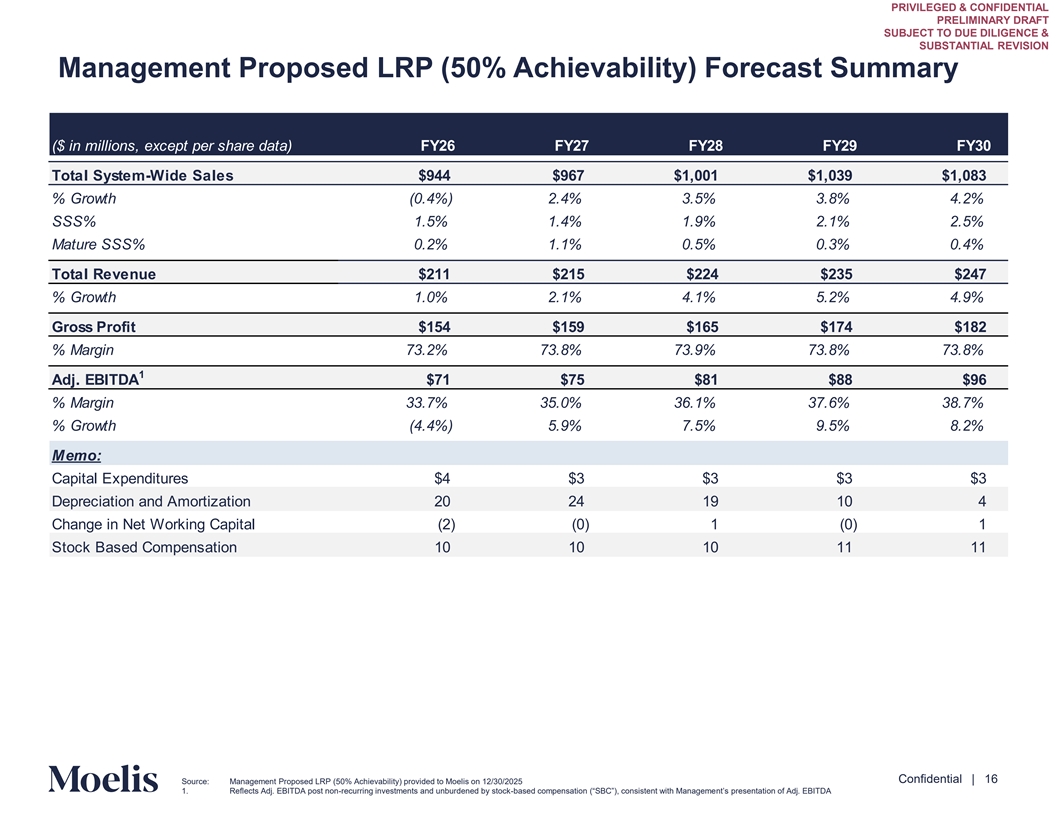
PRIVILEGED & CONFIDENTIAL PRELIMINARY DRAFT SUBJECT TO DUE DILIGENCE & SUBSTANTIAL REVISION Management Proposed LRP (50% Achievability) Forecast Summary ($ in millions, except per share data) FY26 FY27 FY28 FY29 FY30 Total System-Wide Sales $944 $967 $1,001 $1,039 $1,083 % Growth (0.4%) 2.4% 3.5% 3.8% 4.2% SSS% 1.5% 1.4% 1.9% 2.1% 2.5% Mature SSS% 0.2% 1.1% 0.5% 0.3% 0.4% Total Revenue $211 $215 $224 $235 $247 % Growth 1.0% 2.1% 4.1% 5.2% 4.9% Gross Profit $154 $159 $165 $174 $182 % Margin 73.2% 73.8% 73.9% 73.8% 73.8% 1 Adj. EBITDA $71 $75 $81 $88 $96 % Margin 33.7% 35.0% 36.1% 37.6% 38.7% % Growth (4.4%) 5.9% 7.5% 9.5% 8.2% Memo: Capital Expenditures $4 $3 $3 $3 $3 Depreciation and Amortization 20 24 19 10 4 Change in Net Working Capital (2) (0) 1 (0) 1 Stock Based Compensation 10 10 10 11 11 Content must not go below this line Confidential | 16 Source: Management Proposed LRP (50% Achievability) provided to Moelis on 12/30/2025 1. Reflects Adj. EBITDA post non-recurring investments and unburdened by stock-based compensation (“SBC”), consistent with Management’s presentation of Adj. EBITDA

PRIVILEGED & CONFIDENTIAL PRELIMINARY DRAFT SUBJECT TO DUE DILIGENCE & SUBSTANTIAL REVISION Management Proposed LRP (100% Achievability) Forecast Summary ($ in millions, except per share data) FY26 FY27 FY28 FY29 FY30 Total System-Wide Sales $964 $1,017 $1,074 $1,139 $1,211 % Growth 1.7% 5.6% 5.6% 6.1% 6.3% SSS% 3.6% 4.5% 3.9% 4.3% 4.6% Mature SSS% 2.3% 4.2% 2.5% 2.5% 2.5% Total Revenue $215 $226 $240 $258 $276 % Growth 3.4% 5.1% 5.9% 7.7% 7.0% Gross Profit $158 $167 $177 $190 $204 % Margin 73.2% 73.8% 73.9% 73.7% 73.8% 1 Adj. EBITDA $72 $79 $87 $97 $107 % Margin 33.6% 34.9% 36.2% 37.6% 38.7% % Growth (2.4%) 9.1% 9.7% 11.8% 10.3% Memo: Capital Expenditures $4 $3 $3 $3 $3 Depreciation and Amortization 20 24 19 10 4 Change in Net Working Capital (2) (0) 1 (0) 1 Stock Based Compensation 10 10 10 11 11 Content must not go below this line Confidential | 17 Source: Management Proposed LRP (100% Achievability) provided to Moelis on 12/19/2025 1. Reflects Adj. EBITDA post non-recurring investments and unburdened by stock-based compensation (“SBC”), consistent with Management’s presentation of Adj. EBITDA
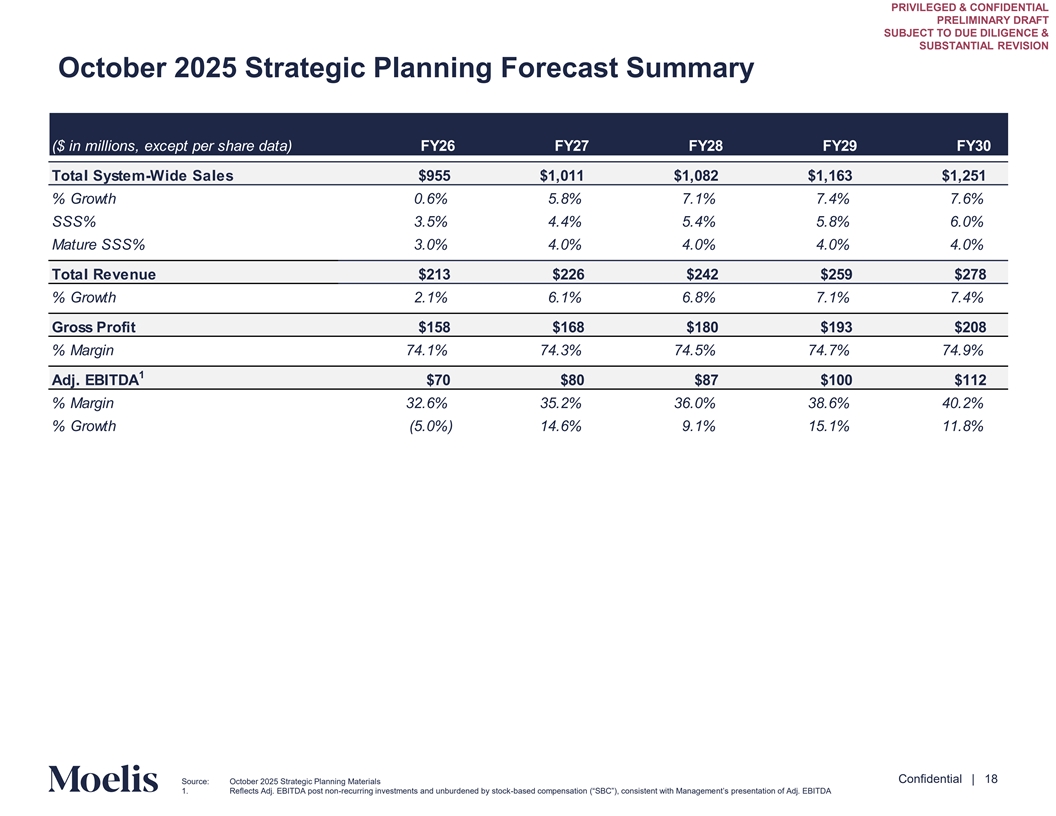
PRIVILEGED & CONFIDENTIAL PRELIMINARY DRAFT SUBJECT TO DUE DILIGENCE & SUBSTANTIAL REVISION October 2025 Strategic Planning Forecast Summary ($ in millions, except per share data) FY26 FY27 FY28 FY29 FY30 Total System-Wide Sales $955 $1,011 $1,082 $1,163 $1,251 % Growth 0.6% 5.8% 7.1% 7.4% 7.6% SSS% 3.5% 4.4% 5.4% 5.8% 6.0% Mature SSS% 3.0% 4.0% 4.0% 4.0% 4.0% Total Revenue $213 $226 $242 $259 $278 % Growth 2.1% 6.1% 6.8% 7.1% 7.4% Gross Profit $158 $168 $180 $193 $208 % Margin 74.1% 74.3% 74.5% 74.7% 74.9% 1 Adj. EBITDA $70 $80 $87 $100 $112 % Margin 32.6% 35.2% 36.0% 38.6% 40.2% % Growth (5.0%) 14.6% 9.1% 15.1% 11.8% Content must not go below this line Confidential | 18 Source: October 2025 Strategic Planning Materials 1. Reflects Adj. EBITDA post non-recurring investments and unburdened by stock-based compensation (“SBC”), consistent with Management’s presentation of Adj. EBITDA
PRIVILEGED & CONFIDENTIAL PRELIMINARY DRAFT SUBJECT TO DUE DILIGENCE & SUBSTANTIAL REVISION Disclaimer This presentation has been prepared by Moelis & Company LLC (“Moelis”) solely for the information and assistance of the Special Committee of the Board of Directors of the company codenamed “Elegant” (the “Company”) in considering the matters referred to in these materials. This presentation is confidential and may not be disclosed (in whole or in part) or utilized for other purposes without the express prior written consent of Moelis. This presentation has been prepared based on information provided by the Company and/or from third party sources. Moelis assumed such information is complete and accurate in all material respects. Moelis has not independently verified such information (or assumed responsibility for the independent verification of such information). To the extent this presentation includes projections, forecasts or other forward-looking statements, Moelis has assumed that such information was reasonably prepared based on the best currently available estimates and judgments of the Company and/or other parties as to the future performance of the Company and/or such other parties. Moelis expresses no views as to the reasonableness of any such projections, forecasts or other forward-looking statements or the assumptions on which they are based. Moelis has not made any independent evaluation or appraisal of any of the assets or liabilities (contingent, derivative, off-balance-sheet, or otherwise) of the Company or any other party. Moelis’ participation in any due diligence review is solely for purposes of supporting its advice and analysis. This presentation is based on economic, monetary, market and other conditions as in effect on, and the information made available to us as of, the date hereof, and Moelis assumes no obligation to update this presentation or correct any information herein. No company or transaction used in this presentation is identical to the Company or any potential transaction. The analyses set forth in this presentation do not purport to be appraisals and such analyses do not reflect Moelis’ views of the prices at which businesses or securities actually may be sold. Because the analyses described in these materials (including the information used in such analyses) are inherently subject to uncertainty, Moelis does not assume responsibility if future results are materially different from those forecast. This presentation was designed for use by certain persons familiar with the business of the Company. This presentation is not intended to provide the sole basis for any decision on any transaction or strategic alternative and is not a recommendation with respect to any transaction or strategic alternative. This presentation does not address the Special Committee’s underlying business decision to explore or recommend any transaction or strategic alternative or the relative merits of any transaction or strategic alternative as compared to any alternative business strategies or transactions that might be available to the Company. Nothing contained in this presentation should be construed as legal, regulatory, tax or accounting advice. Moelis and its affiliates are engaged globally in a wide range of investment banking and other activities for their own account and otherwise. Moelis and its affiliates may have advised, may seek to advise and may in the future advise in companies referred to in this presentation. Personnel of Moelis or such affiliates may make statements or provide advice that is contrary to information included in this presentation. The proprietary interests of Moelis or its affiliates may conflict with your interests. In addition, Moelis and its affiliates and their personnel may from time to time have positions in or effect transactions in securities referred to in this material (or derivatives of such securities), or serve as a director of companies referred to in this presentation. Content must not go below this line Confidential | 19