
Exhibit (c)(vi) Project Elegant Discussion Materials February 9, 2026 Content must not go below this line
1. Executive Summary Content must not go below this line Confidential | 1
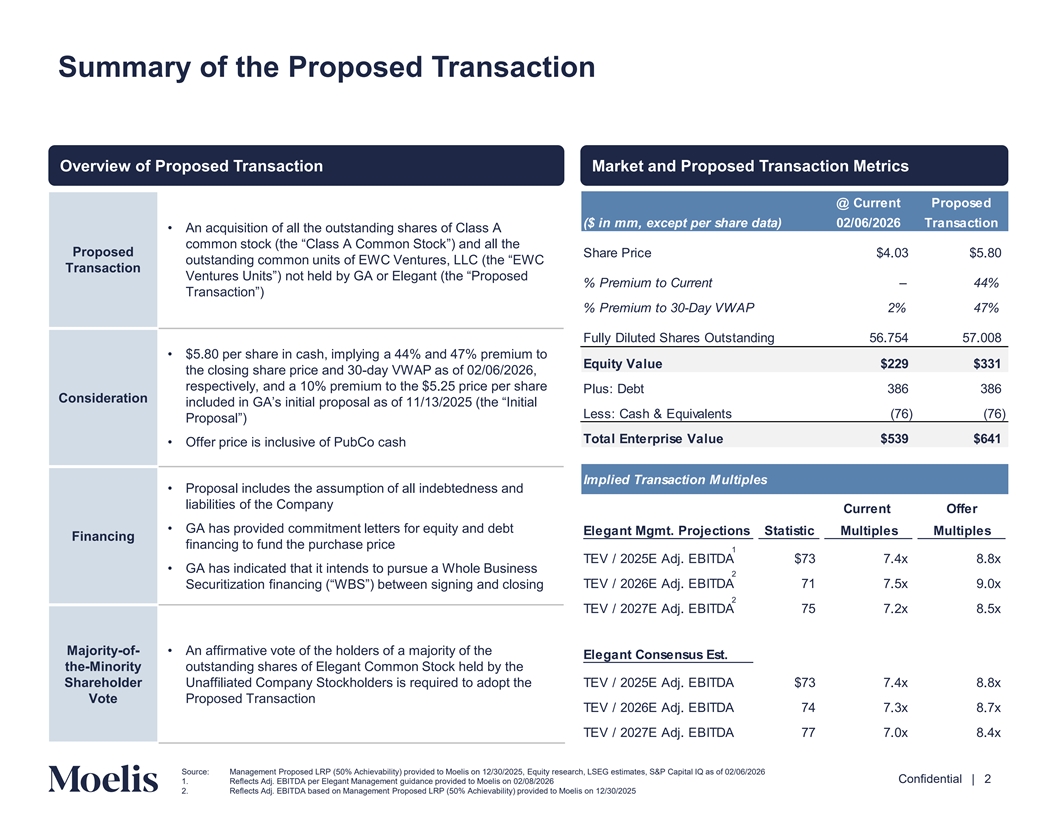
Summary of the Proposed Transaction Overview of Proposed Transaction Market and Proposed Transaction Metrics @ Current Proposed ($ in mm, except per share data) 02/06/2026 Transaction • An acquisition of all the outstanding shares of Class A common stock (the “Class A Common Stock”) and all the Proposed Share Price $4.03 $5.80 outstanding common units of EWC Ventures, LLC (the “EWC Transaction Ventures Units”) not held by GA or Elegant (the “Proposed % Premium to Current – 44% Transaction”) % Premium to 30-Day VWAP 2% 47% Fully Diluted Shares Outstanding 56.754 57.008 • $5.80 per share in cash, implying a 44% and 47% premium to Equity Value $229 $331 the closing share price and 30-day VWAP as of 02/06/2026, respectively, and a 10% premium to the $5.25 price per share Plus: Debt 386 386 Consideration included in GA’s initial proposal as of 11/13/2025 (the “Initial Less: Cash & Equivalents (76) (76) Proposal”) Total Enterprise Value $539 $641 • Offer price is inclusive of PubCo cash Implied Transaction Multiples • Proposal includes the assumption of all indebtedness and liabilities of the Company Current Offer • GA has provided commitment letters for equity and debt Elegant Mgmt. Projections Statistic Multiples Multiples Financing financing to fund the purchase price 1 TEV / 2025E Adj. EBITDA $73 7.4x 8.8x • GA has indicated that it intends to pursue a Whole Business 2 TEV / 2026E Adj. EBITDA 71 7.5x 9.0x Securitization financing (“WBS”) between signing and closing 2 TEV / 2027E Adj. EBITDA 75 7.2x 8.5x Majority-of- • An affirmative vote of the holders of a majority of the Elegant Consensus Est. the-Minority outstanding shares of Elegant Common Stock held by the Shareholder Unaffiliated Company Stockholders is required to adopt the TEV / 2025E Adj. EBITDA $73 7.4x 8.8x Vote Proposed Transaction TEV / 2026E Adj. EBITDA 74 7.3x 8.7x TEV / 2027E Adj. EBITDA 77 7.0x 8.4x Content must not go below this line Source: Management Proposed LRP (50% Achievability) provided to Moelis on 12/30/2025, Equity research, LSEG estimates, S&P Capital IQ as of 02/06/2026 Confidential | 2 1. Reflects Adj. EBITDA per Elegant Management guidance provided to Moelis on 02/08/2026 2. Reflects Adj. EBITDA based on Management Proposed LRP (50% Achievability) provided to Moelis on 12/30/2025
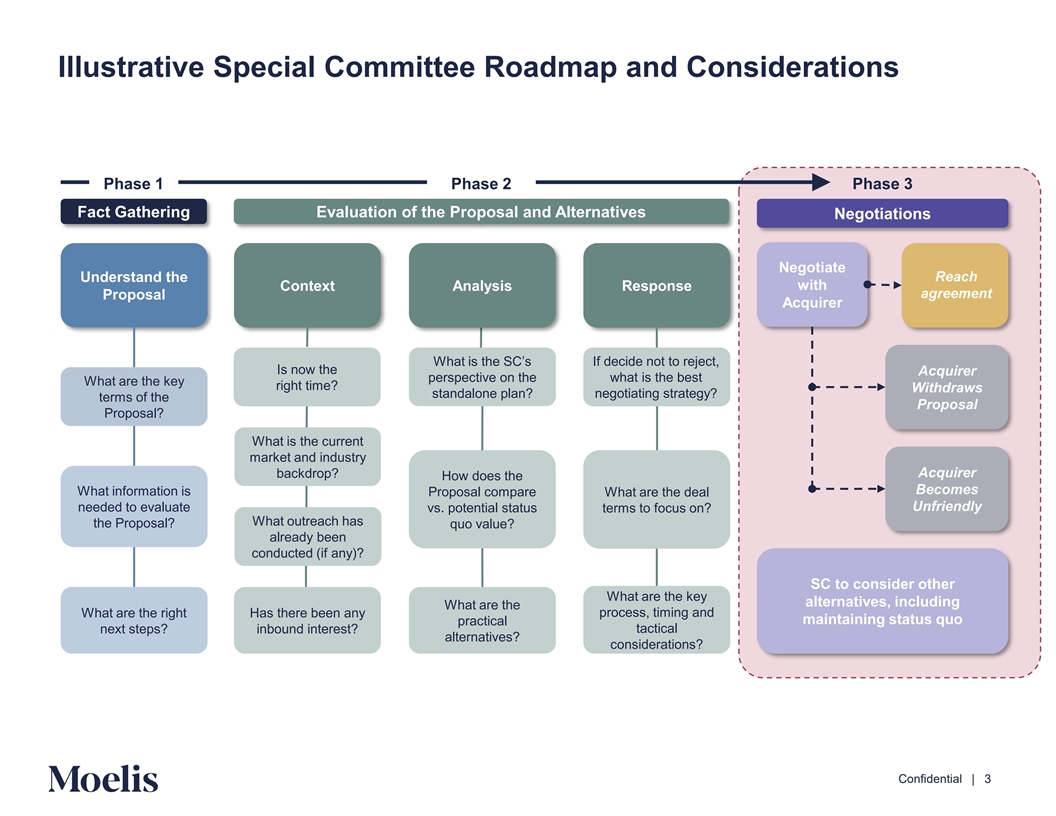
Illustrative Special Committee Roadmap and Considerations Phase 1 Phase 2 Phase 3 Fact Gathering Evaluation of the Proposal and Alternatives Negotiations Negotiate Reach Understand the Context Analysis Response with agreement Proposal Acquirer What is the SC’s If decide not to reject, Is now the Acquirer perspective on the what is the best What are the key right time? Withdraws standalone plan? negotiating strategy? terms of the Proposal Proposal? What is the current market and industry Acquirer backdrop? How does the Becomes What information is Proposal compare What are the deal Unfriendly needed to evaluate vs. potential status terms to focus on? What outreach has the Proposal? quo value? already been conducted (if any)? SC to consider other What are the key alternatives, including What are the What are the right Has there been any process, timing and maintaining status quo practical next steps? inbound interest? tactical alternatives? considerations? Content must not go below this line Confidential | 3

2. Financial Analysis Content must not go below this line Confidential | 4
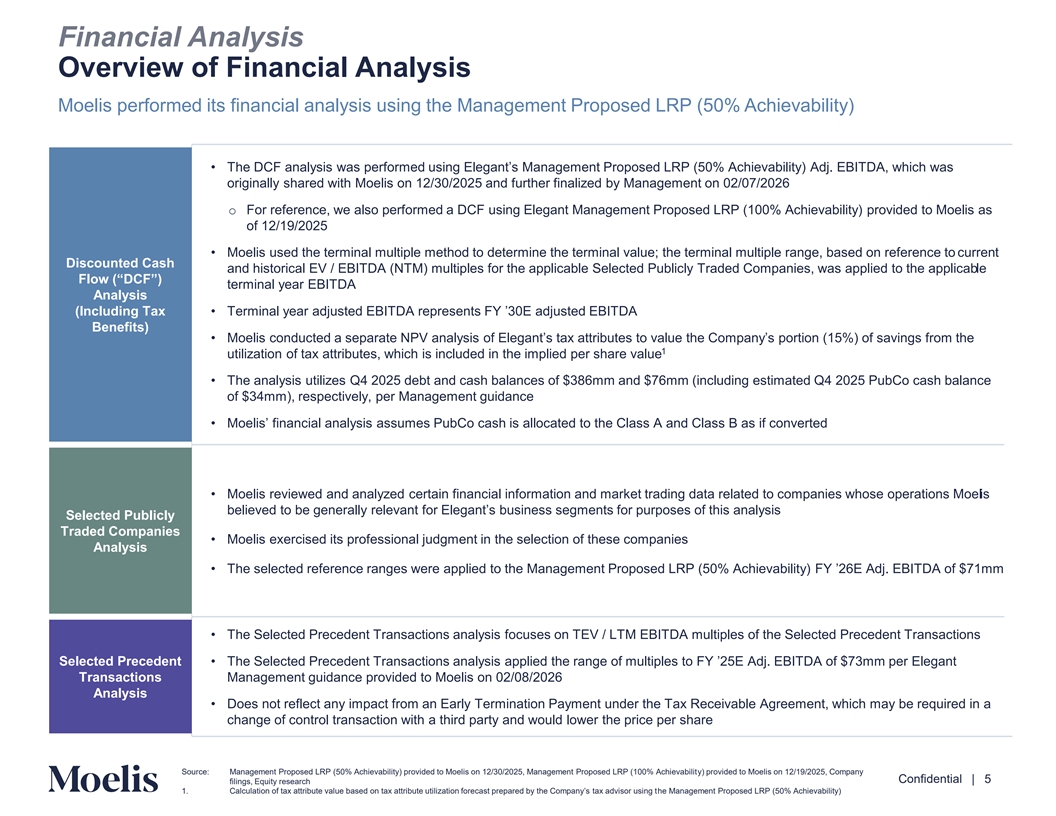
Financial Analysis Overview of Financial Analysis Moelis performed its financial analysis using the Management Proposed LRP (50% Achievability) • The DCF analysis was performed using Elegant’s Management Proposed LRP (50% Achievability) Adj. EBITDA, which was originally shared with Moelis on 12/30/2025 and further finalized by Management on 02/07/2026 o For reference, we also performed a DCF using Elegant Management Proposed LRP (100% Achievability) provided to Moelis as of 12/19/2025 • Moelis used the terminal multiple method to determine the terminal value; the terminal multiple range, based on reference to current Discounted Cash and historical EV / EBITDA (NTM) multiples for the applicable Selected Publicly Traded Companies, was applied to the applicable Flow (“DCF”) terminal year EBITDA Analysis (Including Tax • Terminal year adjusted EBITDA represents FY ’30E adjusted EBITDA Benefits) • Moelis conducted a separate NPV analysis of Elegant’s tax attributes to value the Company’s portion (15%) of savings from the 1 utilization of tax attributes, which is included in the implied per share value • The analysis utilizes Q4 2025 debt and cash balances of $386mm and $76mm (including estimated Q4 2025 PubCo cash balance of $34mm), respectively, per Management guidance • Moelis’ financial analysis assumes PubCo cash is allocated to the Class A and Class B as if converted • Moelis reviewed and analyzed certain financial information and market trading data related to companies whose operations Moelis believed to be generally relevant for Elegant’s business segments for purposes of this analysis Selected Publicly Traded Companies • Moelis exercised its professional judgment in the selection of these companies Analysis • The selected reference ranges were applied to the Management Proposed LRP (50% Achievability) FY ’26E Adj. EBITDA of $71mm • The Selected Precedent Transactions analysis focuses on TEV / LTM EBITDA multiples of the Selected Precedent Transactions Selected Precedent • The Selected Precedent Transactions analysis applied the range of multiples to FY ’25E Adj. EBITDA of $73mm per Elegant Transactions Management guidance provided to Moelis on 02/08/2026 Analysis • Does not reflect any impact from an Early Termination Payment under the Tax Receivable Agreement, which may be required in a change of control transaction with a third party and would lower the price per share Content must not go below this line Source: Management Proposed LRP (50% Achievability) provided to Moelis on 12/30/2025, Management Proposed LRP (100% Achievability) provided to Moelis on 12/19/2025, Company Confidential | 5 filings, Equity research 1. Calculation of tax attribute value based on tax attribute utilization forecast prepared by the Company’s tax adviso her M uasinnagg etment Proposed LRP (50% Achievability)
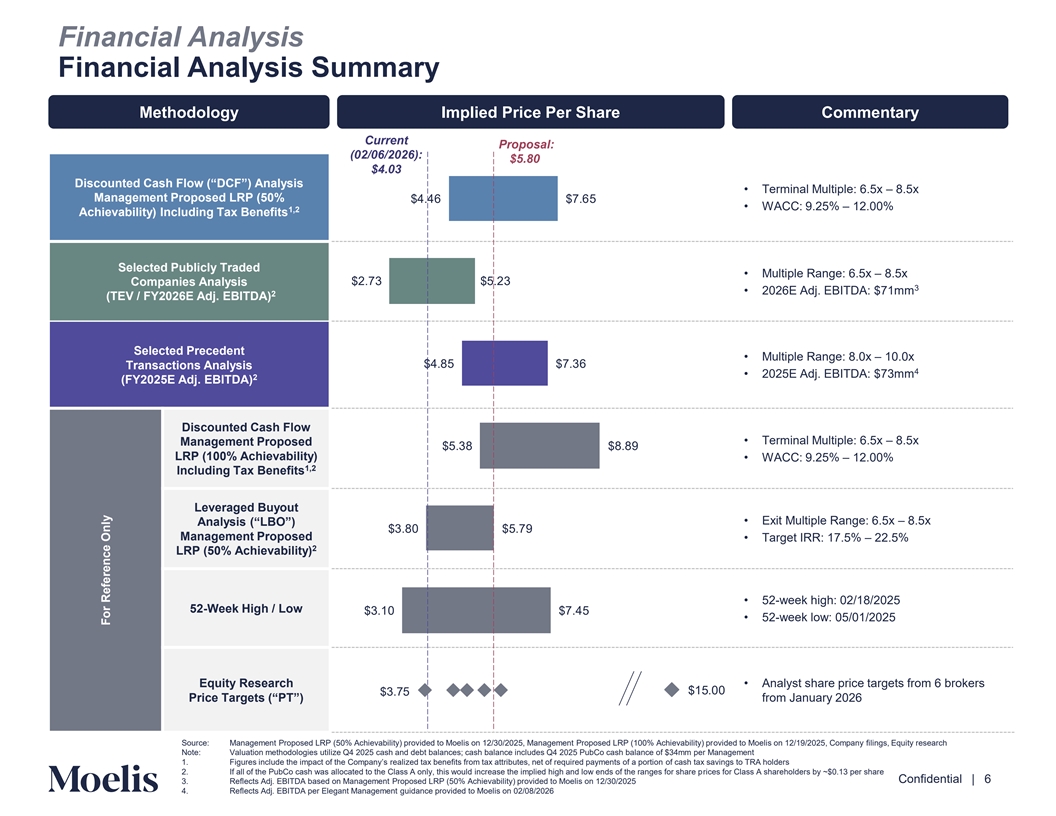
Financial Analysis Financial Analysis Summary Methodology Implied Price Per Share Commentary Current Proposal: (02/06/2026): $5.80 $4.03 Discounted Cash Flow (“DCF”) Analysis • Terminal Multiple: 6.5x – 8.5x Management Proposed LRP (50% $ . 6 $7.65 • WACC: 9.25% – 12.00% 1,2 Achievability) Including Tax Benefits Selected Publicly Traded • Multiple Range: 6.5x – 8.5x $2.73 $5.23 Companies Analysis 3 • 2026E Adj. EBITDA: $71mm 2 (TEV / FY2026E Adj. EBITDA) Selected Precedent • Multiple Range: 8.0x – 10.0x $ . 5 $7.36 Transactions Analysis 4 • 2025E Adj. EBITDA: $73mm 2 (FY2025E Adj. EBITDA) Discounted Cash Flow • Terminal Multiple: 6.5x – 8.5x Management Proposed $5.3 $ . LRP (100% Achievability) • WACC: 9.25% – 12.00% 1,2 Including Tax Benefits Leveraged Buyout • Exit Multiple Range: 6.5x – 8.5x Analysis (“LBO”) $3. 0 $5.7 Management Proposed • Target IRR: 17.5% – 22.5% 2 LRP (50% Achievability) • 52-week high: 02/18/2025 52-Week High / Low $3.10 $7. 5 • 52-week low: 05/01/2025 Equity Research • Analyst share price targets from 6 brokers $15.00 $3.75 Price Targets (“PT”) from January 2026 Source: Management Proposed LRP (50% Achievability) provided to Moelis on 12/30/2025, Management Proposed LRP (100% Achievability) provided to Moelis on 12/19/2025, Company filings, Equity research Content must not Note: Valuation methodologies utilize Q4 2025 cash and debt balances; cash balance includes Q4 2025 PubCo cash balance of $34mm per Management 1. Figures include the impact of the Company’s realized tax benefits from tax attributes, net of required payments of of aca psh or ttiaoxn sa vings to TRA holders go below this line 2. If all of the PubCo cash was allocated to the Class A only, this would increase the implied high and low ends of the ranges for share prices for Class A shareholders by ~$0.13 per share Confidential | 6 3. Reflects Adj. EBITDA based on Management Proposed LRP (50% Achievability) provided to Moelis on 12/30/2025 4. Reflects Adj. EBITDA per Elegant Management guidance provided to Moelis on 02/08/2026 For Reference Only
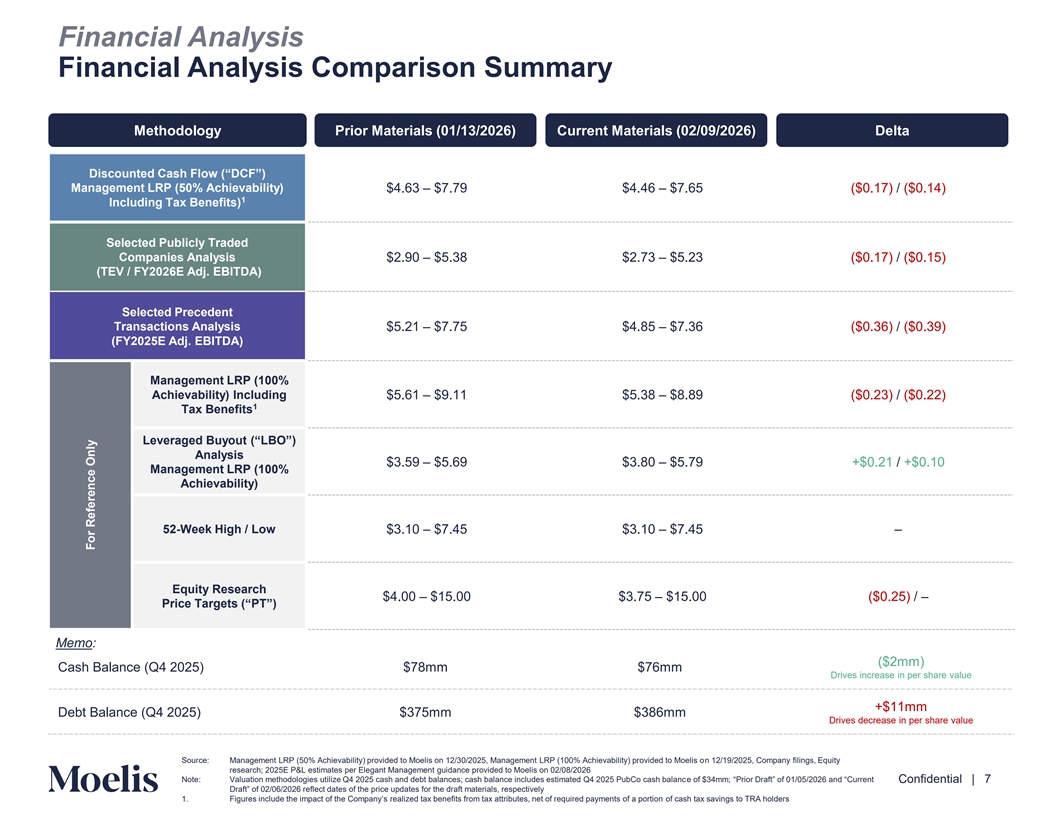
Financial Analysis Financial Analysis Comparison Summary Methodology Prior Materials (01/13/2026) Current Materials (02/09/2026) Delta Discounted Cash Flow (“DCF”) Management LRP (50% Achievability) $4.63 – $7.79 $4.46 – $7.65 ($0.17) / ($0.14) 1 Including Tax Benefits) Selected Publicly Traded Companies Analysis $2.90 – $5.38 $2.73 – $5.23 ($0.17) / ($0.15) (TEV / FY2026E Adj. EBITDA) Selected Precedent Transactions Analysis $5.21 – $7.75 $4.85 – $7.36 ($0.36) / ($0.39) (FY2025E Adj. EBITDA) Management LRP (100% Achievability) Including $5.61 – $9.11 $5.38 – $8.89 ($0.23) / ($0.22) 1 Tax Benefits Leveraged Buyout (“LBO”) Analysis $3.59 – $5.69 $3.80 – $5.79 +$0.21 / +$0.10 Management LRP (100% Achievability) 52-Week High / Low $3.10 – $7.45 $3.10 – $7.45 – Equity Research $4.00 – $15.00 $3.75 – $15.00 ($0.25) / – Price Targets (“PT”) Memo: ($2mm) Cash Balance (Q4 2025) $78mm $76mm Drives increase in per share value +$11mm Debt Balance (Q4 2025) $375mm $386mm Drives decrease in per share value Content must not Source: Management LRP (50% Achievability) provided to Moelis on 12/30/2025, Management LRP (100% Achievability) provided to Moelis on 12/19/2025, Company filings, Equity go below this line research; 2025E P&L estimates per Elegant Management guidance provided to Moelis on 02/08/2026 Note: Valuation methodologies utilize Q4 2025 cash and debt balances; cash balance includes estimated Q4 2025 PubCo cash balance of $3 mm; “Prior Draft” 01 of /05/2026 and “Current Confidential | 7 Draft” of 02/06/2026 reflect dates of th pre ice updates for the draft materials, respectively 1. Figures include the impact of the Company’s realized tax benefits from tax attributes, net of required payments of of aca psh or ttiaoxn sa vings to TRA holders For Reference Only
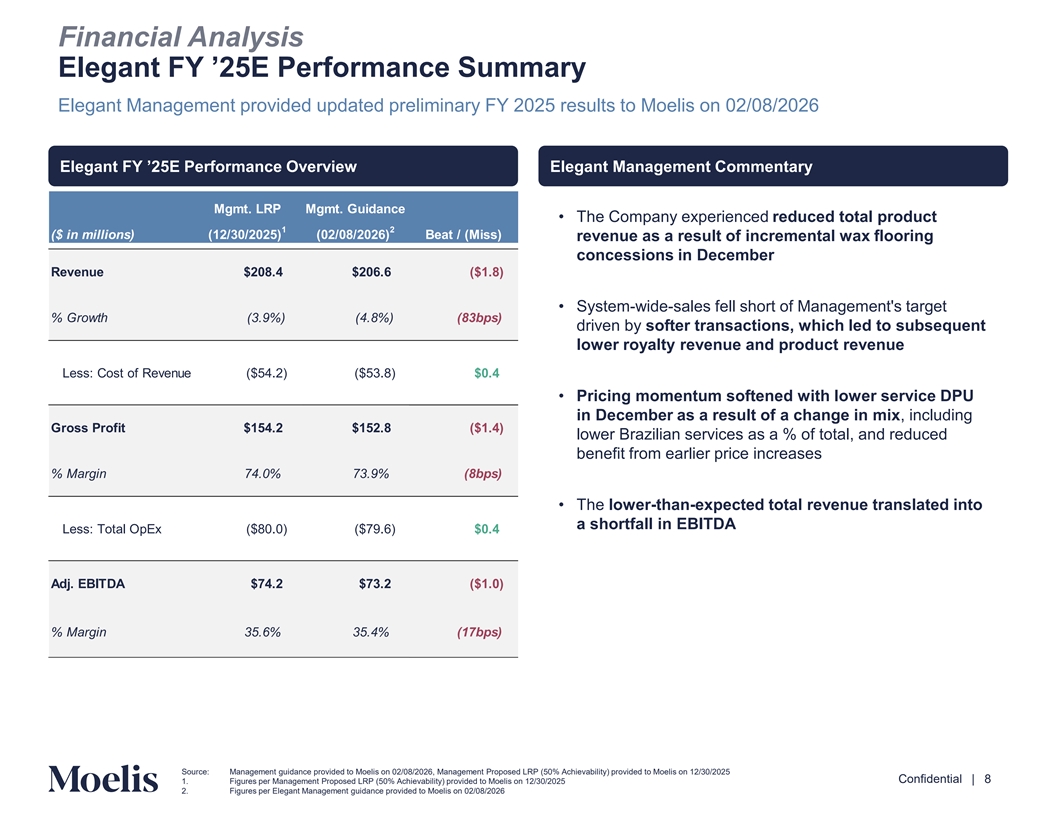
Financial Analysis Elegant FY ’25E Performance Summary Elegant Management provided updated preliminary FY 2025 results to Moelis on 02/08/2026 Elegant FY ’25E Performance Overview Elegant Management Commentary Mgmt. LRP Mgmt. Guidance • The Company experienced reduced total product 1 2 ($ in millions) (12/30/2025) (02/08/2026) Beat / (Miss) revenue as a result of incremental wax flooring concessions in December Revenue $208.4 $206.6 ($1.8) • System-wide-sales fell short of Management's target % Growth (3.9%) (4.8%) (83bps) driven by softer transactions, which led to subsequent lower royalty revenue and product revenue Less: Cost of Revenue ($54.2) ($53.8) $0.4 • Pricing momentum softened with lower service DPU in December as a result of a change in mix, including Gross Profit $154.2 $152.8 ($1.4) lower Brazilian services as a % of total, and reduced benefit from earlier price increases % Margin 74.0% 73.9% (8bps) • The lower-than-expected total revenue translated into a shortfall in EBITDA Less: Total OpEx ($80.0) ($79.6) $0.4 Adj. EBITDA $74.2 $73.2 ($1.0) % Margin 35.6% 35.4% (17bps) Content must not go below this line Source: Management guidance provided to Moelis on 02/08/2026, Management Proposed LRP (50% Achievability) provided to Moelis on 12/30/2025 Confidential | 8 1. Figures per Management Proposed LRP (50% Achievability) provided to Moelis on 12/30/2025 2. Figures per Elegant Management guidance provided to Moelis on 02/08/2026
3. Appendix Content must not go below this line Confidential | 9
A. Discounted Cash Flow Analysis Content must not go below this line Confidential | 10
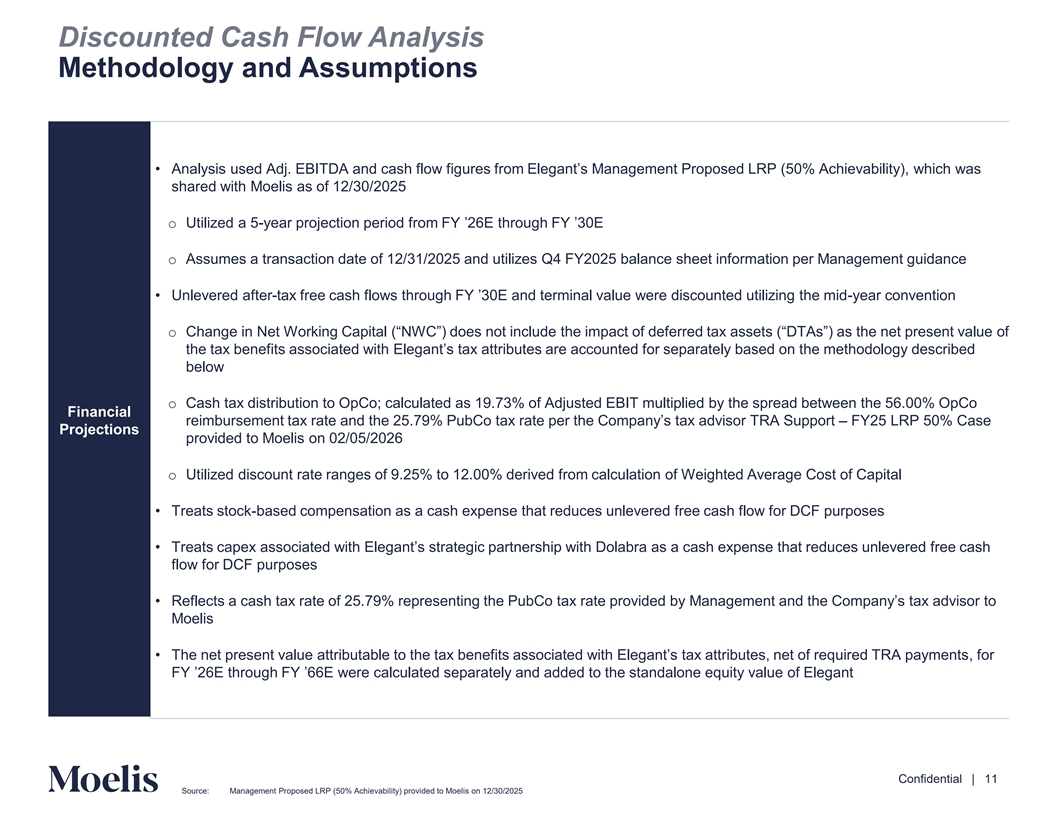
Discounted Cash Flow Analysis Methodology and Assumptions • Analysis used Adj. EBITDA and cash flow figures from Elegant’s Management Proposed LRP (50% Achievability), which was shared with Moelis as of 12/30/2025 o Utilized a 5-year projection period from FY ’26E through FY ’30E o Assumes a transaction date of 12/31/2025 and utilizes Q4 FY2025 balance sheet information per Management guidance • Unlevered after-tax free cash flows through FY ’30E and terminal value were discounted utilizing -tyhe ea rm con id vention o Change in Net Working Capital (“NWC”) does not include the impact of deferred tax assets (“DTAs”) as the net present value of the tax benefits associated with Elegant’s tax attributes are accounted for separately based on the methodology described below o Cash tax distribution to OpCo; calculated as 19.73% of Adjusted EBIT multiplied by the spread between the 56.00% OpCo Financial reimbursement tax rate and the 25.7 % PubCo tax rate per the Company’s tax advisor TRA –S FY25 upporLRP t 50% Case Projections provided to Moelis on 02/05/2026 o Utilized discount rate ranges of 9.25% to 12.00% derived from calculation of Weighted Average Cost of Capital • Treats stock-based compensation as a cash expense that reduces unlevered free cash flow for DCF purposes • Treats capex associated with Elegant’s strategic partnership with Dolabra as a cash expense that reduces unlevered free cash flow for DCF purposes • Reflects a cash tax rate of 25.7 % representing the PubCo tax rate provided by Management and the Company’s tax advisor to Moelis • The net present value attributable to the tax benefits associated with Elegant’s tax attributes, net of required TRA, fpa or yments FY ’26E through FY ’66E were calculated separately and added to the standalone equity value of Elegant Content must not go below this line Confidential | 11 Source: Management Proposed LRP (50% Achievability) provided to Moelis on 12/30/2025
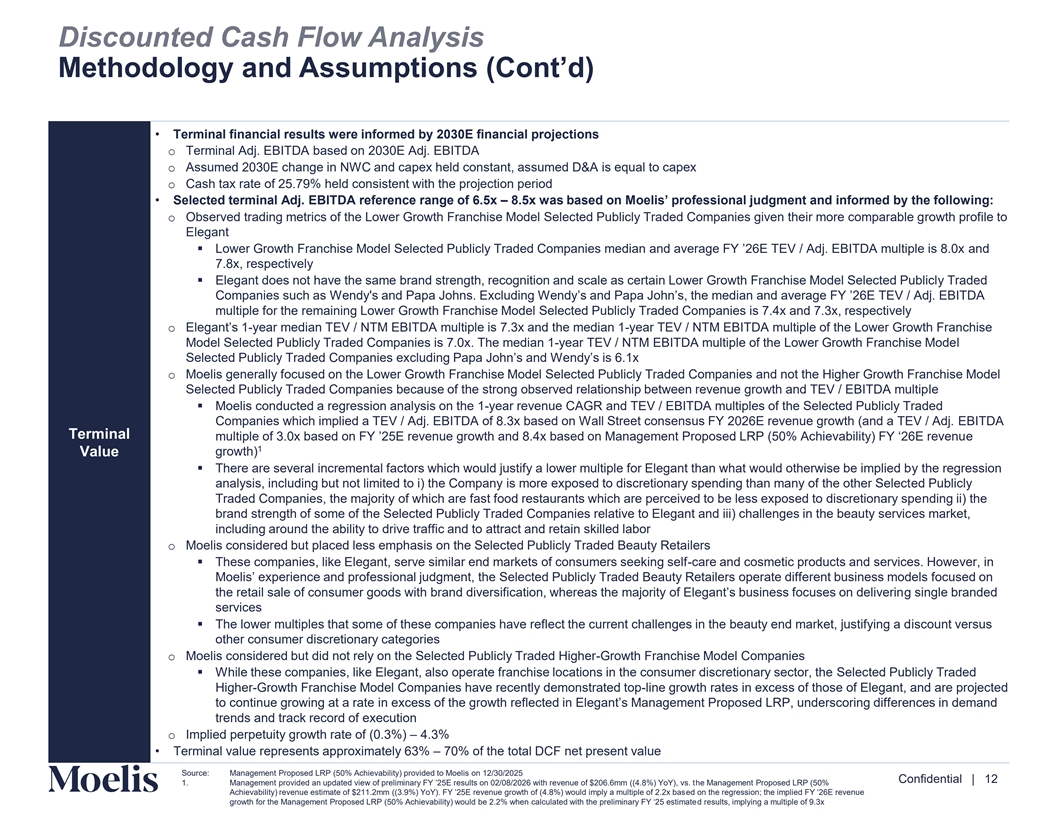
Discounted Cash Flow Analysis Methodology and Assumptions (Cont’d) • Terminal financial results were informed by 2030E financial projections o Terminal Adj. EBITDA based on 2030E Adj. EBITDA o Assumed 2030E change in NWC and capex held constant, assumed D&A is equal to capex o Cash tax rate of 25.79% held consistent with the projection period • Selected terminal Adj. EBITDA reference range of 6.5x – 8.5x was based on Moelis’ professional judgment and informed by th oe wing foll: o Observed trading metrics of the Lower Growth Franchise Model Selected Publicly Traded Companies given their more comparable growth profile to Elegant ▪ Lower Growth Franchise Model Selected Publicly Traded Companies median and average FY ’26E TEV / Adj. EBITDA multi pl ane d is .0x 7.8x, respectively ▪ Elegant does not have the same brand strength, recognition and scale as certain Lower Growth Franchise Model Selected Publicly Traded Companies such as Wendy's and Papa Johns. Excluding Wendy’s and Papa John’s, the median and average FY ’26E TEV / A dj. EBITDA multiple for the remaining Lower Growth Franchise Model Selected Publicly Traded Companies is 7.4x and 7.3x, respectively o Elegant’s 1-year median TEV / NTM EBITDA multiple is 7.3x and the median 1-year TEV / NTM EBITDA multiple of the Lower Growth Franchise Model Selected Publicly Traded Companies is 7.0x. The median 1-year TEV / NTM EBITDA multiple of the Lower Growth Franchise Model Selected Publicly Traded Companies excluding Papa John’s and Wendy’s is 6.1x o Moelis generally focused on the Lower Growth Franchise Model Selected Publicly Traded Companies and not the Higher Growth Franchise Model Selected Publicly Traded Companies because of the strong observed relationship between revenue growth and TEV / EBITDA multiple ▪ Moelis conducted a regression analysis on the 1-year revenue CAGR and TEV / EBITDA multiples of the Selected Publicly Traded Companies which implied a TEV / Adj. EBITDA of 8.3x based on Wall Street consensus FY 2026E revenue growth (and a TEV / Adj. EBITDA Terminal multiple of 3.0x based on FY ’25E revenue growth and . x based on Management Proposed LRP (50% Achievability) FY ‘e 26E revenu 1 Value growth) ▪ There are several incremental factors which would justify a lower multiple for Elegant than what would otherwise be implied by the regression analysis, including but not limited to i) the Company is more exposed to discretionary spending than many of the other Selected Publicly Traded Companies, the majority of which are fast food restaurants which are perceived to be less exposed to discretionary spending ii) the brand strength of some of the Selected Publicly Traded Companies relative to Elegant and iii) challenges in the beauty services market, including around the ability to drive traffic and to attract and retain skilled labor o Moelis considered but placed less emphasis on the Selected Publicly Traded Beauty Retailers ▪ These companies, like Elegant, serve similar end markets of consumers seeking self-care and cosmetic products and services. However, in Moelis’ experience and professional judgment, the Selected Publicly Traded Beauty Retailers operate different business models focused on the retail sale of consumer goods with brand diversification, whereas the majority of Elegant’s business focuses on g sdel ingl ive erin branded services ▪ The lower multiples that some of these companies have reflect the current challenges in the beauty end market, justifying a discount versus other consumer discretionary categories o Moelis considered but did not rely on the Selected Publicly Traded Higher-Growth Franchise Model Companies ▪ While these companies, like Elegant, also operate franchise locations in the consumer discretionary sector, the Selected Publicly Traded Higher-Growth Franchise Model Companies have recently demonstrated top-line growth rates in excess of those of Elegant, and are projected to continue growing at a rate in excess of the growth reflected in Elegant’s Management Proposed LRP, underscoring differences in demand trends and track record of execution o Implied perpetuity growth rate of (0.3%) – 4.3% Content must not • Terminal value represents approximately 63% – 70% of the total DCF net present value go below this line Source: Management Proposed LRP (50% Achievability) provided to Moelis on 12/30/2025 Confidential | 12 1. Management provided an updated view of preliminary FY ’25E results on 02/0 /2026 with revenue of $206.6mm (( . %) he YoY M)a, nvs. agetment Proposed LRP (50% Achievability) revenue estimate of $211.2mm ((3. %) YoY). FY ’25E revenue growth of ( . %) would imply a multiple o ed f 2o.2 n t x b hea sregression; the implied FY ‘26E revenue growth for the Management Proposed LRP (50% Achievability) would be 2.2% when calculated with the preliminary FY ‘25 d e resti sum lts, ate implying a multiple of 9.3x
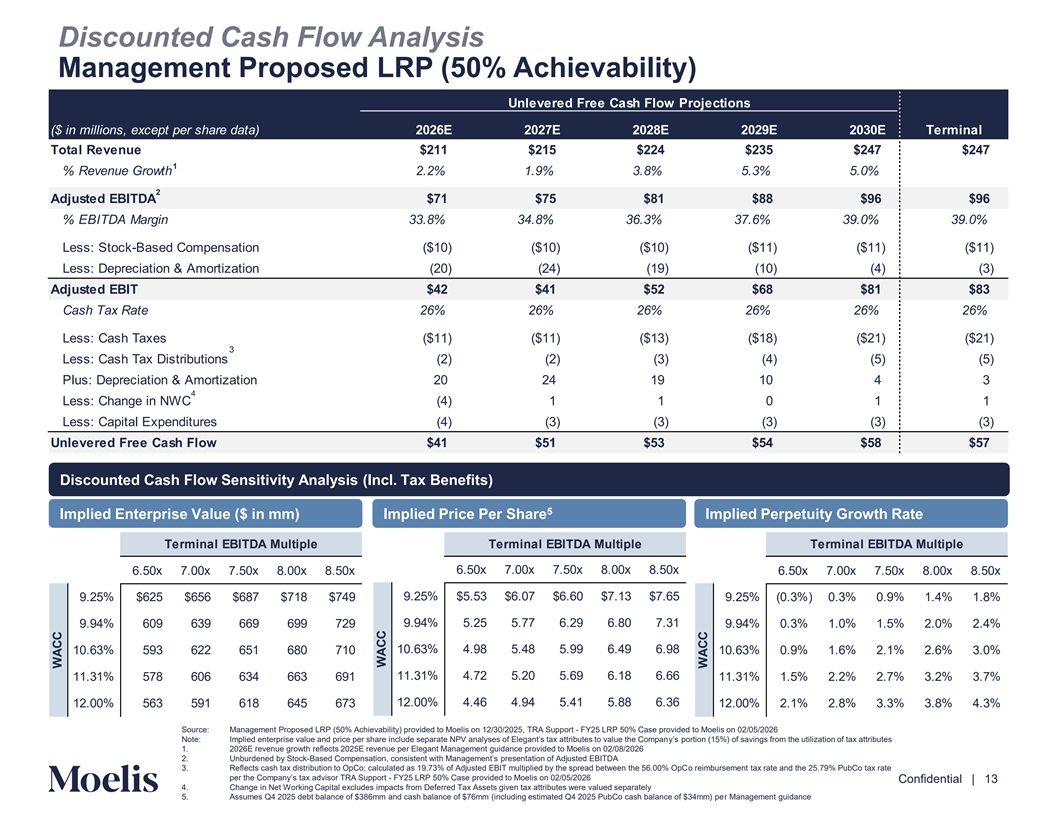
Discounted Cash Flow Analysis Management Proposed LRP (50% Achievability) Unlevered Free Cash Flow Projections ($ in millions, except per share data) 2026E 2027E 2028E 2029E 2030E Terminal Total Revenue $211 $215 $224 $235 $247 $247 1 % Revenue Growth 2.2% 1.9% 3.8% 5.3% 5.0% 2 Adjusted EBITDA $71 $75 $81 $88 $96 $96 % EBITDA Margin 33.8% 34.8% 36.3% 37.6% 39.0% 39.0% Less: Stock-Based Compensation ($10) ($10) ($10) ($11) ($11) ($11) Less: Depreciation & Amortization (20) (24) (19) (10) (4) (3) Adjusted EBIT $42 $41 $52 $68 $81 $83 Cash Tax Rate 26% 26% 26% 26% 26% 26% Less: Cash Taxes ($11) ($11) ($13) ($18) ($21) ($21) 3 Less: Cash Tax Distributions (2) (2) (3) (4) (5) (5) Plus: Depreciation & Amortization 20 24 19 10 4 3 4 Less: Change in NWC (4) 1 1 0 1 1 Less: Capital Expenditures (4) (3) (3) (3) (3) (3) Unlevered Free Cash Flow $41 $51 $53 $54 $58 $57 Discounted Cash Flow Sensitivity Analysis (Incl. Tax Benefits) 5 Implied Enterprise Value ($ in mm) Implied Price Per Share Implied Perpetuity Growth Rate Terminal EBITDA Multiple Terminal EBITDA Multiple Terminal EBITDA Multiple 6.50x 7.00x 7.50x 8.00x 8.50x 6.50x 7.00x 7.50x 8.00x 8.50x 6.50x 7.00x 7.50x 8.00x 8.50x 9.25% $5.53 $6.07 $6.60 $7.13 $7.65 9.25% $625 $656 $687 $718 $749 9.25% (0.3%) 0.3% 0.9% 1.4% 1.8% 9.94% 5.25 5.77 6.29 6.80 7.31 9.94% 609 639 669 699 729 9.94% 0.3% 1.0% 1.5% 2.0% 2.4% 10.63% 4.98 5.48 5.99 6.49 6.98 10.63% 593 622 651 680 710 10.63% 0.9% 1.6% 2.1% 2.6% 3.0% 11.31% 4.72 5.20 5.69 6.18 6.66 11.31% 578 606 634 663 691 11.31% 1.5% 2.2% 2.7% 3.2% 3.7% 12.00% 4.46 4.94 5.41 5.88 6.36 12.00% 563 591 618 645 673 12.00% 2.1% 2.8% 3.3% 3.8% 4.3% Source: Management Proposed LRP (50% Achievability) provided to Moelis on 12/30/2025, TRA Support - FY25 LRP 50% Case provided to Moelis on 02/05/2026 Note: Implied enterprise value and price per share include separate NPV analyses of Elegant’s tax attributes to value thy’s e Com porptiaonn (15%) of savings from the utilization of tax attributes 1. 2026E revenue growth reflects 2025E revenue per Elegant Management guidance provided to Moelis on 02/08/2026 Content must not 2. Unburdened by Stock-Based Compensation, consistent with Management’s presentation of Adjusted EBITDA 3. Reflects cash tax distribution to OpCo; calculated as 19.73% of Adjusted EBIT multiplied by the spread between the 56.00% OpCo reimbursement tax rate and the 25.79% PubCo tax rate go below this line per the Company’s tax advisor TRA Supp-o Frt Y25 LRP 50% Case provided to Moelis on 02/05/2026 Confidential | 13 4. Change in Net Working Capital excludes impacts from Deferred Tax Assets given tax attributes were valued separately 5. Assumes Q4 2025 debt balance of $386mm and cash balance of $76mm (including estimated Q4 2025 PubCo cash balance of $34mm) per Management guidance WACC WACC WACC
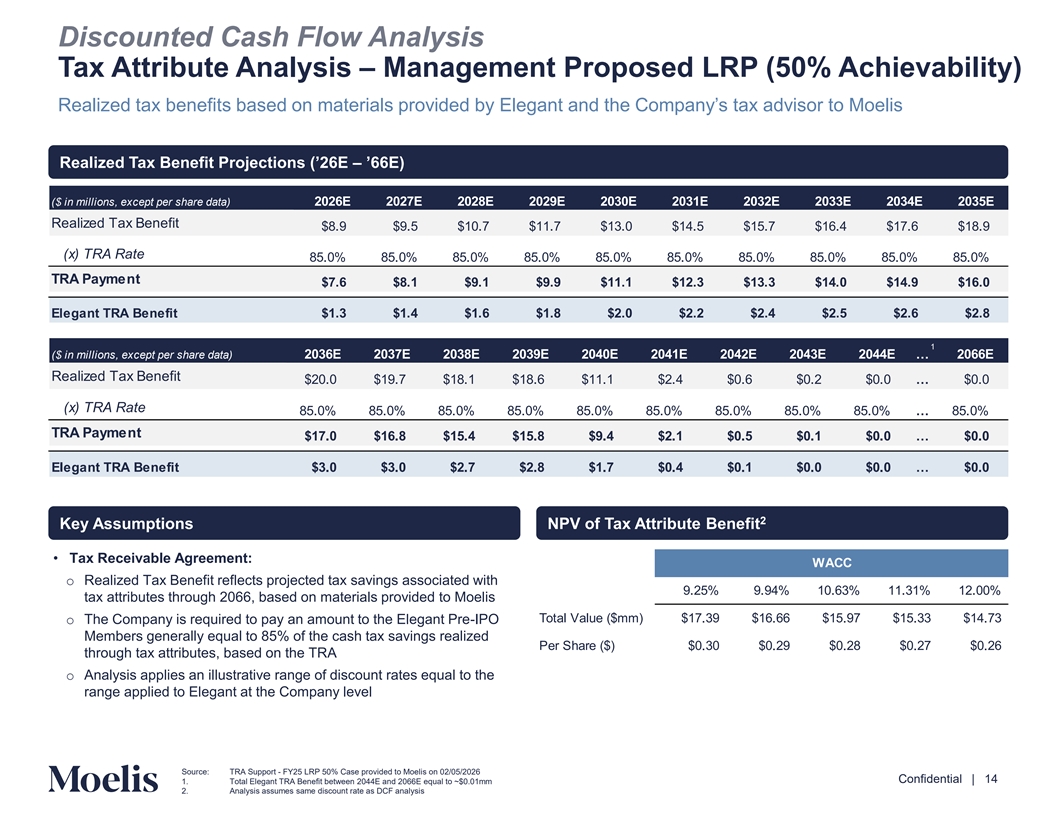
Discounted Cash Flow Analysis Tax Attribute Analysis – Management Proposed LRP (50% Achievability) Realized tax benefits based on materials provided by Elegant and the Company’s tax advisor to Moelis Realized Tax Benefit Projections (’26–E ’66E) ($ in millions, except per share data) 2026E 2027E 2028E 2029E 2030E 2031E 2032E 2033E 2034E 2035E Realized Tax Benefit $8.9 $9.5 $10.7 $11.7 $13.0 $14.5 $15.7 $16.4 $17.6 $18.9 (x) TRA Rate 85.0% 85.0% 85.0% 85.0% 85.0% 85.0% 85.0% 85.0% 85.0% 85.0% TRA Payment $7.6 $8.1 $9.1 $9.9 $11.1 $12.3 $13.3 $14.0 $14.9 $16.0 Elegant TRA Benefit $1.3 $1.4 $1.6 $1.8 $2.0 $2.2 $2.4 $2.5 $2.6 $2.8 1 ($ in millions, except per share data) 2036E 2037E 2038E 2039E 2040E 2041E 2042E 2043E 2044E … 2066E Realized Tax Benefit $20.0 $19.7 $18.1 $18.6 $11.1 $2.4 $0.6 $0.2 $0.0 … $0.0 (x) TRA Rate 85.0% 85.0% 85.0% 85.0% 85.0% 85.0% 85.0% 85.0% 85.0% … 85.0% TRA Payment $17.0 $16.8 $15.4 $15.8 $9.4 $2.1 $0.5 $0.1 $0.0 … $0.0 Elegant TRA Benefit $3.0 $3.0 $2.7 $2.8 $1.7 $0.4 $0.1 $0.0 $0.0 … $0.0 2 Key Assumptions NPV of Tax Attribute Benefit • Tax Receivable Agreement: WACC o Realized Tax Benefit reflects projected tax savings associated with 9.25% 9.94% 10.63% 11.31% 12.00% tax attributes through 2066, based on materials provided to Moelis Total Value ($mm) $17.39 $16.66 $15.97 $15.33 $14.73 o The Company is required to pay an amount to the Elegant Pre-IPO Members generally equal to 85% of the cash tax savings realized Per Share ($) $0.30 $0.29 $0.28 $0.27 $0.26 through tax attributes, based on the TRA o Analysis applies an illustrative range of discount rates equal to the range applied to Elegant at the Company level Content must not go below this line Source: TRA Support - FY25 LRP 50% Case provided to Moelis on 02/05/2026 Confidential | 14 1. Total Elegant TRA Benefit between 2044E and 2066E equal to ~$0.01mm 2. Analysis assumes same discount rate as DCF analysis
B. Selected Publicly Traded Companies Analysis Content must not go below this line Confidential | 15
Selected Publicly Traded Companies Analysis Methodologies & Assumptions Analysis reflects implied enterprise value to EBITDA multiples based on trading multiples of the selected publicly traded companies deemed generally relevant by Moelis in certain respects to Elegant • Moelis selected the publicly traded companies for Elegant based on the following criteria: o Franchisor business models with at least 50% franchised units o Exposure to discretionary consumer spending o Market Capitalization of $300mm to $50bn • Moelis considered publicly traded companies in the discretionary restaurant services and wellness services (i.e., fitness) industry with at least 50% of units operating under a franchise model to be the most relevant o Companies exposed to discretionary consumer services and beauty, health and wellness trends are exposed to similar consumer dynamics as Elegant o Companies with over 50% franchised units have similar operating characteristics as Elegant (e.g., asset light) o Over % of Elegant’s units are franchised o Moelis considered that beauty service companies like Elegant face unique business model challenges compared to restaurant services • The labor structure of beauty service companies is more complex and demands more specialized employees • Beauty services are considered more discretionary in nature compared to restaurants, which can be viewed as more of a value play and necessity o Additionally, Moelis considered that brand recognition and scale within the restaurant and wellness services industry serves as a significant competitive moat and drives awareness and subsequent traffic • Moelis also considered publicly traded companies that operate as beauty retailers are also considered to be relevant to Elegant, but less so than franchise business models o Beauty retailers are exposed to similar consumer dynamics as beauty, health and wellness retailers regarding importance of driving traffic and discretionary income dynamics o However, beauty retailers differ from franchise models in two major ways • Beauty retailers operate as corporate-owned stores, not as franchised stores, and therefore operate under different operating characteristics (e.g., asset light) • Beauty retailers sell branded goods instead of a service, making them less susceptible to labor market dynamics than a service business Content must not go below this line Confidential | 16 Source: Company filings, LSEG estimates, S&P Capital IQ as of 02/06/2026
Selected Publicly Traded Companies Analysis Methodologies & Assumptions (Cont’d) Analysis reflects implied enterprise value to EBITDA multiples based on trading multiples of the selected publicly traded companies deemed generally relevant by Moelis in certain respects to Elegant • Both franchise service businesses and beauty retailers have public trading multiples that are highly informed by their respective projected growth rates o To determine whether a company should be considered higher growth vs. lower growth, Moelis considered: (i) whether the Company is expected to have a greater than 5% revenue CAGR over the next two years and (ii) other factors as deemed appropriate, including size and historical growth rates • For example, RBI was classified as a Higher Growth Selected Publicly Traded Company; although it is only expected to grow at a rate of 3.5%, it has grown at a high growth rate historically, has strong international growth and is growing off a large base of ~$9.4bn in revenue • Xponential Fitness was classified as a Lower Growth Selected Publicly Traded Company; although it is expected to grow at a rate of 6.1%, it is recovering from lower growth with a historical revenue CAGR of (2.0%) • Driven Brands was classified as a Higher Growth Selected Publicly Traded Company; although its historical growth rate is (9.9%), this metric was negatively impacted by the divestiture of its U.S. car wash business in April 2025 (16% of FY24 revenue); it is expected to grow at a rate of 10.1% o Lower Growth Franchise Models trade at a median TEV / 2026E Adj. EBITDA multiple of 8.0x • Given Elegant’s historical and projected growth profile, Moelis considered the -grow lowerth franchise models to be more relevant and didn’t rely on the higher-growth bucket to determine the multiple range • While Elegant is a recognizable brand, Moelis considered the superior brand strength and scale of Wendy’s and Papa e Joh dete nsr mwini hing l the multiple range. Excluding Wendy’s and Papa Johns, the median TEV / 2026E Adj. EBITDA multiple for the remaining Low Fr era nG cr ho isw eth M odel Selected Publicly Traded Companies is 7.4x • Further, Moelis considered that a discount to restaurant and fitness service companies may be warranted due to challenges across the beauty services space o A regression analysis comparing the selected publicly traded company set’s TEV / 2026E Adj. EBITDA multi-pl year e an rev d enue C 1 AGR from 2025E – 1 2026E returns a correlation of 0.7223 • Based on Elegant’s Wall Street consensus FY 2026E revenue growth of 1.3% from –20 2025 26EE , this implies a TEV / 2026E EBITDA multiple of 8.3x • Based on Elegant’s LRP (50% Achievability) revenue growth of 1. % from 20 – 20 2526 E E, this implies a TEV / 2026E EBITDA multiple of 8.4x • If Elegant repeats its FY 2025E revenue growth per the Elegant LRP (50% Achievability) of (3.9%), this implies a TEV / 2026E EBITDA multiple of 3.0x • There are several incremental factors which would justify a lower multiple for Elegant than what would otherwise be implied by the regression analysis, including but not limited to i) the Company is more exposed to discretionary spending than many of the other Selected Publicly Traded Companies, the majority of which are fast food restaurants which are perceived to be less exposed to discretionary spending ii) the brand strength of some of the Selected Publicly Traded Companies relative to Elegant and iii) challenges in the beauty services market, including around the ability to drive traffic and to attract and retain skilled labor • Based on the above factors, Moelis used its professional judgment to select a TEV / 2026E EBITDA publicly traded multiple range of 6.5x – 8.5x o The multiple range was informed by the median TEV / 2026E Adj. EBITDA multiple of the lower-growth publicly traded franchise consumer service companies of .0x, Elegant’s low historical growth rate and low consensus growth rate estimates, the challenging envac iron rosm sen the t beauty services industry, which may warrant a discount to companies in the restaurant and fitness industries, and Elegant’s 1-year median TEV / NTM trading multiple of 7.3x and current TEV / FY ’26E multiple of 7.3x based on consensus estimates Content must not go below this line Confidential | 17 Source: Company filings, LSEG estimates, S&P Capital IQ as of 02/06/2026 1. Jack in the Box was removed from the regression analysis due to the impact of the divestiture of Del Taco on sales growth
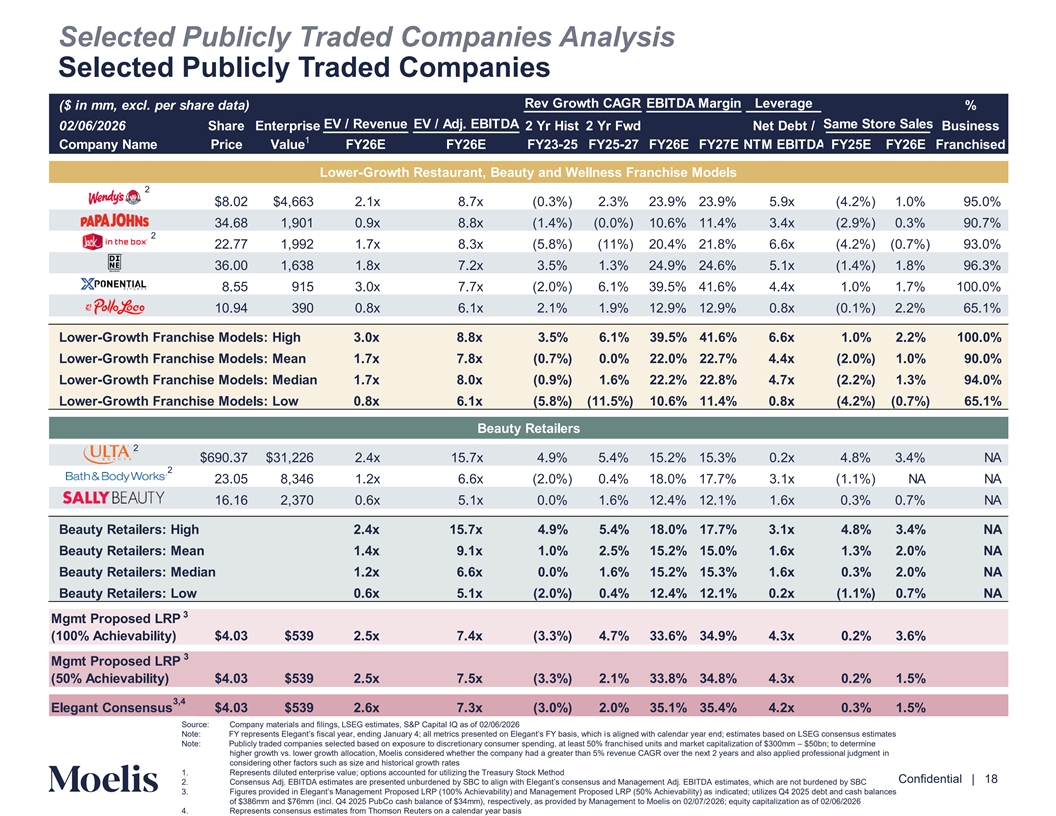
Selected Publicly Traded Companies Analysis Selected Publicly Traded Companies Rev Growth CAGR EBITDA Margin Leverage ($ in mm, excl. per share data) % EV / Revenue EV / Adj. EBITDA Same Store Sales 02/06/2026 Share Enterprise 2 Yr Hist 2 Yr Fwd Net Debt / Business 1 Company Name Price Value FY26E FY26E FY23-25 FY25-27 FY26E FY27E NTM EBITDA FY25E FY26E Franchised Lower-Growth Restaurant, Beauty and Wellness Franchise Models 2 $8.02 $4,663 2.1x 8.7x (0.3%) 2.3% 23.9% 23.9% 5.9x (4.2%) 1.0% 95.0% 34.68 1,901 0.9x 8.8x (1.4%) (0.0%) 10.6% 11.4% 3.4x (2.9%) 0.3% 90.7% 2 22.77 1,992 1.7x 8.3x (5.8%) (11%) 20.4% 21.8% 6.6x (4.2%) (0.7%) 93.0% 36.00 1,638 1.8x 7.2x 3.5% 1.3% 24.9% 24.6% 5.1x (1.4%) 1.8% 96.3% 8.55 915 3.0x 7.7x (2.0%) 6.1% 39.5% 41.6% 4.4x 1.0% 1.7% 100.0% 10.94 390 0.8x 6.1x 2.1% 1.9% 12.9% 12.9% 0.8x (0.1%) 2.2% 65.1% Lower-Growth Franchise Models: High 3.0x 8.8x 3.5% 6.1% 39.5% 41.6% 6.6x 1.0% 2.2% 100.0% Lower-Growth Franchise Models: Mean 1.7x 7.8x (0.7%) 0.0% 22.0% 22.7% 4.4x (2.0%) 1.0% 90.0% Lower-Growth Franchise Models: Median 1.7x 8.0x (0.9%) 1.6% 22.2% 22.8% 4.7x (2.2%) 1.3% 94.0% Lower-Growth Franchise Models: Low 0.8x 6.1x (5.8%) (11.5%) 10.6% 11.4% 0.8x (4.2%) (0.7%) 65.1% Beauty Retailers 2 $690.37 $31,226 2.4x 15.7x 4.9% 5.4% 15.2% 15.3% 0.2x 4.8% 3.4% NA 2 23.05 8,346 1.2x 6.6x (2.0%) 0.4% 18.0% 17.7% 3.1x (1.1%) NA NA 16.16 2,370 0.6x 5.1x 0.0% 1.6% 12.4% 12.1% 1.6x 0.3% 0.7% NA Beauty Retailers: High 2.4x 15.7x 4.9% 5.4% 18.0% 17.7% 3.1x 4.8% 3.4% NA Beauty Retailers: Mean 1.4x 9.1x 1.0% 2.5% 15.2% 15.0% 1.6x 1.3% 2.0% NA Beauty Retailers: Median 1.2x 6.6x 0.0% 1.6% 15.2% 15.3% 1.6x 0.3% 2.0% NA Beauty Retailers: Low 0.6x 5.1x (2.0%) 0.4% 12.4% 12.1% 0.2x (1.1%) 0.7% NA 3 Mgmt Proposed LRP (100% Achievability) $4.03 $539 2.5x 7.4x (3.3%) 4.7% 33.6% 34.9% 4.3x 0.2% 3.6% 3 Mgmt Proposed LRP (50% Achievability) $4.03 $539 2.5x 7.5x (3.3%) 2.1% 33.8% 34.8% 4.3x 0.2% 1.5% 3,4 Elegant Consensus $4.03 $539 2.6x 7.3x (3.0%) 2.0% 35.1% 35.4% 4.2x 0.3% 1.5% Source: Company materials and filings, LSEG estimates, S&P Capital IQ as of 02/06/2026 Note: FY represents Elegant’s fiscal year, ending January ; all metrics presented on Elegant’s Fs Ya lb igansi es, d ww ith hi ca ch lei ndar year end; estimates based on LSEG consensus estimates Note: Publicly traded companies selected based on exposure to discretionary consumer spending, at least 50% franchised units and market capitalization of $300mm – $50bn; to determine Content must not higher growth vs. lower growth allocation, Moelis considered whether the company had a greater than 5% revenue CAGR over the next 2 years and also applied professional judgment in considering other factors such as size and historical growth rates go below this line 1. Represents diluted enterprise value; options accounted for utilizing the Treasury Stock Method Confidential | 18 2. Consensus Adj. EBITDA estimates are presented unburdened by SBC to align with Elegant’s consensus and Management Adj. estEiB mIT ate DA s, which are not burdened by SBC 3. Figures provided in Elegant’s Management Proposed LRP (100% Achievability) and Management Proposed LRP (50% Achieva b inildity) ica te as d; utilizes Q4 2025 debt and cash balances of $386mm and $76mm (incl. Q4 2025 PubCo cash balance of $34mm), respectively, as provided by Management to Moelis on 02/07/2026; equity capitalization as of 02/06/2026 4. Represents consensus estimates from Thomson Reuters on a calendar year basis
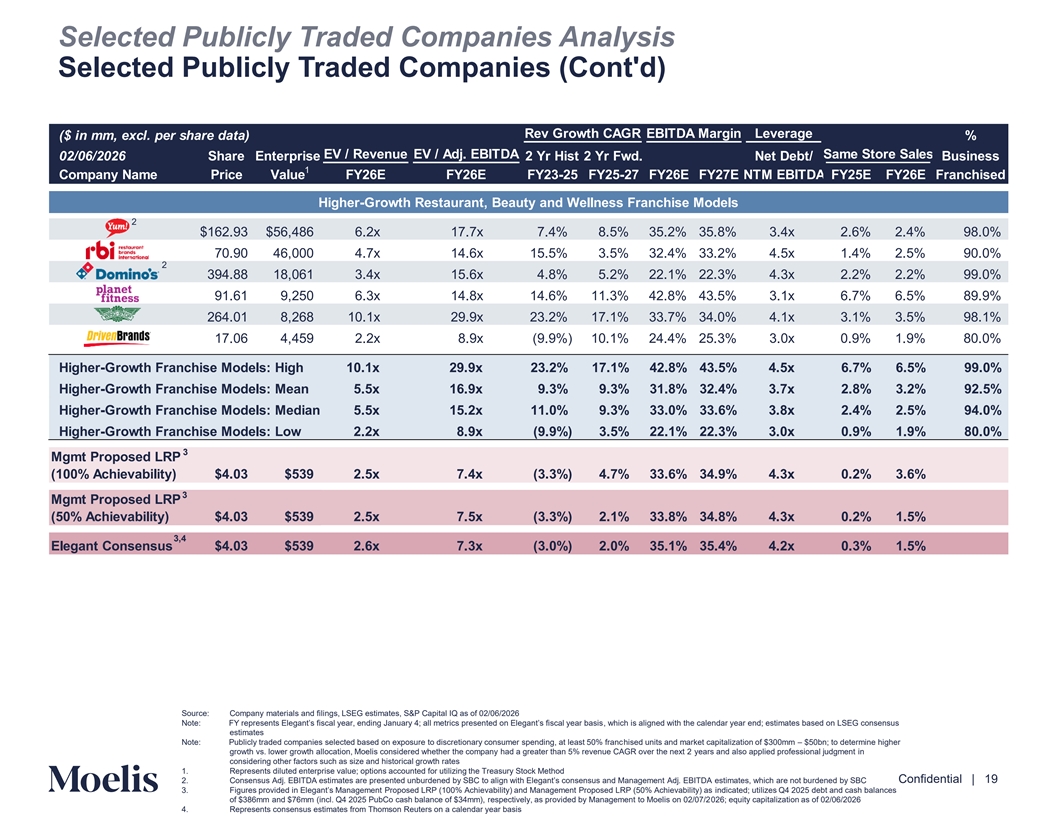
Selected Publicly Traded Companies Analysis Selected Publicly Traded Companies (Cont'd) Rev Growth CAGR EBITDA Margin Leverage ($ in mm, excl. per share data) % EV / Revenue EV / Adj. EBITDA Same Store Sales 02/06/2026 Share Enterprise 2 Yr Hist 2 Yr Fwd. Net Debt/ Business 1 Company Name Price Value FY26E FY26E FY23-25 FY25-27 FY26E FY27E NTM EBITDA FY25E FY26E Franchised Higher-Growth Restaurant, Beauty and Wellness Franchise Models 2 $162.93 $56,486 6.2x 17.7x 7.4% 8.5% 35.2% 35.8% 3.4x 2.6% 2.4% 98.0% 70.90 46,000 4.7x 14.6x 15.5% 3.5% 32.4% 33.2% 4.5x 1.4% 2.5% 90.0% 2 394.88 18,061 3.4x 15.6x 4.8% 5.2% 22.1% 22.3% 4.3x 2.2% 2.2% 99.0% 91.61 9,250 6.3x 14.8x 14.6% 11.3% 42.8% 43.5% 3.1x 6.7% 6.5% 89.9% 264.01 8,268 10.1x 29.9x 23.2% 17.1% 33.7% 34.0% 4.1x 3.1% 3.5% 98.1% 17.06 4,459 2.2x 8.9x (9.9%) 10.1% 24.4% 25.3% 3.0x 0.9% 1.9% 80.0% Higher-Growth Franchise Models: High 10.1x 29.9x 23.2% 17.1% 42.8% 43.5% 4.5x 6.7% 6.5% 99.0% Higher-Growth Franchise Models: Mean 5.5x 16.9x 9.3% 9.3% 31.8% 32.4% 3.7x 2.8% 3.2% 92.5% Higher-Growth Franchise Models: Median 5.5x 15.2x 11.0% 9.3% 33.0% 33.6% 3.8x 2.4% 2.5% 94.0% Higher-Growth Franchise Models: Low 2.2x 8.9x (9.9%) 3.5% 22.1% 22.3% 3.0x 0.9% 1.9% 80.0% 3 Mgmt Proposed LRP (100% Achievability) $4.03 $539 2.5x 7.4x (3.3%) 4.7% 33.6% 34.9% 4.3x 0.2% 3.6% 3 Mgmt Proposed LRP (50% Achievability) $4.03 $539 2.5x 7.5x (3.3%) 2.1% 33.8% 34.8% 4.3x 0.2% 1.5% 3,4 Elegant Consensus $4.03 $539 2.6x 7.3x (3.0%) 2.0% 35.1% 35.4% 4.2x 0.3% 1.5% Source: Company materials and filings, LSEG estimates, S&P Capital IQ as of 02/06/2026 Note: FY represents Elegant’s fiscal year, ending January ; all metrics presented on Elegant’s f , isca which l ye is aar b liga nsi eds with the calendar year end; estimates based on LSEG consensus estimates Note: Publicly traded companies selected based on exposure to discretionary consumer spending, at least 50% franchised units and market capitalization of $300mm – $50bn; to determine higher growth vs. lower growth allocation, Moelis considered whether the company had a greater than 5% revenue CAGR over the next 2 years and also applied professional judgment in Content must not considering other factors such as size and historical growth rates go below this line 1. Represents diluted enterprise value; options accounted for utilizing the Treasury Stock Method Confidential | 19 2. Consensus Adj. EBITDA estimates are presented unburdened by SBC to align with Elegant’s consensus and Management Adj. estEiB mIT ate DA s, which are not burdened by SBC 3. Figures provided in Elegant’s Management Proposed LRP (100% Achievability) and Management Proposed LRP (50% Achieva b inildity) ica te as d; utilizes Q4 2025 debt and cash balances of $386mm and $76mm (incl. Q4 2025 PubCo cash balance of $34mm), respectively, as provided by Management to Moelis on 02/07/2026; equity capitalization as of 02/06/2026 4. Represents consensus estimates from Thomson Reuters on a calendar year basis
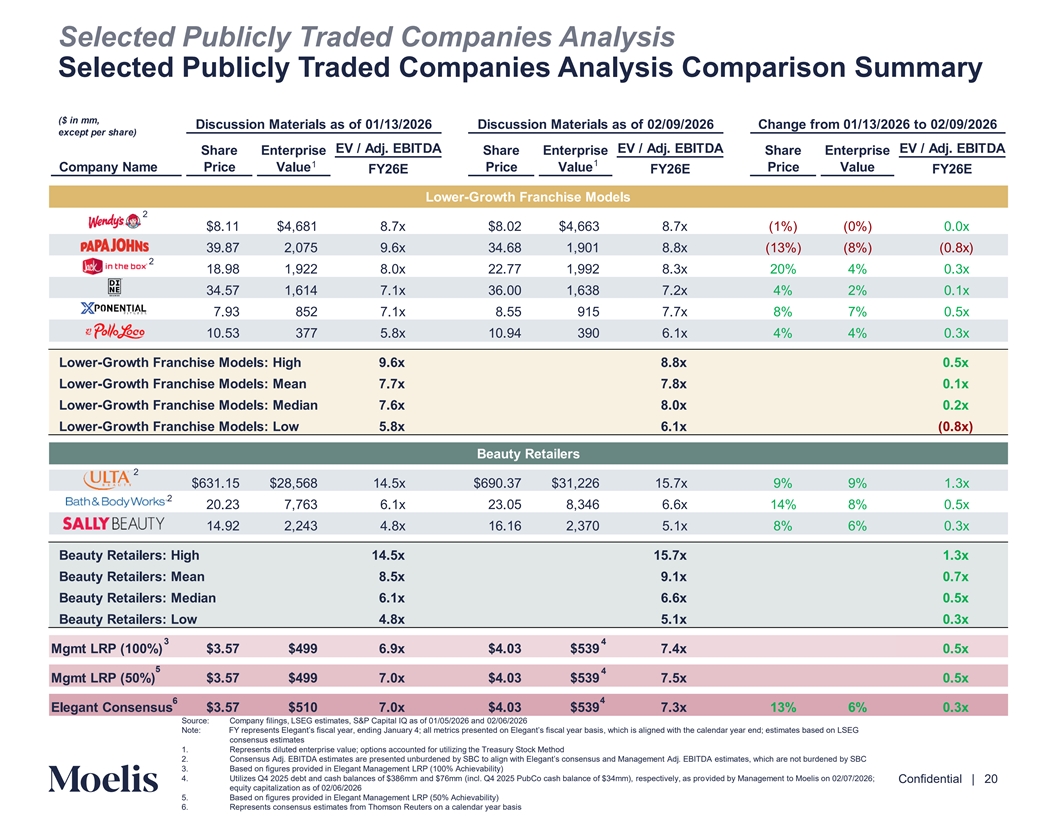
Selected Publicly Traded Companies Analysis Selected Publicly Traded Companies Analysis Comparison Summary ($ in mm, Discussion Materials as of 01/13/2026 Discussion Materials as of 02/09/2026 Change from 01/13/2026 to 02/09/2026 except per share) EV / Adj. EBITDA EV / Adj. EBITDA EV / Adj. EBITDA Share Enterprise Share Enterprise Share Enterprise 1 1 Company Name Price Value Price Value Price Value FY26E FY26E FY26E Lower-Growth Franchise Models 2 $8.11 $4,681 8.7x $8.02 $4,663 8.7x (1%) (0%) 0.0x 39.87 2,075 9.6x 34.68 1,901 8.8x (13%) (8%) (0.8x) 2 18.98 1,922 8.0x 22.77 1,992 8.3x 20% 4% 0.3x 34.57 1,614 7.1x 36.00 1,638 7.2x 4% 2% 0.1x 7.93 852 7.1x 8.55 915 7.7x 8% 7% 0.5x 10.53 377 5.8x 10.94 390 6.1x 4% 4% 0.3x Lower-Growth Franchise Models: High 9.6x 8.8x 0.5x Lower-Growth Franchise Models: Mean 7.7x 7.8x 0.1x Lower-Growth Franchise Models: Median 7.6x 8.0x 0.2x Lower-Growth Franchise Models: Low 5.8x 6.1x (0.8x) Beauty Retailers 2 $631.15 $28,568 14.5x $690.37 $31,226 15.7x 9% 9% 1.3x 2 20.23 7,763 6.1x 23.05 8,346 6.6x 14% 8% 0.5x 14.92 2,243 4.8x 16.16 2,370 5.1x 8% 6% 0.3x Beauty Retailers: High 14.5x 15.7x 1.3x Beauty Retailers: Mean 8.5x 9.1x 0.7x Beauty Retailers: Median 6.1x 6.6x 0.5x Beauty Retailers: Low 4.8x 5.1x 0.3x 3 4 Mgmt LRP (100%) $3.57 $499 6.9x $4.03 $539 7.4x 0.5x 5 4 Mgmt LRP (50%) $3.57 $499 7.0x $4.03 $539 7.5x 0.5x 6 4 Elegant Consensus $3.57 $510 7.0x $4.03 $539 7.3x 13% 6% 0.3x Source: Company filings, LSEG estimates, S&P Capital IQ as of 01/05/2026 and 02/06/2026 Note: FY represents Elegant’s fiscal year, ending January ; all metrics presented on Elegant’s fi , w sc hial ch i year s al ba ignsi eds with the calendar year end; estimates based on LSEG consensus estimates 1. Represents diluted enterprise value; options accounted for utilizing the Treasury Stock Method Content must not 2. Consensus Adj. EBITDA estimates are presented unburdened by SBC to align with Elegant’s consensus and Management Adj. estEiB mIT ate DA s, which are not burdened by SBC go below this line 3. Based on figures provided in Elegant Management LRP (100% Achievability) 4. Utilizes Q4 2025 debt and cash balances of $386mm and $76mm (incl. Q4 2025 PubCo cash balance of $34mm), respectively, as provided by Management to Moelis on 02/07/2026; Confidential | 20 equity capitalization as of 02/06/2026 5. Based on figures provided in Elegant Management LRP (50% Achievability) 6. Represents consensus estimates from Thomson Reuters on a calendar year basis
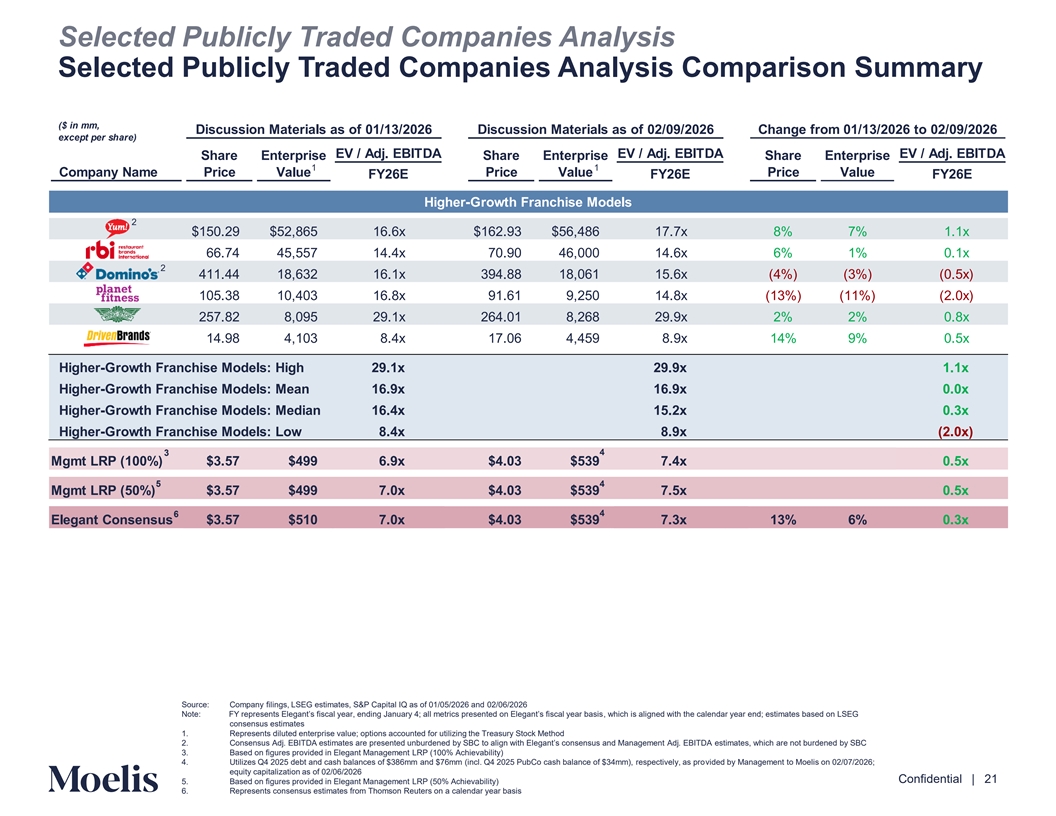
Selected Publicly Traded Companies Analysis Selected Publicly Traded Companies Analysis Comparison Summary ($ in mm, Discussion Materials as of 01/13/2026 Discussion Materials as of 02/09/2026 Change from 01/13/2026 to 02/09/2026 except per share) EV / Adj. EBITDA EV / Adj. EBITDA EV / Adj. EBITDA Share Enterprise Share Enterprise Share Enterprise 1 1 Company Name Price Value Price Value Price Value FY26E FY26E FY26E Higher-Growth Franchise Models 2 $150.29 $52,865 16.6x $162.93 $56,486 17.7x 8% 7% 1.1x 66.74 45,557 14.4x 70.90 46,000 14.6x 6% 1% 0.1x 2 411.44 18,632 16.1x 394.88 18,061 15.6x (4%) (3%) (0.5x) 105.38 10,403 16.8x 91.61 9,250 14.8x (13%) (11%) (2.0x) 257.82 8,095 29.1x 264.01 8,268 29.9x 2% 2% 0.8x 14.98 4,103 8.4x 17.06 4,459 8.9x 14% 9% 0.5x Higher-Growth Franchise Models: High 29.1x 29.9x 1.1x Higher-Growth Franchise Models: Mean 16.9x 16.9x 0.0x Higher-Growth Franchise Models: Median 16.4x 15.2x 0.3x Higher-Growth Franchise Models: Low 8.4x 8.9x (2.0x) 3 4 Mgmt LRP (100%) $3.57 $499 6.9x $4.03 $539 7.4x 0.5x 5 4 Mgmt LRP (50%) $3.57 $499 7.0x $4.03 $539 7.5x 0.5x 4 6 Elegant Consensus $3.57 $510 7.0x $4.03 $539 7.3x 13% 6% 0.3x Source: Company filings, LSEG estimates, S&P Capital IQ as of 01/05/2026 and 02/06/2026 Note: FY represents Elegant’s fiscal year, ending January ; all metrics presented on Elegant’s f , isca which l ye is aar b liga nsi eds with the calendar year end; estimates based on LSEG consensus estimates 1. Represents diluted enterprise value; options accounted for utilizing the Treasury Stock Method 2. Consensus Adj. EBITDA estimates are presented unburdened by SBC to align with Elegant’s consensus and Management Adj. estEiB mIT ate DA s, which are not burdened by SBC Content must not 3. Based on figures provided in Elegant Management LRP (100% Achievability) 4. Utilizes Q4 2025 debt and cash balances of $386mm and $76mm (incl. Q4 2025 PubCo cash balance of $34mm), respectively, as provided by Management to Moelis on 02/07/2026; go below this line equity capitalization as of 02/06/2026 Confidential | 21 5. Based on figures provided in Elegant Management LRP (50% Achievability) 6. Represents consensus estimates from Thomson Reuters on a calendar year basis
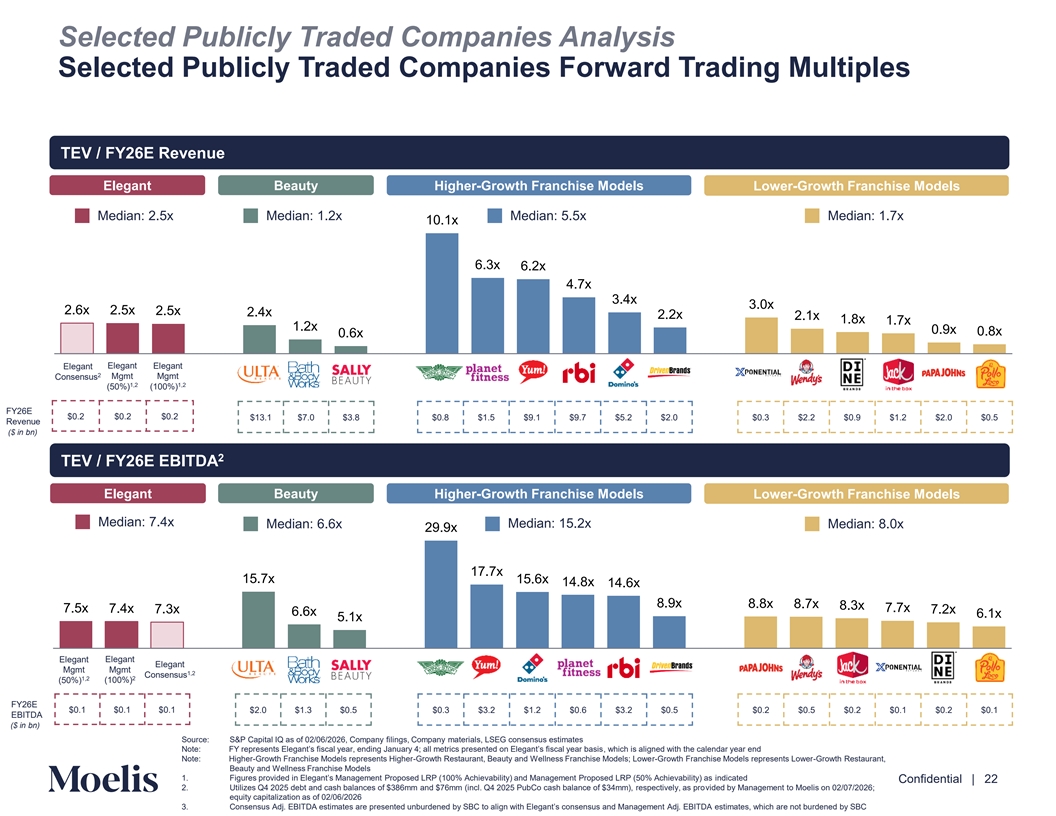
Selected Publicly Traded Companies Analysis Selected Publicly Traded Companies Forward Trading Multiples TEV / FY26E Revenue Elegant Beauty Higher-Growth Franchise Models Lower-Growth Franchise Models Median: 2.5x Median: 1.2x Median: 5.5x Median: 1.7x 10.1x 6.3x 6.2x 4.7x 3.4x 3.0x 2.6x 2.5x 2.5x 2.4x 2.2x 2.1x 1.8x 1.7x 1.2x 0.9x 0.8x 0.6x Elegant Elegant Elegant 2 Consensus Mgmt Mgmt 1,2 1,2 (50%) (100%) FY26E $0.2 $0.2 $0.2 $13.1 $7.0 $3.8 $0.8 $1.5 $9.1 $9.7 $5.2 $2.0 $0.3 $2.2 $0.9 $1.2 $2.0 $0.5 Revenue ($ in bn) 2 TEV Net Le / FY ve2 ra 6ge E EBITDA Elegant Beauty Higher-Growth Franchise Models Lower-Growth Franchise Models Median: 7.4x Median: 6.6x Median: 15.2x Median: 8.0x 29.9x 17.7x 15.7x 15.6x 14.8x 14.6x 8.9x 8.8x 8.7x 8.3x 7.7x 7.5x 7.4x 7.3x 7.2x 6.6x 6.1x 5.1x Elegant Elegant Elegant Mgmt Mgmt 1,2 Consensus 1,2 2 (100%) (50%) FY26E $0.1 $0.1 $0.1 $2.0 $1.3 $0.5 $0.3 $3.2 $1.2 $0.6 $3.2 $0.5 $0.2 $0.5 $0.2 $0.1 $0.2 $0.1 EBITDA ($ in bn) Source: S&P Capital IQ as of 02/06/2026, Company filings, Company materials, LSEG consensus estimates Note: FY represents Elegant’s fiscal year, ending January ; all metrics presented on Elegant’s f , isca which l ye is aar b liga nsi eds with the calendar year end Content must not Note: Higher-Growth Franchise Models represents Higher-Growth Restaurant, Beauty and Wellness Franchise Models; Lower-Growth Franchise Models represents Lower-Growth Restaurant, go below this line Beauty and Wellness Franchise Models 1. Figures provided in Elegant’s Management Proposed LRP (100% Achievability) and Management Proposed LRP (50% Achieva b inildity) ica te as d Confidential | 22 2. Utilizes Q4 2025 debt and cash balances of $386mm and $76mm (incl. Q4 2025 PubCo cash balance of $34mm), respectively, as provided by Management to Moelis on 02/07/2026; equity capitalization as of 02/06/2026 3. Consensus Adj. EBITDA estimates are presented unburdened by SBC to align with Elegant’s consensus and Management Adj. estEiB mIT ate DA s, which are not burdened by SBC
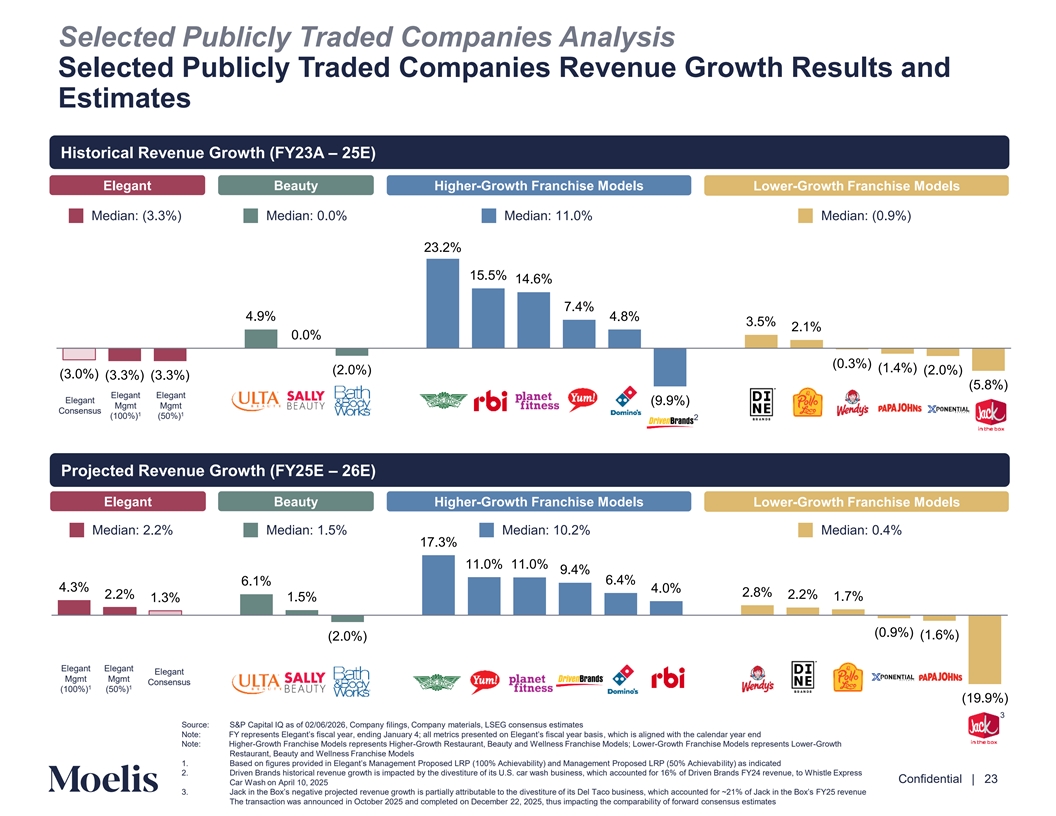
Selected Publicly Traded Companies Analysis Selected Publicly Traded Companies Revenue Growth Results and Estimates Historical Revenue Growth (FY23A – 25E) Elegant Beauty Higher-Growth Franchise Models Lower-Growth Franchise Models Median: (3.3%) Median: 0.0% Median: 11.0% Median: (0.9%) 23.2% 15.5% 14.6% 7.4% 4.9% 4.8% 3.5% 2.1% 0.0% (0.3%) (1.4%) (2.0%) (2.0%) (3.0%) (3.3%) (3.3%) (5.8%) Elegant Elegant Elegant (9.9%) Mgmt Mgmt Consensus 1 1 (100%) (50%) 2 Net Le Projected veraRev ge enue Growth (FY25E – 26E) Elegant Beauty Higher-Growth Franchise Models Lower-Growth Franchise Models Median: 2.2% Median: 1.5% Median: 10.2% Median: 0.4% 17.3% 11.0% 11.0% 9.4% 6.1% 6.4% 4.3% 4.0% 2.8% 2.2% 2.2% 1.5% 1.7% 1.3% (0.9%) (1.6%) (2.0%) Elegant Elegant Elegant Mgmt Mgmt Consensus 1 1 (100%) (50%) (19.9%) 3 Source: S&P Capital IQ as of 02/06/2026, Company filings, Company materials, LSEG consensus estimates Note: FY represents Elegant’s fiscal year, ending January ; all metrics presented on Elegant’s f , isca which l ye is aar b liga nsi eds with the calendar year end Note: Higher-Growth Franchise Models represents Higher-Growth Restaurant, Beauty and Wellness Franchise Models; Lower-Growth Franchise Models represents Lower-Growth Content must not Restaurant, Beauty and Wellness Franchise Models 1. Based on figures provided in Elegant’s Management Proposed LRP (100% Achievability) and Management Proposed LRP (50% iliAty) ch iaes i vanbdicated go below this line 2. Driven Brands historical revenue growth is impacted by the divestiture of its U.S. car wash business, which accounted for 16% of Driven Brands FY24 revenue, to Whistle Express Confidential | 23 Car Wash on April 10, 2025 3. Jack in the Box’s negative projected revenue growth is partially attributable to the divestiture of its Del Taco bu ich sine accoun ss, whted for ~21% of Jack in the Box’s FY25 revenue The transaction was announced in October 2025 and completed on December 22, 2025, thus impacting the comparability of forward consensus estimates
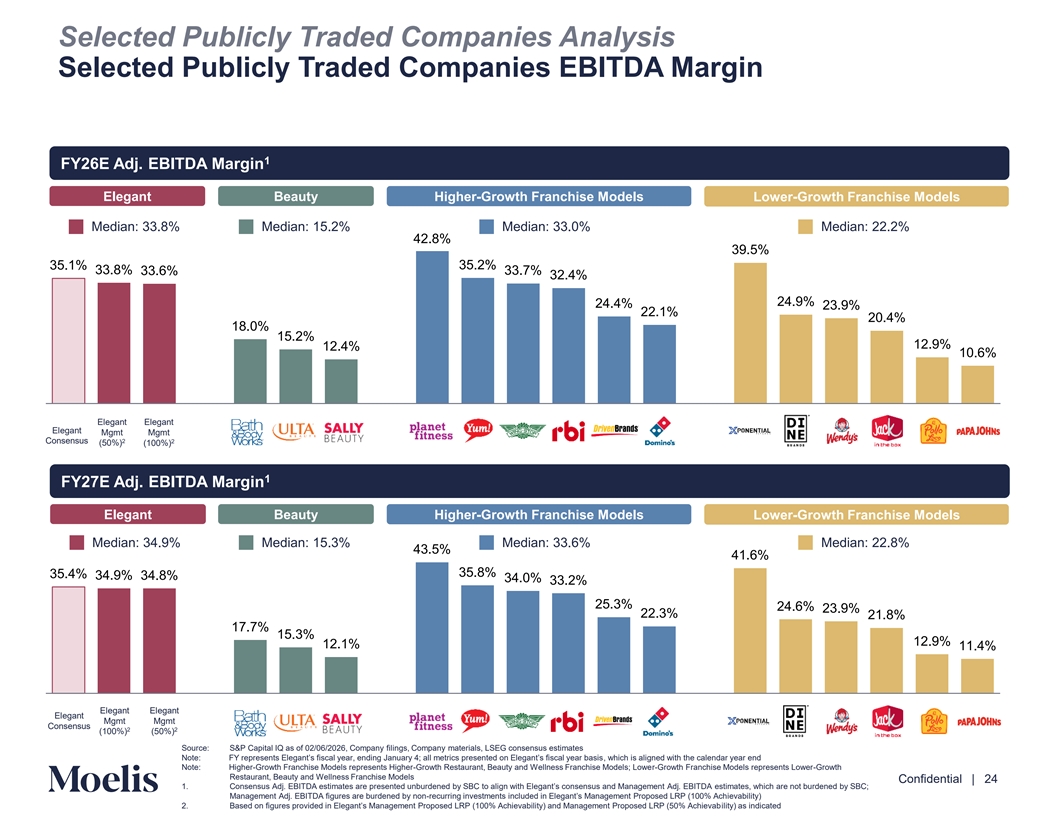
Selected Publicly Traded Companies Analysis Selected Publicly Traded Companies EBITDA Margin 1 FY26E Adj. EBITDA Margin Elegant Beauty Higher-Growth Franchise Models Lower-Growth Franchise Models Median: 33.8% Median: 15.2% Median: 33.0% Median: 22.2% 42.8% 39.5% 35.1% 35.2% 33.8% 33.7% 33.6% 32.4% 24.9% 24.4% 23.9% 22.1% 20.4% 18.0% 15.2% 12.9% 12.4% 10.6% Elegant Elegant Elegant Mgmt Mgmt Consensus 2 2 (50%) (100%) 1 FY Net Le 27E v A edj ra. ge EBITDA Margin Elegant Beauty Higher-Growth Franchise Models Lower-Growth Franchise Models Median: 34.9% Median: 15.3% Median: 33.6% Median: 22.8% 43.5% 41.6% 35.8% 35.4% 34.9% 34.8% 34.0% 33.2% 25.3% 24.6% 23.9% 22.3% 21.8% 17.7% 15.3% 12.9% 12.1% 11.4% Elegant Elegant Elegant Mgmt Mgmt Consensus 2 2 (100%) (50%) a Source: S&P Capital IQ as of 02/06/2026, Company filings, Company materials, LSEG consensus estimates Content must not Note: FY represents Elegant’s fiscal year, ending January ; all metrics presented on Elegant’s f , isca which l ye is aar b liga nsi eds with the calendar year end Note: Higher-Growth Franchise Models represents Higher-Growth Restaurant, Beauty and Wellness Franchise Models; Lower-Growth Franchise Models represents Lower-Growth go below this line Restaurant, Beauty and Wellness Franchise Models Confidential | 24 1. Consensus Adj. EBITDA estimates are presented unburdened by SBC to align with Elegant’s consensus and Management Adj. estEiB mIT ate DA s, which are not burdened by SBC; Management Adj. EBITDA figures are burdened by non-recurring investments included in Elegant’s Management Proposed LRP (100%i A evab chility) 2. Based on figures provided in Elegant’s Management Proposed LRP (100% Achievability) and Management Proposed LRP (50% iliAty) ch iaes i vanbdicated
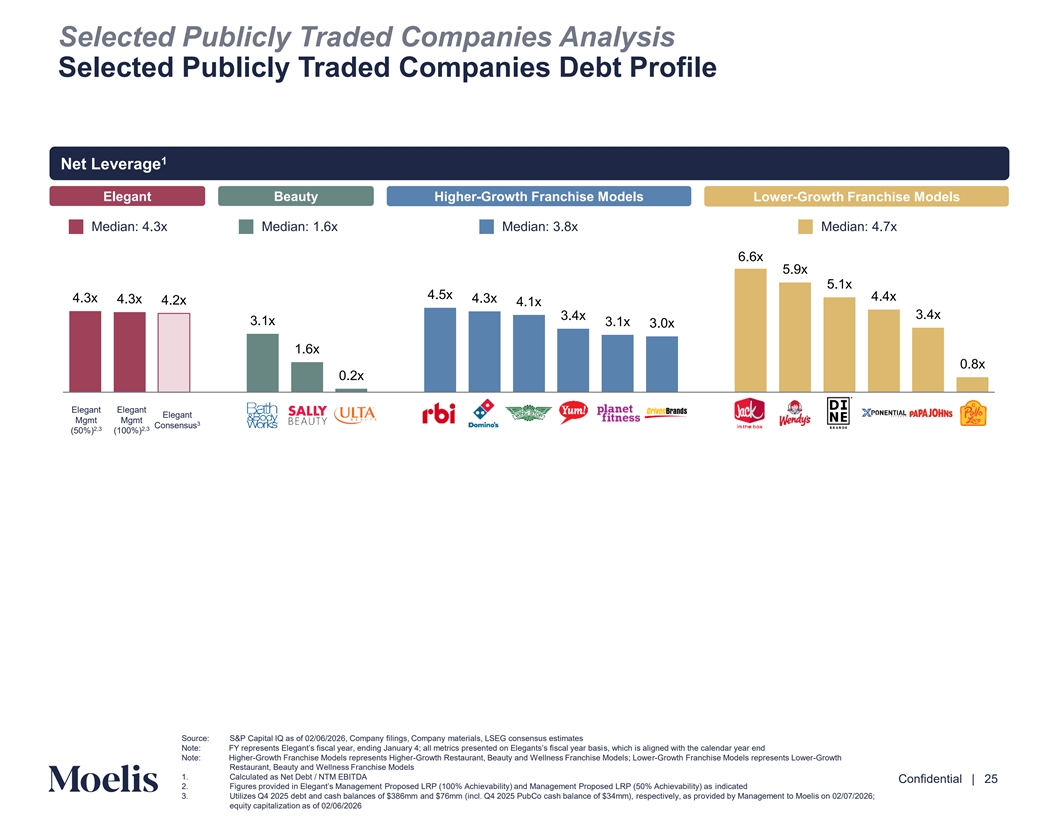
Selected Publicly Traded Companies Analysis Selected Publicly Traded Companies Debt Profile 1 Net Leverage Elegant Beauty Higher-Growth Franchise Models Lower-Growth Franchise Models Median: 4.3x Median: 1.6x Median: 3.8x Median: 4.7x 6.6x 5.9x 5.1x 4.5x 4.4x 4.3x 4.3x 4.3x 4.2x 4.1x 3.4x 3.4x 3.1x 3.1x 3.0x 1.6x 0.8x 0.2x Elegant Elegant Elegant Mgmt Mgmt 3 Consensus 2,3 2,3 (50%) (100%) Source: S&P Capital IQ as of 02/06/2026, Company filings, Company materials, LSEG consensus estimates Note: FY represents Elegant’s fiscal year, ending January ; all metrics presented on Elegants’s f s, isca which l ye is aar b liga nsi ed with the calendar year end Content must not Note: Higher-Growth Franchise Models represents Higher-Growth Restaurant, Beauty and Wellness Franchise Models; Lower-Growth Franchise Models represents Lower-Growth Restaurant, Beauty and Wellness Franchise Models go below this line 1. Calculated as Net Debt / NTM EBITDA Confidential | 25 2. Figures provided in Elegant’s Management Proposed LRP (100% Achievability) and Management Proposed LRP (50% Achieva b inildity) ica te as d 3. Utilizes Q4 2025 debt and cash balances of $386mm and $76mm (incl. Q4 2025 PubCo cash balance of $34mm), respectively, as provided by Management to Moelis on 02/07/2026; equity capitalization as of 02/06/2026
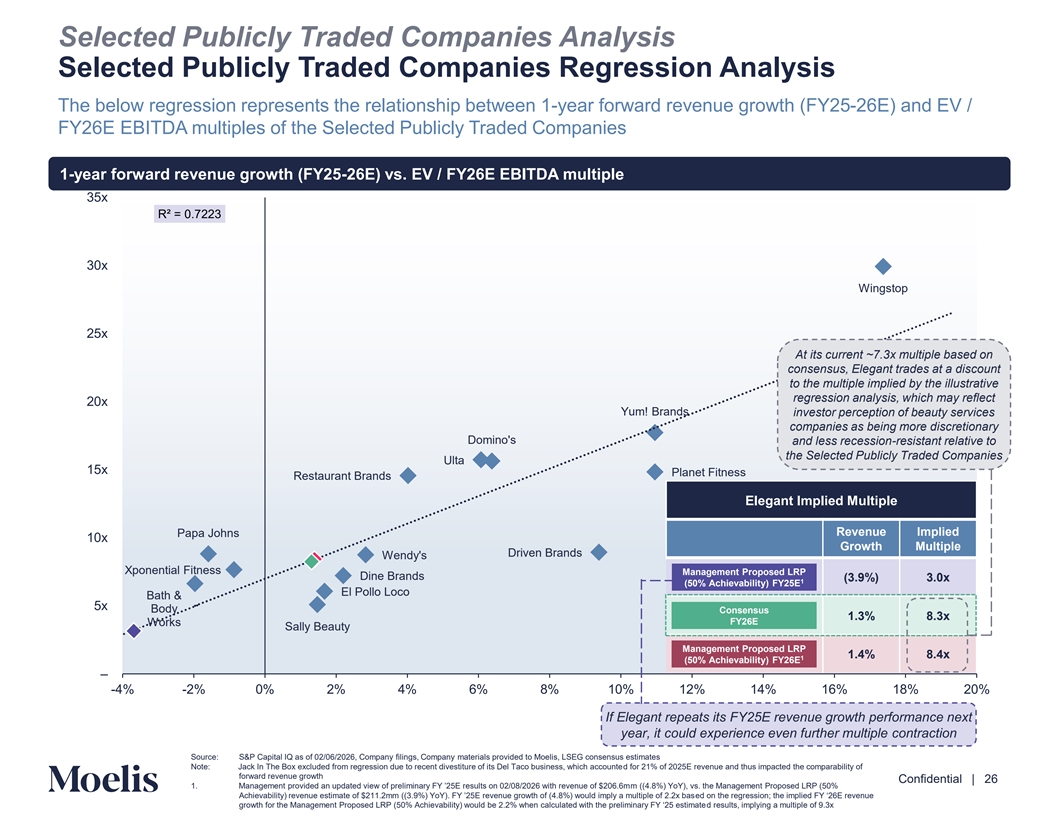
Selected Publicly Traded Companies Analysis Selected Publicly Traded Companies Regression Analysis The below regression represents the relationship between 1-year forward revenue growth (FY25-26E) and EV / FY26E EBITDA multiples of the Selected Publicly Traded Companies 1-year forward revenue growth (FY25-26E) vs. EV / FY26E EBITDA multiple 35x R² = 0.7223 30x Wingstop 25x At its current ~7.3x multiple based on consensus, Elegant trades at a discount to the multiple implied by the illustrative regression analysis, which may reflect 20x Yum! Brands investor perception of beauty services companies as being more discretionary Domino's and less recession-resistant relative to the Selected Publicly Traded Companies Ulta 15x Planet Fitness Restaurant Brands Elegant Implied Multiple Revenue Implied Papa Johns 10x Growth Multiple Driven Brands Wendy's Xponential Fitness Management Proposed LRP Dine Brands (3.9%) 3.0x 1 (50% Achievability) FY25E El Pollo Loco Bath & 5x Body Consensus 1.3% 8.3x FY26E Works Sally Beauty Management Proposed LRP 1.4% 8.4x 1 (50% Achievability) FY26E – -4% -2% 0% 2% 4% 6% 8% 10% 12% 14% 16% 18% 20% If Elegant repeats its FY25E revenue growth performance next year, it could experience even further multiple contraction Content must not Source: S&P Capital IQ as of 02/06/2026, Company filings, Company materials provided to Moelis, LSEG consensus estimates Note: Jack In The Box excluded from regression due to recent divestiture of its Del Taco business, which accounted for 21% of 2025E revenue and thus impacted the comparability of go below this line forward revenue growth Confidential | 26 1. Management provided an updated view of preliminary FY ’25E results on 02/0 /2026 with rm e ve ((4n.8 ue % o ) f Yo$Y2)0, 6vs. .6m the Management Proposed LRP (50% Achievability) revenue estimate of $211.2mm ((3. %) YoY). FY ’25E revenue growth of ( . %) would imply a multiple o ed f 2o.2 n t x b hea sregression; the implied FY ‘26E revenue growth for the Management Proposed LRP (50% Achievability) would be 2.2% when calculated with the preliminary FY ‘25 d e resti sum lts, ate implying a multiple of 9.3x
C. Selected Precedent Transactions Analysis Content must not go below this line Confidential | 27
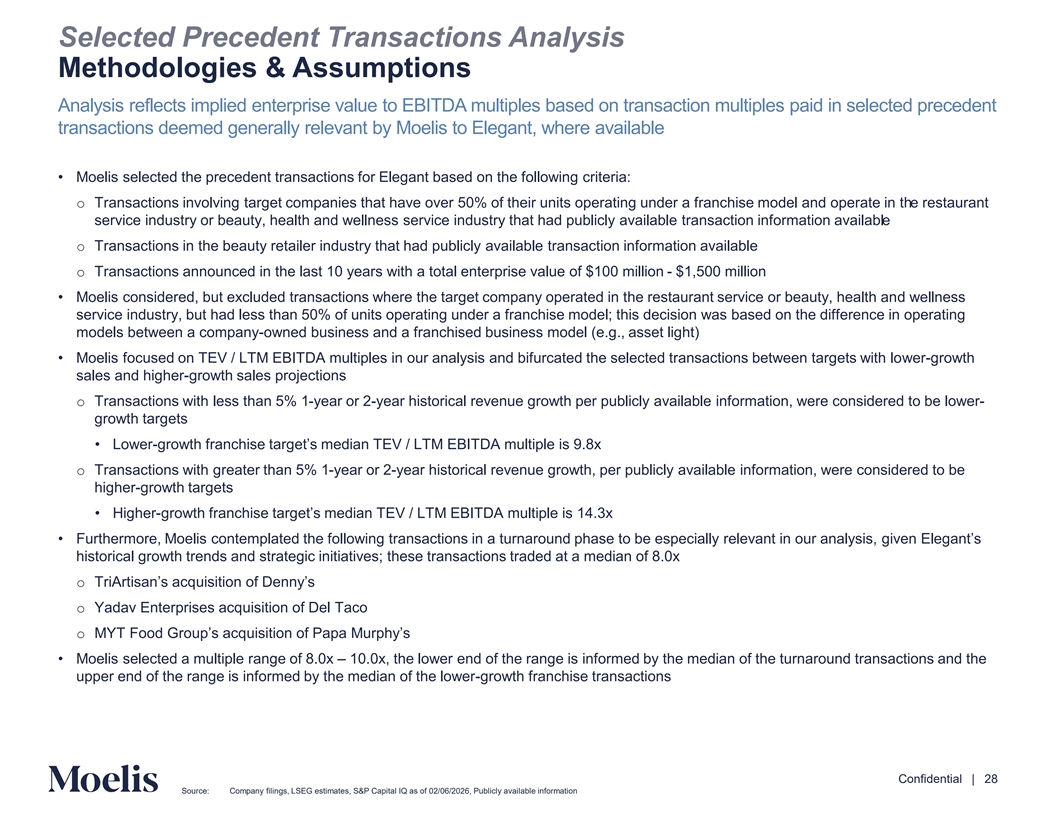
Selected Precedent Transactions Analysis Methodologies & Assumptions Analysis reflects implied enterprise value to EBITDA multiples based on transaction multiples paid in selected precedent transactions deemed generally relevant by Moelis to Elegant, where available • Moelis selected the precedent transactions for Elegant based on the following criteria: o Transactions involving target companies that have over 50% of their units operating under a franchise model and operate in the restaurant service industry or beauty, health and wellness service industry that had publicly available transaction information available o Transactions in the beauty retailer industry that had publicly available transaction information available o Transactions announced in the last 10 years with a total enterprise value of $100 million - $1,500 million • Moelis considered, but excluded transactions where the target company operated in the restaurant service or beauty, health and wellness service industry, but had less than 50% of units operating under a franchise model; this decision was based on the difference in operating models between a company-owned business and a franchised business model (e.g., asset light) • Moelis focused on TEV / LTM EBITDA multiples in our analysis and bifurcated the selected transactions between targets with lower-growth sales and higher-growth sales projections o Transactions with less than 5% 1-year or 2-year historical revenue growth per publicly available information, were considered to be lower- growth targets • Lower-growth franchise target’s median TEV / LTM EBITDA multiple is . x o Transactions with greater than 5% 1-year or 2-year historical revenue growth, per publicly available information, were considered to be higher-growth targets • Higher-growth franchise target’s median TEV / LTM EBITDA multiple is 1 .3x • Furthermore, Moelis contemplated the following transactions in a turnaround phase to be especially relevant in our analysis, given Elegant’s historical growth trends and strategic initiatives; these transactions traded at a median of 8.0x o TriArtisan’s acquisition of Denny’s o Yadav Enterprises acquisition of Del Taco o MYT Food Group’s acquisition of Papa Murphy’s • Moelis selected a multiple range of 8.0x – 10.0x, the lower end of the range is informed by the median of the turnaround transactions and the upper end of the range is informed by the median of the lower-growth franchise transactions Content must not go below this line Confidential | 28 Source: Company filings, LSEG estimates, S&P Capital IQ as of 02/06/2026, Publicly available information
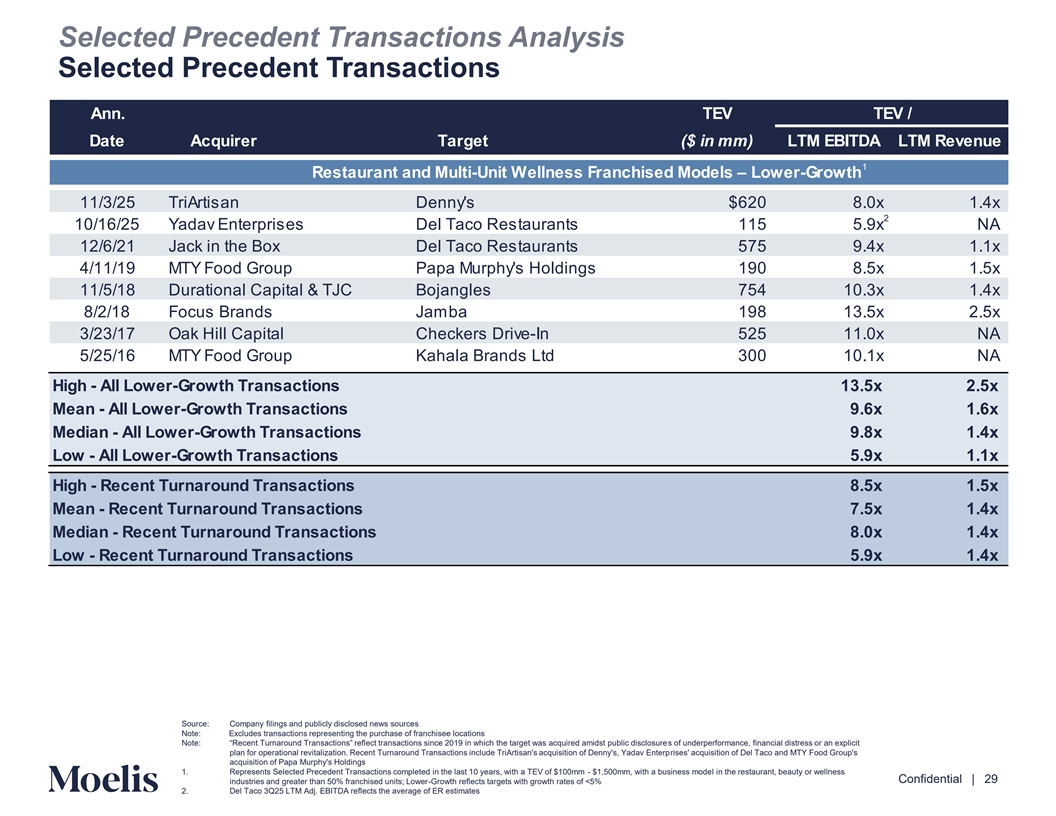
Selected Precedent Transactions Analysis Selected Precedent Transactions Ann. TEV TEV / Date Acquirer Target ($ in mm) LTM EBITDA LTM Revenue 1 Restaurant and Multi-Unit Wellness Franchised Models – Lower-Growth 11/3/25 TriArtisan Denny's $620 8.0x 1.4x 2 10/16/25 Yadav Enterprises Del Taco Restaurants 115 5.9x NA 12/6/21 Jack in the Box Del Taco Restaurants 575 9.4x 1.1x 4/11/19 MTY Food Group Papa Murphy's Holdings 190 8.5x 1.5x 11/5/18 Durational Capital & TJC Bojangles 754 10.3x 1.4x 8/2/18 Focus Brands Jamba 198 13.5x 2.5x 3/23/17 Oak Hill Capital Checkers Drive-In 525 11.0x NA 5/25/16 MTY Food Group Kahala Brands Ltd 300 10.1x NA High - All Lower-Growth Transactions 13.5x 2.5x Mean - All Lower-Growth Transactions 9.6x 1.6x Median - All Lower-Growth Transactions 9.8x 1.4x Low - All Lower-Growth Transactions 5.9x 1.1x High - Recent Turnaround Transactions 8.5x 1.5x Mean - Recent Turnaround Transactions 7.5x 1.4x Median - Recent Turnaround Transactions 8.0x 1.4x Low - Recent Turnaround Transactions 5.9x 1.4x Source: Company filings and publicly disclosed news sources Note: Excludes transactions representing the purchase of franchisee locations Note: “Recent Turnaround Transactions” reflect transactions since 201 in which the target was acquired amidst public ds iscl of ousu ndre erperformance, financial distress or an explicit Content must not plan for operational revitalization. Recent Turnaround Transactions include TriArtisan's acquisition of Denny's, Yadav Enterprises' acquisition of Del Taco and MTY Food Group's acquisition of Papa Murphy's Holdings go below this line 1. Represents Selected Precedent Transactions completed in the last 10 years, with a TEV of $100mm - $1,500mm, with a business model in the restaurant, beauty or wellness Confidential | 29 industries and greater than 50% franchised units; Lower-Growth reflects targets with growth rates of <5% 2. Del Taco 3Q25 LTM Adj. EBITDA reflects the average of ER estimates
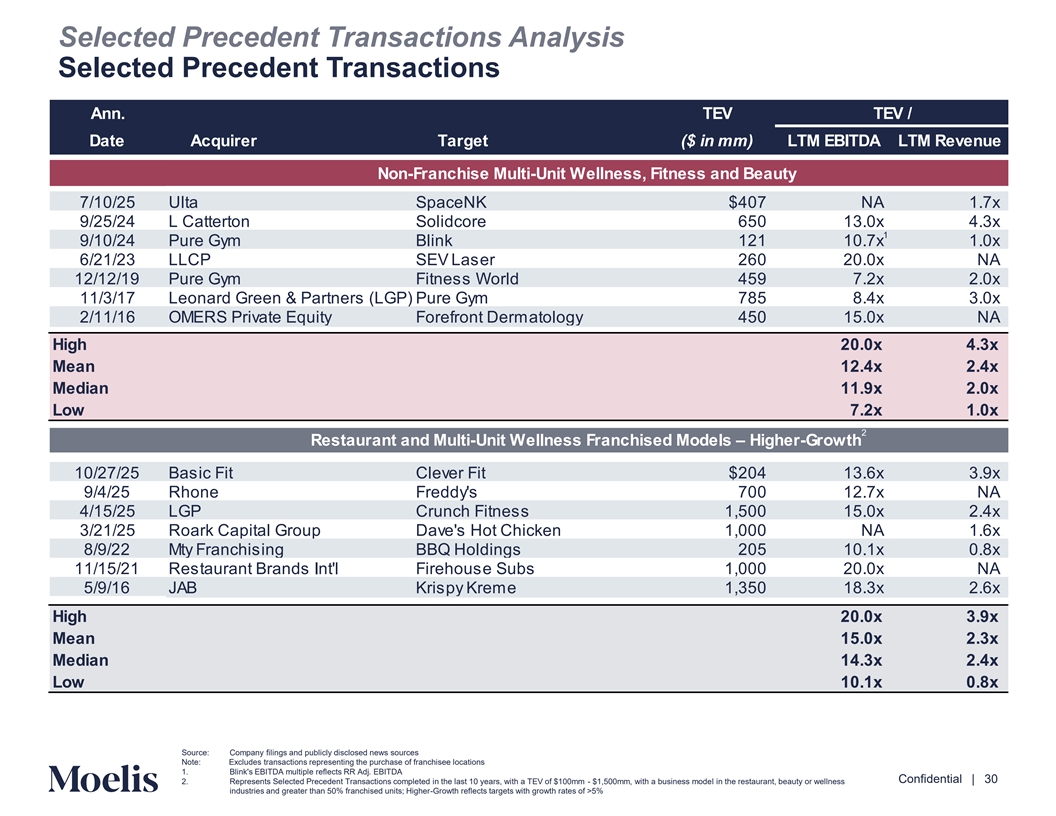
Selected Precedent Transactions Analysis Selected Precedent Transactions Ann. TEV TEV / Date Acquirer Target ($ in mm) LTM EBITDA LTM Revenue Non-Franchise Multi-Unit Wellness, Fitness and Beauty 7/10/25 Ulta SpaceNK $407 NA 1.7x 9/25/24 L Catterton Solidcore 650 13.0x 4.3x 1 9/10/24 Pure Gym Blink 121 10.7x 1.0x 6/21/23 LLCP SEV Laser 260 20.0x NA 12/12/19 Pure Gym Fitness World 459 7.2x 2.0x 11/3/17 Leonard Green & Partners (LGP) Pure Gym 785 8.4x 3.0x 2/11/16 OMERS Private Equity Forefront Dermatology 450 15.0x NA High 20.0x 4.3x Mean 12.4x 2.4x Median 11.9x 2.0x Low 7.2x 1.0x 2 Restaurant and Multi-Unit Wellness Franchised Models – Higher-Growth 10/27/25 Basic Fit Clever Fit $204 13.6x 3.9x 9/4/25 Rhone Freddy's 700 12.7x NA 4/15/25 LGP Crunch Fitness 1,500 15.0x 2.4x 3/21/25 Roark Capital Group Dave's Hot Chicken 1,000 NA 1.6x 8/9/22 Mty Franchising BBQ Holdings 205 10.1x 0.8x 11/15/21 Restaurant Brands Int'l Firehouse Subs 1,000 20.0x NA 5/9/16 JAB Krispy Kreme 1,350 18.3x 2.6x High 20.0x 3.9x Mean 15.0x 2.3x Median 14.3x 2.4x Low 10.1x 0.8x Content must not Source: Company filings and publicly disclosed news sources Note: Excludes transactions representing the purchase of franchisee locations go below this line 1. Blink's EBITDA multiple reflects RR Adj. EBITDA Confidential | 30 2. Represents Selected Precedent Transactions completed in the last 10 years, with a TEV of $100mm - $1,500mm, with a business model in the restaurant, beauty or wellness industries and greater than 50% franchised units; Higher-Growth reflects targets with growth rates of >5%
D. Discounted Cash Flow Analysis (For Reference Only) Content must not go below this line Confidential | 31
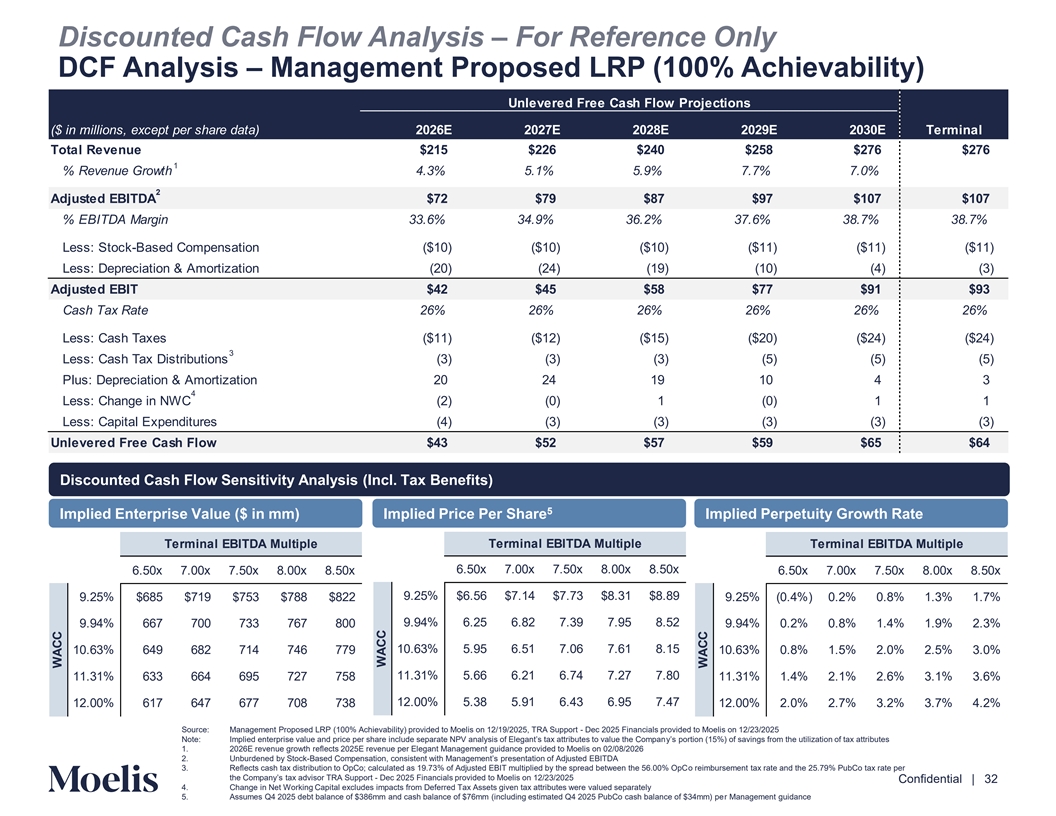
Discounted Cash Flow Analysis – For Reference Only DCF Analysis – Management Proposed LRP (100% Achievability) Unlevered Free Cash Flow Projections ($ in millions, except per share data) 2026E 2027E 2028E 2029E 2030E Terminal Total Revenue $215 $226 $240 $258 $276 $276 1 % Revenue Growth 4.3% 5.1% 5.9% 7.7% 7.0% 2 Adjusted EBITDA $72 $79 $87 $97 $107 $107 % EBITDA Margin 33.6% 34.9% 36.2% 37.6% 38.7% 38.7% Less: Stock-Based Compensation ($10) ($10) ($10) ($11) ($11) ($11) Less: Depreciation & Amortization (20) (24) (19) (10) (4) (3) Adjusted EBIT $42 $45 $58 $77 $91 $93 Cash Tax Rate 26% 26% 26% 26% 26% 26% Less: Cash Taxes ($11) ($12) ($15) ($20) ($24) ($24) 3 Less: Cash Tax Distributions (3) (3) (3) (5) (5) (5) Plus: Depreciation & Amortization 20 24 19 10 4 3 4 Less: Change in NWC (2) (0) 1 (0) 1 1 Less: Capital Expenditures (4) (3) (3) (3) (3) (3) Unlevered Free Cash Flow $43 $52 $57 $59 $65 $64 Discounted Cash Flow Sensitivity Analysis (Incl. Tax Benefits) 5 Implied Enterprise Value ($ in mm) Implied Price Per Share Implied Perpetuity Growth Rate Terminal EBITDA Multiple Terminal EBITDA Multiple Terminal EBITDA Multiple 6.50x 7.00x 7.50x 8.00x 8.50x 6.50x 7.00x 7.50x 8.00x 8.50x 6.50x 7.00x 7.50x 8.00x 8.50x 9.25% $6.56 $7.14 $7.73 $8.31 $8.89 9.25% $685 $719 $753 $788 $822 9.25% (0.4%) 0.2% 0.8% 1.3% 1.7% 9.94% 6.25 6.82 7.39 7.95 8.52 9.94% 667 700 733 767 800 9.94% 0.2% 0.8% 1.4% 1.9% 2.3% 10.63% 5.95 6.51 7.06 7.61 8.15 10.63% 649 682 714 746 779 10.63% 0.8% 1.5% 2.0% 2.5% 3.0% 11.31% 5.66 6.21 6.74 7.27 7.80 11.31% 633 664 695 727 758 11.31% 1.4% 2.1% 2.6% 3.1% 3.6% 12.00% 5.38 5.91 6.43 6.95 7.47 12.00% 617 647 677 708 738 12.00% 2.0% 2.7% 3.2% 3.7% 4.2% Source: Management Proposed LRP (100% Achievability) provided to Moelis on 12/19/2025, TRA Support - Dec 2025 Financials provided to Moelis on 12/23/2025 Note: Implied enterprise value and price per share include separate NPV analysis of Elegant’s tax attributes to value thy’s e Co pomrptioann (15%) of savings from the utilization of tax attributes 1. 2026E revenue growth reflects 2025E revenue per Elegant Management guidance provided to Moelis on 02/08/2026 Content must not 2. Unburdened by Stock-Based Compensation, consistent with Management’s presentation of Adjusted EBITDA 3. Reflects cash tax distribution to OpCo; calculated as 19.73% of Adjusted EBIT multiplied by the spread between the 56.00% OpCo reimbursement tax rate and the 25.79% PubCo tax rate per go below this line the Company’s tax advisor TRA Suppo - rDec t 2025 Financials provided to Moelis on 12/23/2025 Confidential | 32 4. Change in Net Working Capital excludes impacts from Deferred Tax Assets given tax attributes were valued separately 5. Assumes Q4 2025 debt balance of $386mm and cash balance of $76mm (including estimated Q4 2025 PubCo cash balance of $34mm) per Management guidance WACC WACC WACC
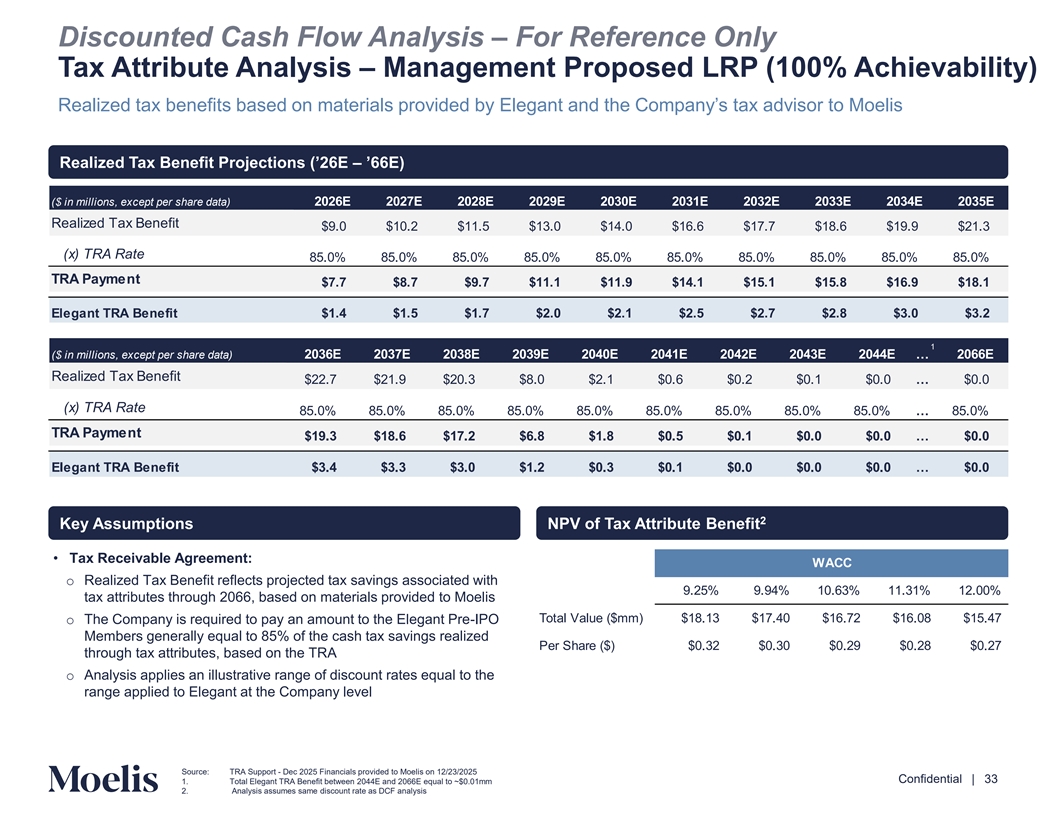
Discounted Cash Flow Analysis – For Reference Only Tax Attribute Analysis – Management Proposed LRP (100% Achievability) Realized tax benefits based on materials provided by Elegant and the Company’s tax advisor to Moelis Realized Tax Benefit Projections (’26–E ’66E) ($ in millions, except per share data) 2026E 2027E 2028E 2029E 2030E 2031E 2032E 2033E 2034E 2035E Realized Tax Benefit $9.0 $10.2 $11.5 $13.0 $14.0 $16.6 $17.7 $18.6 $19.9 $21.3 (x) TRA Rate 85.0% 85.0% 85.0% 85.0% 85.0% 85.0% 85.0% 85.0% 85.0% 85.0% TRA Payment $7.7 $8.7 $9.7 $11.1 $11.9 $14.1 $15.1 $15.8 $16.9 $18.1 Elegant TRA Benefit $1.4 $1.5 $1.7 $2.0 $2.1 $2.5 $2.7 $2.8 $3.0 $3.2 1 ($ in millions, except per share data) 2036E 2037E 2038E 2039E 2040E 2041E 2042E 2043E 2044E … 2066E Realized Tax Benefit $22.7 $21.9 $20.3 $8.0 $2.1 $0.6 $0.2 $0.1 $0.0 … $0.0 (x) TRA Rate 85.0% 85.0% 85.0% 85.0% 85.0% 85.0% 85.0% 85.0% 85.0% … 85.0% TRA Payment $19.3 $18.6 $17.2 $6.8 $1.8 $0.5 $0.1 $0.0 $0.0 … $0.0 Elegant TRA Benefit $3.4 $3.3 $3.0 $1.2 $0.3 $0.1 $0.0 $0.0 $0.0 … $0.0 2 Key Assumptions NPV of Tax Attribute Benefit • Tax Receivable Agreement: WACC o Realized Tax Benefit reflects projected tax savings associated with 9.25% 9.94% 10.63% 11.31% 12.00% tax attributes through 2066, based on materials provided to Moelis Total Value ($mm) $18.13 $17.40 $16.72 $16.08 $15.47 o The Company is required to pay an amount to the Elegant Pre-IPO Members generally equal to 85% of the cash tax savings realized Per Share ($) $0.32 $0.30 $0.29 $0.28 $0.27 through tax attributes, based on the TRA o Analysis applies an illustrative range of discount rates equal to the range applied to Elegant at the Company level Content must not go below this line Source: TRA Support - Dec 2025 Financials provided to Moelis on 12/23/2025 Confidential | 33 1. Total Elegant TRA Benefit between 2044E and 2066E equal to ~$0.01mm 2. Analysis assumes same discount rate as DCF analysis
E. Leverage Buyout Analysis (For Reference Only) Content must not go below this line Confidential | 34
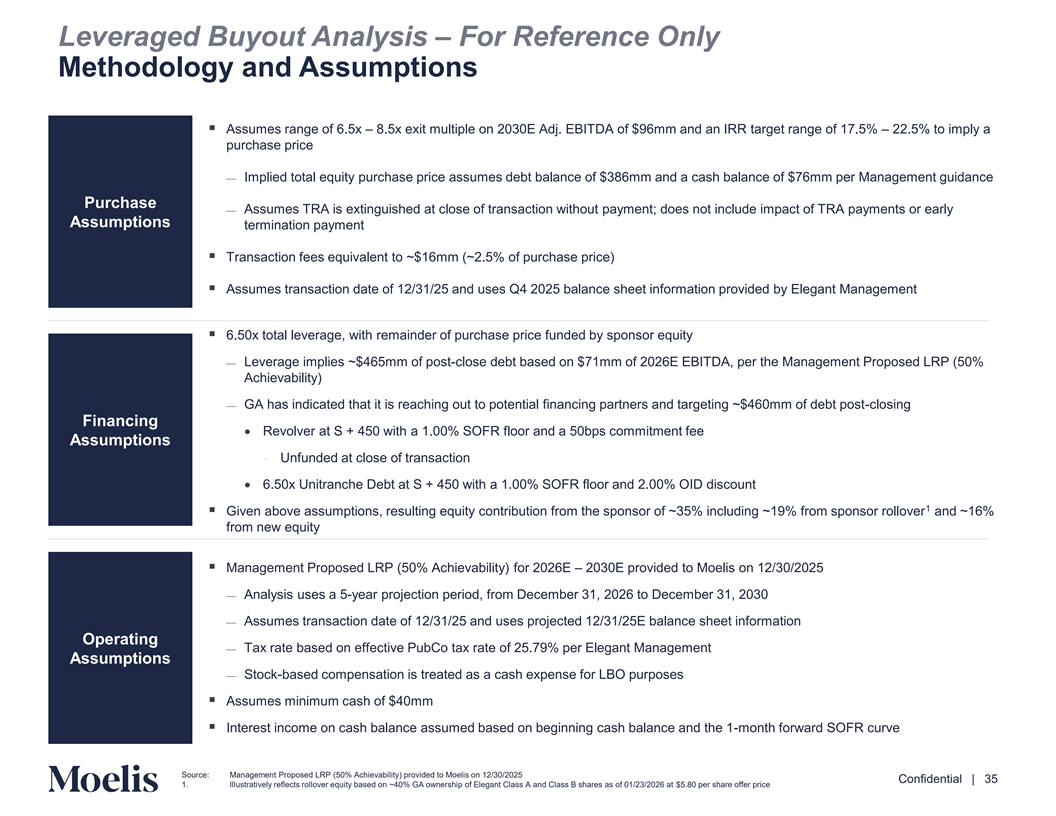
Leveraged Buyout Analysis – For Reference Only Methodology and Assumptions ▪ Assumes range of 6.5x – 8.5x exit multiple on 2030E Adj. EBITDA of $96mm and an IRR target range of 17.5% – 22.5% to imply a purchase price ⎯ Implied total equity purchase price assumes debt balance of $386mm and a cash balance of $76mm per Management guidance Purchase ⎯ Assumes TRA is extinguished at close of transaction without payment; does not include impact of TRA payments or early Assumptions termination payment ▪ Transaction fees equivalent to ~$16mm (~2.5% of purchase price) ▪ Assumes transaction date of 12/31/25 and uses Q4 2025 balance sheet information provided by Elegant Management ▪ 6.50x total leverage, with remainder of purchase price funded by sponsor equity ⎯ Leverage implies ~$465mm of post-close debt based on $71mm of 2026E EBITDA, per the Management Proposed LRP (50% Achievability) ⎯ GA has indicated that it is reaching out to potential financing partners and targeting ~$460mm of debt post-closing Financing • Revolver at S + 450 with a 1.00% SOFR floor and a 50bps commitment fee Assumptions − Unfunded at close of transaction • 6.50x Unitranche Debt at S + 450 with a 1.00% SOFR floor and 2.00% OID discount 1 ▪ Given above assumptions, resulting equity contribution from the sponsor of ~35% including ~19% from sponsor rollover and ~16% from new equity ▪ Management Proposed LRP (50% Achievability) for 2026E – 2030E provided to Moelis on 12/30/2025 ⎯ Analysis uses a 5-year projection period, from December 31, 2026 to December 31, 2030 ⎯ Assumes transaction date of 12/31/25 and uses projected 12/31/25E balance sheet information Operating ⎯ Tax rate based on effective PubCo tax rate of 25.79% per Elegant Management Assumptions ⎯ Stock-based compensation is treated as a cash expense for LBO purposes ▪ Assumes minimum cash of $40mm ▪ Interest income on cash balance assumed based on beginning cash balance and the 1-month forward SOFR curve Content must not go below this line Source: Management Proposed LRP (50% Achievability) provided to Moelis on 12/30/2025 Confidential | 35 1. Illustratively reflects rollover equity based on ~40% GA ownership of Elegant Class A and Class B shares as of 01/23/2026 at $5.80 per share offer price
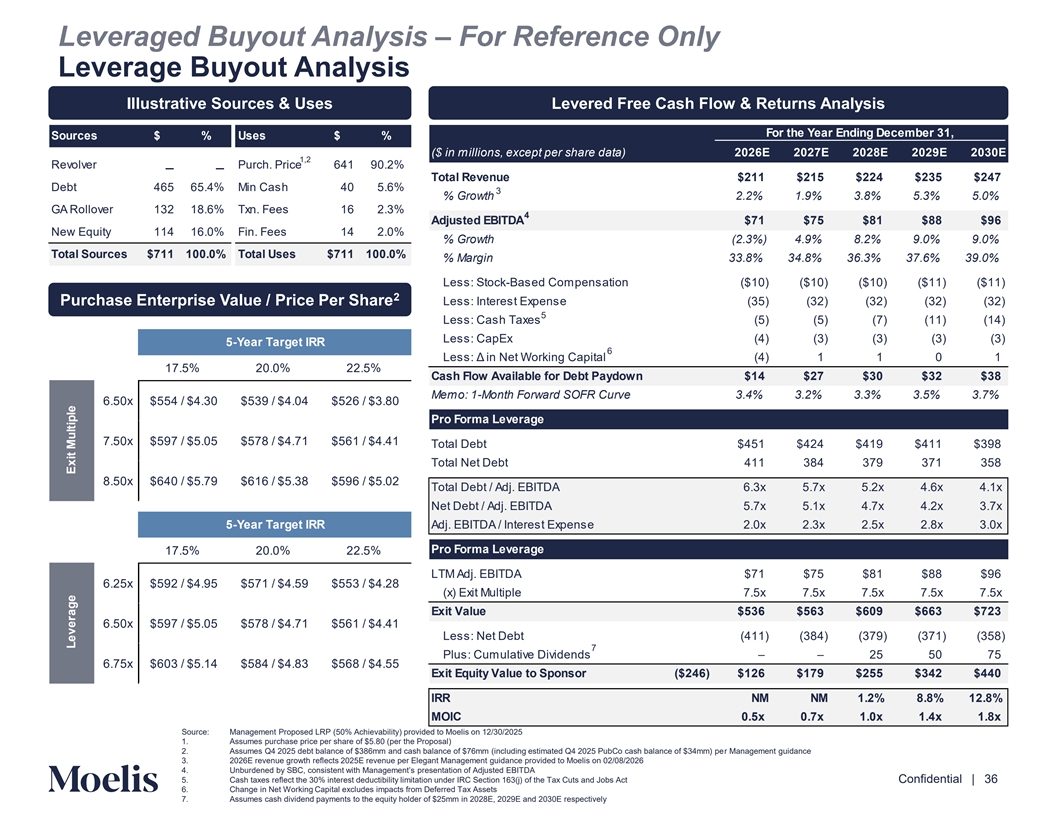
Leveraged Buyout Analysis – For Reference Only Leverage Buyout Analysis Illustrative Sources & Uses Levered Free Cash Flow & Returns Analysis For the Year Ending December 31, Sources $ % Uses $ % ($ in millions, except per share data) 2026E 2027E 2028E 2029E 2030E 1,2 Revolver Purch. Price 641 90.2% – – Total Revenue $211 $215 $224 $235 $247 Debt 465 65.4% Min Cash 40 5.6% 3 % Growth 2.2% 1.9% 3.8% 5.3% 5.0% GA Rollover 132 18.6% Txn. Fees 16 2.3% 4 Adjusted EBITDA $71 $75 $81 $88 $96 New Equity 114 16.0% Fin. Fees 14 2.0% % Growth (2.3%) 4.9% 8.2% 9.0% 9.0% Total Sources $711 100.0% Total Uses $711 100.0% % Margin 33.8% 34.8% 36.3% 37.6% 39.0% Less: Stock-Based Compensation ($10) ($10) ($10) ($11) ($11) 2 Purchase Enterprise Value / Price Per Share Less: Interest Expense (35) (32) (32) (32) (32) 5 Less: Cash Taxes (5) (5) (7) (11) (14) Less: CapEx (4) (3) (3) (3) (3) 5-Year Target IRR 6 Less: Δ in Net Working Capital (4) 1 1 0 1 17.5% 20.0% 22.5% Cash Flow Available for Debt Paydown $14 $27 $30 $32 $38 Memo: 1-Month Forward SOFR Curve 3.4% 3.2% 3.3% 3.5% 3.7% 6.50x $554 / $4.30 $539 / $4.04 $526 / $3.80 Pro Forma Leverage 7.50x $597 / $5.05 $578 / $4.71 $561 / $4.41 Total Debt $451 $424 $419 $411 $398 Total Net Debt 411 384 379 371 358 8.50x $640 / $5.79 $616 / $5.38 $596 / $5.02 Total Debt / Adj. EBITDA 6.3x 5.7x 5.2x 4.6x 4.1x Net Debt / Adj. EBITDA 5.7x 5.1x 4.7x 4.2x 3.7x 5-Year Target IRR Adj. EBITDA / Interest Expense 2.0x 2.3x 2.5x 2.8x 3.0x Pro Forma Leverage 17.5% 20.0% 22.5% LTM Adj. EBITDA $71 $75 $81 $88 $96 6.25x $592 / $4.95 $571 / $4.59 $553 / $4.28 (x) Exit Multiple 7.5x 7.5x 7.5x 7.5x 7.5x Exit Value $536 $563 $609 $663 $723 6.50x $597 / $5.05 $578 / $4.71 $561 / $4.41 Less: Net Debt (411) (384) (379) (371) (358) 7 Plus: Cumulative Dividends – – 25 50 75 6.75x $603 / $5.14 $584 / $4.83 $568 / $4.55 Exit Equity Value to Sponsor ($246) $126 $179 $255 $342 $440 IRR NM NM 1.2% 8.8% 12.8% MOIC 0.5x 0.7x 1.0x 1.4x 1.8x Source: Management Proposed LRP (50% Achievability) provided to Moelis on 12/30/2025 1. Assumes purchase price per share of $5.80 (per the Proposal) 2. Assumes Q4 2025 debt balance of $386mm and cash balance of $76mm (including estimated Q4 2025 PubCo cash balance of $34mm) per Management guidance Content must not 3. 2026E revenue growth reflects 2025E revenue per Elegant Management guidance provided to Moelis on 02/08/2026 go below this line 4. Unburdened by SBC, consistent with Management’s presentation of Adjusted EBITDA 5. Cash taxes reflect the 30% interest deductibility limitation under IRC Section 163(j) of the Tax Cuts and Jobs Act Confidential | 36 6. Change in Net Working Capital excludes impacts from Deferred Tax Assets 7. Assumes cash dividend payments to the equity holder of $25mm in 2028E, 2029E and 2030E respectively Leverage Exit Multiple
F. Additional Context for Evaluating the Offer Content must not go below this line Confidential | 37
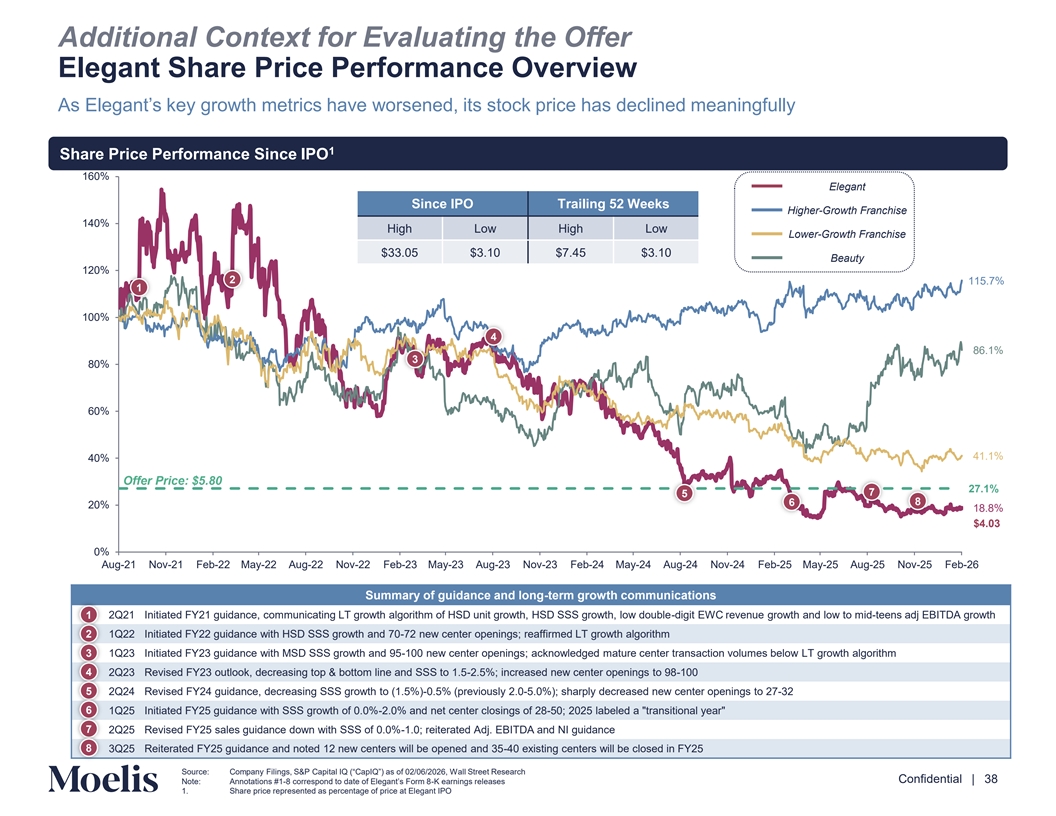
Additional Context for Evaluating the Offer Elegant Share Price Performance Overview As Elegant’s key growth metrics have worsened, its stock price has declined meaningfully 1 Share Price Performance Since IPO 160% Elegant Since IPO Trailing 52 Weeks Higher-Growth Franchise 140% High Low High Low Lower-Growth Franchise $33.05 $3.10 $7.45 $3.10 Beauty 120% 2 115.7% 1 100% 4 86.1% 3 80% 60% 41.1% 40% Offer Price: $5.80 27.1% 7 5 8 6 20% 18.8% $4.03 0% Aug-21 Nov-21 Feb-22 May-22 Aug-22 Nov-22 Feb-23 May-23 Aug-23 Nov-23 Feb-24 May-24 Aug-24 Nov-24 Feb-25 May-25 Aug-25 Nov-25 Feb-26 Summary of guidance and long-term growth communications 1 2Q21 Initiated FY21 guidance, communicating LT growth algorithm of HSD unit growth, HSD SSS growth, low double-digit EWC revenue growth and low to mid-teens adj EBITDA growth 1Q22 Initiated FY22 guidance with HSD SSS growth and 70-72 new center openings; reaffirmed LT growth algorithm 2 3 1Q23 Initiated FY23 guidance with MSD SSS growth and 95-100 new center openings; acknowledged mature center transaction volumes below LT growth algorithm 4 2Q23 Revised FY23 outlook, decreasing top & bottom line and SSS to 1.5-2.5%; increased new center openings to 98-100 5 2Q24 Revised FY24 guidance, decreasing SSS growth to (1.5%)-0.5% (previously 2.0-5.0%); sharply decreased new center openings to 27-32 6 1Q25 Initiated FY25 guidance with SSS growth of 0.0%-2.0% and net center closings of 28-50; 2025 labeled a transitional year 7 2Q25 Revised FY25 sales guidance down with SSS of 0.0%-1.0; reiterated Adj. EBITDA and NI guidance 8 3Q25 Reiterated FY25 guidance and noted 12 new centers will be opened and 35-40 existing centers will be closed in FY25 Content must not go below this line Source: Company Filings, S&P Capital IQ (“CapIQ”) as of 02/06/2026, Wall Street Research Confidential | 38 Note: Annotations #1- correspond to date of Elegant’s For-m K earnings releases 1. Share price represented as percentage of price at Elegant IPO
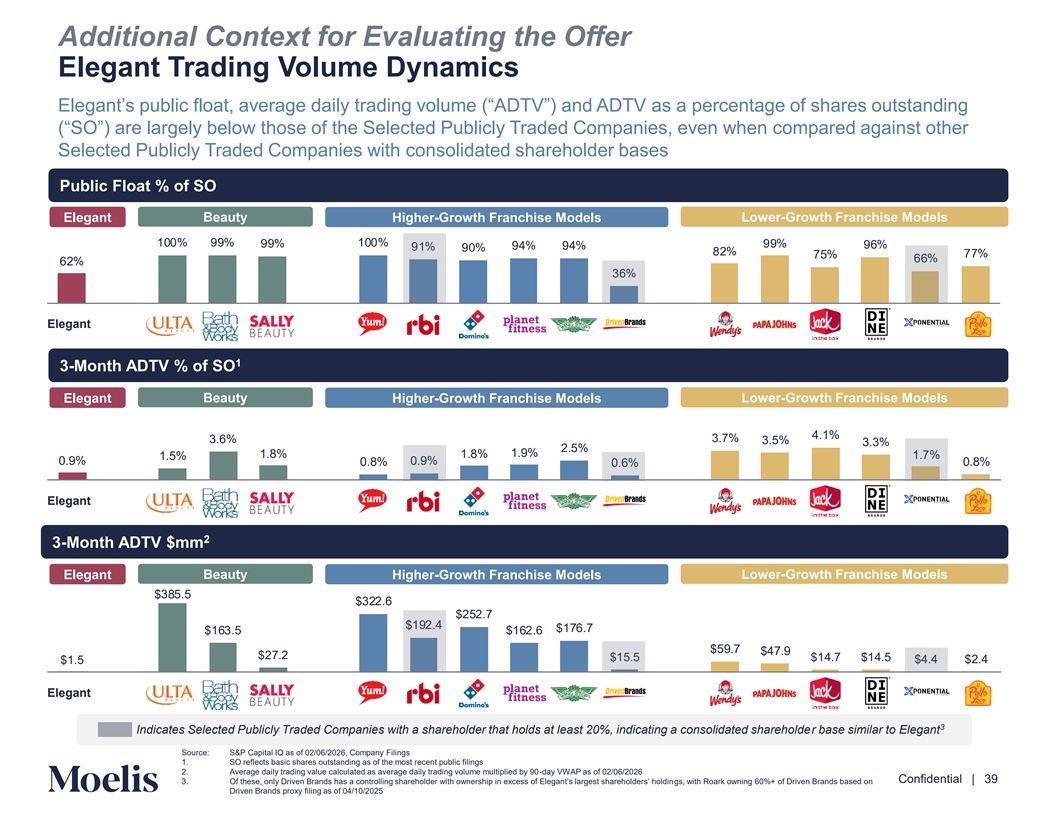
Additional Context for Evaluating the Offer Elegant Trading Volume Dynamics Elegant’s public float, average daily trading volume (“ADTV”) and ADTV as a percentage of shares outstanding (“SO”) are largely below those of the Selected Publicly Traded Companies, even when compared against other Selected Publicly Traded Companies with consolidated shareholder bases Public Float % of SO Beauty Lower-Growth Franchise Models Elegant Higher-Growth Franchise Models 100% % 100% % % % % 6% 1% 0% 2% 77% 75% 66% 62% 36% Elegant 1 3-Month ADTV % of SO Elegant Beauty Higher-Growth Franchise Models Lower-Growth Franchise Models .1% 3.7% 3.6% 3.5% 3.3% 2.5% 1. % 1. % 1. % 1.7% 1.5% 0. % 0. % 0. % 0.6% 0. % Elegant 2 3-Month ADTV $mm Beauty Lower-Growth Franchise Models Elegant Higher-Growth Franchise Models $3 5.5 $322.6 $252.7 $1 2. $176.7 $163.5 $162.6 $5 .7 $ 7. $27.2 $15.5 $1 .7 $1 .5 $1.5 $ . $2. Elegant 3 Indicates Selected Publicly Traded Companies with a shareholder that holds at least 20%, indicating a consolidated shareholder base similar to Elegant Content must not Source: S&P Capital IQ as of 02/06/2026, Company Filings 1. SO reflects basic shares outstanding as of the most recent public filings go below this line 2. Average daily trading value calculated as average daily trading volume multiplied by 90-day VWAP as of 02/06/2026 Confidential | 39 3. Of these, only Driven Brands has a controlling shareholder with ownership in excess of Elegant’s largest shareholde grs, s’ h wio thld Ro in ark owning 60%+ of Driven Brands based on Driven Brands proxy filing as of 04/10/2025
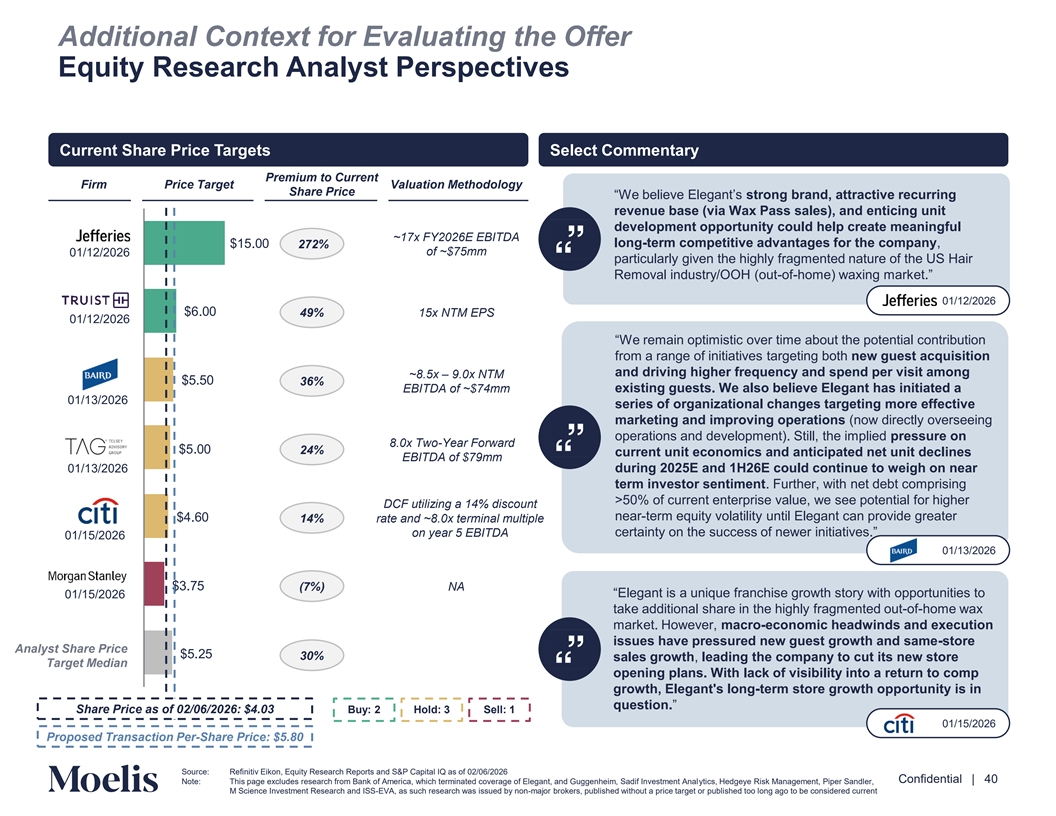
Additional Context for Evaluating the Offer Equity Research Analyst Perspectives Current Share Price Targets Select Commentary Premium to Current Firm Price Target Valuation Methodology Share Price “We believe Elegant’sstron g brand, attractive recurring revenue base (via Wax Pass sales), and enticing unit development opportunity could help create meaningful ~17x FY2026E EBITDA $15.00 272% long-term competitive advantages for the company, 01/12/2026 of ~$75mm particularly given the highly fragmented nature of the US Hair Removal industry/OOH (out-of-home) waxing market.” 01/12/2026 $6.00 49% 15x NTM EPS 01/12/2026 “We remain optimistic over time about the potential contribution from a range of initiatives targeting both new guest acquisition and driving higher frequency and spend per visit among ~8.5x – 9.0x NTM $5.50 36% existing guests. We also believe Elegant has initiated a EBITDA of ~$74mm 01/13/2026 series of organizational changes targeting more effective marketing and improving operations (now directly overseeing operations and development). Still, the implied pressure on 8.0x Two-Year Forward $5.00 24% current unit economics and anticipated net unit declines EBITDA of $79mm during 2025E and 1H26E could continue to weigh on near 01/13/2026 term investor sentiment. Further, with net debt comprising >50% of current enterprise value, we see potential for higher DCF utilizing a 14% discount near-term equity volatility until Elegant can provide greater $ .60 14% rate and ~8.0x terminal multiple certainty on the success of newer initiatives.” on year 5 EBITDA 01/15/2026 01/13/2026 $3.75 (7%) NA “Elegant is a unique franchise growth story with opportunities to 01/15/2026 take additional share in the highly fragmented out-of-home wax market. However, macro-economic headwinds and execution issues have pressured new guest growth and same-store Analyst Share Price $5.25 30% sales growth, leading the company to cut its new store Target Median opening plans. With lack of visibility into a return to comp growth, Elegant's long-term store growth opportunity is in question.” Share Price as of 02/06/2026: $4.03 Buy: 2 Hold: 3 Sell: 1 01/15/2026 Proposed Transaction Per-Share Price: $5.80 Content must not go below this line Source: Refinitiv Eikon, Equity Research Reports and S&P Capital IQ as of 02/06/2026 Confidential | 40 Note: This page excludes research from Bank of America, which terminated coverage of Elegant, and Guggenheim, Sadif Investment Analytics, Hedgeye Risk Management, Piper Sandler, M Science Investment Research and ISS-EVA, as such research was issued by non-major brokers, published without a price target or published too long ago to be considered current
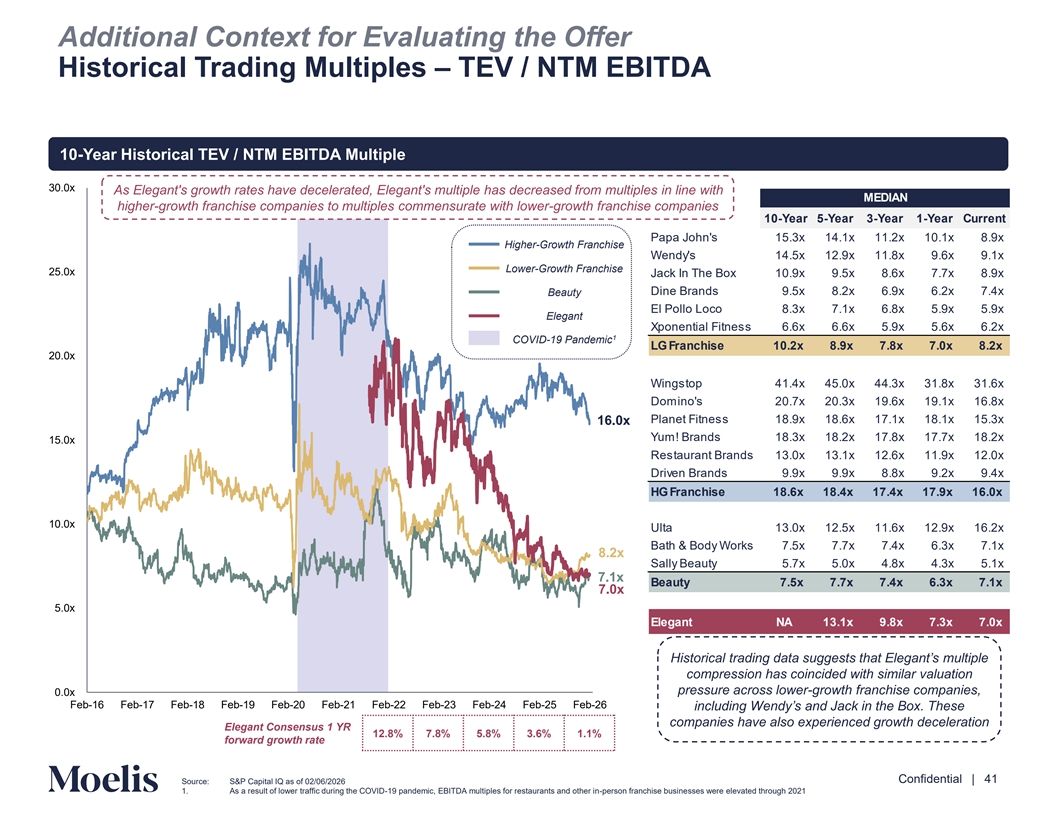
Additional Context for Evaluating the Offer Historical Trading Multiples – TEV / NTM EBITDA 10-Year Historical TEV / NTM EBITDA Multiple 30.0x As Elegant's growth rates have decelerated, Elegant's multiple has decreased from multiples in line with MEDIAN higher-growth franchise companies to multiples commensurate with lower-growth franchise companies 10-Year 5-Year 3-Year 1-Year Current Papa John's 15.3x 14.1x 11.2x 10.1x 8.9x Higher-Growth Franchise Wendy's 14.5x 12.9x 11.8x 9.6x 9.1x Lower-Growth Franchise 25.0x Jack In The Box 10.9x 9.5x 8.6x 7.7x 8.9x Beauty Dine Brands 9.5x 8.2x 6.9x 6.2x 7.4x El Pollo Loco 8.3x 7.1x 6.8x 5.9x 5.9x Elegant Xponential Fitness 6.6x 6.6x 5.9x 5.6x 6.2x 1 COVID-19 Pandemic LG Franchise 10.2x 8.9x 7.8x 7.0x 8.2x 20.0x Wingstop 41.4x 45.0x 44.3x 31.8x 31.6x Domino's 20.7x 20.3x 19.6x 19.1x 16.8x Planet Fitness 18.9x 18.6x 17.1x 18.1x 15.3x 16.0x Yum! Brands 18.3x 18.2x 17.8x 17.7x 18.2x 15.0x Restaurant Brands 13.0x 13.1x 12.6x 11.9x 12.0x Driven Brands 9.9x 9.9x 8.8x 9.2x 9.4x HG Franchise 18.6x 18.4x 17.4x 17.9x 16.0x 10.0x Ulta 13.0x 12.5x 11.6x 12.9x 16.2x Bath & Body Works 7.5x 7.7x 7.4x 6.3x 7.1x 8.2x Sally Beauty 5.7x 5.0x 4.8x 4.3x 5.1x 7.1x Beauty 7.5x 7.7x 7.4x 6.3x 7.1x 7.0x 5.0x Elegant NA 13.1x 9.8x 7.3x 7.0x Historical trading data suggests that Elegant’s multiple compression has coincided with similar valuation pressure across lower-growth franchise companies, 0.0x Feb-16 Feb-17 Feb-18 Feb-19 Feb-20 Feb-21 Feb-22 Feb-23 Feb-24 Feb-25 Feb-26 including Wendy’s and Jack in the Box. These companies have also experienced growth deceleration Elegant Consensus 1 YR 12.8% 7.8% 5.8% 3.6% 1.1% forward growth rate Content must not go below this line Confidential | 41 Source: S&P Capital IQ as of 02/06/2026 1. As a result of lower traffic during the COVID-19 pandemic, EBITDA multiples for restaurants and other in-person franchise businesses were elevated through 2021
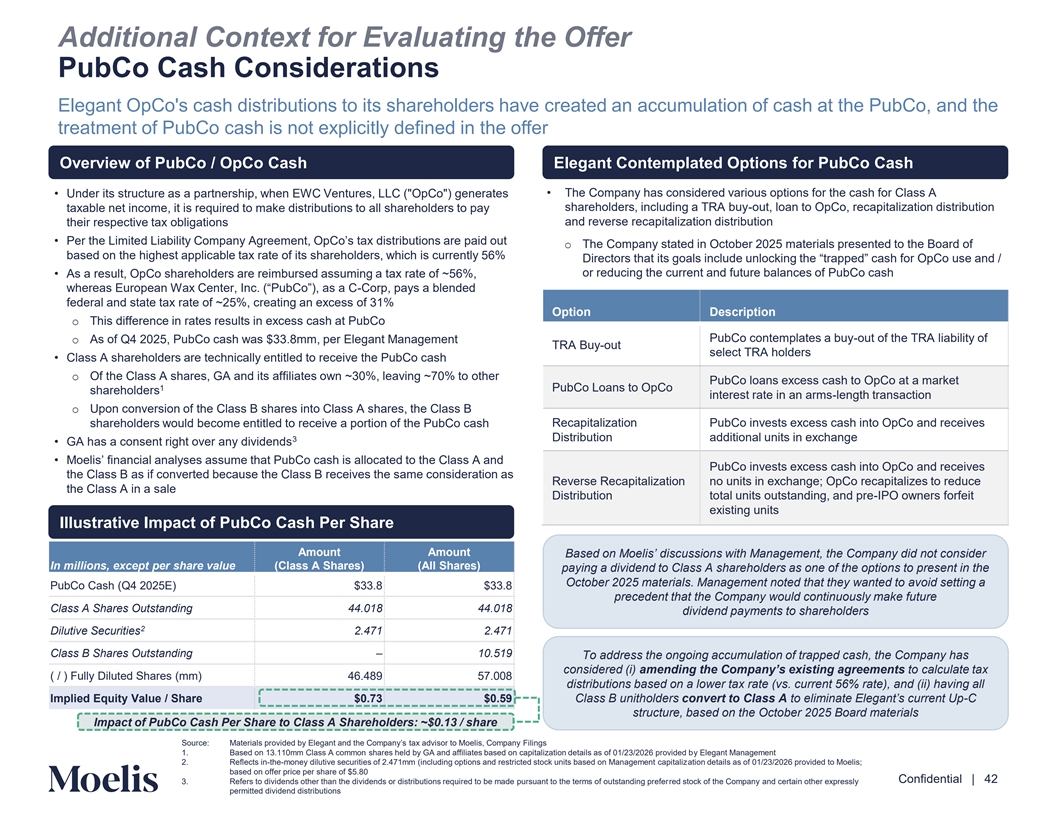
Additional Context for Evaluating the Offer PubCo Cash Considerations Elegant OpCo's cash distributions to its shareholders have created an accumulation of cash at the PubCo, and the treatment of PubCo cash is not explicitly defined in the offer Overview of PubCo / OpCo Cash Elegant Contemplated Options for PubCo Cash • Under its structure as a partnership, when EWC Ventures, LLC ( OpCo ) generates • The Company has considered various options for the cash for Class A taxable net income, it is required to make distributions to all shareholders to pay shareholders, including a TRA buy-out, loan to OpCo, recapitalization distribution and reverse recapitalization distribution their respective tax obligations • Per the Limited Liability Company Agreement, OpCo’s tax distributions are paid out o The Company stated in October 2025 materials presented to the Board of based on the highest applicable tax rate of its shareholders, which is currently 56% Directors that its goals include unlocking the “trapped” cash for OpCo use and / • As a result, OpCo shareholders are reimbursed assuming a tax rate of ~56%, or reducing the current and future balances of PubCo cash whereas European Wax Center, Inc. (“PubCo”), as -Corp a C , pays a blended federal and state tax rate of ~25%, creating an excess of 31% Option Description o This difference in rates results in excess cash at PubCo PubCo contemplates a buy-out of the TRA liability of o As of Q4 2025, PubCo cash was $33.8mm, per Elegant Management TRA Buy-out select TRA holders • Class A shareholders are technically entitled to receive the PubCo cash o Of the Class A shares, GA and its affiliates own ~30%, leaving ~70% to other PubCo loans excess cash to OpCo at a market 1 PubCo Loans to OpCo shareholders interest rate in an arms-length transaction o Upon conversion of the Class B shares into Class A shares, the Class B Recapitalization PubCo invests excess cash into OpCo and receives shareholders would become entitled to receive a portion of the PubCo cash Distribution additional units in exchange 3 • GA has a consent right over any dividends • Moelis’ financial analyses assume that PubCo cash is allocated to the Class A and PubCo invests excess cash into OpCo and receives the Class B as if converted because the Class B receives the same consideration as Reverse Recapitalization no units in exchange; OpCo recapitalizes to reduce the Class A in a sale Distribution total units outstanding, and pre-IPO owners forfeit existing units Illustrative Impact of PubCo Cash Per Share Amount Amount Based on Moelis’ discussions with Management, the Company did not consider In millions, except per share value (Class A Shares) (All Shares) paying a dividend to Class A shareholders as one of the options to present in the October 2025 materials. Management noted that they wanted to avoid setting a PubCo Cash (Q4 2025E) $33.8 $33.8 precedent that the Company would continuously make future Class A Shares Outstanding 44.018 44.018 dividend payments to shareholders 2 Dilutive Securities 2.471 2.471 Class B Shares Outstanding – 10.519 To address the ongoing accumulation of trapped cash, the Company has considered (i) amending the Company’s existing agreements to calculate tax ( / ) Fully Diluted Shares (mm) 46.489 57.008 distributions based on a lower tax rate (vs. current 56% rate), and (ii) having all Implied Equity Value / Share $0.73 $0.59 Class B unitholders convert to Class A to eliminate Elegant’s current Up-C structure, based on the October 2025 Board materials Impact of PubCo Cash Per Share to Class A Shareholders: ~$0.13 / share Source: Materials provided by Elegant and the Company’s tax advisor to Moelis, Company Filings Content must not 1. Based on 13.110mm Class A common shares held by GA and affiliates based on capitalization details as of 01/23/2026 provided by Elegant Management 2. Reflects in-the-money dilutive securities of 2.471mm (including options and restricted stock units based on Management capitalization details as of 01/23/2026 provided to Moelis; go below this line based on offer price per share of $5.80 Confidential | 42 3. Refers to dividends other than the dividends or distributions required to be made pursuant to the terms of outstanding preferred stock of the Company and certain other expressly permitted dividend distributions
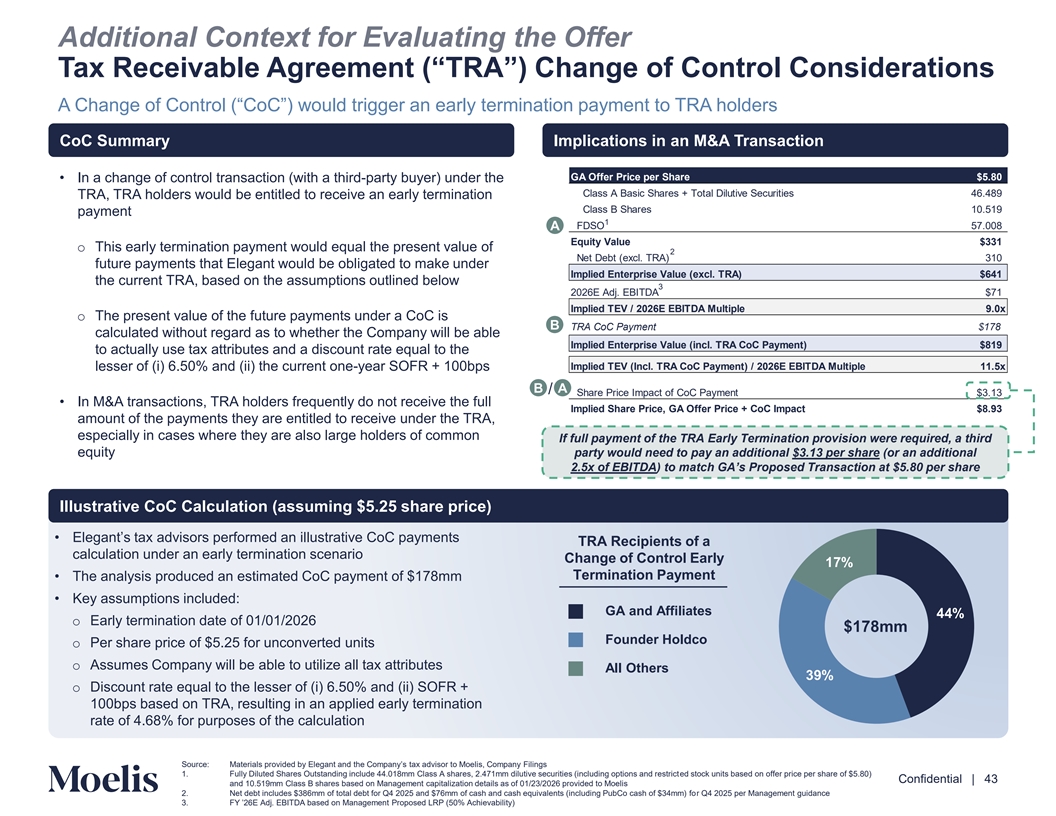
Additional Context for Evaluating the Offer Tax Receivable Agreement (“TRA”) Change of Control Considerations A Change of Control (“CoC”) would trigger an early termination payment to TRA holders CoC Summary Implications in an M&A Transaction GA Offer Price per Share $5.80 • In a change of control transaction (with a third-party buyer) under the Class A Basic Shares + Total Dilutive Securities 46.489 TRA, TRA holders would be entitled to receive an early termination Class B Shares 10.519 payment 1 FDSO 57.008 A Equity Value $331 o This early termination payment would equal the present value of 2 Net Debt (excl. TRA) 310 future payments that Elegant would be obligated to make under Implied Enterprise Value (excl. TRA) $641 the current TRA, based on the assumptions outlined below 3 2026E Adj. EBITDA $71 Implied TEV / 2026E EBITDA Multiple 9.0x o The present value of the future payments under a CoC is B TRA CoC Payment $178 calculated without regard as to whether the Company will be able Implied Enterprise Value (incl. TRA CoC Payment) $819 to actually use tax attributes and a discount rate equal to the lesser of (i) 6.50% and (ii) the current one-year SOFR + 100bps Implied TEV (Incl. TRA CoC Payment) / 2026E EBITDA Multiple 11.5x B A / Share Price Impact of CoC Payment $3.13 • In M&A transactions, TRA holders frequently do not receive the full Implied Share Price, GA Offer Price + CoC Impact $8.93 amount of the payments they are entitled to receive under the TRA, especially in cases where they are also large holders of common If full payment of the TRA Early Termination provision were required, a third equity party would need to pay an additional $3.13 per share (or an additional 2.5x of EBITDA) to match GA’s Proposed Transaction at $5.80 per share Illustrative CoC Calculation (assuming $5.25 share price) • Elegant’s tax advisors performed an illustrative CoC payments TRA Recipients of a calculation under an early termination scenario Change of Control Early Termination Payment • The analysis produced an estimated CoC payment of $178mm • Key assumptions included: GA and Affiliates o Early termination date of 01/01/2026 $178mm Founder Holdco o Per share price of $5.25 for unconverted units o Assumes Company will be able to utilize all tax attributes All Others o Discount rate equal to the lesser of (i) 6.50% and (ii) SOFR + 100bps based on TRA, resulting in an applied early termination rate of 4.68% for purposes of the calculation Content must not Source: Materials provided by Elegant and the Company’s tax adviso to r Moelis, Company Filings go below this line 1. Fully Diluted Shares Outstanding include 44.018mm Class A shares, 2.471mm dilutive securities (including options and restricted stock units based on offer price per share of $5.80) Confidential | 43 and 10.519mm Class B shares based on Management capitalization details as of 01/23/2026 provided to Moelis 2. Net debt includes $386mm of total debt for Q4 2025 and $76mm of cash and cash equivalents (including PubCo cash of $34mm) for Q4 2025 per Management guidance 3. FY ’26E Adj. EBITDA based on Management Proposed LRP (50% Achievability)
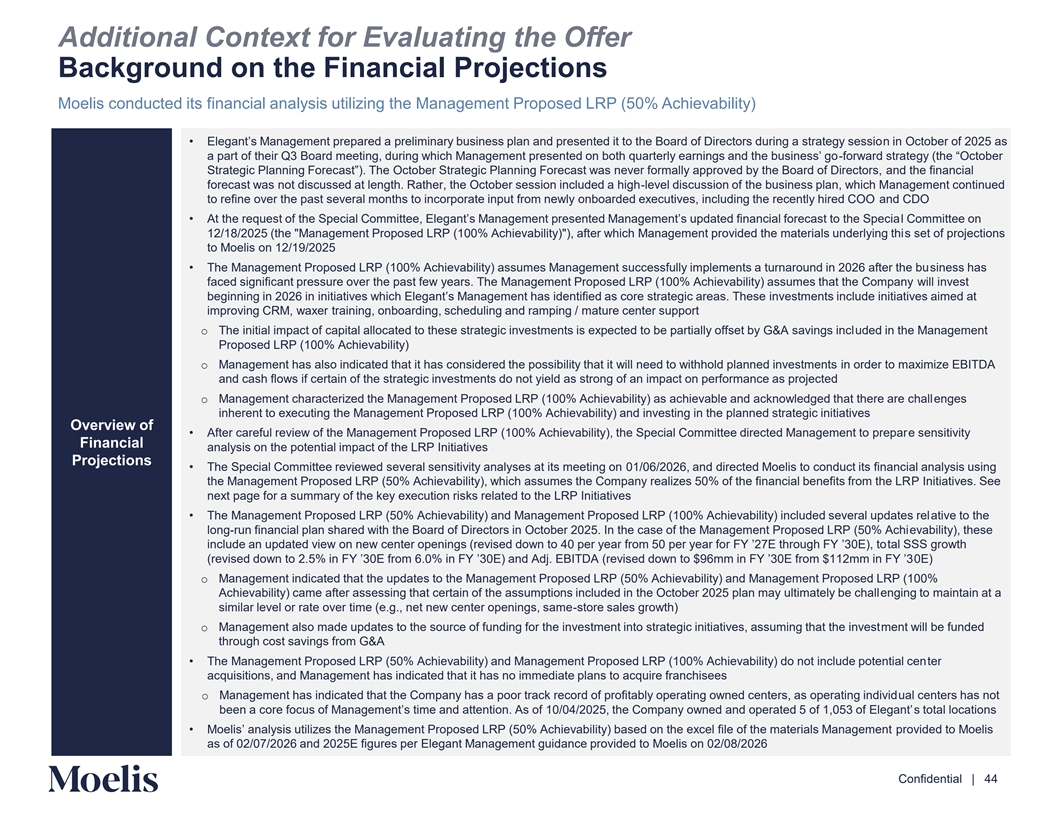
Additional Context for Evaluating the Offer Background on the Financial Projections Moelis conducted its financial analysis utilizing the Management Proposed LRP (50% Achievability) • Elegant’s Management prepared a preliminary business plan and presented it to the Board of Directors during a strate n gy in Oses ctosbe io r of 2025 as a part of their Q3 Board meeting, during which Management presented on both quarterly earnings and the bu-s foin rw es as rd ’ g so trategy (the “October Strategic Planning Forecast”). The October Strategic Planning Forecast was never formally approved by the Board of Dir ane dc th toers fi,nancial forecast was not discussed at length. Rather, the October session included a high-level discussion of the business plan, which Management continued to refine over the past several months to incorporate input from newly onboarded executives, including the recently hired COO and CDO • At the request of the Special Committee, Elegant’s Management presented Management’s updated financial forecast to thle C oSp me mciittaee on 12/18/2025 (the Management Proposed LRP (100% Achievability) ), after which Management provided the materials underlying this set of projections to Moelis on 12/19/2025 • The Management Proposed LRP (100% Achievability) assumes Management successfully implements a turnaround in 2026 after the business has faced significant pressure over the past few years. The Management Proposed LRP (100% Achievability) assumes that the Company will invest beginning in 2026 in initiatives which Elegant’s Management has identified as core strategic areas. These investments iniinc tiatilude ves aimed at improving CRM, waxer training, onboarding, scheduling and ramping / mature center support o The initial impact of capital allocated to these strategic investments is expected to be partially offset by G&A savings included in the Management Proposed LRP (100% Achievability) o Management has also indicated that it has considered the possibility that it will need to withhold planned investments in order to maximize EBITDA and cash flows if certain of the strategic investments do not yield as strong of an impact on performance as projected o Management characterized the Management Proposed LRP (100% Achievability) as achievable and acknowledged that there are challenges inherent to executing the Management Proposed LRP (100% Achievability) and investing in the planned strategic initiatives Overview of • After careful review of the Management Proposed LRP (100% Achievability), the Special Committee directed Management to prepare sensitivity Financial analysis on the potential impact of the LRP Initiatives Projections • The Special Committee reviewed several sensitivity analyses at its meeting on 01/06/2026, and directed Moelis to conduct its financial analysis using the Management Proposed LRP (50% Achievability), which assumes the Company realizes 50% of the financial benefits from the LRP Initiatives. See next page for a summary of the key execution risks related to the LRP Initiatives • The Management Proposed LRP (50% Achievability) and Management Proposed LRP (100% Achievability) included several updates relative to the long-run financial plan shared with the Board of Directors in October 2025. In the case of the Management Proposed LRP (50% Achievability), these include an updated view on new center openings (revised down to 0 per year from 50 per year for FY ’27E throughta FY l SSS g ’30E), rowto th (revised down to 2.5% in FY ’30E from 6.0% in FY ’30E) and Adj. EBITDA (revised down to $ 6mm in FY ’30E from $11 02 E)mm in FY ’3 o Management indicated that the updates to the Management Proposed LRP (50% Achievability) and Management Proposed LRP (100% Achievability) came after assessing that certain of the assumptions included in the October 2025 plan may ultimately be challenging to maintain at a similar level or rate over time (e.g., net new center openings, same-store sales growth) o Management also made updates to the source of funding for the investment into strategic initiatives, assuming that the investment will be funded through cost savings from G&A • The Management Proposed LRP (50% Achievability) and Management Proposed LRP (100% Achievability) do not include potential center acquisitions, and Management has indicated that it has no immediate plans to acquire franchisees o Management has indicated that the Company has a poor track record of profitably operating owned centers, as operating individual centers has not been a core focus of Management’s time and attention. As of 10/0 /2025, the Company owned and operated 5 of 1,053s o tof taEl l le og ca an tit’ ons • Moelis’ analysis utilizes the Management Proposed LRP (50% Achievability) based on the excel file of the materials Ma n praogveim deedn tto Moelis as of 02/07/2026 and 2025E figures per Elegant Management guidance provided to Moelis on 02/08/2026 Content must not go below this line Confidential | 44
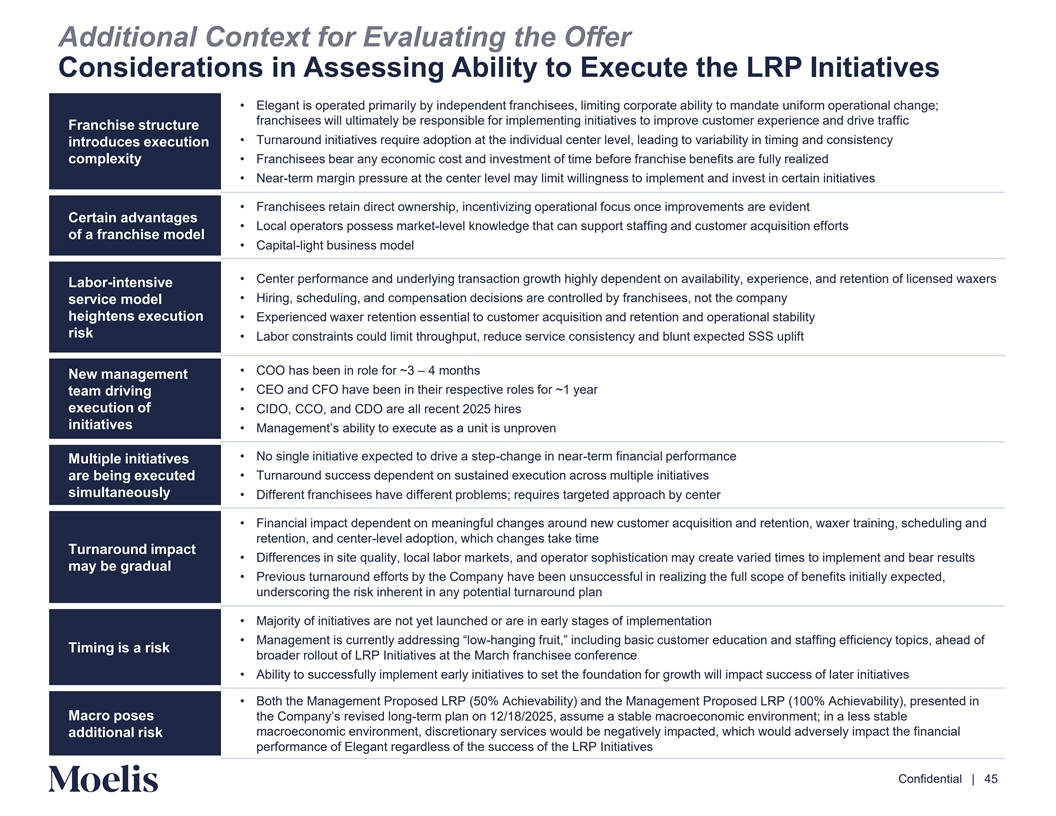
Additional Context for Evaluating the Offer Considerations in Assessing Ability to Execute the LRP Initiatives • Elegant is operated primarily by independent franchisees, limiting corporate ability to mandate uniform operational change; franchisees will ultimately be responsible for implementing initiatives to improve customer experience and drive traffic Franchise structure • Turnaround initiatives require adoption at the individual center level, leading to variability in timing and consistency introduces execution complexity • Franchisees bear any economic cost and investment of time before franchise benefits are fully realized • Near-term margin pressure at the center level may limit willingness to implement and invest in certain initiatives • Franchisees retain direct ownership, incentivizing operational focus once improvements are evident Certain advantages • Local operators possess market-level knowledge that can support staffing and customer acquisition efforts of a franchise model • Capital-light business model • Center performance and underlying transaction growth highly dependent on availability, experience, and retention of licensed waxers Labor-intensive • Hiring, scheduling, and compensation decisions are controlled by franchisees, not the company service model heightens execution • Experienced waxer retention essential to customer acquisition and retention and operational stability risk • Labor constraints could limit throughput, reduce service consistency and blunt expected SSS uplift • COO has been in role for ~3 – 4 months New management • CEO and CFO have been in their respective roles for ~1 year team driving execution of • CIDO, CCO, and CDO are all recent 2025 hires initiatives • Management’s ability to execute as a unit is unproven • No single initiative expected to drive a step-change in near-term financial performance Multiple initiatives are being executed • Turnaround success dependent on sustained execution across multiple initiatives simultaneously • Different franchisees have different problems; requires targeted approach by center • Financial impact dependent on meaningful changes around new customer acquisition and retention, waxer training, scheduling and retention, and center-level adoption, which changes take time Turnaround impact • Differences in site quality, local labor markets, and operator sophistication may create varied times to implement and bear results may be gradual • Previous turnaround efforts by the Company have been unsuccessful in realizing the full scope of benefits initially expected, underscoring the risk inherent in any potential turnaround plan • Majority of initiatives are not yet launched or are in early stages of implementation • Management is currently addressing “low -hanging fruit,” including basic customer education and staffing efficiency topics, ahea of d Timing is a risk broader rollout of LRP Initiatives at the March franchisee conference • Ability to successfully implement early initiatives to set the foundation for growth will impact success of later initiatives • Both the Management Proposed LRP (50% Achievability) and the Management Proposed LRP (100% Achievability), presented in Macro poses the Company’s revised long -term plan on 12/18/2025, assume a stable macroeconomic environment; in a less stable macroeconomic environment, discretionary services would be negatively impacted, which would adversely impact the financial additional risk performance of Elegant regardless of the success of the LRP Initiatives Content must not go below this line Confidential | 45
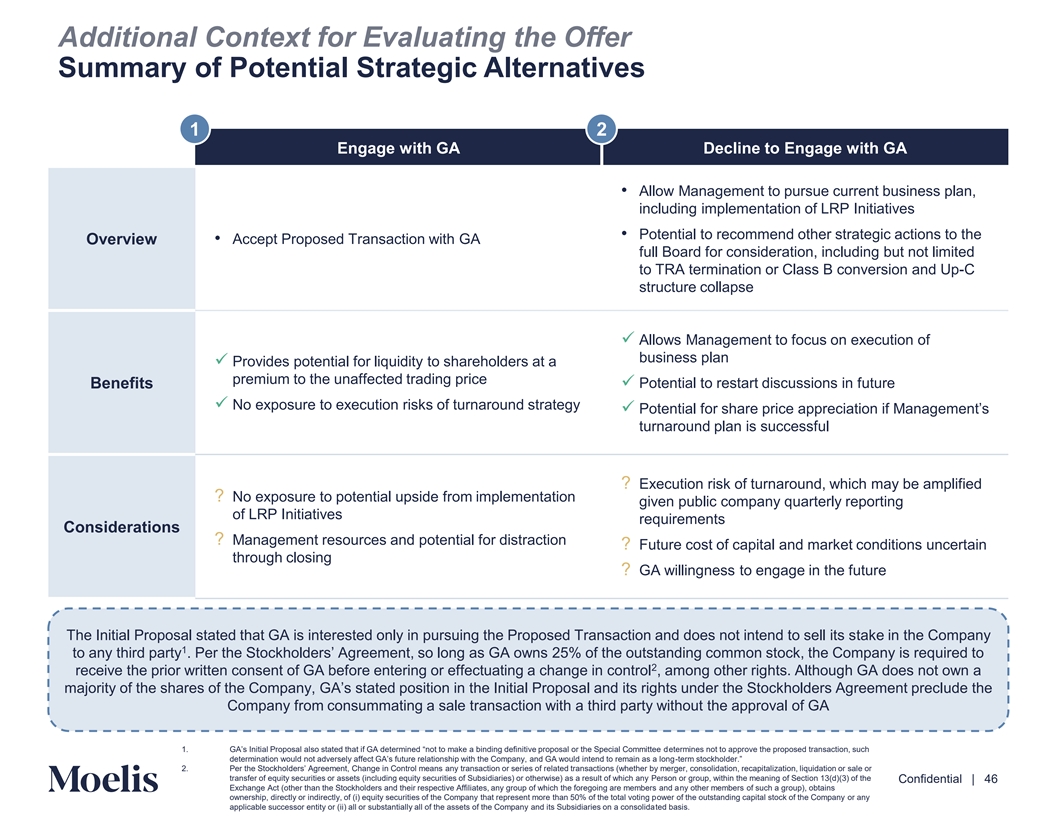
Additional Context for Evaluating the Offer Summary of Potential Strategic Alternatives 1 2 Engage with GA Decline to Engage with GA • Allow Management to pursue current business plan, including implementation of LRP Initiatives • Potential to recommend other strategic actions to the • Accept Proposed Transaction with GA Overview full Board for consideration, including but not limited to TRA termination or Class B conversion and Up-C structure collapse ✓ Allows Management to focus on execution of business plan ✓ Provides potential for liquidity to shareholders at a premium to the unaffected trading price ✓ Potential to restart discussions in future Benefits ✓ No exposure to execution risks of turnaround strategy ✓ Potential for share price appreciation if Management’s turnaround plan is successful ? Execution risk of turnaround, which may be amplified ? No exposure to potential upside from implementation given public company quarterly reporting of LRP Initiatives requirements Considerations ? Management resources and potential for distraction ? Future cost of capital and market conditions uncertain through closing ? GA willingness to engage in the future The Initial Proposal stated that GA is interested only in pursuing the Proposed Transaction and does not intend to sell its stake in the Company 1 to any third party . Per the Stockholders’ Agreement, so long as GA owns 25% of the outstanding common stock, the Company is required to 2 receive the prior written consent of GA before entering or effectuating a change in control , among other rights. Although GA does not own a majority of the shares of the Company, GA’s stated position in the Initial Proposal and its rights under the Stockholders Agree ud me en the t precl Company from consummating a sale transaction with a third party without the approval of GA 1. GA’s Initial Proposal also stated that if GA determined “not to make a binding definitive proposal or the Special Com eterm miitt ne ee s n dot to approve the proposed transaction, such Content must not determination would not adversely affect GA’s future relationship with the Company, and GA would intend to remain a -tes a rm sto lockh ng older.” go below this line 2. Per the Stockholders’ Agreement, Change in Control mea anns y transaction or series of related transactions (whether by merger, consolidation, recapitalization, liquidation or sale or transfer of equity securities or assets (including equity securities of Subsidiaries) or otherwise) as a result of which any Person or group, within the meaning of Section 13(d)(3) of the Confidential | 46 Exchange Act (other than the Stockholders and their respective Affiliates, any group of which the foregoing are members and any other members of such a group), obtains ownership, directly or indirectly, of (i) equity securities of the Company that represent more than 50% of the total voting power of the outstanding capital stock of the Company or any applicable successor entity or (ii) all or substantially all of the assets of the Company and its Subsidiaries on a consolidated basis.

G. Summary of Management Financial Projections Content must not go below this line Confidential | 47

Summary of Management Financial Projections Management Proposed LRP (50% Achievability) Forecast Summary ($ in millions, except per share data) FY26 FY27 FY28 FY29 FY30 Total System-Wide Sales $945 $967 $1,000 $1,039 $1,083 1 % Growth (0.3%) 2.4% 3.4% 3.9% 4.2% SSS% 1.5% 1.4% 1.9% 2.1% 2.5% Mature SSS% (0.2%) 1.1% 0.7% 0.3% 0.4% Total Revenue $211 $215 $224 $235 $247 1 % Growth 2.2% 1.9% 3.8% 5.3% 5.0% Gross Profit $155 $159 $165 $174 $182 % Margin 73.2% 73.8% 74.0% 73.9% 73.8% 2 Adj. EBITDA $71 $75 $81 $88 $96 % Margin 33.8% 34.8% 36.3% 37.6% 39.0% 1 % Growth (2.3%) 4.9% 8.2% 9.0% 9.0% Memo: Capital Expenditures $4 $3 $3 $3 $3 Depreciation and Amortization 20 24 19 10 4 3 Change in Net Working Capital (4) 1 1 0 1 Stock Based Compensation 10 10 10 11 11 Content must not Source: Management Proposed LRP (50% Achievability) provided to Moelis on 12/30/2025 go below this line 1. 2026E system-wide sales, revenue and EBITDA growth reflects 2025E figures per Elegant Management guidance provided to Moelis on 02/08/2026 Confidential | 48 2. Reflects Adj. EBITDA post non-recurring investments and unburdened by stock-based compensation (“SBC”), consistent with Managem nt’s e presentation of Adj. EBITDA 3. Change in Net Working Capital (“NWC”) does not include the impact of deferred tax assets (“DTAs”)
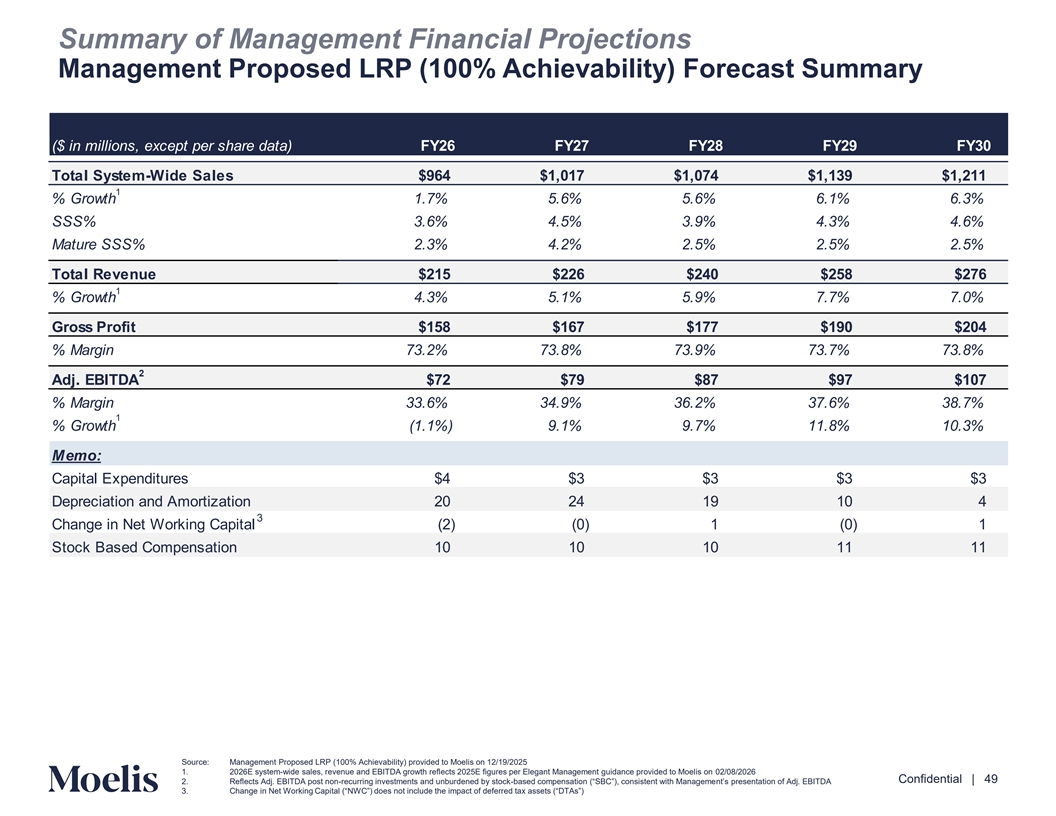
Summary of Management Financial Projections Management Proposed LRP (100% Achievability) Forecast Summary ($ in millions, except per share data) FY26 FY27 FY28 FY29 FY30 Total System-Wide Sales $964 $1,017 $1,074 $1,139 $1,211 1 % Growth 1.7% 5.6% 5.6% 6.1% 6.3% SSS% 3.6% 4.5% 3.9% 4.3% 4.6% Mature SSS% 2.3% 4.2% 2.5% 2.5% 2.5% Total Revenue $215 $226 $240 $258 $276 1 % Growth 4.3% 5.1% 5.9% 7.7% 7.0% Gross Profit $158 $167 $177 $190 $204 % Margin 73.2% 73.8% 73.9% 73.7% 73.8% 2 Adj. EBITDA $72 $79 $87 $97 $107 % Margin 33.6% 34.9% 36.2% 37.6% 38.7% 1 % Growth (1.1%) 9.1% 9.7% 11.8% 10.3% Memo: Capital Expenditures $4 $3 $3 $3 $3 Depreciation and Amortization 20 24 19 10 4 3 Change in Net Working Capital (2) (0) 1 (0) 1 Stock Based Compensation 10 10 10 11 11 Content must not Source: Management Proposed LRP (100% Achievability) provided to Moelis on 12/19/2025 go below this line 1. 2026E system-wide sales, revenue and EBITDA growth reflects 2025E figures per Elegant Management guidance provided to Moelis on 02/08/2026 Confidential | 49 2. Reflects Adj. EBITDA post non-recurring investments and unburdened by stock-based compensation (“SBC”), consistent with Managem nt’s e presentation of Adj. EBITDA 3. Change in Net Working Capital (“NWC”) does not include the impact of deferred tax assets (“DTAs”)

H. Additional Elegant Information Content must not go below this line Confidential | 50
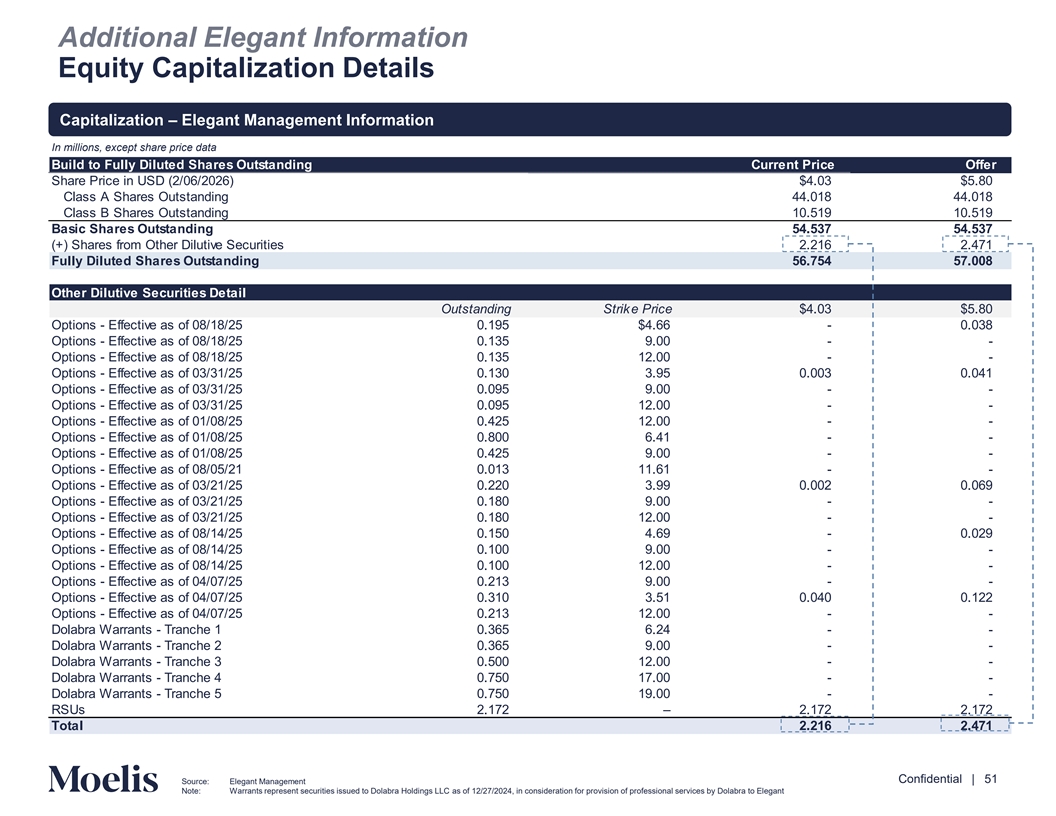
Additional Elegant Information Equity Capitalization Details Capitalization – Elegant Management Information In millions, except share price data Build to Fully Diluted Shares Outstanding Current Price Offer Share Price in USD (2/06/2026) $4.03 $5.80 Class A Shares Outstanding 44.018 44.018 Class B Shares Outstanding 10.519 10.519 Basic Shares Outstanding 54.537 54.537 (+) Shares from Other Dilutive Securities 2.216 2.471 Fully Diluted Shares Outstanding 56.754 57.008 Other Dilutive Securities Detail Outstanding Strike Price $4.03 $5.80 Options - Effective as of 08/18/25 0.195 $4.66 - 0.038 Options - Effective as of 08/18/25 0.135 9.00 - - Options - Effective as of 08/18/25 0.135 12.00 - - Options - Effective as of 03/31/25 0.130 3.95 0.003 0.041 Options - Effective as of 03/31/25 0.095 9.00 - - Options - Effective as of 03/31/25 0.095 12.00 - - Options - Effective as of 01/08/25 0.425 12.00 - - Options - Effective as of 01/08/25 0.800 6.41 - - Options - Effective as of 01/08/25 0.425 9.00 - - Options - Effective as of 08/05/21 0.013 11.61 - - Options - Effective as of 03/21/25 0.220 3.99 0.002 0.069 Options - Effective as of 03/21/25 0.180 9.00 - - Options - Effective as of 03/21/25 0.180 12.00 - - Options - Effective as of 08/14/25 0.150 4.69 - 0.029 Options - Effective as of 08/14/25 0.100 9.00 - - Options - Effective as of 08/14/25 0.100 12.00 - - Options - Effective as of 04/07/25 0.213 9.00 - - Options - Effective as of 04/07/25 0.310 3.51 0.040 0.122 Options - Effective as of 04/07/25 0.213 12.00 - - Dolabra Warrants - Tranche 1 0.365 6.24 - - Dolabra Warrants - Tranche 2 0.365 9.00 - - Dolabra Warrants - Tranche 3 0.500 12.00 - - Dolabra Warrants - Tranche 4 0.750 17.00 - - Dolabra Warrants - Tranche 5 0.750 19.00 - - RSUs 2.172 – 2.172 2.172 Total 2.216 2.471 Content must not go below this line Confidential | 51 Source: Elegant Management Note: Warrants represent securities issued to Dolabra Holdings LLC as of 12/27/2024, in consideration for provision of professional services by Dolabra to Elegant
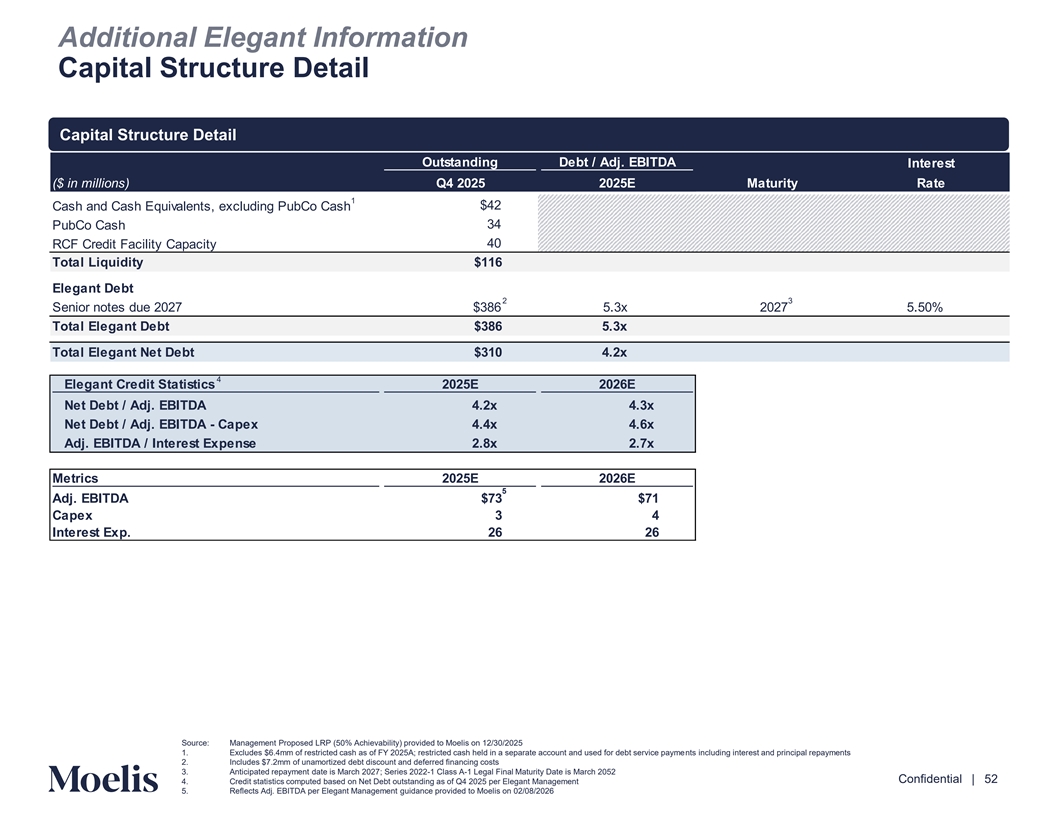
Additional Elegant Information Capital Structure Detail Capital Structure Detail Outstanding Debt / Adj. EBITDA Interest ($ in millions) Q4 2025 2025E Maturity Rate 1 $42 Cash and Cash Equivalents, excluding PubCo Cash PubCo Cash 34 40 RCF Credit Facility Capacity Total Liquidity $116 Elegant Debt 2 3 Senior notes due 2027 $386 5.3x 2027 5.50% Total Elegant Debt $386 5.3x Total Elegant Net Debt $310 4.2x 4 Elegant Credit Statistics 2025E 2026E Net Debt / Adj. EBITDA 4.2x 4.3x Net Debt / Adj. EBITDA - Capex 4.4x 4.6x Adj. EBITDA / Interest Expense 2.8x 2.7x Metrics 2025E 2026E 5 Adj. EBITDA $73 $71 Capex 3 4 Interest Exp. 26 26 Source: Management Proposed LRP (50% Achievability) provided to Moelis on 12/30/2025 Content must not 1. Excludes $6.4mm of restricted cash as of FY 2025A; restricted cash held in a separate account and used for debt service payments including interest and principal repayments 2. Includes $7.2mm of unamortized debt discount and deferred financing costs go below this line 3. Anticipated repayment date is March 2027; Series 2022-1 Class A-1 Legal Final Maturity Date is March 2052 Confidential | 52 4. Credit statistics computed based on Net Debt outstanding as of Q4 2025 per Elegant Management 5. Reflects Adj. EBITDA per Elegant Management guidance provided to Moelis on 02/08/2026
Disclaimer This presentation has been prepared by Moelis & Company LLC (“Moelis”) solely for the information and assistance of al tC he omm Spe ittci ee of the Board of Directors of the company codenamed “Elegant” (the “Company”) in considering the matters referred to in t erihe als. se Thi ms at presentation is confidential and may not be disclosed (in whole or in part) or utilized for other purposes without the express prior written consent of Moelis. This presentation has been prepared based on information provided by the Company and/or from third party sources. Moelis assumed such information is complete and accurate in all material respects. Moelis has not independently verified such information (or assumed responsibility for the independent verification of such information). To the extent this presentation includes projections, forecasts or other forward-looking statements, Moelis has assumed that such information was reasonably prepared based on the best currently available estimates and judgments of the Company and/or other parties as to the future performance of the Company and/or such other parties. Moelis expresses no views as to the reasonableness of any such projections, forecasts or other forward-looking statements or the assumptions on which they are based. Moelis has not made any independent evaluation or appraisal of any of the assets or liabilities (contingent, derivative, off-balance-sheet, or otherwise) of the Company or any other party. Moelis’ participation in any due diligence review is solely for purposes of supdv poir ce ting an id ts anaalysis. This presentation is based on economic, monetary, market and other conditions as in effect on, and the information made available to us as of, the date hereof, and Moelis assumes no obligation to update this presentation or correct any information herein. No company or transaction used in this presentation is identical to the Company or any potential transaction. The analyses set forth in this presentation do not purport to be appraisals and such analyses do not reflect Moelis’ views of the prices at which businesses or secu actual ritlyies may be sold. Because the analyses described in these materials (including the information used in such analyses) are inherently subject to uncertainty, Moelis does not assume responsibility if future results are materially different from those forecast. This presentation was designed for use by certain persons familiar with the business of the Company. This presentation is not intended to provide the sole basis for any decision on any transaction or strategic alternative and is not a recommendation with respect to any transaction or strategic alternative. This presentation does not address the Special Committee’s underlying business decision to ex repl comm ore or end any transaction or strategic alternative or the relative merits of any transaction or strategic alternative as compared to any alternative business strategies or transactions that might be available to the Company. Nothing contained in this presentation should be construed as legal, regulatory, tax or accounting advice. Moelis and its affiliates are engaged globally in a wide range of investment banking and other activities for their own account and otherwise. Moelis and its affiliates may have advised, may seek to advise and may in the future advise in companies referred to in this presentation. Personnel of Moelis or such affiliates may make statements or provide advice that is contrary to information included in this presentation. The proprietary interests of Moelis or its affiliates may conflict with your interests. In addition, Moelis and its affiliates and their personnel may from time to time have positions in or effect transactions in securities referred to in this material (or derivatives of such securities), or serve as a director of companies referred to in this presentation. Content must not go below this line Confidential | 53