Exhibit (c)(17)
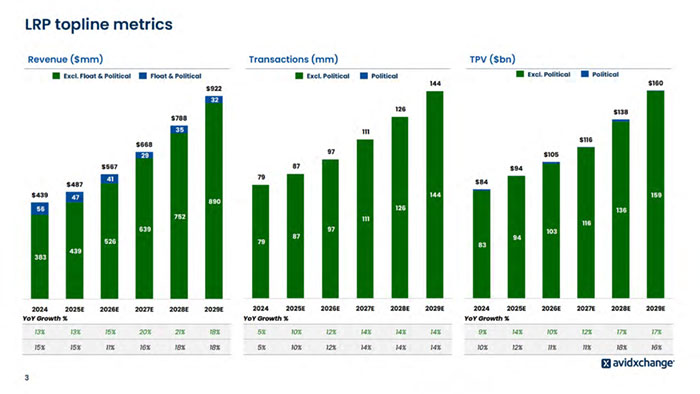
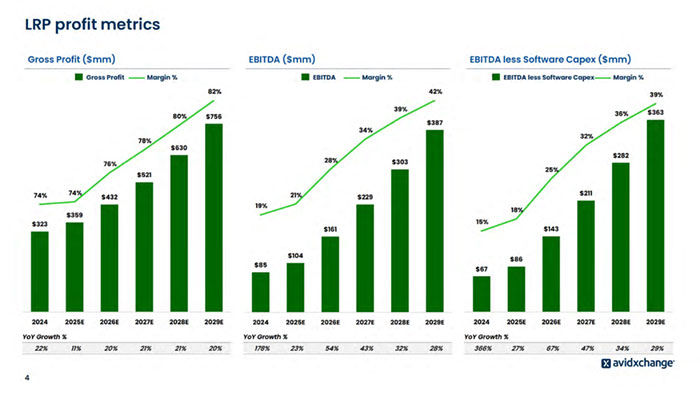
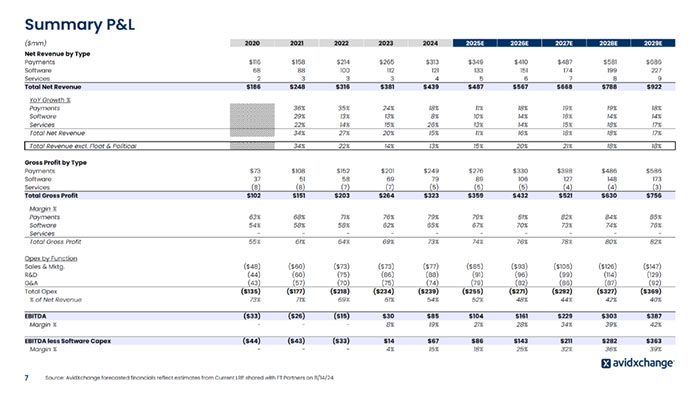
Summary P&L ($mm) 2020 2021 2022 2023 2024 2025E 2026E 2027E 2028E 2029E Net Revenue by Type Payments $116 $158 $214 $265 $313 $349 $410 $487 $581 $686 Software 68 88 100 112 121 133 151 174 199 227 Services 2 3 3 3 4 5 6 7 8 9 Total Net Revenue $186 $248 $316 $381 $439 $487 $567 $668 $788 $922 YoY Growth % Payments 36% 35% 24% 18% 11% 18% 19% 19% 18% Software 29% 13% 13% 8% 10% 14% 16% 14% 14% Services 22% 14% 15% 26% 13% 14% 15% 18% 17% Total Net Revenue 34% 27% 20% 15% 11% 16% 18% 18% 17% Total Revenue excl. Float & Political 34% 22% 14% 13% 15% 20% 21% 18% 18% Gross Profit by Type Payments $73 $108 $152 $201 $249 $276 $330 $398 $486 $586 Software 37 51 58 69 79 89 106 127 148 173 Services (8) (8) (7) (7) (5) (5) (5) (4) (4) (3) Total Gross Profit $102 $151 $203 $264 $323 $359 $432 $521 $630 $756 Margin % Payments 63% 68% 71% 76% 79% 79% 81% 82% 84% 85% Software 54% 58% 58% 62% 65% 67% 70% 73% 74% 76% Services - - - - - - - - - - Total Gross Profit 55% 61% 64% 69% 73% 74% 76% 78% 80% 82% Opex by Function Sales & Mktg. ($48) ($60) ($73) ($73) ($77) ($85) ($93) ($106) ($126) ($147) R&D (44) (60) (75) (86) (88) (91) (96) (99) (114) (129) G&A (43) (57) (70) (75) (74) (79) (82) (86) (87) (92) Total Opex ($135) ($177) ($218) ($234) ($239) ($255) ($271) ($292) ($327) ($369) % of Net Revenue 73% 71% 69% 61% 54% 52% 48% 44% 42% 40% EBITDA ($33) ($26) ($15) $30 $85 $104 $161 $229 $303 $387 Margin % - - - 8% 19% 21% 28% 34% 39% 42% EBITDA less Software Capex ($44) ($43) ($33) $14 $67 $86 $143 $211 $282 $363 Margin % - - - 4% 15% 18% 25% 32% 36% 39% Source: AvidXchange forecasted financials reflect estimates from Current LRP shared 7 with FT Partners on 11/14/24
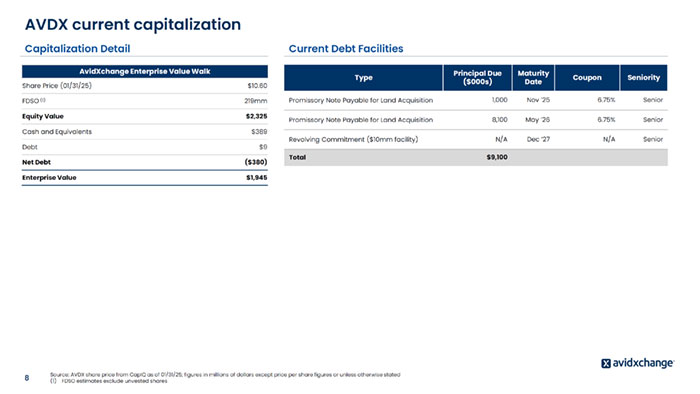
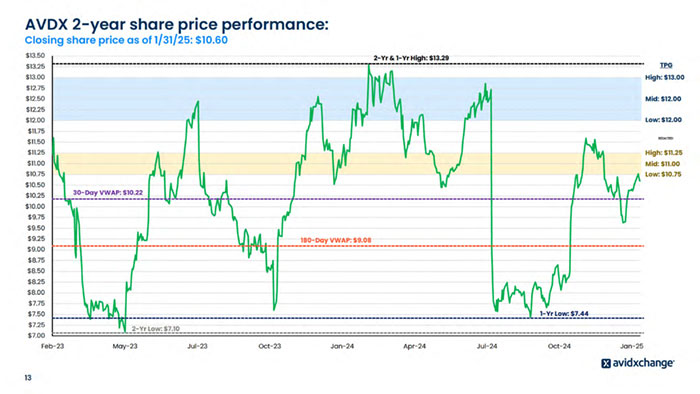
AVDX current capitalization Source: AVDX share price from CapIQ as of 01/31/25; figures in millions of dollars except price per share figures or unless otherwise stated (1) FDSO estimates exclude unvested shares AvidXchange Enterprise Value Walk Share Price (01/31/25) $10.60 FDSO (1) 219mm Equity Value $2,325 Cash and Equivalents $389 Debt $9 Net Debt ($380) Enterprise Value $1,945 Type Principal Due ($000s) Maturity Date Coupon Seniority Promissory Note Payable for Land Acquisition 1,000 Nov ’25 6.75% Senior Promissory Note Payable for Land Acquisition 8,100 May ’26 6.75% Senior Revolving Commitment ($10mm facility) N/A Dec ’27 N/A Senior Total $9,100 Capitalization Detail Current Debt Facilities 8

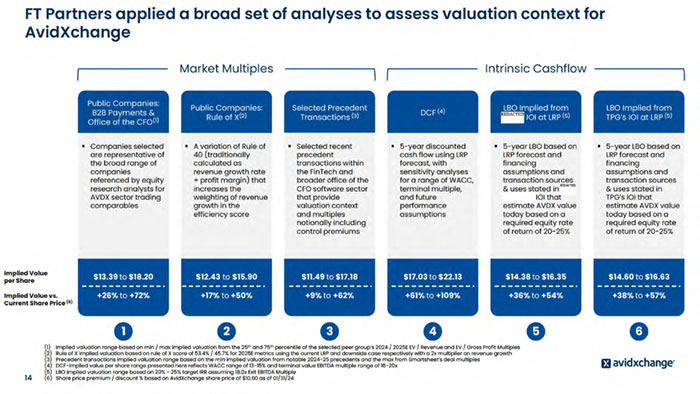
valuation considerations
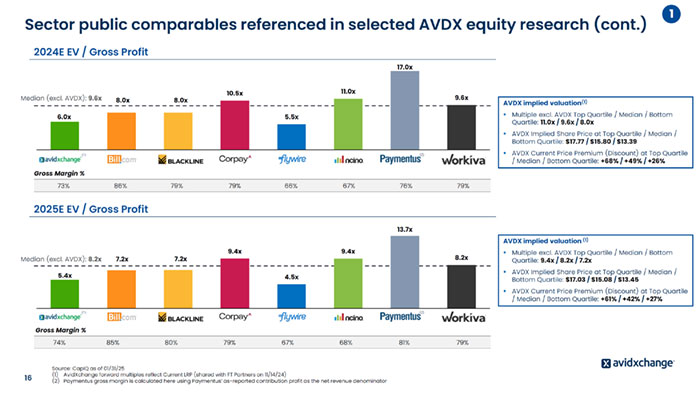
Source: CapIQ as of 01/31/25 (1) AvidXchange forward multiples reflect Current LRP (shared with FT Partners on 11/14/24) (2) Paymentus gross margin is calculated here using Paymentus’ as-reported contribution profit as the net revenue denominator 2025E EV / Gross Profit 2024E EV / Gross Profit 6.0x 8.0x 8.0x 10.5x 5.5x 11.0x 17.0x 9.6x 5.4x 7.2x 7.2x 9.4x 4.5x 9.4x 13.7x 8.2x 1 Median (excl. AVDX): 9.6x Median (excl. AVDX): 8.2x AVDX implied valuation(1) ? Multiple excl. AVDX Top Quartile / Median / Bottom Quartile: 11.0x / 9.6x / 8.0x ? AVDX Implied Share Price at Top Quartile / Median / Bottom Quartile: $17.77 / $15.80 / $13.39 ? AVDX Current Price Premium (Discount) at Top Quartile / Median / Bottom Quartile: +68% / +49% / +26% AVDX implied valuation (1) ? Multiple excl. AVDX Top Quartile / Median / Bottom Quartile: 9.4x / 8.2x / 7.2x ? AVDX Implied Share Price at Top Quartile / Median / Bottom Quartile: $17.03 / $15.08 / $13.45 ? AVDX Current Price Premium (Discount) at Top Quartile / Median / Bottom Quartile: +61% / +42% / +27% Sector public comparables referenced in selected AVDX equity research (cont.) 16 (1) (2) (1) (2) Gross Margin % 74% 85% 80% 79% 67% 68% 81% 79% Gross Margin % 73% 86% 79% 79% 66% 67% 76% 79%
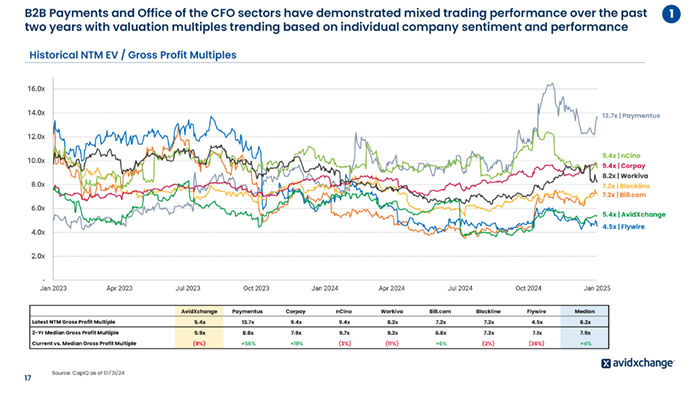
- 2.0x 4.0x 6.0x 8.0x 10.0x 12.0x 14.0x 16.0x Jan 2023 Apr 2023 Jul 2023 Oct 2023 Jan 2024 Apr 2024 Jul 2024 Oct 2024 Jan 2025 Source: CapIQ as of 01/31/24 Historical NTM EV / Gross Profit Multiples 13.7x | Paymentus 4.5x | Flywire 7.2x | Bill.com 5.4x | AvidXchange 7.2x | Blackline 9.4x | Corpay 9.4x | nCino 8.2x | Workiva AvidXchange Paymentus Corpay nCino Workiva Bill.com Blackline Flywire Median Latest NTM Gross Profit Multiple 5.4x 13.7x 9.4x 9.4x 8.2x 7.2x 7.2x 4.5x 8.2x 2-Yr Median Gross Profit Multiple 5.9x 8.8x 7.9x 9.7x 9.2x 6.8x 7.3x 7.1x 7.9x Current vs. Median Gross Profit Multiple (9%) +56% +19% (3%) (11%) +6% (2%) (36%) +4% 1 17 B2B Payments and Office of the CFO sectors have demonstrated mixed trading performance over the past two years with valuation multiples trending based on individual company sentiment and performance
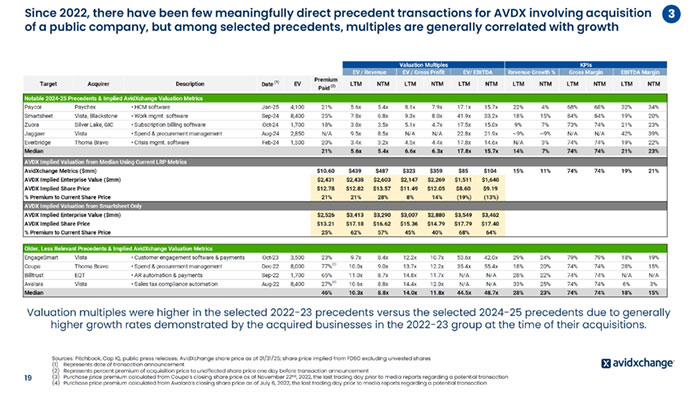
Valuation Multiples KPIs EV / Revenue EV / Gross Profit EV/ EBITDA Revenue Growth % Gross Margin EBITDA Margin Target Acquirer Description Date (1) EV Premium Paid (2) LTM NTM LTM NTM LTM NTM LTM NTM LTM NTM LTM NTM Notable 2024-25 Precedents & Implied AvidXchange Valuation Metrics Paycor Paychex • HCM software Jan-25 4,100 21% 5.6x 5.4x 8.1x 7.9x 17.1x 15.7x 22% 4% 68% 68% 32% 34% Smartsheet Vista, Blackstone • Work mgmt. software Sep-24 8,400 25% 7.8x 6.8x 9.3x 8.0x 41.9x 33.2x 18% 15% 84% 84% 19% 20% Zuora Silver Lake, GIC • Subscription billing software Oct-24 1,700 18% 3.8x 3.5x 5.1x 4.7x 17.5x 15.0x 9% 7% 73% 74% 21% 23% Jaggaer Vista • Spend & procurement management Aug-24 2,850 N/A 9.5x 8.5x N/A N/A 22.8x 21.9x ~9% ~9% N/A N/A 42% 39% Everbridge Thoma Bravo • Crisis mgmt. software Feb-24 1,500 20% 3.4x 3.2x 4.5x 4.4x 17.8x 14.6x N/A 3% 74% 74% 19% 22% Median 21% 5.6x 5.4x 6.6x 6.3x 17.8x 15.7x 14% 7% 74% 74% 21% 23% AVDX Implied Valuation from Median Using Current LRP Metrics AvidXchange Metrics ($mm) $10.60 $439 $487 $323 $359 $85 $104 15% 11% 74% 74% 19% 21% AVDX Implied Enterprise Value ($mm) $2,431 $2,438 $2,603 $2,147 $2,269 $1,511 $1,640 AVDX Implied Share Price $12.78 $12.82 $13.57 $11.49 $12.05 $8.60 $9.19 % Premium to Current Share Price 21% 21% 28% 8% 14% (19%) (13%) AVDX Implied Valuation from Smartsheet Only AVDX Implied Enterprise Value ($mm) $2,526 $3,413 $3,290 $3,007 $2,880 $3,549 $3,462 AVDX Implied Share Price $13.21 $17.18 $16.62 $15.36 $14.79 $17.79 $17.40 % Premium to Current Share Price 25% 62% 57% 45% 40% 68% 64% Older, Less Relevant Precedents & Implied AvidXchange Valuation Metrics EngageSmart Vista • Customer engagement software & payments Oct-23 3,500 23% 9.7x 8.4x 12.2x 10.7x 53.6x 42.0x 29% 24% 79% 79% 18% 19% Coupa Thoma Bravo • Spend & procurement management Dec-22 8,000 77% 10.0x 9.0x 13.7x 12.2x 35.4x 55.4x 18% 20% 74% 74% 28% 15% Billtrust EQT • AR automation & payments Sep-22 1,700 65% 11.0x 8.7x 14.8x 11.7x N/A N/A 28% 22% 74% 74% N/A N/A Avalara Vista • Sales tax compliance automation Aug-22 8,400 27% 10.6x 8.8x 14.4x 12.0x N/A N/A 33% 25% 74% 74% 6% 3% Median 46% 10.3x 8.8x 14.0x 11.8x 44.5x 48.7x 28% 23% 74% 74% 18% 15% Since 2022, there have been few meaningfully direct precedent transactions for AVDX involving acquisition of a public company, but among selected precedents, multiples are generally correlated with growth Sources: Pitchbook, Cap IQ, public press releases; AvidXchange share price as of 01/31/25; share price implied from FDSO excluding unvested shares (1) Represents date of transaction announcement (2) Represents percent premium of acquisition price to unaffected share price one day before transaction announcement (3) Purchase price premium calculated from Coupa’s closing share price as of November 22nd, 2022, the last trading day prior to media reports regarding a potential transaction (4) Purchase price premium calculated from Avalara’s closing share price as of July 6, 2022, the last trading day prior to media reports regarding a potential transaction (3) (4) Valuation multiples were higher in the selected 2022-23 precedents versus the selected 2024-25 precedents due to generally higher growth rates demonstrated by the acquired businesses in the 2022-23 group at the time of their acquisitions. 3 19
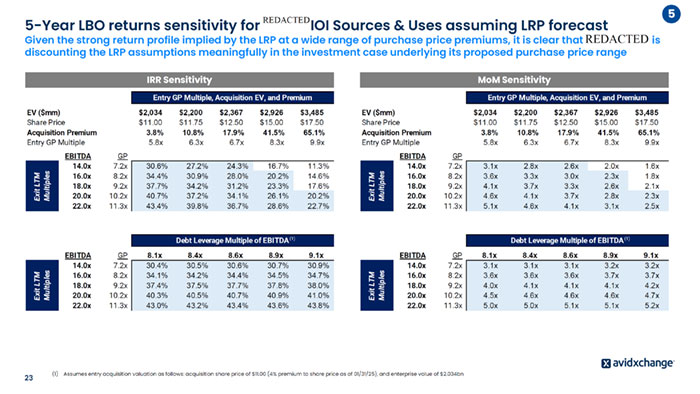
(1) Assumes entry acquisition valuation as follows: acquisition share price of $11.00 (4% premium to share price as of 01/31/25), and enterprise value of $2.034bn IRR Sensitivity MoM Sensitivity Entry GP Multiple, Acquisition EV, and Premium EV ($mm) $2,034 $2,200 $2,367 $2,926 $3,485 Share Price $11.00 $11.75 $12.50 $15.00 $17.50 Acquisition Premium 3.8% 10.8% 17.9% 41.5% 65.1% Entry GP Multiple 5.8x 6.3x 6.7x 8.3x 9.9x EBITDA GP 14.0x 7.2x 3.1x 2.8x 2.6x 2.0x 1.6x 16.0x 8.2x 3.6x 3.3x 3.0x 2.3x 1.8x 18.0x 9.2x 4.1x 3.7x 3.3x 2.6x 2.1x 20.0x 10.2x 4.6x 4.1x 3.7x 2.8x 2.3x 22.0x 11.3x 5.1x 4.6x 4.1x 3.1x 2.5x Exit LTM Multiples Entry GP Multiple, Acquisition EV, and Premium EV ($mm) $2,034 $2,200 $2,367 $2,926 $3,485 Share Price $11.00 $11.75 $12.50 $15.00 $17.50 Acquisition Premium 3.8% 10.8% 17.9% 41.5% 65.1% Entry GP Multiple 5.8x 6.3x 6.7x 8.3x 9.9x EBITDA GP 14.0x 7.2x 30.6% 27.2% 24.3% 16.7% 11.3% 16.0x 8.2x 34.4% 30.9% 28.0% 20.2% 14.6% 18.0x 9.2x 37.7% 34.2% 31.2% 23.3% 17.6% 20.0x 10.2x 40.7% 37.2% 34.1% 26.1% 20.2% 22.0x 11.3x 43.4% 39.8% 36.7% 28.6% 22.7% Exit LTM Multiples Debt Leverage Multiple of EBITDA EBITDA GP 8.1x 8.4x 8.6x 8.9x 9.1x 14.0x 7.2x 30.4% 30.5% 30.6% 30.7% 30.9% 16.0x 8.2x 34.1% 34.2% 34.4% 34.5% 34.7% 18.0x 9.2x 37.4% 37.5% 37.7% 37.8% 38.0% 20.0x 10.2x 40.3% 40.5% 40.7% 40.9% 41.0% 22.0x 11.3x 43.0% 43.2% 43.4% 43.6% 43.8% Exit LTM Multiples 5 23 5-Year LBO returns sensitivity for IOI Sources & Uses assuming LRP forecast Given the strong return profile implied by the LRP at a wide range of purchase price premiums, it is clear that is discounting the LRP assumptions meaningfully in the investment case underlying its proposed purchase price range Debt Leverage Multiple of EBITDA EBITDA GP 8.1x 8.4x 8.6x 8.9x 9.1x 14.0x 7.2x 3.1x 3.1x 3.1x 3.2x 3.2x 16.0x 8.2x 3.6x 3.6x 3.6x 3.7x 3.7x 18.0x 9.2x 4.0x 4.1x 4.1x 4.1x 4.2x 20.0x 10.2x 4.5x 4.6x 4.6x 4.6x 4.7x 22.0x 11.3x 5.0x 5.0x 5.1x 5.1x 5.2x Exit LTM Multiples (1) (1) REDACTED REDACTED
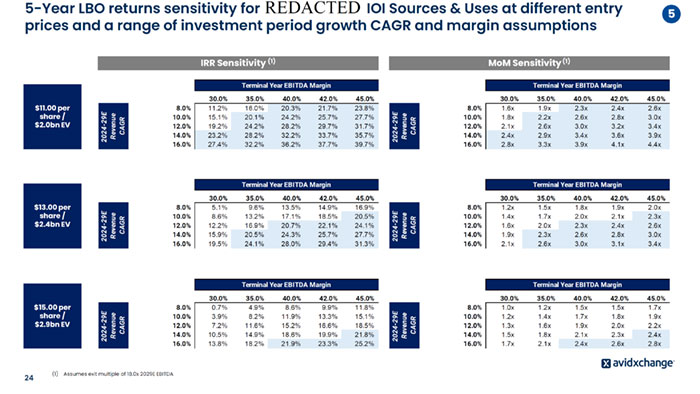
5 24 5-Year LBO returns sensitivity for IOI Sources & Uses at different entry prices and a range of investment period growth CAGR and margin assumptions IRR Sensitivity (1) MoM Sensitivity (1) Terminal Year EBITDA Margin 30.0% 35.0% 40.0% 42.0% 45.0% 8.0% 1.6x 1.9x 2.3x 2.4x 2.6x 10.0% 1.8x 2.2x 2.6x 2.8x 3.0x 12.0% 2.1x 2.6x 3.0x 3.2x 3.4x 14.0% 2.4x 2.9x 3.4x 3.6x 3.9x 16.0% 2.8x 3.3x 3.9x 4.1x 4.4x 2024-29E Revenue CAGR Terminal Year EBITDA Margin 30.0% 35.0% 40.0% 42.0% 45.0% 8.0% 11.2% 16.0% 20.3% 21.7% 23.8% 10.0% 15.1% 20.1% 24.2% 25.7% 27.7% 12.0% 19.2% 24.2% 28.2% 29.7% 31.7% 14.0% 23.2% 28.2% 32.2% 33.7% 35.7% 16.0% 27.4% 32.2% 36.2% 37.7% 39.7% 2024-29E Revenue CAGR $11.00 per share / $2.0bn EV Terminal Year EBITDA Margin 30.0% 35.0% 40.0% 42.0% 45.0% 8.0% 1.2x 1.5x 1.8x 1.9x 2.0x 10.0% 1.4x 1.7x 2.0x 2.1x 2.3x 12.0% 1.6x 2.0x 2.3x 2.4x 2.6x 14.0% 1.9x 2.3x 2.6x 2.8x 3.0x 16.0% 2.1x 2.6x 3.0x 3.1x 3.4x 2024-29E Revenue CAGR Terminal Year EBITDA Margin 30.0% 35.0% 40.0% 42.0% 45.0% 8.0% 5.1% 9.6% 13.5% 14.9% 16.9% 10.0% 8.6% 13.2% 17.1% 18.5% 20.5% 12.0% 12.2% 16.9% 20.7% 22.1% 24.1% 14.0% 15.9% 20.5% 24.3% 25.7% 27.7% 16.0% 19.5% 24.1% 28.0% 29.4% 31.3% 2024-29E Revenue CAGR Terminal Year EBITDA Margin 30.0% 35.0% 40.0% 42.0% 45.0% 8.0% 1.0x 1.2x 1.5x 1.5x 1.7x 10.0% 1.2x 1.4x 1.7x 1.8x 1.9x 12.0% 1.3x 1.6x 1.9x 2.0x 2.2x 14.0% 1.5x 1.8x 2.1x 2.3x 2.4x 16.0% 1.7x 2.1x 2.4x 2.6x 2.8x 2024-29E Revenue CAGR Terminal Year EBITDA Margin 30.0% 35.0% 40.0% 42.0% 45.0% 8.0% 0.7% 4.9% 8.6% 9.9% 11.8% 10.0% 3.9% 8.2% 11.9% 13.3% 15.1% 12.0% 7.2% 11.6% 15.2% 16.6% 18.5% 14.0% 10.5% 14.9% 18.6% 19.9% 21.8% 16.0% 13.8% 18.2% 21.9% 23.3% 25.2% 2024-29E Revenue CAGR $13.00 per share / $2.4bn EV $15.00 per share / $2.9bn EV (1) Assumes exit multiple of 18.0x 2029E EBITDA REDACTED
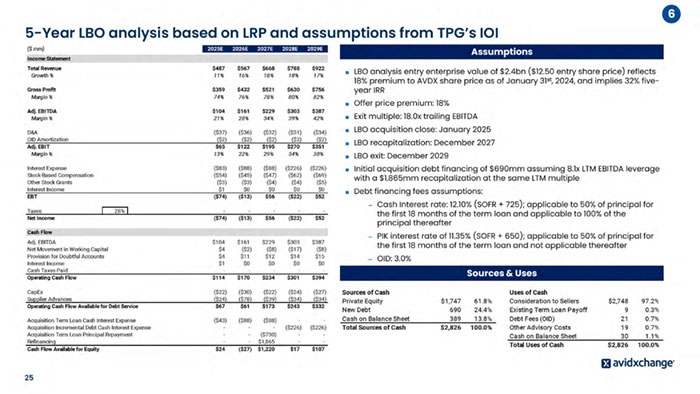
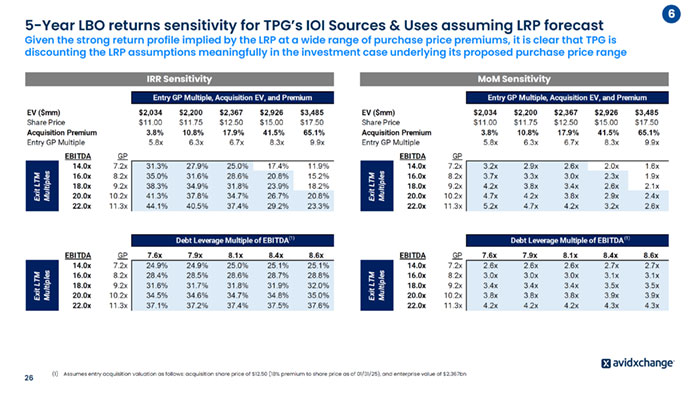
(1) Assumes entry acquisition valuation as follows: acquisition share price of $12.50 (18% premium to share price as of 01/31/25), and enterprise value of $2.367bn IRR Sensitivity MoM Sensitivity Entry GP Multiple, Acquisition EV, and Premium EV ($mm) $2,034 $2,200 $2,367 $2,926 $3,485 Share Price $11.00 $11.75 $12.50 $15.00 $17.50 Acquisition Premium 3.8% 10.8% 17.9% 41.5% 65.1% Entry GP Multiple 5.8x 6.3x 6.7x 8.3x 9.9x EBITDA GP 14.0x 7.2x 3.2x 2.9x 2.6x 2.0x 1.6x 16.0x 8.2x 3.7x 3.3x 3.0x 2.3x 1.9x 18.0x 9.2x 4.2x 3.8x 3.4x 2.6x 2.1x 20.0x 10.2x 4.7x 4.2x 3.8x 2.9x 2.4x 22.0x 11.3x 5.2x 4.7x 4.2x 3.2x 2.6x Exit LTM Multiples Entry GP Multiple, Acquisition EV, and Premium EV ($mm) $2,034 $2,200 $2,367 $2,926 $3,485 Share Price $11.00 $11.75 $12.50 $15.00 $17.50 Acquisition Premium 3.8% 10.8% 17.9% 41.5% 65.1% Entry GP Multiple 5.8x 6.3x 6.7x 8.3x 9.9x EBITDA GP 14.0x 7.2x 31.3% 27.9% 25.0% 17.4% 11.9% 16.0x 8.2x 35.0% 31.6% 28.6% 20.8% 15.2% 18.0x 9.2x 38.3% 34.9% 31.8% 23.9% 18.2% 20.0x 10.2x 41.3% 37.8% 34.7% 26.7% 20.8% 22.0x 11.3x 44.1% 40.5% 37.4% 29.2% 23.3% Exit LTM Multiples Debt Leverage Multiple of EBITDA EBITDA GP 7.6x 7.9x 8.1x 8.4x 8.6x 14.0x 7.2x 2.6x 2.6x 2.6x 2.7x 2.7x 16.0x 8.2x 3.0x 3.0x 3.0x 3.1x 3.1x 18.0x 9.2x 3.4x 3.4x 3.4x 3.5x 3.5x 20.0x 10.2x 3.8x 3.8x 3.8x 3.9x 3.9x 22.0x 11.3x 4.2x 4.2x 4.2x 4.3x 4.3x Exit LTM Multiples Debt Leverage Multiple of EBITDA EBITDA GP 7.6x 7.9x 8.1x 8.4x 8.6x 14.0x 7.2x 24.9% 24.9% 25.0% 25.1% 25.1% 16.0x 8.2x 28.4% 28.5% 28.6% 28.7% 28.8% 18.0x 9.2x 31.6% 31.7% 31.8% 31.9% 32.0% 20.0x 10.2x 34.5% 34.6% 34.7% 34.8% 35.0% 22.0x 11.3x 37.1% 37.2% 37.4% 37.5% 37.6% Exit LTM Multiples (1) (1) 6 26 5-Year LBO returns sensitivity for TPG’s IOI Sources & Uses assuming LRP forecast Given the strong return profile implied by the LRP at a wide range of purchase price premiums, it is clear that TPG is discounting the LRP assumptions meaningfully in the investment case underlying its proposed purchase price range

6 27 5-Year LBO returns sensitivity for TPG’s IOI Sources & Uses at different entry prices and a range of investment period growth CAGR and margin assumptions Terminal Year EBITDA Margin 30.0% 35.0% 40.0% 42.0% 45.0% 8.0% 1.6x 2.0x 2.4x 2.5x 2.7x 10.0% 1.9x 2.3x 2.7x 2.9x 3.1x 12.0% 2.2x 2.7x 3.1x 3.3x 3.6x 14.0% 2.5x 3.0x 3.5x 3.7x 4.0x 16.0% 2.9x 3.4x 4.0x 4.2x 4.6x 2024-29E Revenue CAGR Terminal Year EBITDA Margin 30.0% 35.0% 40.0% 42.0% 45.0% 8.0% 12.1% 17.0% 21.1% 22.5% 24.6% 10.0% 16.1% 21.0% 25.1% 26.5% 28.6% 12.0% 20.1% 25.1% 29.0% 30.5% 32.5% 14.0% 24.2% 29.0% 33.0% 34.4% 36.5% 16.0% 28.3% 32.9% 36.9% 38.3% 40.4% 2024-29E Revenue CAGR $11.00 per share / $2.0bn EV Terminal Year EBITDA Margin 30.0% 35.0% 40.0% 42.0% 45.0% 8.0% 1.3x 1.6x 1.8x 1.9x 2.1x 10.0% 1.5x 1.8x 2.1x 2.2x 2.4x 12.0% 1.7x 2.1x 2.4x 2.5x 2.7x 14.0% 1.9x 2.3x 2.7x 2.9x 3.1x 16.0% 2.2x 2.6x 3.1x 3.2x 3.5x 2024-29E Revenue CAGR Terminal Year EBITDA Margin 30.0% 35.0% 40.0% 42.0% 45.0% 8.0% 5.9% 10.4% 14.3% 15.7% 17.6% 10.0% 9.5% 14.1% 17.9% 19.3% 21.2% 12.0% 13.1% 17.7% 21.5% 22.9% 24.8% 14.0% 16.7% 21.2% 25.0% 26.4% 28.4% 16.0% 20.3% 24.8% 28.6% 30.0% 32.0% 2024-29E Revenue CAGR Terminal Year EBITDA Margin 30.0% 35.0% 40.0% 42.0% 45.0% 8.0% 1.1x 1.3x 1.5x 1.6x 1.7x 10.0% 1.2x 1.5x 1.7x 1.8x 2.0x 12.0% 1.4x 1.7x 1.9x 2.1x 2.2x 14.0% 1.6x 1.9x 2.2x 2.3x 2.5x 16.0% 1.8x 2.1x 2.5x 2.6x 2.8x 2024-29E Revenue CAGR Terminal Year EBITDA Margin 30.0% 35.0% 40.0% 42.0% 45.0% 8.0% 1.4% 5.7% 9.3% 10.6% 12.5% 10.0% 4.7% 9.0% 12.6% 14.0% 15.8% 12.0% 7.9% 12.3% 15.9% 17.3% 19.2% 14.0% 11.3% 15.6% 19.3% 20.6% 22.5% 16.0% 14.6% 18.9% 22.6% 23.9% 25.8% 2024-29E Revenue CAGR $13.00 per share / $2.4bn EV $15.00 per share / $2.9bn EV IRR Sensitivity (1) MoM Sensitivity (1) (1) Assumes exit multiple of 18.0x 2029E EBITDA
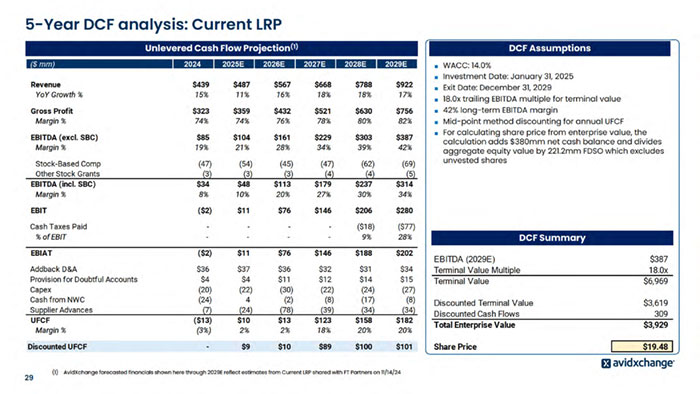
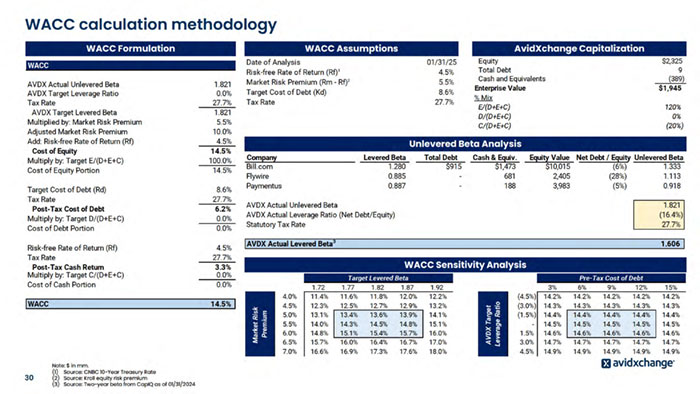
Appendix - DCF Reference Materials