
Exhibit (c)(18)
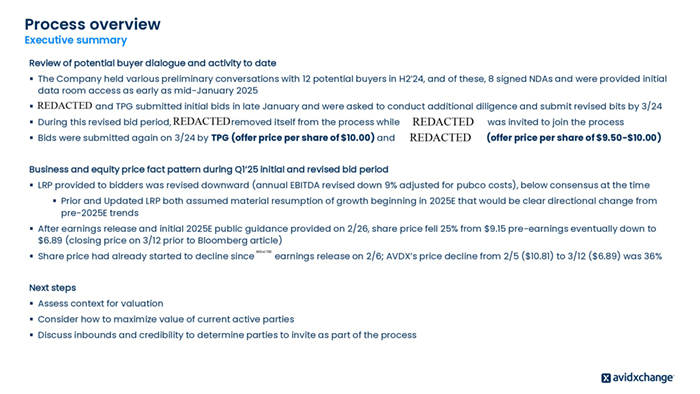
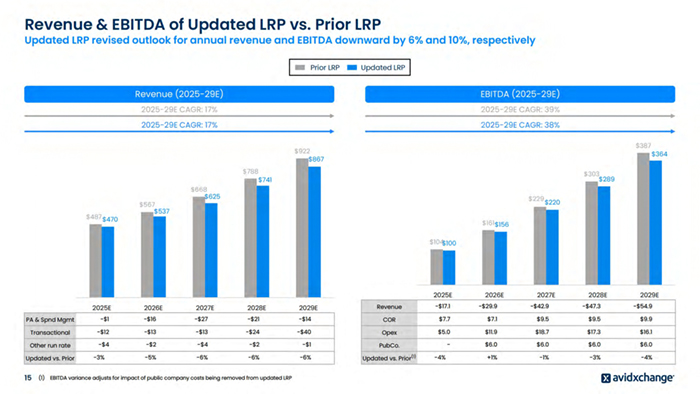
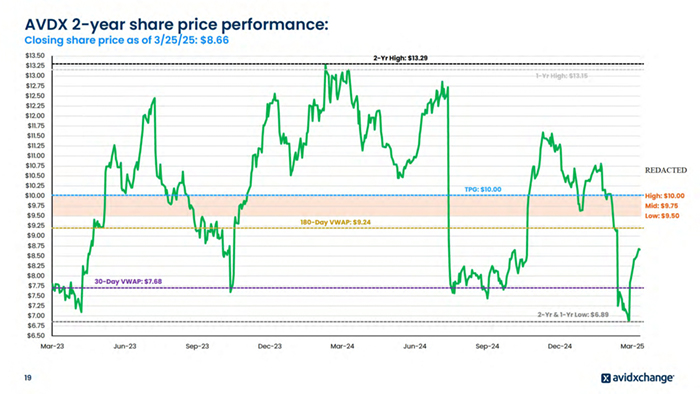
Process overview Executive summary Review of potential buyer dialogue and activity to date ▪ The Company held various preliminary conversations with 12 potential buyers in H2’24, and of these, 8 signed NDAs and were provided initial data room access as early as mid-January 2025 ▪ REDACTED and TPG submitted initial bids in late January and were asked to conduct additional diligence and submit revised bits by 3/24 ▪ During this revised bid period, REDACTED removed itself from the process while ▪ Bids were submitted again on 3/24 by TPG (offer price per share of $10.00) and REDACTED REDACTED was invited to join the process (offer price per share of $9.50-$10.00) Business and equity price fact pattern during Q1’25 initial and revised bid period ▪ LRP provided to bidders was revised downward (annual EBITDA revised down 9% adjusted for pubco costs), below consensus at the time ▪ Prior and Updated LRP both assumed material resumption of growth beginning in 2025E that would be clear directional change from pre-2025E trends ▪ After earnings release and initial 2025E public guidance provided on 2/26, share price fell 25% from $9.15 pre-earnings eventually down to $6.89 (closing price on 3/12 prior to Bloomberg article) ▪ Share price had already started to decline since REDACTED earnings release on 2/6; AVDX’s price decline from 2/5 ($10.81) to 3/12 ($6.89) was 36% Next steps ▪ Assess context for valuation ▪ Consider how to maximize value of current active parties ▪ Discuss inbounds and credibility to determine parties to invite as part of the process
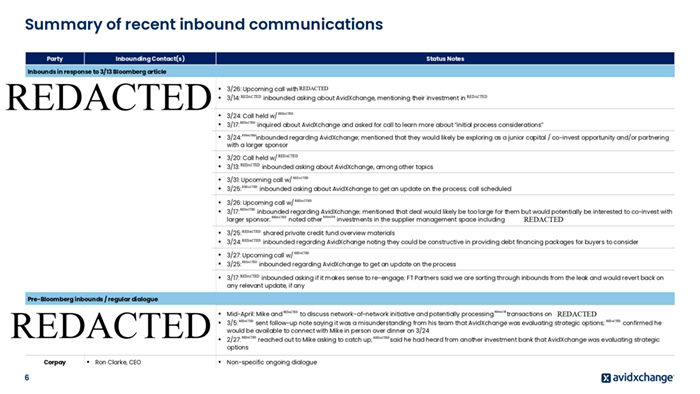
Summary of recent inbound communications Party Inbounding Contact(s) Status Notes Inbounds in response to 3/13 Bloomberg article REDACTED ▪ 3/26: Upcoming call with REDACTED ▪ 3/14: REDACTED inbounded asking about AvidXchange, mentioning their investment in REDACTED ▪ 3/24: Call held w/ ▪ 3/17: ▪ 3/24: inbounded regarding AvidXchange; mentioned that they would likely be exploring as a junior capital / co-invest opportunity and/or partnering with a larger sponsor ▪ 3/20: Call held w/ REDACTED ▪ 3/13: REDACTED inbounded asking about AvidXchange, among other topics ▪ 3/31: Upcoming call w/ ▪ 3/25: ▪ 3/26: Upcoming call w/ ▪ 3/17: inbounded regarding AvidXchange; mentioned that deal would likely be too large for them but would potentially be interested to co-invest with REDACTE REDACTED larger sponsor; noted other investments in the supplier management space including REDACTED ▪ 3/25: REDACTED shared private credit fund overview materials ▪ 3/24: REDACTED inbounded regarding AvidXchange noting they could be constructive in providing debt financing packages for buyers to consider ▪ 3/27: Upcoming call w/ ▪ 3/25: ▪ 3/17: REDACTED inbounded asking if it makes sense to re-engage; FT Partners said we are sorting through inbounds from the leak and would revert back on any relevant update, if any ▪ Mid-April: Mike and ▪ 3/5: sent follow-up note saying it was a misunderstanding from his team that AvidXchange was evaluating strategic options; would be available to connect with Mike in person over dinner on 3/24 ▪ 2/27: options ▪ Non-specific ongoing dialogue REDACTED REDACTED inquired about AvidXchange and asked for call to learn more about “initial process considerations” REDACTED REDACTED REDACTED inbounded asking about AvidXchange to get an update on the process; call scheduled REDACTED REDACTED REDACTED REDACTED inbounded regarding AvidXchange to get an update on the process Pre-Bloomberg inbounds / regular dialogue REDACTED Corpay 6 ▪ Ron Clarke, CEO REDACTED to discuss network-of-network initiative and potentially processing REDACTED REDACTED reached out to Mike asking to catch up; REDACTED REDACTE transactions on REDACTED REDACTED confirmed he said he had heard from another investment bank that AvidXchange was evaluating strategic
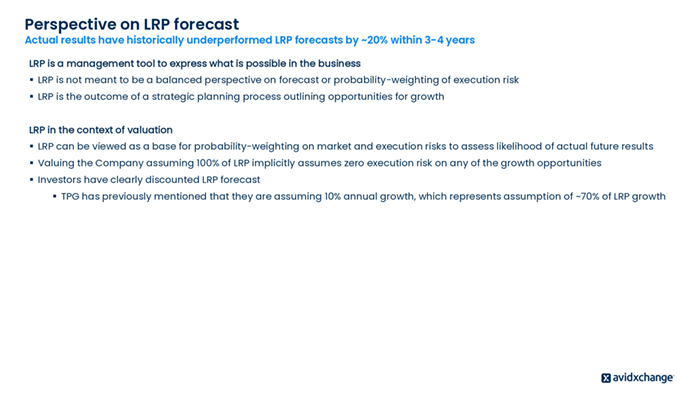
Perspective on LRP forecast Actual results have historically underperformed LRP forecasts by ~20% within 3-4 years LRP is a management tool to express what is possible in the business ▪ LRP is not meant to be a balanced perspective on forecast or probability-weighting of execution risk ▪ LRP is the outcome of a strategic planning process outlining opportunities for growth LRP in the context of valuation ▪ LRP can be viewed as a base for probability-weighting on market and execution risks to assess likelihood of actual future results ▪ Valuing the Company assuming 100% of LRP implicitly assumes zero execution risk on any of the growth opportunities ▪ Investors have clearly discounted LRP forecast ▪ TPG has previously mentioned that they are assuming 10% annual growth, which represents assumption of ~70% of LRP growth
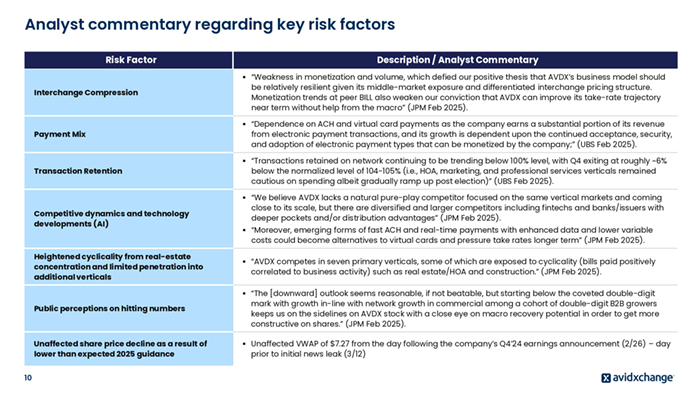
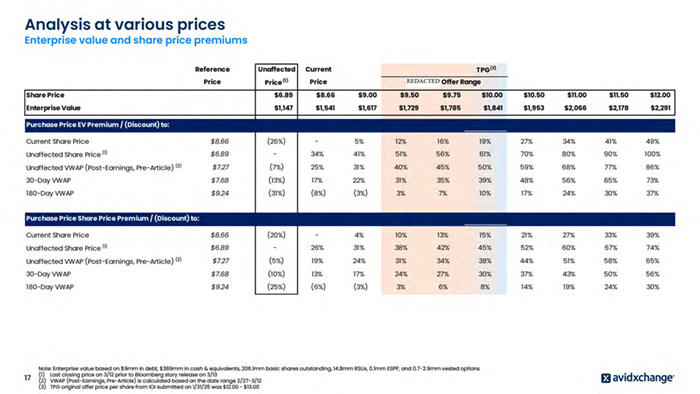
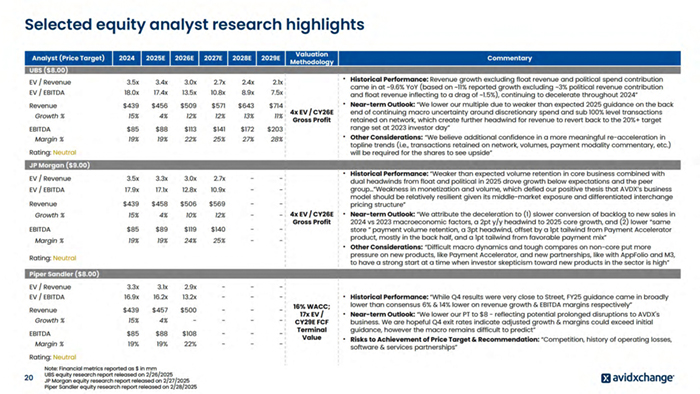
Analyst commentary regarding key risk factors Risk Factor Interchange Compression ▪ “Weakness in monetization and volume, which defied our positive thesis that AVDX’s business model should be relatively resilient given its middle-market exposure and differentiated interchange pricing structure. Monetization trends at peer BILL also weaken our conviction that AVDX can improve its take-rate trajectory near term without help from the macro” (JPM Feb 2025). Payment Mix ▪ “Dependence on ACH and virtual card payments as the company earns a substantial portion of its revenue from electronic payment transactions, and its growth is dependent upon the continued acceptance, security, and adoption of electronic payment types that can be monetized by the company;” (UBS Feb 2025). Transaction Retention ▪ “Transactions retained on network continuing to be trending below 100% level, with Q4 exiting at roughly ~6% below the normalized level of 104-105% (i.e., HOA, marketing, and professional services verticals remained cautious on spending albeit gradually ramp up post election)” (UBS Feb 2025). Competitive dynamics and technology developments (AI) 10 Description / Analyst Commentary ▪ “We believe AVDX lacks a natural pure-play competitor focused on the same vertical markets and coming close to its scale, but there are diversified and larger competitors including fintechs and banks/issuers with deeper pockets and/or distribution advantages” (JPM Feb 2025). ▪ “Moreover, emerging forms of fast ACH and real-time payments with enhanced data and lower variable costs could become alternatives to virtual cards and pressure take rates longer term” (JPM Feb 2025). Heightened cyclicality from real-estate concentration and limited penetration into additional verticals ▪ “AVDX competes in seven primary verticals, some of which are exposed to cyclicality (bills paid positively correlated to business activity) such as real estate/HOA and construction.” (JPM Feb 2025). Public perceptions on hitting numbers ▪ “The [downward] outlook seems reasonable, if not beatable, but starting below the coveted double-digit mark with growth in-line with network growth in commercial among a cohort of double-digit B2B growers keeps us on the sidelines on AVDX stock with a close eye on macro recovery potential in order to get more constructive on shares.” (JPM Feb 2025). Unaffected share price decline as a result of lower than expected 2025 guidance ▪ Unaffected VWAP of $7.27 from the day following the company’s Q4’24 earnings announcement (2/26) – day prior to initial news leak (3/12)
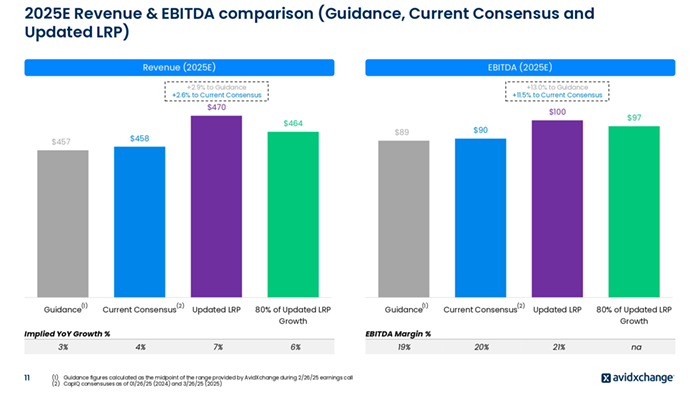
2025E Revenue & EBITDA comparison (Guidance, Current Consensus and Updated LRP) Revenue (2025E) EBITDA (2025E) +2.9% to Guidance +2.6% to Current Consensus +13.0% to Guidance +11.5% to Current Consensus $470 $100 $464 $458 $457 (1) Guidance (2) Current Consensus Updated LRP 80% of Updated LRP Growth Implied YoY Growth % 3% 11 $97 $90 $89 (1) Guidance (2) Current Consensus Updated LRP 80% of Updated LRP Growth 20% 21% na EBITDA Margin % 4% 7% 6% (1) Guidance figures calculated as the midpoint of the range provided by AvidXchange during 2/26/25 earnings call (2) CapIQ consensuses as of 01/26/25 (2024) and 3/26/25 (2025) 19%
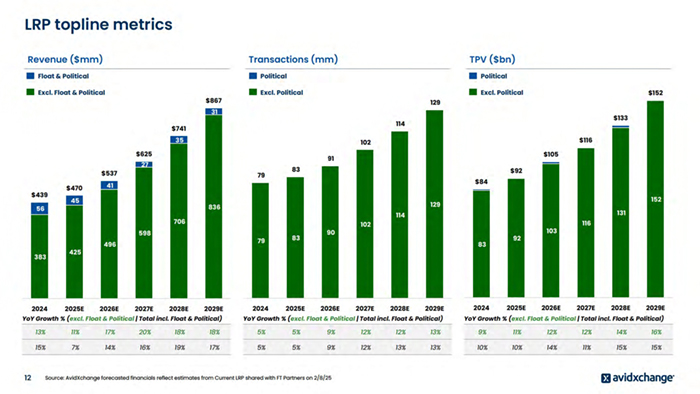
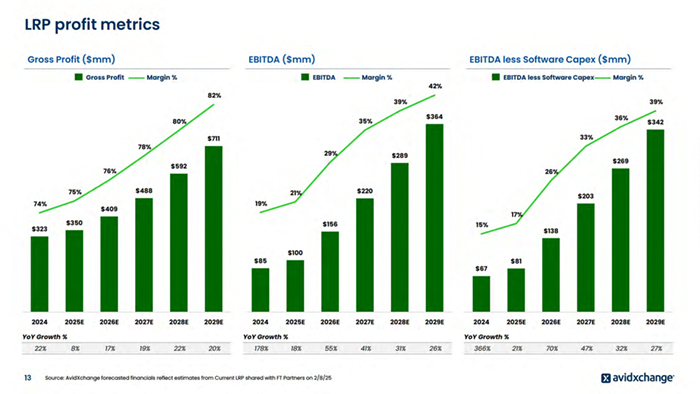
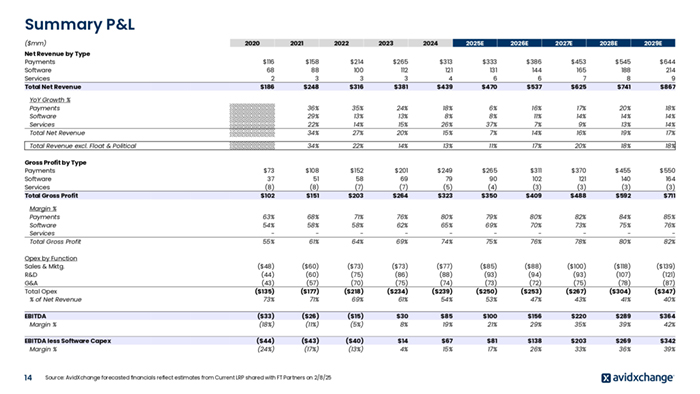
Summary P&L ($mm) Net Revenue by Type Payments Software Services Total Net Revenue 2020 2021 $116 68 2 $186 2022 2023 2024 2025E 2026E 2027E 2028E 2029E $158 88 3 $248 $214 100 3 $316 $265 112 3 $381 $313 121 4 $439 $333 131 6 $470 $386 144 6 $537 $453 165 7 $625 $545 188 8 $741 $644 214 9 $867 YoY Growth % Payments Software Services Total Net Revenue 36% 29% 22% 34% 35% 13% 14% 27% 24% 13% 15% 20% 18% 8% 26% 15% 6% 8% 37% 7% 16% 11% 7% 14% 17% 14% 9% 16% 20% 14% 13% 19% 18% 14% 14% 17% Total Revenue excl. Float & Political 34% 22% 14% 13% 11% 17% 20% 18% 18% Gross Profit by Type Payments Software Services Total Gross Profit $73 37 (8) $102 $108 51 (8) $151 $152 58 (7) $203 $201 69 (7) $264 $249 79 (5) $323 $265 90 (4) $350 $311 102 (3) $409 $370 121 (3) $488 $455 140 (3) $592 $550 164 (3) $711 Margin % Payments Software Services Total Gross Profit 63% 54% 55% 68% 58% 61% 71% 58% 64% 76% 62% 69% 80% 65% 74% 79% 69% 75% 80% 70% 76% 82% 73% 78% 84% 75% 80% 85% 76% 82% Opex by Function Sales & Mktg. R&D G&A Total Opex % of Net Revenue ($48) (44) (43) ($135) 73% ($60) (60) (57) ($177) 71% ($73) (75) (70) ($218) 69% ($73) (86) (75) ($234) 61% ($77) (88) (74) ($239) 54% ($85) (93) (73) ($250) 53% ($88) (94) (72) ($253) 47% ($100) (93) (75) ($267) 43% ($118) (107) (78) ($304) 41% ($139) (121) (87) ($347) 40% EBITDA Margin % ($33) (18%) ($26) (11%) ($15) (5%) $30 8% $85 19% $100 21% $156 29% $220 35% $289 39% $364 42% EBITDA less Software Capex Margin % ($44) (24%) ($43) (17%) ($40) (13%) $14 4% $67 15% $81 17% $138 26% $203 33% $269 36% $342 39% 14 Source: AvidXchange forecasted financials reflect estimates from Current LRP shared with FT Partners on 2/8/25

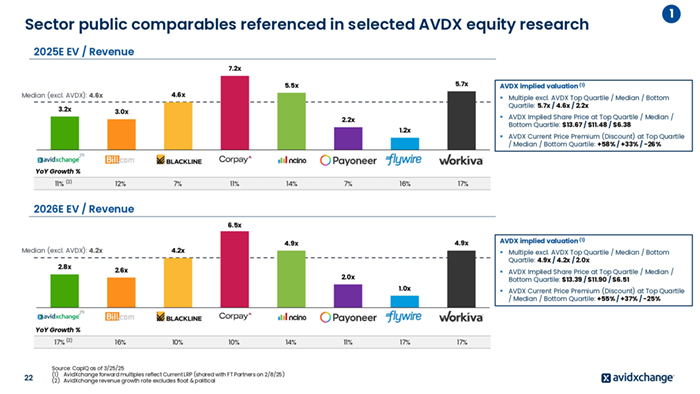
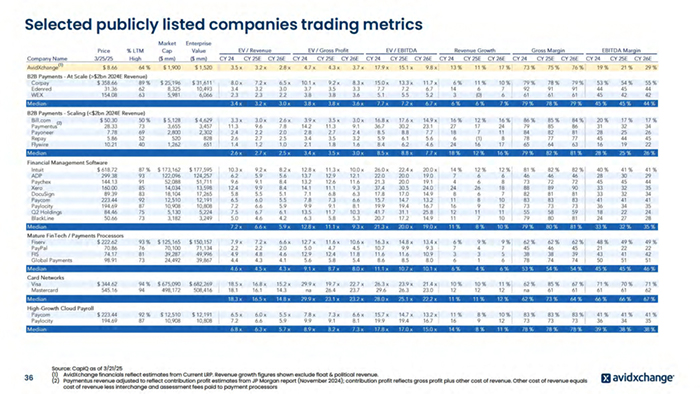
Sector public comparables referenced in selected AVDX equity research 1 2025E EV / Revenue 7.2x 5.7x 5.5x 4.6x Median (excl. AVDX): 4.6x 3.2x AVDX implied valuation (1) ▪ Multiple excl. AVDX Top Quartile / Median / Bottom Quartile: 5.7x / 4.6x / 2.2x 3.0x ▪ AVDX Implied Share Price at Top Quartile / Median / Bottom Quartile: $13.67 / $11.48 / $6.38 2.2x 1.2x ▪ AVDX Current Price Premium (Discount) at Top Quartile / Median / Bottom Quartile: +58% / +33% / -26% (1) YoY Growth % 11% (2) 12% 7% 11% 14% 7% 16% 17% 2026E EV / Revenue 6.5x Median (excl. AVDX): 4.2x 2.8x 4.9x 4.9x 4.2x ▪ Multiple excl. AVDX Top Quartile / Median / Bottom Quartile: 4.9x / 4.2x / 2.0x 2.6x ▪ AVDX Implied Share Price at Top Quartile / Median / Bottom Quartile: $13.39 / $11.90 / $6.51 2.0x 1.0x ▪ AVDX Current Price Premium (Discount) at Top Quartile / Median / Bottom Quartile: +55% / +37% / -25% (1) YoY Growth % 17% (2) 22 16% 10% AVDX implied valuation (1) 10% Source: CapIQ as of 3/25/25 (1) AvidXchange forward multiples reflect Current LRP (shared with FT Partners on 2/8/25) (2) AvidXchange revenue growth rate excludes float & political 14% 11% 17% 17%
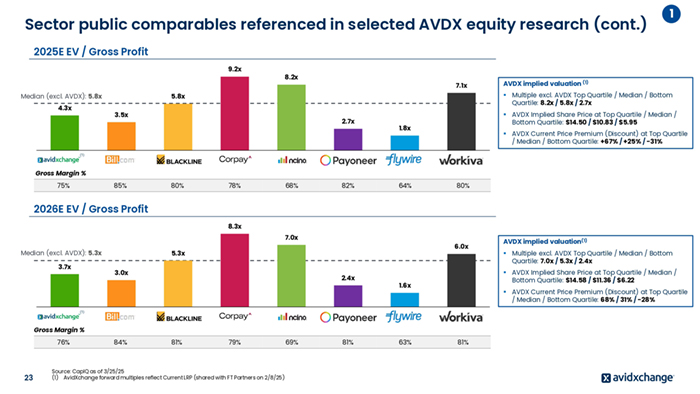
Sector public comparables referenced in selected AVDX equity research (cont.) 1 2025E EV / Gross Profit 9.2x 7.1x AVDX implied valuation (1) ▪ Multiple excl. AVDX Top Quartile / Median / Bottom Quartile: 8.2x / 5.8x / 2.7x 5.8x Median (excl. AVDX): 5.8x 4.3x 8.2x 3.5x 2.7x ▪ AVDX Implied Share Price at Top Quartile / Median / Bottom Quartile: $14.50 / $10.83 / $5.95 1.8x ▪ AVDX Current Price Premium (Discount) at Top Quartile / Median / Bottom Quartile: +67% / +25% / -31% (1) Gross Margin % 75% 85% 80% 78% 68% 82% 64% 80% 2026E EV / Gross Profit 8.3x 7.0x Median (excl. AVDX): 5.3x 3.7x 6.0x 5.3x 3.0x 2.4x 1.6x ▪ AVDX Current Price Premium (Discount) at Top Quartile / Median / Bottom Quartile: 68% / 31% / -28% Gross Margin % 23 84% 81% 79% Source: CapIQ as of 3/25/25 (1) AvidXchange forward multiples reflect Current LRP (shared with FT Partners on 2/8/25) 69% 81% 63% ▪ Multiple excl. AVDX Top Quartile / Median / Bottom Quartile: 7.0x / 5.3x / 2.4x ▪ AVDX Implied Share Price at Top Quartile / Median / Bottom Quartile: $14.58 / $11.36 / $6.22 (1) 76% AVDX implied valuation(1) 81%
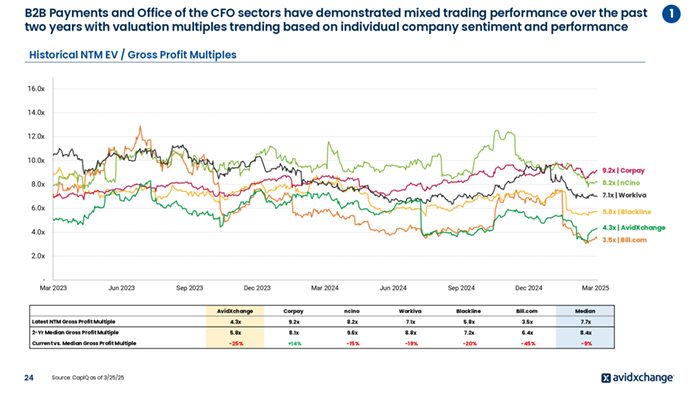
B2B Payments and Office of the CFO sectors have demonstrated mixed trading performance over the past two years with valuation multiples trending based on individual company sentiment and performance Historical NTM EV / Gross Profit Multiples 16.0x 14.0x 12.0x 10.0x 9.2x | Corpay 8.2x | nCino 8.0x 7.1x | Workiva 6.0x 5.8x | Blackline 4.3x | AvidXchange 4.0x 3.5x | Bill.com 2.0x Mar 2023 Jun 2023 Sep 2023 Dec 2023 Mar 2024 Jun 2024 Sep 2024 Dec 2024 Mar 2025 AvidXchange Corpay ncino Workiva Blackline Bill.com Median Latest NTM Gross Profit Multiple 4.3x 9.2x 8.2x 7.1x 5.8x 3.5x 7.7x 2-Yr Median Gross Profit Multiple 5.8x 8.1x 9.6x 8.8x 7.2x 6.4x 8.4x Current vs. Median Gross Profit Multiple -25% +14% -15% -19% -20% -45% -9% 24 Source: CapIQ as of 3/25/25 1
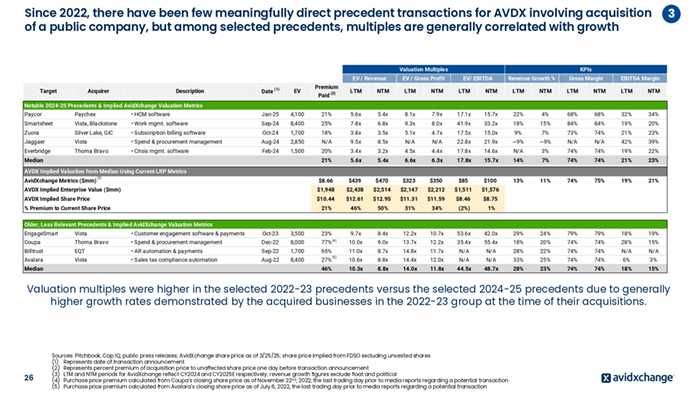
Since 2022, there have been few meaningfully direct precedent transactions for AVDX involving acquisition of a public company, but among selected precedents, multiples are generally correlated with growth Valuation Multiples Target Acquirer Description Date (1) EV Premium (2) Paid 3 KPIs EV / Revenue EV / Gross Profit EV/ EBITDA Revenue Growth % LTM NTM LTM NTM LTM NTM LTM Gross Margin EBITDA Margin NTM LTM NTM LTM NTM Notable 2024-25 Precedents & Implied AvidXchange Valuation Metrics Paycor Paychex • HCM software Jan-25 4,100 21% 5.6x 5.4x 8.1x 7.9x 17.1x 15.7x 22% 4% 68% 68% 32% 34% Smartsheet Vista, Blackstone • Work mgmt. software Sep-24 8,400 25% 7.8x 6.8x 9.3x 8.0x 41.9x 33.2x 18% 15% 84% 84% 19% 20% Zuora Silver Lake, GIC • Subscription billing software Oct-24 1,700 18% 3.8x 3.5x 5.1x 4.7x 17.5x 15.0x 9% 7% 73% 74% 21% 23% Jaggaer Vista • Spend & procurement management Aug-24 2,850 N/A 9.5x 8.5x N/A N/A 22.8x 21.9x ~9% ~9% N/A N/A 42% 39% Everbridge Thoma Bravo • Crisis mgmt. software Feb-24 1,500 20% 3.4x 3.2x 4.5x 4.4x 17.8x 14.6x N/A 3% 74% 74% 19% 22% 21% 5.6x 5.4x 6.6x 6.3x 17.8x 15.7x 14% 7% 74% 74% 21% 23% $8.66 $439 $470 $323 $350 $85 $100 13% 11% 74% 75% 19% 21% AVDX Implied Enterprise Value ($mm) $1,948 $2,438 $2,514 $2,147 $2,212 $1,511 $1,576 AVDX Implied Share Price $10.44 $12.61 $12.95 $11.31 $11.59 $8.46 $8.75 21% 46% 50% 31% 34% (2%) 1% Median AVDX Implied Valuation from Median Using Current LRP Metrics AvidXchange Metrics ($mm) (3) % Premium to Current Share Price Older, Less Relevant Precedents & Implied AvidXchange Valuation Metrics EngageSmart Vista • Customer engagement software & payments Oct-23 3,500 23% 9.7x 8.4x 12.2x 10.7x 53.6x 42.0x 29% 24% 79% 79% 18% 19% Coupa Thoma Bravo • Spend & procurement management Dec-22 8,000 77% (4) 10.0x 9.0x 13.7x 12.2x 35.4x 55.4x 18% 20% 74% 74% 28% 15% Billtrust EQT • AR automation & payments Sep-22 1,700 65% 11.0x 8.7x 14.8x 11.7x N/A N/A 28% 22% 74% 74% N/A N/A Avalara Vista • Sales tax compliance automation Aug-22 8,400 27% 10.6x 8.8x 14.4x 12.0x N/A N/A 33% 25% 74% 74% 6% 3% 10.3x 8.8x 14.0x 11.8x 44.5x 48.7x 28% 23% 74% 74% 18% 15% Median 46% (5) Valuation multiples were higher in the selected 2022-23 precedents versus the selected 2024-25 precedents due to generally higher growth rates demonstrated by the acquired businesses in the 2022-23 group at the time of their acquisitions. 26 Sources: Pitchbook, Cap IQ, public press releases; AvidXchange share price as of 3/25/25; share price implied from FDSO excluding unvested shares (1) Represents date of transaction announcement (2) Represents percent premium of acquisition price to unaffected share price one day before transaction announcement (3) LTM and NTM periods for AvidXchange reflect CY2024 and CY2025E respectively; revenue growth figures exclude float and political (4) Purchase price premium calculated from Coupa’s closing share price as of November 22nd, 2022, the last trading day prior to media reports regarding a potential transaction (5) Purchase price premium calculated from Avalara’s closing share price as of July 6, 2022, the last trading day prior to media reports regarding a potential transaction
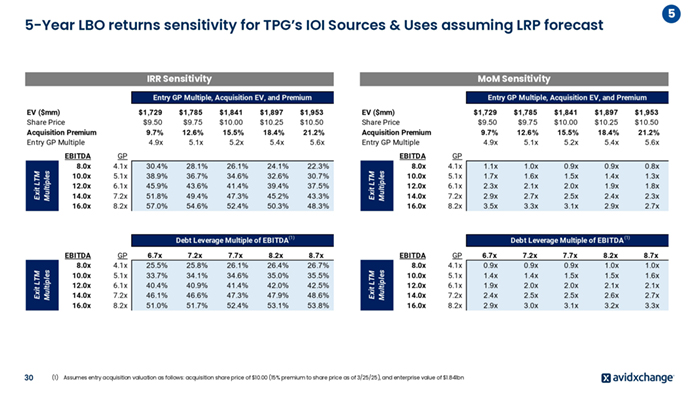
5 5-Year LBO returns sensitivity for TPG’s IOI Sources & Uses assuming LRP forecast IRR Sensitivity MoM Sensitivity Entry GP Multiple, Acquisition EV, and Premium Entry GP Multiple, Acquisition EV, and Premium Exit LTM Multiples EBITDA 8.0x 10.0x 12.0x 14.0x 16.0x $1,729 $9.50 9.7% 4.9x GP 4.1x 5.1x 6.1x 7.2x 8.2x 30.4% 38.9% 45.9% 51.8% 57.0% $1,785 $9.75 12.6% 5.1x 28.1% 36.7% 43.6% 49.4% 54.6% $1,841 $10.00 15.5% 5.2x 26.1% 34.6% 41.4% 47.3% 52.4% $1,897 $10.25 18.4% 5.4x 24.1% 32.6% 39.4% 45.2% 50.3% $1,953 $10.50 21.2% 5.6x 22.3% 30.7% 37.5% 43.3% 48.3% EV ($mm) Share Price Acquisition Premium Entry GP Multiple Exit LTM Multiples EV ($mm) Share Price Acquisition Premium Entry GP Multiple EBITDA 8.0x 10.0x 12.0x 14.0x 16.0x GP 4.1x 5.1x 6.1x 7.2x 8.2x $1,729 $9.50 9.7% 4.9x $1,785 $9.75 12.6% 5.1x $1,841 $10.00 15.5% 5.2x $1,897 $10.25 18.4% 5.4x $1,953 $10.50 21.2% 5.6x 1.1x 1.7x 2.3x 2.9x 3.5x 1.0x 1.6x 2.1x 2.7x 3.3x 0.9x 1.5x 2.0x 2.5x 3.1x 0.9x 1.4x 1.9x 2.4x 2.9x 0.8x 1.3x 1.8x 2.3x 2.7x Exit LTM Multiples EBITDA 8.0x 10.0x 12.0x 14.0x 16.0x 30 (1) GP 4.1x 5.1x 6.1x 7.2x 8.2x 6.7x 25.5% 33.7% 40.4% 46.1% 51.0% 7.2x 25.8% 34.1% 40.9% 46.6% 51.7% 7.7x 26.1% 34.6% 41.4% 47.3% 52.4% 8.2x 26.4% 35.0% 42.0% 47.9% 53.1% Debt Leverage Multiple of EBITDA (1) 8.7x 26.7% 35.5% 42.5% 48.6% 53.8% Exit LTM Multiples Debt Leverage Multiple of EBITDA(1) EBITDA 8.0x 10.0x 12.0x 14.0x 16.0x GP 4.1x 5.1x 6.1x 7.2x 8.2x Assumes entry acquisition valuation as follows: acquisition share price of $10.00 (15% premium to share price as of 3/25/25), and enterprise value of $1.841bn 6.7x 0.9x 1.4x 1.9x 2.4x 2.9x 7.2x 0.9x 1.4x 2.0x 2.5x 3.0x 7.7x 0.9x 1.5x 2.0x 2.5x 3.1x 8.2x 1.0x 1.5x 2.1x 2.6x 3.2x 8.7x 1.0x 1.6x 2.1x 2.7x 3.3x
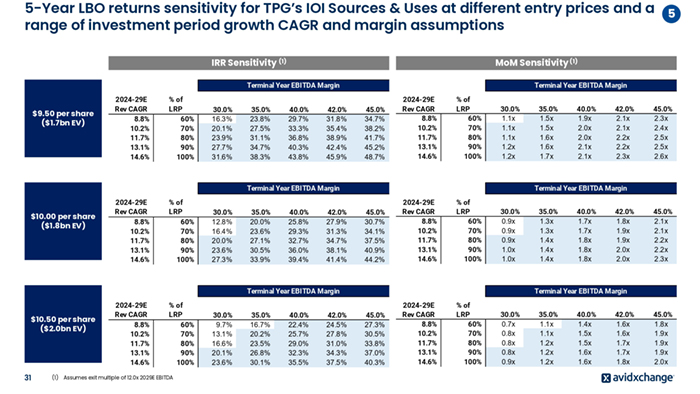
5-Year LBO returns sensitivity for TPG’s IOI Sources & Uses at different entry prices and a 5 range of investment period growth CAGR and margin assumptions IRR Sensitivity (1) MoM Sensitivity (1) Terminal Year EBITDA Margin Terminal Year EBITDA Margin $9.50 per share ($1.7bn EV) 2024-29E Rev CAGR 8.8% 10.2% 11.7% 13.1% 14.6% % of LRP 60% 70% 80% 90% 100% 30.0% 16.3% 20.1% 23.9% 27.7% 31.6% 35.0% 23.8% 27.5% 31.1% 34.7% 38.3% 40.0% 29.7% 33.3% 36.8% 40.3% 43.8% 42.0% 31.8% 35.4% 38.9% 42.4% 45.9% 45.0% 34.7% 38.2% 41.7% 45.2% 48.7% 2024-29E Rev CAGR 8.8% 10.2% 11.7% 13.1% 14.6% % of LRP 60% 70% 80% 90% 100% 30.0% 1.1x 1.1x 1.1x 1.2x 1.2x Terminal Year EBITDA Margin $10.00 per share ($1.8bn EV) 2024-29E Rev CAGR 8.8% 10.2% 11.7% 13.1% 14.6% % of LRP 60% 70% 80% 90% 100% 30.0% 12.8% 16.4% 20.0% 23.6% 27.3% 35.0% 20.0% 23.6% 27.1% 30.5% 33.9% 40.0% 25.8% 29.3% 32.7% 36.0% 39.4% 42.0% 27.9% 31.3% 34.7% 38.1% 41.4% $10.50 per share ($2.0bn EV) 31 (1) % of LRP 60% 70% 80% 90% 100% Assumes exit multiple of 12.0x 2029E EBITDA 30.0% 9.7% 13.1% 16.6% 20.1% 23.6% 35.0% 16.7% 20.2% 23.5% 26.8% 30.1% 40.0% 22.4% 25.7% 29.0% 32.3% 35.5% 42.0% 24.5% 27.8% 31.0% 34.3% 37.5% 40.0% 1.9x 2.0x 2.0x 2.1x 2.1x 42.0% 2.1x 2.1x 2.2x 2.2x 2.3x 45.0% 2.3x 2.4x 2.5x 2.5x 2.6x Terminal Year EBITDA Margin 45.0% 30.7% 34.1% 37.5% 40.9% 44.2% 2024-29E Rev CAGR 8.8% 10.2% 11.7% 13.1% 14.6% % of LRP 60% 70% 80% 90% 100% 30.0% 0.9x 0.9x 0.9x 1.0x 1.0x Terminal Year EBITDA Margin 2024-29E Rev CAGR 8.8% 10.2% 11.7% 13.1% 14.6% 35.0% 1.5x 1.5x 1.6x 1.6x 1.7x 35.0% 1.3x 1.3x 1.4x 1.4x 1.4x 40.0% 1.7x 1.7x 1.8x 1.8x 1.8x 42.0% 1.8x 1.9x 1.9x 2.0x 2.0x 45.0% 2.1x 2.1x 2.2x 2.2x 2.3x Terminal Year EBITDA Margin 45.0% 27.3% 30.5% 33.8% 37.0% 40.3% 2024-29E Rev CAGR 8.8% 10.2% 11.7% 13.1% 14.6% % of LRP 60% 70% 80% 90% 100% 30.0% 0.7x 0.8x 0.8x 0.8x 0.9x 35.0% 1.1x 1.1x 1.2x 1.2x 1.2x 40.0% 1.4x 1.5x 1.5x 1.6x 1.6x 42.0% 1.6x 1.6x 1.7x 1.7x 1.8x 45.0% 1.8x 1.9x 1.9x 1.9x 2.0x
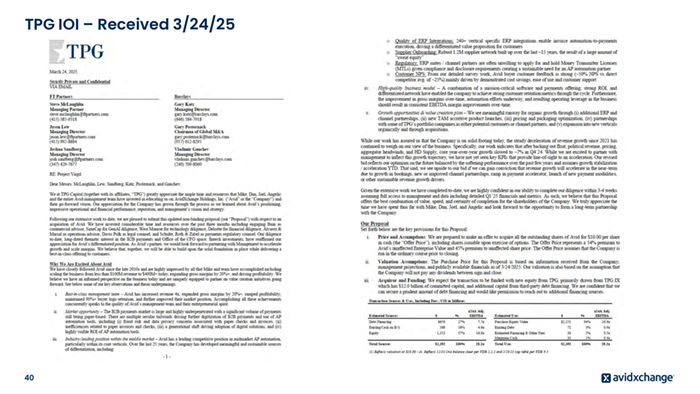
TPG IOI – Received 3/24/25 40
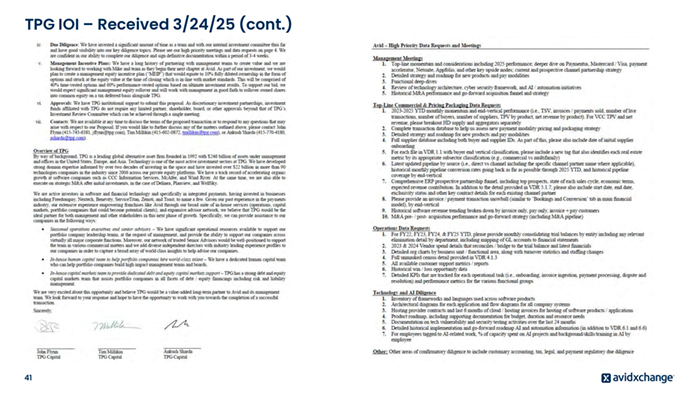
TPG IOI – Received 3/24/25 (cont.) 41


REDACTED 44

REDACTED 45