Exhibit (c)(20)
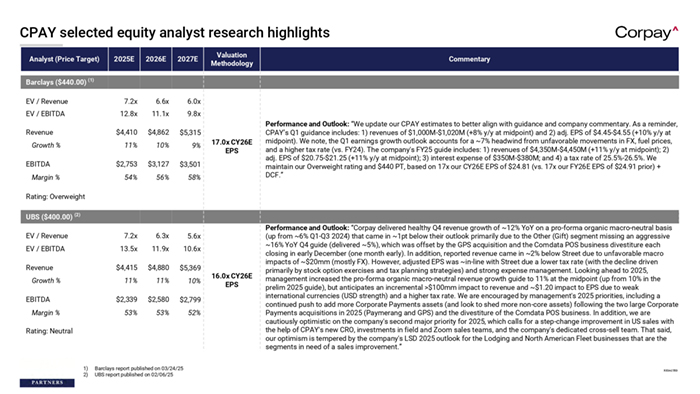
CPAY selected equity analyst research highlights Analyst (Price Target) 2025E 2026E 2027E EV / Revenue 7.2x 6.6x 6.0x EV / EBITDA 12.8x 11.1x 9.8x Revenue $4,410 $4,862 $5,315 11% 10% 9% $2,753 $3,127 $3,501 54% 56% 58% EV / Revenue 7.2x 6.3x 5.6x EV / EBITDA 13.5x 11.9x 10.6x Revenue $4,415 $4,880 $5,369 11% 11% 10% $2,339 $2,580 $2,799 53% 53% 52% Valuation Methodology Commentary 17.0x CY26E EPS Performance and Outlook: “We update our CPAY estimates to better align with guidance and company commentary. As a reminder, CPAY’s Q1 guidance includes: 1) revenues of $1,000M-$1,020M (+8% y/y at midpoint) and 2) adj. EPS of $4.45-$4.55 (+10% y/y at midpoint). We note, the Q1 earnings growth outlook accounts for a ~7% headwind from unfavorable movements in FX, fuel prices, and a higher tax rate (vs. FY24). The company’s FY25 guide includes: 1) revenues of $4,350M-$4,450M (+11% y/y at midpoint); 2) adj. EPS of $20.75-$21.25 (+11% y/y at midpoint); 3) interest expense of $350M-$380M; and 4) a tax rate of 25.5%-26.5%. We maintain our Overweight rating and $440 PT, based on 17x our CY26E EPS of $24.81 (vs. 17x our FY26E EPS of $24.91 prior) + DCF.” Barclays ($440.00) (1) Growth % EBITDA Margin % Rating: Overweight UBS ($400.00) (2) Growth % EBITDA Margin % Rating: Neutral 1) 2) Barclays report published on 03/24/25 UBS report published on 02/06/25 16.0x CY26E EPS Performance and Outlook: “Corpay delivered healthy Q4 revenue growth of ~12% YoY on a pro-forma organic macro-neutral basis (up from ~6% Q1-Q3 2024) that came in ~1pt below their outlook primarily due to the Other (Gift) segment missing an aggressive ~16% YoY Q4 guide (delivered ~5%), which was offset by the GPS acquisition and the Comdata POS business divestiture each closing in early December (one month early). In addition, reported revenue came in ~2% below Street due to unfavorable macro impacts of ~$20mm (mostly FX). However, adjusted EPS was ~in-line with Street due a lower tax rate (with the decline driven primarily by stock option exercises and tax planning strategies) and strong expense management. Looking ahead to 2025, management increased the pro-forma organic macro-neutral revenue growth guide to 11% at the midpoint (up from 10% in the prelim 2025 guide), but anticipates an incremental >$100mm impact to revenue and ~$1.20 impact to EPS due to weak international currencies (USD strength) and a higher tax rate. We are encouraged by management’s 2025 priorities, including a continued push to add more Corporate Payments assets (and look to shed more non-core assets) following the two large Corporate Payments acquisitions in 2025 (Paymerang and GPS) and the divestiture of the Comdata POS business. In addition, we are cautiously optimistic on the company’s second major priority for 2025, which calls for a step-change improvement in US sales with the help of CPAY’s new CRO, investments in field and Zoom sales teams, and the company’s dedicated cross-sell team. That said, our optimism is tempered by the company’s LSD 2025 outlook for the Lodging and North American Fleet businesses that are the segments in need of a sales improvement.” REDACTED
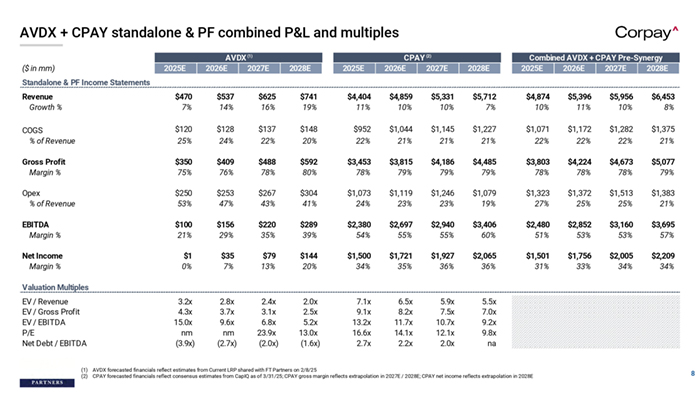
AVDX + CPAY standalone & PF combined P&L and multiples ($ in mm) 2025E AVDX (1) 2026E 2027E 2028E 2025E CPAY (2) 2026E 2027E 2028E Combined AVDX + CPAY Pre-Synergy 2025E 2026E 2027E 2028E Standalone & PF Income Statements Revenue Growth % $470 7% $537 14% $625 16% $741 19% $4,404 11% $4,859 10% $5,331 10% $5,712 7% $4,874 10% $5,396 11% $5,956 10% $6,453 8% COGS % of Revenue $120 25% $128 24% $137 22% $148 20% $952 22% $1,044 21% $1,145 21% $1,227 21% $1,071 22% $1,172 22% $1,282 22% $1,375 21% Gross Profit Margin % $350 75% $409 76% $488 78% $592 80% $3,453 78% $3,815 79% $4,186 79% $4,485 79% $3,803 78% $4,224 78% $4,673 78% $5,077 79% Opex % of Revenue $250 53% $253 47% $267 43% $304 41% $1,073 24% $1,119 23% $1,246 23% $1,079 19% $1,323 27% $1,372 25% $1,513 25% $1,383 21% EBITDA Margin % $100 21% $156 29% $220 35% $289 39% $2,380 54% $2,697 55% $2,940 55% $3,406 60% $2,480 51% $2,852 53% $3,160 53% $3,695 57% Net Income Margin % $1 0% $35 7% $79 13% $144 20% $1,500 34% $1,721 35% $1,927 36% $2,065 36% $1,501 31% $1,756 33% $2,005 34% $2,209 34% 3.2x 4.3x 15.0x nm (3.9x) 2.8x 3.7x 9.6x nm (2.7x) 2.4x 3.1x 6.8x 23.9x (2.0x) 2.0x 2.5x 5.2x 13.0x (1.6x) 7.1x 9.1x 13.2x 16.6x 2.7x 6.5x 8.2x 11.7x 14.1x 2.2x 5.9x 7.5x 10.7x 12.1x 2.0x 5.5x 7.0x 9.2x 9.8x na Valuation Multiples EV / Revenue EV / Gross Profit EV / EBITDA P/E Net Debt / EBITDA (1) AVDX forecasted financials reflect estimates from Current LRP shared with FT Partners on 2/8/25 (2) CPAY forecasted financials reflect consensus estimates from CapIQ as of 3/31/25; CPAY gross margin reflects extrapolation in 2027E / 2028E; CPAY net income reflects extrapolation in 2028E 8
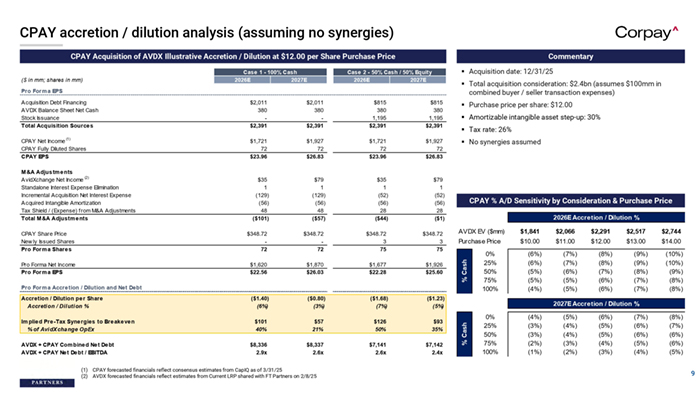
CPAY accretion / dilution analysis (assuming no synergies) CPAY Acquisition of AVDX Illustrative Accretion / Dilution at $12.00 per Share Purchase Price ($ in mm; shares in mm) Case 1 - 100% Cash 2026E 2027E Commentary ▪ Acquisition date: 12/31/25 Case 2 - 50% Cash / 50% Equity 2026E 2027E ▪ Total acquisition consideration: $2.4bn (assumes $100mm in combined buyer / seller transaction expenses) $2,011 380 $2,391 $2,011 380 $2,391 $815 380 1,195 $2,391 $815 380 1,195 $2,391 ▪ Purchase price per share: $12.00 CPAY Net Income CPAY Fully Diluted Shares CPAY EPS $1,721 72 $23.96 $1,927 72 $26.83 $1,721 72 $23.96 $1,927 72 $26.83 ▪ No synergies assumed M&A Adjustm ents AvidXchange Net Income (2) Standalone Interest Expense Elimination Incremental Acquisition Net Interest Expense Acquired Intangible Amortization Tax Shield / (Expense) from M&A Adjustments Total M&A Adjustm ents $35 1 (129) (56) 48 ($101) $79 1 (129) (56) 48 ($57) $35 1 (52) (56) 28 ($44) $79 1 (52) (56) 28 ($1) CPAY Share Price New ly Issued Shares Pro Form a Shares $348.72 72 $348.72 72 $348.72 3 75 $348.72 3 75 AVDX EV ($mm) $1,841 $2,066 $2,291 $2,517 $2,744 Purchase Price $10.00 $11.00 $12.00 $13.00 $14.00 Pro Forma Net Income Pro Form a EPS $1,620 $22.56 $1,870 $26.03 $1,677 $22.28 $1,926 $25.60 % Cash Pro Form a EPS Acquisition Debt Financing AVDX Balance Sheet Net Cash Stock Issuance Total Acquisition Sources 0% 25% 50% 75% 100% (6%) (6%) (5%) (5%) (4%) (7%) (7%) (6%) (5%) (5%) (8%) (8%) (7%) (6%) (6%) (9%) (9%) (8%) (7%) (7%) (10%) (10%) (9%) (8%) (8%) Accretion / Dilution per Share Accretion / Dilution % ($1.40) (6%) ($0.80) (3%) ($1.68) (7%) ($1.23) (5%) Im plied Pre-Tax Synergies to Breakeven % of AvidXchange OpEx $101 40% $57 21% $126 50% $93 35% $8,336 2.9x $8,337 2.6x $7,141 2.6x $7,142 2.4x (1) ▪ Amortizable intangible asset step-up: 30% ▪ Tax rate: 26% CPAY % A/D Sensitivity by Consideration & Purchase Price 2026E Accretion / Dilution % Pro Form a Accretion / Dilution and Net Debt (1) CPAY forecasted financials reflect consensus estimates from CapIQ as of 3/31/25 (2) AVDX forecasted financials reflect estimates from Current LRP shared with FT Partners on 2/8/25 % Cash AVDX + CPAY Com bined Net Debt AVDX + CPAY Net Debt / EBITDA 2027E Accretion / Dilution % 0% 25% 50% 75% 100% (4%) (3%) (3%) (2%) (1%) (5%) (4%) (4%) (3%) (2%) (6%) (5%) (5%) (4%) (3%) (7%) (6%) (6%) (5%) (4%) (8%) (7%) (6%) (6%) (5%) 9

REDACTED

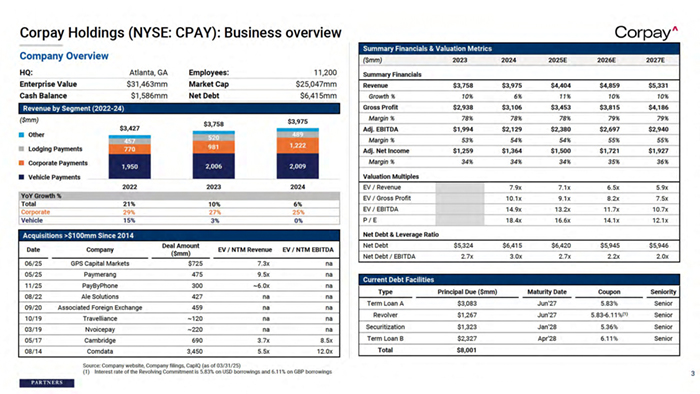
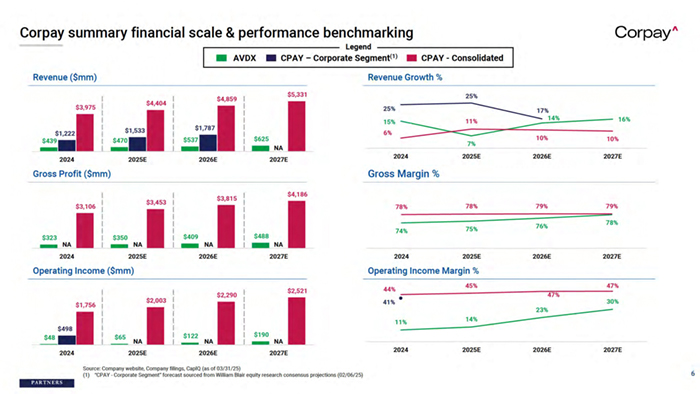
Source: Company website, Company filings, CapIQ (as of 03/28/25) 11 REDACTED

12 REDACTED

13 REDACTED

14 Source: Company website, Company filings, CapIQ (as of 03/31/25) REDACTED

15 REDACTED REDACTED
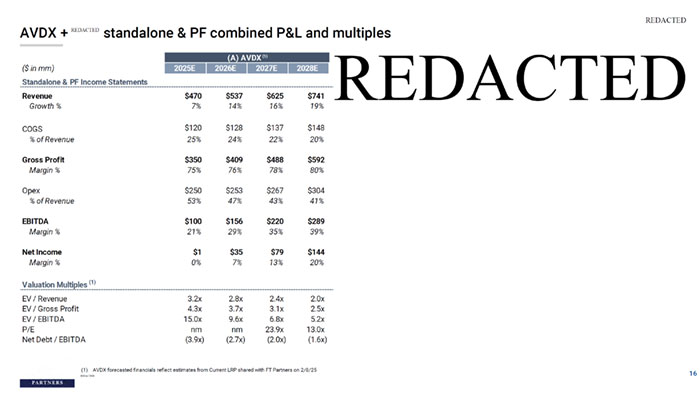
16 AVDX + standalone & PF combined P&L and multiples (A) AVDX (1) ($ in mm) 2025E 2026E 2027E 2028E Standalone & PF Income Statements Revenue $470 $537 $625 $741 Growth % 7% 14% 16% 19% COGS $120 $128 $137 $148 % of Revenue 25% 24% 22% 20% Gross Profit $350 $409 $488 $592 Margin % 75% 76% 78% 80% Opex $250 $253 $267 $304 % of Revenue 53% 47% 43% 41% EBITDA $100 $156 $220 $289 Margin % 21% 29% 35% 39% Net Income $1 $35 $79 $144 Margin % 0% 7% 13% 20% Valuation Multiples (1) EV / Revenue 3.2x 2.8x 2.4x 2.0x EV / Gross Profit 4.3x 3.7x 3.1x 2.5x EV / EBITDA 15.0x 9.6x 6.8x 5.2x P/E nm nm 23.9x 13.0x Net Debt / EBITDA (3.9x) (2.7x) (2.0x) (1.6x) (1) AVDX forecasted financials reflect estimates from Current LRP shared with FT Partners on 2/8/25 REDACTED REDACTED REDACTED REDACTED

REDACTED