
Exhibit (c)(21)
AvidXchange Board discussion materials
financial profile summary LRP & Related Context
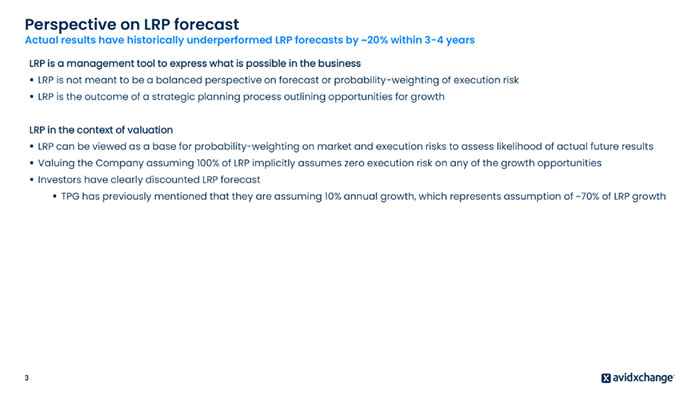
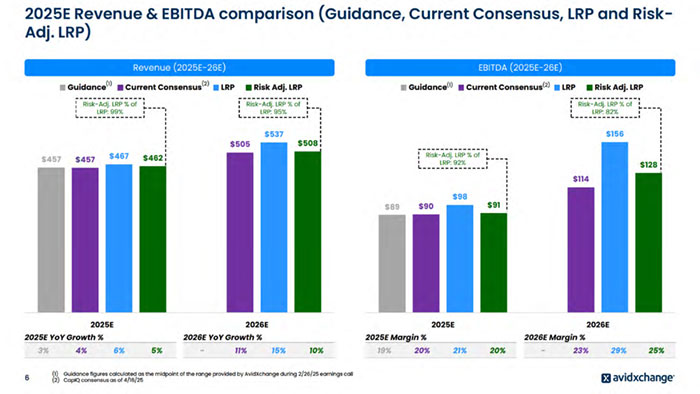
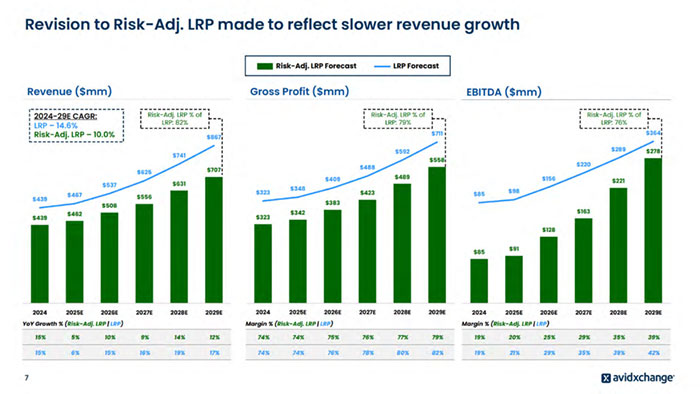
Perspective on LRP forecast Actual results have historically underperformed LRP forecasts by ~20% within 3-4 years LRP is a management tool to express what is possible in the business ? LRP is not meant to be a balanced perspective on forecast or probability-weighting of execution risk ? LRP is the outcome of a strategic planning process outlining opportunities for growth LRP in the context of valuation ? LRP can be viewed as a base for probability-weighting on market and execution risks to assess likelihood of actual future results ? Valuing the Company assuming 100% of LRP implicitly assumes zero execution risk on any of the growth opportunities ? Investors have clearly discounted LRP forecast ? TPG has previously mentioned that they are assuming 10% annual growth, which represents assumption of ~70% of LRP growth 3
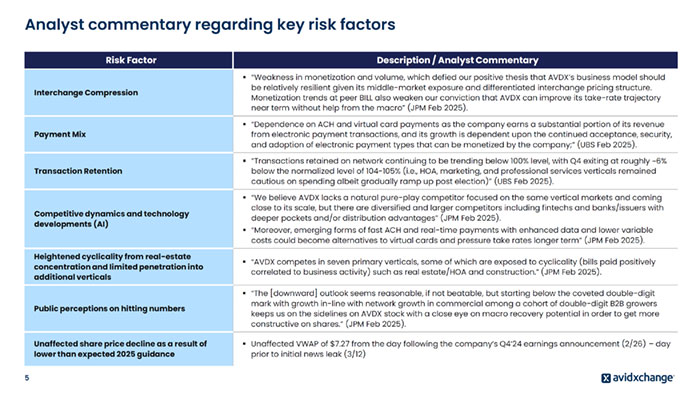
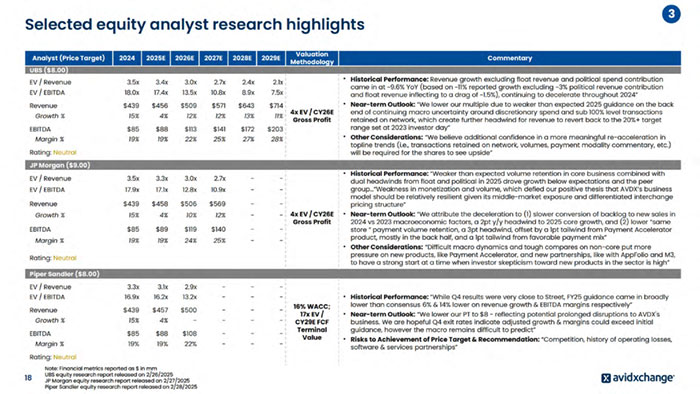
Risk Factor Description / Analyst Commentary Interchange Compression ? “Weakness in monetization and volume, which defied our positive thesis that AVDX’s business model should be relatively resilient given its middle-market exposure and differentiated interchange pricing structure. Monetization trends at peer BILL also weaken our conviction that AVDX can improve its take-rate trajectory near term without help from the macro” (JPM Feb 2025). Payment Mix ? “Dependence on ACH and virtual card payments as the company earns a substantial portion of its revenue from electronic payment transactions, and its growth is dependent upon the continued acceptance, security, and adoption of electronic payment types that can be monetized by the company;” (UBS Feb 2025). Transaction Retention ? “Transactions retained on network continuing to be trending below 100% level, with Q4 exiting at roughly ~6% below the normalized level of 104-105% (i.e., HOA, marketing, and professional services verticals remained cautious on spending albeit gradually ramp up post election)” (UBS Feb 2025). Competitive dynamics and technology developments (AI) ? “We believe AVDX lacks a natural pure-play competitor focused on the same vertical markets and coming close to its scale, but there are diversified and larger competitors including fintechs and banks/issuers with deeper pockets and/or distribution advantages” (JPM Feb 2025). ? “Moreover, emerging forms of fast ACH and real-time payments with enhanced data and lower variable costs could become alternatives to virtual cards and pressure take rates longer term” (JPM Feb 2025). Heightened cyclicality from real-estate concentration and limited penetration into additional verticals ? “AVDX competes in seven primary verticals, some of which are exposed to cyclicality (bills paid positively correlated to business activity) such as real estate/HOA and construction.” (JPM Feb 2025). Public perceptions on hitting numbers ? “The [downward] outlook seems reasonable, if not beatable, but starting below the coveted double-digit mark with growth in-line with network growth in commercial among a cohort of double-digit B2B growers keeps us on the sidelines on AVDX stock with a close eye on macro recovery potential in order to get more constructive on shares.” (JPM Feb 2025). Unaffected share price decline as a result of lower than expected 2025 guidance ? Unaffected VWAP of $7.27 from the day following the company’s Q4’24 earnings announcement (2/26) – day prior to initial news leak (3/12) Analyst commentary regarding key risk factors 5
2025E

valuation considerations
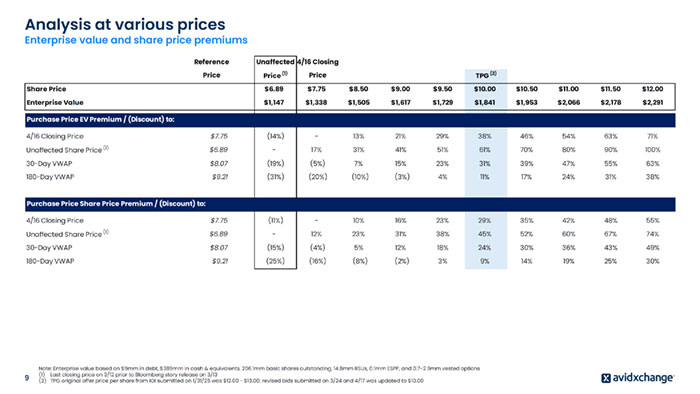
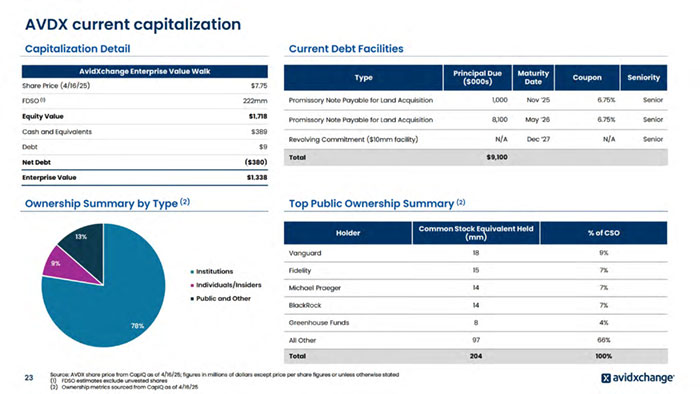
Reference Unaffected 4/16 Closing Price Price (1) Price TPG (2) Share Price $6.89 $7.75 $8.50 $9.00 $9.50 $10.00 $10.50 $11.00 $11.50 $12.00 Enterprise Value $1,147 $1,338 $1,505 $1,617 $1,729 $1,841 $1,953 $2,066 $2,178 $2,291 Purchase Price EV Premium / (Discount) to: 4/16 Closing Price $7.75 (14%) - 13% 21% 29% 38% 46% 54% 63% 71% Unaffected Share Price (1) $6.89 - 17% 31% 41% 51% 61% 70% 80% 90% 100% 30-Day VWAP $8.07 (19%) (5%) 7% 15% 23% 31% 39% 47% 55% 63% 180-Day VWAP $9.21 (31%) (20%) (10%) (3%) 4% 11% 17% 24% 31% 38% Purchase Price Share Price Premium / (Discount) to: 4/16 Closing Price $7.75 (11%) - 10% 16% 23% 29% 35% 42% 48% 55% Unaffected Share Price (1) $6.89 - 12% 23% 31% 38% 45% 52% 60% 67% 74% 30-Day VWAP $8.07 (15%) (4%) 5% 12% 18% 24% 30% 36% 43% 49% 180-Day VWAP $9.21 (25%) (16%) (8%) (2%) 3% 9% 14% 19% 25% 30% Analysis at various prices Enterprise value and share price premiums 9 Note: Enterprise value based on $9mm in debt, $389mm in cash & equivalents, 206.1mm basic shares outstanding, 14.8mm RSUs, 0.1mm ESPP, and 0.7-2.9mm vested options (1) Last closing price on 3/12 prior to Bloomberg story release on 3/13 (2) TPG original offer price per share from IOI submitted on 1/31/25 was $12.00 - $13.00; revised bids submitted on 3/24 and 4/17 was updated to $10.00
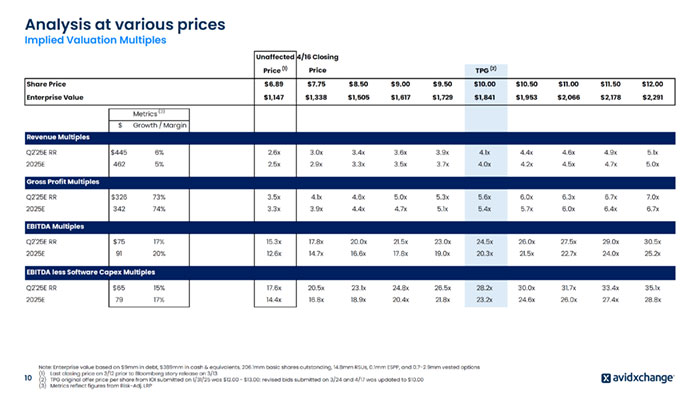
Analysis at various prices Implied Valuation Multiples Unaffected 4/16 Closing Price (1) Price TPG (2) Share Price $6.89 $7.75 $8.50 $9.00 $9.50 $10.00 $10.50 $11.00 $11.50 $12.00 Enterprise Value $1,147 $1,338 $1,505 $1,617 $1,729 $1,841 $1,953 $2,066 $2,178 $2,291 Metrics (3) $ Growth / Margin Revenue Multiples Q2'25E RR $445 6% 2.6x 3.0x 3.4x 3.6x 3.9x 4.1x 4.4x 4.6x 4.9x 5.1x 2025E 462 5% 2.5x 2.9x 3.3x 3.5x 3.7x 4.0x 4.2x 4.5x 4.7x 5.0x Gross Profit Multiples Q2'25E RR $326 73% 3.5x 4.1x 4.6x 5.0x 5.3x 5.6x 6.0x 6.3x 6.7x 7.0x 2025E 342 74% 3.3x 3.9x 4.4x 4.7x 5.1x 5.4x 5.7x 6.0x 6.4x 6.7x EBITDA Multiples Q2'25E RR $75 17% 15.3x 17.8x 20.0x 21.5x 23.0x 24.5x 26.0x 27.5x 29.0x 30.5x 2025E 91 20% 12.6x 14.7x 16.6x 17.8x 19.0x 20.3x 21.5x 22.7x 24.0x 25.2x EBITDA less Software Capex Multiples Q2'25E RR $65 15% 17.6x 20.5x 23.1x 24.8x 26.5x 28.2x 30.0x 31.7x 33.4x 35.1x 2025E 79 17% 14.4x 16.8x 18.9x 20.4x 21.8x 23.2x 24.6x 26.0x 27.4x 28.8x 10 Note: Enterprise value based on $9mm in debt, $389mm in cash & equivalents, 206.1mm basic shares outstanding, 14.8mm RSUs, 0.1mm ESPP, and 0.7-2.9mm vested options (1) Last closing price on 3/12 prior to Bloomberg story release on 3/13 (2) TPG original offer price per share from IOI submitted on 1/31/25 was $12.00 - $13.00; revised bids submitted on 3/24 and 4/17 was updated to $10.00 (3) Metrics reflect figures from Risk-Adj. LRP
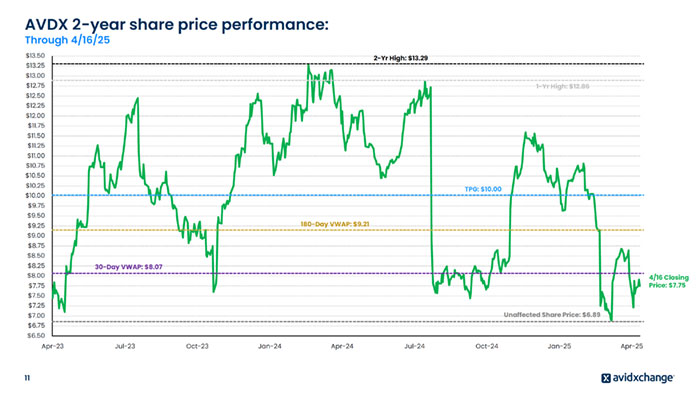
$6.50 $6.75 $7.00 $7.25 $7.50 $7.75 $8.00 $8.25 $8.50 $8.75 $9.00 $9.25 $9.50 $9.75 $10.00 $10.25 $10.50 $10.75 $11.00 $11.25 $11.50 $11.75 $12.00 $12.25 $12.50 $12.75 $13.00 $13.25 $13.50 Apr-23 Jul-23 Oct-23 Jan-24 Apr-24 Jul-24 Oct-24 Jan-25 Apr-25 AVDX 2-year share price performance: 30-Day VWAP: $8.07 180-Day VWAP: $9.21 Unaffected Share Price: $6.89 1-Yr High: $12.86 2-Yr High: $13.29 Through 4/16/25 11 TPG: $10.00 4/16 Closing Price: $7.75
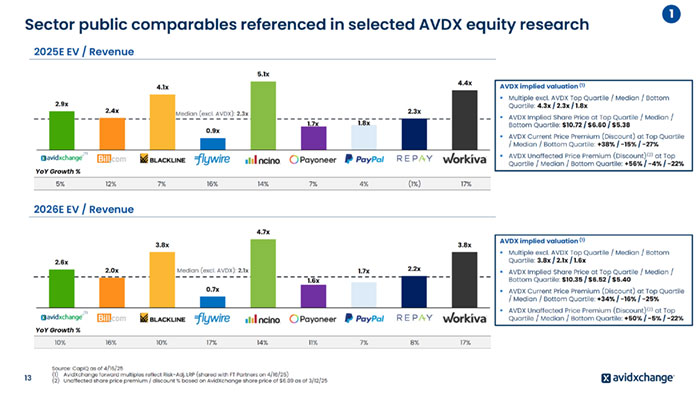
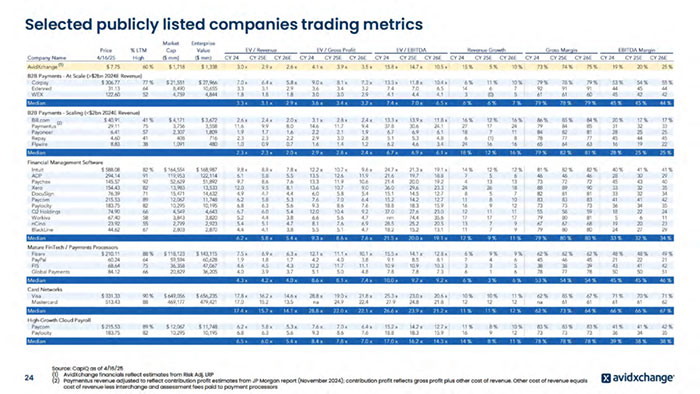
Source: CapIQ as of 4/16/25 (1) AvidXchange forward multiples reflect Risk-Adj. LRP (shared with FT Partners on 4/16/25) (2) Unaffected share price premium / discount % based on AvidXchange share price of $6.89 as of 3/12/25 1 AVDX implied valuation (1) ? Multiple excl. AVDX Top Quartile / Median / Bottom Quartile: 3.8x / 2.1x / 1.6x ? AVDX Implied Share Price at Top Quartile / Median / Bottom Quartile: $10.35 / $6.52 / $5.40 ? AVDX Current Price Premium (Discount) at Top Quartile / Median / Bottom Quartile: +34% / -16% / -25% ? AVDX Unaffected Price Premium (Discount)(2) at Top Quartile / Median / Bottom Quartile: +50% / -5% / -22% AVDX implied valuation (1) ? Multiple excl. AVDX Top Quartile / Median / Bottom Quartile: 4.3x / 2.3x / 1.8x ? AVDX Implied Share Price at Top Quartile / Median / Bottom Quartile: $10.72 / $6.60 / $5.38 ? AVDX Current Price Premium (Discount) at Top Quartile / Median / Bottom Quartile: +38% / -15% / -27% ? AVDX Unaffected Price Premium (Discount)(2) at Top Quartile / Median / Bottom Quartile: +56% / -4% / -22% 2026E EV / Revenue 2.6x 2.0x 3.8x 0.7x 4.7x 1.6x 1.7x 2.2x 3.8x Median (excl. AVDX): 2.1x 13 Sector public comparables referenced in selected AVDX equity research 2025E EV / Revenue 2.9x 2.4x 4.1x 0.9x 5.1x 1.7x 1.8x 2.3x 4.4x Median (excl. AVDX): 2.3x YoY Growth % 5% 12% 7% 16% 14% 7% 4% (1%) 17% YoY Growth % 10% 16% 10% 17% 14% 11% 7% 8% 17% (1) (1)
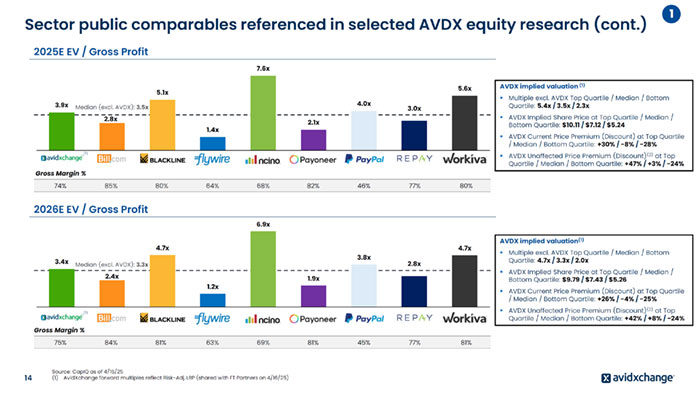
Source: CapIQ as of 4/16/25 (1) AvidXchange forward multiples reflect Risk-Adj. LRP (shared with FT Partners on 4/16/25) 1 Sector public comparables referenced in selected AVDX equity research (cont.) 14 2026E EV / Gross Profit 3.4x 2.4x 4.7x 1.2x 6.9x 1.9x 3.8x 2.8x 4.7x Median (excl. AVDX): 3.3x AVDX implied valuation(1) ? Multiple excl. AVDX Top Quartile / Median / Bottom Quartile: 4.7x / 3.3x / 2.0x ? AVDX Implied Share Price at Top Quartile / Median / Bottom Quartile: $9.79 / $7.43 / $5.26 ? AVDX Current Price Premium (Discount) at Top Quartile / Median / Bottom Quartile: +26% / -4% / -25% ? AVDX Unaffected Price Premium (Discount)(2) at Top Quartile / Median / Bottom Quartile: +42% / +8% / -24% 2025E EV / Gross Profit 3.9x 2.8x 5.1x 1.4x 7.6x 2.1x 4.0x 3.0x 5.6x Median (excl. AVDX): 3.5x AVDX implied valuation (1) ? Multiple excl. AVDX Top Quartile / Median / Bottom Quartile: 5.4x / 3.5x / 2.3x ? AVDX Implied Share Price at Top Quartile / Median / Bottom Quartile: $10.11 / $7.12 / $5.24 ? AVDX Current Price Premium (Discount) at Top Quartile / Median / Bottom Quartile: +30% / -8% / -28% ? AVDX Unaffected Price Premium (Discount)(2) at Top Quartile / Median / Bottom Quartile: +47% / +3% / -24% Gross Margin % 74% 85% 80% 64% 68% 82% 46% 77% 80% Gross Margin % 75% 84% 81% 63% 69% 81% 45% 77% 81% (1) (1)
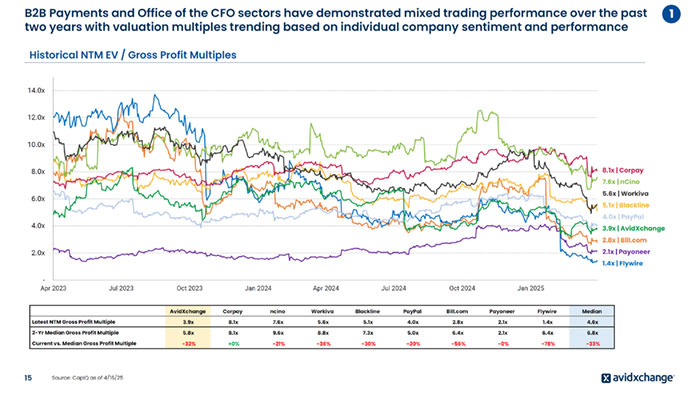
- 2.0x 4.0x 6.0x 8.0x 10.0x 12.0x 14.0x Apr 2023 Jul 2023 Oct 2023 Jan 2024 Apr 2024 Jul 2024 Oct 2024 Jan 2025 Source: CapIQ as of 4/16/25 Historical NTM EV / Gross Profit Multiples 2.8x | Bill.com 3.9x | AvidXchange 5.1x | Blackline 8.1x | Corpay 7.6x | nCino 5.6x | Workiva AvidXchange Corpay ncino Workiva Blackline PayPal Bill.com Payoneer Flywire Median Latest NTM Gross Profit Multiple 3.9x 8.1x 7.6x 5.6x 5.1x 4.0x 2.8x 2.1x 1.4x 4.6x 2-Yr Median Gross Profit Multiple 5.8x 8.1x 9.6x 8.8x 7.3x 5.0x 6.4x 2.1x 6.4x 6.8x Current vs. Median Gross Profit Multiple -32% +0% -21% -36% -30% -20% -56% -0% -78% -33% 1 15 B2B Payments and Office of the CFO sectors have demonstrated mixed trading performance over the past two years with valuation multiples trending based on individual company sentiment and performance 2.1x | Payoneer 1.4x | Flywire 4.0x | PayPal
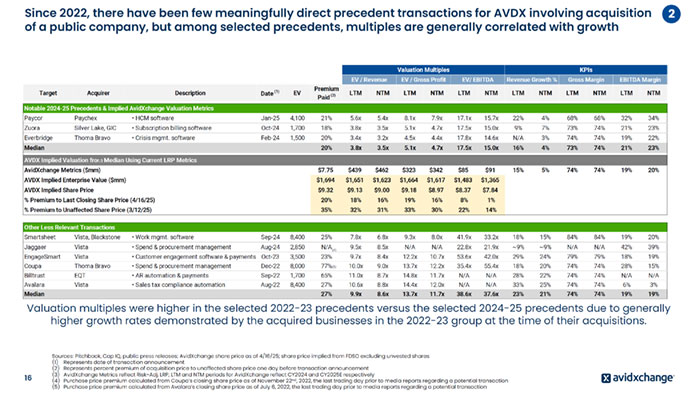
Valuation Multiples KPIs EV / Revenue EV / Gross Profit EV/ EBITDA Revenue Growth % Gross Margin EBITDA Margin Target Acquirer Description Date (1) EV Premium Paid (2) LTM NTM LTM NTM LTM NTM LTM NTM LTM NTM LTM NTM Notable 2024-25 Precedents & Implied AvidXchange Valuation Metrics Paycor Paychex • HCM software Jan-25 4,100 21% 5.6x 5.4x 8.1x 7.9x 17.1x 15.7x 22% 4% 68% 68% 32% 34% Zuora Silver Lake, GIC • Subscription billing software Oct-24 1,700 18% 3.8x 3.5x 5.1x 4.7x 17.5x 15.0x 9% 7% 73% 74% 21% 23% Everbridge Thoma Bravo • Crisis mgmt. software Feb-24 1,500 20% 3.4x 3.2x 4.5x 4.4x 17.8x 14.6x N/A 3% 74% 74% 19% 22% Median 20% 3.8x 3.5x 5.1x 4.7x 17.5x 15.0x 16% 4% 73% 74% 21% 23% AVDX Implied Valuation from Median Using Current LRP Metrics AvidXchange Metrics ($mm) $7.75 $439 $462 $323 $342 $85 $91 15% 5% 74% 74% 19% 20% AVDX Implied Enterprise Value ($mm) $1,694 $1,651 $1,623 $1,664 $1,617 $1,483 $1,365 AVDX Implied Share Price $9.32 $9.13 $9.00 $9.18 $8.97 $8.37 $7.84 % Premium to Last Closing Share Price (4/16/25) 20% 18% 16% 19% 16% 8% 1% % Premium to Unaffected Share Price (3/12/25) 35% 32% 31% 33% 30% 22% 14% Other Less Relevant Transactions Smartsheet Vista, Blackstone • Work mgmt. software Sep-24 8,400 25% 7.8x 6.8x 9.3x 8.0x 41.9x 33.2x 18% 15% 84% 84% 19% 20% Jaggaer Vista • Spend & procurement management Aug-24 2,850 N/A 9.5x 8.5x N/A N/A 22.8x 21.9x ~9% ~9% N/A N/A 42% 39% EngageSmart Vista • Customer engagement software & payments Oct-23 3,500 23% 9.7x 8.4x 12.2x 10.7x 53.6x 42.0x 29% 24% 79% 79% 18% 19% Coupa Thoma Bravo • Spend & procurement management Dec-22 8,000 77% 10.0x 9.0x 13.7x 12.2x 35.4x 55.4x 18% 20% 74% 74% 28% 15% Billtrust EQT • AR automation & payments Sep-22 1,700 65% 11.0x 8.7x 14.8x 11.7x N/A N/A 28% 22% 74% 74% N/A N/A Avalara Vista • Sales tax compliance automation Aug-22 8,400 27% 10.6x 8.8x 14.4x 12.0x N/A N/A 33% 25% 74% 74% 6% 3% Median 27% 9.9x 8.6x 13.7x 11.7x 38.6x 37.6x 23% 21% 74% 74% 19% 19% Since 2022, there have been few meaningfully direct precedent transactions for AVDX involving acquisition of a public company, but among selected precedents, multiples are generally correlated with growth Sources: Pitchbook, Cap IQ, public press releases; AvidXchange share price as of 4/16/25; share price implied from FDSO excluding unvested shares (1) Represents date of transaction announcement (2) Represents percent premium of acquisition price to unaffected share price one day before transaction announcement (3) AvidXchange Metrics reflect Risk-Adj. LRP; LTM and NTM periods for AvidXchange reflect CY2024 and CY2025E respectively (4) Purchase price premium calculated from Coupa’s closing share price as of November 22nd, 2022, the last trading day prior to media reports regarding a potential transaction (5) Purchase price premium calculated from Avalara’s closing share price as of July 6, 2022, the last trading day prior to media reports regarding a potential transaction (4) (5) Valuation multiples were higher in the selected 2022-23 precedents versus the selected 2024-25 precedents due to generally higher growth rates demonstrated by the acquired businesses in the 2022-23 group at the time of their acquisitions. 2 16 (3)
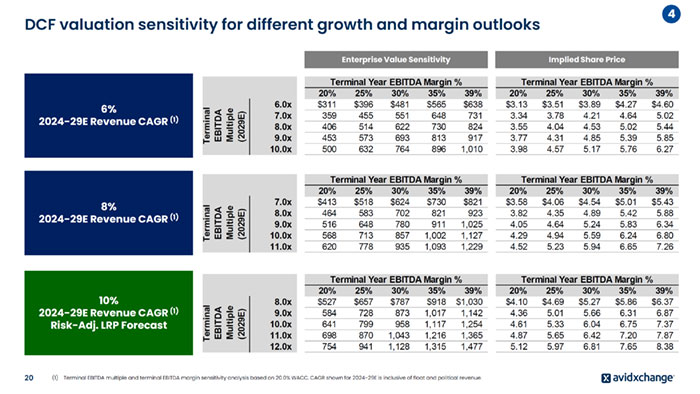
4 20 DCF valuation sensitivity for different growth and margin outlooks 6% 2024-29E Revenue CAGR (1) 10% 2024-29E Revenue CAGR (1) Risk-Adj. LRP Forecast 8% 2024-29E Revenue CAGR (1) (1) Terminal EBITDA multiple and terminal EBITDA margin sensitivity analysis based on 20.0% WACC. CAGR shown for 2024-29E is inclusive of float and political revenue. Terminal Year EBITDA Margin % Terminal Year EBITDA Margin % 20% 25% 30% 35% 39% 20% 25% 30% 35% 39% 8.0x $527 $657 $787 $918 $1,030 $4.10 $4.69 $5.27 $5.86 $6.37 9.0x 584 728 873 1,017 1,142 4.36 5.01 5.66 6.31 6.87 10.0x 641 799 958 1,117 1,254 4.61 5.33 6.04 6.75 7.37 11.0x 698 870 1,043 1,216 1,365 4.87 5.65 6.42 7.20 7.87 12.0x 754 941 1,128 1,315 1,477 5.12 5.97 6.81 7.65 8.38 Terminal EBITDA Multiple (2029E) Terminal Year EBITDA Margin % Terminal Year EBITDA Margin % 20% 25% 30% 35% 39% 20% 25% 30% 35% 39% 7.0x $413 $518 $624 $730 $821 $3.58 $4.06 $4.54 $5.01 $5.43 8.0x 464 583 702 821 923 3.82 4.35 4.89 5.42 5.88 9.0x 516 648 780 911 1,025 4.05 4.64 5.24 5.83 6.34 10.0x 568 713 857 1,002 1,127 4.29 4.94 5.59 6.24 6.80 11.0x 620 778 935 1,093 1,229 4.52 5.23 5.94 6.65 7.26 Terminal EBITDA Multiple (2029E) Terminal Year EBITDA Margin % Terminal Year EBITDA Margin % 20% 25% 30% 35% 39% 20% 25% 30% 35% 39% 6.0x $311 $396 $481 $565 $638 $3.13 $3.51 $3.89 $4.27 $4.60 7.0x 359 455 551 648 731 3.34 3.78 4.21 4.64 5.02 8.0x 406 514 622 730 824 3.55 4.04 4.53 5.02 5.44 9.0x 453 573 693 813 917 3.77 4.31 4.85 5.39 5.85 10.0x 500 632 764 896 1,010 3.98 4.57 5.17 5.76 6.27 Terminal EBITDA Multiple (2029E) Enterprise Value Sensitivity Implied Share Price
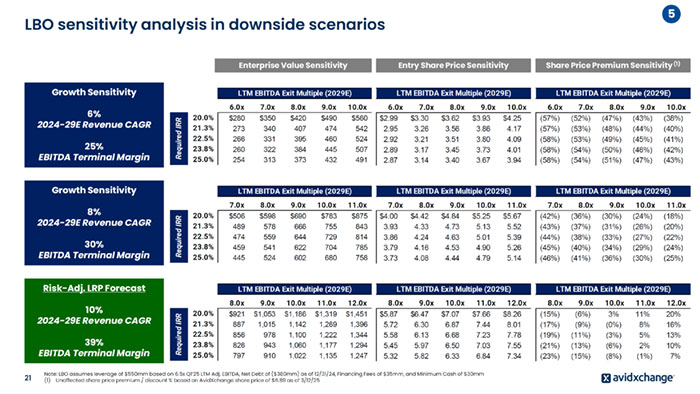
LBO sensitivity analysis in downside scenarios 5 21 Growth Sensitivity 6% 2024-29E Revenue CAGR 25% EBITDA Terminal Margin Growth Sensitivity 8% 2024-29E Revenue CAGR 30% EBITDA Terminal Margin Risk-Adj. LRP Forecast 10% 2024-29E Revenue CAGR 39% EBITDA Terminal Margin Enterprise Value Sensitivity Entry Share Price Sensitivity LTM EBITDA Exit Multiple (2029E) 8.0x 9.0x 10.0x 11.0x 12.0x 20.0% $921 $1,053 $1,186 $1,319 $1,451 21.3% 887 1,015 1,142 1,269 1,396 22.5% 856 978 1,100 1,222 1,344 23.8% 826 943 1,060 1,177 1,294 25.0% 797 910 1,022 1,135 1,247 Required IRR LTM EBITDA Exit Multiple (2029E) 8.0x 9.0x 10.0x 11.0x 12.0x $5.87 $6.47 $7.07 $7.66 $8.26 5.72 6.30 6.87 7.44 8.01 5.58 6.13 6.68 7.23 7.78 5.45 5.97 6.50 7.03 7.55 5.32 5.82 6.33 6.84 7.34 LTM EBITDA Exit Multiple (2029E) 6.0x 7.0x 8.0x 9.0x 10.0x $2.99 $3.30 $3.62 $3.93 $4.25 2.95 3.26 3.56 3.86 4.17 2.92 3.21 3.51 3.80 4.09 2.89 3.17 3.45 3.73 4.01 2.87 3.14 3.40 3.67 3.94 LTM EBITDA Exit Multiple (2029E) 6.0x 7.0x 8.0x 9.0x 10.0x 20.0% $280 $350 $420 $490 $560 21.3% 273 340 407 474 542 22.5% 266 331 395 460 524 23.8% 260 322 384 445 507 25.0% 254 313 373 432 491 Required IRR LTM EBITDA Exit Multiple (2029E) 7.0x 8.0x 9.0x 10.0x 11.0x 20.0% $506 $598 $690 $783 $875 21.3% 489 578 666 755 843 22.5% 474 559 644 729 814 23.8% 459 541 622 704 785 25.0% 445 524 602 680 758 Required IRR LTM EBITDA Exit Multiple (2029E) 7.0x 8.0x 9.0x 10.0x 11.0x $4.00 $4.42 $4.84 $5.25 $5.67 3.93 4.33 4.73 5.13 5.52 3.86 4.24 4.63 5.01 5.39 3.79 4.16 4.53 4.90 5.26 3.73 4.08 4.44 4.79 5.14 LTM EBITDA Exit Multiple (2029E) 8.0x 9.0x 10.0x 11.0x 12.0x (15%) (6%) 3% 11% 20% (17%) (9%) (0%) 8% 16% (19%) (11%) (3%) 5% 13% (21%) (13%) (6%) 2% 10% (23%) (15%) (8%) (1%) 7% Share Price Premium Sensitivity (1) LTM EBITDA Exit Multiple (2029E) 7.0x 8.0x 9.0x 10.0x 11.0x (42%) (36%) (30%) (24%) (18%) (43%) (37%) (31%) (26%) (20%) (44%) (38%) (33%) (27%) (22%) (45%) (40%) (34%) (29%) (24%) (46%) (41%) (36%) (30%) (25%) LTM EBITDA Exit Multiple (2029E) 6.0x 7.0x 8.0x 9.0x 10.0x (57%) (52%) (47%) (43%) (38%) (57%) (53%) (48%) (44%) (40%) (58%) (53%) (49%) (45%) (41%) (58%) (54%) (50%) (46%) (42%) (58%) (54%) (51%) (47%) (43%) Note: LBO assumes leverage of $550mm based on 6.5x Q1’25 LTM Adj. EBITDA, Net Debt of ($380mm) as of 12/31/24, Financing Fees of $35mm, and Minimum Cash of $30mm (1) Unaffected share price premium / discount % based on AvidXchange share price of $6.89 as of 3/12/25
Appendix - DCF Reference Materials
appendix - risk-adj. lrp p&l
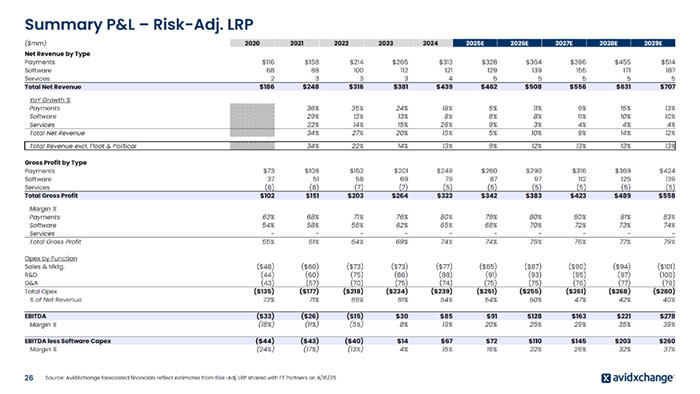
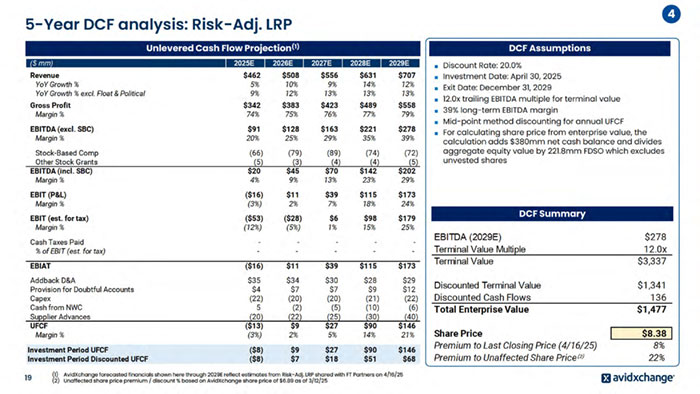
Summary P&L – Risk-Adj. LRP ($mm) 2020 2021 2022 2023 2024 2025E 2026E 2027E 2028E 2029E Net Revenue by Type Payments $116 $158 $214 $265 $313 $328 $364 $396 $455 $514 Software 68 88 100 112 121 129 139 155 171 187 Services 2 3 3 3 4 5 5 5 5 5 Total Net Revenue $186 $248 $316 $381 $439 $462 $508 $556 $631 $707 YoY Growth % Payments 36% 35% 24% 18% 5% 11% 9% 15% 13% Software 29% 13% 13% 8% 6% 8% 11% 10% 10% Services 22% 14% 15% 26% 9% 3% 4% 4% 4% Total Net Revenue 34% 27% 20% 15% 5% 10% 9% 14% 12% Total Revenue excl. Float & Political 34% 22% 14% 13% 9% 12% 13% 13% 13% Gross Profit by Type Payments $73 $108 $152 $201 $249 $260 $290 $316 $369 $424 Software 37 51 58 69 79 87 97 112 125 139 Services (8) (8) (7) (7) (5) (5) (5) (5) (5) (5) Total Gross Profit $102 $151 $203 $264 $323 $342 $383 $423 $489 $558 Margin % Payments 63% 68% 71% 76% 80% 79% 80% 80% 81% 83% Software 54% 58% 58% 62% 65% 68% 70% 72% 73% 74% Services - - - - - - - - - - Total Gross Profit 55% 61% 64% 69% 74% 74% 75% 76% 77% 79% Opex by Function Sales & Mktg. ($48) ($60) ($73) ($73) ($77) ($85) ($87) ($90) ($94) ($101) R&D (44) (60) (75) (86) (88) (91) (93) (95) (97) (100) G&A (43) (57) (70) (75) (74) (75) (75) (76) (77) (79) Total Opex ($135) ($177) ($218) ($234) ($239) ($251) ($255) ($261) ($268) ($280) % of Net Revenue 73% 71% 69% 61% 54% 54% 50% 47% 42% 40% EBITDA ($33) ($26) ($15) $30 $85 $91 $128 $163 $221 $278 Margin % (18%) (11%) (5%) 8% 19% 20% 25% 29% 35% 39% EBITDA less Software Capex ($44) ($43) ($40) $14 $67 $72 $110 $145 $203 $260 Margin % (24%) (17%) (13%) 4% 15% 16% 22% 26% 32% 37% Source: AvidXchange forecasted financials reflect estimates from Risk-Adj. LRP 26 shared with FT Partners on 4/16/25