Exhibit (c)(3)
Project Virgil: Preliminary Valuation Analysis January 2025
1. Virgil Trading Performance 1 2. Preliminary Perspectives on Valuation 6 Appendix 15 Proposed Agenda

Virgil Trading Performance
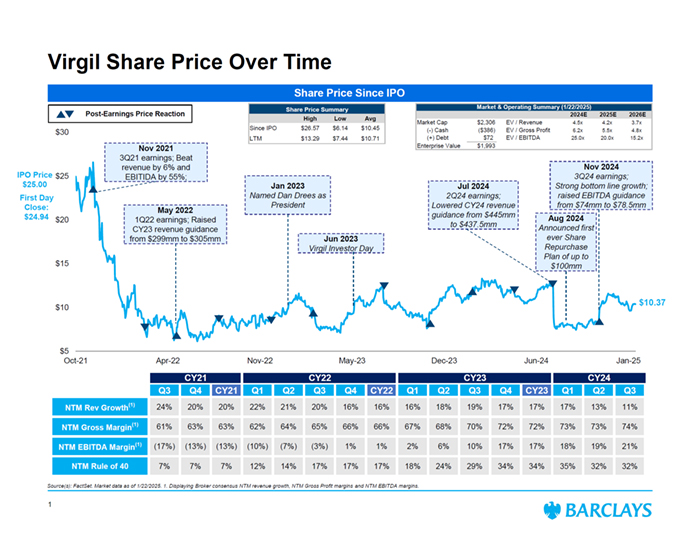
$5 $10 $15 $20 $25 $30 Oct-21 Apr-22 Nov-22 May-23 Dec-23 Jun-24 Jan-25 Virgil Share Price Over Time Source(s): FactSet. Market data as of 1/22/2025. 1. Displaying Broker consensus NTM revenue growth, NTM Gross Profit margins and NTM EBITDA margins. Share Price Since IPO $10.37 Post-Earnings Price Reaction IPO Price $25.00 First Day Close: $24.94 Market & Operating Summary (1/22/2025) 2024E 2025E 2026E Market Cap $2,306 EV / Revenue 4.5x 4.2x 3.7x (-) Cash ($386) EV / Gross Profit 6.2x 5.5x 4.8x (+) Debt $72 EV / EBITDA 25.0x 20.0x 15.2x Enterprise Value $1,993 CY21 CY22 CY23 CY24 Q3 Q4 CY21 Q1 Q2 Q3 Q4 CY22 Q1 Q2 Q3 Q4 CY23 Q1 Q2 Q3 NTM Rev Growth(1) 24% 20% 20% 22% 21% 20% 16% 16% 16% 18% 19% 17% 17% 17% 13% 11% NTM Gross Margin(1) 61% 63% 63% 62% 64% 65% 66% 66% 67% 68% 70% 72% 72% 73% 73% 74% NTM EBITDA Margin(1) (17%) (13%) (13%) (10%) (7%) (3%) 1% 1% 2% 6% 10% 17% 17% 18% 19% 21% NTM Rule of 40 7% 7% 7% 12% 14% 17% 17% 17% 18% 24% 29% 34% 34% 35% 32% 32% Share Price Summary High Low Avg Since IPO $26.57 $6.14 $10.45 LTM $13.29 $7.44 $10.71 Nov 2021 3Q21 earnings; Beat revenue by 6% and EBITIDA by 55%; May 2022 1Q22 earnings; Raised CY23 revenue guidance from $299mm to $305mm Jan 2023 Named Dan Drees as President Jun 2023 Virgil Investor Day Jul 2024 2Q24 earnings; Lowered CY24 revenue guidance from $445mm to $437.5mm Aug 2024 Announced first ever Share Repurchase Plan of up to $100mm Nov 2024 3Q24 earnings; Strong bottom line growth; raised EBITDA guidance from $74mm to $78.5mm 1
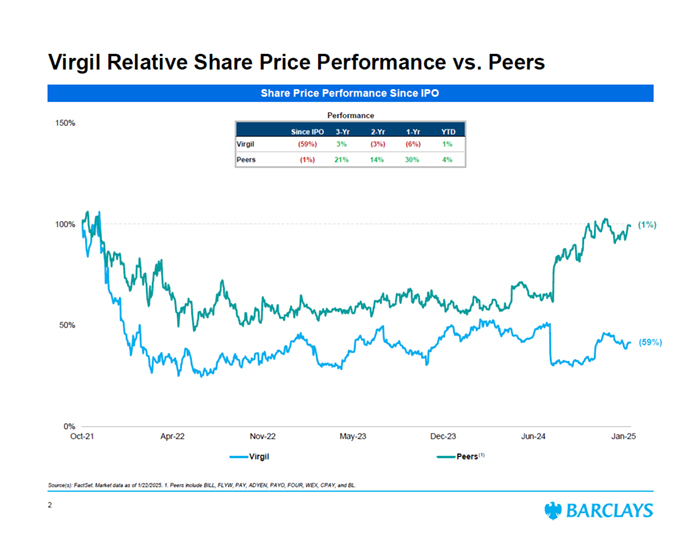
Virgil Relative Share Price Performance vs. Peers Source(s): FactSet. Market data as of 1/22/2025. 1. Peers include BILL, FLYW, PAY, ADYEN, PAYO, FOUR, WEX, CPAY, and BL. Share Price Performance Since IPO 0% 50% 100% 150% Oct-21 Apr-22 Nov-22 May-23 Dec-23 Jun-24 Jan-25 Virgil Peers (59%) (1%) Performance Since IPO 3-Yr 2-Yr 1-Yr YTD Virgil (59%) 3% (3%) (6%) 1% Peers (1%) 21% 14% 30% 4% (1) 2
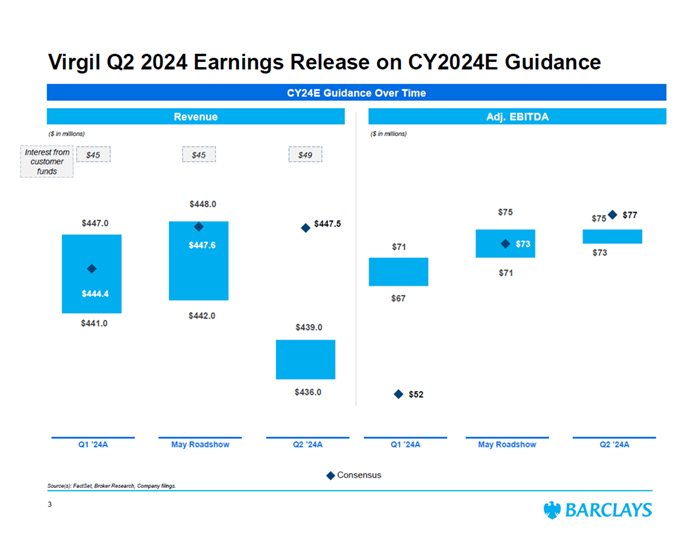
$67 $71 $73 $52 $73 $77 $71 $75 $75 $441.0 $442.0 $436.0 $444.4 $447.6 $447.0 $447.5 $448.0 $439.0 Virgil Q2 2024 Earnings Release on CY2024E Guidance Source(s): FactSet, Broker Research, Company filings. CY24E Guidance Over Time Revenue Adj. EBITDA Q1 ’24A May Roadshow Q2 ’24A Q1 ’24A May Roadshow Q2 ’24A Consensus ($ in millions) Interest from customer funds $45 $45 $49 ($ in millions) 3
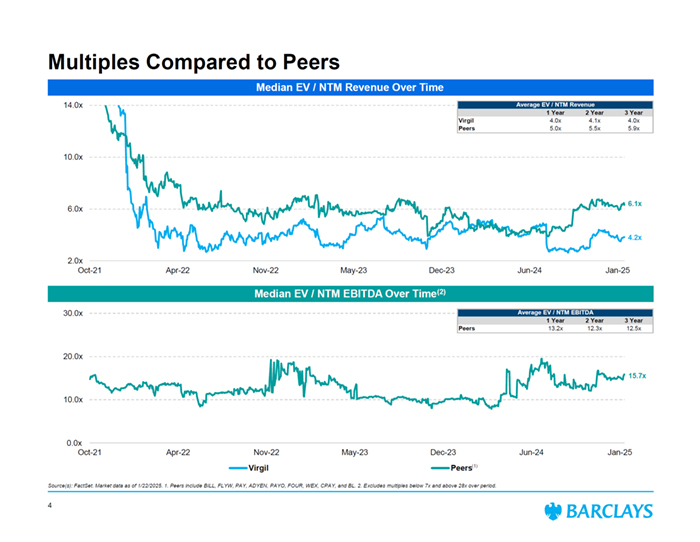
- 10.0x 20.0x 30.0x Oct-21 Apr-22 Nov-22 May-23 Dec-23 Jun-24 Jan-25 Virgil Peers Multiples Compared to Peers Median EV / NTM Revenue Over Time Median EV / NTM EBITDA Over Time(2) 6.1x 4.2x 15.7x Source(s): FactSet. Market data as of 1/22/2025. 1. Peers include BILL, FLYW, PAY, ADYEN, PAYO, FOUR, WEX, CPAY, and BL. 2. Excludes multiples below 7x and above 28x over period. (1) Average EV / NTM EBITDA 1 Year 2 Year 3 Year Peers 13.2x 12.3x 12.5x 0.0x 2.0x 6.0x 10.0x 14.0x Oct-21 Apr-22 Nov-22 May-23 Dec-23 Jun-24 Jan-25 Average EV / NTM Revenue 1 Year 2 Year 3 Year Virgil 4.0x 4.1x 4.0x Peers 5.0x 5.5x 5.9x 4
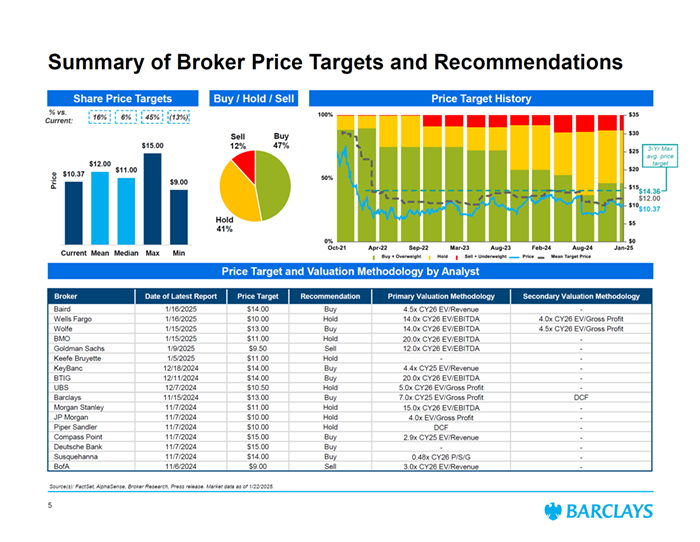
Summary of Broker Price Targets and Recommendations Source(s): FactSet, AlphaSense, Broker Research, Press release. Market data as of 1/22/2025. Share Price Targets Price % vs. Current: 16% 6% $10.37 $12.00 $11.00 $15.00 $9.00 Current Mean Median Max Min (13%) Buy 47% Hold 41% Sell 12% Buy / Hold / Sell Price Target and Valuation Methodology by Analyst Price Target History 45% $10.37 $12.00 Broker Date of Latest Report Price Target Recommendation Primary Valuation Methodology Secondary Valuation Methodology Baird 1/16/2025 $14.00 Buy 4.5x CY26 EV/Revenue - Wells Fargo 1/16/2025 $10.00 Hold 14.0x CY26 EV/EBITDA 4.0x CY26 EV/Gross Profit Wolfe 1/15/2025 $13.00 Buy 14.0x CY26 EV/EBITDA 4.5x CY26 EV/Gross Profit BMO 1/15/2025 $11.00 Hold 20.0x CY26 EV/EBITDA - Goldman Sachs 1/9/2025 $9.50 Sell 12.0x CY26 EV/EBITDA - Keefe Bruyette 1/5/2025 $11.00 Hold - - KeyBanc 12/18/2024 $14.00 Buy 4.4x CY25 EV/Revenue - BTIG 12/11/2024 $14.00 Buy 20.0x CY26 EV/EBITDA - UBS 12/7/2024 $10.50 Hold 5.0x CY26 EV/Gross Profit - Barclays 11/15/2024 $13.00 Buy 7.0x CY25 EV/Gross Profit DCF Morgan Stanley 11/7/2024 $11.00 Hold 15.0x CY26 EV/EBITDA - JP Morgan 11/7/2024 $10.00 Hold 4.0x EV/Gross Profit - Piper Sandler 11/7/2024 $10.00 Hold DCF - Compass Point 11/7/2024 $15.00 Buy 2.9x CY25 EV/Revenue - Deutsche Bank 11/7/2024 $15.00 Buy - - Susquehanna 11/7/2024 $14.00 Buy 0.48x CY26 P/S/G - BofA 11/6/2024 $9.00 Sell 3.0x CY26 EV/Revenue - $14.36 3-Yr Max avg. price target 5
Preliminary Perspectives on Valuation
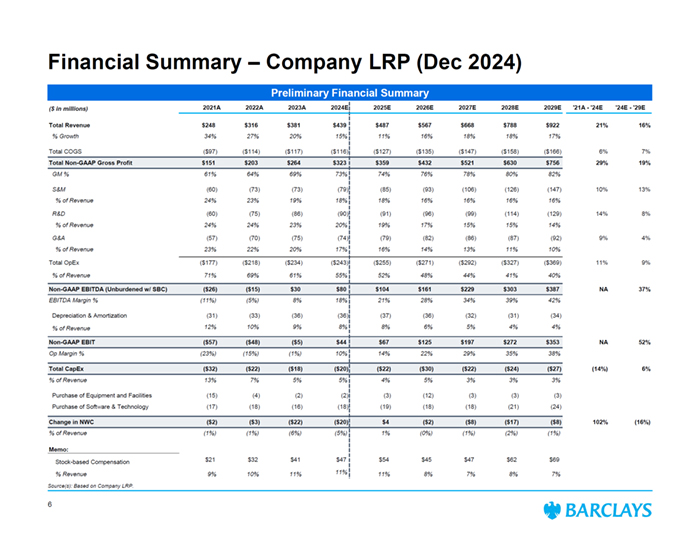
Financial Summary – Company LRP (Dec 2024) Preliminary Financial Summary Source(s): Based on Company LRP. ($ in millions) 2021A 2022A 2023A 2024E 2025E 2026E 2027E 2028E 2029E '21A - '24E '24E - '29E Total Revenue $248 $316 $381 $439 $487 $567 $668 $788 $922 21% 16% % Growth 34% 27% 20% 15% 11% 16% 18% 18% 17% Total COGS ($97) ($114) ($117) ($116) ($127) ($135) ($147) ($158) ($166) 6% 7% Total Non-GAAP Gross Profit $151 $203 $264 $323 $359 $432 $521 $630 $756 29% 19% GM % 61% 64% 69% 73% 74% 76% 78% 80% 82% S&M (60) (73) (73) (79) (85) (93) (106) (126) (147) 10% 13% % of Revenue 24% 23% 19% 18% 18% 16% 16% 16% 16% R&D (60) (75) (86) (90) (91) (96) (99) (114) (129) 14% 8% % of Revenue 24% 24% 23% 20% 19% 17% 15% 15% 14% G&A (57) (70) (75) (74) (79) (82) (86) (87) (92) 9% 4% % of Revenue 23% 22% 20% 17% 16% 14% 13% 11% 10% Total OpEx ($177) ($218) ($234) ($243) ($255) ($271) ($292) ($327) ($369) 11% 9% % of Revenue 71% 69% 61% 55% 52% 48% 44% 41% 40% Non-GAAP EBITDA (Unburdened w/ SBC) ($26) ($15) $30 $80 $104 $161 $229 $303 $387 NA 37% EBITDA Margin % (11%) (5%) 8% 18% 21% 28% 34% 39% 42% Depreciation & Amortization (31) (33) (36) (36) (37) (36) (32) (31) (34) % of Revenue 12% 10% 9% 8% 8% 6% 5% 4% 4% Non-GAAP EBIT ($57) ($48) ($5) $44 $67 $125 $197 $272 $353 NA 52% Op Margin % (23%) (15%) (1%) 10% 14% 22% 29% 35% 38% Total CapEx ($32) ($22) ($18) ($20) ($22) ($30) ($22) ($24) ($27) (14%) 6% % of Revenue 13% 7% 5% 5% 4% 5% 3% 3% 3% Purchase of Equipment and Facilities (15) (4) (2) (2) (3) (12) (3) (3) (3) Purchase of Software & Technology (17) (18) (16) (18) (19) (18) (18) (21) (24) Change in NWC ($2) ($3) ($22) ($20) $4 ($2) ($8) ($17) ($8) 102% (16%) % of Revenue (1%) (1%) (6%) (5%) 1% (0%) (1%) (2%) (1%) Memo: Stock-based Compensation $21 $32 $41 $47 $54 $45 $47 $62 $69 % Revenue 9% 10% 11% 11% 11% 8% 7% 8% 7% 6
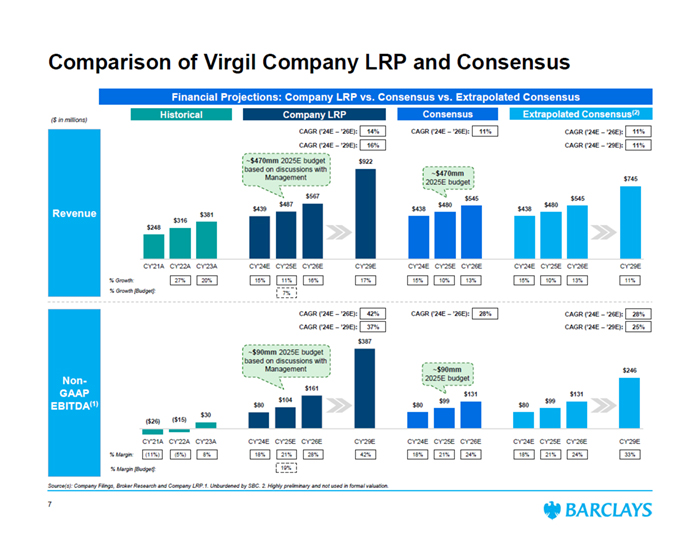
$248 $316 $381 $439 $487 $567 $922 $438 $480 $545 $438 $480 $545 $745 CY'21A CY'22A CY'23A CY'24E CY'25E CY'26E CY'29E CY'24E CY'25E CY'26E CY'24E CY'25E CY'26E CY'29E ($26) ($15) $30 $80 $104 $161 $387 $80 $99 $131 $80 $99 $131 $246 CY'21A CY'22A CY'23A CY'24E CY'25E CY'26E CY'29E CY'24E CY'25E CY'26E CY'24E CY'25E CY'26E CY'29E Revenue ($ in millions) Non- GAAP EBITDA(1) Financial Projections: Company LRP vs. Consensus vs. Extrapolated Consensus % Growth: 14% Comparison of Virgil Company LRP and Consensus Source(s): Company Filings, Broker Research and Company LRP.1. Unburdened by SBC. 2. Highly preliminary and not used in formal valuation. 17% 15% 10% 13% % Margin: 16% CAGR (’24E – ’26E): 42% 15% 11% 18% 21% 28% 42% 18% 21% 24% 27% 20% (11%) (5%) 8% ~$470mm 2025E budget based on discussions with Management CAGR (’24E – ’26E): 11% 28% CAGR (’24E – ’26E): CAGR (’24E – ’26E): 11% 33% CAGR (’24E – ’29E): 16% CAGR (’24E – ’29E): 11% CAGR (’24E – ’29E): 37% CAGR (’24E – ’29E): 25% Historical Company LRP 15% 10% 13% Consensus Extrapolated Consensus(2) CAGR (’24E – ’26E): 11% 18% 21% 24% CAGR (’24E – ’26E): 28% 7 ~$90mm 2025E budget based on discussions with Management 7% 19% % Growth [Budget]: % Margin [Budget]: ~$470mm 2025E budget ~$90mm 2025E budget
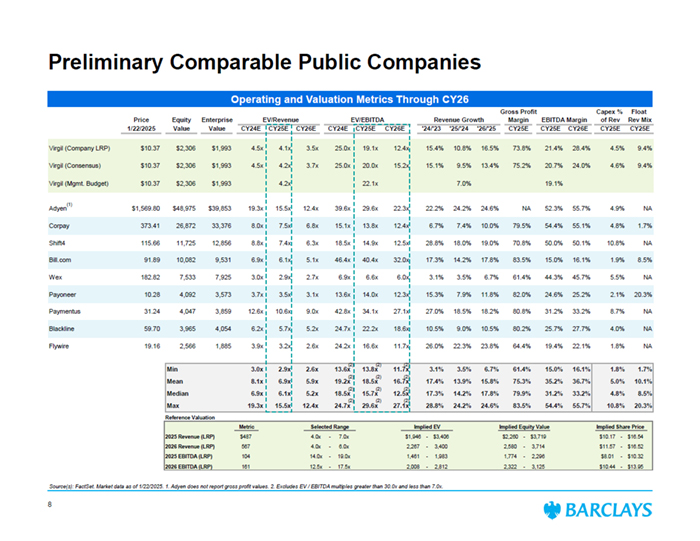
Preliminary Comparable Public Companies Operating and Valuation Metrics Through CY26 Source(s): FactSet. Market data as of 1/22/2025. 1. Adyen does not report gross profit values. 2. Excludes EV / EBITDA multiples greater than 30.0x and less than 7.0x. Gross Profit Capex % Float Price Equity Enterprise EV/Revenue EV/EBITDA Revenue Growth Margin EBITDA Margin of Rev Rev Mix 1/22/2025 Value Value CY24E CY25E CY26E CY24E CY25E CY26E '24/'23 '25/'24 '26/'25 CY25E CY25E CY26E CY25E CY25E Reported Virgil (Company LRP) $10.37 $2,306 $1,993 4.5x 4.1x 3.5x 25.0x 19.1x 12.4x 15.4% 10.8% 16.5% 73.8% 21.4% 28.4% 4.5% 9.4% Virgil (Consensus) $10.37 $2,306 $1,993 4.5x 4.2x 3.7x 25.0x 20.0x 15.2x 15.1% 9.5% 13.4% 75.2% 20.7% 24.0% 4.6% 9.4% Virgil (Mgmt. Budget) $10.37 $2,306 $1,993 4.2x 22.1x 7.0% 19.1% Adyen $1,569.80 $48,975 $39,853 19.3x 15.5x 12.4x 39.6x 29.6x 22.3x 22.2% 24.2% 24.6% NA 52.3% 55.7% 4.9% NA Corpay 373.41 26,872 33,376 8.0x 7.5x 6.8x 15.1x 13.8x 12.4x 6.7% 7.4% 10.0% 79.5% 54.4% 55.1% 4.8% 1.7% Shift4 115.66 11,725 12,856 8.8x 7.4x 6.3x 18.5x 14.9x 12.5x 28.8% 18.0% 19.0% 70.8% 50.0% 50.1% 10.8% NA Bill.com 91.89 10,082 9,531 6.9x 6.1x 5.1x 46.4x 40.4x 32.0x 17.3% 14.2% 17.8% 83.5% 15.0% 16.1% 1.9% 8.5% Wex 182.82 7,533 7,925 3.0x 2.9x 2.7x 6.9x 6.6x 6.0x 3.1% 3.5% 6.7% 61.4% 44.3% 45.7% 5.5% NA Payoneer 10.28 4,092 3,573 3.7x 3.5x 3.1x 13.6x 14.0x 12.3x 15.3% 7.9% 11.8% 82.0% 24.6% 25.2% 2.1% 20.3% Paymentus 31.24 4,047 3,859 12.6x 10.6x 9.0x 42.8x 34.1x 27.1x 27.0% 18.5% 18.2% 80.8% 31.2% 33.2% 8.7% NA Blackline 59.70 3,965 4,054 6.2x 5.7x 5.2x 24.7x 22.2x 18.6x 10.5% 9.0% 10.5% 80.2% 25.7% 27.7% 4.0% NA Flywire 19.16 2,566 1,885 3.9x 3.2x 2.6x 24.2x 16.6x 11.7x 26.0% 22.3% 23.8% 64.4% 19.4% 22.1% 1.8% NA Min 3.0x 2.9x 2.6x 13.6x 13.8x 11.7x 3.1% 3.5% 6.7% 61.4% 15.0% 16.1% 1.8% 1.7% Mean 8.1x 6.9x 5.9x 19.2x 18.5x 16.7x 17.4% 13.9% 15.8% 75.3% 35.2% 36.7% 5.0% 10.1% Median 6.9x 6.1x 5.2x 18.5x 15.7x 12.5x 17.3% 14.2% 17.8% 79.9% 31.2% 33.2% 4.8% 8.5% Max 19.3x 15.5x 12.4x 24.7x 29.6x 27.1x 28.8% 24.2% 24.6% 83.5% 54.4% 55.7% 10.8% 20.3% (2) Reference Valuation Metric Selected Range Implied EV Implied Equity Value Implied Share Price 2025 Revenue (LRP) $487 4.0x - 7.0x $1,946 - $3,406 $2,260 - $3,719 $10.17 - $16.54 2026 Revenue (LRP) 567 4.0x - 6.0x 2,267 - 3,400 2,580 - 3,714 $11.57 - $16.52 2025 EBITDA (LRP) 104 14.0x - 19.0x 1,461 - 1,983 1,774 - 2,296 $8.01 - $10.32 2026 EBITDA (LRP) 161 12.5x - 17.5x 2,008 - 2,812 2,322 - 3,125 $10.44 - $13.95 (2) (2) (2) (2) (2) (2) (2) (2) (2) (2) (2) (1) 8
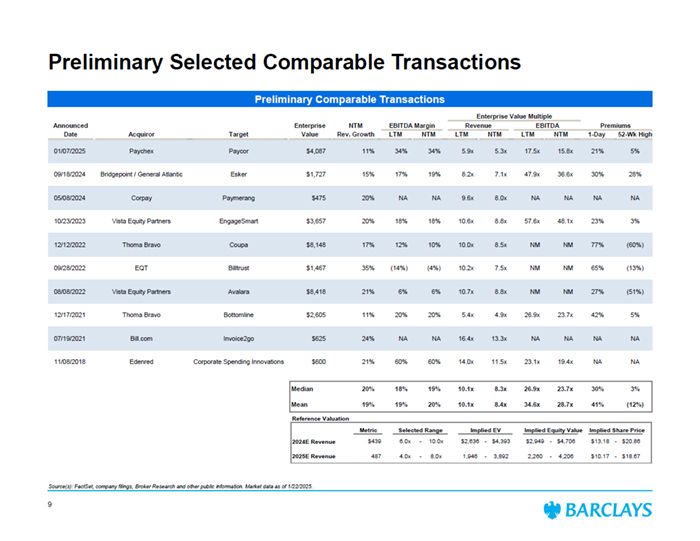
Preliminary Selected Comparable Transactions Preliminary Comparable Transactions Source(s): FactSet, company filings, Broker Research and other public information. Market data as of 1/22/2025. Enterprise Value Multiple Announced Enterprise NTM EBITDA Margin Revenue EBITDA Premiums Date Acquiror Target Value Rev. Growth LTM NTM LTM NTM LTM NTM 1-Day 52-Wk High 01/07/2025 Paychex Paycor $4,087 11% 34% 34% 5.9x 5.3x 17.5x 15.8x 21% 5% 09/18/2024 Bridgepoint / General Atlantic Esker $1,727 15% 17% 19% 8.2x 7.1x 47.9x 36.6x 30% 28% 05/08/2024 Corpay Paymerang $475 20% NA NA 9.6x 8.0x NA NA NA NA 10/23/2023 Vista Equity Partners EngageSmart $3,657 20% 18% 18% 10.6x 8.8x 57.6x 48.1x 23% 3% 12/12/2022 Thoma Bravo Coupa $8,148 17% 12% 10% 10.0x 8.5x NM NM 77% (60%) 09/28/2022 EQT Billtrust $1,467 35% (14%) (4%) 10.2x 7.5x NM NM 65% (13%) 08/08/2022 Vista Equity Partners Avalara $8,418 21% 6% 6% 10.7x 8.8x NM NM 27% (51%) 12/17/2021 Thoma Bravo Bottomline $2,605 11% 20% 20% 5.4x 4.9x 26.9x 23.7x 42% 5% 07/19/2021 Bill.com Invoice2go $625 24% NA NA 16.4x 13.3x NA NA NA NA 11/08/2018 Edenred Corporate Spending Innovations $600 21% 60% 60% 14.0x 11.5x 23.1x 19.4x NA NA Median 20% 18% 19% 10.1x 8.3x 26.9x 23.7x 30% 3% Mean 19% 19% 20% 10.1x 8.4x 34.6x 28.7x 41% (12%) Reference Valuation Metric Selected Range Implied EV Implied Equity Value Implied Share Price 2024E Revenue $439 6.0x - 10.0x $2,636 - $4,393 $2,949 - $4,706 $13.18 - $20.86 2025E Revenue 487 4.0x - 8.0x 1,946 - 3,892 2,260 - 4,206 $10.17 - $18.67 9
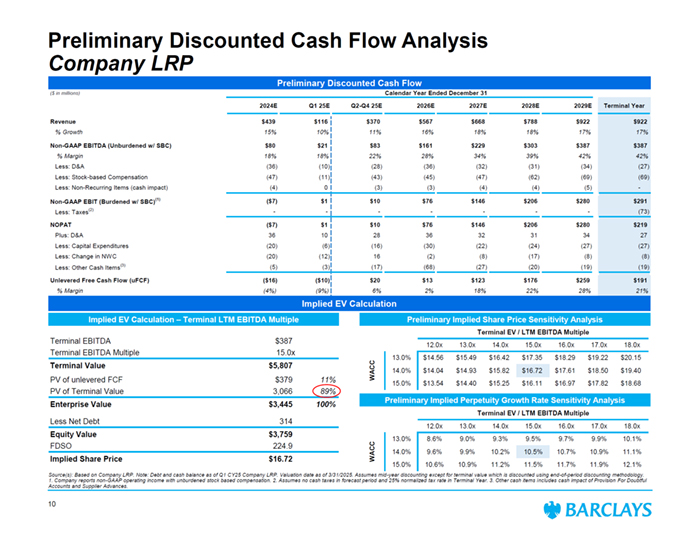
Preliminary Discounted Cash Flow Analysis Company LRP ($ in millions) Calendar Year Ended December 31 2024E Q1 25E Q2-Q4 25E 2026E 2027E 2028E 2029E Terminal Year Revenue $439 $116 $370 $567 $668 $788 $922 $922 % Growth 15% 10% 11% 16% 18% 18% 17% 17% Non-GAAP EBITDA (Unburdened w/ SBC) $80 $21 $83 $161 $229 $303 $387 $387 % Margin 18% 18% 22% 28% 34% 39% 42% 42% Less: D&A (36) (10) (28) (36) (32) (31) (34) (27) Less: Stock-based Compensation (47) (11) (43) (45) (47) (62) (69) (69) Less: Non-Recurring Items (cash impact) (4) 0 (3) (3) (4) (4) (5) - Non-GAAP EBIT (Burdened w/ SBC)(1) ($7) $1 $10 $76 $146 $206 $280 $291 Less: Taxes(2) - - - - - - - (73) NOPAT ($7) $1 $10 $76 $146 $206 $280 $219 Plus: D&A 36 10 28 36 32 31 34 27 Less: Capital Expenditures (20) (6) (16) (30) (22) (24) (27) (27) Less: Change in NWC (20) (12) 16 (2) (8) (17) (8) (8) Less: Other Cash Items(3) (5) (3) (17) (68) (27) (20) (19) (19) Unlevered Free Cash Flow (uFCF) ($16) ($10) $20 $13 $123 $176 $259 $191 % Margin (4%) (9%) 6% 2% 18% 22% 28% 21% Implied EV Calculation Implied EV Calculation – Terminal LTM EBITDA Multiple Preliminary Implied Share Price Sensitivity Analysis Source(s): Based on Company LRP. Note: Debt and cash balance as of Q1 CY25 Company LRP. Valuation date as of 3/31/2025. Assumes mid-year discounting except for terminal value which is discounted using end-of-period discounting methodology. 1. Company reports non-GAAP operating income with unburdened stock based compensation. 2. Assumes no cash taxes in forecast period and 25% normalized tax rate in Terminal Year. 3. Other cash items includes cash impact of Provision For Doubtful Accounts and Supplier Advances. Terminal EBITDA $387 Terminal EBITDA Multiple 15.0x Terminal Value $5,807 PV of unlevered FCF $379 11% PV of Terminal Value 3,066 89% Enterprise Value $3,445 100% Less Net Debt 314 Equity Value $3,759 FDSO 224.9 Implied Share Price $16.72 Terminal EV / LTM EBITDA Multiple 1671.6% 12.0x 13.0x 14.0x 15.0x 16.0x 17.0x 18.0x 13.0% $14.56 $15.49 $16.42 $17.35 $18.29 $19.22 $20.15 14.0% $14.04 $14.93 $15.82 $16.72 $17.61 $18.50 $19.40 15.0% $13.54 $14.40 $15.25 $16.11 $16.97 $17.82 $18.68 WACC Preliminary Implied Perpetuity Growth Rate Sensitivity Analysis Terminal EV / LTM EBITDA Multiple 10.5% 12.0x 13.0x 14.0x 15.0x 16.0x 17.0x 18.0x 13.0% 8.6% 9.0% 9.3% 9.5% 9.7% 9.9% 10.1% 14.0% 9.6% 9.9% 10.2% 10.5% 10.7% 10.9% 11.1% 15.0% 10.6% 10.9% 11.2% 11.5% 11.7% 11.9% 12.1% WACC 10 Preliminary Discounted Cash Flow
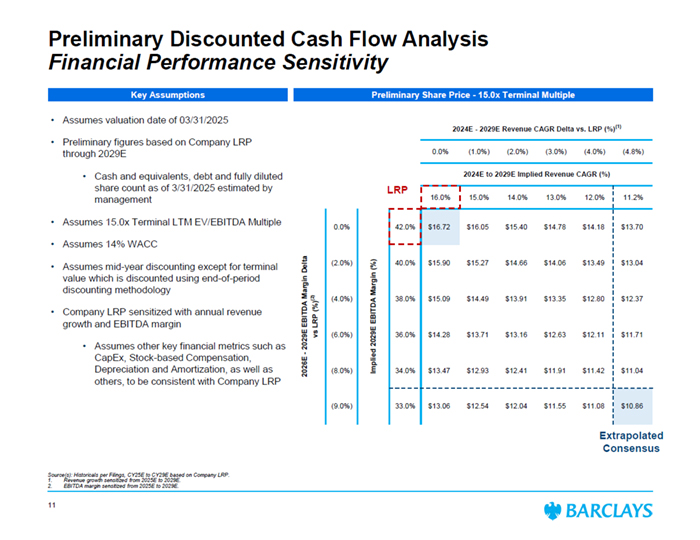
2024E - 2029E Revenue CAGR Delta vs. LRP (%)(1) 0.0% (1.0%) (2.0%) (3.0%) (4.0%) (4.8%) 2024E to 2029E Implied Revenue CAGR (%) 16.0% 15.0% 14.0% 13.0% 12.0% 11.2% 0.0% 42.0% $16.72 $16.05 $15.40 $14.78 $14.18 $13.70 (2.0%) 40.0% $15.90 $15.27 $14.66 $14.06 $13.49 $13.04 (4.0%) 38.0% $15.09 $14.49 $13.91 $13.35 $12.80 $12.37 (6.0%) 36.0% $14.28 $13.71 $13.16 $12.63 $12.11 $11.71 (8.0%) 34.0% $13.47 $12.93 $12.41 $11.91 $11.42 $11.04 (9.0%) 33.0% $13.06 $12.54 $12.04 $11.55 $11.08 $10.86 2026E - 2029E EBITDA Margin Delta vs LRP (%)(2) Implied 2029E EBITDA Margin (%) Key Assumptions • Assumes valuation date of 03/31/2025 • Preliminary figures based on Company LRP through 2029E • Cash and equivalents, debt and fully diluted share count as of 3/31/2025 estimated by management • Assumes 15.0x Terminal LTM EV/EBITDA Multiple • Assumes 14% WACC • Assumes mid-year discounting except for terminal value which is discounted using end-of-period discounting methodology • Company LRP sensitized with annual revenue growth and EBITDA margin • Assumes other key financial metrics such as CapEx, Stock-based Compensation, Depreciation and Amortization, as well as others, to be consistent with Company LRP Preliminary Discounted Cash Flow Analysis Financial Performance Sensitivity Source(s): Historicals per Filings, CY25E to CY29E based on Company LRP. 1. Revenue growth sensitized from 2025E to 2029E. 2. EBITDA margin sensitized from 2025E to 2029E. Preliminary Share Price - 15.0x Terminal Multiple LRP Extrapolated Consensus 11
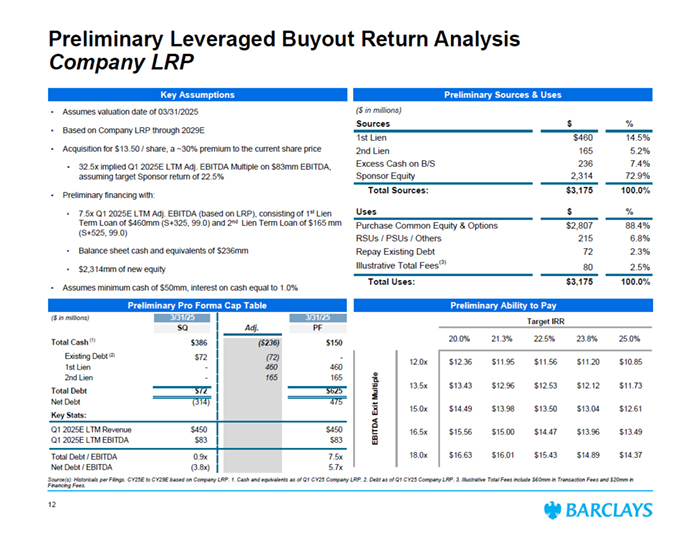
Preliminary Pro Forma Cap Table Preliminary Ability to Pay Key Assumptions ($ in millions) Sources $ % 1st Lien $460 14.5% 2nd Lien 165 5.2% Excess Cash on B/S 236 7.4% Sponsor Equity 2,314 72.9% Total Sources: $3,175 100.0% Uses $ % Purchase Common Equity & Options $2,807 88.4% RSUs / PSUs / Others 215 6.8% Repay Existing Debt 72 2.3% Illustrative Total Fees(3) 80 2.5% Total Uses: $3,175 100.0% ($ in millions) 3/31/25 3/31/25 SQ Adj. PF Total Cash(1) $386 ($236) $150 Existing Debt(2) $72 (72) - 1st Lien - 460 460 2nd Lien - 165 165 Total Debt $72 $625 Net Debt (314) 475 Key Stats: Q1 2025E LTM Revenue $450 $450 Q1 2025E LTM EBITDA $83 $83 Total Debt / EBITDA 0.9x 7.5x Net Debt / EBITDA (3.8x) 5.7x Preliminary Leveraged Buyout Return Analysis Company LRP Source(s): Historicals per Filings. CY25E to CY29E based on Company LRP. 1. Cash and equivalents as of Q1 CY25 Company LRP. 2. Debt as of Q1 CY25 Company LRP. 3. Illustrative Total Fees include $60mm in Transaction Fees and $20mm in Financing Fees. Target IRR $13.5 20.0% 21.3% 22.5% 23.8% 25.0% 12.0x $12.36 $11.95 $11.56 $11.20 $10.85 13.5x $13.43 $12.96 $12.53 $12.12 $11.73 15.0x $14.49 $13.98 $13.50 $13.04 $12.61 16.5x $15.56 $15.00 $14.47 $13.96 $13.49 18.0x $16.63 $16.01 $15.43 $14.89 $14.37 EBITDA Exit Multiple Preliminary Sources & Uses • Assumes valuation date of 03/31/2025 • Based on Company LRP through 2029E • Acquisition for $13.50 / share, a ~30% premium to the current share price • 32.5x implied Q1 2025E LTM Adj. EBITDA Multiple on $83mm EBITDA, assuming target Sponsor return of 22.5% • Preliminary financing with: • 7.5x Q1 2025E LTM Adj. EBITDA (based on LRP), consisting of 1st Lien Term Loan of $460mm (S+325, 99.0) and 2nd Lien Term Loan of $165 mm (S+525, 99.0) • Balance sheet cash and equivalents of $236mm • $2,314mm of new equity • Assumes minimum cash of $50mm, interest on cash equal to 1.0% (1) (2) 12
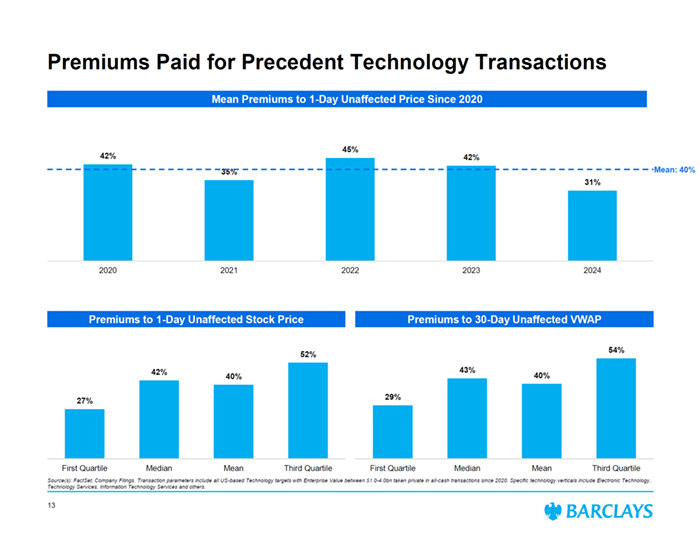
29% 43% 40% 54% First Quartile Median Mean Third Quartile 27% 42% 40% 52% First Quartile Median Mean Third Quartile Premiums Paid for Precedent Technology Transactions Source(s): FactSet, Company Filings. Transaction parameters include all US-based Technology targets with Enterprise Value between $1.0-4.0bn taken private in all-cash transactions since 2020. Specific technology verticals include Electronic Technology, Technology Services, Information Technology Services and others. Premiums Premiums to 1-Day Unaffected Stock Price to 30-Day Unaffected VWAP 42% 35% 45% 42% 31% 2020 2021 2022 2023 2024 Mean Premiums to 1-Day Unaffected Price Since 2020 Mean: 40% 13
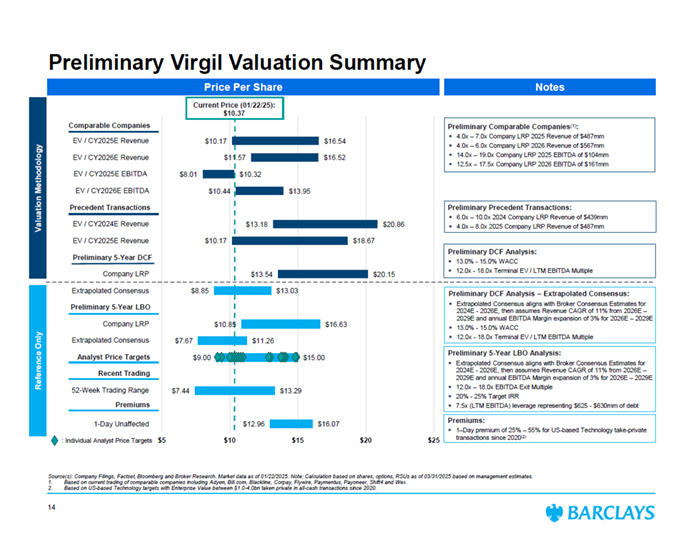
$10.17 $11.57 $8.01 $10.44 $13.18 $10.17 $13.54 $8.85 $10.85 $7.67 $9.00 $7.44 $12.96 $16.54 $16.52 $10.32 $13.95 $20.86 $18.67 $20.15 $13.03 $16.63 $11.26 $15.00 $13.29 $16.07 $5 $10 $15 $20 $25 Comparable Companies EV / CY2025E Revenue EV / CY2026E Revenue EV / CY2025E EBITDA EV / CY2026E EBITDA Precedent Transactions EV / CY2024E Revenue EV / CY2025E Revenue DCF (Terminal Multiple) Company LRP Extrapolated Consensus Company LRP Extrapolated Consensus Analyst Price Recent 52-Week Trading Range Premiums 1-Day Unaffected Current Price (01/22/25): $10.37 Price Per Share Notes Preliminary Comparable Companies(1): „H 4.0x ¡V 7.0x Company LRP 2025 Revenue of $487mm „H 4.0x ¡V 6.0x Company LRP 2026 Revenue of $567mm „H 14.0x ¡V 19.0x Company LRP 2025 EBITDA of $104mm „H 12.5x ¡V 17.5x Company LRP 2026 EBITDA of $161mm Premiums: „H 1¡VDay premium of 25% ¡V 55% for US-based Technology take-private transactions since 2020(2) Preliminary Precedent Transactions: „H 6.0x ¡V 10.0x 2024 Company LRP Revenue of $439mm „H 4.0x ¡V 8.0x 2025 Company LRP Revenue of $487mm Reference Only Valuation Methodology Preliminary Virgil Valuation Summary Preliminary DCF Analysis: „H 13.0% - 15.0% WACC „H 12.0x - 18.0x Terminal EV / LTM EBITDA Multiple Premiums Recent Trading Precedent Transactions Comparable Companies Source(s): Company Filings, Factset, Bloomberg and Broker Research. Market data as of 01/22/2025. Note: Calculation based on shares, options, RSUs as of 03/31/2025 based on management estimates. 1. Based on current trading of comparable companies including Adyen, Bill.com, Blackline, Corpay, Flywire, Paymentus, Payoneer, Shift4 and Wex. 2. Based on US-based Technology targets with Enterprise Value between $1.0-4.0bn taken private in all-cash transactions since 2020. Analyst Price Targets Preliminary 5-Year LBO Analysis: „H Extrapolated Consensus aligns with Broker Consensus Estimates for 2024E - 2026E, then assumes Revenue CAGR of 11% from 2026E ¡V 2029E and annual EBITDA Margin expansion of 3% for 2026E ¡V 2029E „H 12.0x ¡V 18.0x EBITDA Exit Multiple „H 20% - 25% Target IRR „H 7.5x (LTM EBITDA) leverage representing $625 - $630mm of debt Preliminary 5-Year DCF Preliminary 5-Year LBO : Individual Analyst Price Targets Preliminary DCF Analysis ¡V Extrapolated Consensus: „H Extrapolated Consensus aligns with Broker Consensus Estimates for 2024E - 2026E, then assumes Revenue CAGR of 11% from 2026E ¡V 2029E and annual EBITDA Margin expansion of 3% for 2026E ¡V 2029E „H 13.0% - 15.0% WACC „H 12.0x - 18.0x Terminal EV / LTM EBITDA Multiple 14

Appendix
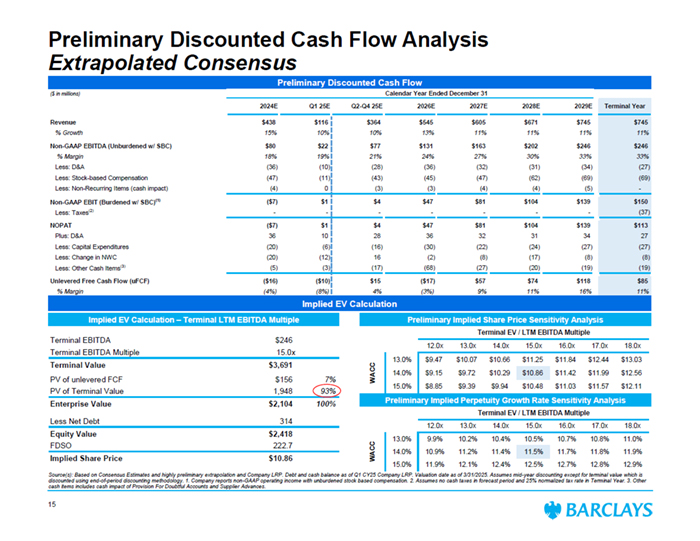
Preliminary Discounted Cash Flow Preliminary Discounted Cash Flow Analysis Extrapolated Consensus ($ in millions) Calendar Year Ended December 31 2024E Q1 25E Q2-Q4 25E 2026E 2027E 2028E 2029E Terminal Year Revenue $438 $116 $364 $545 $605 $671 $745 $745 % Growth 15% 10% 10% 13% 11% 11% 11% 11% Non-GAAP EBITDA (Unburdened w/ SBC) $80 $22 $77 $131 $163 $202 $246 $246 % Margin 18% 19% 21% 24% 27% 30% 33% 33% Less: D&A (36) (10) (28) (36) (32) (31) (34) (27) Less: Stock-based Compensation (47) (11) (43) (45) (47) (62) (69) (69) Less: Non-Recurring Items (cash impact) (4) 0 (3) (3) (4) (4) (5) - Non-GAAP EBIT (Burdened w/ SBC)(1) ($7) $1 $4 $47 $81 $104 $139 $150 Less: Taxes(2) - - - - - - - (37) NOPAT ($7) $1 $4 $47 $81 $104 $139 $113 Plus: D&A 36 10 28 36 32 31 34 27 Less: Capital Expenditures (20) (6) (16) (30) (22) (24) (27) (27) Less: Change in NWC (20) (12) 16 (2) (8) (17) (8) (8) Less: Other Cash Items(3) (5) (3) (17) (68) (27) (20) (19) (19) Unlevered Free Cash Flow (uFCF) ($16) ($10) $15 ($17) $57 $74 $118 $85 % Margin (4%) (8%) 4% (3%) 9% 11% 16% 11% Implied EV Calculation – Terminal LTM EBITDA Multiple Source(s): Based on Consensus Estimates and highly preliminary extrapolation and Company LRP. Debt and cash balance as of Q1 CY25 Company LRP. Valuation date as of 3/31/2025. Assumes mid-year discounting except for terminal value which is discounted using end-of-period discounting methodology. 1. Company reports non-GAAP operating income with unburdened stock based compensation. 2. Assumes no cash taxes in forecast period and 25% normalized tax rate in Terminal Year. 3. Other cash items includes cash impact of Provision For Doubtful Accounts and Supplier Advances. Terminal EBITDA $246 Terminal EBITDA Multiple 15.0x Terminal Value $3,691 PV of unlevered FCF $156 7% PV of Terminal Value 1,948 93% Enterprise Value $2,104 100% Less Net Debt 314 Equity Value $2,418 FDSO 222.7 Implied Share Price $10.86 Terminal EV / LTM EBITDA Multiple 1085.7% 12.0x 13.0x 14.0x 15.0x 16.0x 17.0x 18.0x 13.0% $9.47 $10.07 $10.66 $11.25 $11.84 $12.44 $13.03 14.0% $9.15 $9.72 $10.29 $10.86 $11.42 $11.99 $12.56 15.0% $8.85 $9.39 $9.94 $10.48 $11.03 $11.57 $12.11 WACC Implied EV Calculation Preliminary Implied Share Price Sensitivity Analysis Preliminary Implied Perpetuity Growth Rate Sensitivity Analysis Terminal EV / LTM EBITDA Multiple 11.5% 12.0x 13.0x 14.0x 15.0x 16.0x 17.0x 18.0x 13.0% 9.9% 10.2% 10.4% 10.5% 10.7% 10.8% 11.0% 14.0% 10.9% 11.2% 11.4% 11.5% 11.7% 11.8% 11.9% 15.0% 11.9% 12.1% 12.4% 12.5% 12.7% 12.8% 12.9% WACC 15
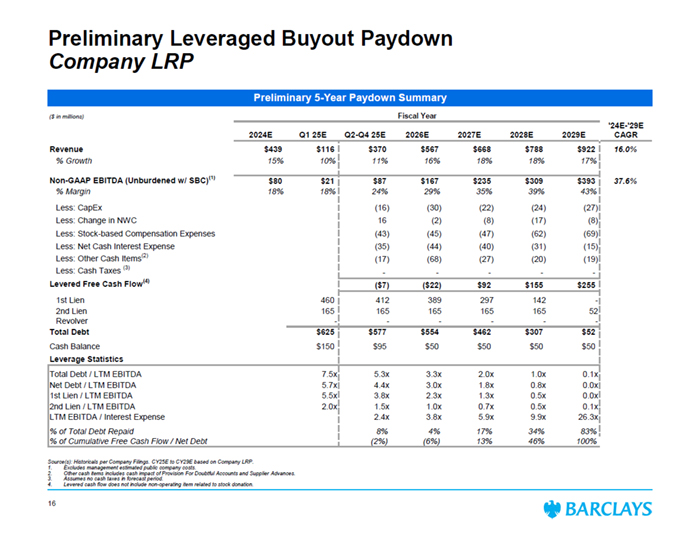
Preliminary 5-Year Paydown Summary ($ in millions) Fiscal Year '24E-'29E 2024E Q1 25E Q2-Q4 25E 2026E 2027E 2028E 2029E CAGR Revenue $439 $116 $370 $567 $668 $788 $922 16.0% % Growth 15% 10% 11% 16% 18% 18% 17% Non-GAAP EBITDA (Unburdened w/ SBC)(1) $80 $21 $87 $167 $235 $309 $393 37.6% % Margin 18% 18% 24% 29% 35% 39% 43% Less: CapEx (16) (30) (22) (24) (27) Less: Change in NWC 16 (2) (8) (17) (8) Less: Stock-based Compensation Expenses (43) (45) (47) (62) (69) Less: Net Cash Interest Expense (35) (44) (40) (31) (15) Less: Other Cash Items(2) (17) (68) (27) (20) (19) Less: Cash Taxes (3) - - - - - Levered Free Cash Flow(4) ($7) ($22) $92 $155 $255 1st Lien 460 412 389 297 142 - 2nd Lien 165 165 165 165 165 52 Revolver - - - - - - Total Debt $625 $577 $554 $462 $307 $52 Cash Balance $150 $95 $50 $50 $50 $50 Leverage Statistics Total Debt / LTM EBITDA 7.5x 5.3x 3.3x 2.0x 1.0x 0.1x Net Debt / LTM EBITDA 5.7x 4.4x 3.0x 1.8x 0.8x 0.0x 1st Lien / LTM EBITDA 5.5x 3.8x 2.3x 1.3x 0.5x 0.0x 2nd Lien / LTM EBITDA 2.0x 1.5x 1.0x 0.7x 0.5x 0.1x LTM EBITDA / Interest Expense 2.4x 3.8x 5.9x 9.9x 26.3x % of Total Debt Repaid 8% 4% 17% 34% 83% % of Cumulative Free Cash Flow / Net Debt (2%) (6%) 13% 46% 100% Source(s): Historicals per Company Filings. CY25E to CY29E based on Company LRP. 1. Excludes management estimated public company costs. 2. Other cash items includes cash impact of Provision For Doubtful Accounts and Supplier Advances. 3. Assumes no cash taxes in forecast period. 4. Levered cash flow does not include non-operating item related to stock donation. 16 Preliminary Leveraged Buyout Paydown Company LRP
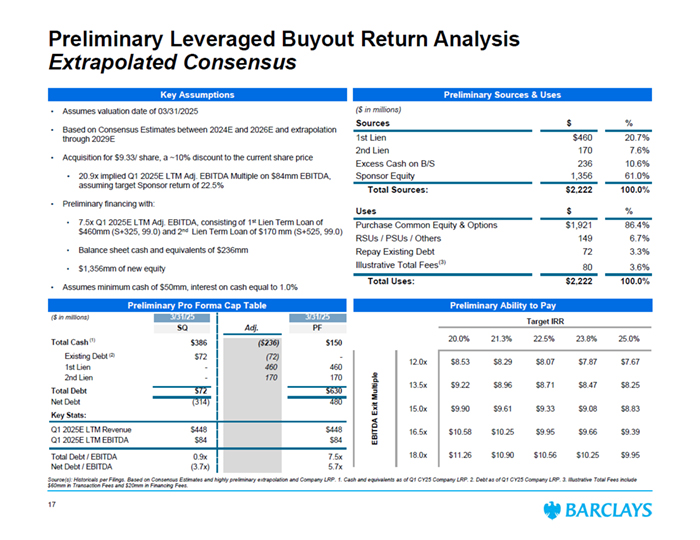
Preliminary Pro Forma Cap Table Preliminary Ability to Pay Key Assumptions • Assumes valuation date of 03/31/2025 • Based on Consensus Estimates between 2024E and 2026E and extrapolation through 2029E • Acquisition for $9.33/ share, a ~10% discount to the current share price • 20.9x implied Q1 2025E LTM Adj. EBITDA Multiple on $84mm EBITDA, assuming target Sponsor return of 22.5% • Preliminary financing with: • 7.5x Q1 2025E LTM Adj. EBITDA, consisting of 1st Lien Term Loan of $460mm (S+325, 99.0) and 2nd Lien Term Loan of $170 mm (S+525, 99.0) • Balance sheet cash and equivalents of $236mm • $1,356mm of new equity • Assumes minimum cash of $50mm, interest on cash equal to 1.0% ($ in millions) Sources $ % 1st Lien $460 20.7% 2nd Lien 170 7.6% Excess Cash on B/S 236 10.6% Sponsor Equity 1,356 61.0% Total Sources: $2,222 100.0% Uses $ % Purchase Common Equity & Options $1,921 86.4% RSUs / PSUs / Others 149 6.7% Repay Existing Debt 72 3.3% Illustrative Total Fees(3) 80 3.6% Total Uses: $2,222 100.0% ($ in millions) 3/31/25 3/31/25 SQ Adj. PF Total Cash(1) $386 ($236) $150 Existing Debt(2) $72 (72) - 1st Lien - 460 460 2nd Lien - 170 170 Total Debt $72 $630 Net Debt (314) 480 Key Stats: Q1 2025E LTM Revenue $448 $448 Q1 2025E LTM EBITDA $84 $84 Total Debt / EBITDA 0.9x 7.5x Net Debt / EBITDA (3.7x) 5.7x Source(s): Historicals per Filings. Based on Consensus Estimates and highly preliminary extrapolation and Company LRP. 1. Cash and equivalents as of Q1 CY25 Company LRP. 2. Debt as of Q1 CY25 Company LRP. 3. Illustrative Total Fees include $60mm in Transaction Fees and $20mm in Financing Fees. Target IRR $9.3 20.0% 21.3% 22.5% 23.8% 25.0% 12.0x $8.53 $8.29 $8.07 $7.87 $7.67 13.5x $9.22 $8.96 $8.71 $8.47 $8.25 15.0x $9.90 $9.61 $9.33 $9.08 $8.83 16.5x $10.58 $10.25 $9.95 $9.66 $9.39 18.0x $11.26 $10.90 $10.56 $10.25 $9.95 EBITDA Exit Multiple Preliminary Sources & Uses Preliminary Leveraged Buyout Return Analysis Extrapolated Consensus 17 (1) (2)
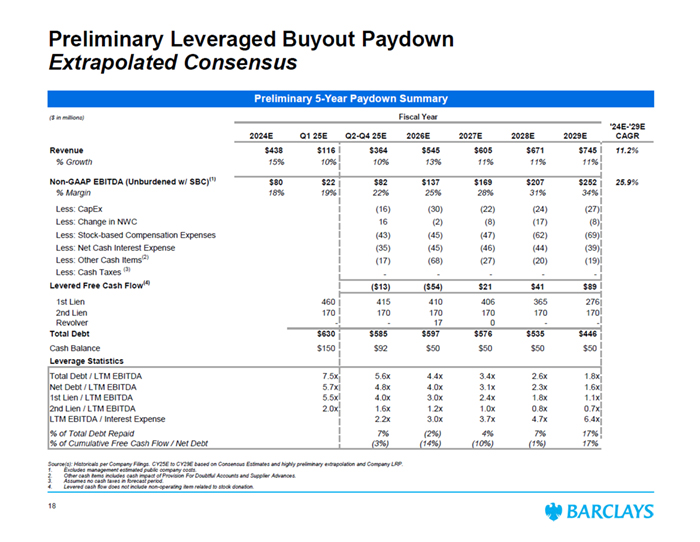
Preliminary 5-Year Paydown Summary ($ in millions) Fiscal Year '24E-'29E 2024E Q1 25E Q2-Q4 25E 2026E 2027E 2028E 2029E CAGR Revenue $438 $116 $364 $545 $605 $671 $745 11.2% % Growth 15% 10% 10% 13% 11% 11% 11% Non-GAAP EBITDA (Unburdened w/ SBC)(1) $80 $22 $82 $137 $169 $207 $252 25.9% % Margin 18% 19% 22% 25% 28% 31% 34% Less: CapEx (16) (30) (22) (24) (27) Less: Change in NWC 16 (2) (8) (17) (8) Less: Stock-based Compensation Expenses (43) (45) (47) (62) (69) Less: Net Cash Interest Expense (35) (45) (46) (44) (39) Less: Other Cash Items(2) (17) (68) (27) (20) (19) Less: Cash Taxes (3) - - - - - Levered Free Cash Flow(4) ($13) ($54) $21 $41 $89 1st Lien 460 415 410 406 365 276 2nd Lien 170 170 170 170 170 170 Revolver - - 17 0 - - Total Debt $630 $585 $597 $576 $535 $446 Cash Balance $150 $92 $50 $50 $50 $50 Leverage Statistics Total Debt / LTM EBITDA 7.5x 5.6x 4.4x 3.4x 2.6x 1.8x Net Debt / LTM EBITDA 5.7x 4.8x 4.0x 3.1x 2.3x 1.6x 1st Lien / LTM EBITDA 5.5x 4.0x 3.0x 2.4x 1.8x 1.1x 2nd Lien / LTM EBITDA 2.0x 1.6x 1.2x 1.0x 0.8x 0.7x LTM EBITDA / Interest Expense 2.2x 3.0x 3.7x 4.7x 6.4x % of Total Debt Repaid 7% (2%) 4% 7% 17% % of Cumulative Free Cash Flow / Net Debt (3%) (14%) (10%) (1%) 17% Source(s): Historicals per Company Filings. CY25E to CY29E based on Consensus Estimates and highly preliminary extrapolation and Company LRP. 1. Excludes management estimated public company costs. 2. Other cash items includes cash impact of Provision For Doubtful Accounts and Supplier Advances. 3. Assumes no cash taxes in forecast period. 4. Levered cash flow does not include non-operating item related to stock donation. 18 Preliminary Leveraged Buyout Paydown Extrapolated Consensus
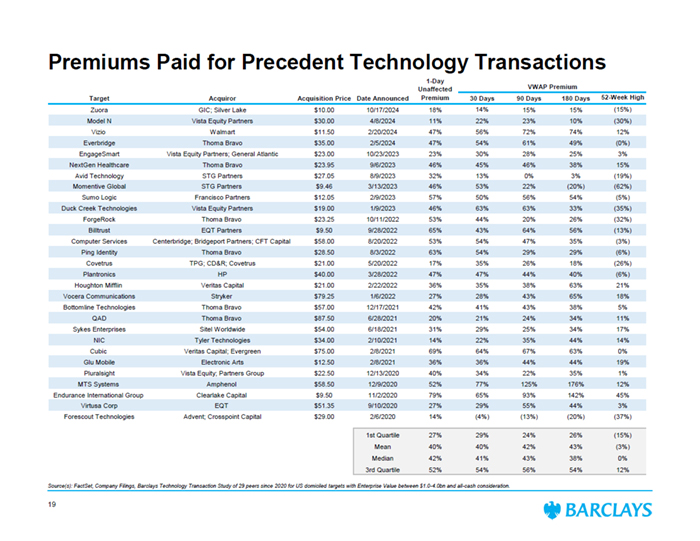
Premiums Paid for Precedent Technology Transactions Source(s): FactSet, Company Filings, Barclays Technology Transaction Study of 29 peers since 2020 for US domiciled targets with Enterprise Value between $1.0-4.0bn and all-cash consideration. VWAP Premium Target Acquiror Acquisition Price Date Announced 30 Days 90 Days 180 Days 52-Week High Zuora GIC; Silver Lake $10.00 10/17/2024 18% 14% 15% 15% (15%) Model N Vista Equity Partners $30.00 4/8/2024 11% 22% 23% 10% (30%) Vizio Walmart $11.50 2/20/2024 47% 56% 72% 74% 12% Everbridge Thoma Bravo $35.00 2/5/2024 47% 54% 61% 49% (0%) EngageSmart Vista Equity Partners; General Atlantic $23.00 10/23/2023 23% 30% 28% 25% 3% NextGen Healthcare Thoma Bravo $23.95 9/6/2023 46% 45% 46% 38% 15% Avid Technology STG Partners $27.05 8/9/2023 32% 13% 0% 3% (19%) Momentive Global STG Partners $9.46 3/13/2023 46% 53% 22% (20%) (62%) Sumo Logic Francisco Partners $12.05 2/9/2023 57% 50% 56% 54% (5%) Duck Creek Technologies Vista Equity Partners $19.00 1/9/2023 46% 63% 63% 33% (35%) ForgeRock Thoma Bravo $23.25 10/11/2022 53% 44% 20% 26% (32%) Billtrust EQT Partners $9.50 9/28/2022 65% 43% 64% 56% (13%) Computer Services Centerbridge; Bridgeport Partners; CFT Capital $58.00 8/20/2022 53% 54% 47% 35% (3%) Ping Identity Thoma Bravo $28.50 8/3/2022 63% 54% 29% 29% (6%) Covetrus TPG; CD&R; Covetrus $21.00 5/20/2022 17% 35% 26% 18% (26%) Plantronics HP $40.00 3/28/2022 47% 47% 44% 40% (6%) Houghton Mifflin Veritas Capital $21.00 2/22/2022 36% 35% 38% 63% 21% Vocera Communications Stryker $79.25 1/6/2022 27% 28% 43% 65% 18% Bottomline Technologies Thoma Bravo $57.00 12/17/2021 42% 41% 43% 38% 5% QAD Thoma Bravo $87.50 6/28/2021 20% 21% 24% 34% 11% Sykes Enterprises Sitel Worldwide $54.00 6/18/2021 31% 29% 25% 34% 17% NIC Tyler Technologies $34.00 2/10/2021 14% 22% 35% 44% 14% Cubic Veritas Capital; Evergreen $75.00 2/8/2021 69% 64% 67% 63% 0% Glu Mobile Electronic Arts $12.50 2/8/2021 36% 36% 44% 44% 19% Pluralsight Vista Equity; Partners Group $22.50 12/13/2020 40% 34% 22% 35% 1% MTS Systems Amphenol $58.50 12/9/2020 52% 77% 125% 176% 12% Endurance International Group Clearlake Capital $9.50 11/2/2020 79% 65% 93% 142% 45% Virtusa Corp EQT $51.35 9/10/2020 27% 29% 55% 44% 3% Forescout Technologies Advent; Crosspoint Capital $29.00 2/6/2020 14% (4%) (13%) (20%) (37%) 1st Quartile 27% 29% 24% 26% (15%) Mean 40% 40% 42% 43% (3%) Median 42% 41% 43% 38% 0% 3rd Quartile 52% 54% 56% 54% 12% 1-Day Unaffected Premium 19
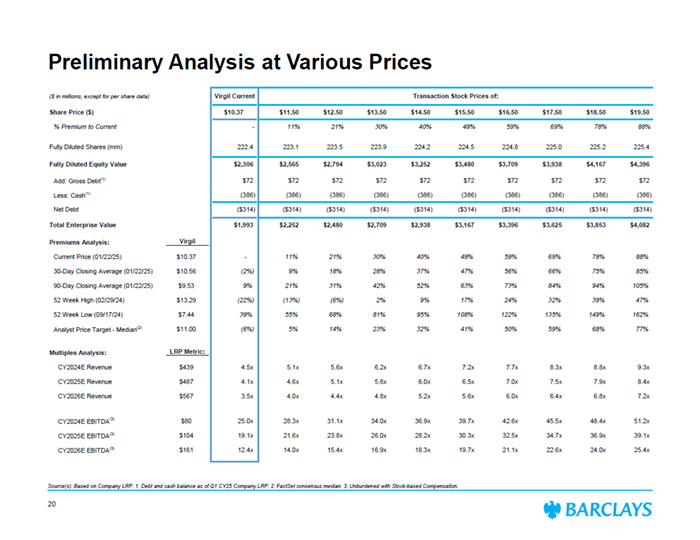
($ in millions, except for per share data) Virgil Current Transaction Stock Prices of: Share Price ($) $10.37 $11.50 $12.50 $13.50 $14.50 $15.50 $16.50 $17.50 $18.50 $19.50 % Premium to Current - 11% 21% 30% 40% 49% 59% 69% 78% 88% Fully Diluted Shares (mm) 222.4 223.1 223.5 223.9 224.2 224.5 224.8 225.0 225.2 225.4 Fully Diluted Equity Value $2,306 $2,565 $2,794 $3,023 $3,252 $3,480 $3,709 $3,938 $4,167 $4,396 Add: Gross Debt(1) $72 $72 $72 $72 $72 $72 $72 $72 $72 $72 Less: Cash(1) (386) (386) (386) (386) (386) (386) (386) (386) (386) (386) Net Debt ($314) ($314) ($314) ($314) ($314) ($314) ($314) ($314) ($314) ($314) Total Enterprise Value $1,993 $2,252 $2,480 $2,709 $2,938 $3,167 $3,396 $3,625 $3,853 $4,082 Premiums Analysis: Virgil Current Price (01/22/25) $10.37 - 11% 21% 30% 40% 49% 59% 69% 78% 88% 30-Day Closing Average (01/22/25) $10.56 (2%) 9% 18% 28% 37% 47% 56% 66% 75% 85% 90-Day Closing Average (01/22/25) $9.53 9% 21% 31% 42% 52% 63% 73% 84% 94% 105% 52 Week High (02/29/24) $13.29 (22%) (13%) (6%) 2% 9% 17% 24% 32% 39% 47% 52 Week Low (09/17/24) $7.44 39% 55% 68% 81% 95% 108% 122% 135% 149% 162% Analyst Price Target - Median(2) $11.00 (6%) 5% 14% 23% 32% 41% 50% 59% 68% 77% Multiples Analysis: LRP Metric: CY2024E Revenue $439 4.5x 5.1x 5.6x 6.2x 6.7x 7.2x 7.7x 8.3x 8.8x 9.3x CY2025E Revenue $487 4.1x 4.6x 5.1x 5.6x 6.0x 6.5x 7.0x 7.5x 7.9x 8.4x CY2026E Revenue $567 3.5x 4.0x 4.4x 4.8x 5.2x 5.6x 6.0x 6.4x 6.8x 7.2x CY2024E EBITDA(3) $80 25.0x 28.3x 31.1x 34.0x 36.9x 39.7x 42.6x 45.5x 48.4x 51.2x CY2025E EBITDA(3) $104 19.1x 21.6x 23.8x 26.0x 28.2x 30.3x 32.5x 34.7x 36.9x 39.1x CY2026E EBITDA(3) $161 12.4x 14.0x 15.4x 16.9x 18.3x 19.7x 21.1x 22.6x 24.0x 25.4x Preliminary Analysis at Various Prices Source(s): Based on Company LRP. 1. Debt and cash balance as of Q1 CY25 Company LRP. 2. FactSet consensus median. 3. Unburdened with Stock-based Compensation. 20
Disclaimer The following pages contain material that was provided to the Board of Directors (the “Board”) of Virgil (the “Company”) by Barclays Capital Inc. (“Barclays”). The accompanying material and any Barclays presentation related to the material was compiled or prepared on a confidential basis solely for consideration by the Board and no part of it may be reproduced, distributed or transmitted without the prior written consent of Barclays. The information contained in this material was obtained from the Company[, the counterparty] and/or publicly available sources, and Barclays has relied upon such information without independent verification thereof and does not assume any liability for any such information. These materials are being provided in connection with an actual corporate engagement and may not be used or relied upon for any purpose other than as specifically contemplated by a written agreement with Barclays. Moreover, any information provided herein was not prepared for or intended for use by any individual for personal, family or household purposes. Any estimates, historical financial information, projections and other information contained herein have been prepared by management of the Company [and/or the counterparty, third party experts] or were obtained from publicly available sources (approved for Barclays’ use by the Company) or are based upon such estimates and projections. With respect to such estimates and projections, Barclays has assumed that they have been reasonably prepared on a basis reflecting the best currently available estimates, projections and judgment of the management of the Company [and/or the counterparty, third party experts]. The projections contained herein may or may not be achieved and differences between projected results and those actually achieved may be material. No representation or warranty, expressed or implied, is made as to the accuracy or completeness of such information and nothing contained herein is, or shall be relied upon as, a promise or representation, whether as to the past or the future. The analysis contained herein is based on current market conditions which are subject to change and Barclays assumes no obligation to update or otherwise revise these materials. Nothing in these materials shall be deemed to constitute a recommendation or investment, legal, tax, financial, accounting or other advice. Because these materials were prepared for use in the context of a presentation to the Board, these materials are incomplete without reference to, and should be assessed solely in conjunction with, the oral briefing provided by Barclays to the Board (in their capacity as directors and not in any individual capacity and is not for the benefit of any individual, including any individual officer, director, shareholder or any other person). These materials were not prepared for or intended for use by any individual for personal, family or household purposes nor were they prepared to comply with the disclosure standards under state and federal securities laws or any other applicable laws and, to the extent the material may be considered by readers not as familiar with the business and affairs of the Company as the Board, none of the Company, Barclays, their respective affiliates or any of their respective legal or financial advisors or accountants takes any responsibility for the accuracy or completeness of any of the material if used by persons other than the Board. These materials are not intended to provide the sole basis for evaluation of the proposed corporate transaction and do not purport to contain all information that may be required and should not be considered a recommendation with respect to the proposed corporate transaction. Barclays has not made or obtained any evaluations or appraisals of the assets or liabilities of the Company or any other party to any corporate transaction or any of their respective affiliates and has no obligation to evaluate the solvency of the Company or any other party to any transaction under any state or federal laws relating to bankruptcy, insolvency or similar matters. The analyses contained herein do not purport to be appraisals nor do they necessarily reflect the prices at which businesses or securities actually may be sold or purchased. Barclays’ role in any due diligence review is limited solely to performing such a review as it shall deem necessary to support its own advice and analysis and shall not be on behalf of the Company, the Board or any individual officer, director, shareholder or any other person. Barclays, its subsidiaries and affiliates engage in a wide range of businesses from investment and commercial banking, lending, asset management and other financial and non-financial services. In the ordinary course of its business, Barclays and its affiliates may actively trade and effect transactions in the equity, debt and/or other securities (and any derivatives thereof) and financial instruments (including loans and other obligations) of the Company [and [the counterparty]] for its own account and for the accounts of its customers and, accordingly, may at any time hold long or short positions and investments in such securities and financial instruments or in other financial products and instruments. Unless otherwise expressly agreed or provided for in other applicable Barclays disclosures governing such corporate transactions or required by law or regulation, Barclays conducts these activities as principal and executes its principal transactions as an arm’s length counterparty. Barclays does not act as a fiduciary in relation to these corporate transactions. These materials do not constitute investment advice nor do they form part of an offer to sell or purchase, or the solicitation of an offer to sell or purchase, any securities or any of the businesses or assets described herein or an offer of financing or an offer or recommendation to enter into any corporate transaction described herein. Barclays Capital Inc. is the United States investment bank of Barclays Bank PLC. Barclays Bank PLC is authorised by the Prudential Regulation Authority and regulated by the Financial Conduct Authority and the Prudential Regulation Authority (Financial Services Register No. 122702). Registered in England. Registered No. 1026167. Registered office: 1 Churchill Place, London E14 5HP. Neither Barclays Bank PLC, New York Branch nor Barclays Bank Delaware is responsible for the obligations of its affiliates. Copyright Barclays Bank PLC, 2025 (all rights reserved). 21