
Exhibit (c)(5)
Project Virgil February 2025

Situation Update
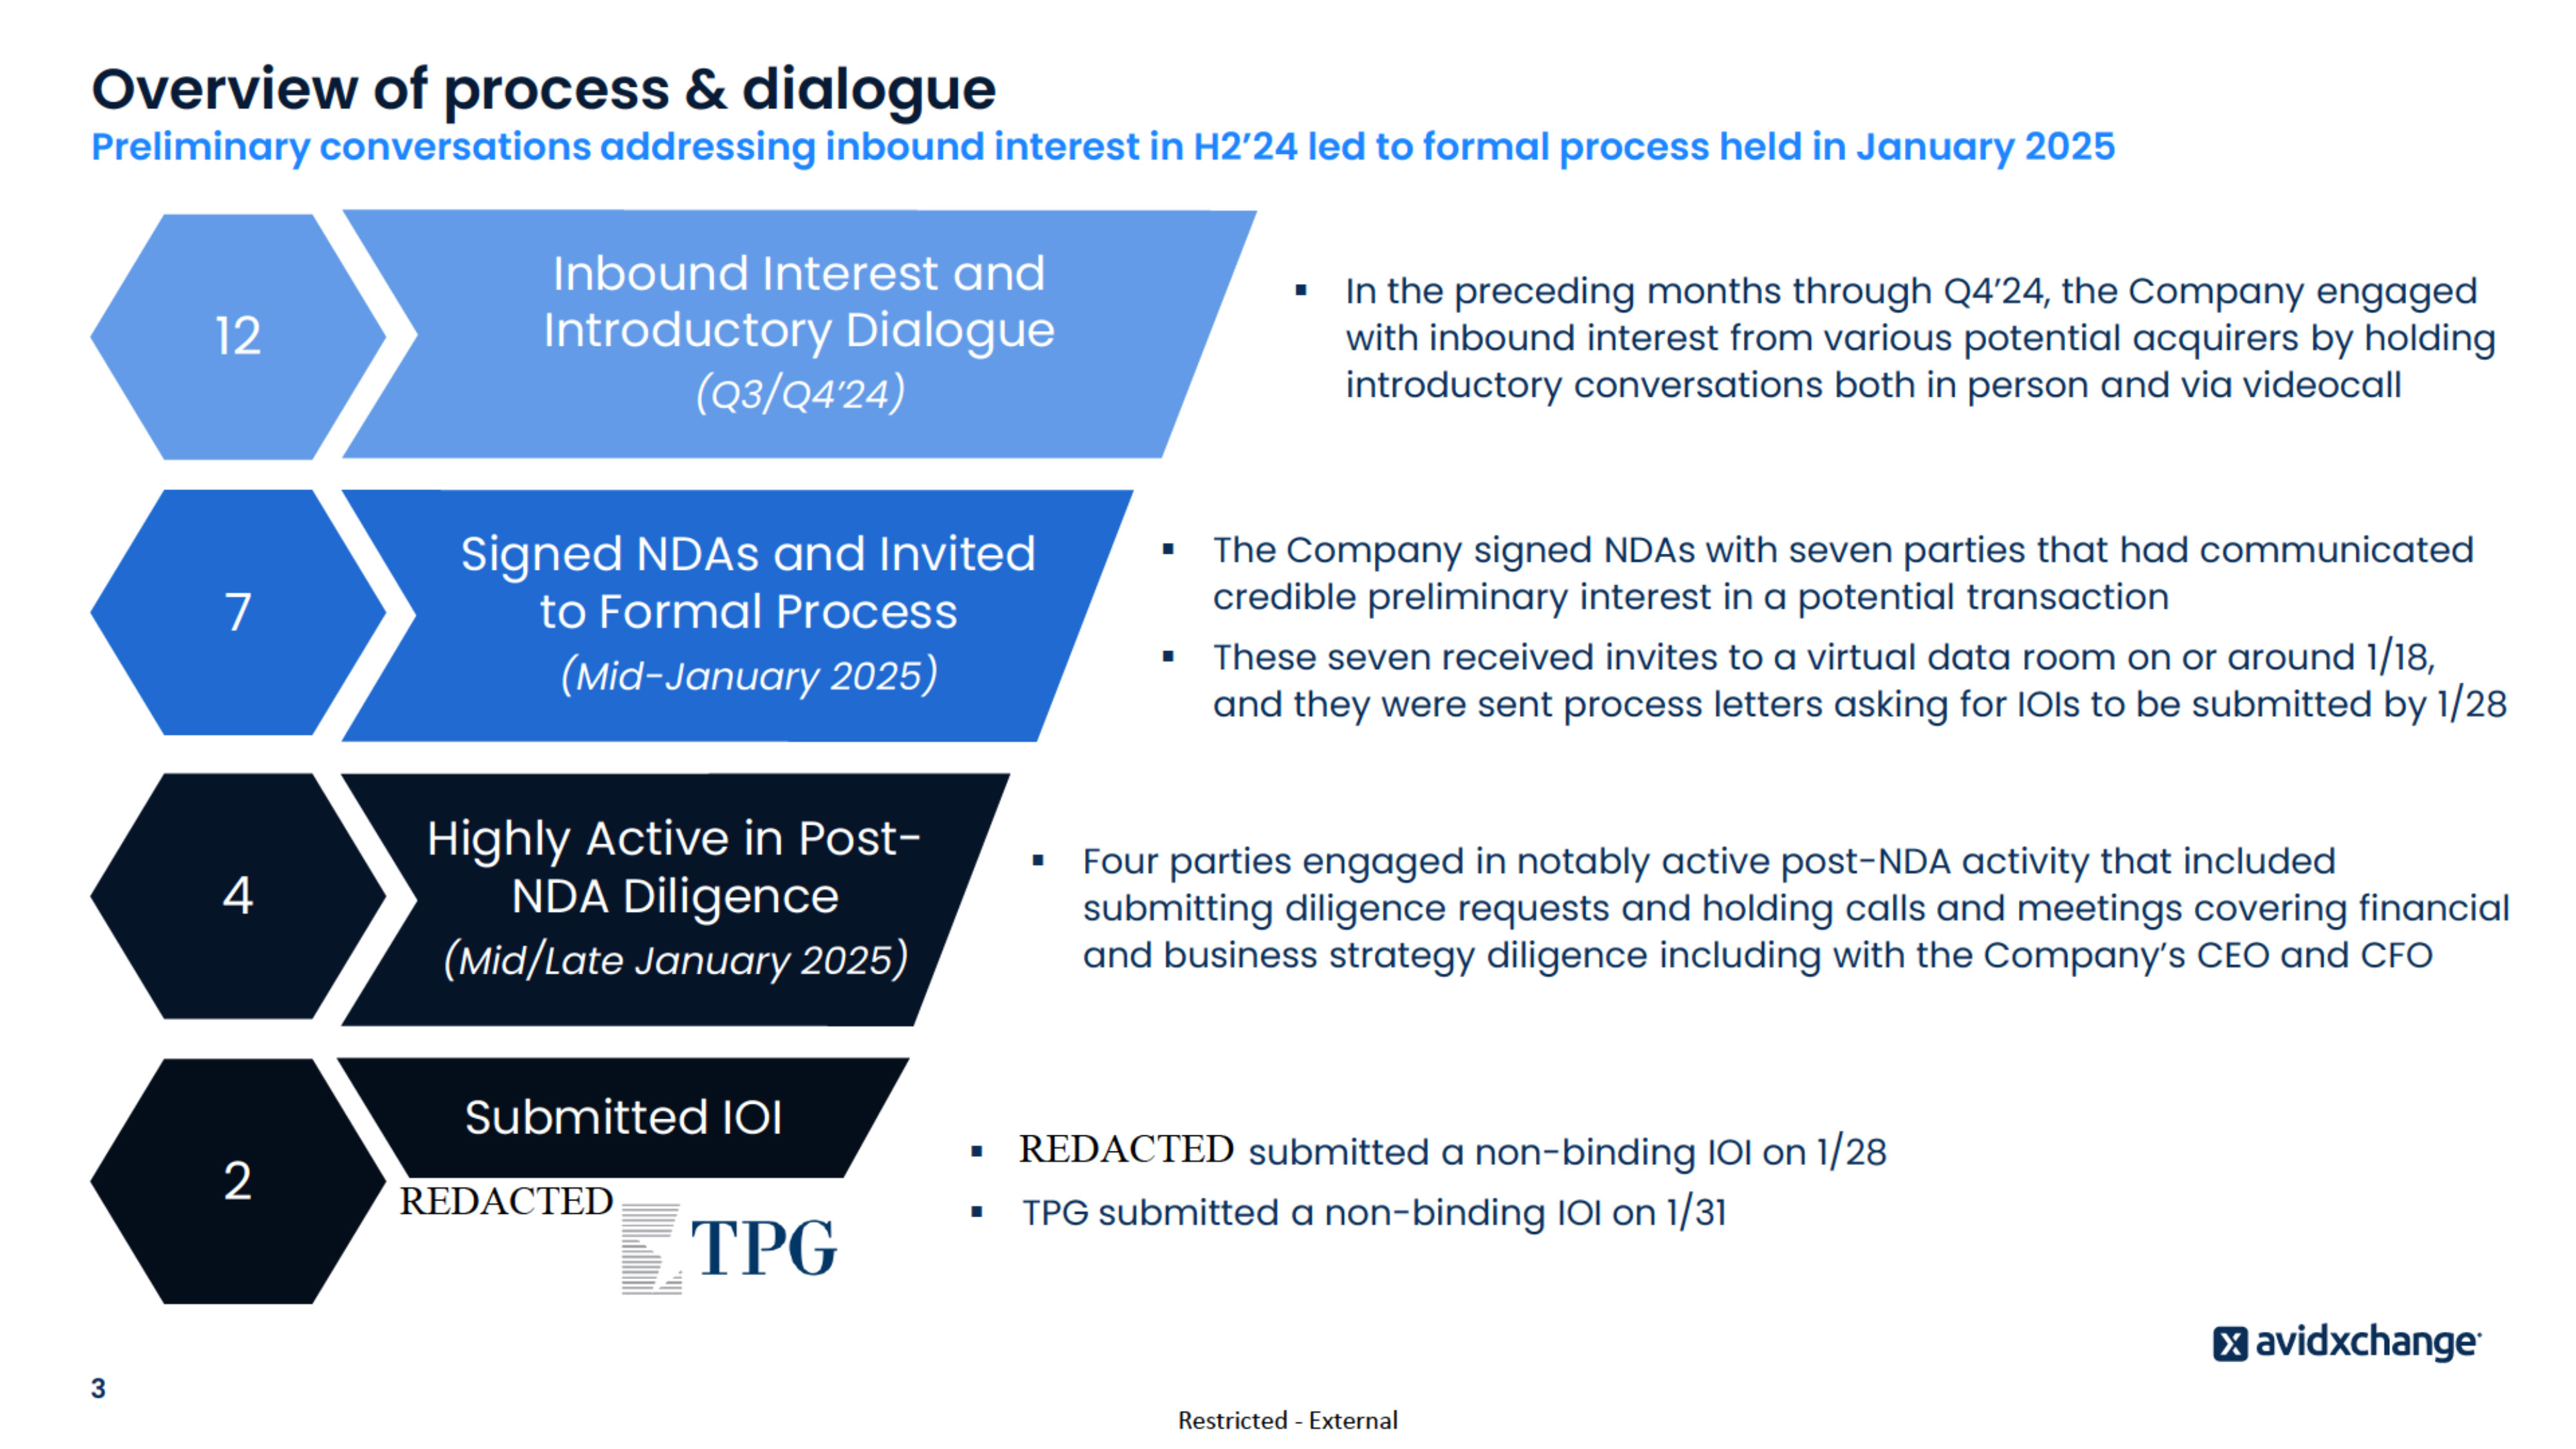
Restricted - External Overview of process & dialogue 3 Preliminary conversations addressing inbound interest in H2f24 led to formal process held in January 2025 12 7 4 2 Inbound Interest and Introductory Dialogue (Q3/Q4f24) Submitted IOI Highly Active in Post- NDA Diligence (Mid/Late January 2025) Signed NDAs and Invited to Formal Process (Mid-January 2025) . In the preceding months through Q4f24, the Company engaged with inbound interest from various potential acquirers by holding introductory conversations both in person and via videocall . The Company signed NDAs with seven parties that had communicated credible preliminary interest in a potential transaction . These seven received invites to a virtual data room on or around 1/18, and they were sent process letters asking for IOIs to be submitted by 1/28 . Four parties engaged in notably active post-NDA activity that included submitting diligence requests and holding calls and meetings covering financial and business strategy diligence including with the Companyfs CEO and CFO . Bain Capital submitted a non-binding IOI on 1/28 . TPG submitted a non-binding IOI on 1/31
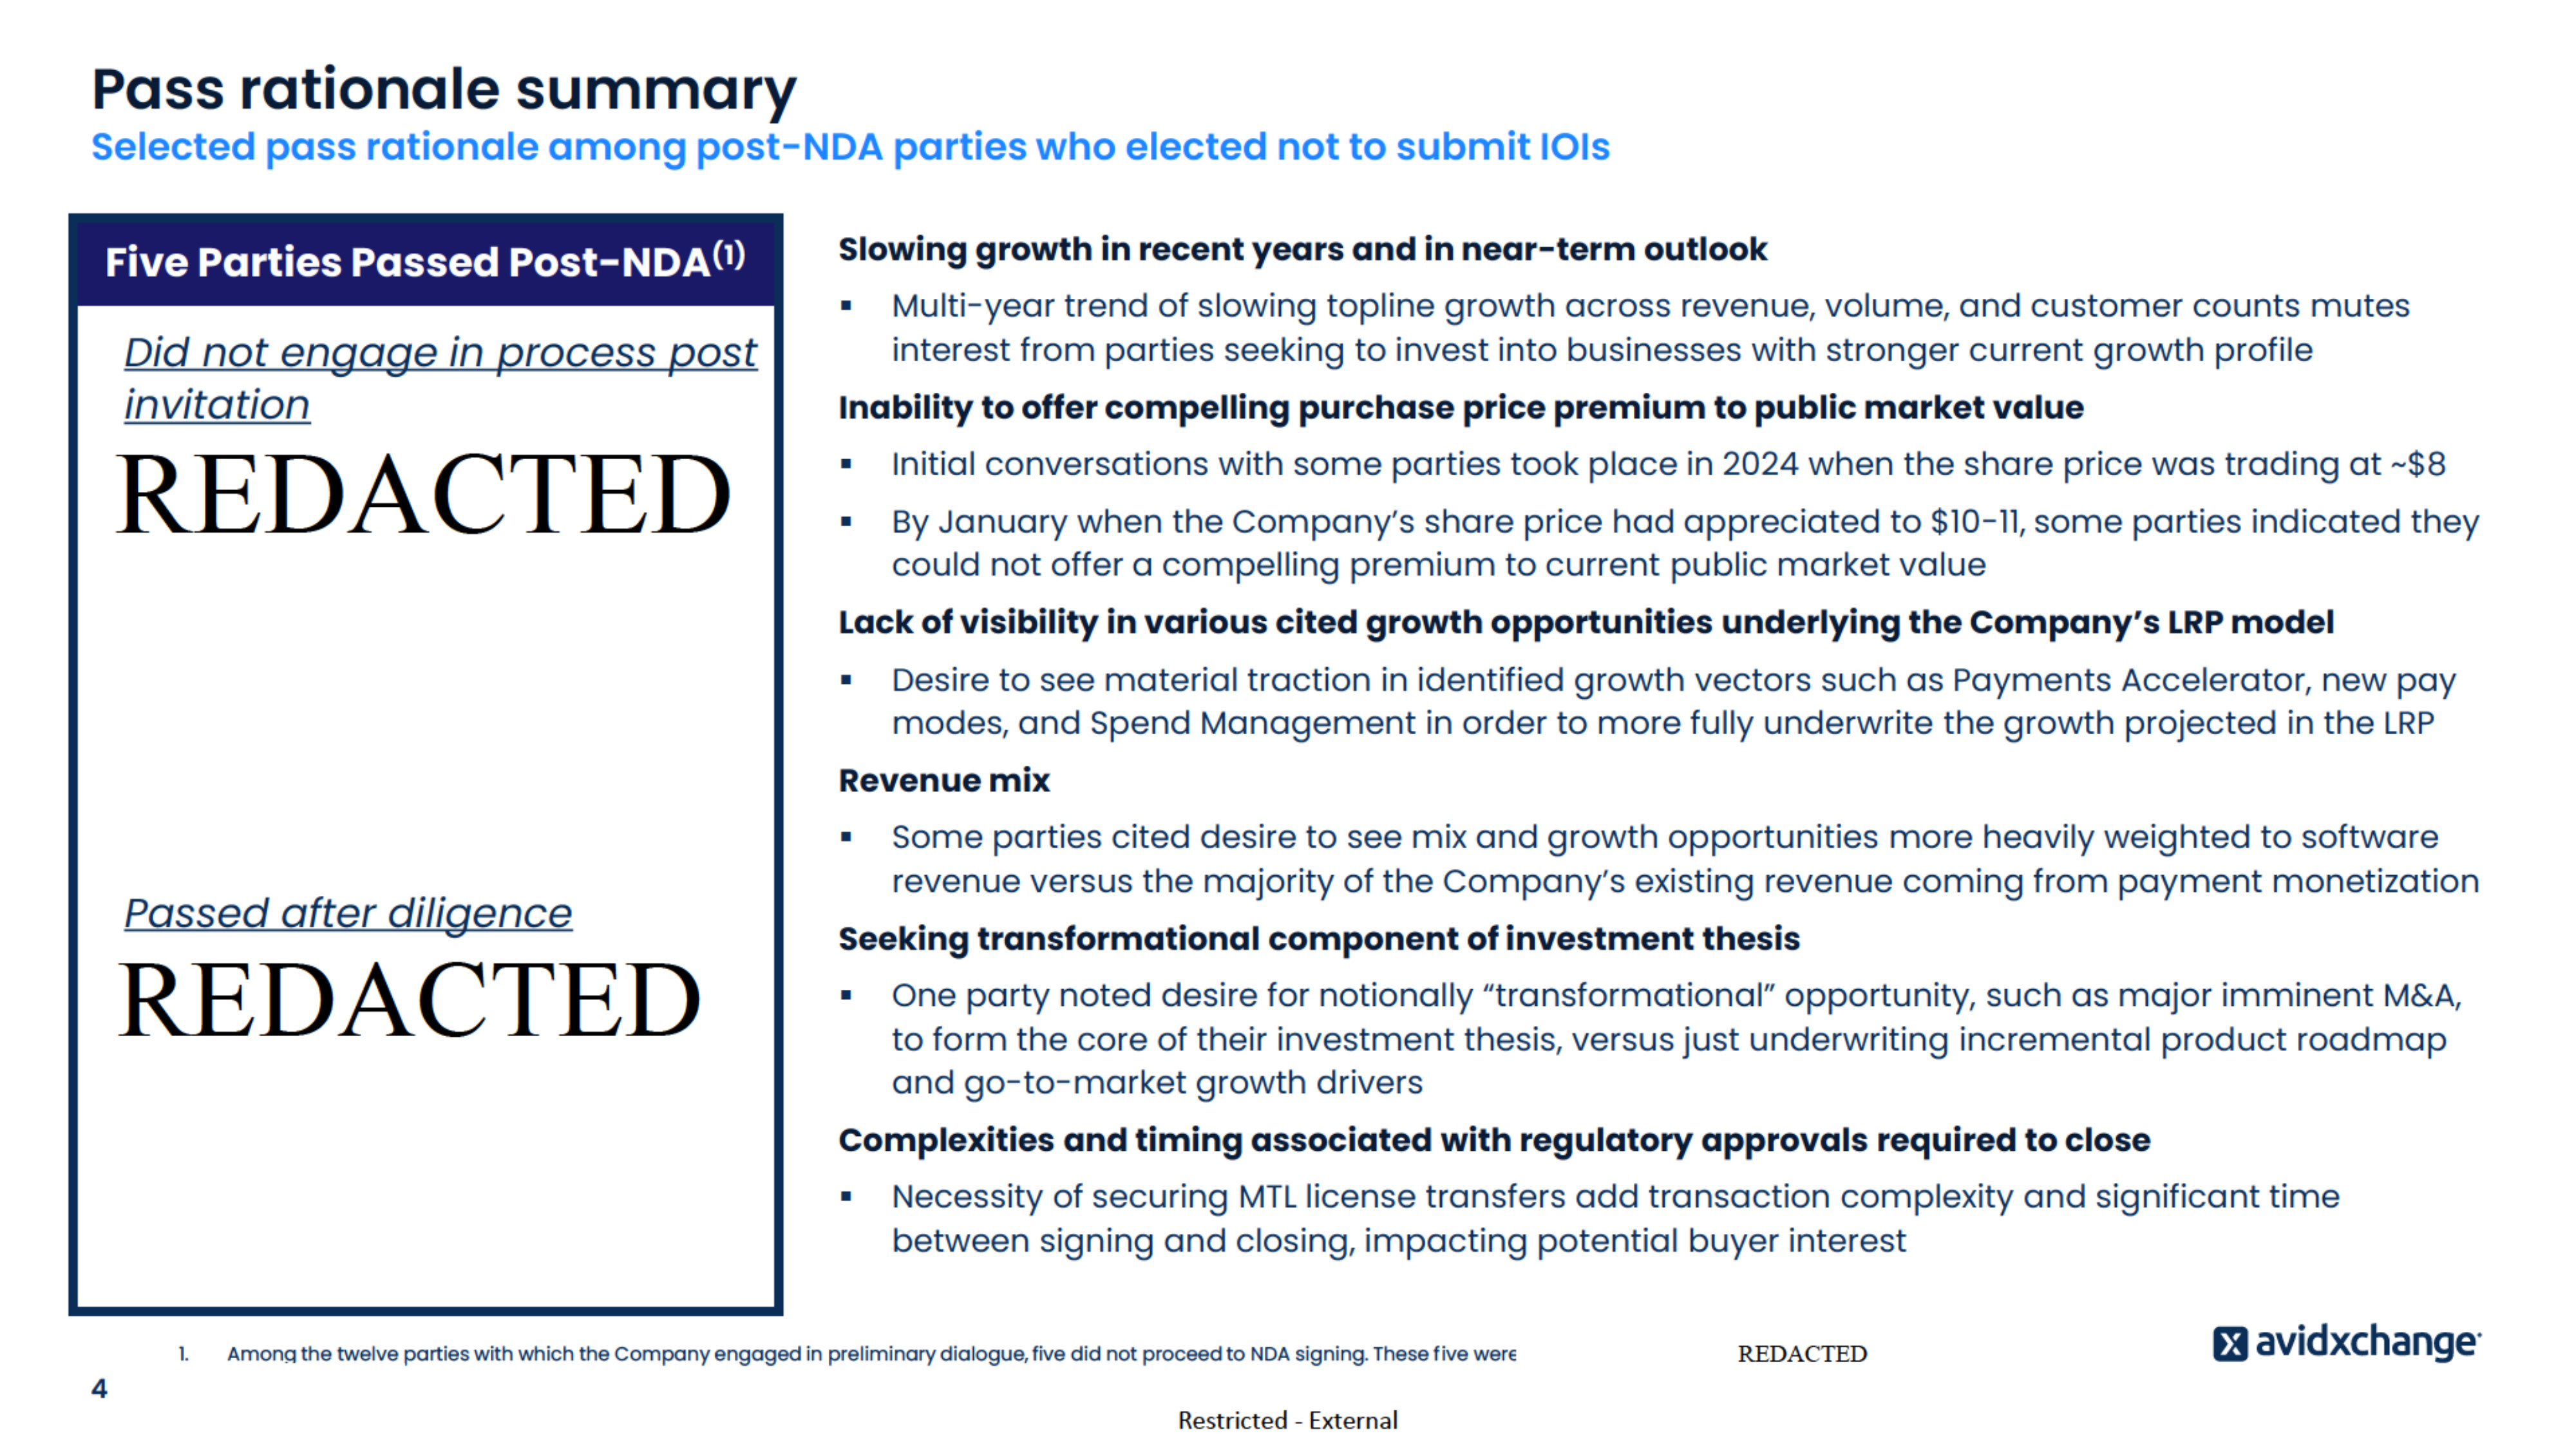
Restricted - External Pass rationale summary Selected pass rationale among post-NDA parties who elected not to submit IOIs Five Parties Passed Post-NDA(1) Did not engage in process post invitation . Clearlake . GTCR . TA Associates Passed after diligence . Silver Lake . Thoma Bravo Slowing growth in recent years and in near-term outlook . Multi-year trend of slowing topline growth across revenue, volume, and customer counts mutes interest from parties seeking to invest into businesses with stronger current growth profile Inability to offer compelling purchase price premium to public market value . Initial conversations with some parties took place in 2024 when the share price was trading at ~$8 . By January when the Companyfs share price had appreciated to $10-11, some parties indicated they could not offer a compelling premium to current public market value Lack of visibility in various cited growth opportunities underlying the Companyfs LRP model . Desire to see material traction in identified growth vectors such as Payments Accelerator, new pay modes, and Spend Management in order to more fully underwrite the growth projected in the LRP Revenue mix . Some parties cited desire to see mix and growth opportunities more heavily weighted to software revenue versus the majority of the Companyfs existing revenue coming from payment monetization Seeking transformational component of investment thesis . One party noted desire for notionally gtransformationalh opportunity, such as major imminent M&A, to form the core of their investment thesis, versus just underwriting incremental product roadmap and go-to-market growth drivers Complexities and timing associated with regulatory approvals required to close . Necessity of securing MTL license transfers add transaction complexity and significant time between signing and closing, impacting potential buyer interest 4 1. Among the twelve parties with which the Company engaged in preliminary dialogue, five did not proceed to NDA signing. These five were Summit Partners, Vista Equity, Blackstone, Constellation, and Francisco Partners.
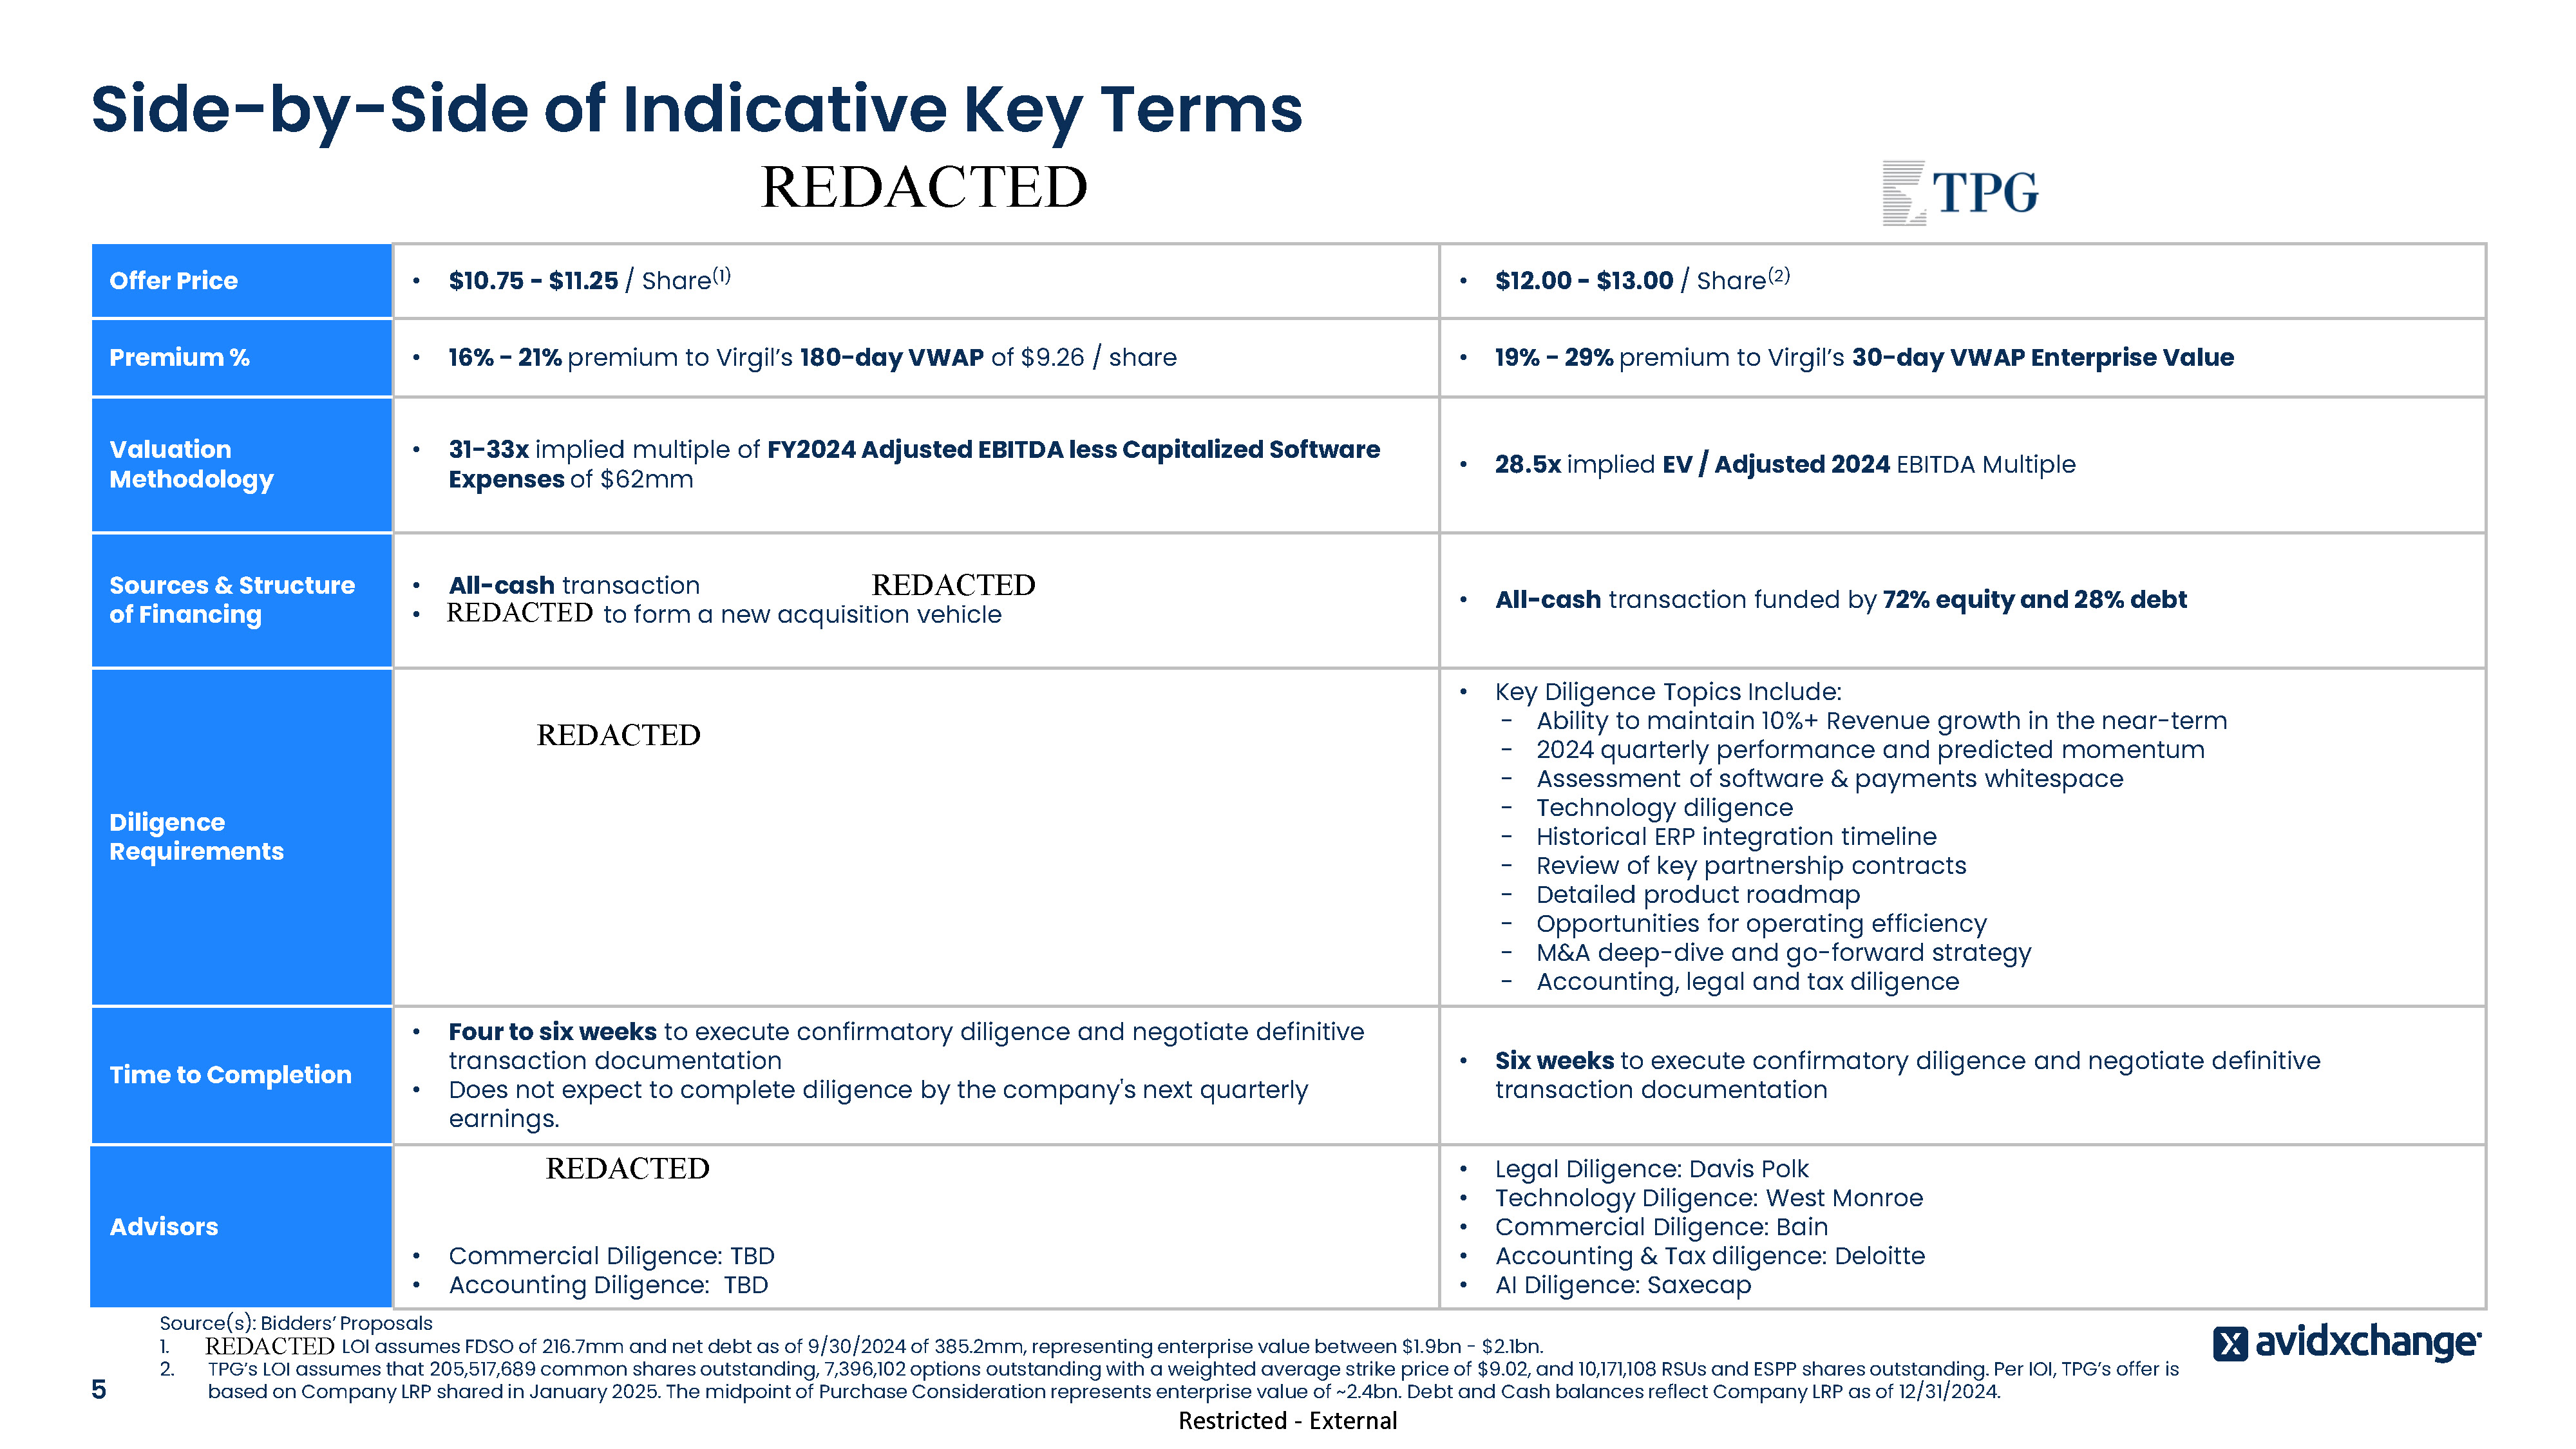
Restricted - External Offer Price • $10.75 - $11.25 / Share(1) • $12.00 - $13.00 / Share(2) Premium % • 16% - 21% premium to Virgil’s 180-day VWAP of $9.26 / share • 19% - 29% premium to Virgil’s 30-day VWAP Enterprise Value Valuation Methodology • 31-33x implied multiple of FY2024 Adjusted EBITDA less Capitalized Software Expenses of $62mm • 28.5x implied EV / Adjusted 2024 EBITDA Multiple Sources & Structure of Financing • All-cash transaction funded by 66% of Equity and 34% of Debt • Bain Capital to form a new acquisition vehicle • All-cash transaction funded by 72% equity and 28% debt Diligence Requirements • Key Diligence Topics Include: - Growth strategy and competitive landscape - Recent performance and 2025 budget - Suppliers, buyers-suppliers and partners - Top clients and partnerships - Go-to-market and costs - Technologies and product roadmap - Accounting & legal • Key Diligence Topics Include: - Ability to maintain 10%+ Revenue growth in the near-term - 2024 quarterly performance and predicted momentum - Assessment of software & payments whitespace - Technology diligence - Historical ERP integration timeline - Review of key partnership contracts - Detailed product roadmap - Opportunities for operating efficiency - M&A deep-dive and go-forward strategy - Accounting, legal and tax diligence Time to Completion • Four to six weeks to execute confirmatory diligence and negotiate definitive transaction documentation • Does not expect to complete diligence by the company's next quarterly earnings. • Six weeks to execute confirmatory diligence and negotiate definitive transaction documentation Advisors • Legal Diligence: Kirkland & Ellis • Cost Diligence: AlixPartners • Technical Diligence: EY-Parthenon • Commercial Diligence: TBD • Accounting Diligence: TBD • Legal Diligence: Davis Polk • Technology Diligence: West Monroe • Commercial Diligence: Bain • Accounting & Tax diligence: Deloitte • AI Diligence: Saxecap Side-by-Side of Indicative Key Terms Source(s): Bidders’ Proposals 1. Bain Capital’s LOI assumes FDSO of 216.7mm and net debt as of 9/30/2024 of 385.2mm, representing enterprise value between $1.9bn - $2.1bn. 2. TPG’s LOI assumes that 205,517,689 common shares outstanding, 7,396,102 options outstanding with a weighted average strike price of $9.02, and 10,171,108 RSUs and ESPP shares outstanding. Per IOI, TPG’s offer is based on Company LRP shared in January 2025. The midpoint of Purchase Consideration represents enterprise value of ~2.4bn. Debt and Cash balances reflect 5 Company LRP as of 12/31/2024.

Preliminary Perspectives on Valuation
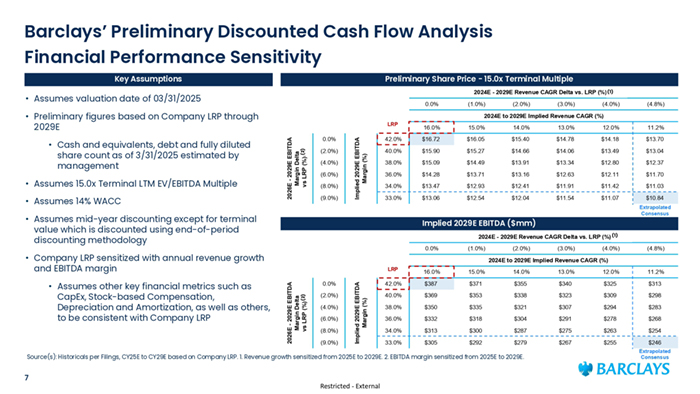
Barclays’ Preliminary Discounted Cash Flow Analysis Financial Performance Sensitivity Key Assumptions Preliminary Share Price - 15.0x Terminal Multiple (1) 2024E - 2029E Revenue CAGR Delta vs. LRP (%)(1) • Assumes valuation date of 03/31/2025 0.0% • Preliminary figures based on Company LRP through 2029E • Assumes 14% WACC 0.0% (2.0%) (4.0%) (6.0%) (8.0%) (9.0%) Implied 2029E EBITDA Margin (%) • Assumes 15.0x Terminal LTM EV/EBITDA Multiple (4.0%) (4.8%) 15.0% 14.0% 13.0% 12.0% 11.2% 42.0% $16.72 $16.05 $15.40 $14.78 $14.18 $13.70 40.0% $15.90 $15.27 $14.66 $14.06 $13.49 $13.04 38.0% $15.09 $14.49 $13.91 $13.34 $12.80 $12.37 36.0% $14.28 $13.71 $13.16 $12.63 $12.11 $11.70 34.0% $13.47 $12.93 $12.41 $11.91 $11.42 $11.03 33.0% $13.06 $12.54 $12.04 $11.54 $11.07 $10.84 Extrapolated Consensus Implied 2029E EBITDA ($mm) (1)(1) 2024E - 2029E Revenue CAGR Delta vs. LRP (%)(1) 0.0% • Company LRP sensitized with annual revenue growth and EBITDA margin (1.0%) (2.0%) (3.0%) (4.0%) (4.8%) 0.0% (2.0%) (4.0%) (6.0%) (8.0%) (9.0%) Implied 2029E EBITDA Margin (%) 2026E - 2029E EBITDA Margin Delta (2) vs LRP (%)(2) 2024E to 2029E Implied Revenue CAGR (%) LRP 16.0% 15.0% 14.0% 13.0% 12.0% 11.2% 42.0% $387 $371 $355 $340 $325 $313 40.0% $369 $353 $338 $323 $309 $298 38.0% $350 $335 $321 $307 $294 $283 36.0% $332 $318 $304 $291 $278 $268 34.0% $313 $300 $287 $275 $263 $254 33.0% $305 $292 $279 $267 $255 Source(s): Historicals per Filings, CY25E to CY29E based on Company LRP. 1. Revenue growth sensitized from 2025E to 2029E. 2. EBITDA margin sensitized from 2025E to 2029E. 7 (3.0%) 16.0% • Assumes mid-year discounting except for terminal value which is discounted using end-of-period discounting methodology • Assumes other key financial metrics such as CapEx, Stock-based Compensation, Depreciation and Amortization, as well as others, to be consistent with Company LRP (2.0%) 2024E to 2029E Implied Revenue CAGR (%) LRP 2026E - 2029E EBITDA Margin Delta (2) vs LRP (%)(2) • Cash and equivalents, debt and fully diluted share count as of 3/31/2025 estimated by management (1.0%) Restricted - External $246 Extrapolated Consensus
Appendix
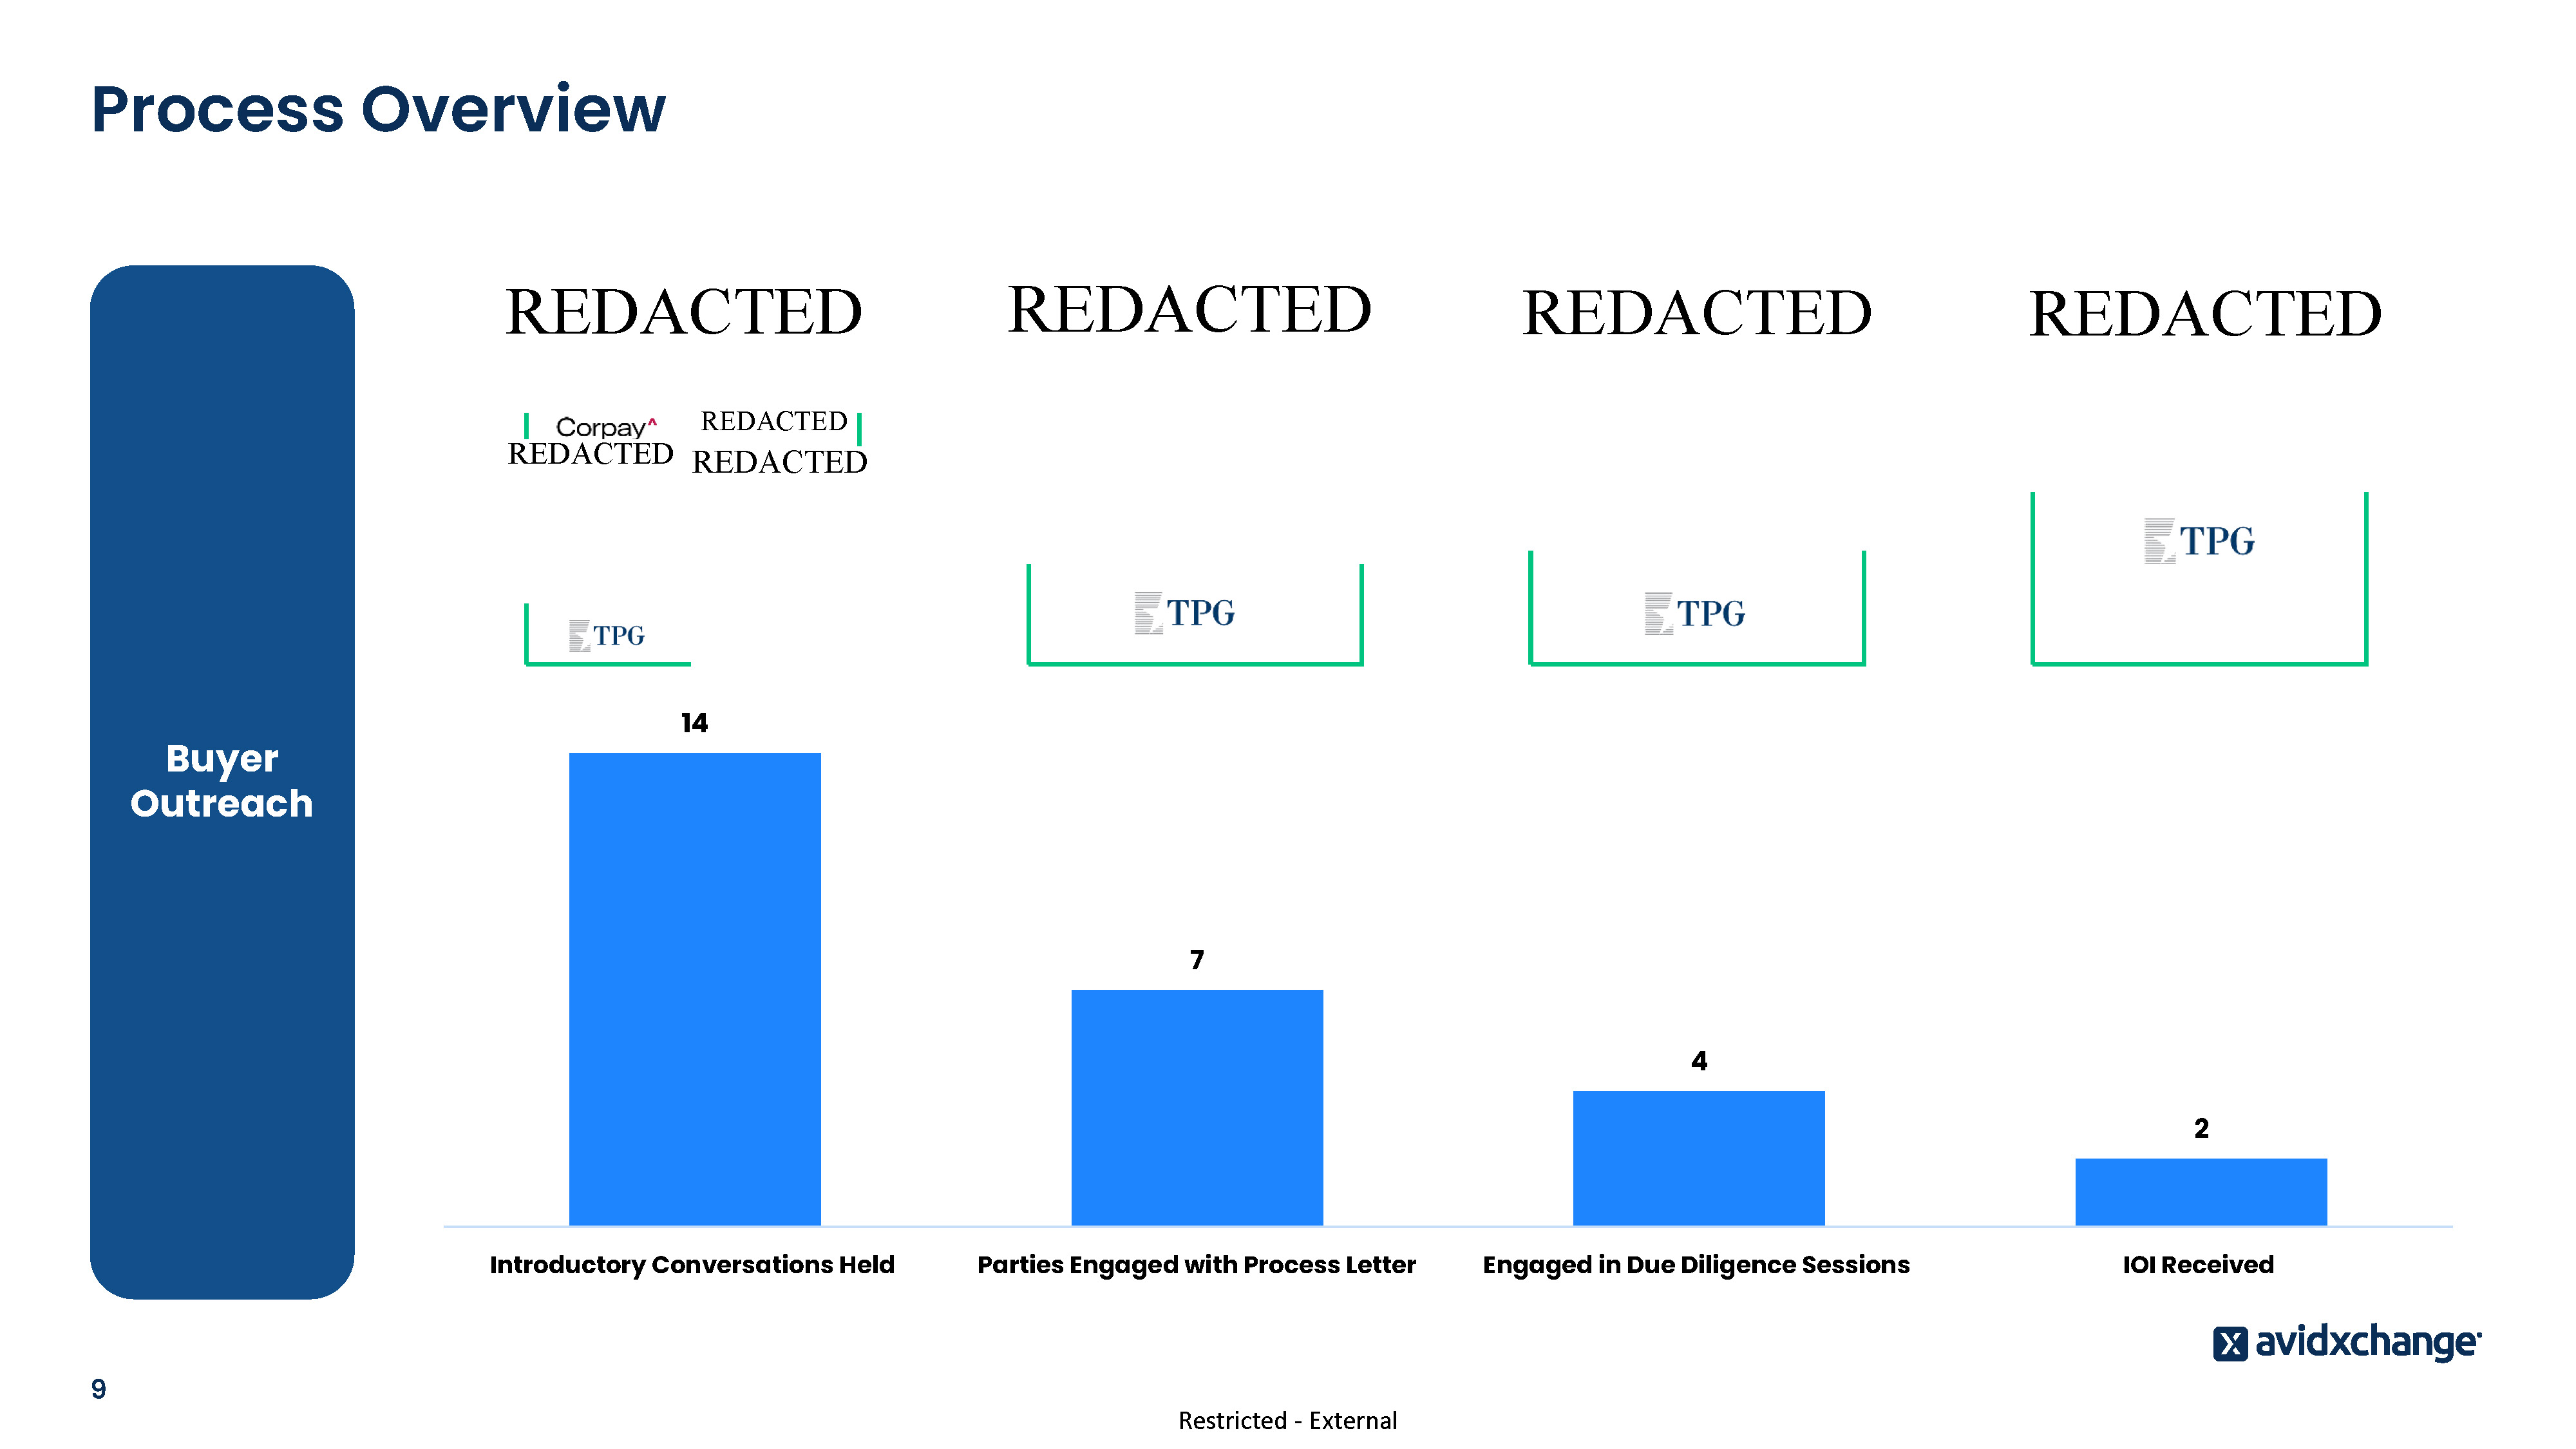
Process Overview Buyer Outreach 14 7 4 2 Introductory Conversations Held 9 Parties Engaged with Process Letter Restricted - External Engaged in Due Diligence Sessions IOI Received
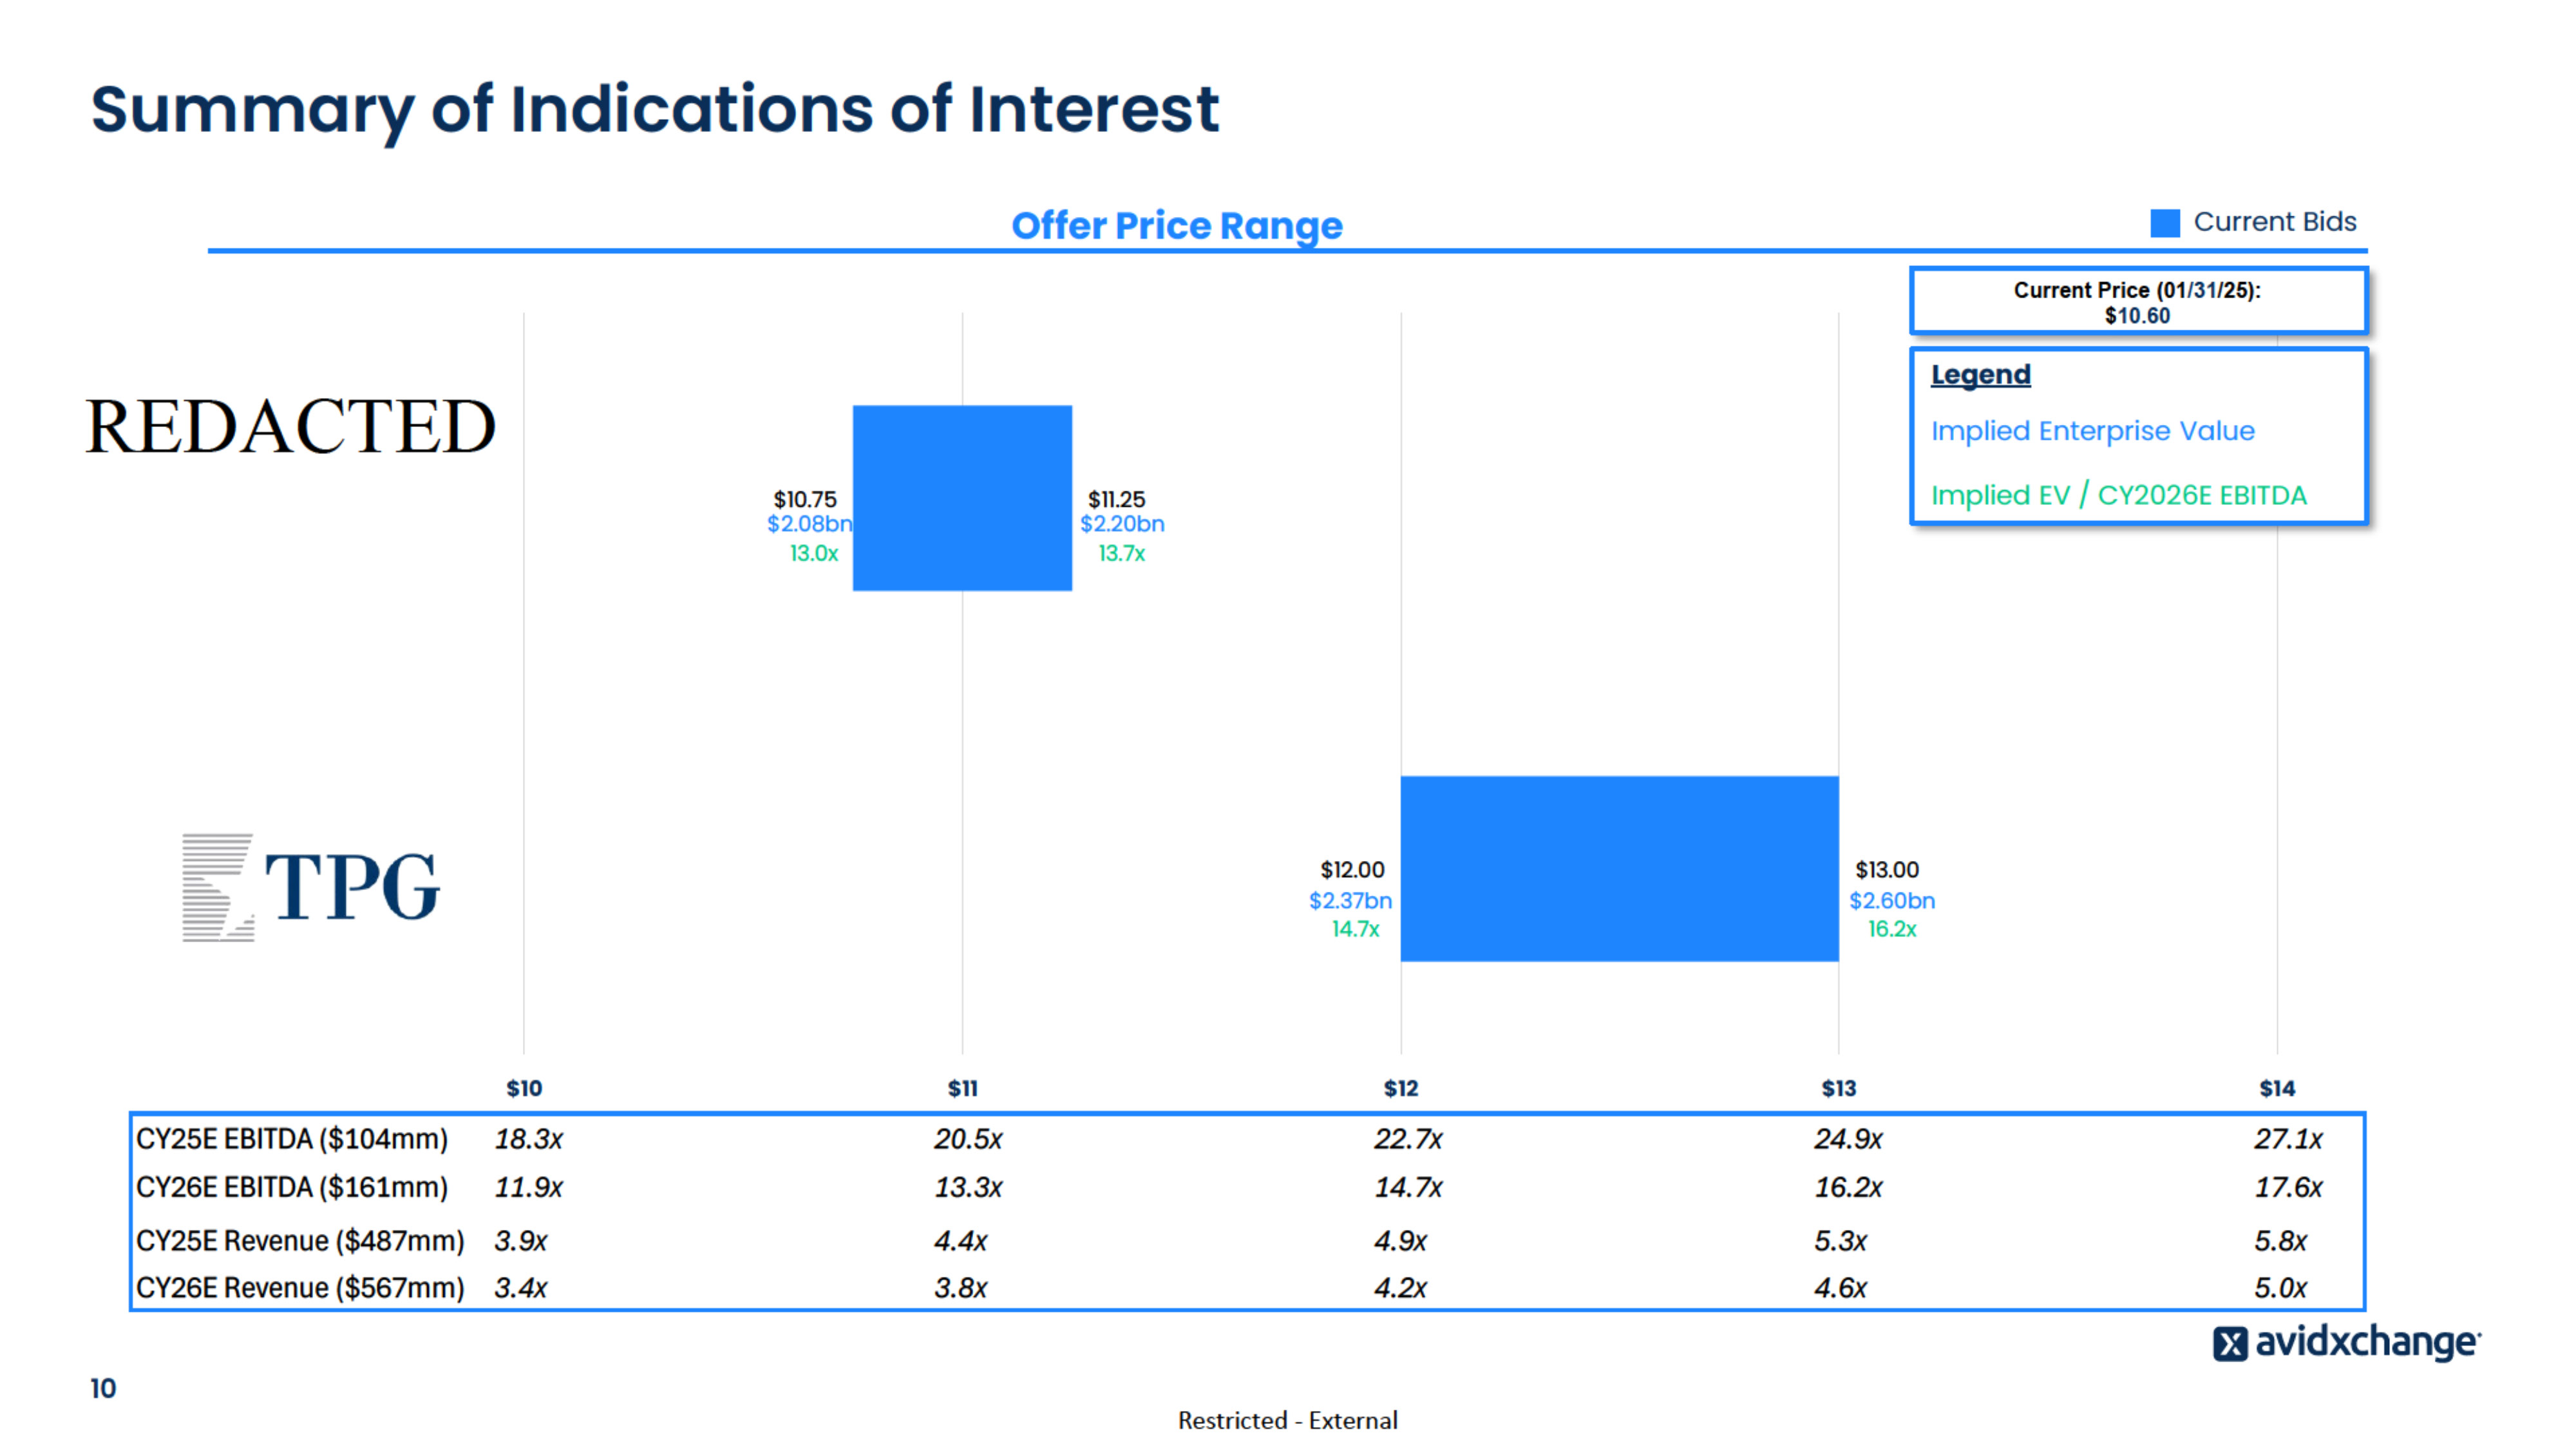
Summary of Indications of Interest Offer Price Range Current Bids Current Price (01/31/25): $10.60 Legend Implied Enterprise Value $10.75 $2.08bn 13.0x Implied EV / CY2026E EBITDA $11.25 $2.20bn 13.7x $12.00 $2.37bn 14.7x 10 $13.00 $2.60bn 16.2x $10 $11 $12 $13 $14 CY25E EBITDA ($104mm) 18.3x 20.5x 22.7x 24.9x 27.1x CY26E EBITDA ($161mm) 11.9x 13.3x 14.7x 16.2x 17.6x CY25E Revenue ($487mm) 3.9x 4.4x 4.9x 5.3x 5.8x CY26E Revenue ($567mm) 3.4x 3.8x 4.2x 4.6x 5.0x Restricted - External
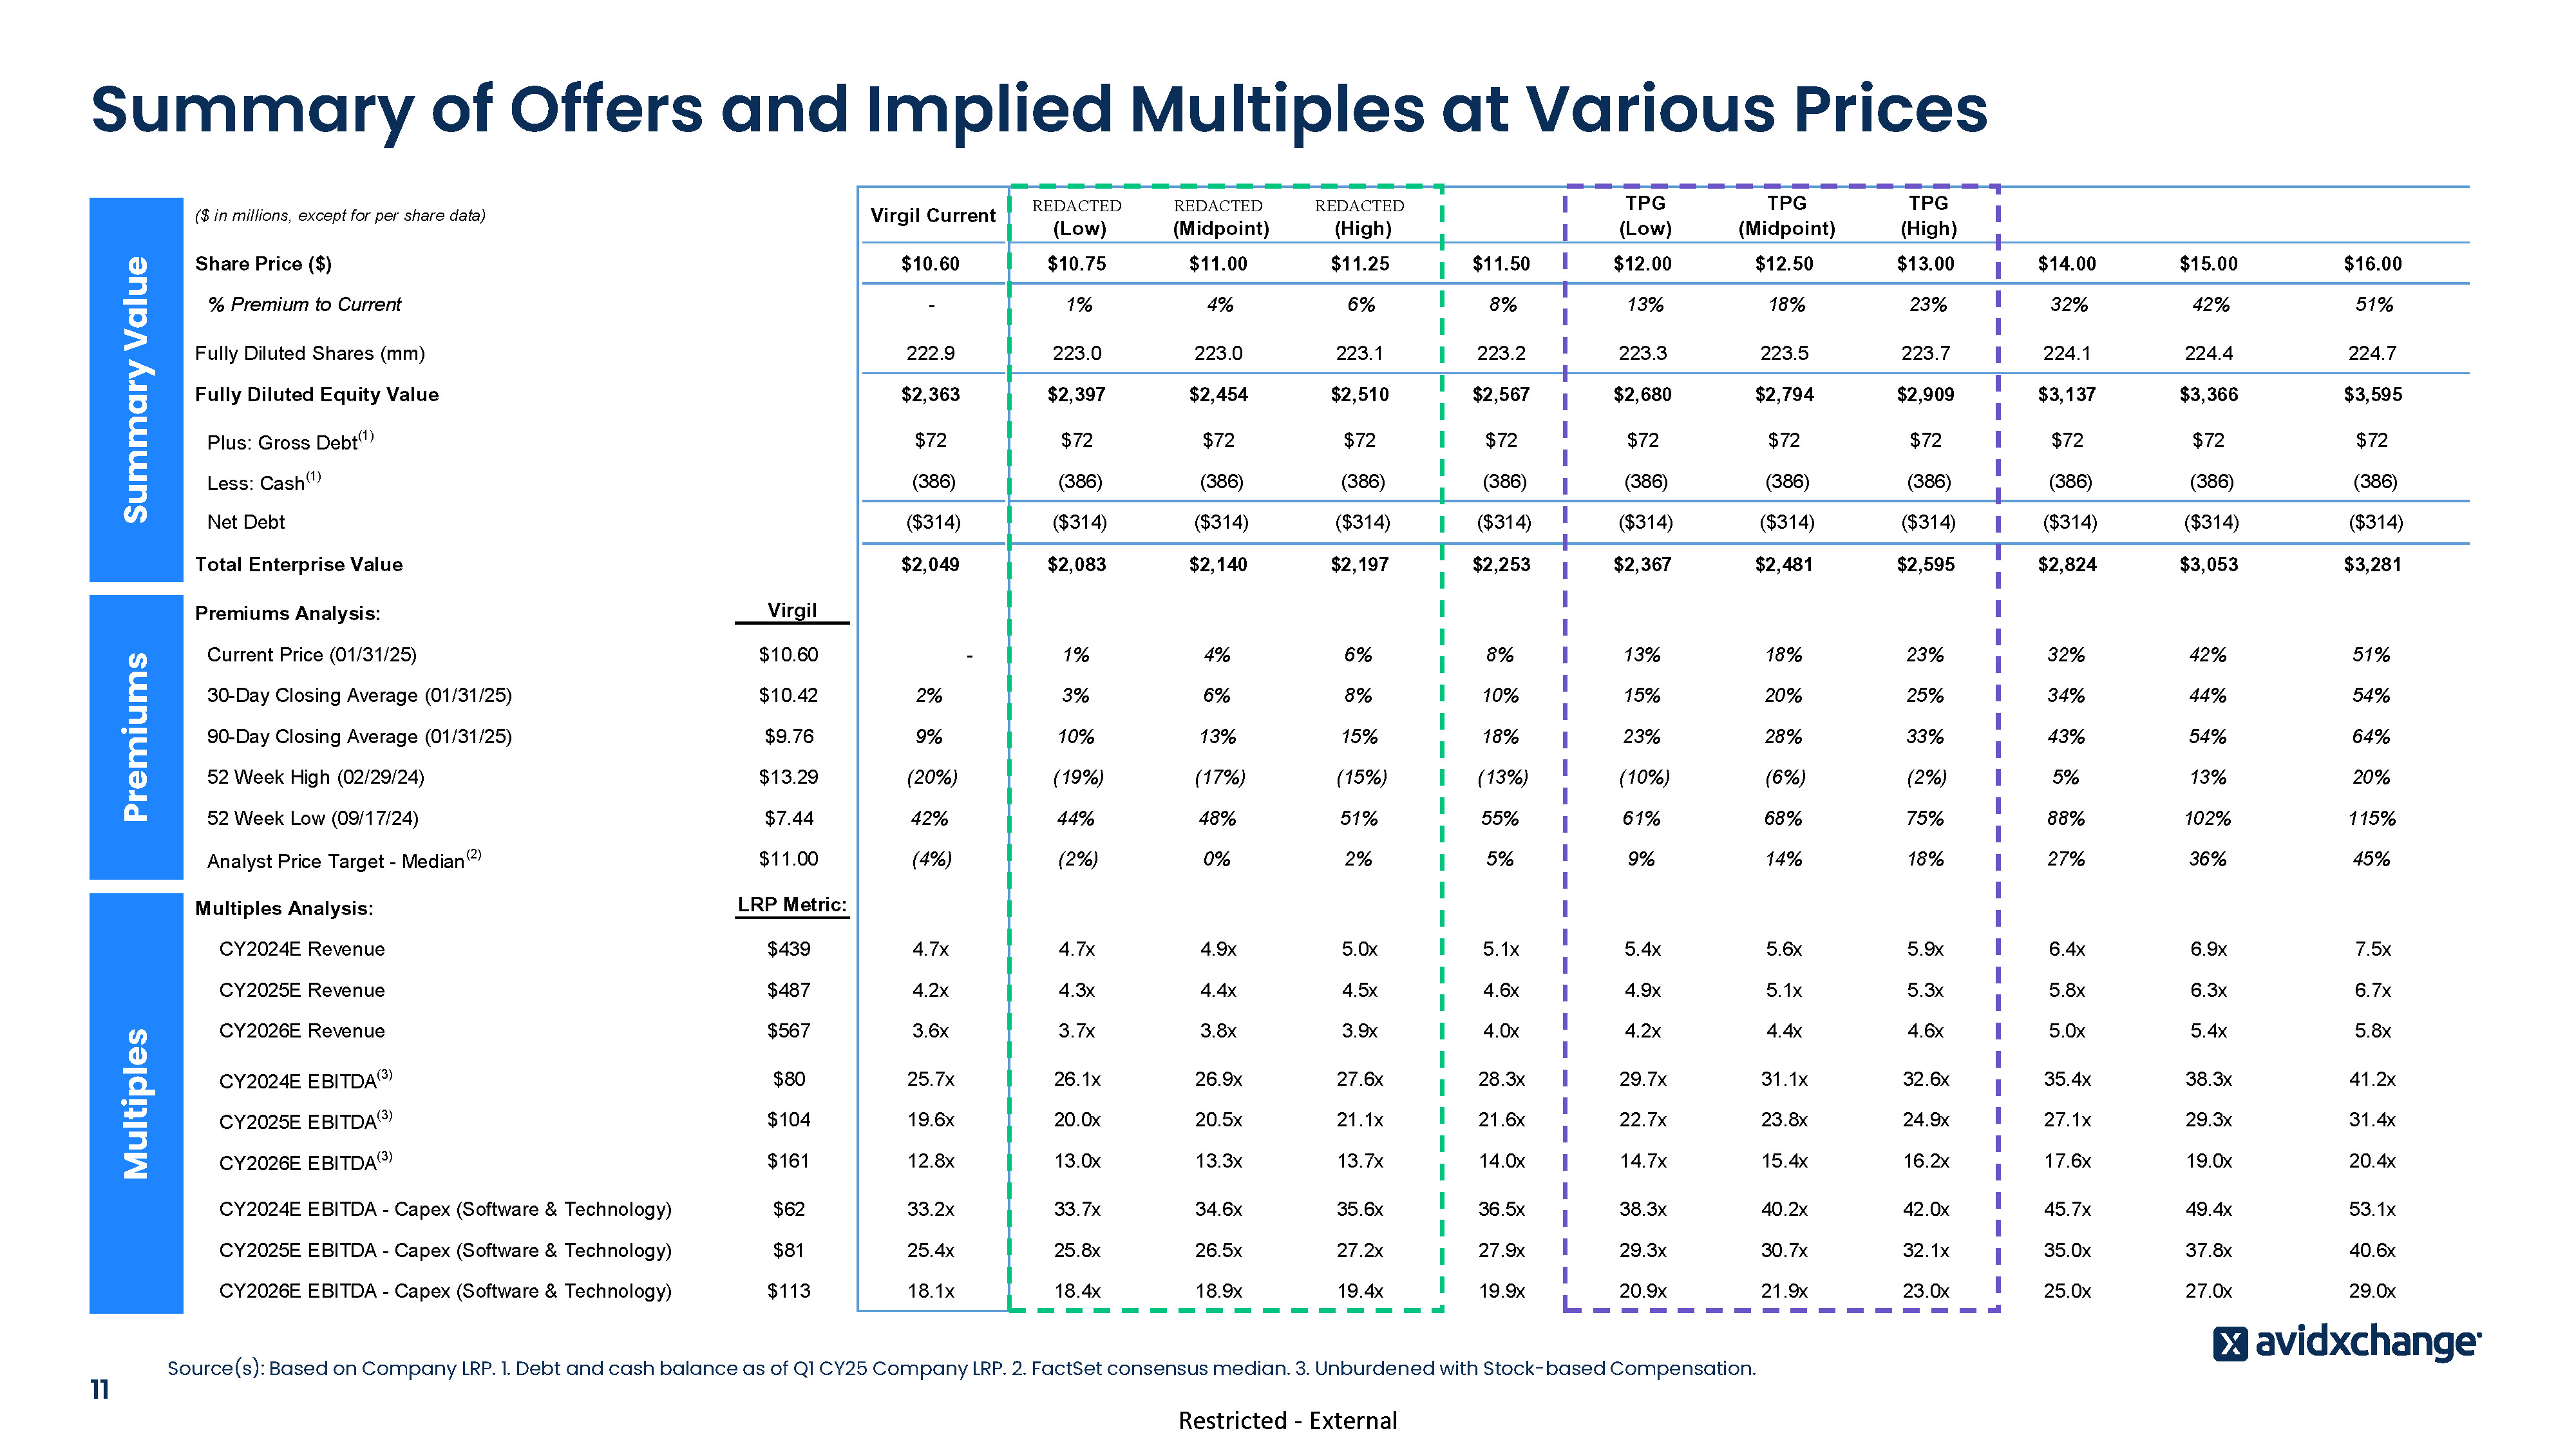
Summary of Offers and Implied Multiples at Various Prices Premiums Summary Value ($ in millions, except for per share data) Share Price ($) Multiples Bain Capital (Low) Bain Capital (Midpoint) Bain Capital (High) TPG (Low) TPG (Midpoint) TPG (High) $10.60 $10.75 $11.00 $11.25 $11.50 $12.00 $12.50 $13.00 $14.00 $15.00 $16.00 % Premium to Current - 1% 4% 6% 8% 13% 18% 23% 32% 42% 51% Fully Diluted Shares (mm) 222.9 223.0 223.0 223.1 223.2 223.3 223.5 223.7 224.1 224.4 224.7 Fully Diluted Equity Value $2,363 $2,397 $2,454 $2,510 $2,567 $2,680 $2,794 $2,909 $3,137 $3,366 $3,595 $72 $72 $72 $72 $72 $72 $72 $72 $72 $72 $72 (386) (386) (386) (386) (386) (386) (386) (386) (386) (386) (386) Net Debt ($314) ($314) ($314) ($314) ($314) ($314) ($314) ($314) ($314) ($314) ($314) Total Enterprise Value $2,049 $2,083 $2,140 $2,197 $2,253 $2,367 $2,481 $2,595 $2,824 $3,053 $3,281 1% 4% 6% 8% 13% 18% 23% 32% 42% 51% Plus: Gross Debt Less: Cash (1) (1) Premiums Analysis: Virgil Current Price (01/31/25) $10.60 30-Day Closing Average (01/31/25) $10.42 2% 3% 6% 8% 10% 15% 20% 25% 34% 44% 54% 90-Day Closing Average (01/31/25) $9.76 9% 10% 13% 15% 18% 23% 28% 33% 43% 54% 64% 52 Week High (02/29/24) $13.29 (20%) (19%) (17%) (15%) (13%) (10%) (6%) (2%) 5% 13% 20% 52 Week Low (09/17/24) $7.44 42% 44% 48% 51% 55% 61% 68% 75% 88% 102% 115% Analyst Price Target - Median (2) $11.00 (4%) (2%) 0% 2% 5% 9% 14% 18% 27% 36% 45% - LRP Metric: Multiples Analysis: 11 Virgil Current CY2024E Revenue $439 4.7x 4.7x 4.9x 5.0x 5.1x 5.4x 5.6x 5.9x 6.4x 6.9x 7.5x CY2025E Revenue $487 4.2x 4.3x 4.4x 4.5x 4.6x 4.9x 5.1x 5.3x 5.8x 6.3x 6.7x CY2026E Revenue $567 3.6x 3.7x 3.8x 3.9x 4.0x 4.2x 4.4x 4.6x 5.0x 5.4x 5.8x CY2024E EBITDA(3) $80 25.7x 26.1x 26.9x 27.6x 28.3x 29.7x 31.1x 32.6x 35.4x 38.3x 41.2x (3) CY2025E EBITDA $104 19.6x 20.0x 20.5x 21.1x 21.6x 22.7x 23.8x 24.9x 27.1x 29.3x 31.4x CY2026E EBITDA(3) $161 12.8x 13.0x 13.3x 13.7x 14.0x 14.7x 15.4x 16.2x 17.6x 19.0x 20.4x CY2024E EBITDA - Capex (Software & Technology) $62 33.2x 33.7x 34.6x 35.6x 36.5x 38.3x 40.2x 42.0x 45.7x 49.4x 53.1x CY2025E EBITDA - Capex (Software & Technology) $81 25.4x 25.8x 26.5x 27.2x 27.9x 29.3x 30.7x 32.1x 35.0x 37.8x 40.6x CY2026E EBITDA - Capex (Software & Technology) $113 18.1x 18.4x 18.9x 19.4x 19.9x 20.9x 21.9x 23.0x 25.0x 27.0x 29.0x Source(s): Based on Company LRP. 1. Debt and cash balance as of Q1 CY25 Company LRP. 2. FactSet consensus median. 3. Unburdened with Stock-based Compensation. Restricted - External
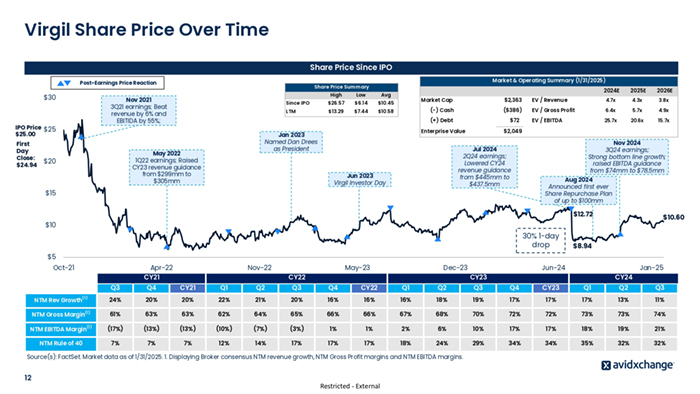
Virgil Share Price Over Time Share Price Since IPO Post-Earnings Price Reaction $30 Nov 2021 3Q21 earnings; Beat revenue by 6% and EBITIDA by 55%; IPO Price $25 $25.00 First Day Close: $24.94 High Low Avg Since IPO $26.57 $6.14 $10.45 LTM $13.29 $7.44 $10.58 Jan 2023 Named Dan Drees as President May 2022 1Q22 earnings; Raised CY23 revenue guidance from $299mm to $305mm $20 Market & Operating Summary (1/31/2025) Share Price Summary 2024E 2025E 2026E 4.7x 4.3x 3.8x Market Cap $2,363 EV / Revenue (-) Cash ($386) EV / Gross Profit 6.4x 5.7x 4.9x (+) Debt $72 EV / EBITDA 25.7x 20.6x 15.7x Enterprise Value $2,049 Jul 2024 2Q24 earnings; Lowered CY24 revenue guidance from $445mm to $437.5mm Jun 2023 Virgil Investor Day $15 Nov 2024 3Q24 earnings; Strong bottom line growth; raised EBITDA guidance from $74mm to $78.5mm Aug 2024 Announced first ever Share Repurchase Plan of up to $100mm $12.72 $10.60 $10 30% 1-day drop $8.94 $5 Oct-21 Apr-22 CY21 Nov-22 May-23 Dec-23 CY22 Jun-24 Jan-25 CY23 CY24 Q3 Q4 CY21 Q1 Q2 Q3 Q4 CY22 Q1 Q2 Q3 Q4 CY23 Q1 Q2 Q3 (1) NTM Rev Growth 24% 20% 20% 22% 21% 20% 16% 16% 16% 18% 19% 17% 17% 17% 13% 11% NTM Gross Margin(1) 61% 63% 63% 62% 64% 65% 66% 66% 67% 68% 70% 72% 72% 73% 73% 74% NTM EBITDA Margin (1) (17%) (13%) (13%) (10%) (7%) (3%) 1% 1% 2% 6% 10% 17% 17% 18% 19% 21% NTM Rule of 40 7% 7% 7% 12% 14% 17% 17% 17% 18% 24% 29% 34% 34% 35% 32% 32% Source(s): FactSet. Market data as of 1/31/2025. 1. Displaying Broker consensus NTM revenue growth, NTM Gross Profit margins and NTM EBITDA margins. 12 Restricted - External
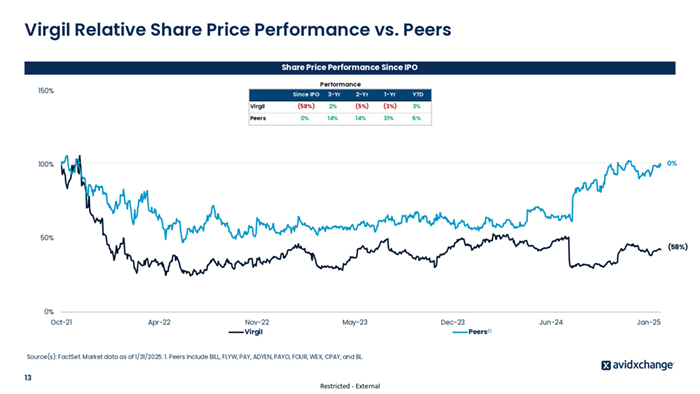
Virgil Relative Share Price Performance vs. Peers Share Price Performance Since IPO Performance 150% Since IPO 3-Yr 2-Yr 1-Yr YTD Virgil (58%) 2% (5%) (3%) 3% Peers 0% 14% 14% 31% 6% 0% 100% 50% (58%) 0% Oct-21 Apr-22 Nov-22 Virgil May-23 Jun-24 Peers(1) Source(s): FactSet. Market data as of 1/31/2025. 1. Peers include BILL, FLYW, PAY, ADYEN, PAYO, FOUR, WEX, CPAY, and BL. 13 Dec-23 Restricted - External Jan-25
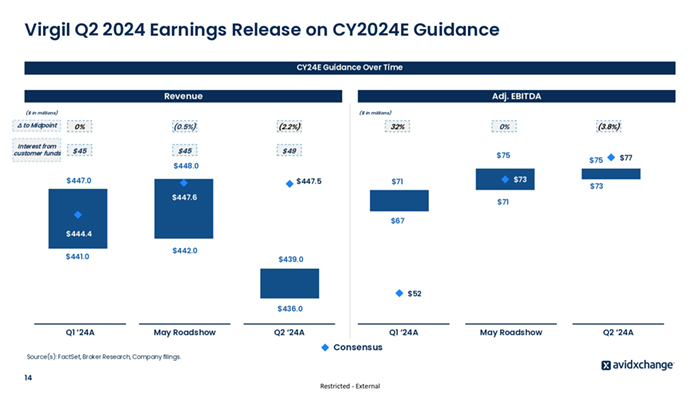
Virgil Q2 2024 Earnings Release on CY2024E Guidance CY24E Guidance Over Time Revenue Adj. EBITDA ($ in millions) ($ in millions) ∆ to Midpoint 0% (0.5%) (2.2%) Interest from customer funds $45 $45 $49 32% 0% (3.8%) $75 $447.0 $447.5 $73 $71 $447.6 $77 $75 $448.0 $73 $71 $67 $444.4 $441.0 $442.0 $439.0 $52 $436.0 Q1 ‘24A May Roadshow Source(s): FactSet, Broker Research, Company filings. 14 Q2 ‘24A Q1 ‘24A Consensus Restricted - External May Roadshow Q2 ‘24A
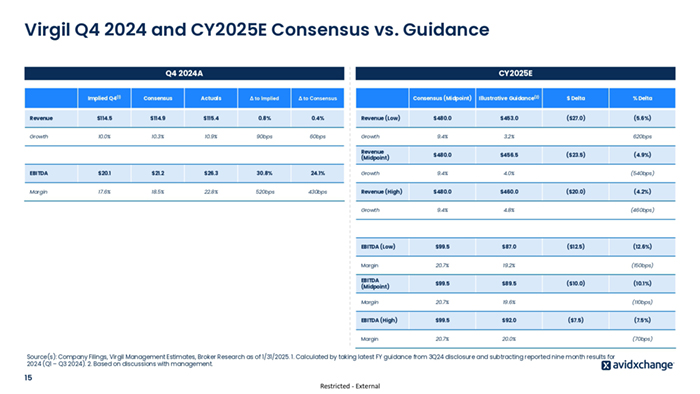
Virgil Q4 2024 and CY2025E Consensus vs. Guidance Q4 2024A CY2025E (2) Implied Q4(1) Consensus Actuals Δ to Implied Δ to Consensus Revenue $114.5 $114.9 $115.4 0.8% 0.4% Revenue (Low) Growth 10.0% 10.3% 10.9% 90bps 60bps Growth (1) Consensus (Midpoint) Illustrative Guidance(2) $ Delta % Delta $480.0 $453.0 ($27.0) (5.6%) 9.4% 3.2% $480.0 $456.5 9.4% 4.0% $480.0 $460.0 Growth 9.4% 4.8% EBITDA (Low) $99.5 $87.0 Margin 20.7% 19.2% EBITDA (Midpoint) $99.5 $89.5 Margin 20.7% 19.6% EBITDA (High) $99.5 $92.0 Margin 20.7% 20.0% Revenue (Midpoint) EBITDA $20.1 $21.2 $26.3 30.8% 24.1% Growth Margin 17.6% 18.5% 22.8% 520bps 430bps Revenue (High) 620bps ($23.5) (540bps) ($20.0) Restricted - External (4.2%) (460bps) ($12.5) (12.6%) (150bps) ($10.0) (10.1%) (110bps) ($7.5) Source(s): Company Filings, Virgil Management Estimates, Broker Research as of 1/31/2025. 1. Calculated by taking latest FY guidance from 3Q24 disclosure and subtracting reported nine month results for 2024 (Q1 – Q3 2024). 2. Based on discussions with management. 15 (4.9%) (7.5%) (70bps)
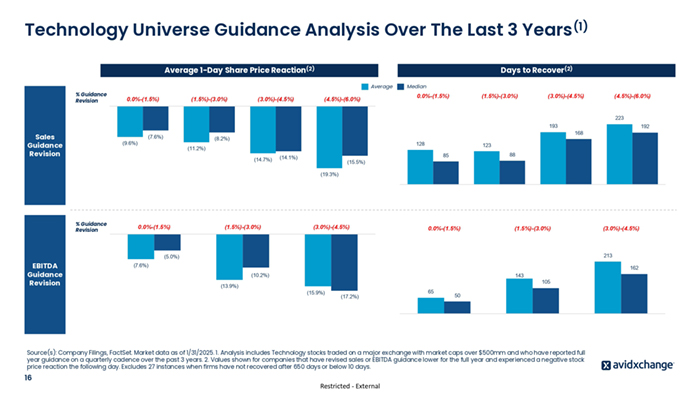
Technology Universe Guidance Analysis Over The Last 3 Years(1) Average 1-Day Share Price Reaction(2) Days to Recover(2) Average % Guidance Revision 0.0%-(1.5%) (1.5%)-(3.0%) (3.0%)-(4.5%) (4.5%)-(6.0%) Median 0.0%-(1.5%) (1.5%)-(3.0%) (3.0%)-(4.5%) (4.5%)-(6.0%) 223 193 Sales Guidance Revision (9.6%) (7.6%) (8.2%) 128 (11.2%) (14.7%) (14.1%) 192 168 123 88 85 (15.5%) (19.3%) % Guidance Revision 0.0%-(1.5%) (1.5%)-(3.0%) (3.0%)-(4.5%) 0.0%-(1.5%) (1.5%)-(3.0%) 213 (5.0%) EBITDA Guidance Revision (7.6%) 162 (10.2%) (13.9%) 143 (15.9%) (17.2%) 65 105 50 Source(s): Company Filings, FactSet. Market data as of 1/31/2025. 1. Analysis includes Technology stocks traded on a major exchange with market caps over $500mm and who have reported full year guidance on a quarterly cadence over the past 3 years. 2. Values shown for companies that have revised sales or EBITDA guidance lower for the full year and experienced a negative stock price reaction the following day. Excludes 27 instances when firms have not recovered after 650 days or below 10 days. 16 (3.0%)-(4.5%) Restricted - External
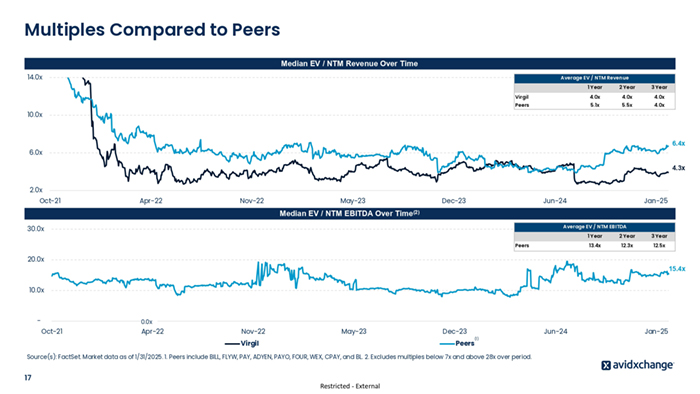
Multiples Compared to Peers Median EV / NTM Revenue Over Time 14.0x Average EV / NTM Revenue 1 Year 2 Year 3 Year Virgil 4.0x 4.0x 4.0x Peers 5.1x 5.5x 4.0x 10.0x 6.4x 6.0x 4.3x 2.0x Oct-21 Apr-22 Nov-22 May-23 Dec-23 Jun-24 Jan-25 Median EV / NTM EBITDA Over Time(2) Average EV / NTM EBITDA 30.0x Peers 1 Year 2 Year 3 Year 13.4x 12.3x 12.5x 20.0x 15.4x 10.0x - 0.0x Oct-21 Apr-22 Nov-22 May-23 Virgil Dec-23 Peers Jun-24 (1) Source(s): FactSet. Market data as of 1/31/2025. 1. Peers include BILL, FLYW, PAY, ADYEN, PAYO, FOUR, WEX, CPAY, and BL. 2. Excludes multiples below 7x and above 28x over period. 17 Restricted - External Jan-25
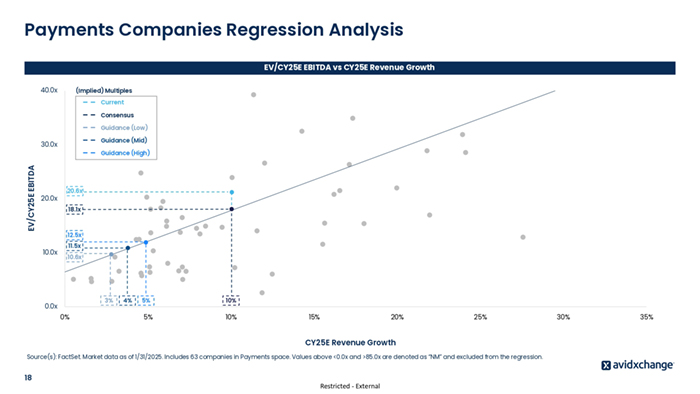
Payments Companies Regression Analysis EV/CY25E EBITDA vs CY25E Revenue Growth 40.0x (Implied) Multiples Current Consensus Guidance (Low) Guidance (Mid) 30.0x EV/CY25E EBITDA Guidance (High) 20.0x 20.6x 18.1x 12.5x 10.0x 11.5x 10.6x 3% 0.0x 0% 4% 5% 10% 5% 10% 15% 20% 25% CY25E Revenue Growth Source(s): FactSet. Market data as of 1/31/2025. Includes 63 companies in Payments space. Values above <0.0x and >85.0x are denoted as “NM” and excluded from the regression. 18 Restricted - External 30% 35%
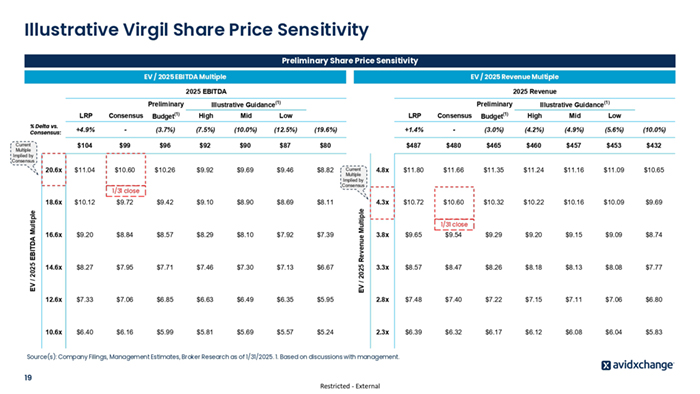
Illustrative Virgil Share Price Sensitivity Preliminary Share Price Sensitivity EV / 2025 EBITDA Multiple EV / 2025 Revenue Multiple 2025 EBITDA Preliminary LRP Consensus Budget High Mid Low +4.9% - (3.7%) (7.5%) (10.0%) (12.5%) (19.6%) $7.99 $104 $99 $96 $92 $90 $87 $80 20.6x $11.04 $10.60 $10.26 $9.92 $9.69 $9.46 $8.82 $9.42 $9.10 $8.90 $8.69 $8.11 % Delta vs. Consensus: Current Multiple Implied by Consensus (1) Illustrative Guidance 1/31 close EV / 2025 EBITDA Multiple 18.6x $10.12 $9.72 16.6x $9.20 $8.84 $8.57 $8.29 $8.10 $7.92 $7.39 14.6x $8.27 $7.95 $7.71 $7.46 $7.30 $7.13 $6.67 12.6x $7.33 $7.06 $6.85 $6.63 $6.49 $6.35 10.6x $6.40 $6.16 $5.99 $5.81 $5.69 $5.57 Current Multiple Implied by Consensus EV / 2025 Revenue Multiple Preliminary 2025 Revenue (1) LRP Consensus Budget High Mid Low +1.4% - (3.0%) (4.2%) (4.9%) (5.6%) (10.0%) $ 10 . 14 $487 $480 $465 $460 $457 $453 $432 4.8x $11.80 $11.66 $11.35 $11.24 $11.16 $11.09 $10.65 4.3x $10.72 $10.60 $10.32 $10.22 $10.16 $10.09 $9.69 1/31 close 3.8x $9.65 $9.54 $9.29 $9.20 $9.15 $9.09 $8.74 3.3x $8.57 $8.47 $8.26 $8.18 $8.13 $8.08 $7.77 $5.95 2.8x $7.48 $7.40 $7.22 $7.15 $7.11 $7.06 $6.80 $5.24 2.3x $6.39 $6.32 $6.17 $6.12 $6.08 $6.04 $5.83 Source(s): Company Filings, Management Estimates, Broker Research as of 1/31/2025. 1. Based on discussions with management. 19 (1) Illustrative Guidance (1) Restricted - External
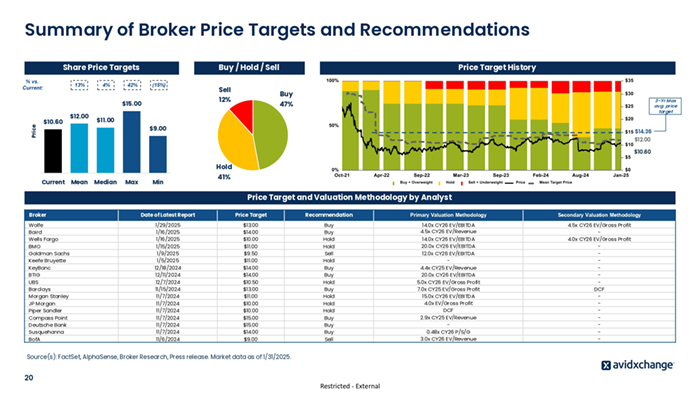
Summary of Broker Price Targets and Recommendations Share Price Targets % vs. Current: 13% 4% Buy / Hold / Sell 42% (15%) Price $12.00 Buy 12% $15.00 $10.60 Sell Price Target History 3-Yr Max avg. price target 47% $11.00 $9.00 $14.36 $12.00 $10.60 Hold Current Mean Median Max Min 41% Price Target and Valuation Methodology by Analyst Broker Wolfe Baird Wells Fargo BMO Goldman Sachs Keefe Bruyette KeyBanc BTIG UBS Barclays Morgan Stanley JP Morgan Piper Sandler Compass Point Deutsche Bank Susquehanna BofA Date of Latest Report Price Target Recommendation Primary Valuation Methodology Secondary Valuation Methodology 1/29/2025 1/16/2025 1/16/2025 1/15/2025 1/9/2025 1/5/2025 12/18/2024 12/11/2024 12/7/2024 11/15/2024 11/7/2024 11/7/2024 11/7/2024 11/7/2024 11/7/2024 11/7/2024 11/6/2024 $13.00 $14.00 $10.00 $11.00 $9.50 $11.00 $14.00 $14.00 $10.50 $13.00 $11.00 $10.00 $10.00 $15.00 $15.00 $14.00 $9.00 Buy Buy Hold Hold Sell Hold Buy Buy Hold Buy Hold Hold Hold Buy Buy Buy Sell 14.0x CY26 EV/EBITDA 4.5x CY26 EV/Revenue 4.5x CY26 EV/Gross Profit 4.0x CY26 EV/Gross Profit DCF - Source(s): FactSet, AlphaSense, Broker Research, Press release. Market data as of 1/31/2025. 20 Restricted - External 14.0x CY26 EV/EBITDA 20.0x CY26 EV/EBITDA 12.0x CY26 EV/EBITDA 4.4x CY25 EV/Revenue 20.0x CY26 EV/EBITDA 5.0x CY26 EV/Gross Profit 7.0x CY25 EV/Gross Profit 15.0x CY26 EV/EBITDA 4.0x EV/Gross Profit DCF 2.9x CY25 EV/Revenue 0.48x CY26 P/S/G 3.0x CY26 EV/Revenue
Disclaimer The following pages contain material that was provided to the Board of Directors (the “Board”) of Virgil (the “Company”) by Barclays Capital Inc. (“Barclays”). The accompanying material and any Barclays presentation related to the material was compiled or prepared on a confidential basis solely for consideration by the Board and no part of it may be reproduced, distributed or transmitted without the prior written consent of Barclays. The information contained in this material was obtained from the Company[, the counterparty] and/or publicly available sources, and Barclays has relied upon such information without independent verification thereof and does not assume any liability for any such information. These materials are being provided in connection with an actual corporate engagement and may not be used or relied upon for any purpose other than as specifically contemplated by a written agreement with Barclays. Moreover, any information provided herein was not prepared for or intended for use by any individual for personal, family or household purposes. Any estimates, historical financial information, projections and other information contained herein have been prepared by management of the Company [and/or the counterparty, third party experts] or were obtained from publicly available sources (approved for Barclays’ use by the Company) or are based upon such estimates and projections. With respect to such estimates and projections, Barclays has assumed that they have been reasonably prepared on a basis reflecting the best currently available estimates, projections and judgment of the management of the Company [and/or the counterparty, third party experts]. The projections contained herein may or may not be achieved and differences between projected results and those actually achieved may be material. No representation or warranty, expressed or implied, is made as to the accuracy or completeness of such information and nothing contained herein is, or shall be relied upon as, a promise or representation, whether as to the past or the future. The analysis contained herein is based on current market conditions which are subject to change and Barclays assumes no obligation to update or otherwise revise these materials. Nothing in these materials shall be deemed to constitute a recommendation or investment, legal, tax, financial, accounting or other advice. Because these materials were prepared for use in the context of a presentation to the Board, these materials are incomplete without reference to, and should be assessed solely in conjunction with, the oral briefing provided by Barclays to the Board (in their capacity as directors and not in any individual capacity and is not for the benefit of any individual, including any individual officer, director, shareholder or any other person). These materials were not prepared for or intended for use by any individual for personal, family or household purposes nor were they prepared to comply with the disclosure standards under state and federal securities laws or any other applicable laws and, to the extent the material may be considered by readers not as familiar with the business and affairs of the Company as the Board, none of the Company, Barclays, their respective affiliates or any of their respective legal or financial advisors or accountants takes any responsibility for the accuracy or completeness of any of the material if used by persons other than the Board. These materials are not intended to provide the sole basis for evaluation of the proposed corporate transaction and do not purport to contain all information that may be required and should not be considered a recommendation with respect to the proposed corporate transaction. Barclays has not made or obtained any evaluations or appraisals of the assets or liabilities of the Company or any other party to any corporate transaction or any of their respective affiliates and has no obligation to evaluate the solvency of the Company or any other party to any transaction under any state or federal laws relating to bankruptcy, insolvency or similar matters. The analyses contained herein do not purport to be appraisals nor do they necessarily reflect the prices at which businesses or securities actually may be sold or purchased. Barclays’ role in any due diligence review is limited solely to performing such a review as it shall deem necessary to support its own advice and analysis and shall not be on behalf of the Company, the Board or any individual officer, director, shareholder or any other person. Barclays, its subsidiaries and affiliates engage in a wide range of businesses from investment and commercial banking, lending, asset management and other financial and non-financial services. In the ordinary course of its business, Barclays and its affiliates may actively trade and effect transactions in the equity, debt and/or other securities (and any derivatives thereof) and financial instruments (including loans and other obligations) of the Company [and [the counterparty]] for its own account and for the accounts of its customers and, accordingly, may at any time hold long or short positions and investments in such securities and financial instruments or in other financial products and instruments. Unless otherwise expressly agreed or provided for in other applicable Barclays disclosures governing such corporate transactions or required by law or regulation, Barclays conducts these activities as principal and executes its principal transactions as an arm’s length counterparty. Barclays does not act as a fiduciary in relation to these corporate transactions. These materials do not constitute investment advice nor do they form part of an offer to sell or purchase, or the solicitation of an offer to sell or purchase, any securities or any of the businesses or assets described herein or an offer of financing or an offer or recommendation to enter into any corporate transaction described herein. Barclays Capital Inc. is the United States investment bank of Barclays Bank PLC. Barclays Bank PLC is authorised by the Prudential Regulation Authority and regulated by the Financial Conduct Authority and the Prudential Regulation Authority (Financial Services Register No. 122702). Registered in England. Registered No. 1026167. Registered office: 1 Churchill Place, London E14 5HP. Neither Barclays Bank PLC, New York Branch nor Barclays Bank Delaware is responsible for the obligations of its affiliates. Copyright Barclays Bank PLC, 2025 (all rights reserved). Restricted - External