
Exhibit (c)(8)
Used: 3/26/2025 Project Virgil March 2025
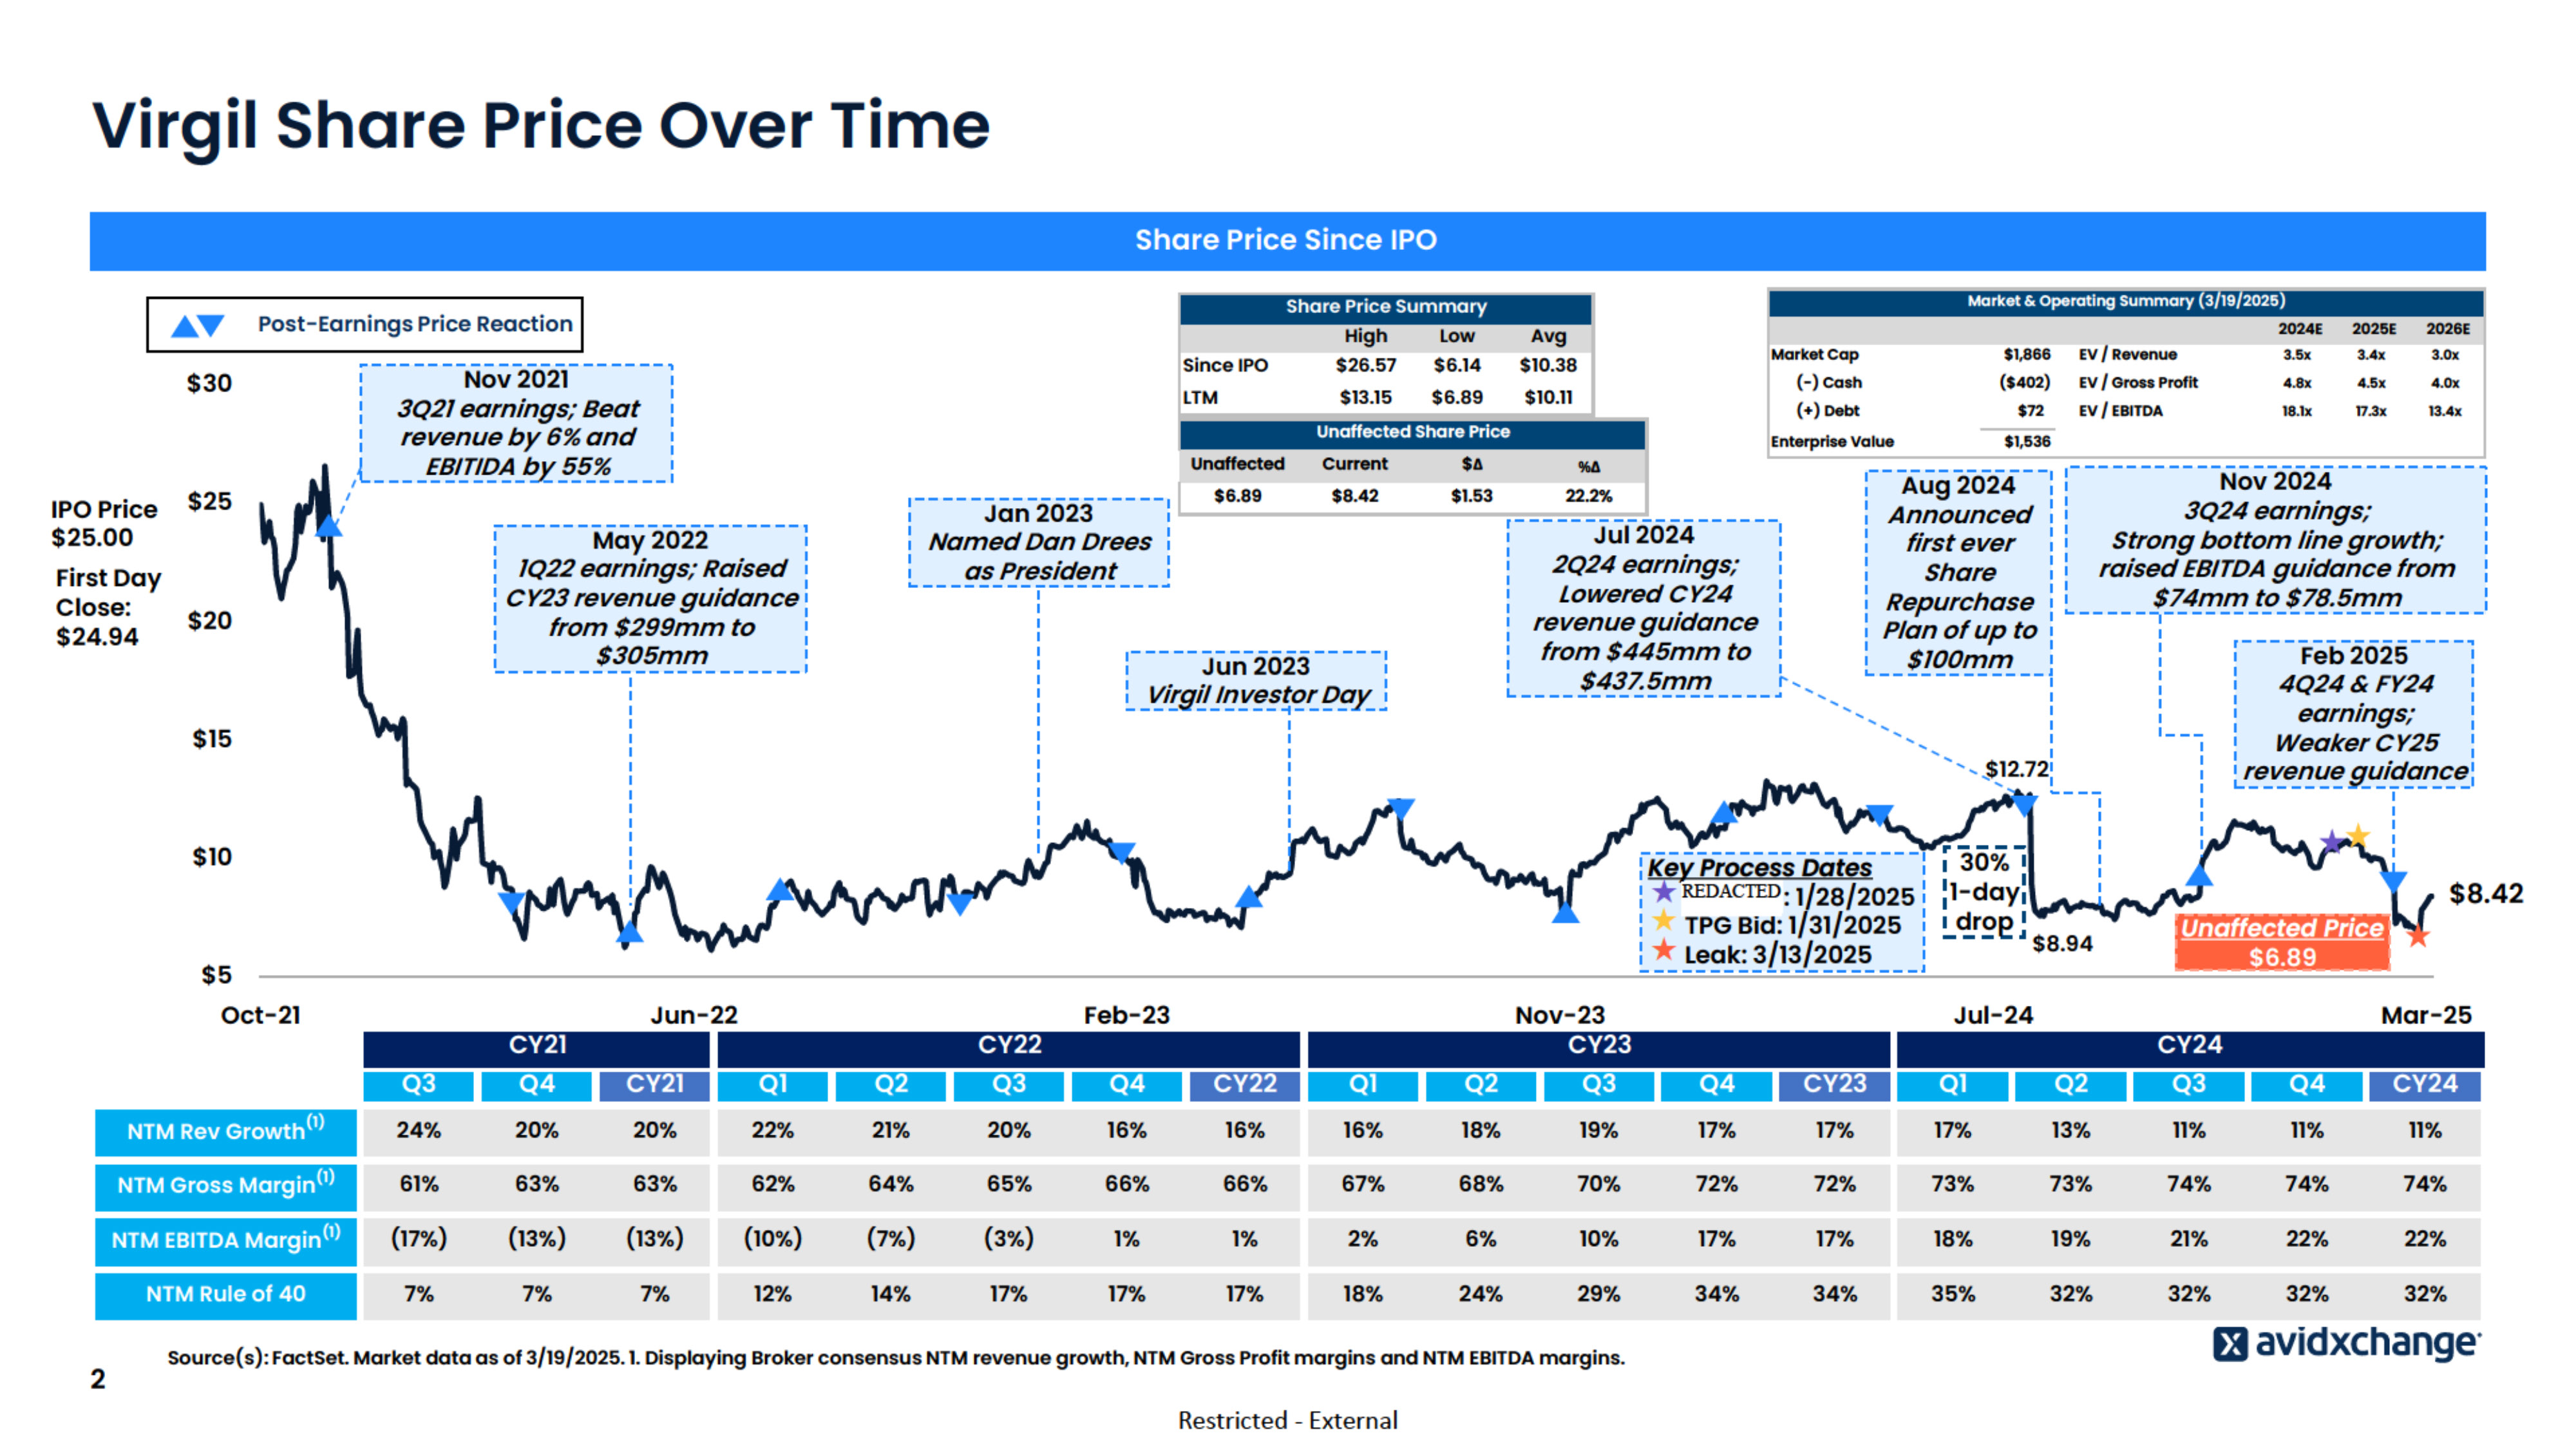
Virgil Share Price Over Time Share Price Since IPO IPO Price $25.00 First Day Close: $24.94 Since IPO Nov 2021 $30 LTM 3Q21 earnings; Beat revenue by 6% and EBITIDA by 55% High Low Avg $26.57 $6.14 $10.38 $13.15 $6.89 $10.11 Unaffected Share Price $25 Jan 2023 May 2022 Unaffected Current $∆ %∆ $6.89 $8.42 $1.53 22.2% 2024E 2025E Market Cap $1,866 EV / Revenue 3.5x 3.4x 3.0x (-) Cash ($402) EV / Gross Profit 4.8x 4.5x 4.0x EV / EBITDA 18.1x 17.3x 13.4x (+) Debt $72 Enterprise Value $1,536 2Q24 earnings; Lowered CY24 revenue guidance from $445mm to $437.5mm Jun 2023 Virgil Investor Day $15 Key Process Dates Bain Bid: 1/28/2025 TPG Bid: 1/31/2025 Leak: 3/13/2025 $5 Oct-21 CY21 Feb 2025 4Q24 & FY24 earnings; Weaker CY25 revenue guidance Jun-22 CY22 Feb-23 Nov-23 CY23 30% 1-day drop $8.94 Jul-24 $8.42 Unaffected Price $6.89 Mar-25 CY24 Q3 Q4 CY21 Q1 Q2 Q3 Q4 CY22 Q1 Q2 Q3 Q4 CY23 Q1 Q2 Q3 Q4 CY24 NTM Rev Growth (1) 24% 20% 20% 22% 21% 20% 16% 16% 16% 18% 19% 17% 17% 17% 13% 11% 11% 11% NTM Gross Margin(1) 61% 63% 63% 62% 64% 65% 66% 66% 67% 68% 70% 72% 72% 73% 73% 74% 74% 74% (1) (17%) (13%) (13%) (10%) (7%) (3%) 1% 1% 2% 6% 10% 17% 17% 18% 19% 21% 22% 22% 7% 7% 7% 12% 14% 17% 17% 17% 18% 24% 29% 34% 34% 35% 32% 32% 32% 32% NTM EBITDA Margin NTM Rule of 40 2 3Q24 earnings; Strong bottom line growth; raised EBITDA guidance from $74mm to $78.5mm $12.72 $10 2026E Nov 2024 Aug 2024 Announced first ever Share Repurchase Plan of up to $100mm Jul 2024 Named Dan Drees as President 1Q22 earnings; Raised CY23 revenue guidance from $299mm to $305mm $20 Market & Operating Summary (3/19/2025) Share Price Summary Post-Earnings Price Reaction Source(s): FactSet. Market data as of 3/19/2025. 1. Displaying Broker consensus NTM revenue growth, NTM Gross Profit margins and NTM EBITDA margins. Restricted - External
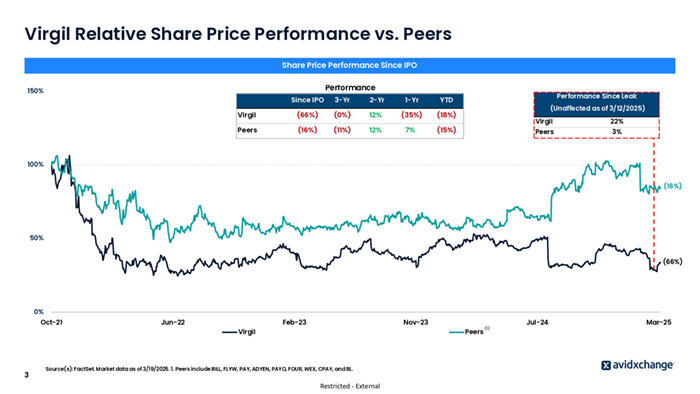
Virgil Relative Share Price Performance vs. Peers Share Price Performance Since IPO Performance 150% Since IPO 3-Yr 2-Yr 1-Yr YTD Virgil (66%) (0%) 12% (35%) (18%) Peers (16%) (11%) 12% 7% (15%) Performance Since Leak (Unaffected as of 3/12/2025) Virgil 22% Peers 3% 100% (16%) 50% (66%) 0% Oct-21 Jun-22 Feb-23 Nov-23 Virgil 3 Peers Source(s): FactSet. Market data as of 3/19/2025. 1. Peers include BILL, FLYW, PAY, ADYEN, PAYO, FOUR, WEX, CPAY, and BL. Restricted - External (1) Jul-24 Mar-25
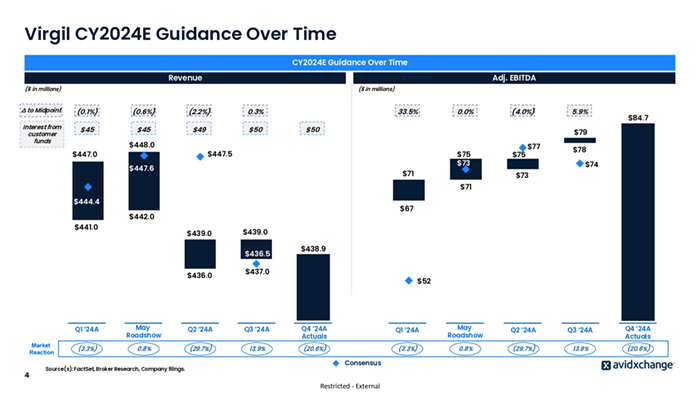
Virgil CY2024E Guidance Over Time CY2024E Guidance Over Time Revenue Adj. EBITDA ($ in millions) ($ in millions) ($ in millions) ∆ to Midpoint (0.1%) (0.6%) (2.2%) 0.3% Interest from customer funds $45 $45 $49 $50 $447.0 $448.0 33.5% 0.0% (4.0%) $50 5.9% $84.7 $79 $447.5 $75 $73 $447.6 $71 $75 $77 $78 $74 $73 $71 $444.4 $67 $442.0 $441.0 $439.0 $439.0 $436.5 $436.0 Market Reaction 4 $438.9 $437.0 $52 Q1 ‘24A May Roadshow Q2 ‘24A Q3 ‘24A Q4 ‘24A Actuals Q1 ‘24A May Roadshow Q2 ‘24A Q3 ‘24A Q4 ‘24A Actuals (3.3%) 0.8% (29.7%) 13.9% (20.6%) (3.3%) 0.8% (29.7%) 13.9% (20.6%) Source(s): FactSet, Broker Research, Company filings. Consensus Restricted - External
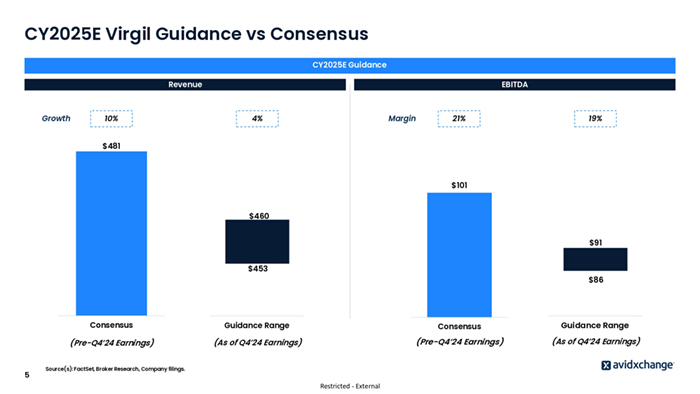
CY2025E Virgil Guidance vs Consensus CY2025E Guidance Revenue Growth 10% EBITDA 4% Margin 21% 19% $481 $101 $460 $91 $453 $86 5 Consensus Guidance Range Consensus Guidance Range (Pre-Q4’24 Earnings) (As of Q4’24 Earnings) (Pre-Q4’24 Earnings) (As of Q4’24 Earnings) Source(s): FactSet, Broker Research, Company filings. Restricted - External
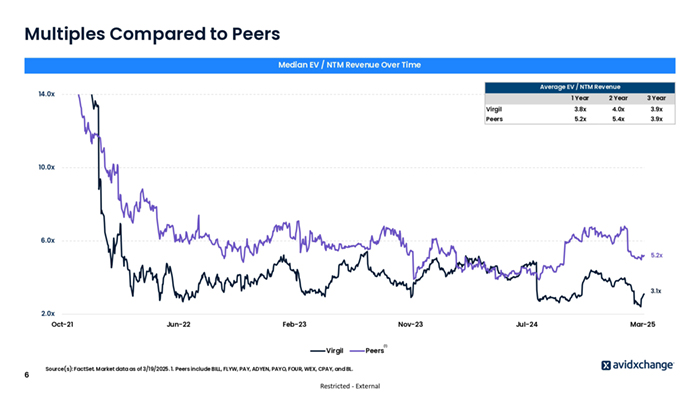
Multiples Compared to Peers Median EV / NTM Revenue Over Time Average EV / NTM Revenue 14.0x 1 Year 2 Year 3 Year Virgil 3.8x 4.0x 3.9x Peers 5.2x 5.4x 3.9x 10.0x 6.0x 5.2x 3.1x 2.0x Oct-21 Jun-22 Feb-23 Nov-23 Virgil 6 (1) Peers Source(s): FactSet. Market data as of 3/19/2025. 1. Peers include BILL, FLYW, PAY, ADYEN, PAYO, FOUR, WEX, CPAY, and BL. Restricted - External Jul-24 Mar-25
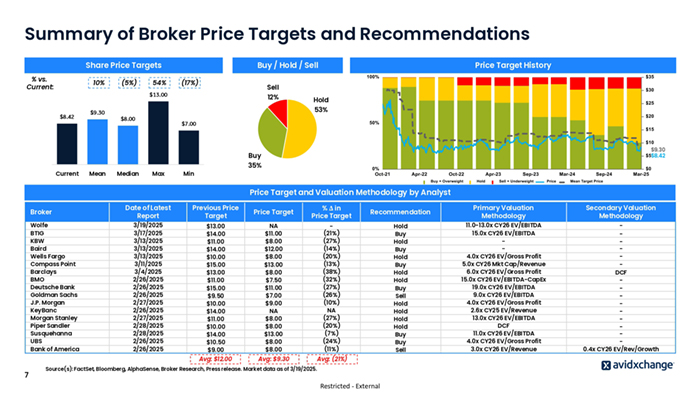
Summary of Broker Price Targets and Recommendations Share Price Targets % vs. Current: 10% (5%) 54% Buy / Hold / Sell (17%) Sell $13.00 $8.42 $9.30 Price Target History 12% Hold 53% $8.00 $7.00 $9.30 $8.42 Buy Current Mean Median Max 35% Min Price Target and Valuation Methodology by Analyst Broker Wolfe BTIG KBW Baird Wells Fargo Compass Point Barclays BMO Deutsche Bank Goldman Sachs J.P. Morgan KeyBanc Morgan Stanley Piper Sandler Susquehanna UBS Bank of America 7 Date of Latest Report Previous Price Target Price Target % Δ in Price Target Recommendation Primary Valuation Methodology Secondary Valuation Methodology 3/19/2025 3/17/2025 3/13/2025 3/13/2025 3/13/2025 3/11/2025 3/4/2025 2/26/2025 2/26/2025 2/26/2025 2/27/2025 2/26/2025 2/27/2025 2/28/2025 2/28/2025 2/26/2025 2/26/2025 $13.00 $14.00 $11.00 $14.00 $10.00 $15.00 $13.00 $11.00 $15.00 $9.50 $10.00 $14.00 $11.00 $10.00 $14.00 $10.50 $9.00 NA $11.00 $8.00 $12.00 $8.00 $13.00 $8.00 $7.50 $11.00 $7.00 $9.00 NA $8.00 $8.00 $13.00 $8.00 $8.00 (21%) (27%) (14%) (20%) (13%) (38%) (32%) (27%) (26%) (10%) NA (27%) (20%) (7%) (24%) (11%) Hold Buy Hold Buy Hold Buy Hold Hold Buy Sell Hold Hold Hold Hold Buy Buy Sell 11.0-13.0x CY26 EV/EBITDA 15.0x CY26 EV/EBITDA 4.0x CY26 EV/Gross Profit 5.0x CY26 Mkt Cap/Revenue 6.0x CY26 EV/Gross Profit 15.0x CY26 EV/EBITDA-CapEx 19.0x CY26 EV/EBITDA 9.0x CY26 EV/EBITDA 4.0x CY26 EV/Gross Profit 2.6x CY25 EV/Revenue 13.0x CY26 EV/EBITDA DCF 11.0x CY26 EV/EBITDA 4.0x CY26 EV/Gross Profit 3.0x CY26 EV/Revenue DCF 0.4x CY26 EV/Rev/Growth Avg: $12.00 Avg: $9.30 Avg: (21%) Source(s): FactSet, Bloomberg, AlphaSense, Broker Research, Press release. Market data as of 3/19/2025. Restricted - External
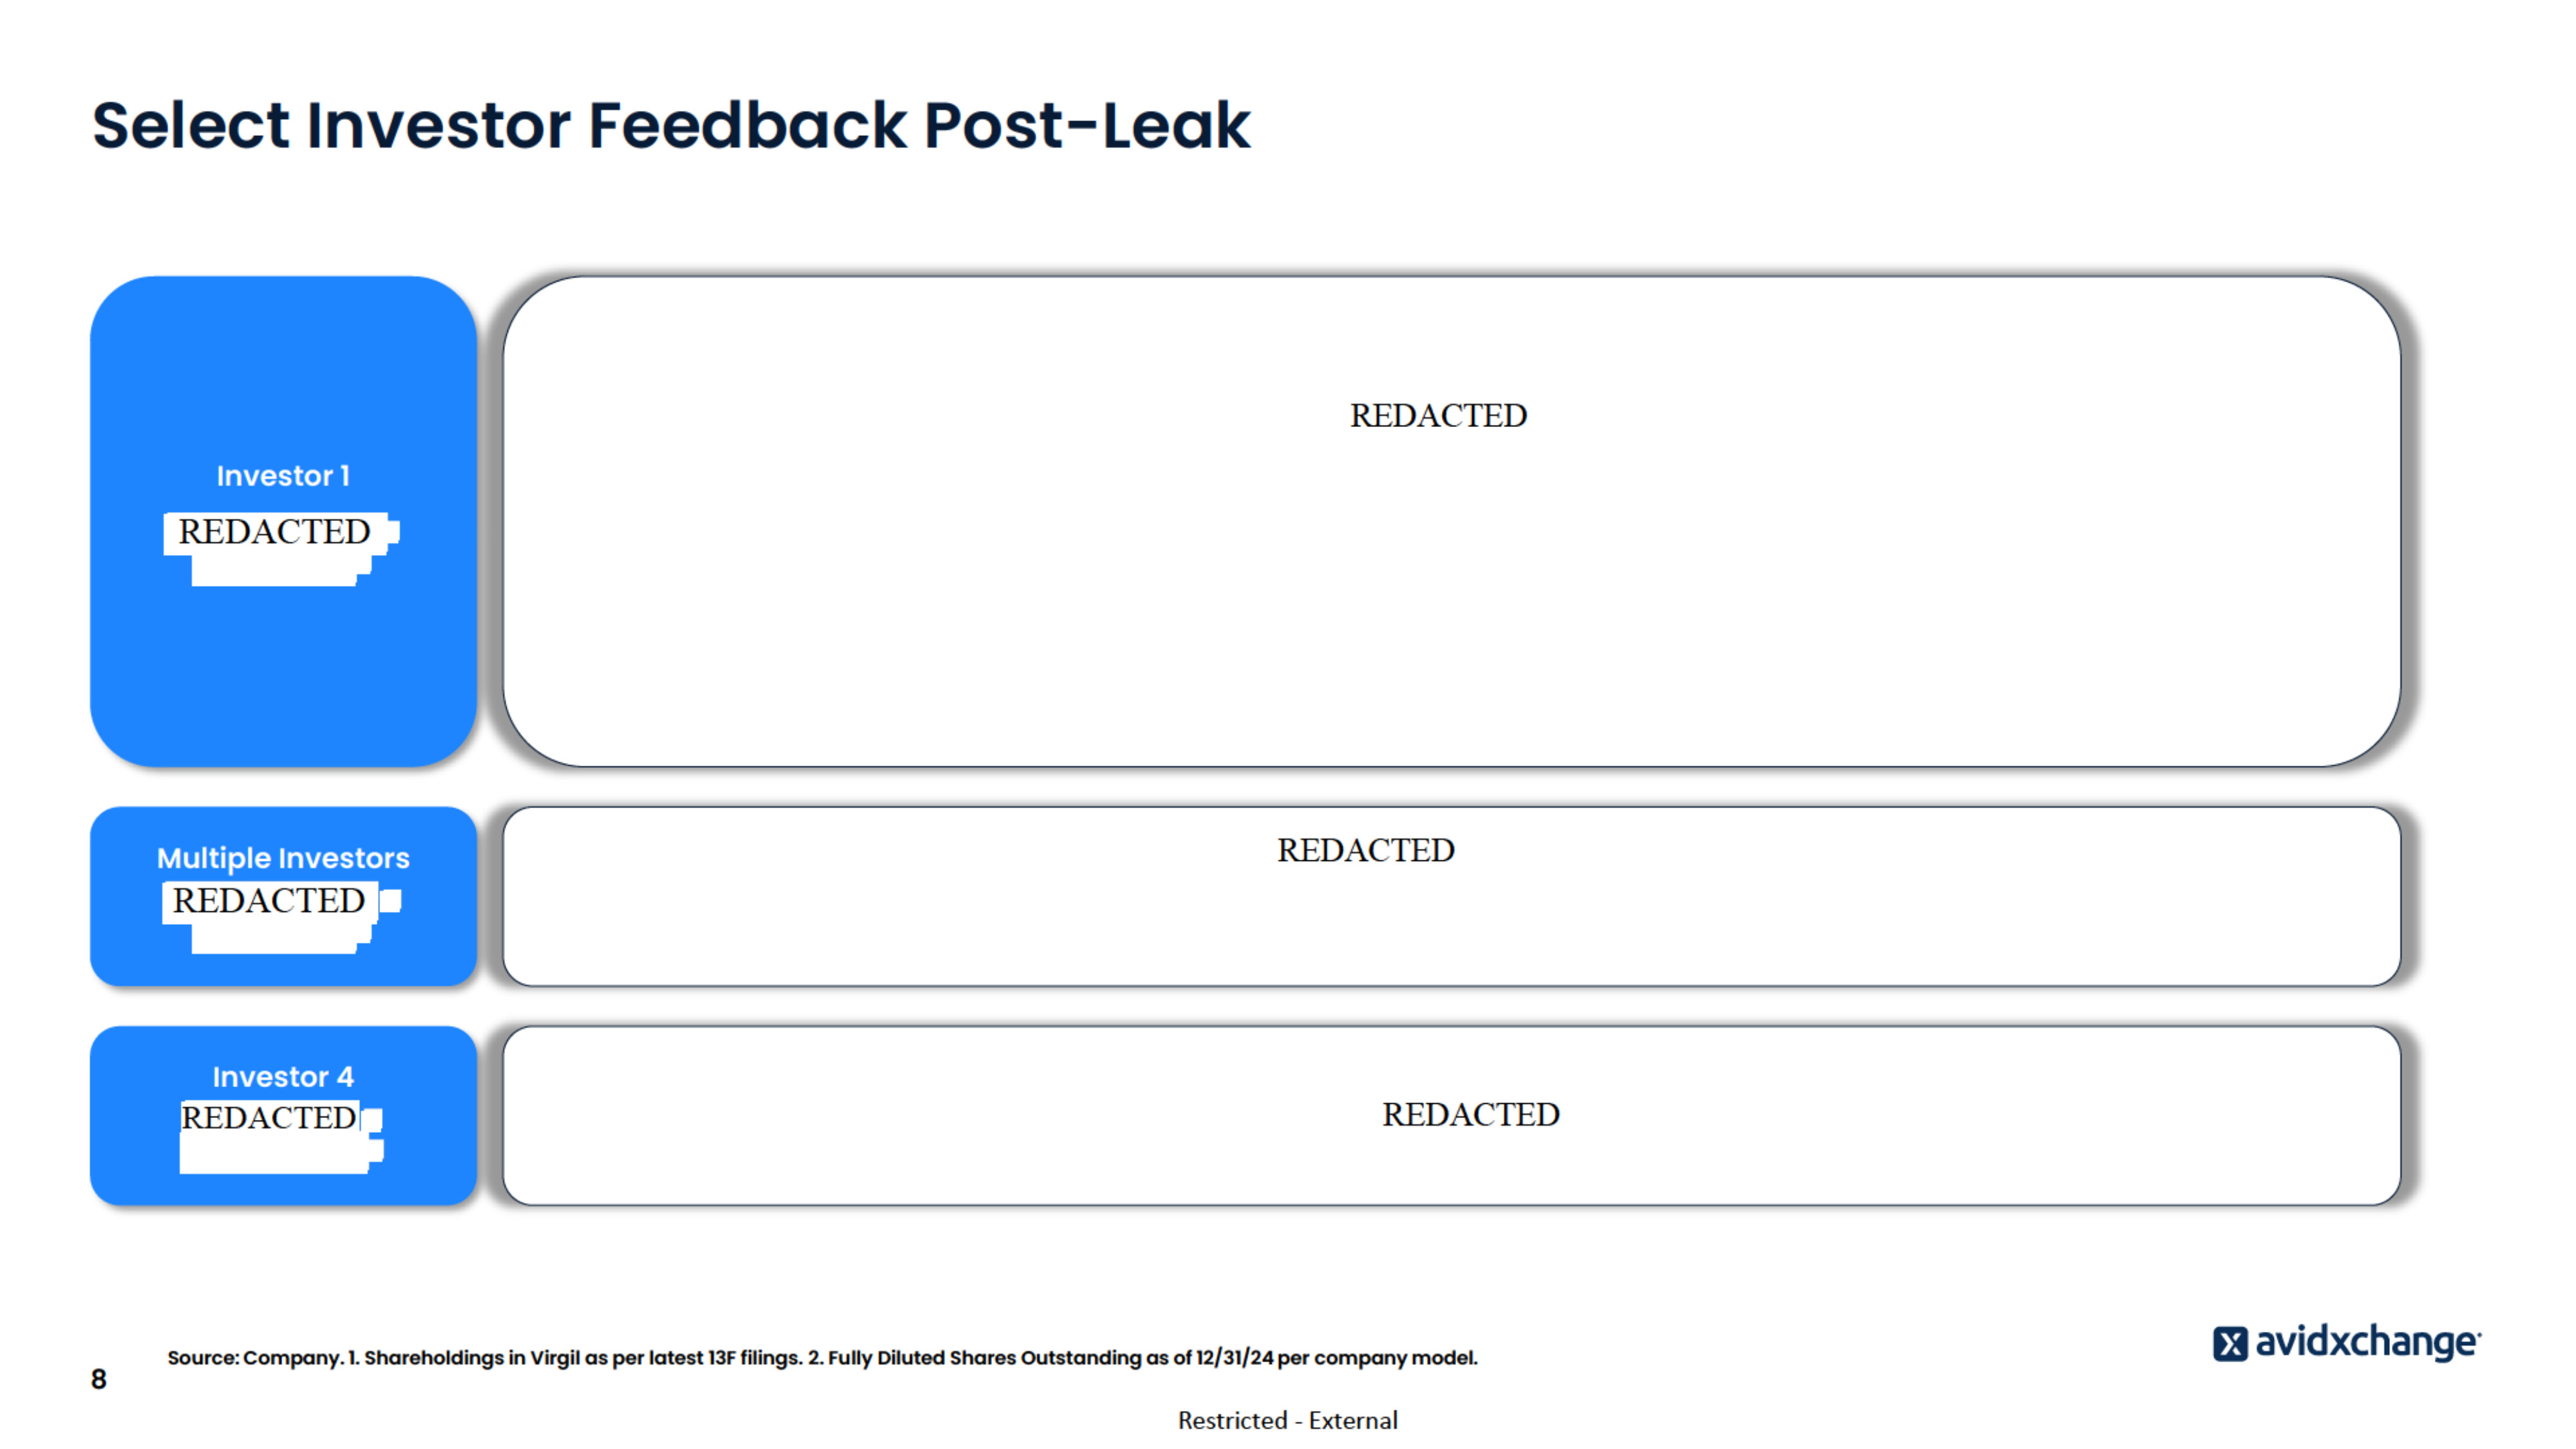
Select Investor Feedback Post-Leak Investor 1 10.7mm shares(1) 5% of Total(2) ● “If it were me, I would be looking to go private. But only if the sponsors would be more focused on exit multiple than near term cash generation.” ● “As such, while we wouldn’t view any price sub $10 as appropriate in a sale, something in the low doubles that discounts both the risks and the time it would take seems reasonable.” ● “… if you choose to remain independent, that would be a clear signal that you think value is underestimated. I’d personally like to see a significant buyback once your stock falls back to $6-7 where it probably goes in a “no-sale” scenario.” Multiple Investors ● Investor 2 (8.0mm shares, 4% of total) and Investor 3 (4.4mm shares, 2% of total) shared the same sentiment as Investor 1: 12.3mm shares (1) 6% of Total(2) ● “…while we wouldn’t view any price sub $10 as appropriate in a sale, something in the low doubles that discounts both the risks and the time it would take seems reasonable” Investor 4 690k shares (1) 0.3% of Total(2) 8 ● “... Don’t sell! Throwing a number out there but at least not for less than $12... public markets are short term stupid and long term efficient!” Source: Company. 1. Shareholdings in Virgil as per latest 13F filings. 2. Fully Diluted Shares Outstanding as of 12/31/24 per company model. Restricted - External
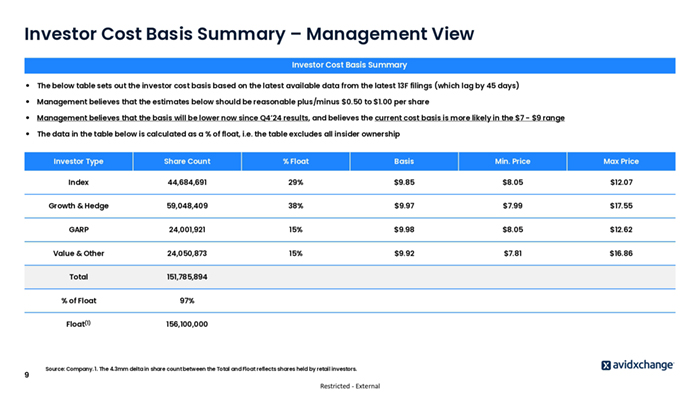
Investor Cost Basis Summary – Management View Investor Cost Basis Summary ● The below table sets out the investor cost basis based on the latest available data from the latest 13F filings (which lag by 45 days) ● Management believes that the estimates below should be reasonable plus/minus $0.50 to $1.00 per share ● Management believes that the basis will be lower now since Q4’24 results, and believes the current cost basis is more likely in the $7 - $9 range ● The data in the table below is calculated as a % of float, i.e. the table excludes all insider ownership 9 Investor Type Share Count % Float Basis Min. Price Max Price Index 44,684,691 29% $9.85 $8.05 $12.07 Growth & Hedge 59,048,409 38% $9.97 $7.99 $17.55 GARP 24,001,921 15% $9.98 $8.05 $12.62 Value & Other 24,050,873 15% $9.92 $7.81 $16.86 Total 151,785,894 % of Float 97% Float(1) 156,100,000 Source: Company. 1. The 4.3mm delta in share count between the Total and Float reflects shares held by retail investors. Restricted - External
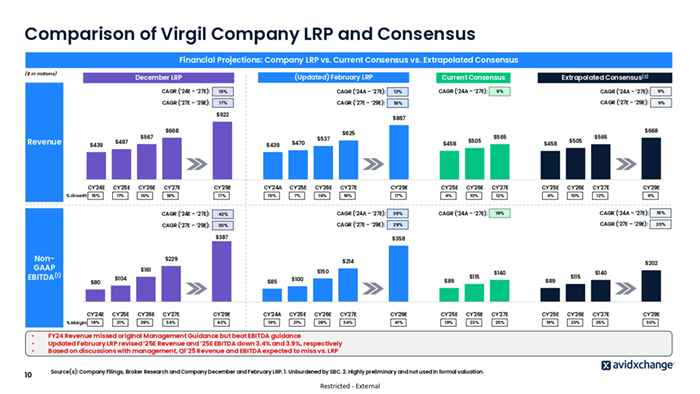
Comparison of Virgil Company LRP and Consensus Financial Projections: Company LRP vs. Current Consensus vs. Extrapolated Consensus ($ in millions) (Updated) February LRP December LRP CAGR (‘24E – ‘27E): 15% CAGR (‘24A – ‘27E): 12% CAGR (‘27E – ‘29E): 17% CAGR (‘27E – ‘29E): 18% $922 Revenue $439 CY’24E % Growth: 15% $487 $567 $668 $439 $470 $537 $625 $458 CY’24E • • • 10 CAGR (‘24A – ‘27E): 9% CAGR (‘27E – ‘29E): 9% $505 $565 $458 $505 $565 $668 CY’26E CY’27E CY’29E CY’24A CY’25E CY’26E CY’27E CY’29E CY’25E CY’26E CY’27E CY’25E CY’26E CY’27E CY’29E 11% 16% 18% 17% 15% 7% 14% 16% 17% 4% 10% 12% 4% 10% 12% 9% CAGR (‘24E – ‘27E): 42% CAGR (‘24A – ‘27E): 36% CAGR (‘27E – ‘29E): 30% CAGR (‘27E – ‘29E): 29% CAGR (‘24A – ‘27E): 18% CAGR (‘24A – ‘27E): 18% CAGR (‘27E – ‘29E): 20% $358 $214 $161 % Margin: 18% 9% CY’25E $229 $80 CAGR (‘24A – ‘27E): Extrapolated Consensus(2) $867 $387 NonGAAP EBITDA(1) Current Consensus $202 $150 $104 $85 $100 $89 $115 $140 $89 $115 $140 CY’25E CY’26E CY’27E CY’29E CY’24A CY’25E CY’26E CY’27E CY’29E CY’25E CY’26E CY’27E CY’25E CY’26E CY’27E CY’29E 21% 28% 34% 42% 19% 21% 28% 34% 41% 19% 23% 25% 19% 23% 25% 30% FY24 Revenue missed original Management Guidance but beat EBITDA guidance Updated February LRP revised ‘25E Revenue and ‘25E EBITDA down 3.4% and 3.9%, respectively Based on discussions with management, Q1’25 Revenue and EBITDA expected to miss vs. LRP Source(s): Company Filings, Broker Research and Company December and February LRP. 1. Unburdened by SBC. 2. Highly preliminary and not used in formal valuation. Restricted - External
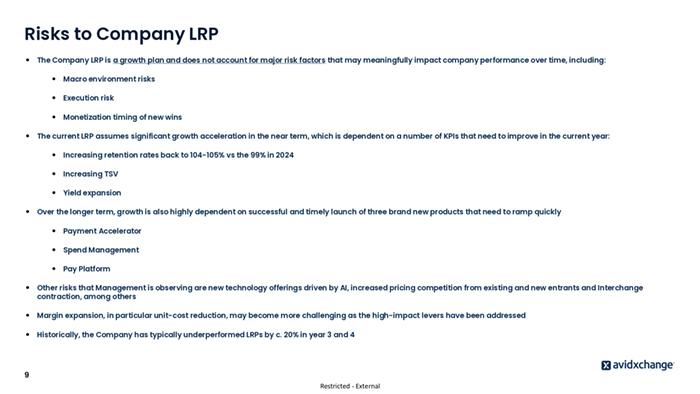
Risks to Company LRP ● The Company LRP is a growth plan and does not account for major risk factors that may meaningfully impact company performance over time, including: ● Macro environment risks ● Execution risk ● Monetization timing of new wins The current LRP assumes significant growth acceleration in the near term, which is dependent on a number of KPIs that need to improve in the current year: ● Increasing retention rates back to 104-105% vs the 99% in 2024 ● Increasing TSV ● Yield expansion Over the longer term, growth is also highly dependent on successful and timely launch of three brand new products that need to ramp quickly ● Payment Accelerator ● Spend Management ● Pay Platform ● Other risks that Management is observing are new technology offerings driven by AI, increased pricing competition from existing and new entrants and Interchange contraction, among others ● Margin expansion, in particular unit-cost reduction, may become more challenging as the high-impact levers have been addressed ● Historically, the Company has typically underperformed LRPs by c. 20% in year 3 and 4 9 Restricted - External
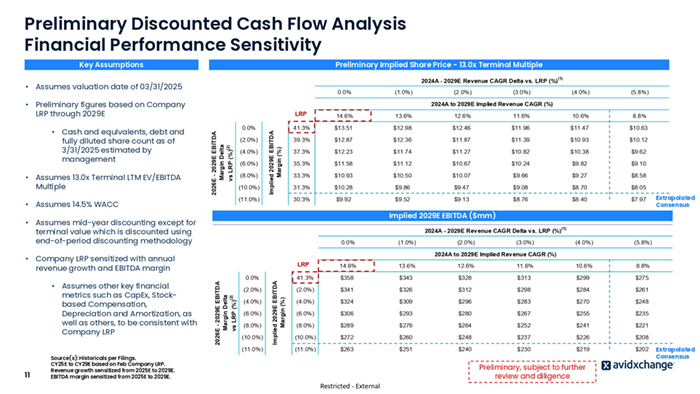
Preliminary Discounted Cash Flow Analysis Financial Performance Sensitivity Key Assumptions Preliminary Implied Share Price - 13.0x Terminal Multiple 2024A - 2029E Revenue CAGR Delta vs. LRP (%) • Assumes valuation date of 03/31/2025 0.0% • Preliminary figures based on Company LRP through 2029E • Assumes 14.5% WACC 0.0% (2.0%) (4.0%) (6.0%) (8.0%) (10.0%) Implied 2029E EBITDA Margin (%) • Assumes 13.0x Terminal LTM EV/EBITDA Multiple (11.0%) (4.0%) (5.8%) 14.6% 13.6% 12.6% 11.6% 10.6% 8.8% 41.3% $13.51 $12.98 $12.46 $11.96 $11.47 $10.63 39.3% $12.87 $12.36 $11.87 $11.39 $10.93 $10.12 37.3% $12.23 $11.74 $11.27 $10.82 $10.38 $9.62 35.3% $11.58 $11.12 $10.67 $10.24 $9.82 $9.10 33.3% $10.93 $10.50 $10.07 $9.66 $9.27 $8.58 31.3% $10.28 $9.86 $9.47 $9.08 $8.70 $8.05 30.3% $9.92 $9.52 $9.13 $8.76 $8.40 $7.97 (4.0%) (5.8%) Extrapolated Consensus Implied 2029E EBITDA ($mm) 2024A - 2029E Revenue CAGR Delta vs. LRP (%) 0.0% (1.0%) (2.0%) (3.0%) (1) 2024A to 2029E Implied Revenue CAGR (%) 0.0% (2.0%) (4.0%) (6.0%) (8.0%) (10.0%) (11.0%) Implied 2029E EBITDA Margin (%) 2026E - 2029E EBITDA Margin Delta vs LRP (%)(2) • Company LRP sensitized with annual revenue growth and EBITDA margin 11 (3.0%) LRP • Assumes mid-year discounting except for terminal value which is discounted using end-of-period discounting methodology • Assumes other key financial metrics such as CapEx, Stockbased Compensation, Depreciation and Amortization, as well as others, to be consistent with Company LRP (2.0%) 2024A to 2029E Implied Revenue CAGR (%) 2026E - 2029E EBITDA Margin Delta vs LRP (%)(2) • Cash and equivalents, debt and fully diluted share count as of 3/31/2025 estimated by management (1.0%) (1) LRP 14.6% 13.6% 12.6% 11.6% 10.6% 8.8% 41.3% $358 $343 $328 $313 $299 $275 (2.0%) $341 $326 $312 $298 $284 $261 (4.0%) $324 $309 $296 $283 $270 $248 (6.0%) $306 $293 $280 $267 $255 $235 (8.0%) $289 $276 $264 $252 $241 $221 (10.0%) $272 $260 $248 $237 $226 $208 (11.0%) $263 $251 $240 $230 $219 $202 Source(s): Historicals per Filings. CY25E to CY29E based on Feb Company LRP. Revenue growth sensitized from 2025E to 2029E. EBITDA margin sensitized from 2025E to 2029E. Restricted - External Preliminary, subject to further review and diligence Extrapolated Consensus
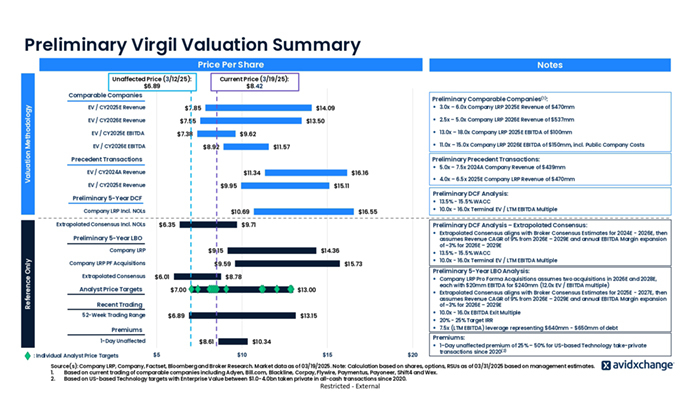
Preliminary Virgil Valuation Summary Price Per Share Unaffected Price (3/12/25): $6.89 Notes Current Price (3/19/25): $8.42 Valuation Methodology Comparable Companies Comparable Companies Preliminary Comparable Companies(1): EV / CY2025E Revenue $7.85 EV / CY2026E Revenue $7.55 EV / CY2025E EBITDA $7.38 EV / CY2026E EBITDA ● 3.0x – 6.0x Company LRP 2025E Revenue of $470mm $14.09 ● 2.5x – 5.0x Company LRP 2026E Revenue of $537mm $13.50 ● 13.0x – 18.0x Company LRP 2025E EBITDA of $100mm $9.62 $8.92 ● 11.0x – 15.0x Company LRP 2026E EBITDA of $150mm, incl. Public Company Costs $11.57 Precedent Transactions Precedent Transactions Preliminary Precedent Transactions: EV / CY2024A Revenue $11.34 EV / CY2025E Revenue ● 5.0x – 7.5x 2024A Company Revenue of $439mm $16.16 $9.95 ● 4.0x – 6.5x 2025E Company LRP Revenue of $470mm $15.11 Preliminary DCF Analysis: DCF (Terminal Multiple) Preliminary 5-Year DCF ● 13.5% - 15.5% WACC Company LRP Incl. NOLs Extrapolated Consensus Incl. NOLs $10.69 $6.35 ● 10.0x - 16.0x Terminal EV / LTM EBITDA Multiple $16.55 $9.71 Preliminary DCF Analysis – Extrapolated Consensus: ● Extrapolated Consensus aligns with Broker Consensus Estimates for 2024E - 2026E, then assumes Revenue CAGR of 9% from 2026E – 2029E and annual EBITDA Margin expansion of ~3% for 2026E – 2029E LBO Preliminary 5-Year LBO Reference Only Company LRP $9.15 Company LRP PF Acquisitions Extrapolated Consensus $14.36 $9.59 $6.01 Analyst Price Targets Analyst Price Targets ● 13.5% - 15.5% WACC ● 10.0x - 16.0x Terminal EV / LTM EBITDA Multiple $15.73 Preliminary 5-Year LBO Analysis: $8.78 $7.00 $13.00 $6.89 $13.15 ● Company LRP Pro Forma Acquisitions assumes two acquisitions in 2026E and 2028E, each with $20mm EBITDA for $240mm (12.0x EV / EBITDA multiple) ● Extrapolated Consensus aligns with Broker Consensus Estimates for 2025E - 2027E, then assumes Revenue CAGR of 9% from 2026E – 2029E and annual EBITDA Margin expansion of ~3% for 2026E – 2029E ● 10.0x - 16.0x EBITDA Exit Multiple ● 20% - 25% Target IRR ● 7.5x (LTM EBITDA) leverage representing $640mm - $650mm of debt Recent Trading Recent Trading 52-Week Trading Range Premiums Premiums 1-Day Unaffected : Individual Analyst Price Targets $8.61 $5 Premiums: $10.34 $10 $15 $20 ● 1–Day unaffected premium of 25% – 50% for US-based Technology take-private transactions since 2020(2) Source(s): Company LRP, Company, Factset, Bloomberg and Broker Research. Market data as of 03/19/2025. Note: Calculation based on shares, options, RSUs as of 03/31/2025 based on management estimates. 1. Based on current trading of comparable companies including Adyen, Bill.com, Blackline, Corpay, Flywire, Paymentus, Payoneer, Shift4 and Wex. 2. Based on US-based Technology targets with Enterprise Value between $1.0-4.0bn taken private in all-cash transactions since 2020. Restricted - External
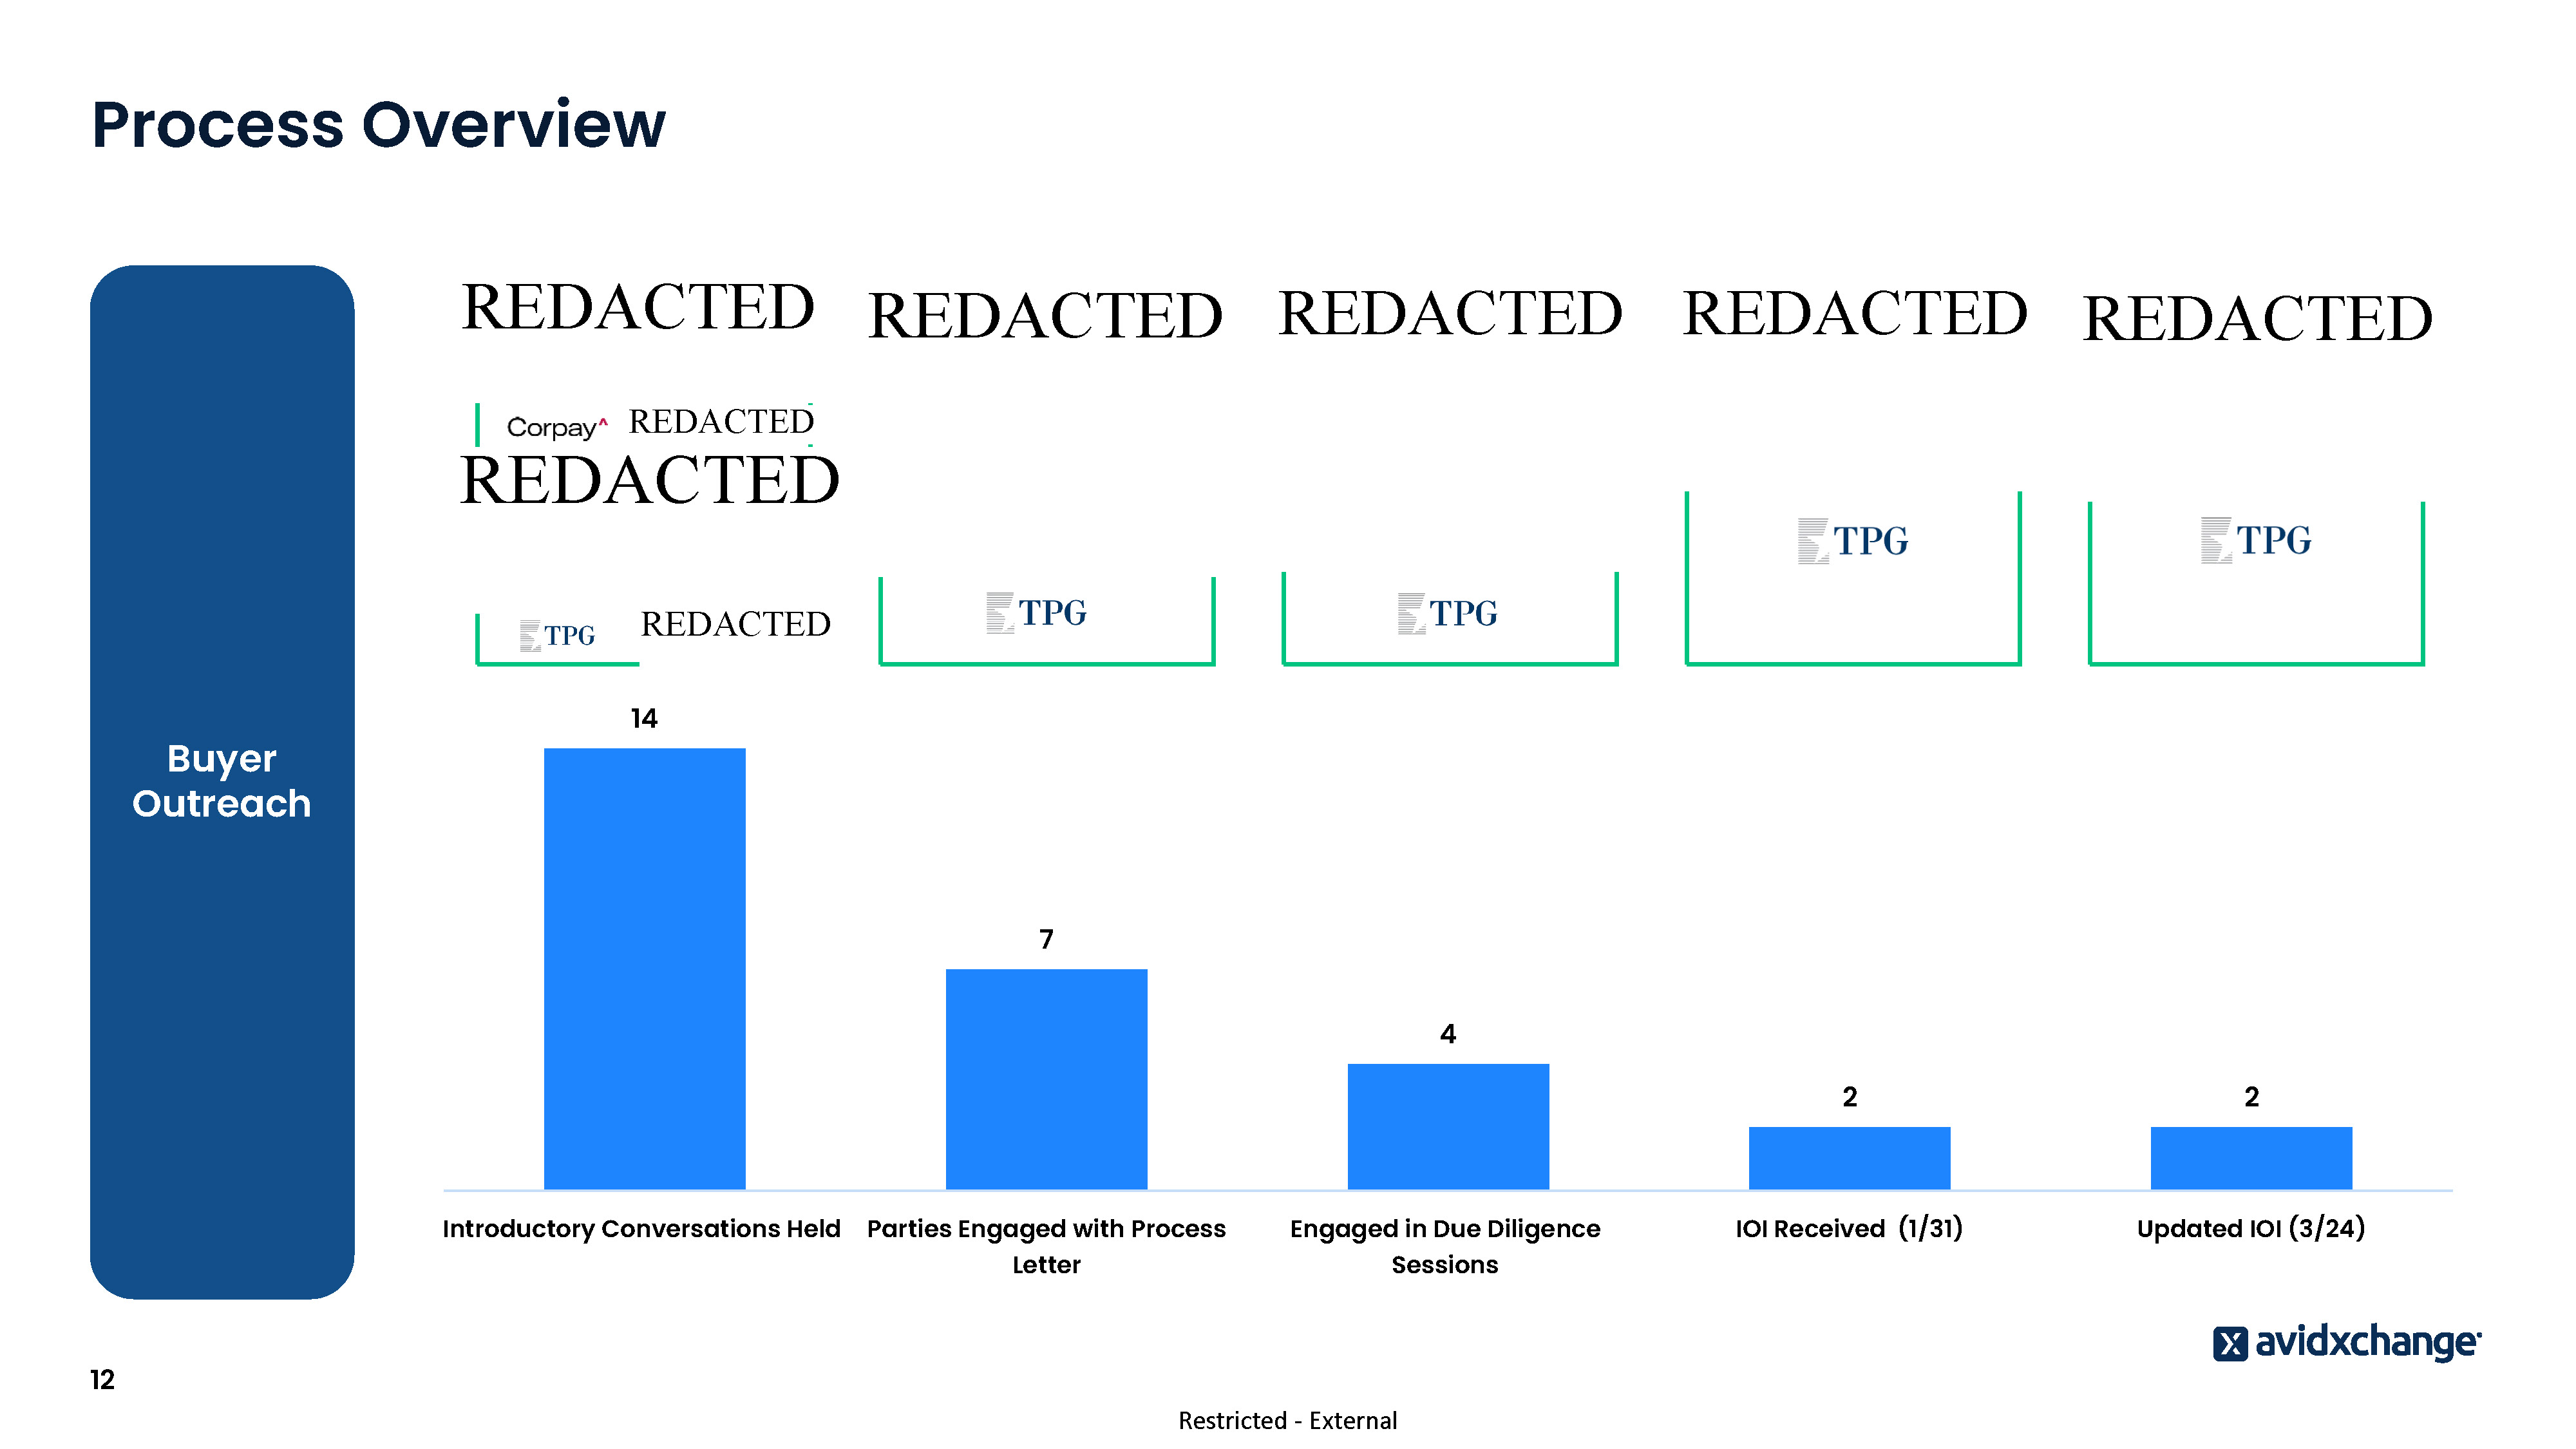
Process Overview Buyer Outreach 14 7 4 Introductory Conversations Held Parties Engaged with Process Engaged in Due Diligence Letter Sessions 12 Restricted - External 2 2 IOI Received (1/31) Updated IOI (3/24)
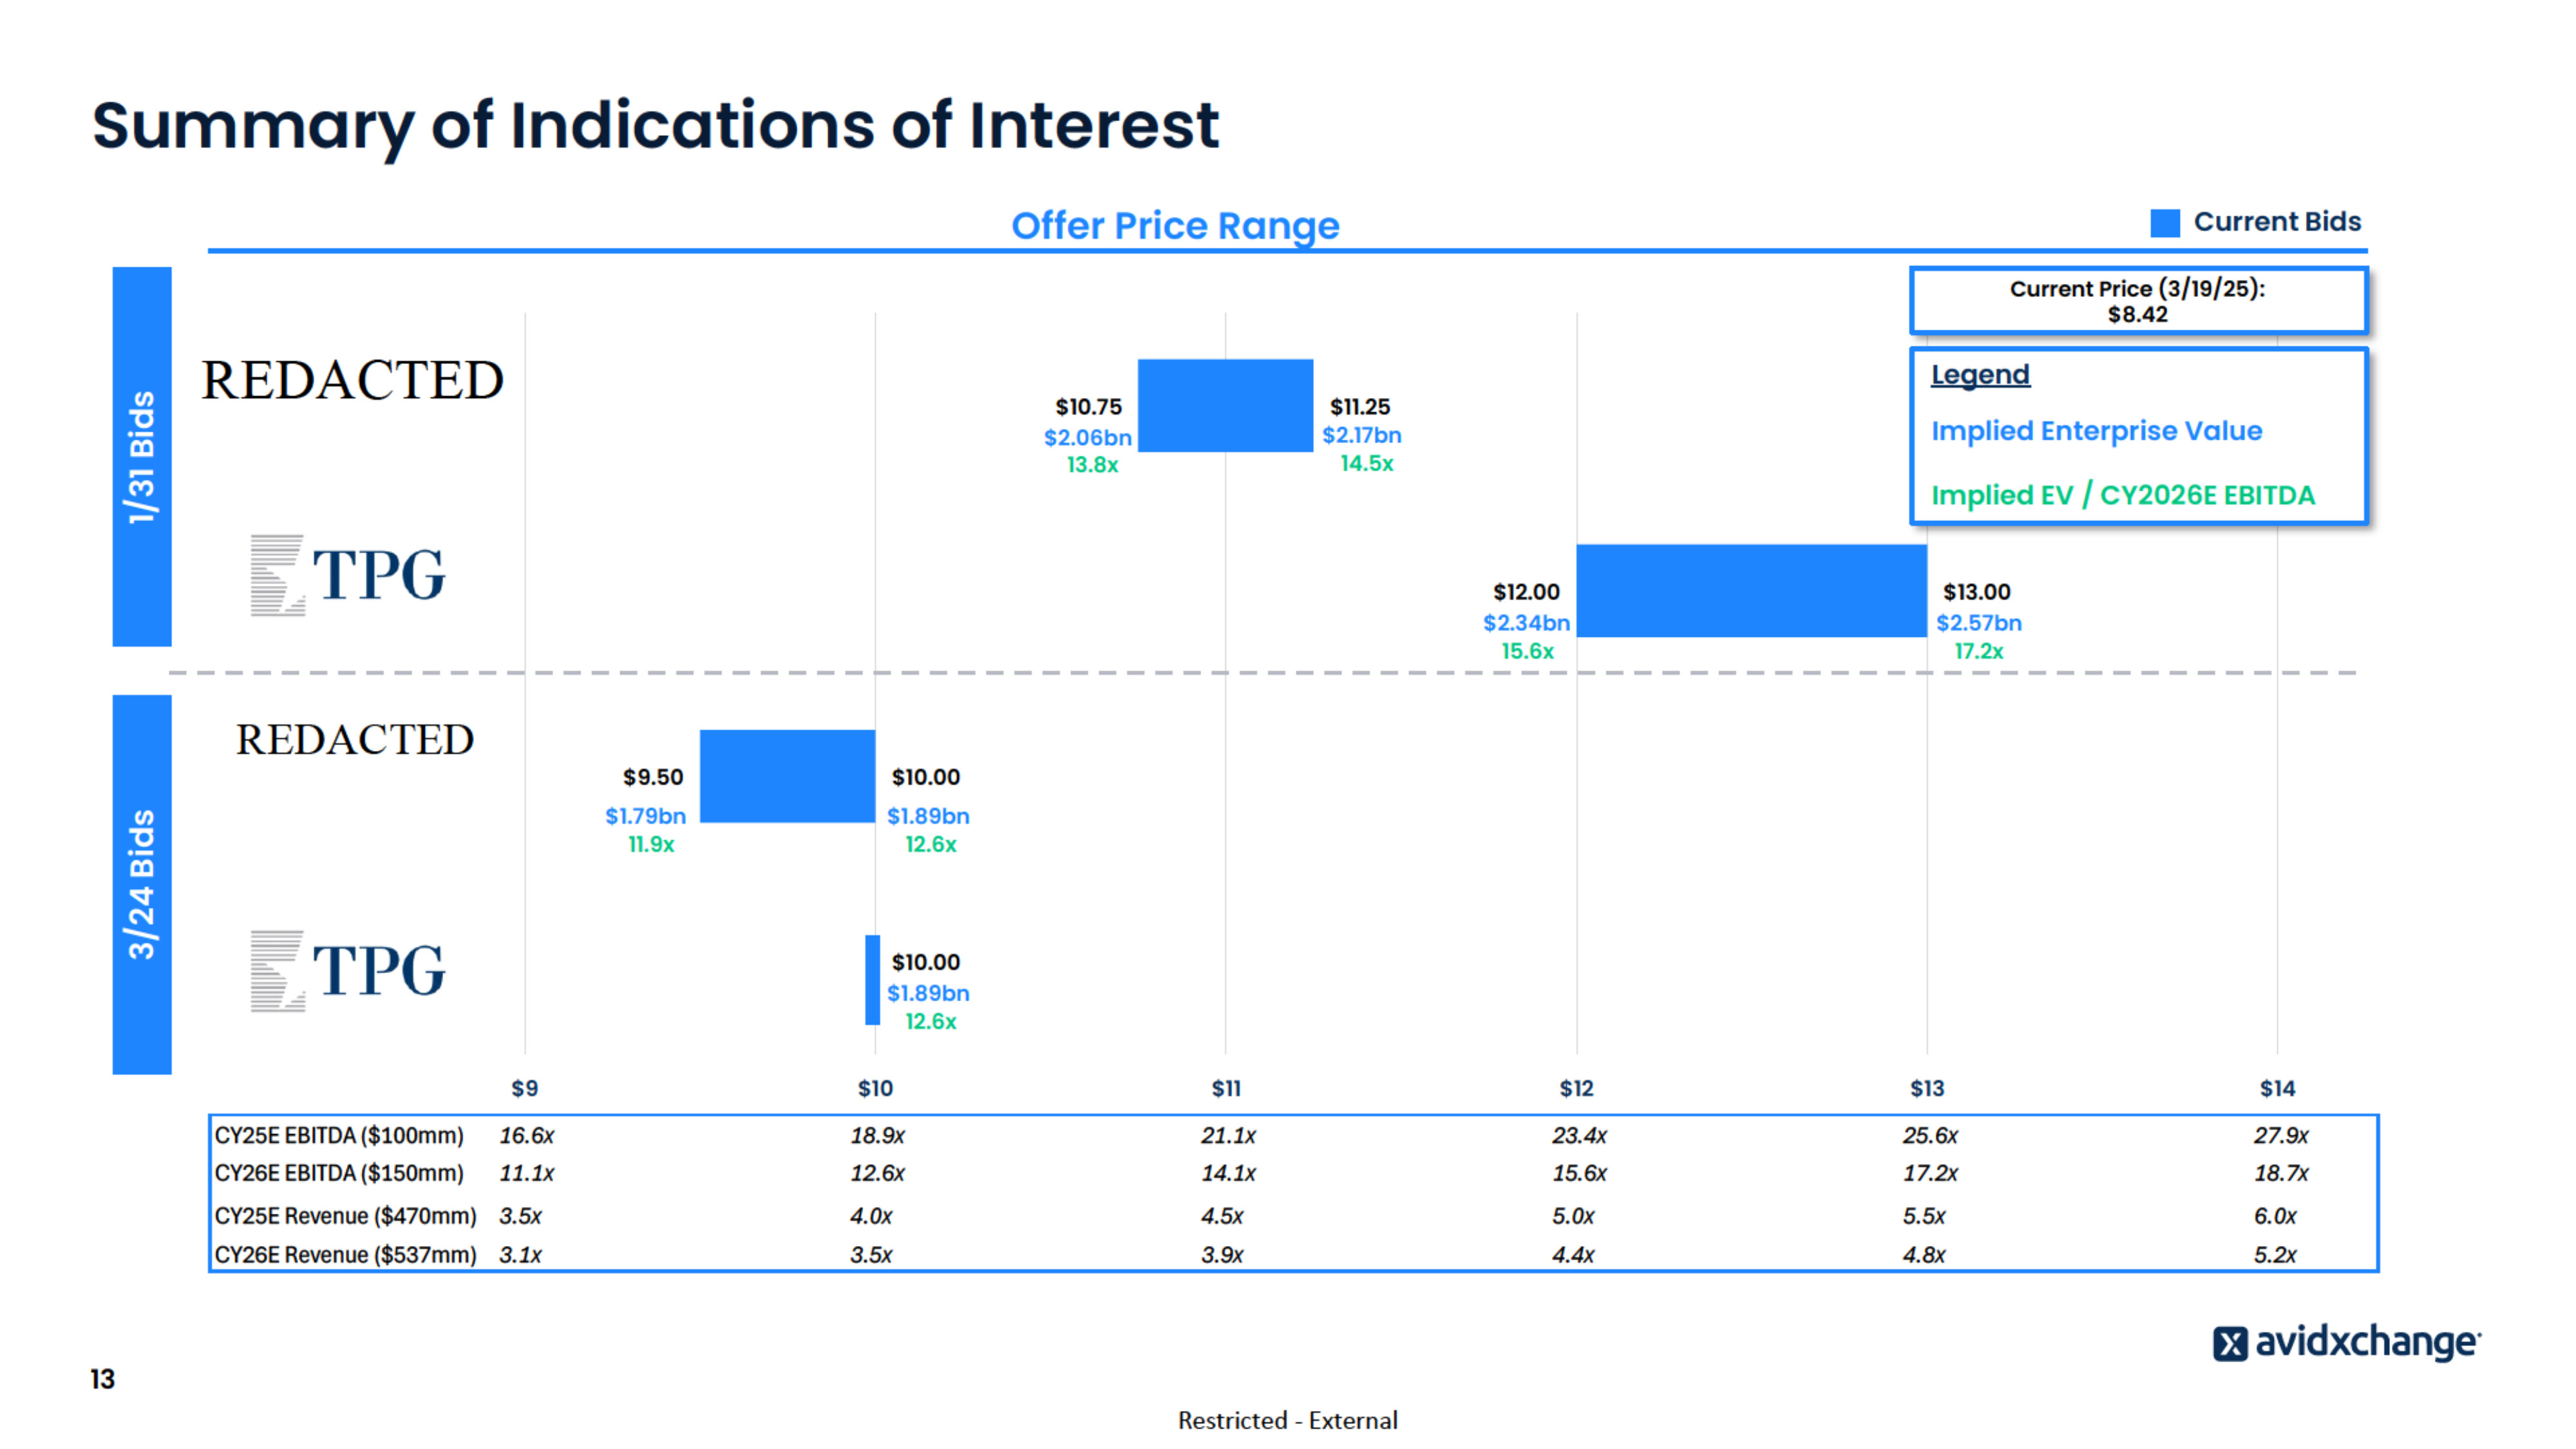
Summary of Indications of Interest Offer Price Range Current Bids 1/31 Bids Current Price (3/19/25): $8.42 $10.75 $2.06bn 13.8x Legend $11.25 $2.17bn 14.5x Implied Enterprise Value Implied EV / CY2026E EBITDA 3/24 Bids $12.00 $2.34bn 15.6x $9.50 $10.00 $1.79bn 11.9x $1.89bn 12.6x $13.00 $2.57bn 17.2x $10.00 $1.89bn 12.6x $9 $10 $11 $12 $13 $14 CY25E EBITDA ($100mm) 16.6x 18.9x 21.1x 23.4x 25.6x 27.9x CY26E EBITDA ($150mm) 11.1x 12.6x 14.1x 15.6x 17.2x 18.7x 0.0x CY25E Revenue ($470mm) 3.5x 4.0x 4.5x 5.0x 5.5x 6.0x CY26E Revenue ($537mm) 3.1x 3.5x 3.9x 4.4x 4.8x 5.2x 13 Restricted - External
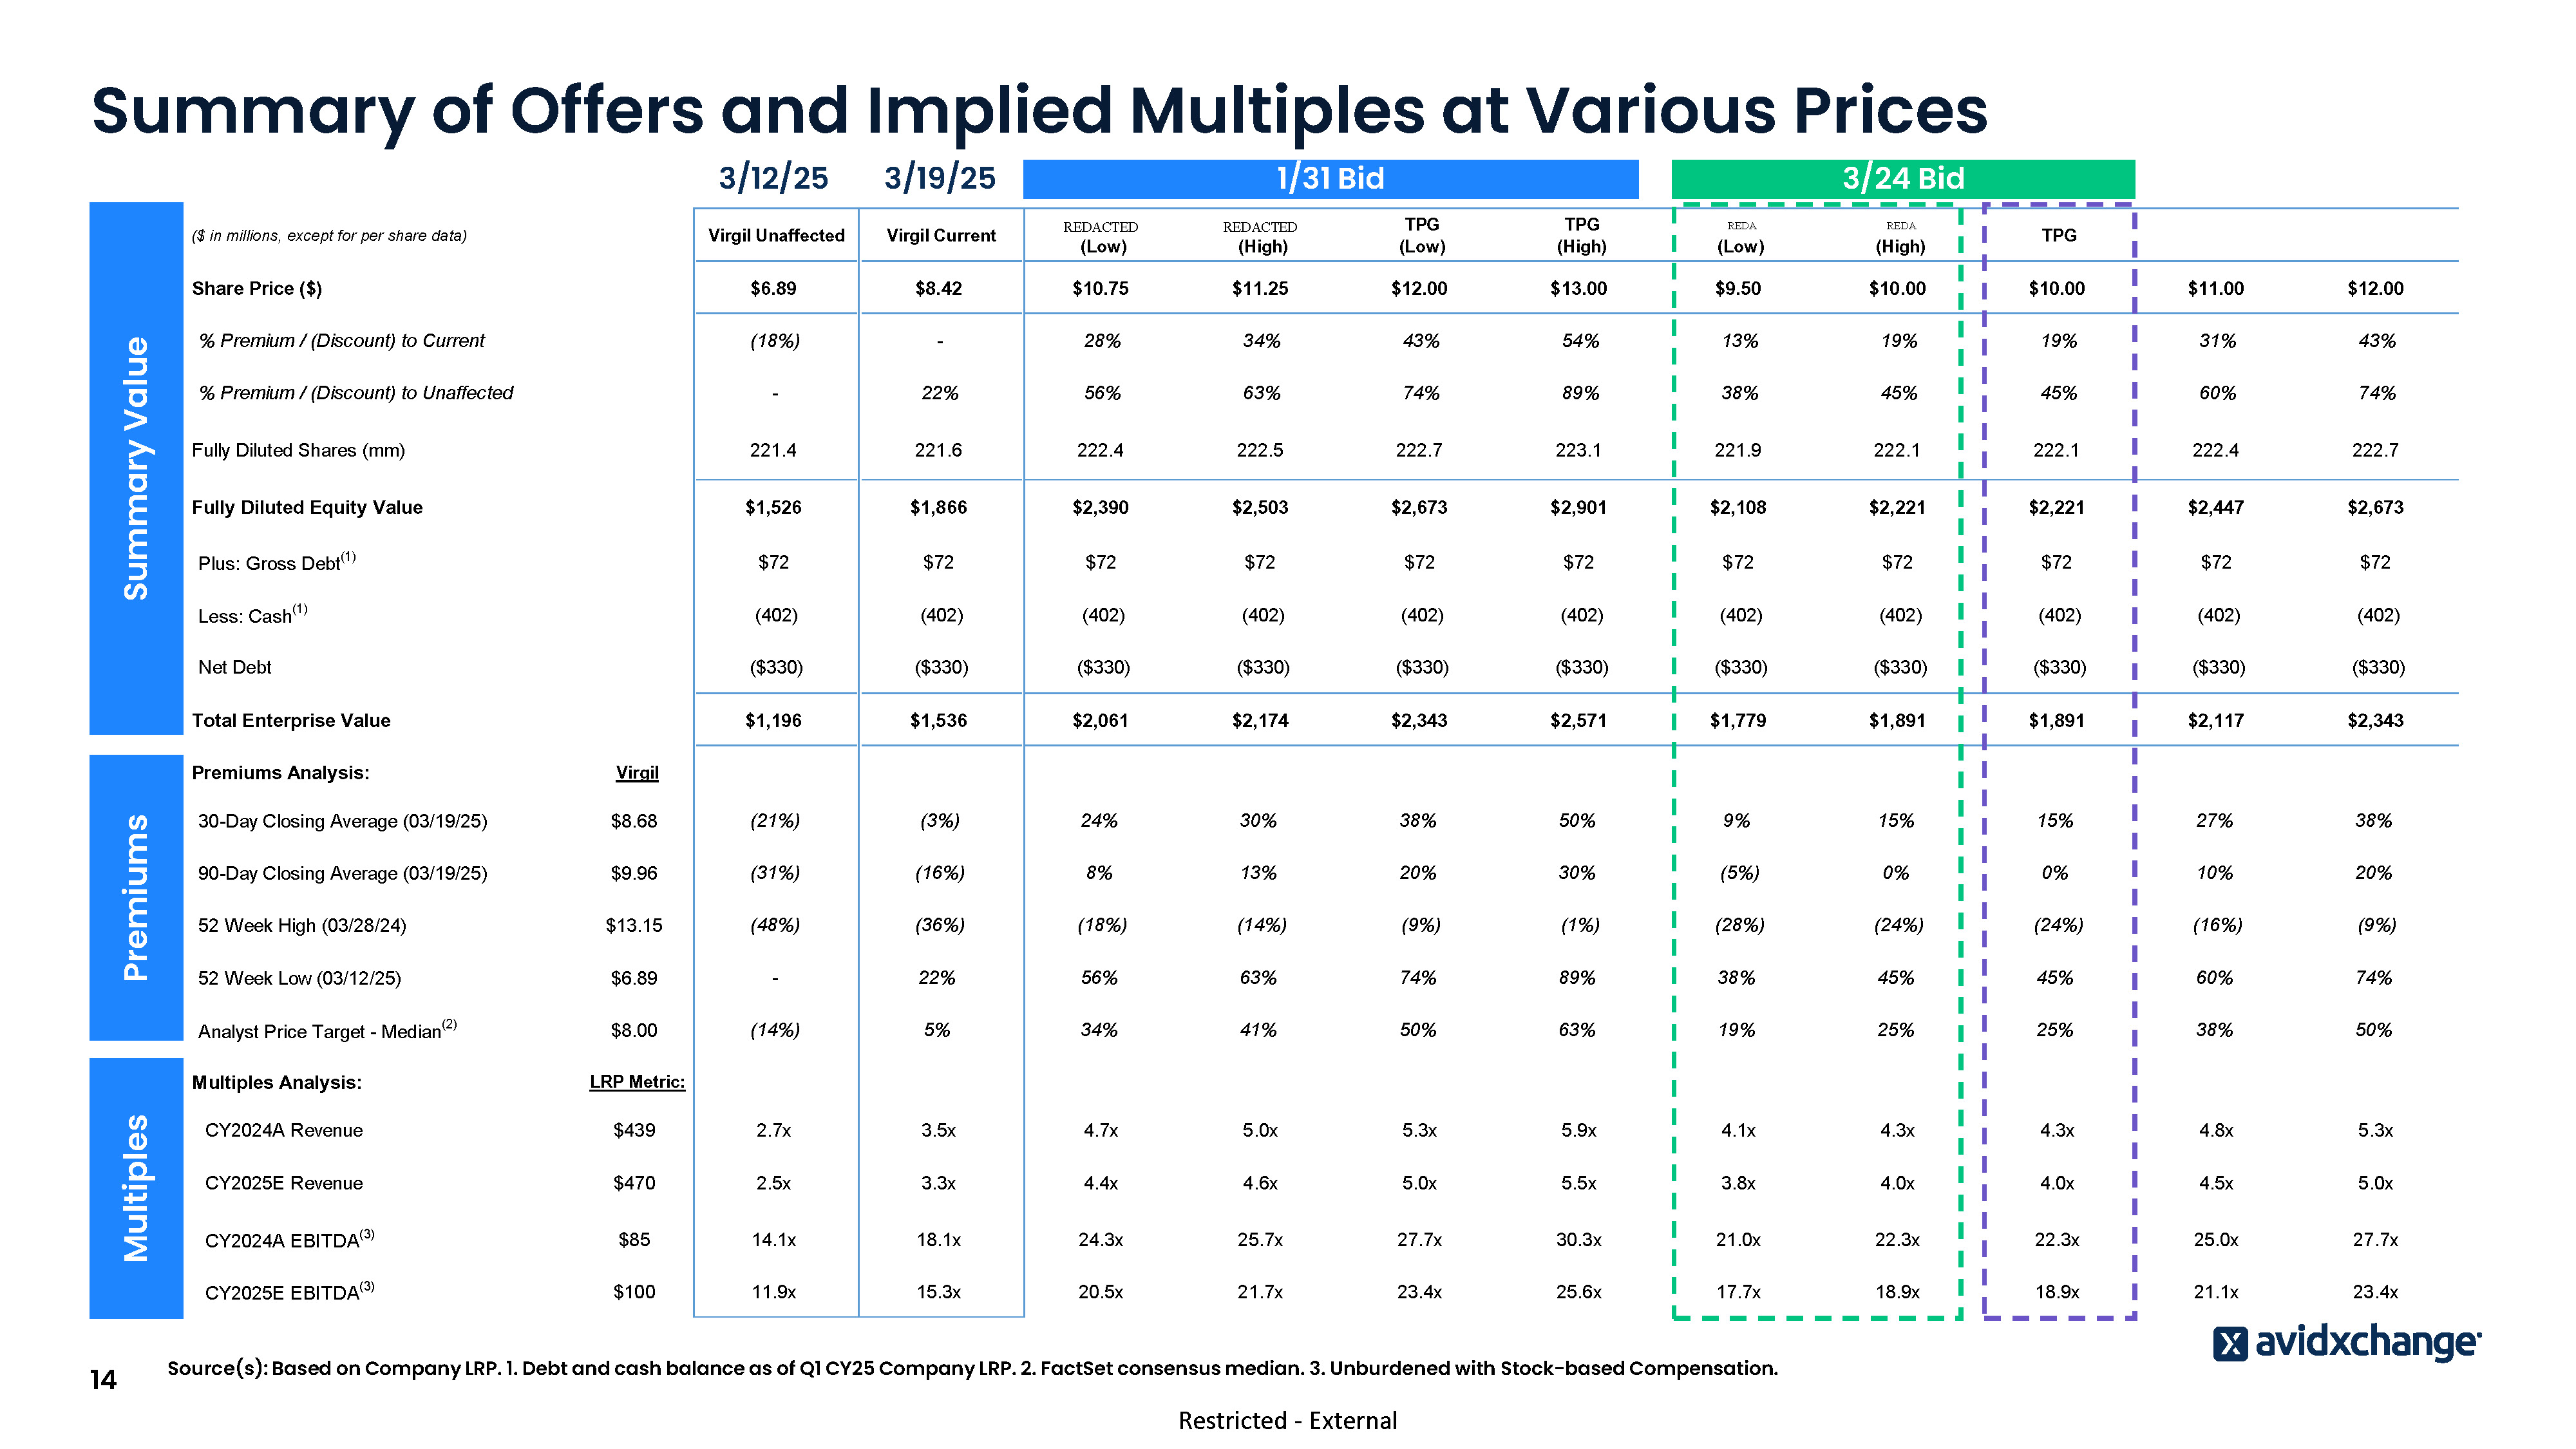
Summary of Offers and Implied Multiples at Various Prices 3/12/25 3/19/25 Virgil Unaffected Virgil Current Bain Cap (Low) Bain Cap (High) TPG (Low) TPG (High) FP (Low) FP (High) TPG Share Price ($) $6.89 $8.42 $10.75 $11.25 $12.00 $13.00 $9.50 $10.00 $10.00 $11.00 $12.00 % Premium / (Discount) to Current (18%) - 28% 34% 43% 54% 13% 19% 19% 31% 43% - 22% 56% 63% 74% 89% 38% 45% 45% 60% 74% Fully Diluted Shares (mm) 221.4 221.6 222.4 222.5 222.7 223.1 221.9 222.1 222.1 222.4 222.7 Fully Diluted Equity Value $1,526 $1,866 $2,390 $2,503 $2,673 $2,901 $2,108 $2,221 $2,221 $2,447 $2,673 Plus: Gross Debt(1) $72 $72 $72 $72 $72 $72 $72 $72 $72 $72 $72 Less: Cash(1) (402) (402) (402) (402) (402) (402) (402) (402) (402) (402) (402) Net Debt ($330) ($330) ($330) ($330) ($330) ($330) ($330) ($330) ($330) ($330) ($330) Total Enterprise Value $1,196 $1,536 $2,061 $2,174 $2,343 $2,571 $1,779 $1,891 $1,891 $2,117 $2,343 Multiples Premiums Summary Value ($ in millions, except for per share data) 14 % Premium / (Discount) to Unaffected 1/31 Bid 3/24 Bid Premiums Analysis: Virgil 30-Day Closing Average (03/19/25) $8.68 (21%) (3%) 24% 30% 38% 50% 9% 15% 15% 27% 38% 90-Day Closing Average (03/19/25) $9.96 (31%) (16%) 8% 13% 20% 30% (5%) 0% 0% 10% 20% 52 Week High (03/28/24) $13.15 (48%) (36%) (18%) (14%) (9%) (1%) (28%) (24%) (24%) (16%) (9%) 52 Week Low (03/12/25) $6.89 - 22% 56% 63% 74% 89% 38% 45% 45% 60% 74% Analyst Price Target - Median(2) $8.00 (14%) 5% 34% 41% 50% 63% 19% 25% 25% 38% 50% Multiples Analysis: LRP Metric: CY2024A Revenue $439 2.7x 3.5x 4.7x 5.0x 5.3x 5.9x 4.1x 4.3x 4.3x 4.8x 5.3x CY2025E Revenue $470 2.5x 3.3x 4.4x 4.6x 5.0x 5.5x 3.8x 4.0x 4.0x 4.5x 5.0x CY2024A EBITDA(3) $85 14.1x 18.1x 24.3x 25.7x 27.7x 30.3x 21.0x 22.3x 22.3x 25.0x 27.7x CY2025E EBITDA(3) $100 11.9x 15.3x 20.5x 21.7x 23.4x 25.6x 17.7x 18.9x 18.9x 21.1x 23.4x Source(s): Based on Company LRP. 1. Debt and cash balance as of Q1 CY25 Company LRP. 2. FactSet consensus median. 3. Unburdened with Stock-based Compensation. Restricted - External

Side-by-Side of Indicative Key Terms Offer Price • $9.50-10.00 / Share(1) • $10.00 / Share(2) Premium % • • 38-45% premium to Virgil’s unaffected share price of $6.89 as of March 12th 9-15% premium to Virgil’s one-day closing price of $8.68 as of March 24th • • 54% premium to Virgil’s unaffected Enterprise Value as of March 12th 45% premium to its unaffected share price of $6.89 as of March 12th Valuation Methodology • Undisclosed • • • Assumed company will not pay any dividends between sign and close Cash and debt figures reflect 12/31/24 balance sheet Deceleration of revenue growth since 2021 has weighed on view of valuation • 27% debt financing and 57% new equity and 16% existing cash on Balance Sheet Equity to be funded from TPG IX Additional debt from third-party debt financing Valuation includes management incentive plan • Assumes 10% fully diluted ownership in stock options including 40% time-vested options and 60% performance-vested options Sources & Structure of Financing • • • Advisors 15 • • • • Key Diligence Topics Include: • Financial and operational trends • Go-forward growth drivers • Market position and competitive differentiation • Go-to-Market • Confirmatory • Key Diligence Topics Include: • Management meetings • Top-line commercial & pricing packaging data • Operations data • Technology and AI diligence • Confirmatory • Three weeks to execute diligence and negotiation definitive transaction documentation • Three-Four weeks to execute diligence and negotiation definitive transaction documentation • • To be engaged in Round 2 Would include external market consultants, accounting, tax, legal advisors and other additional specialists • • • • • Bain (Business / Commercial) Deloitte (Financial / Accounting) Saxe Cap / West Monroe (Technology/Cyber/AI) David Polk (Legal) Alvarez Marsal (Operations) Diligence Requirements Time to Completion Combination of equity and debt; capital structure to be determined in next phase Equity capital provided by Francisco Partners VII, L.P. Debt financing through previous relationships with lenders Source(s): Bidders’ Proposals 1. FP LOI assumes FDSO of 205,517,689 common shares, 10,098,649 outstanding RSUs, 7,396,102 vested and unvested options with a weighted average strike price of $9.02 and 72,459 ESPP shares. 2. TPG IOI assumes FDSO of 228,399,524 as of 2/28/25. Restricted - External
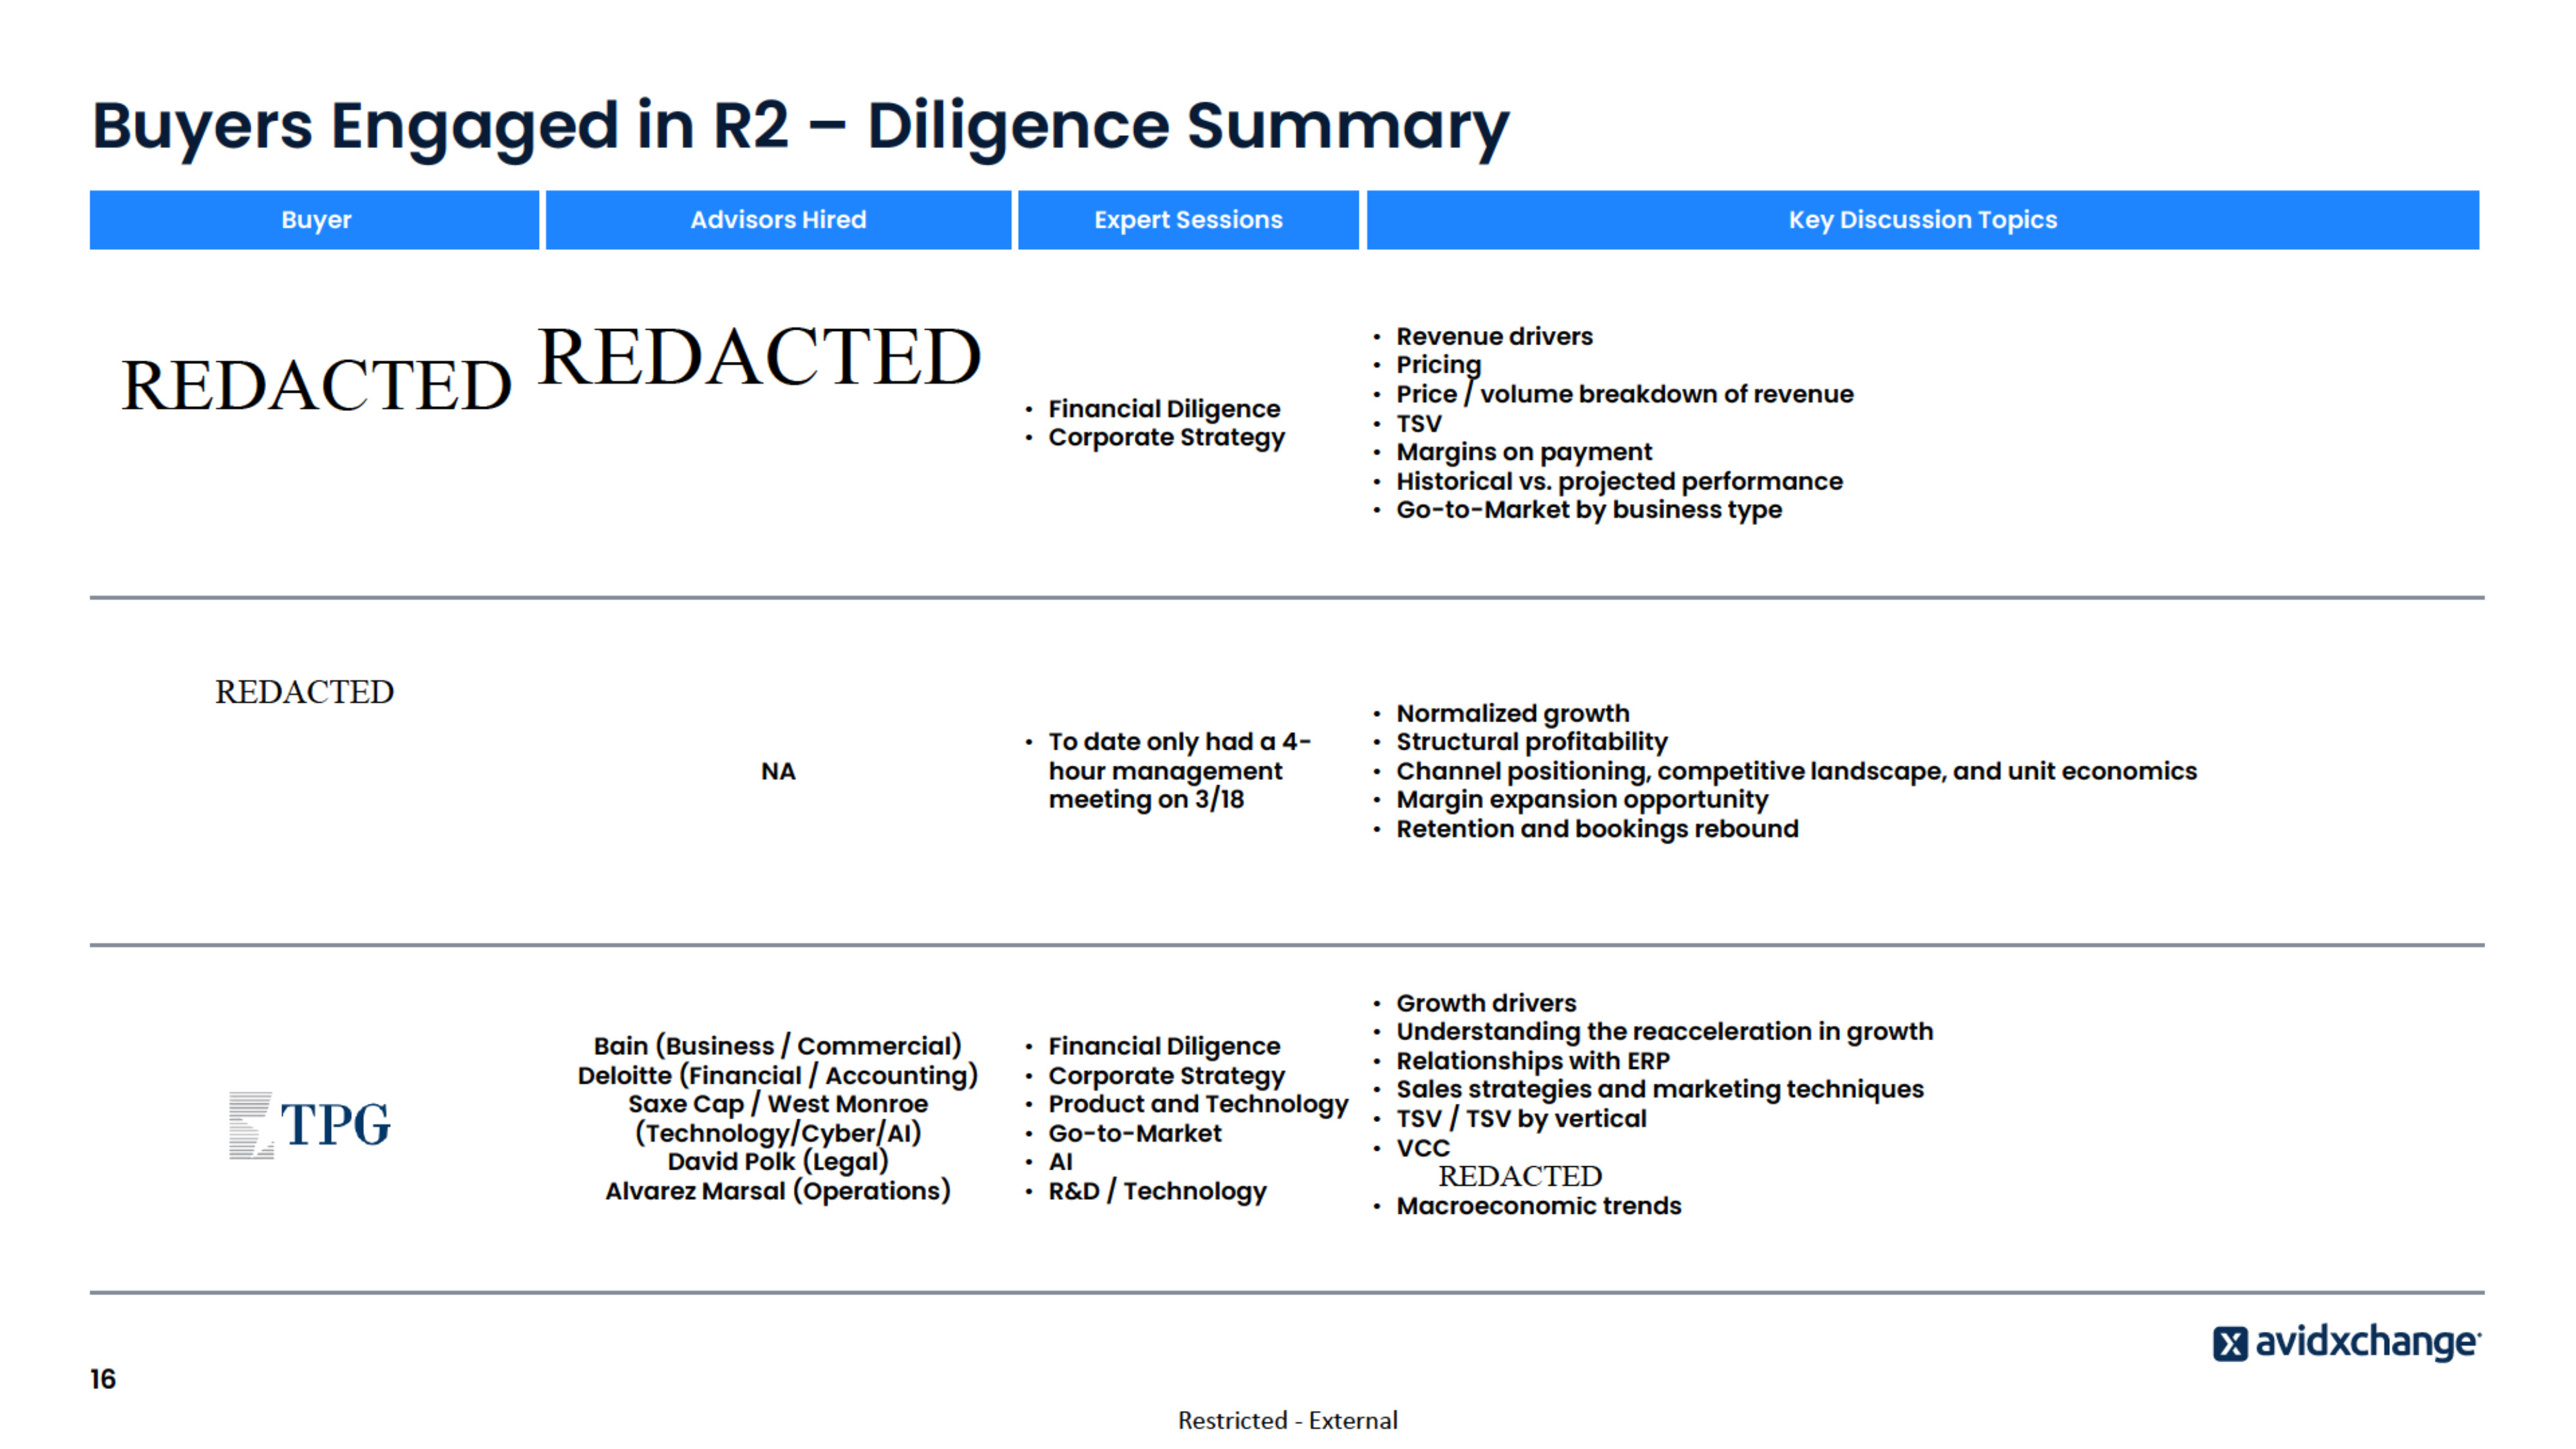
Buyers Engaged in R2 – Diligence Summary Buyer Advisors Hired Expert Sessions Key Discussion Topics EY Parthenon (Technology/Cyber/AI) Kirkland and Ellis (Legal) Alex Partners (Operations) • Financial Diligence • Corporate Strategy • Revenue drivers • Pricing • Price / volume breakdown of revenue • TSV • Margins on payment • Historical vs. projected performance • Go-to-Market by business type NA • To date only had a 4hour management meeting on 3/18 • Normalized growth • Structural profitability • Channel positioning, competitive landscape, and unit economics • Margin expansion opportunity • Retention and bookings rebound Bain (Business / Commercial) Deloitte (Financial / Accounting) Saxe Cap / West Monroe (Technology/Cyber/AI) David Polk (Legal) Alvarez Marsal (Operations) • Growth drivers • Understanding the reacceleration in growth • Financial Diligence • Relationships with ERP • Corporate Strategy • Sales strategies and marketing techniques • Product and Technology • TSV / TSV by vertical • Go-to-Market • VCC • AI • NetSuite Partnership • R&D / Technology • Macroeconomic trends 16 Restricted - External
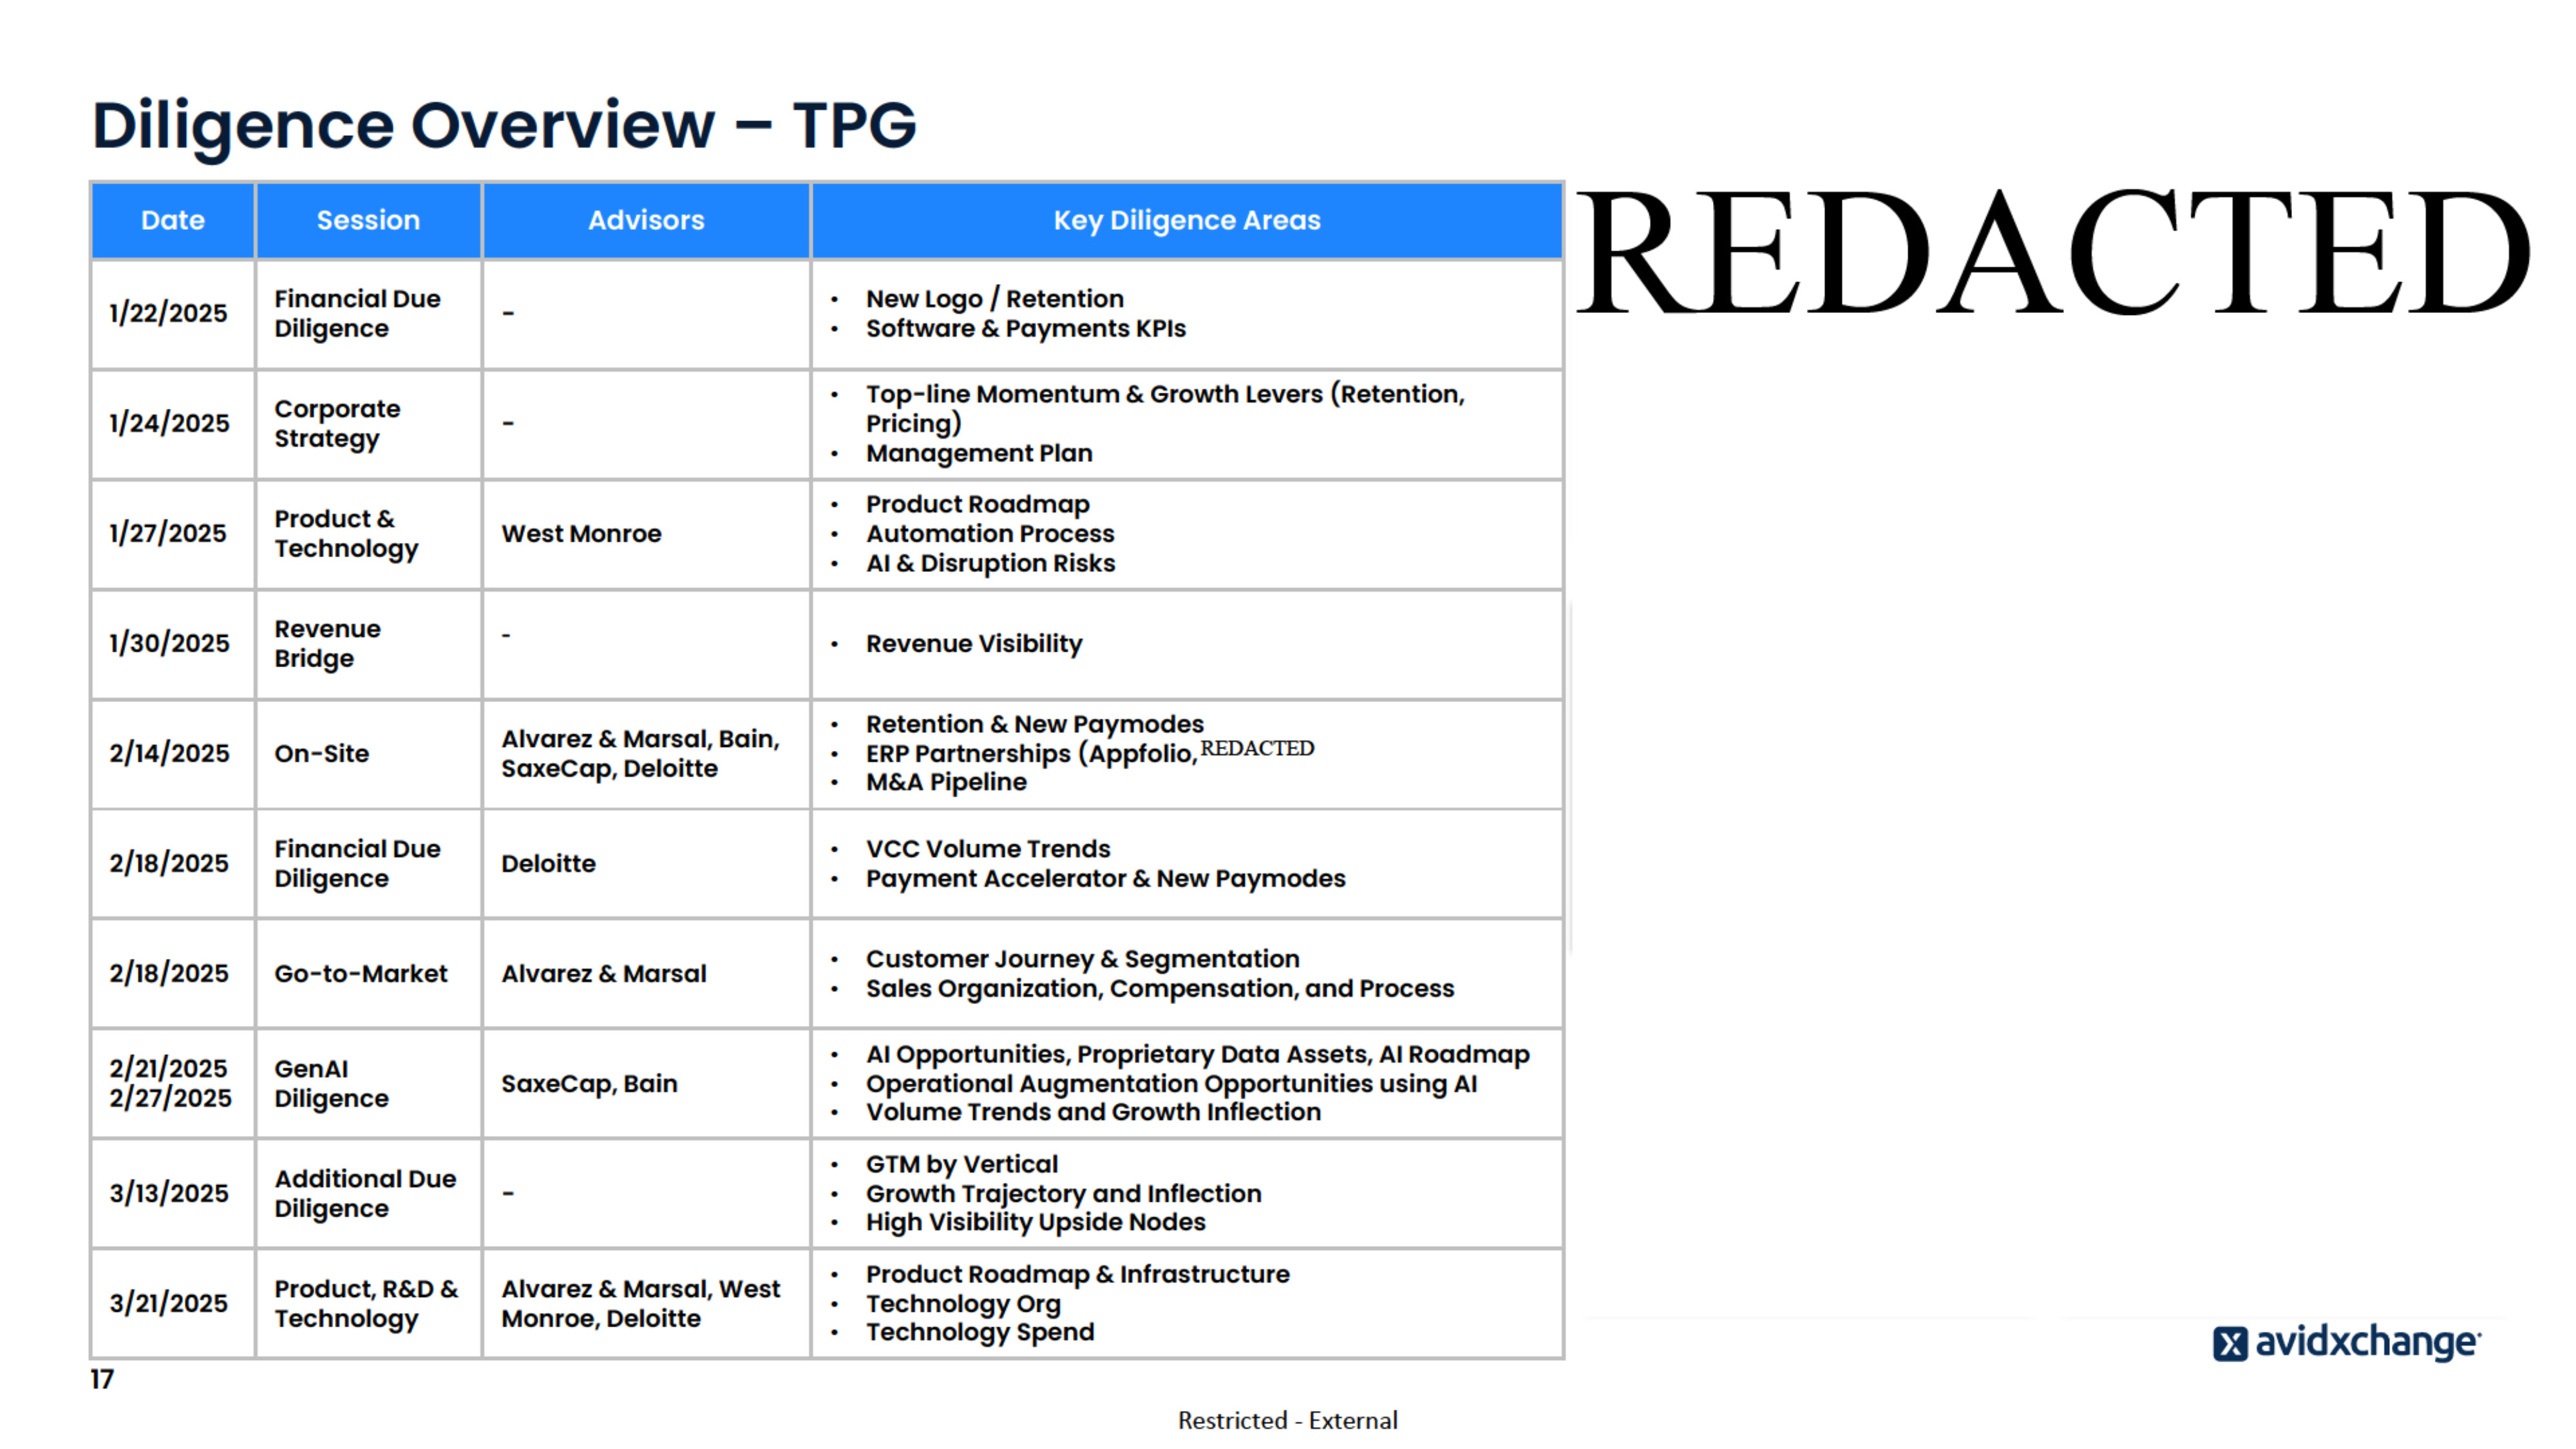
Diligence Overview – TPG Date Session Advisors 1/22/2025 Financial Due Diligence - 1/24/2025 Corporate Strategy - 1/27/2025 Product & Technology 1/30/2025 Key Diligence Areas • • New Logo / Retention Software & Payments KPIs • • Top-line Momentum & Growth Levers (Retention, Pricing) Management Plan West Monroe • • • Product Roadmap Automation Process AI & Disruption Risks Revenue Bridge - • Revenue Visibility 2/14/2025 On-Site Alvarez & Marsal, Bain, SaxeCap, Deloitte • • • Retention & New Paymodes ERP Partnerships (Appfolio, Netsuite) M&A Pipeline 2/18/2025 Financial Due Diligence Deloitte • • VCC Volume Trends Payment Accelerator & New Paymodes 2/18/2025 Go-to-Market Alvarez & Marsal • • Customer Journey & Segmentation Sales Organization, Compensation, and Process 2/21/2025 2/27/2025 GenAI Diligence SaxeCap, Bain • • • AI Opportunities, Proprietary Data Assets, AI Roadmap Operational Augmentation Opportunities using AI Volume Trends and Growth Inflection 3/13/2025 Additional Due Diligence - • • • GTM by Vertical Growth Trajectory and Inflection High Visibility Upside Nodes 3/21/2025 Product, R&D & Technology Alvarez & Marsal, West Monroe, Deloitte • • • Product Roadmap & Infrastructure Technology Org Technology Spend 17 Restricted - External
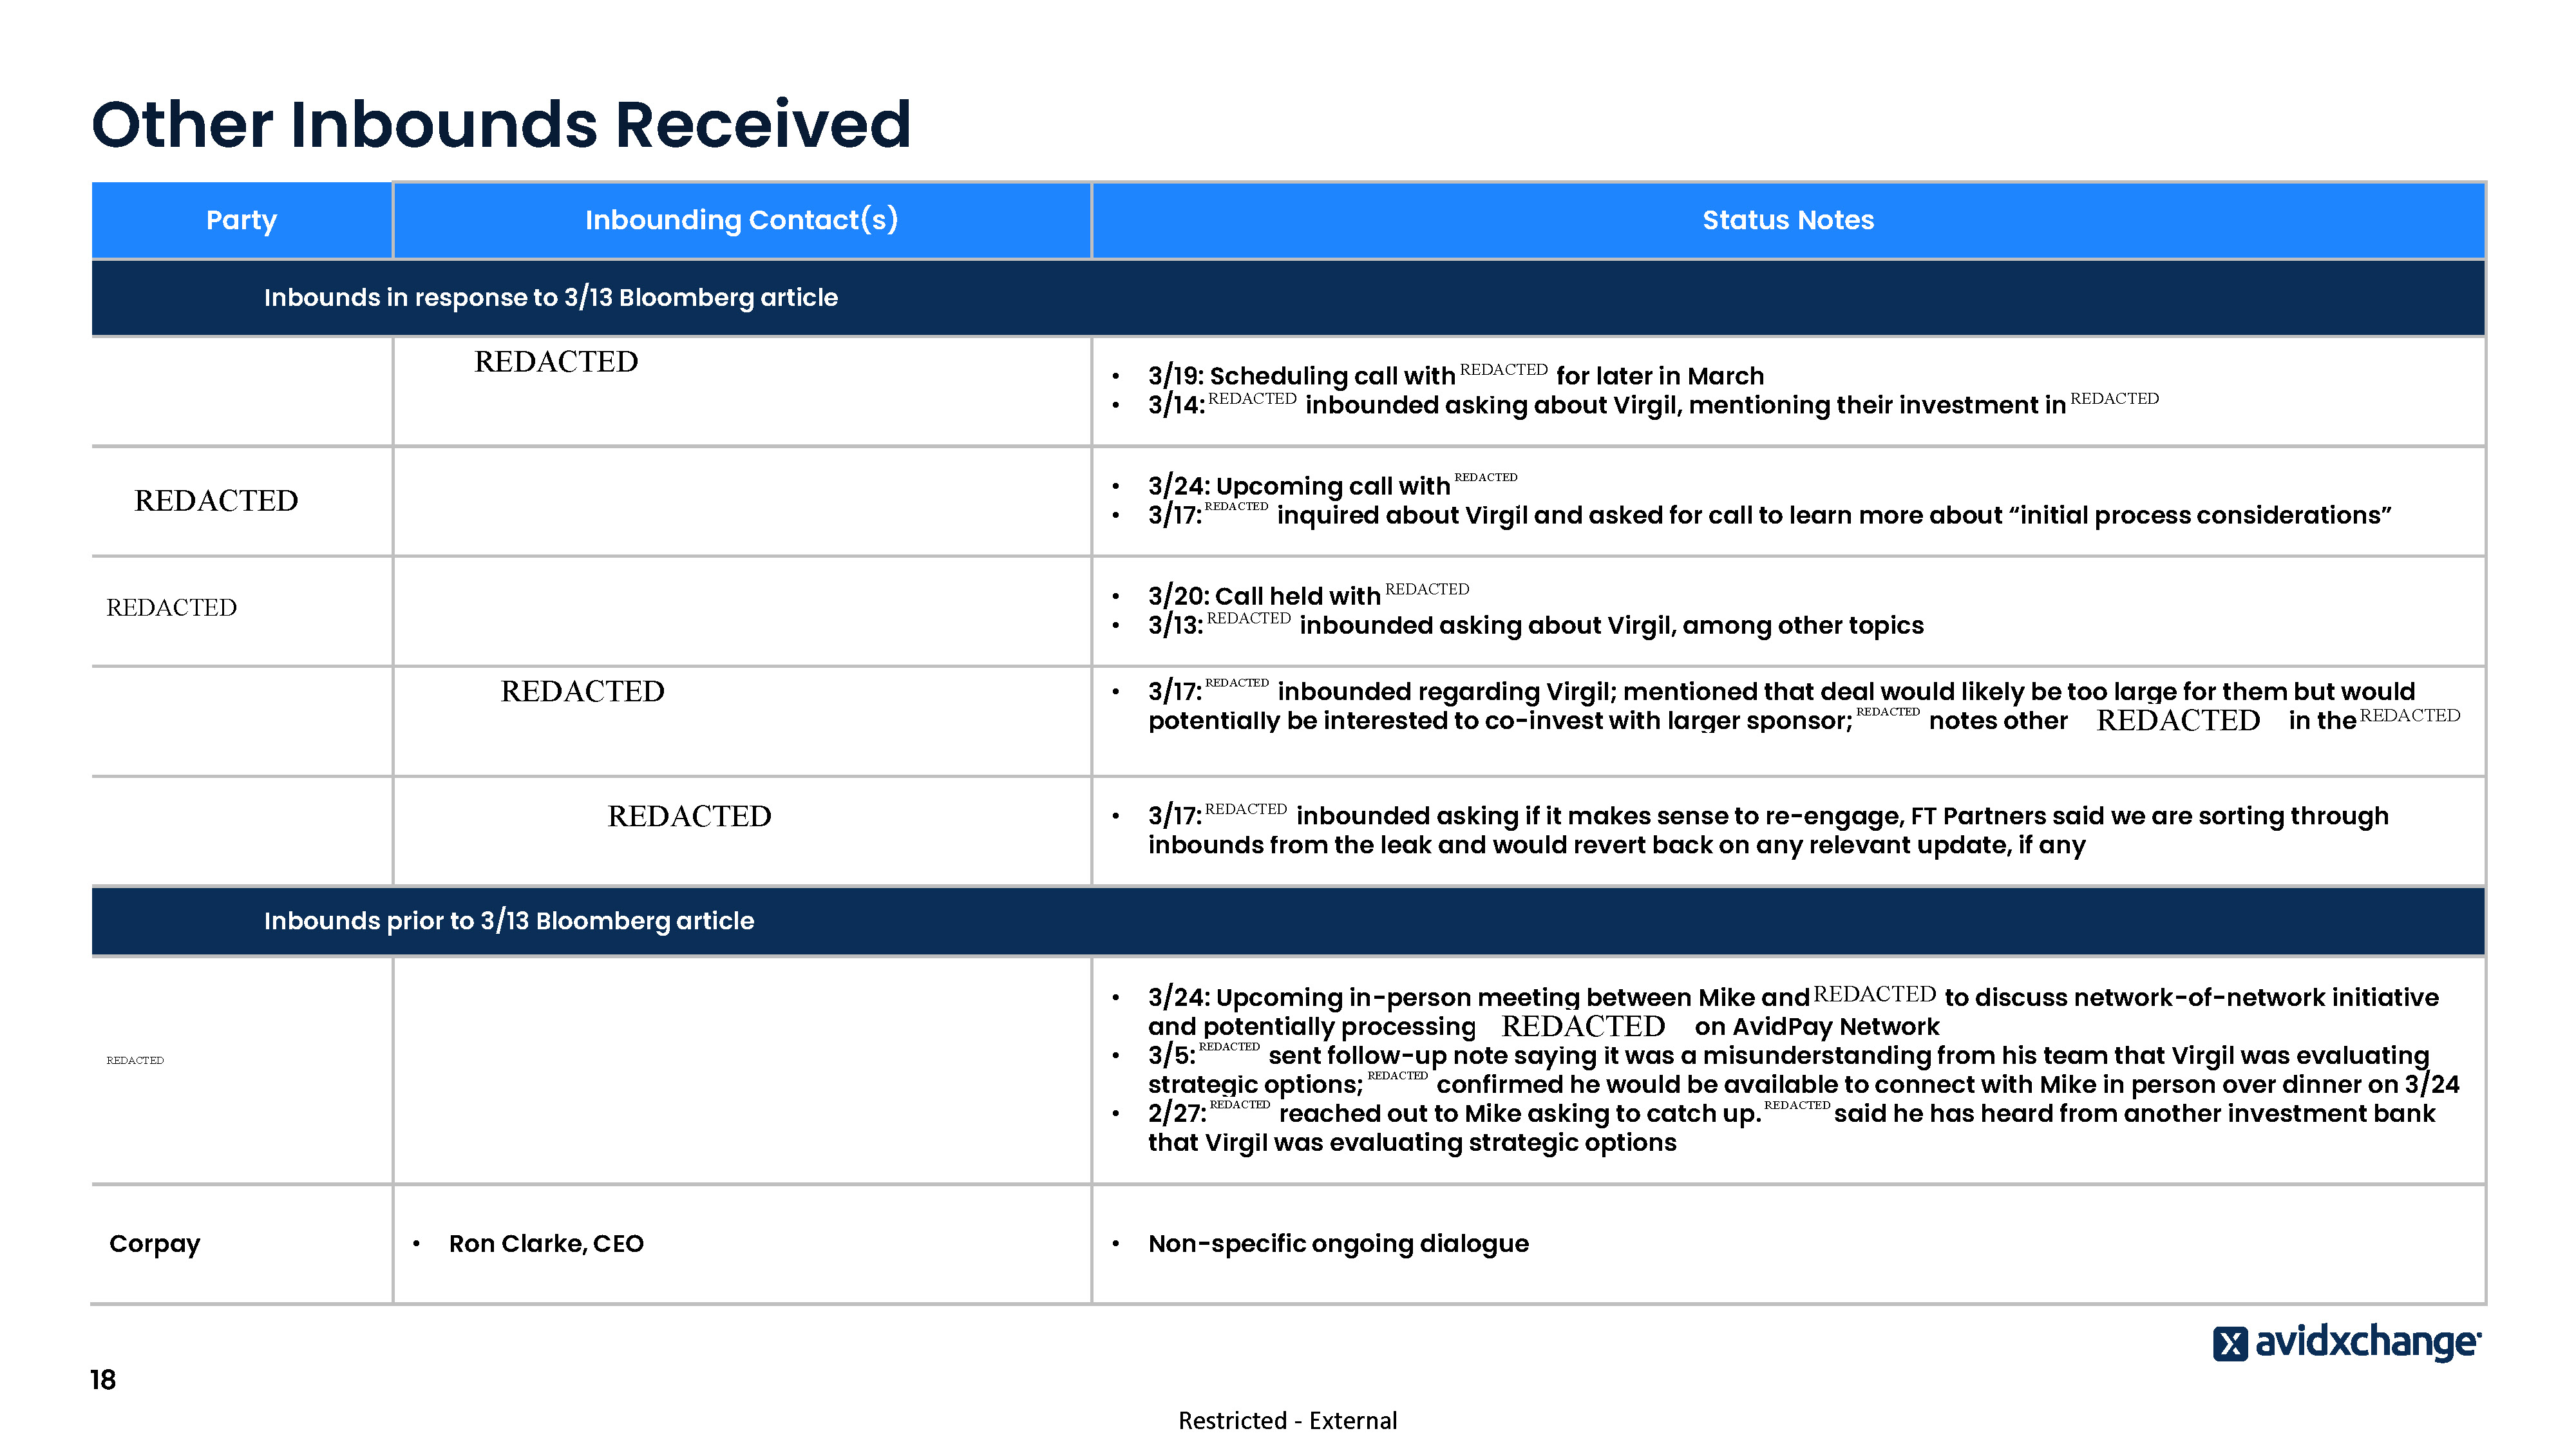
Other Inbounds Received Party Inbounding Contact(s) Status Notes Inbounds in response to 3/13 Bloomberg article Advent / Medius • • • Eric North, Partner Bo Huang, Partner Sebastian Garcia, Principal • • 3/19: Scheduling call with Advent for later in March 3/14: Advent inbounded asking about Virgil, mentioning their investment in Medius American Express • Scott Callard, VP Corporate Development • • 3/24: Upcoming call with Scott 3/17: Scott inquired about Virgil and asked for call to learn more about “initial process considerations” Hg Capital • Farouk Hussein, Patner • • 3/20: Call held with Farouk 3/13: Farouk inbounded asking about Virgil, among other topics Norwest Venture Partners • • • Chris Sondej, Principal Sameer Kapur, VP Aidan Greenstein, Investor • 3/17: Chris inbounded regarding Virgil; mentioned that deal would likely be too large for them but would potentially be interested to co-invest with larger sponsor; Chris notes other NVP investments in the supplier management space including Supplier.io and SourceDay Vista • • Monti Saroya, Senior Managing Director Adrian Alonso, Managing Director • 3/17: Adrian inbounded asking if it makes sense to re-engage, FT Partners said we are sorting through inbounds from the leak and would revert back on any relevant update, if any • 3/24: Upcoming in-person meeting between Mike and Rene in SF to discuss network-of-network initiative and potentially processing BILL transactions on AvidPay Network 3/5: Rene sent follow-up note saying it was a misunderstanding from his team that Virgil was evaluating strategic options; Rene confirmed he would be available to connect with Mike in person over dinner on 3/24 2/27: Rene reached out to Mike asking to catch up. Rene said he has heard from another investment bank that Virgil was evaluating strategic options Inbounds prior to 3/13 Bloomberg article BILL • Rene Lacerte, CEO • • Corpay • Ron Clarke, CEO • Non-specific ongoing dialogue 18 Restricted - External

Appendix
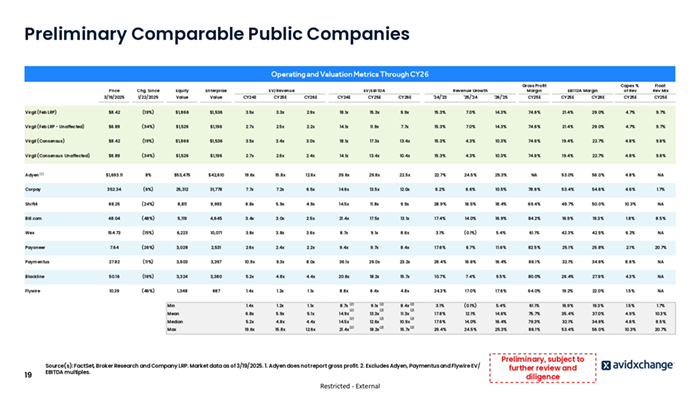
Preliminary Comparable Public Companies Operating and Valuation Metrics Through CY26 Gross Profit Margin Capex % of Rev Float Rev Mix CY26E CY25E CY25E 21.4% 29.0% 4.7% 9.7% 74.6% 21.4% 29.0% 4.7% 9.7% 10.3% 74.6% 19.4% 22.7% 4.8% 9.8% 4.3% 10.3% 74.6% 19.4% 22.7% 4.8% 9.8% 22.7% 24.5% 25.3% NA 53.0% 56.0% 4.8% NA 12.0x 6.2% 6.6% 10.5% 78.6% 53.4% 54.6% 4.6% 1.7% 11.8x 9.9x 28.9% 16.5% 18.4% 69.4% 49.7% 50.0% 10.3% NA 21.4x 17.5x 13.1x 17.4% 14.0% 16.9% 84.2% 16.9% 19.3% 1.8% 8.5% 3.6x 8.7x 9.1x 8.6x 3.1% (0.1%) 5.4% 61.1% 42.3% 42.5% 6.2% NA 2.4x 2.2x 9.4x 9.7x 8.4x 17.6% 6.7% 11.6% 82.5% 25.1% 25.8% 2.1% 20.7% 10.9x 9.3x 8.0x 36.1x 29.0x 23.2x 29.4% 16.6% 16.4% 86.1% 32.1% 34.6% 8.6% NA 3,380 5.2x 4.8x 4.4x 20.6x 18.2x 15.7x 10.7% 7.4% 9.5% 80.0% 26.4% 27.9% 4.3% NA 687 1.4x 1.2x 1.1x 8.8x 6.4x 4.8x 24.3% 17.0% 17.6% 64.0% 19.2% 22.0% 1.5% NA Price Chg. Since Equity Enterprise 3/19/2025 1/22/2025 Value Value CY24E CY25E CY26E CY24E CY25E CY26E ‘24/’23 ‘25/’24 ‘26/’25 CY25E CY25E Virgil (Feb LRP) $8.42 (19%) $1,866 $1,536 3.5x 3.3x 2.9x 18.1x 15.3x 9.9x 15.3% 7.0% 14.3% 74.6% Virgil (Feb LRP - Unaffected) $6.89 (34%) $1,526 $1,196 2.7x 2.5x 2.2x 14.1x 11.9x 7.7x 15.3% 7.0% 14.3% Virgil (Consensus) $8.42 (19%) $1,866 $1,536 3.5x 3.4x 3.0x 18.1x 17.3x 13.4x 15.3% 4.3% Virgil (Consensus Unaffected) $6.89 (34%) $1,526 $1,196 2.7x 2.6x 2.4x 14.1x 13.4x 10.4x 15.3% Adyen (1) $1,693.11 8% $53,475 $42,610 19.6x 15.8x 12.6x 39.6x 29.8x 22.5x Corpay 352.34 (6%) 25,312 31,778 7.7x 7.2x 6.5x 14.6x 13.5x Shift4 88.25 (24%) 8,811 9,993 6.8x 5.9x 4.9x 14.5x Bill.com 48.04 (48%) 5,119 4,645 3.4x 3.0x 2.5x Wex 154.73 (15%) 6,223 10,071 3.8x 3.8x Payoneer 7.64 (26%) 3,028 2,531 2.6x Paymentus 27.82 (11%) 3,603 3,397 Blackline 50.16 (16%) 3,324 Flywire 10.29 (46%) 1,348 EV/EBITDA Revenue Growth EBITDA Margin Min 1.4x 1.2x 1.1x 8.7x (2) 9.1x (2) 8.4x (2) 3.1% (0.1%) 5.4% 61.1% 16.9% 19.3% 1.5% 1.7% Mean 6.8x 5.9x 5.1x 14.9x 13.3x 11.3x 17.8% 12.1% 14.6% 75.7% 35.4% 37.0% 4.9% 10.3% Median 5.2x 4.8x 4.4x 14.5x Max 19 EV/Revenue 19.6x 15.8x 12.6x 21.4x (2) (2) (2) 12.6x 18.2x (2) (2) (2) 10.9x 15.7x (2) (2) (2) 17.6% 14.0% 16.4% 79.3% 32.1% 34.6% 4.6% 8.5% 29.4% 24.5% 25.3% 86.1% 53.4% 56.0% 10.3% 20.7% Source(s): FactSet, Broker Research and Company LRP. Market data as of 3/19/2025. 1. Adyen does not report gross profit. 2. Excludes Adyen, Paymentus and Flywire EV/ EBITDA multiples. Restricted - External Preliminary, subject to further review and diligence
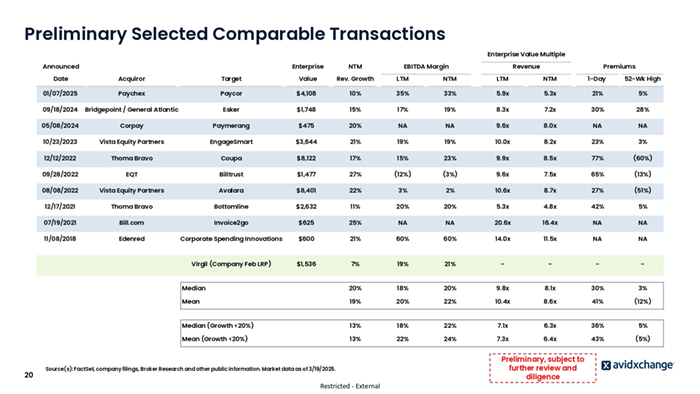
Preliminary Selected Comparable Transactions Enterprise Value Multiple Announced 20 Enterprise NTM EBITDA Margin Revenue Premiums Date Acquiror Target Value Rev. Growth LTM NTM LTM NTM 1-Day 52-Wk High 01/07/2025 Paychex Paycor $4,108 10% 35% 33% 5.9x 5.3x 21% 5% 09/18/2024 Bridgepoint / General Atlantic Esker $1,748 15% 17% 19% 8.3x 7.2x 30% 28% 05/08/2024 Corpay Paymerang $475 20% NA NA 9.6x 8.0x NA NA 10/23/2023 Vista Equity Partners EngageSmart $3,644 21% 19% 19% 10.0x 8.2x 23% 3% 12/12/2022 Thoma Bravo Coupa $8,122 17% 15% 23% 9.9x 8.5x 77% (60%) 09/28/2022 EQT Billtrust $1,477 27% (12%) (3%) 9.6x 7.5x 65% (13%) 08/08/2022 Vista Equity Partners Avalara $8,401 22% 3% 2% 10.6x 8.7x 27% (51%) 12/17/2021 Thoma Bravo Bottomline $2,632 11% 20% 20% 5.3x 4.8x 42% 5% 07/19/2021 Bill.com Invoice2go $625 25% NA NA 20.6x 16.4x NA NA 11/08/2018 Edenred Corporate Spending Innovations $600 21% 60% 60% 14.0x 11.5x NA NA Virgil (Company Feb LRP) $1,536 7% 19% 21% - - - - Median 20% 18% 20% 9.8x 8.1x 30% 3% Mean 19% 20% 22% 10.4x 8.6x 41% (12%) Median (Growth <20%) 13% 18% 22% 7.1x 6.3x 36% 5% Mean (Growth <20%) 13% 22% 24% 7.3x 6.4x 43% (5%) Source(s): FactSet, company filings, Broker Research and other public information. Market data as of 3/19/2025. Restricted - External Preliminary, subject to further review and diligence
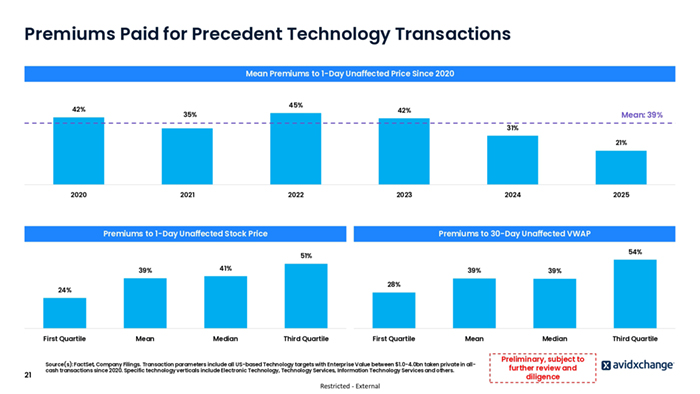
Premiums Paid for Precedent Technology Transactions Mean Premiums to 1-Day Unaffected Price Since 2020 45% 42% 42% 35% Mean: 39% 31% 21% 2020 2021 2022 2023 Premiums to 1-Day Unaffected Stock Price 2024 2025 Premiums to 30-Day Unaffected VWAP 54% 51% 39% 41% 21 39% Mean Median 28% 24% First Quartile 39% Mean Median Third Quartile First Quartile Source(s): FactSet, Company Filings. Transaction parameters include all US-based Technology targets with Enterprise Value between $1.0-4.0bn taken private in allcash transactions since 2020. Specific technology verticals include Electronic Technology, Technology Services, Information Technology Services and others. Restricted - External Preliminary, subject to further review and diligence Third Quartile
Disclaimer The following pages contain material that was provided to the Board of Directors (the “Board”) of Virgil (the “Company”) by Barclays Capital Inc. (“Barclays”). The accompanying material and any Barclays presentation related to the material was compiled or prepared on a confidential basis solely for consideration by the Board and no part of it may be reproduced, distributed or transmitted without the prior written consent of Barclays. The information contained in this material was obtained from the Company and/or publicly available sources, and Barclays has relied upon such information without independent verification thereof and does not assume any liability for any such information. These materials are being provided in connection with an actual corporate engagement and may not be used or relied upon for any purpose other than as specifically contemplated by a written agreement with Barclays. Moreover, any information provided herein was not prepared for or intended for use by any individual for personal, family or household purposes. Any estimates, historical financial information, projections and other information contained herein have been prepared by management of the Company or were obtained from publicly available sources (approved for Barclays’ use by the Company) or are based upon such estimates and projections. With respect to such estimates and projections, Barclays has assumed that they have been reasonably prepared on a basis reflecting the best currently available estimates, projections and judgment of the management of the Company. The projections contained herein may or may not be achieved and differences between projected results and those actually achieved may be material. No representation or warranty, expressed or implied, is made as to the accuracy or completeness of such information and nothing contained herein is, or shall be relied upon as, a promise or representation, whether as to the past or the future. The analysis contained herein is based on current market conditions which are subject to change and Barclays assumes no obligation to update or otherwise revise these materials. Nothing in these materials shall be deemed to constitute a recommendation or investment, legal, tax, financial, accounting or other advice. Because these materials were prepared for use in the context of a presentation to the Board, these materials are incomplete without reference to, and should be assessed solely in conjunction with, the oral briefing provided by Barclays to the Board (in their capacity as directors and not in any individual capacity and is not for the benefit of any individual, including any individual officer, director, shareholder or any other person). These materials were not prepared for or intended for use by any individual for personal, family or household purposes nor were they prepared to comply with the disclosure standards under state and federal securities laws or any other applicable laws and, to the extent the material may be considered by readers not as familiar with the business and affairs of the Company as the Board, none of the Company, Barclays, their respective affiliates or any of their respective legal or financial advisors or accountants takes any responsibility for the accuracy or completeness of any of the material if used by persons other than the Board. These materials are not intended to provide the sole basis for evaluation of the proposed corporate transaction and do not purport to contain all information that may be required and should not be considered a recommendation with respect to the proposed corporate transaction. Barclays has not made or obtained any evaluations or appraisals of the assets or liabilities of the Company or any other party to any corporate transaction or any of their respective affiliates and has no obligation to evaluate the solvency of the Company or any other party to any transaction under any state or federal laws relating to bankruptcy, insolvency or similar matters. The analyses contained herein do not purport to be appraisals nor do they necessarily reflect the prices at which businesses or securities actually may be sold or purchased. Barclays’ role in any due diligence review is limited solely to performing such a review as it shall deem necessary to support its own advice and analysis and shall not be on behalf of the Company, the Board or any individual officer, director, shareholder or any other person. Barclays, its subsidiaries and affiliates engage in a wide range of businesses from investment and commercial banking, lending, asset management and other financial and non-financial services. In the ordinary course of its business, Barclays and its affiliates may actively trade and effect transactions in the equity, debt and/or other securities (and any derivatives thereof) and financial instruments (including loans and other obligations) of the Company for its own account and for the accounts of its customers and, accordingly, may at any time hold long or short positions and investments in such securities and financial instruments or in other financial products and instruments. Unless otherwise expressly agreed or provided for in other applicable Barclays disclosures governing such corporate transactions or required by law or regulation, Barclays conducts these activities as principal and executes its principal transactions as an arm’s length counterparty. Barclays does not act as a fiduciary in relation to these corporate transactions. These materials do not constitute investment advice nor do they form part of an offer to sell or purchase, or the solicitation of an offer to sell or purchase, any securities or any of the businesses or assets described herein or an offer of financing or an offer or recommendation to enter into any corporate transaction described herein. Barclays Capital Inc. is the United States investment bank of Barclays Bank PLC. Barclays Bank PLC is authorised by the Prudential Regulation Authority and regulated by the Financial Conduct Authority and the Prudential Regulation Authority (Financial Services Register No. 122702). Registered in England. Registered No. 1026167. Registered office: 1 Churchill Place, London E14 5HP. Neither Barclays Bank PLC, New York Branch nor Barclays Bank Delaware is responsible for the obligations of its affiliates. Copyright Barclays Bank PLC, 2025 (all rights reserved). Discussion Material