QUARTERLY REPORT PURSUANT TO SECTION 13 OR 15(d) OF THE SECURITIES EXCHANGE ACT OF 1934
For the Quarterly Period ended September 30, 2025
OR
☐
TRANSITION REPORT PURSUANT TO SECTION 13 OR 15(d) OF THE SECURITIES EXCHANGE ACT OF 1934
For the transition period from ________ to ________
Commission file number 001-40798
______________________________
DUTCH BROS INC.
(Exact name of Registrant as specified in its charter)
______________________________
Delaware
87-1041305
(State or other jurisdiction of
incorporation or organization)
(I.R.S. Employer Identification No.)
1930 W. Rio Salado Pkwy
Tempe,
Arizona
85281
(Address of Principal Executive Offices)
(Zip Code)
(877)899-2767
(Registrant's telephone number, including area code)
______________________________
Securities registered pursuant to Section 12(b) of the Act:
Title of Each Class
Trading Symbol
Name of Exchange on which Registered
Class A Common Stock,
par value $0.00001 per share
BROS
The New York Stock Exchange
Indicate by check mark whether the registrant: (1) has filed all reports required to be filed by Section 13 or 15(d) of the Securities Exchange Act of 1934 during the preceding 12 months (or for such shorter period that the registrant was required to file such reports); and (2) has been subject to such filing requirements for the past 90 days. Yesx No o
Indicate by check mark whether the registrant has submitted electronically every Interactive Data File required to be submitted pursuant to Rule 405 of Regulation S-T (§232.405 of this chapter) during the preceding 12 months (or for such shorter period that the registrant was required to submit such files). Yesx No o
Indicate by check mark whether the registrant is a large accelerated filer, an accelerated filer, a non-accelerated filer, a smaller reporting company, or an emerging growth company. See the definitions of “large accelerated filer,” “accelerated filer,” “smaller reporting company,” and “emerging growth company” in Rule 12b-2 of the Exchange Act.
Large accelerated filer
x
Accelerated filer
o
Non-accelerated filer
o
Smaller reporting company
o
Emerging growth company
o
If an emerging growth company, indicate by check mark if the registrant has elected not to use the extended transition period for complying with any new or revised financial accounting standards provided pursuant to Section 13(a) of the Exchange Act. o
Indicate by check mark whether the registrant is a shell company (as defined in Rule 12b-2 of the Act). Yes o No x
As of October 31, 2025, the registrant’s outstanding shares of common stock were as follows:
As used in this Quarterly Report on Form 10-Q (this Form 10-Q), the terms identified below have the meanings specified below unless otherwise noted or the context requires otherwise. References in this Form 10-Q to “Dutch Bros,” the “Company,” “we,” “us” and “our” refer to Dutch Bros Inc. and its consolidated subsidiaries unless the context indicates otherwise.
Term
Definition
2022 Credit Facility
Has the meaning set forth in NOTE 9 — Debt to the condensed consolidated financial statements, included elsewhere in this Form 10-Q
2025 Credit Facility
Has the meaning set forth in NOTE 9 — Debt to the condensed consolidated financial statements, included elsewhere in this Form 10-Q
AOCI
Accumulated Other Comprehensive Income
ASU
Accounting Standards Update
AUV
Average Unit Volume
BPS or bps
Basis points, which is used to express differences in rates. One basis point is the equivalent of 1/100 of one percent
CEO
Chief Executive Officer
CODM
Chief Operating Decision Maker
Co-Founder
Travis Boersma, our Executive Chairman and Co-Founder, and affiliated entities over which he maintains voting control
Continuing Members
The Co-Founder and the Sponsor
Dutch Bros OpCo
Dutch Mafia, LLC, a Delaware limited liability company and direct subsidiary of Dutch Bros Inc.
Dutch Bros Inc.
A Delaware corporation, the Class A common stock of which is publicly traded on the New York Stock Exchange under the symbol “BROS”
EBITDAR
Earnings before interest, taxes, depreciation, amortization, and rent costs
FASB
Financial Accounting Standards Board
GAAP
U.S. Generally Accepted Accounting Principles
IPO
Initial Public Offering
N/A
Not applicable
N/M
Not meaningful
OpCo LLC Agreement
The Fifth Amended and Restated Limited Liability Company Agreement of Dutch Bros OpCo
OpCo Units
Class A common units, Class B voting units and Class C voting units of Dutch Bros OpCo, each as further defined in the OpCo LLC Agreement, collectively
PSU
Performance-Based Stock Units
RSA
Restricted Stock Awards
RSU
Restricted Stock Units
Same Shop Sales
The estimated percentage change in year-over-year sales, for the comparable shop base, which we define as shops open for 15 complete months or longer as of the first day of the reporting period
SEC
Securities and Exchange Commission
SOFR
Secured Overnight Financing Rate
Sponsor
TSG Consumer Partners, L.P. and certain of its affiliates
Tax Receivable Agreements (TRAs)
The Tax Receivable Agreement (Exchanges) that Dutch Bros Inc. entered into with the Continuing Members and the Tax Receivable Agreement (Reorganization) that Dutch Bros Inc. entered into with TSG7 A AIV VI Holdings-A, L.P. and DG Coinvestor Blocker Aggregator, L.P. or their assignees or successors, in connection with the IPO
Dutch Bros, our Windmill logo (), Dutch Bros Blue Rebel, and our other registered and common law trade names, trademarks and service marks are the property of Dutch Bros Inc. All other trademarks, trade names, and service marks appearing in this Form 10-Q are the property of their respective owners. Solely for convenience, the trademarks and trade names in this Form 10-Q may be referred to without the ® and ™ symbols, but such references should not be construed as any indicator that their respective owners will not assert their rights thereto.
Certain statements in this Form 10-Q, including those in the section titled “Management’s Discussion and Analysis,” that are not historical facts, including those regarding the impact of inflation, increased minimum wages, interest rate risk, and general macroeconomic conditions on our results of operations, supply chain, or liquidity, the potential impact of actions we have taken to mitigate the impact of unforeseen circumstances, taxes and tax rates, our expectations regarding the number of new shops we may open, anticipated future revenues and earnings, consumer demand, and our expectations to generate positive cash flow in the foreseeable future are forward-looking statements as defined in the Private Securities Litigation Reform Act of 1995. We use words such as “anticipate,” “believe,” “could,” “estimate,” “expect,” “intend,” “may,” “predict,” “project,” “should,” “target,” and similar terms and phrases, including references to assumptions, to identify forward-looking statements. In addition, statements that “we believe” and similar statements reflect our beliefs and opinions on the relevant subject. While we believe that information provides a reasonable basis for these statements, that information may be limited or incomplete, and our statements should not be read to indicate that we have conducted an exhaustive inquiry into, or review of, all relevant information. These forward-looking statements are based on information available to us as of the date of this Form 10-Q, and we assume no obligation to update these forward-looking statements. These statements are subject to risks and uncertainties that could cause actual results to differ materially from those described in the statements. You should not place undue reliance on forward-looking statements, which speak only as of the date of this Form 10-Q.
You should read the following unaudited condensed consolidated financial statements and the related notes in this Form 10-Q together with our analysis and discussion of our financial condition and results of operations and other financial information included elsewhere in this Form 10-Q. You should also read our Annual Report on Form 10-K for the year ended December 31, 2024, filed with the SEC on February 13, 2025 (2024 Form 10-K).
While we believe that our assumptions are reasonable, we caution that it is very difficult to predict the impact of known factors, and it is impossible for us to anticipate all factors that could affect actual results. You should evaluate all forward-looking statements made in this report in the context of the factors that could cause outcomes to differ materially from expectations. These factors include, but are not limited to, those listed under the “Risk Factors” section of this Form 10-Q, and in our 2024 Form 10-K, as such risk factors may be amended, supplemented or superseded from time to time by other reports we file with the SEC.
Website Disclosure
We use our website as a distribution channel of material company information. Financial and other important information regarding our company is routinely posted on and accessible through our website at https://investors.dutchbros.com. In addition, you may automatically receive email alerts and other information about our company when you subscribe your email address by visiting the “Investor Email Alerts” section of our investor relations page at https://investors.dutchbros.com/resources. The information on our website is not incorporated herein or otherwise a part of this Form 10-Q.
(in thousands, except per share amounts; unaudited)
September 30, 2025
December 31, 2024
Preferred stock, $0.00001 par value per share - 20,000 shares authorized; zero shares issued and outstanding as of September 30, 2025 and December 31, 2024, respectively
—
—
Class A common stock, $0.00001 par value per share - 400,000 shares authorized; 127,031 and 115,432 shares issued and outstanding as of September 30, 2025 and December 31, 2024, respectively
1
1
Class B common stock, $0.00001 par value per share - 144,000 shares authorized; 35,211 and 35,227 shares issued and outstanding as of September 30, 2025 and December 31, 2024, respectively
—
—
Class C common stock, $0.00001 par value per share - 105,000 shares authorized; 2,280 and 3,545 shares issued and outstanding as of September 30, 2025 and December 31, 2024, respectively
—
—
Additional paid-in capital
578,256
517,074
Accumulated other comprehensive income
162
628
Retained earnings
78,138
19,666
Total stockholders' equity attributable to Dutch Bros Inc.
656,557
537,369
Non-controlling interests
208,472
226,496
Total equity
865,029
763,865
Total liabilities and equity
$
2,921,997
$
2,501,085
See accompanying notes to condensed consolidated financial statements.
Condensed Consolidated Statements of Stockholders’ Equity
Three Months Ended September 30, 2025
Dutch Bros Inc. Stockholders’ Equity
Class A
Common Stock
Class B
Common Stock
Class C
Common Stock
(in thousands; unaudited)
Shares
Amount
Shares
Amount
Shares
Amount
Additional Paid-in-Capital
Accumulated Other Comprehensive Income
Retained Earnings
Non-Controlling Interests
Total Equity
Balance, June 30, 2025
126,932
$
1
35,211
$
—
2,347
$
—
$
575,240
$
284
$
60,643
$
197,761
$
833,929
Net income
—
—
—
—
—
—
—
—
17,495
9,788
27,283
Unrealized loss on derivative securities, effective portion, net of income tax benefit of $40
—
—
—
—
—
—
—
(122)
—
(65)
(187)
Equity-based compensation expense
—
—
—
—
—
—
3,326
—
—
1,322
4,648
Issuance of Class A common stock pursuant to vesting of equity awards
32
—
—
—
—
—
(728)
—
—
(289)
(1,017)
Issuance of Class A common stock for conversion of Dutch Bros OpCo Class A common units, and for surrender and cancellation of Class C common stock, pursuant to exchange transactions
67
—
—
—
(67)
—
—
—
—
—
—
Effect of equity transactions of Dutch Bros OpCo Class A common units
Condensed Consolidated Statements of Stockholders’ Equity (continued)
Nine Months Ended September 30, 2025
Dutch Bros Inc. Stockholders’ Equity
Class A
Common Stock
Class B
Common Stock
Class C
Common Stock
(in thousands; unaudited)
Shares
Amount
Shares
Amount
Shares
Amount
Additional Paid-in-Capital
Accumulated Other Comprehensive Income
Retained Earnings
Non-Controlling Interests
Total Equity
Balance, December 31, 2024
115,432
$
1
35,227
$
—
3,545
$
—
$
517,074
$
628
$
19,666
$
226,496
$
763,865
Net income
—
—
—
—
—
—
—
—
58,472
29,648
88,120
Unrealized loss on derivative securities, effective portion, net of income tax benefit of $187
—
—
—
—
—
—
(108)
(466)
—
(311)
(885)
Equity-based compensation expense
—
—
—
—
—
—
9,567
—
—
3,946
13,513
Issuance of Class A common stock pursuant to vesting of equity awards, net of stock withheld for tax withholding obligations
335
—
—
—
—
—
(8,499)
—
—
(3,536)
(12,035)
Issuance of Class A common stock for conversion of Dutch Bros OpCo Class A common units, and for surrender and cancellation of Class C common stock, pursuant to exchange transactions
11,264
—
—
—
(1,264)
—
—
—
—
—
—
Effect of equity transactions of Dutch Bros OpCo Class A common units
—
—
—
—
—
—
40,904
—
—
(40,904)
—
Impacts of Tax Receivable Agreements
—
—
—
—
—
—
19,318
—
—
—
19,318
Reverse Split transaction pursuant to OpCo Recapitalization
—
—
(16)
—
(1)
—
—
—
—
—
—
Distributions paid to non-controlling interest holders
Condensed Consolidated Statements of Stockholders’ Equity (continued)
Nine Months Ended September 30, 2024
Dutch Bros Inc. Stockholders’ Equity
Class A
Common Stock
Class B
Common Stock
Class C
Common Stock
Class D
Common Stock
(in thousands; unaudited)
Shares
Amount
Shares
Amount
Shares
Amount
Shares
Amount
Additional Paid-in-Capital
Accumulated Other Comprehensive Income
Retained Earnings (Accumulated Deficit)
Non-Controlling Interests
Total Equity
Balance, December 31, 2023
69,958
$
1
60,629
$
1
35,864
$
—
10,669
$
—
$
379,391
$
544
$
(15,592)
$
311,576
$
675,921
Net income
—
—
—
—
—
—
—
—
—
—
31,646
28,437
60,083
Unrealized loss on derivative securities, effective portion, net of income tax benefit of $183
—
—
—
—
—
—
—
—
(328)
(234)
—
(303)
(865)
Equity-based compensation expense
—
—
—
—
—
—
—
—
4,866
—
—
3,354
8,220
Issuance of Class A common stock pursuant to vesting of equity awards, net of stock withheld for tax withholding obligations
71
—
—
—
—
—
—
—
1,831
—
—
(2,763)
(932)
Issuance of Class A common stock in exchange for surrender and cancellation of Class D common stock, and conversion of Dutch Bros OpCo Class A common units for surrender and cancellation of Class B and C common stock, pursuant to exchange transactions
43,794
—
(2,402)
—
(30,722)
—
(10,669)
—
—
—
—
—
—
Effect of exchange transactions of Dutch Bros OpCo Class A common units
—
—
—
—
—
—
—
—
110,093
—
—
(110,093)
—
Tax impacts of other equity-related transactions
—
—
—
—
—
—
—
—
254
—
—
—
254
Impacts of Tax Receivable Agreements
—
—
—
—
—
—
—
—
10,678
—
—
—
10,678
Class B common stock decoupled from Dutch Bros OpCo Class A common units, surrendered and cancelled
—
—
(23,000)
(1)
—
—
—
—
—
—
—
—
(1)
Distributions paid to non-controlling interest holders
—
—
—
—
—
—
—
—
—
—
—
(687)
(687)
Balance, September 30, 2024
113,823
$
1
35,227
$
—
5,142
$
—
—
$
—
$
506,785
$
310
$
16,054
$
229,521
$
752,671
See accompanying notes to condensed consolidated financial statements.
Notes to Condensed Consolidated Financial Statements (Unaudited)
NOTE 1 — Organization and Background
Business
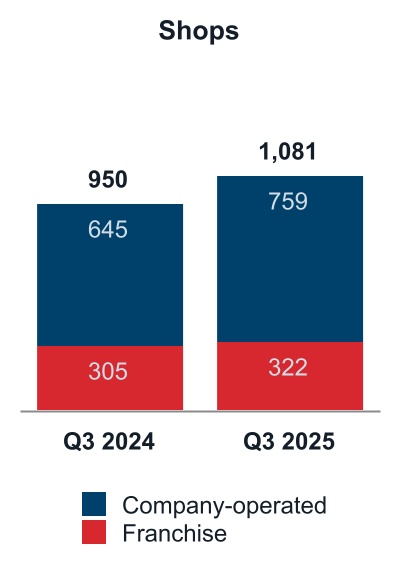
Dutch Bros Inc., a Delaware corporation, together with its subsidiaries (the Company, we, us, or our, collectively) is in the business of operating and franchising drive-thru coffee shops as well as the wholesale and distribution of coffee, coffee-related products, and accessories. As of September 30, 2025, there were 1,081 shops in operation in 24 U.S. states, of which 759 were company-operated and 322 were franchised.
Organization
Dutch Bros Inc. is the sole managing member of Dutch Bros OpCo and operates and controls all of the business and affairs of Dutch Bros OpCo. As a result, Dutch Bros Inc. consolidates the financial results of Dutch Bros OpCo and reports a non-controlling interest representing the economic interest in Dutch Bros OpCo held by the other members of Dutch Bros OpCo. The Company’s fiscal year end is December 31. As of September 30, 2025, Dutch Bros Inc. held 100.0% of the voting interest and 71.6% of the economic interest of Dutch Bros OpCo. The Continuing Members held no voting interest and the remaining 28.4% of the economic interest of Dutch Bros OpCo.
Dutch Bros OpCo Recapitalization
From time to time, Dutch Bros Inc. receives cash distributions from Dutch Bros OpCo pursuant to the OpCo LLC Agreement. Dutch Bros Inc. may then loan any cash in excess of its liabilities back to Dutch Bros OpCo for operations, under the open-ended balance Subordinated Intercompany Note, between Dutch Bros OpCo and Dutch Bros Inc., dated February 28, 2022 (the Intercompany Note).
On February 7, 2025, Dutch Bros Inc. entered into a subscription agreement with Dutch Bros OpCo, pursuant to which Dutch Bros OpCo issued 51,942 newly authorized Dutch Bros OpCo Class A common units to Dutch Bros Inc. in exchange for satisfaction of the outstanding balance of the Intercompany Note, which at that time was approximately $3.5 million.
In accordance with the OpCo LLC Agreement, all outstanding Dutch Bros OpCo Class A common units were then recapitalized through a reverse unit split (the Reverse Split) in order to maintain a one-to-one ratio between the number of Dutch Bros OpCo Class A common units owned by Dutch Bros Inc. and the number of outstanding shares of Class A common stock. Consequently, 15,734 outstanding shares of Class B common stock, and 1,220 outstanding shares of Class C common stock, that were paired with Dutch Bros OpCo Class A common units eliminated as a result of the Reverse Split, were cancelled.
NOTE 2 — Basis of Presentation and Summary of Significant Accounting Policies
Financial Statements Presentation
Our condensed consolidated financial statements as of September 30, 2025 and for the three and nine months ended September 30, 2025 and 2024 have been prepared in accordance with GAAP and pursuant to the rules and regulations of the SEC, consistent in all material respects with those applied in the 2024 Form 10-K and as updated by this Form 10-Q.
We have made estimates and judgments affecting the amounts reported in its condensed consolidated financial statements and the accompanying notes. Although management bases its estimates on historical experience and assumptions that are believed to be reasonable under the circumstances, actual results could differ from those estimates. This report should be read in conjunction with the consolidated financial statements in the 2024 Form 10-K that includes additional information on accounting estimates, policies, and the methods and assumptions used in its estimates.
In the opinion of management, the accompanying condensed consolidated financial statements reflect all adjustments, consisting of normal recurring adjustments, necessary to present fairly our consolidated financial statements for the periods presented. Operating results for the three and nine months ended September 30, 2025 are not necessarily indicative of the results that may be expected for the fiscal year ending December 31, 2025.
Significant Accounting Policies Updates
There have been no material updates to our significant accounting policies during the nine months ended September 30, 2025 from those previously reported in the 2024 Form 10-K.
Recently Issued Accounting Standards
In September 2025, the FASB issued ASU 2025-06, Intangibles - Goodwill and Other - Internal-Use Software (Subtopic 350-40): Targeted Improvements to the Accounting for Internal-Use Software. The intent of this ASU is to address businesses’ shift from using prescriptive and sequential software development methods to using incremental and iterative development methods. The amendments in this ASU remove all references to prescriptive and sequential software development stages, and also provides criteria for when an entity is required to start capitalizing software costs. ASU 2025-06 is effective for all entities' annual reporting periods beginning after December 15, 2027, and interim periods within those annual reporting periods using a prospective transition, modified transition or retrospective transition approach. Early adoption is permitted as of the beginning of an annual reporting period. We will assess potential impacts of this standard on our disclosures in future periods.
In November 2024, the FASB issued ASU No. 2024-03, Income Statement - Reporting Comprehensive Income - Expense Disaggregation Disclosures (Subtopic 220-40). The intent of this ASU is to improve public entity financial footnote disclosures around types of expenses in commonly presented expense categories (i.e., cost of sales; selling, general, and administrative expense; and research and development expense). The amendments in this ASU do not change or remove current expense disclosure requirements, but rather 1) impact where this information appears in the notes to the consolidated financial statements and 2) add additional disclosure requirements for certain expense line items appearing on the face of our consolidated statements of operations. ASU 2024-03, as amended, is effective for annual reporting periods beginning after December 15, 2026 and interim reporting periods beginning after December 15, 2027. Early adoption is permitted. We are currently assessing potential impacts of this standard on our business processes and future disclosures.
In December 2023, the FASB issued ASU No. 2023-09, Income Taxes (Topic 740): Improvements to Income Tax Disclosures. The amendments in this update are intended to enhance the transparency and decision usefulness of income tax disclosures, primarily through improvements to the rate reconciliation and income taxes paid information, specifically requiring (1) consistent categories and greater disaggregation of information in the rate reconciliation, and (2) income taxes paid disaggregation by jurisdiction. These amendments are effective for public business entities' annual periods beginning after December 15, 2024 and interim periods within fiscal years beginning after December 15, 2025, and should be applied on a prospective basis. Early adoption is permitted for annual financial statements that have not yet been issued. We expect to provide additional detail and disclosures under the new guidance in our Form 10-K to be filed for the year ending December 31, 2025.
The following table disaggregates revenue by major component:
Three Months Ended September 30,
Nine Months Ended September 30,
(in thousands)
2025
2024
2025
2024
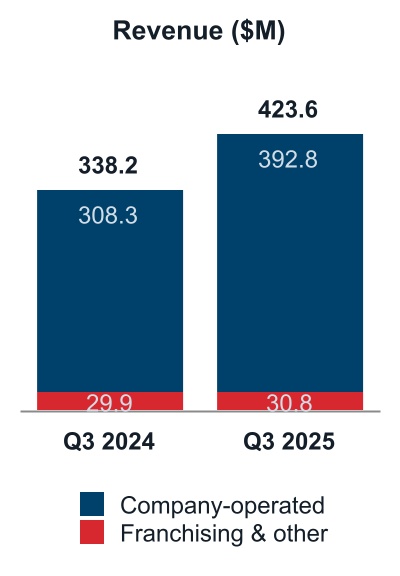
Company-operated shops
$
392,833
$
308,295
$
1,099,754
$
851,648
Franchising
29,122
28,694
89,787
82,545
Other
1,629
1,223
5,008
4,036
Total revenues
$
423,584
$
338,212
$
1,194,549
$
938,229
Deferred Revenue
Components of our deferred revenue liability are as follows:
(in thousands)
September 30, 2025
December 31, 2024
Gift card and loyalty programs
$
50,226
$
48,265
Other deferred revenue, net 1
2,484
2,618
Total deferred revenue
$
52,710
$
50,883
_______________
1 Other deferred revenue, net, are primarily unearned franchise fees.
Deferred revenue activity was as follows:
Nine Months Ended September 30,
(in thousands)
2025
2024
Beginning balance
$
50,883
$
37,025
Revenue deferred 1
405,087
312,963
Revenue recognized 2
(403,126)
(308,012)
Other deferred revenue, net
(134)
129
Ending balance
52,710
42,105
Less: current portion
(45,606)
(35,738)
Deferred revenue, net of current portion
$
7,104
$
6,367
_______________
1 Revenue deferred includes gift card activations, loyalty app cash loads and loyalty points and rewards earned.
2 Revenue recognized includes redemptions of gift cards, loyalty app and loyalty rewards, and breakage.
Revenue recognized during the three and nine months ended September 30, 2025 and 2024, respectively, that was included in the respective deferred revenue liability balances at the beginning of the period are shown below.
Three Months Ended September 30,
Nine Months Ended September 30,
(in thousands)
2025
2024
2025
2024
Gift card redemptions 1
$
756
$
637
$
7,163
$
5,737
Earned franchise fees
110
112
337
336
_____________________
1Amounts exclude cash loads and transactions related to our loyalty rewards program.
Future recognition of initial unearned franchise fees as of September 30, 2025 is as follows:
(in thousands)
Remainder of 2025
$
111
2026
418
2027
373
2028
324
2029
279
Thereafter
979
Total
$
2,484
NOTE 4 — Organization Realignment and Restructurings
On January 29, 2024, our Board of Directors approved an organizational realignment and restructuring plan to expand support operations at our Phoenix, Arizona office. As part of this large-scale initiative, we relocated certain support center staff from our Grants Pass, Oregon headquarters to the Phoenix office. As of March 31, 2025, this initiative was substantially complete, including the build-out and move into our new Phoenix office location. We incurred total aggregate charges of approximately $19.1 million related to this initiative, consisting of (i) approximately $16.6 million in employee-related costs, including relocation, retention and transition costs, termination benefits, and duplicate transition wages and benefits; and (ii) approximately $2.5 million in other costs, including the donation of a building, consulting fees, and duplicate rent. Substantially all of the charges have resulted in current or expected future cash expenditures.
On May 13, 2025, our Board of Directors approved the plan for an additional restructuring program, primarily related to the relocation and streamlining of our remaining back-office operations from our former Grants Pass, Oregon headquarters to our newly-designated Phoenix office corporate headquarters. Affected employees were either offered an opportunity to relocate and continue employment in the Phoenix office or were offered a severance package; these communications were largely completed by May 20, 2025. For this program, we expect to incur total aggregate charges of approximately $8.5 million, consisting of (i) employee-related costs, including relocation, retention and transition costs, termination benefits, and duplicate transition wages and benefits; and (ii) other costs, including consulting fees. Substantially all of the estimated charges are expected to result in current and future cash expenditures. We expect that by December 31, 2025, substantially all of our headquarters employees will be located in our Phoenix office.
During the three and nine months ended September 30, 2025 and 2024, we recorded restructuring charges for employee-related and other costs in selling, general and administrative expenses on the condensed consolidated statements of operations as follows:
As of September 30, 2025 and December 31, 2024, the accruals for corporate restructuring costs are included in accounts payable, accrued compensation and benefits, and accrued expenses on the condensed consolidated balance sheets. The following table summarizes the activity for the restructuring liabilities during the nine months ended September 30, 2025:
(in thousands)
Liability, December 31, 2024
Charges
Cash Payments
Liability, September 30, 2025
Relocation and travel costs
$
698
$
1,903
$
(2,545)
$
56
Termination benefits
2,028
3,324
(3,447)
1,905
Total employee-related costs
2,726
5,227
(5,992)
1,961
Duplicate rent
—
244
(244)
—
Consulting
55
170
(191)
34
Total other costs
55
414
(435)
34
Totals
$
2,781
$
5,641
$
(6,427)
$
1,995
NOTE 5 — Inventories
Inventories, net consist of the following:
(in thousands)
September 30, 2025
December 31, 2024
Raw materials
$
21,835
$
14,594
Finished goods
23,460
21,894
Total inventories
$
45,295
$
36,488
NOTE 6 — Property and Equipment
Property and equipment, net consists of the following:
(dollars in thousands)
Useful Life (Years)
September 30, 2025
December 31, 2024
Software
3
$
13,676
$
10,666
Equipment and fixtures
3
—
7
254,859
229,307
Leasehold improvements
5
—
15
63,864
54,535
Buildings
10
—
39
574,221
487,060
Land
N/A
7,022
7,022
Construction-in-progress 1
N/A
113,571
71,951
Property and equipment, gross
1,027,213
860,541
Less: accumulated depreciation
(237,880)
(176,570)
Property and equipment, net
$
789,333
$
683,971
_______________
1 Construction-in-progress primarily consists of construction and equipment costs for new and existing shops.
The components of lease costs, excluding short-term lease costs and sublease income (both immaterial for the periods presented), were as follows:
Statements of Operations Classification
Three Months Ended September 30,
Nine Months Ended September 30,
(in thousands)
2025
2024
2025
2024
Finance lease costs
Amortization of right-of-use assets
Cost of sales
$
6,969
$
6,429
$
20,254
$
19,059
Amortization of right-of-use assets
Selling, general, and administrative
10
15
40
45
Interest on lease liabilities
Interest expense
5,896
5,541
17,234
16,499
Total finance lease costs
12,876
11,985
37,529
35,603
Operating lease costs
Lease expenses
Cost of sales
10,851
7,656
29,170
20,568
Lease expenses
Selling, general, and administrative
709
680
2,108
959
Total operating lease costs
11,560
8,336
31,278
21,527
Variable lease costs
Cost of sales
2,552
1,747
6,977
4,871
Total lease costs
$
26,988
$
22,068
$
75,784
$
62,001
Supplemental cash flow information related to leases is as follows for the periods presented:
Nine Months Ended September 30,
(in thousands)
2025
2024
Cash paid for amounts included in the measurement of lease liabilities
Operating cash flows from finance leases
$
17,234
$
16,499
Operating cash flows from operating leases1
18,904
17,086
Financing cash flows from finance leases
11,266
7,726
Right-of-use assets obtained in exchange for lease obligations
Finance leases
34,783
12,520
Operating leases
110,050
112,579
_______________
1 For the nine months ended September 30, 2025, the amount presented is net of a $5.4 million tenant improvement allowance received from the landlord related to our Arizona headquarters office lease.
On May 29, 2025 (the Effective Date), we amended and restated our existing $650 million senior secured credit facility, dated February 28, 2022 (as previously amended, the 2022 Credit Facility), with JPMorgan Chase Bank, N.A. as administrative agent (Administrative Agent) and other financial institutions as the lenders party thereto (the 2025 Credit Facility). The 2025 Credit Facility consists of a $500 million revolving credit facility and a term loan facility of up to $150 million. The 2025 Credit Facility also includes sublimits for letters of credit and swingline loans of up to $100 million and $20 million, respectively. The 2025 Credit Facility expires on May 29, 2030 (the Maturity Date). It also contains an option allowing the Loan Parties to increase the size of the 2025 Credit Facility by up to an additional (i) $230 million or (ii) 80% of EBITDAR, whichever is greater, with the agreement of the Administrative Agent and the applicable lenders party thereto.
On the Effective Date, we drew the full $150 million in term loan and $50 million in revolving loans under the 2025 Credit Facility, and all outstanding debt under the 2022 Credit Facility was repaid. As a result of the amendment and restatement, we recognized a loss on debt extinguishment of approximately $2.0 million, comprised of: (i) approximately $1.2 million of fees to intermediaries and other costs related to the 2025 Credit Facility, and (ii) the write-off of approximately $0.8 million unamortized loan costs related to the 2022 Credit Facility. These expenses were recognized in Other income (expense), net on our condensed consolidated statements of operations. In addition, we capitalized approximately $1.5 million of debt issuance costs related to the 2025 Credit Facility in Long-term debt, net of current portion on our condensed consolidated balance sheets.
Interest on borrowings under the 2025 Credit Facility is based on (i) the Alternate Base Rate plus an applicable margin, or (ii) the Term SOFR Rate plus an applicable margin (each as defined in the 2025 Credit Facility), and is payable in accordance with the selected interest rate period and upon maturity. Principal payments for the term loans are required on a quarterly basis in accordance with an amortization schedule up through and including the Maturity Date.
We are required to pay a commitment fee on a quarterly basis, at a per annum rate of between 0.20% and 0.45%, depending on the Net Lease-Adjusted Total Leverage Ratio (as defined in the 2025 Credit Facility), based on the average daily unused portion of the revolving credit facility. These fees are recorded as interest expense on our condensed consolidated statements of operations.
The 2025 Credit Facility contains financial covenants that require us to not exceed a maximum Net Lease-Adjusted Total Leverage Ratio and maintain a minimum Coverage Ratio (as defined in the 2025 Credit Facility). The 2025 Credit Facility also contains certain negative covenants that, among other things, restrict our ability to incur additional debt, grant liens on assets, merge with or acquire other companies, make other investments, dispose of assets, and make restricted payments. Obligations under the 2025 Credit Facility are guaranteed by Dutch Bros OpCo and its subsidiaries, and secured by a first priority perfected security interest in substantially all of the assets of the guarantors.
As of September 30, 2025, $50.0 million was outstanding on our revolving credit facility, and $438.3 million was available for borrowing, net of $11.7 million in letters of credit, and approximately $149.1 million of principal was outstanding on the term loan facility. The revolving loan and term loan both bear interest at approximately 5.83% as of September 30, 2025, excluding any impacts from our interest rate swap. We were in compliance with our financial covenants as of that date.
Our long-term debt consisted of the following for the periods presented:
(in thousands)
September 30, 2025
December 31, 2024
Term loan under credit facility
$
149,063
$
234,688
Revolving loan under credit facility
50,000
—
Finance obligations1
3,022
3,022
Unsecured note payable
208
299
Total debt
202,293
238,009
Less: loan origination fees
(2,417)
(943)
Less: current portion
(3,879)
(17,311)
Total long-term debt, net of current portion
$
195,997
$
219,755
_______________
1 Represents failed sale-leaseback arrangements.
Future annual maturities of long-term debt as of September 30, 2025 are as follows:
(in thousands)
Remainder of 2025
$
970
2026
3,881
2027
5,670
2028
7,500
2029
11,250
Thereafter
173,022
Total
$
202,293
NOTE 10 — Derivative Financial Instruments
We have a receive-variable (Receive Leg), pay-fixed (Pay Leg) interest rate swap with JPMorgan Chase Bank, N.A. As of September 30, 2025, the interest rate swap had a notional amount of approximately $60.4 million and hedges interest rate risk on the term loan under the 2025 Credit Facility. The interest rate swap matures on February 28, 2027, and has a fixed rate of 2.67% per annum for the Pay Leg. The variable rate on the Receive Leg of the interest rate swap is the one-month adjusted term SOFR plus an applicable margin. As of September 30, 2025, the one-month adjusted term SOFR was 4.16%.
Our interest rate swap has been designated as a cash flow hedge, and as such, we record the change in fair value for the effective portion of the interest rate swap in AOCI rather than in current period earnings until the underlying hedged transaction affects earnings. As of September 30, 2025, we expect to reclassify a gain of approximately $0.6 million from AOCI to earnings within the next twelve months.
Designated as a Level 2 instrument within the fair value hierarchy, the fair value and effect of the derivative instrument included in our condensed consolidated financial statements was as follows:
(in thousands)
Balance Sheets Classification
September 30, 2025
December 31, 2024
Derivative instrument designated as cash flow hedge
Interest rate swap contract
Prepaid expenses and other current assets
$
596
$
953
Interest rate swap contract
Other long-term assets
115
832
Total derivative instrument designated as cash flow hedge
$
711
$
1,785
Three Months Ended September 30,
Nine Months Ended September 30,
(in thousands)
Financial Statements Classification
2025
2024
2025
2024
Derivative instrument designated as cash flow hedge
Income (loss) recognized in other comprehensive income before reclassifications
Statements of Comprehensive Income
$
51
$
(1,111)
$
(124)
$
673
Reclassification from accumulated other comprehensive income to earnings for the effective portion
Statements of Operations - Interest expense, net
(278)
(460)
(840)
(1,393)
Income tax benefit
Statements of Operations - Income tax expense
40
247
187
183
The amendment to our credit facility, as discussed in NOTE 9 — Debt, had no impact on our interest rate swap derivative.
NOTE 11 — Income Taxes
Three Months Ended September 30,
Nine Months Ended September 30,
(dollars in thousands)
2025
2024
2025
2024
Income tax expense
$
7,661
$
4,698
$
16,363
$
17,330
Effective tax rate
21.9
%
17.8
%
15.7
%
22.4
%
The effective tax rate for the quarter ended September 30, 2025, was 21.9%, which reflects the US federal statutory rate of 21% on pre-tax income, increased by the impact of state income taxes and offset by the tax benefits of federal tax credits and income attributable to non-controlling interests. The increase in the effective tax rate from 17.8% in the same period in 2024 is primarily due to an increase in valuation allowance related to charitable contributions.
The effective tax rate for the nine months ended September 30, 2025, was 15.7%, which reflects the US federal statutory rate of 21% on pre-tax income, offset by the tax benefits of federal tax credits, income attributable to non-controlling interests, and stock compensation windfall benefits realized during the quarter. The decrease in the effective tax rate from 22.4% in the same period in 2024 is due to tax deductions related to stock-based compensation, as well as the impact of changes in state rates and apportionment on deferred taxes.
In accordance with ASC 740, the effects of changes in tax rates and laws are recognized in the period in which the legislation is enacted. On July 4, 2025, the One Big Beautiful Bill Act (OBBBA) was enacted in the United States. The OBBBA includes significant provisions, including the permanent extension of certain expiring provisions of the Tax Cuts and Jobs Act and the restoration of favorable tax treatment for specific business provisions. The legislation has multiple effective dates, with some provisions taking effect in 2025 and others phased in through 2027. The permanent extension of bonus depreciation provisions in the OBBBA prompted a reassessment of the realizability of our charitable contribution carryforwards during the quarter resulting in the recording of an additional valuation allowance of $1.7 million.
Tax Receivable Agreements
In connection with our IPO, we executed two TRAs which require payment to certain Dutch Bros OpCo owners of 85% of the income tax benefits, if any, that we actually realize or in some cases is deemed to realize (calculated using certain assumptions) as a result of certain tax attributes and benefits covered by the TRAs.
The TRAs-related liabilities are classified on our condensed consolidated balance sheets as current or non-current based on the expected date of payment under the captions “Current portion of tax receivable agreements liability” and “Tax receivable agreements liability, net of current portion,” respectively.
As of September 30, 2025, our total TRAs-related liabilities were $825.8 million.The changes related to these liabilities were as follows:
(in thousands)
September 30, 2025
December 31, 2024
Beginning balance
$
627,834
$
290,920
Additions (reductions) to TRAs:
Exchange of Dutch Bros OpCo Class A common units for Class A common stock
202,680
341,161
Payments under TRA
(4,698)
—
TRAs remeasurements 1
—
(4,247)
Ending balance
$
825,816
$
627,834
Less: current portion
(514)
(71)
TRAs liability, net of current portion
$
825,302
$
627,763
_________________
1 Impact primarily related to state tax rates and adjustments from previous estimates upon finalization of the tax attributes subject to the TRAs.
Total release date fair value of vested equity awards for the nine months ended September 30, 2025 and 2024 are presented below:
Nine Months Ended September 30,
(in thousands, except per share amounts)
2025
2024
Awards/units
W/A vest date fair value
Awards/units
W/A vest date fair value
RSAs
—
$
—
39,752
$
30.99
RSUs
37,988
77.69
3,197
31.34
Equity-Based Compensation
Equity-based compensation expense is recognized on a straight-line basis and is included in our condensed consolidated statements of operations as follows:
As of September 30, 2025, total unrecognized stock-based compensation related to unvested RSUs and PSUs was $34.3 million, which will be recognized as follows:
(in thousands)
Remainder of 2025
$
4,947
2026
16,439
2027
10,655
2028
2,213
Total unrecognized stock-based compensation
$
34,254
NOTE 13 — Non-Controlling Interests
Dutch Bros Inc. is the sole managing member of Dutch Bros OpCo, and, as a result, consolidates the financial results of Dutch Bros OpCo. We report a non-controlling interest representing the economic interest in the Dutch Bros OpCo held by the other members of Dutch Bros OpCo. The OpCo LLC Agreement provides that holders of Dutch Bros OpCo Class A common units may, from time to time, require Dutch Bros OpCo to redeem all or a portion of their Dutch Bros OpCo Class A common units for newly issued shares of Class A common stock on a one-for-one basis. In connection with any redemption or exchange, Dutch Bros Inc. will receive a corresponding number of Dutch Bros OpCo Class A common units, increasing Dutch Bros Inc.’s total ownership in Dutch Bros OpCo. Changes in Dutch Bros Inc.’s ownership in Dutch Bros OpCo, while Dutch Bros Inc. retains its controlling interest in Dutch Bros OpCo, will be accounted for as equity transactions. As such, future redemptions or direct exchanges of Dutch Bros OpCo Class A common units by the other members of Dutch Bros OpCo will result in a change in ownership and reduce the amount recorded as non-controlling interest and increase additional paid-in-capital.
The following table summarizes the ownership interest in Dutch Bros OpCo¹:
September 30, 2025
(units in thousands)
OpCo Units
Ownership %
Dutch Bros OpCo Class A common units held by Dutch Bros Inc.
127,031
71.6
%
Dutch Bros OpCo Class A common units held by non-controlling interest holders
50,481
28.4
%
Total Dutch Bros OpCo Class A common units outstanding
177,512
100.0
%
_______________
1 Dutch Bros OpCo effected a recapitalization on February 7, 2025. For additional information, refer to NOTE 1 — Organization and Background.
The following table summarizes the effect of changes in ownership of Dutch Bros OpCo on our equity for the periods presented:
Three Months Ended September 30,
Nine Months Ended September 30,
(in thousands)
2025
2024
2025
2024
Net income attributable to Dutch Bros Inc.
$
17,495
$
12,644
$
58,472
$
31,646
Other comprehensive loss:
Unrealized loss on derivative securities, effective portion, net of income tax impacts
(122)
(762)
(466)
(234)
Transfers from (to) non-controlling interests:
Increase in additional paid-in capital as a result of equity-based compensation
3,326
1,902
9,567
4,866
Increase (decrease) in additional paid-in capital as a result of common stock issuances pursuant to vesting of equity awards, net of stock withheld for tax
(728)
(36)
(8,499)
1,831
Increase in additional paid-in capital as a result of the acquisition of Dutch Bros OpCo Class A common units
45
8
40,904
110,093
Total effect of changes in ownership interest on equity attributable to Dutch Bros Inc.
$
20,016
$
13,756
$
99,978
$
148,202
The weighted-average ownership percentage for the applicable reporting period is used to attribute net income to Dutch Bros Inc. and the non-controlling interest holders. The non-controlling interest holders’ weighted-average ownership percentage were as follows for the periods presented:
Three Months Ended September 30,
Nine Months Ended September 30,
2025
2024
2025
2024
Weighted-average ownership percentage of non-controlling interest holders
28.5
%
35.8
%
29.7
%
43.7
%
Under the OpCo LLC Agreement, Dutch Bros OpCo is required to make certain distributions to its members with regard to tax obligations. Such distributions paid to members were as follows for the periods presented, and no amounts were payable as of the periods then ended.
The following tables set forth the numerators and denominators used to compute basic and diluted net income per share of Class A and Class D common stock for the periods presented:
Three Months Ended September 30,
Nine Months Ended September 30,
(in thousands)
2025
2024
2025
2024
Numerator:
Net income
$
27,283
$
21,712
$
88,120
$
60,083
Less: Net income attributable to non-controlling interests
9,788
9,068
29,648
28,437
Net income attributable to Dutch Bros Inc.
$
17,495
$
12,644
$
58,472
$
31,646
Three Months Ended September 30,
Nine Months Ended September 30,
(in thousands, except per share amounts)
2025
2024
2025
2024
Basic net income per share attributable to common stockholders
Numerator:
Net income attributable to Dutch Bros Inc.
$
17,495
$
12,644
$
58,472
$
31,646
Denominator:
Weighted-average number of shares of Class A and Class D common stock outstanding - basic ¹
126,986
113,819
124,751
99,756
Basic net income per share attributable to common stockholders ¹
$
0.14
$
0.11
$
0.47
$
0.32
_______________
1 Class D common shares were included in net income per share and weighted-average number of shares calculations in periods prior to June 2024. As of June 2024, all Class D common shares were converted to Class A common shares.
Diluted net income per share attributable to common stockholders
Numerator:
Undistributed net income for basic computation
$
17,495
$
12,644
$
58,472
$
31,646
Increase in net income attributable to common stockholders upon conversion of potentially dilutive instruments
22
22
76
50
Allocation of undistributed net income
$
17,517
$
12,666
$
58,548
$
31,696
Denominator:
Number of shares used in basic computation
126,986
113,819
124,751
99,756
Add: weighted-average effect of dilutive securities
RSAs
—
—
—
12
RSUs
393
433
453
302
Weighted-average number of shares of Class A and Class D common stock outstanding used to calculate diluted net income per share ¹
127,379
114,252
125,204
100,070
Diluted net income per share attributable to common stockholders ¹
$
0.14
$
0.11
$
0.47
$
0.32
_______________
1 Class D common shares were included in net income per share and weighted-average number of shares calculations in periods prior to June 2024. As of June 2024, all Class D common shares were converted to Class A common shares.
The following Class A common stock equivalents were excluded from diluted net income per share in the periods presented because they were anti-dilutive:
Three Months Ended September 30,
Nine Months Ended September 30,
(in thousands)
2025
2024
2025
2024
RSUs
264
160
203
481
PSUs
71
—
61
—
Total anti-dilutive securities
335
160
264
481
NOTE 15 — Commitments and Contingencies
Purchase Obligations
We enter into fixed-price and price-to-be-fixed green coffee purchase commitments. For both fixed-price and price-to-be-fixed purchase commitments, we expect to take delivery of green coffee and to utilize the coffee in a reasonable period of time in the ordinary course of business. Such contracts are used for the normal purchases of green coffee and not for speculative purposes. We do not enter into futures contracts or other derivative instruments related to our green coffee purchase commitments.
We periodically provide guarantees to franchise partners for lease payments. As of September 30, 2025 and December 31, 2024, we had guaranteed approximately $7.9 million and $8.2 million, respectively, in franchise partners’ lease payments and have not established a liability for these guarantees as any liability arising from the guarantees is not material to the condensed consolidated financial statements.
Legal Proceedings
The Company is a party to routine legal actions arising in the ordinary course of and incidental to its business. These claims, legal proceedings, and litigation principally arise from alleged casualty, employment, and other disputes.
In determining loss contingencies, the Company considers the likelihood of loss as well as the ability to reasonably estimate the amount of such loss or liability. An estimated loss is recognized when it is considered probable that a liability has been incurred and when the amount of loss can be reasonably estimated.
Because litigation is inherently unpredictable, assessing contingencies is highly subjective and requires judgments about future events. When evaluating litigation contingencies, we may be unable to provide a meaningful estimate due to a number of factors, including the procedural status of the matter in question, developments in legislation or regulations that affect the validity of certain claims and defenses, the availability of appellate remedies, insurance coverage related to the claim or claims in question, the presence of complex or novel legal theories, and/or the ongoing discovery and development of information important to the matter.
Any claim, proceeding, or litigation has an element of uncertainty, and an unfavorable outcome may have a material adverse effect on the Company’s financial condition, results of operations, or cash flows.
Liabilities Under Tax Receivable Agreements
Under the TRAs, Dutch Bros Inc. is contractually committed to pay the non-controlling interest holders 85% of the amount of any tax benefits that Dutch Bros Inc. actually realizes, or in some cases is deemed to realize, as a result of certain transactions. As of September 30, 2025, Dutch Bros Inc. recognized $825.8 million of liabilities related to its obligations under the TRAs. Refer to NOTE 11 — Income Taxes for additional information.
Related party transactions were as follows for the periods presented:
Three Months Ended September 30,
Nine Months Ended September 30,
(in thousands)
2025
2024
2025
2024
Distributions and TRA payments to Co-Founder and Sponsor ¹
$
—
$
687
$
11,565
$
687
Sales of Company Aircraft ²:
Sales price
—
869
—
9,545
Net book value
—
319
—
8,243
Gain on disposal of Aircraft
—
550
—
1,302
Donations to Dutch Bros Foundation
63
63
2,188
1,688
_______________
1 See NOTE 11 — Income Taxes andNOTE 13 — Non-Controlling Interests for further information.
2 In June 2024 and July 2024, respectively, we sold our airplane, and hangar and related equipment (collectively, the Aircraft), to the Co-Founder.
The Dutch Bros Foundation is a not-for-profit organization founded by our Company that provides philanthropy to local communities. Our Vice Chair, Chief Financial Officer, Chief People Officer, and Chief Legal Officer serve on the board of directors, our Vice Chair serves as the President, and our Chief Legal Officer serves as the Secretary-Treasurer.
NOTE 17 — Segment Reporting
Segment information is prepared on the same basis that our CEO, who is the CODM, manages the segments, evaluates financial results and makes key operating decisions. Our CEO evaluates financial performance based on two operating segments, which offer distinct products and services to different customers: Company-operated shops and Franchising and other. The Company-operated shops segment includes retail coffee shop sales to end consumers. The Franchising and other segment includes bean and product sales to franchise partners, initial franchise fees, royalties, and marketing fees related to the franchise partners, as well as sales of products through our website.
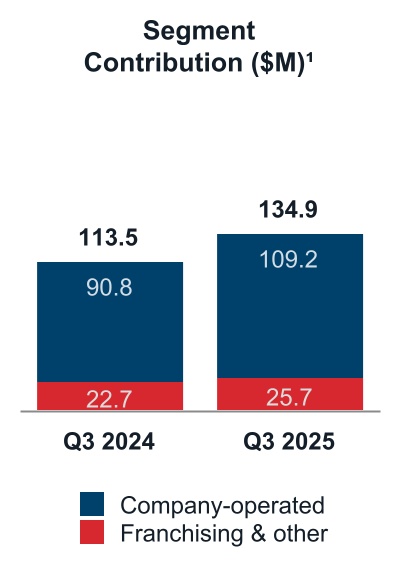
The CODM reviews segment performance and allocates resources based upon segment contribution, which is defined as segment gross profit before depreciation and amortization. Segment contribution is used to monitor and assess segment results compared to prior periods, forecasted results, and our annual operating plan.
All segment revenue is earned in the United States. All intercompany sales amongst the Dutch Bros entities are fully eliminated in consolidation. Further, there are no intersegment revenues. The CODM does not evaluate operating segments using discrete asset information.
Selling, general and administrative expenses primarily consist of unallocated corporate expenses. Unallocated corporate expenses include corporate administrative functions that support the segments but are not directly attributable to or managed by any segment and are not included in the reported financial results of the segments.
No changes have been made to our segments during the three and nine months ended September 30, 2025. In addition, no customer represented 10% or more of total revenue for the three and nine months ended September 30, 2025 and 2024.
Dutch Bros is a high growth operator and franchisor of drive-thru shops that focus on serving high QUALITY, hand-crafted beverages with unparalleled SPEED and superior SERVICE. Founded in 1992 by brothers Dane and Travis Boersma, Dutch Bros began with a double-head espresso machine and a pushcart in Grants Pass, Oregon. Today, we believe that Dutch Bros is one of the fastest-growing brands in the quick service beverage industry in the United States.
Impact of Global Events
General Macroeconomic Uncertainties
As a retailer that is dependent upon consumer discretionary spending, our results of operations are sensitive to changes in macroeconomic conditions. Inflation, coupled with a rise in the U.S. unemployment rate, may have a material adverse effect on our business, financial condition or results of operations. Our customers may have or in the future may have less money available for discretionary purchases and may reduce or stop purchasing our products.
On a macro level, conditions, including changes in tariffs, tax laws, interest rates, inflation, geopolitical conflicts, and significant weather events (such as the 2025 wildfires in California), have created significant uncertainty in the global economy. While we are not able to fully predict the potential impacts of these conditions, we do not currently believe any potential impacts of these macroeconomic conditions would be material to our business.
Minimum Wage Increases
We continued to experience the effects of legislated minimum wage increases that took effect in 2024 in certain states. We expect these pressures to continue to affect our operating results in the foreseeable future. For example, California’s minimum wage increased to $20 per hour effective April 2024 for covered employees in our industry. Additionally, several other states that we operate in have increased their minimum wage requirements in 2025. While these pressures have impacted our operating results, we have taken measures to gradually increase our menu prices, adjust our Dutch Rewards loyalty program, and make operating adjustments that increase productivity to help offset them. Menu price increases may lead to decreases in consumer demand. We will continue to evaluate further pricing actions to protect our operating results, however, if there is a time lag between increasing costs and our ability to increase menu prices or take other action in response, or if we choose not to pass on the cost increases by increasing menu prices, our operating results could be negatively affected.
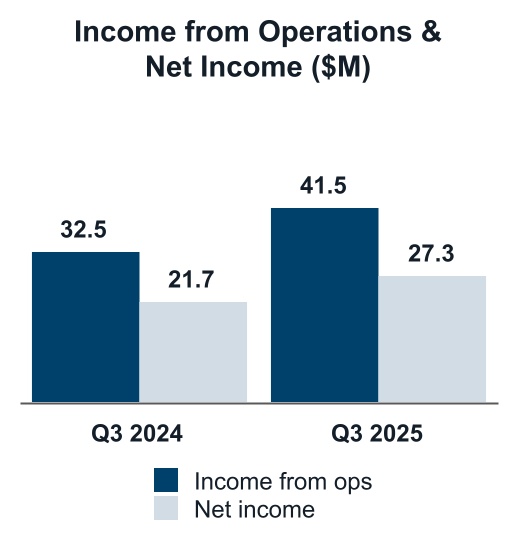
As of September 30, 2025, we had 1,081 systemwide shops in 24 states, an increase of approximately 13.8% from the same period in the prior year. For the three months ended September 30, 2025, we generated $423.6 million of revenue, $27.3 million of net income, and $0.14 of income per diluted share. We have two reportable operating segments: Company-operated shops and Franchising and other.
_________________
1Reconciliation of GAAP to non-GAAP results is provided in the section “Non-GAAP Financial Measures” in Part I, Item 2 “Management’s Discussion and Analysis of Financial Condition and Results of Operations”.
Adjusted selling, general, and administrative expenses 6
57,639
13.6
50,268
14.9
169,845
14.2
138,321
14.7
Net income
27,283
6.4
21,712
6.4
88,120
7.4
60,083
6.4
Adjusted EBITDA 6
78,003
18.4
63,762
18.9
229,912
19.2
181,461
19.3
_________________
1 AUVs are determined based on the net sales for any trailing twelve-month period for systemwide and company-operated shops that have been open a minimum of 15 months. AUVs are calculated by dividing the systemwide and company-operated shops net sales by the total number of systemwide and company-operated shops, respectively. Management uses these metrics as an indicator of shop growth and future expectations of mature locations.
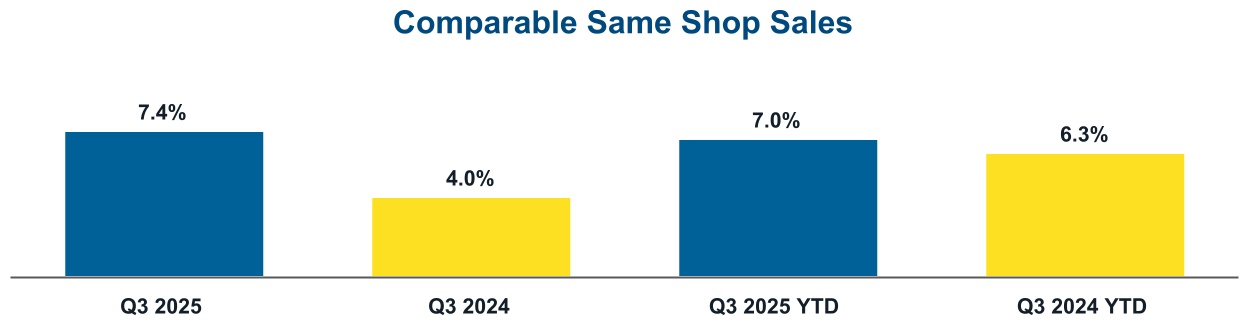
2 Same shop sales represents the estimated percentage change in year-over-year sales, for the comparable shop base, which we define as shops open for 15 complete months or longer as of the first day of the reporting period. Same shop sales can be impacted by changes in customer transaction counts and by changes in the per-ticket amounts. Management uses these metrics as an indicator of shop growth and future expansion strategy. The number of shops included in the systemwide and company-operated comparable bases for the respective periods are presented in the following table.
Three Months Ended September 30,
Nine Months Ended September 30,
(unaudited)
2025
2024
2025
2024
Systemwide shop base
876
716
794
641
Company-operated shops base
582
438
510
370
3 Systemwide sales and systemwide same shop sales are operating measures that include sales at company-operated shops and sales at franchised shops during the comparable periods presented. Franchise sales represent sales at all franchise shops and are revenues to our franchise partners. We do not record franchise sales as revenues; however, our royalty revenues and advertising fund contributions are calculated based on a percentage of franchise sales. As these metrics include sales reported to us by our non-consolidated franchise partners, these metrics should be considered as a supplement to, not a substitute for, our results as reported under GAAP. Management uses these metrics as indicators of our system’s overall financial health, growth and future expansion prospects.
4 Company-operated and franchise shops operating weeks are calculated based on the number of operating days for the shop base and dividing by 7. Our shop base is defined as shops opened as of the period end date. Management uses these metrics as indicators of our system’s overall financial health, growth and future expansion prospects.
5 Dutch Rewards is our digitally based rewards program available exclusively through the Dutch Rewards app.Management uses this metric as an indicator of customer loyalty adoption of our Dutch Rewards app and future promotional plans.
6 Reconciliation of GAAP to non-GAAP results is provided in the section “Non-GAAP Financial Measures” in Part I, Item 2 “Management’s Discussion and Analysis of Financial Condition and Results of Operations.”
Results for our company-operated shops segment were as follows:
Three Months Ended September 30,
Nine Months Ended September 30,
2025
2024
2025
2024
(dollars in thousands; unaudited)
$
%
$
%
$
%
$
%
Company-operated shops revenues
392,833
100.0
308,295
100.0
1,099,754
100.0
851,648
100.0
Beverage, food, and packaging costs
101,875
25.9
78,060
25.3
279,722
25.4
216,923
25.5
Labor costs
108,098
27.5
85,144
27.6
298,807
27.2
230,807
27.1
Occupancy and other costs
66,696
17.0
50,693
16.4
180,607
16.4
136,466
16.0
Pre-opening costs
6,933
1.8
3,551
1.2
17,086
1.6
11,552
1.4
Depreciation and amortization
26,796
6.8
22,470
7.3
77,047
7.0
63,202
7.4
Company-operated shops costs and expenses
310,398
79.0
239,918
77.8
853,269
77.6
658,950
77.4
Company-operated shops gross profit
82,435
21.0
68,377
22.2
246,485
22.4
192,698
22.6
Company-operated shops contribution1
109,231
27.8
90,847
29.5
323,532
29.4
255,900
30.0
_________________
1 Reconciliation of GAAP to non-GAAP results is provided in the section “Non-GAAP Financial Measures” in Part I, Item 2 “Management’s Discussion and Analysis of Financial Condition and Results of Operations.”
Company-operated Shops Segment Performance
Company-operated Shops Revenue
Three Months Ended September 30,
Nine Months Ended September 30,
(dollars in thousands; unaudited)
2025
2024
2025 v. 2024
2025
2024
2025 v. 2024
Company-operated shops revenue
$392,833
$308,295
$84,538
27.4%
$1,099,754
$851,648
$248,106
29.1%
Three Months Ended September 30, 2025 v. 2024
Company-operated shops revenue increased $62.0 million from newly opened shops not yet in the comparable shop base and $22.5 million from a 7.4% increase in same shop sales.
Nine Months Ended September 30, 2025 v. 2024
Company-operated shops revenue increased $194.5 million from newly opened shops not yet in the comparable shop base and $53.6 million from a 7.0% increase in same shop sales.
As a percentage of company-operated shops revenues
25.9%
25.3%
N/A
60 bps
25.4%
25.5%
N/A
(10) bps
Three Months Ended September 30, 2025 v. 2024
As a percentage of company-operated shops revenues, beverage, food and packaging costs increased by 60 basis points. This was primarily due to an increase in coffee costs of 70 basis points, partially offset by the impact of pricing on the comparable shop base.
Nine Months Ended September 30, 2025 v. 2024
As a percentage of company-operated shops revenues, beverage, food and packaging costs decreased by 10 basis points. This was primarily due to a 60 basis point impact of pricing on the comparable shop base, partially offset by an increase in coffee costs.
Labor Costs
Three Months Ended September 30,
Nine Months Ended September 30,
(dollars in thousands; unaudited)
2025
2024
2025 v. 2024
2025
2024
2025 v. 2024
Labor costs
$108,098
$85,144
$22,954
27.0%
$298,807
$230,807
$68,000
29.5%
As a percentage of company-operated shops revenues
27.5%
27.6%
N/A
(10) bps
27.2%
27.1%
N/A
10 bps
Three Months Ended September 30, 2025 v. 2024
As a percentage of company-operated shops revenues, labor costs decreased by 10 basis points primarily due to the impact of pricing and sales leverage, partially offset by increased wages.
Nine Months Ended September 30, 2025 v. 2024
As a percentage of company-operated shops revenues, labor costs increased by 10 basis points. This was primarily due to 80 basis points from increased wages partially offset by a decrease of 60 basis points from the impact of pricing.
As a percentage of company-operated shops revenues
17.0%
16.4%
N/A
60 bps
16.4%
16.0%
N/A
40 bps
Three and Nine Months Ended September 30, 2025 v. 2024
As a percentage of company-operated shops revenues, occupancy and other costs increased by 60 basis points and 40 basis points for the three and nine months ended September 30, 2025, respectively. These increases were primarily due to the impact of occupancy rates from new shops as we shift our lease types to a greater proportion of build-to-suit lease agreements.
Pre-opening Costs
Three Months Ended September 30,
Nine Months Ended September 30,
(dollars in thousands; unaudited)
2025
2024
2025 v. 2024
2025
2024
2025 v. 2024
Pre-opening costs
$6,933
$3,551
$3,382
95.2%
$17,086
$11,552
$5,534
47.9%
As a percentage of company-operated shops revenues
1.8%
1.2%
N/A
60 bps
1.6%
1.4%
N/A
20 bps
New company-operated shops opened
34
33
1
3.0%
89
103
(14)
(13.6)%
Pre-opening costs per new company-operated shop
$204
$108
$95
88.0%
$192
$112
$80
71.4%
Three and Nine Months Ended September 30, 2025 v. 2024
The increase in pre-opening costs was primarily driven by increased travel for setup and training teams, and lease expense related to unopened shops, in the three and nine months ended September 30, 2025 as compared to the same period in 2024.
Depreciation and Amortization
Three Months Ended September 30,
Nine Months Ended September 30,
(dollars in thousands; unaudited)
2025
2024
2025 v. 2024
2025
2024
2025 v. 2024
Depreciation and amortization
$26,796
$22,470
$4,326
19.3%
$77,047
$63,202
$13,845
21.9%
As a percentage of company-operated shops revenues
6.8%
7.3%
N/A
(50) bps
7.0%
7.4%
N/A
(40) bps
Three and Nine Months Ended September 30, 2025 v. 2024
The increase in depreciation and amortization was primarily driven by the increase in the number of company-operated shops in the current period compared to the prior period.
Company-operated Shops Gross Profit and Contribution1
Three Months Ended September 30,
Nine Months Ended September 30,
(dollars in thousands; unaudited)
2025
2024
2025 v. 2024
2025
2024
2025 v. 2024
Company-operated shops gross profit
$82,435
$68,377
$14,058
20.6%
$246,485
$192,698
$53,787
27.9%
As a percentage of company-operated shops revenues
21.0%
22.2%
N/A
(120) bps
22.4%
22.6%
N/A
(20) bps
Company-operated shops contribution 1
$109,231
$90,847
$18,384
20.2%
$323,532
$255,900
$67,632
26.4%
As a percentage of company-operated shops revenues
27.8%
29.5%
N/A
(170) bps
29.4%
30.0%
N/A
(60) bps
_______________________
1 Reconciliation of GAAP to non-GAAP results is provided in the section “Non-GAAP Financial Measures” in Part I, Item 2 “Management’s Discussion and Analysis of Financial Condition and Results of Operations.”
Three and Nine Months Ended September 30, 2025 v. 2024
The company-operated shops gross profit margin decreased by 120 basis points and 20 basis points for the three and nine months ended September 30, 2025, respectively. This was primarily driven by increased coffee costs and labor costs partially offset by leverage from increased sales in the comparable shop base.
Franchising and Other Segment Performance
Three Months Ended September 30,
Nine Months Ended September 30,
(dollars in thousands; unaudited)
2025
2024
2025 v. 2024
2025
2024
2025 v. 2024
Franchising and other revenue
$30,751
$29,917
$834
2.8%
$94,795
$86,581
$8,214
9.5%
Franchising and other gross profit
$24,344
$21,674
$2,670
12.3%
$70,331
$59,483
$10,848
18.2%
As a percentage of franchising and other revenue
79.2%
72.4%
N/A
680 bps
74.2%
68.7%
N/A
550 bps
Three and Nine Months Ended September 30, 2025 v. 2024
The franchising and other gross profit increases for the three and nine months ended September 30, 2025 were primarily driven by products sold to franchisees (net of costs and adjustments), royalties and marketing fees generated from higher franchise partner sales.
The selling, general, and administrative increase of approximately $7.8 million was primarily driven by increased expenses of $5.8 million consisting of investments in human capital to support our revenue growth along with higher performance-based compensation and $1.4 million of higher equity-based compensation. These increases were partially offset by lower realignment and restructuring charges of $1.5 million, as the 2024 realignment program was larger in scope.
Nine Months Ended September 30, 2025 v. 2024
The selling, general, and administrative increase of approximately $27.7 million was primarily driven by increased expenses of $21.2 million consisting of investments in human capital to support our revenue growth and higher performance-based compensation; an increase of $9.5 million related to professional fees and technology services to support our growing business; $4.4 million of higher equity-based compensation; and $2.0 million of increased donations to the Dutch Bros Foundation. These increases were partially offset by lower realignment and restructuring charges of $7.9 million and lower nonrecurring equity offering expenses of $1.5 million.
Other Expense
Three Months Ended September 30,
Nine Months Ended September 30,
(dollars in thousands; unaudited)
2025
2024
2025 v. 2024
2025
2024
2025 v. 2024
Interest expense on finance leases
$
(5,896)
$
(5,541)
$
(355)
6.4%
$
(17,234)
$
(16,499)
$
(735)
4.5%
Other interest expense, net
(799)
(1,328)
529
(39.8)%
(3,652)
(3,760)
108
(2.9)%
Interest expense, net
$
(6,695)
$
(6,869)
$
174
(2.5)%
$
(20,886)
$
(20,259)
$
(627)
3.1%
Other income (expense), net
149
764
(615)
(80.5)%
(1,852)
7,357
(9,209)
N/M
Total other expense
$
(6,546)
$
(6,105)
$
(441)
7.2%
$
(22,738)
$
(12,902)
$
(9,836)
76.2%
Three Months Ended September 30, 2025 v. 2024
The decrease in other income (expense), net was primarily driven by a non-recurring prior year gain on sale of the Company hangar and related equipment to our Co-Founder.
Nine Months Ended September 30, 2025 v. 2024
The decrease in other income (expense), net was primarily driven by remeasurement gains in the prior year related to the TRAs liability, expenses associated with our credit facility refinance in May 2025 (see NOTE 9 — Debt for additional details), and a prior year non-recurring gain on sale of the Company airplane, hangar and related equipment to our Co-Founder.
Income Tax Expense
Three Months Ended September 30,
Nine Months Ended September 30,
(dollars in thousands; unaudited)
2025
2024
2025 v. 2024
2025
2024
2025 v. 2024
Income tax expense
$7,661
$4,698
$2,963
63.1%
$16,363
$17,330
$(967)
(5.6)%
Effective tax rate
21.9%
17.8%
N/A
N/A
15.7%
22.4%
N/A
N/A
Three Months Ended September 30, 2025 v. 2024
The increase in the effective tax rate to 21.9% from 17.8% in the same period in 2024 is primarily due to an increase in valuation allowance related to the realizability of our charitable contributions carryforward.
See NOTE 11 — Income Taxes for additional details.
The decrease in the effective tax rate to 15.7% from 22.4% in the same period in 2024 is due to tax deductions related to stock-based compensation, as well as the impact of changes in state rates and apportionment on deferred taxes.
On July 4, 2025, the One Big Beautiful Bill Act (OBBBA) was enacted in the United States. The OBBBA includes significant provisions, including the permanent extension of certain expiring provisions of the Tax Cuts and Jobs Act and the restoration of favorable tax treatment for specific business provisions. This legislation was enacted during the third quarter of 2025, resulting in an increase to our valuation allowance related to the realizability of our charitable contributions carryforward. Other than the permanent extension of bonus depreciation provisions in the OBBBA, which will lower future cash distributions to our Dutch Bros OpCo owners, we do not expect the effects of this legislation to have a material impact on the Company’s financial results.
See NOTE 11 — Income Taxes for additional details.
Liquidity and Capital Resources
Cash Overview
We had cash and cash equivalents of $267.2 million and $293.4 million as of September 30, 2025 and December 31, 2024, respectively.
For the nine months ended September 30, 2025, our principal sources of liquidity were cash flows from operations and the refinancing of our credit facility. Our principal uses of liquidity for the nine months ended September 30, 2025 were to payoff our prior credit facility, fund our new shop builds and other working capital needs.
Cash Flows
The following table summarizes our cash flows for the periods presented:
Nine Months Ended September 30,
(dollars in thousands; unaudited)
2025
2024
2025 v. 2024
Net cash provided by operating activities
$
215,906
$
184,195
$
31,711
17.2%
Net cash used in investing activities
(169,936)
(169,363)
(573)
0.3
Net cash provided by (used in) financing activities
(72,129)
132,757
(204,886)
(154.3)%
Net increase (decrease) in cash and cash equivalents
$
(26,159)
$
147,589
$
(173,748)
(117.7)%
Cash and cash equivalents at beginning of period
293,354
133,545
159,809
119.7
Cash and cash equivalents at end of period
$
267,195
$
281,134
$
(13,939)
(5.0)%
Operating Activities
The increase in operating activities cash flows was primarily driven by higher net income as a result of year-over-year sales growth and leverage of selling, general and administrative costs.
Investing Activities
The slight increase in investing activities cash outflows was primarily driven by lower investment in capital expenditures due to fewer new company-operated shops openings in the current period compared to the same period in the prior year, partially offset by lower proceeds from disposal of fixed assets.
Financing Activities
The decrease in financing activities cash flows was primarily driven by the net payoff of our 2022 Credit Facility, partially offset by proceeds from our 2025 Credit Facility.
We believe that cash provided by operating activities and proceeds from our 2025 Credit Facility are adequate to fund our debt service requirements, lease obligations, cash distributions required by the OpCo LLC Agreement and the TRAs, and working capital obligations for at least the next 12 months.
Our future capital requirements may vary materially from period to period and will depend on many factors, primarily our expansion and growth by opening additional company-operated shops and/or reacquiring existing franchised shops. Further, the payments that we may be required to make under the TRAs may be significant. We currently expect to fund our current and long-term material capital requirements with operating cash flows and, as needed, additional proceeds from our 2025 Credit Facility, but we may also seek additional debt or equity financing. From time to time, we may explore additional financing sources which could include equity, equity‑linked, and debt financing arrangements.
As of September 30, 2025, cash requirements for the following items have materially changed from our 2024 Form 10-K:
•Operating lease liabilities — increased approximately $195 million from newly commenced leases.
•Debt obligations — decreased approximately $36 million on a net basis primarily due to the payoff of our 2022 Credit Facility, partially offset by proceeds from the 2025 Credit Facility.
Credit Facility
JPMorgan Credit Facility
On May 29, 2025 (the Effective Date), we amended and restated our existing $650 million senior secured credit facility, dated February 28, 2022 (as previously amended, the 2022 Credit Facility), with JPMorgan Chase Bank, N.A. as administrative agent and other financial institutions as the lenders party thereto (the 2025 Credit Facility). The 2025 Credit Facility consists of a $500 million revolving credit facility and a term loan facility of up to $150 million. The 2025 Credit Facility also includes sublimits for letters of credit and swingline loans of up to $100 million and $20 million, respectively. The 2025 Credit Facility expires on May 29, 2030 (the Maturity Date). It also contains an option allowing the Loan Parties to increase the size of the 2025 Credit Facility by up to an additional (i) $230 million or (ii) 80% of EBITDAR, whichever is greater, with the agreement of the Administrative Agent and the applicable lenders party thereto.
On the Effective Date, we drew the full $150 million in term loan and $50 million in revolving loans under the 2025 Credit Facility, and all outstanding debt under the 2022 Credit Facility was repaid.
Interest on borrowings under the 2025 Credit Facility is based on (i) the Alternate Base Rate plus an applicable margin, or (ii) the Term SOFR Rate plus an applicable margin (each as defined in the 2025 Credit Facility), and is payable in accordance with the selected interest rate period and upon maturity. Principal payments for the term loans are required on a quarterly basis in accordance with an amortization schedule up through and including the Maturity Date.
Obligations under the 2025 Credit Facility are guaranteed by Dutch Bros OpCo and certain of its subsidiaries, and secured by a first priority perfected security interest in substantially all of the assets of the guarantors.
Interest Rate Swap Contract
We have an interest rate swap with JPMorgan Chase Bank, N.A. As of September 30, 2025, the interest rate swap had a notional amount of approximately $60 million and hedges interest rate risk on the term loan under the 2025 Credit Facility. The purpose of the floating-to-fixed interest rate swap is to fix the interest base rate charged on the term loan at 2.67% for the notional amount. The interest rate swap matures on February 28, 2027.
The amendment to our credit facility had no impact on our interest rate swap contract.
See NOTE 9 — Debt andNOTE 10 — Derivative Financial Instruments for additional details related to our 2025 Credit Facility and interest rate swap contract.
Organizational Realignment and Restructurings
We expect to recognize additional costs associated with our May 2025 back-office streamlining and restructuring program of approximately $8.5 million, including cash expenditures for (i) employee-related costs and (ii) other costs, including consulting costs.
See NOTE 4 — Organization Realignment and Restructurings for additional details.
Seasonality
Our business is subject to seasonal fluctuations that impact our revenue and company-operated shops gross profit margins. We typically experience higher system sales in the summer months, which impacts revenue and company-operated shops gross profit margins in the second and third quarters of our fiscal year.
Critical Accounting Estimates
There have been no material changes to our critical accounting estimates from those disclosed in our 2024 Form 10-K.
Non-GAAP Financial Measures
In addition to disclosing financial results in accordance with GAAP, this document contains references to the non-GAAP financial measures below. We believe these non-GAAP financial measures provide investors with useful supplemental information about our operating performance, enable comparison of financial trends and results between periods where certain items may vary independent of business performance, and allow for greater transparency with respect to key metrics used by management in operating our business and measuring our performance.
Our non-GAAP financial measures reflect adjustments based on one or more of the following items, as well as the related income tax effects where applicable. Income tax effects have been calculated based on the combined total non-GAAP adjustments using our total effective tax rate. These non-GAAP financial measures should not be considered a substitute for, or superior to, financial measures calculated in accordance with GAAP, and the financial results calculated in accordance with GAAP and reconciliations from these results should be carefully evaluated.
Segment contribution
Definition and/or calculation
Segment gross profit, before depreciation and amortization.
Usefulness to management and investors
This non-GAAP measure is used by our management in making performance decisions without the impact of non-cash depreciation and amortization charges. This is a standard metric used across our industry by investors.
EBITDA, Adjusted EBITDA
EBITDA — definition and/or calculation
Net income before interest expense (net of interest income), income tax expense, and depreciation and amortization expense.
Defined as EBITDA, excluding equity-based compensation, expenses associated with equity offerings, expenses associated with credit facility refinancing, executives transitions costs, (gain) loss on the remeasurement of the liability related to the TRAs, sale of Aircraft, and organization realignment and restructurings costs.
Usefulness to management and investors
These non-GAAP measures are supplemental operating performance measures we believe facilitate comparisons to historical performance and competitors’ operating results. We believe these non-GAAP measures presented provide investors with a supplemental view of our operating performance that facilitates analysis and comparisons of our ongoing business operations because they exclude items that may not be indicative of our ongoing operating performance.
Adjusted selling, general, and administrative
Definition and/or calculation
Selling, general, and administrative expenses, excluding depreciation and amortization, equity-based compensation expense, expenses associated with equity offerings, executive transitions costs, and organization realignment and restructurings costs.
Usefulness to management and investors
This non-GAAP measure is used as a supplemental measure of operating performance that we believe is useful to evaluate our performance period over period and relative to our competitors. We believe the non-GAAP measure presented provides investors with a supplemental view of our operating performance that facilitates analysis and comparisons of our ongoing business operations because it excludes items that may not be indicative of our ongoing operating performance.
Non-GAAP adjustments
Below are the definitions of the non-GAAP adjustments that are used in the calculation of our non-GAAP measures, as described above.
Equity-based compensation
Non-cash expenses related to the grant and vesting of stock awards, including RSAs, RSUs and PSUs, in Dutch Bros Inc. to certain eligible employees.
Expenses associated with equity offerings
Costs incurred as a result of our equity offerings, including secondary offerings by our Sponsor. These costs include, but are not limited to, legal fees, consulting fees, tax fees, and accounting fees.
Expenses associated with 2022 credit facility refinancing
Costs incurred as a result of refinancing our credit facility in May 2025, including write-off of unamortized loan costs related to the amendment and restatement of our 2022 Credit Facility, and intermediary fees and other costs related to our 2025 Credit Facility.
Executive transitions
Employee severance and related benefit costs, as well as sign-on bonus(es) for several executive-level transitions occurring in 2022 and 2023, and amortized through the first quarter of 2024.
TRAs remeasurements
(Gain) loss impacts related to adjustments of our TRAs liabilities.
Sale of Aircraft
Gain impact related to the sale of the Company airplane, hangar and related equipment to our Co-Founder.
Fees and costs, including consulting, employee-related and other costs, in connection with our comprehensive initiatives to develop and implement a long-term strategy involving changes to our organizational structure to support our growth. Our 2024 initiative resulted in realignment activities that occurred in 2023, and restructuring activities to expand our support center operations in Phoenix, Arizona including the build out and move into our new office, that commenced in 2024, and were substantially completed in March 2025. The activities related to our 2025 initiative, which commenced in May 2025 and are expected to continue through at least the first half of 2026, primarily relate to relocation and streamlining of our remaining back-office operations to our new Phoenix, Arizona corporate headquarters. Given the magnitude and scope of these strategic initiatives, we do not expect such costs will recur in the foreseeable future, and do not consider such costs reflective of the ongoing costs necessary to operate our business.
The following are reconciliations of the most comparable GAAP metric to non-GAAP metrics (presented in dollars and as a percentage of revenue):
ITEM 3. QUANTITATIVE AND QUALITATIVE DISCLOSURES ABOUT MARKET RISK
Commodity Risks
Our profitability is dependent on, among other things, our ability to anticipate and react to changes in the costs of key operating resources, including beverage commodities, energy, and other commodities. We have been able to partially offset cost increases resulting from several factors, including market conditions, shortages or interruptions in supply due to weather or other conditions beyond our control, governmental regulations, and inflation by increasing our menu prices over the past year, and making operational adjustments that increase productivity. However, tariffs, sustained inflation of, or substantial increases in costs and expenses, including dairy, coffee, fuel, sugar, cocoa, and packaging commodities pricing, could impact our operating results to the extent that such costs and expenses remain elevated or increase and cannot be offset by menu price increases. Additionally, if there is a time lag between increasing commodity prices and our ability to increase menu prices or take other action in response, or if we choose not to pass on the cost increases by increasing menu prices, our operating results could be negatively affected.
Labor Costs
We have experienced minimum wage increases, which directly affect our labor costs, and other upward pressure on wage rates in several states, including in California beginning in April 2024. Additionally, several other states that we operate in have increased their minimum wage requirements in 2025. In the future, we may or may not be able to offset these cost increases with operational efficiencies, menu price increases, or other adjustments. As of September 30, 2025, we employed approximately 21,000 hourly workers in our company-operated shops.
Interest Rate Risk
We have historically been exposed to interest rate risk through fluctuations in interest rates on our debt obligations. Our 2025 Credit Facility carries interest at a floating rate. We seek to manage exposure to adverse interest rate changes through our normal operating and financing activities, including through the use of interest rate swaps to mitigate the potential impacts of changes in benchmark interest rates on interest expense and cash flows. As of September 30, 2025, we had $50.0 million in revolving loans outstanding, and $149.1 million was outstanding on our term loan facility. A hypothetical increase of interest rates up to 1% on our outstanding term loan as of September 30, 2025 would result in an increase in our annual interest expense of approximately $2.0 million, excluding any potential impacts of interest rate swaps.
Impact of Inflation
The primary inflation factors affecting our operations are commodity and supply costs, energy costs, labor costs, and construction costs of company-operated shops. Increases in the minimum wage requirements directly affect our labor costs. Our leases require us to pay taxes, maintenance, repairs, insurance, and utilities, all of which are generally subject to inflationary increases. Finally, the total cost to build our shops is impacted by inflation. Specifically, increases in sitework and permitting, construction materials, labor, and equipment may increase our overall development costs and capital expenditures, and potentially result in higher rent expenses for new shops. We continue to encounter current commodity inflation, known or pending legislation that will increase minimum wages in certain states, and labor market forces that at times may cause us to increase wages in order to adequately staff our shops. We expect these to affect our operating results in the foreseeable future. While these cost increases have impacted our operating results, we have taken measures to gradually increase our menu prices, adjust our Dutch Rewards loyalty program, and make operating adjustments that increase productivity to help offset these pressures. Price increases and other inflationary pressures may lead to decreases in consumer demand.
As of September 30, 2025, under the supervision and with the participation of our management, including the Chief Executive Officer and Chief Financial Officer, we evaluated the effectiveness of the design and operation of our disclosure controls and procedures, as defined in Rule 13(a)-15(e) of the Securities Exchange Act of 1934, as amended (the Exchange Act). Based on the evaluation, our Chief Executive Officer and Chief Financial Officer have concluded that our disclosure controls and procedures were effective as of that date.
Changes in Internal Control over Financial Reporting
There have been no changes during the three months ended September 30, 2025 that have materially affected, or are reasonably likely to materially affect, our internal control over financial reporting.
We may, from time to time, be a party to litigation and subject to claims incident to the ordinary course of business. As our company matures, we may become party to an increasing number of litigation matters and claims. The outcome of litigation and claims cannot be predicted with certainty, and the resolution of these matters could materially and adversely affect our business, financial condition, results of operations, and growth prospects.
Please refer to NOTE 15 — Commitments and Contingencies under the heading “Legal Proceedings” for further information.
ITEM 1A. RISK FACTORS
Except for the items noted below, there have been no material changes in our risk factors from those disclosed in Part I, Item 1A of our 2024 Form 10-K. The risk factors described in our 2024 Form 10-K, as well as other information set forth in this Quarterly Report on Form 10-Q, could materially and adversely affect our business, financial condition and results of operations, and should be carefully considered. The risks and uncertainties that we face, however, are not limited to those described in the 2024 Form 10-K. Additional risks and uncertainties not presently known to us or that we currently believe to be immaterial may also adversely affect our business and the trading price of our Class A common stock.
International trade policies, including tariffs, sanctions and trade barriers may adversely affect our business, financial condition, results of operations, and prospects.
Substantial new U.S. tariffs and other restrictive trade policies have created a dynamic and unpredictable trade landscape, which may adversely impact our business.
Current or future tariffs or other restrictive trade measures may significantly raise the costs of our imported green coffee beans and other goods, which may adversely impact our product offerings, operational expenses, and construction costs. Such cost increases may reduce our margins and require us to increase prices, which could harm our competitive position, reduce customer demand, and damage customer relationships. Our suppliers and distribution channels are also affected by the current trade environment, and we and they may experience supply chain disruptions as a result of increased costs and uncertainty, as well as risks to the long-term viability of key suppliers, which may impact our ability to meet customer demand or manage inventory efficiently. Tariff and other trade-related cost pressures and supply chain disruptions may lead to reputational harm if we are unable to supply our shops with sufficient products or supply products on expected timelines, or if any price increases are poorly received by customers. In addition, evolving trade policies, including tariffs and trade restrictions, may decrease consumer discretionary spending and result in decreased demand for our products.
Trade disputes, trade restrictions, tariffs and other geopolitical tensions between the U.S. and other countries may also exacerbate unfavorable macroeconomic conditions including inflationary pressures, foreign exchange volatility, financial market instability, and economic recessions or downturns, which may also necessitate pricing actions and result in a negative impact on customer demand for our products, limit expansion opportunities, limit our access to capital, or otherwise negatively impact our business and operations. Ongoing tariff, trade restrictions and macroeconomic uncertainty may contribute to volatility in the price of our Class A common stock.
Ongoing uncertainty regarding trade policies may also complicate our short- and long-term strategic planning, and that of our suppliers and distributors, including decisions regarding hiring, product strategy, capital investment, supply chain design, and geographic expansion.
While we continue to monitor trade developments, the ultimate impact of these risks remains uncertain and any prolonged economic downturn, escalation in trade tensions, or deterioration in international perception of U.S.-based companies could materially and adversely affect our business, results of operations, financial condition, and prospects. In addition, tariffs and other trade developments have and may continue to heighten the risks related to the other risk factors described in our 2024 Form 10-K.
Legislation and regulations requiring the display and provision of nutritional information for our menu offerings, and new information, attitudes, or regulations regarding additives, diet and health or adverse opinions about the health effects of consuming our menu offerings, could affect consumer preferences and negatively impact our business, financial condition, and results of operations.
Government regulation and customer consumption habits may impact our business as a result of changes in attitudes regarding diet and health (including use of weight-loss or appetite-suppressing drugs) or new information regarding the health effects of consuming our menu offerings. These changes have resulted in, and may continue to result in, the enactment of laws and regulations that impact the ingredients and nutritional content of our menu offerings, or laws and regulations requiring us to disclose the nutritional content of our food offerings.
For example, a number of states, counties, and cities have enacted menu labeling laws requiring multi-unit restaurant operators to disclose certain nutritional information to customers, or have enacted legislation restricting the use of certain types of ingredients in food sold at restaurants. Furthermore, the Patient Protection and Affordable Care Act of 2010 (the PPACA) establishes a uniform, federal requirement for certain restaurants to post certain nutritional information on their menus. Specifically, the PPACA amended the Federal Food, Drug and Cosmetic Act to require certain chain restaurants to publish the total number of calories of standard menu items on menus and menu boards, along with a statement that puts this calorie information in the context of a total daily calorie intake. The PPACA also requires covered restaurants to provide to consumers, upon request, a written summary of detailed nutritional information for each standard menu item, and to provide a statement on menus and menu boards about the availability of this information. The PPACA further permits the Food and Drug Administration to require covered restaurants to make additional nutrient disclosures, such as disclosure of trans-fat content. More recently, U.S. regulatory authorities, including the Food and Drug Administration, have indicated their intent to restrict or prohibit the use of certain food dyes currently permitted for lawful use in the food supply by the end of 2026. The Food and Drug Administration continues to develop a revised post-market food chemical review program. Furthermore, an increasing number of states have proposed or enacted laws prohibiting or limiting the use of certain food and color additives and state enforcement actions and investigations into their use are underway. Should such regulatory change affect the ingredients currently used in our products and we are unable to identify or secure comparable and cost-effective alternative ingredients, such change could have an adverse effect on our results of operations and financial position. An unfavorable report on, or reaction to, our current or future menu ingredients, the size of our portions, or the nutritional content of our menu items could negatively influence the demand for our offerings.
We cannot make any assurances regarding our ability to effectively respond to changes in customer health perceptions or our ability to successfully implement nutrient content disclosure requirements or other resulting regulations, including potential regulations around the use of certain ingredients, dyes, or other additives, or to adapt our menu offerings to trends in drinking and consumption habits. The imposition of menu-labeling laws, additional restrictions on certain food additives, and such other regulations could have an adverse effect on our results of operations and financial position, as well as the food service and restaurant industry in general.
We may be unable to identify all potential allergens present in our products at the time of purchase, whether they were introduced by us or by our third party vendors. This could result in the inability of some customers to purchase our products, or could result in negative health consequences for individuals sensitive to such allergens who choose to purchase our products regardless. A potentially serious allergic reaction to our products may result in negative public perception and could harm our business and results of operations.
In addition, social media has contributed to an increase in “secret menu” style drinks that are not created or marketed by us. Such drinks can be ordered by customers, for example, by asking for specific combinations of flavors or ingredients. We have no control over such trends, may not become timely aware of them, and may be unable to provide nutritional information for them. Such trends may also result in a mixture of ingredients in ways that could be perceived negatively, including with regard to health effects, and such perception could harm our business.
ITEM 2. UNREGISTERED SALES OF EQUITY SECURITIES AND USE OF PROCEEDS
Issuer Purchases of Equity Securities
The following table summarizes purchases of Class A common stock during the three months ended September 30, 2025:
Period
Total Number of Shares Purchased 1
Weighted-Average Price Paid Per Share
Total Number of Shares Purchased as Part of Publicly Announced Plans or Programs
Maximum Number (or Approximate Dollar Value) of Shares that May Yet Be Purchased Under the Plans or Programs
July 1 - 31, 2025
15,159
$67.10
N/A
N/A
August 1 - 31, 2025
—
—
—
—
September 1 - 30, 2025
—
—
—
—
_________________
1 In connection with the vesting of RSUs granted pursuant to the Dutch Bros Inc. 2021 Equity Incentive Plan, as amended, shares of Class A common stock are delivered to Dutch Bros by employees to satisfy tax withholding obligations.
Unregistered Sales of Equity Securities
On August 28, 2025, pursuant to Section 3(a)(9) of the Securities Act, we made an unregistered issuance of Dutch Bros Inc.’s Class A common stock via exchange of 67,500 Dutch Bros OpCo Class A common units (and corresponding cancellation of the same number of shares of Class C common stock) held by our Sponsor for shares of our Class A common stock on a one-for-one basis. Such shares of Class A common stock were then sold directly by our Sponsor pursuant to Rule 144 of the Securities Act, and we received no proceeds.
Additionally, during the three months ended March 31, 2025, pursuant to Section 3(a)(9) of the Securities Act, we made unregistered issuances of Dutch Bros Inc.’s Class A common stock via exchange of an aggregate total of 1,196,703 Dutch Bros OpCo Class A common units (and corresponding cancellation of the same number of shares of Class C common stock) held by our Sponsor for shares of our Class A common stock on a one-for-one basis. Such shares of Class A common stock were then sold directly by our Sponsor pursuant to Rule 144 of the Securities Act, and we received no proceeds.
On August 11, 2025, Christine Barone, our Chief Executive Officer and President, adopted a Rule 10b5-1 trading arrangement (the Trading Plan), providing for the sale of up to 42,031 shares of our Class A common stock. The Trading Plan’s expiration date is July 31, 2026. The Trading Plan is intended to satisfy the affirmative defense conditions of Rule 10b5-1(c) under the Exchange Act.
Cover Page with Interactive Data File (formatted as Inline XBRL with applicable taxonomy extension information contained in Exhibits 101)
X
_______________________
† Management contract or compensatory plan or arrangement.
* The certifications furnished in Exhibit 32.1 hereto are deemed to accompany this Quarterly Report on Form 10-Q and will not be deemed "filed" for purposes of Section 18 of the Securities Exchange Act of 1934, as amended, except to the extent that the registrant specifically incorporates it by reference.
Pursuant to the requirements of the Securities Exchange Act of 1934, the Registrant has duly caused this report to be signed on its behalf by the undersigned thereunto duly authorized.
 ), Dutch Bros Blue Rebel, and our other registered and common law trade names, trademarks and service marks are the property of Dutch Bros Inc. All other trademarks, trade names, and service marks appearing in this Form 10-Q are the property of their respective owners. Solely for convenience, the trademarks and trade names in this Form 10-Q may be referred to without the ® and ™ symbols, but such references should not be construed as any indicator that their respective owners will not assert their rights thereto.