GOLUB CAPITAL DIRECT LENDING CORPORATION EARNINGS PRESENTATION QUARTER ENDED DECEMBER 31, 2025
2 Such forward-looking statements may include statements preceded by, followed by or that otherwise include the words “may,” “might,” “will,” “intend,” “should,” “could,” “can,” “would,” “expect,” “believe,” “estimate,” “anticipate,” “predict,” “potential,” “plan” or similar words. We have based the forward-looking statements included in this presentation on information available to us on the date of this presentation. Actual results could differ materially from those anticipated in our forward-looking statements and future results could differ materially from historical performance. We undertake no obligation to revise or update any forward-looking statements, whether as a result of new information, future events or otherwise. You are advised to consult any additional disclosures that we make directly to you or through reports that we have filed or in the future file with the Securities and Exchange Commission (“SEC”), including annual reports on Form 10-K, quarterly reports on Form 10-Q and current reports on Form 8-K. This presentation contains statistics and other data that have been obtained from or compiled from information made available by third-party service providers. We have not independently verified such statistics or data. In evaluating prior performance information in this presentation, you should remember that past performance is not a guarantee, prediction, or projection of future results, and there can be no assurance that we will achieve similar results in the future. Some of the statements in this presentation constitute forward-looking statements, which relate to future events or our future performance or financial condition. The forward-looking statements contained in this presentation involve risks and uncertainties, including statements as to: our future operating results; our business prospects and the prospects of our portfolio companies, including our and their ability to achieve our respective objectives due to disruptions, including, without limitation, those caused by global health pandemics or other large scale events; the effect of investments that we expect to make and the competition for those investments; our contractual arrangements and relationships with third parties; actual and potential conflicts of interest with GC Advisors LLC (“GC Advisors”), our investment adviser, and other affiliates of Golub Capital LLC (collectively, “Golub Capital”); the dependence of our future success on the general economy and its effect on the industries in which we invest; the ability of our portfolio companies to achieve their objectives; the use of borrowed money to finance a portion of our investments; the adequacy of our financing sources and working capital; the timing of cash flows, if any, from the operations of our portfolio companies; general economic and political trends and other external factors, changes in political, economic or industry conditions, the interest rate environment or conditions affecting the financial and capital markets that could result in changes to the value of our assets; elevated levels of inflation, and its impact on us, on our portfolio companies and on the industries in which we invest; the ability of GC Advisors to locate suitable investments for us and to monitor and administer our investments; the ability of GC Advisors or its affiliates to attract and retain highly talented professionals; the ability of GC Advisors to continue to effectively manage our business due to disruptions, including those caused by global health pandemics or other large scale events; turmoil in Ukraine, Russia and the Middle East, including sanctions related to such turmoil, and the potential for volatility in energy prices and other supply chain issues and any impact on the industries in which we invest; our ability to qualify and maintain our qualification as a regulated investment company and as a business development company; the impact of information technology systems and systems failures, including data security breaches, data privacy compliance, network disruptions, and cybersecurity attacks; general price and volume fluctuations in the stock markets; the impact on our business of the Dodd-Frank Wall Street Reform and Consumer Protection Act and the rules and regulations issued thereunder and any actions toward repeal thereof; and the effect of changes to tax legislation and our tax position. Disclaimer
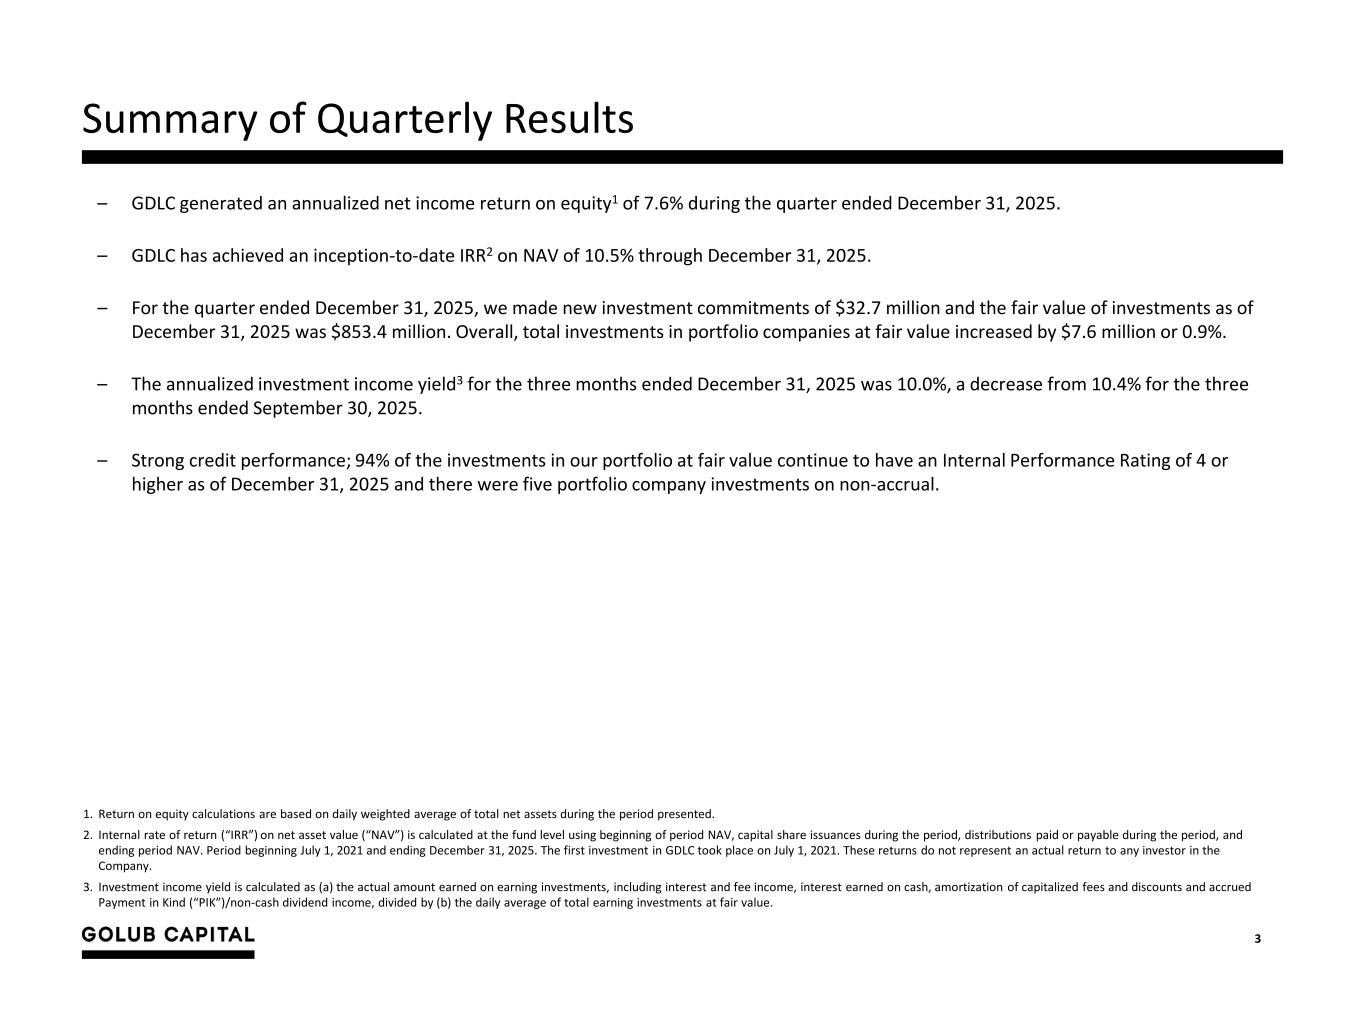
3 Summary of Quarterly Results – GDLC generated an annualized net income return on equity1 of 7.6% during the quarter ended December 31, 2025. – GDLC has achieved an inception-to-date IRR2 on NAV of 10.5% through December 31, 2025. – For the quarter ended December 31, 2025, we made new investment commitments of $32.7 million and the fair value of investments as of December 31, 2025 was $853.4 million. Overall, total investments in portfolio companies at fair value increased by $7.6 million or 0.9%. – The annualized investment income yield3 for the three months ended December 31, 2025 was 10.0%, a decrease from 10.4% for the three months ended September 30, 2025. – Strong credit performance; 94% of the investments in our portfolio at fair value continue to have an Internal Performance Rating of 4 or higher as of December 31, 2025 and there were five portfolio company investments on non-accrual. 1. Return on equity calculations are based on daily weighted average of total net assets during the period presented. 2. Internal rate of return (“IRR”) on net asset value (“NAV”) is calculated at the fund level using beginning of period NAV, capital share issuances during the period, distributions paid or payable during the period, and ending period NAV. Period beginning July 1, 2021 and ending December 31, 2025. The first investment in GDLC took place on July 1, 2021. These returns do not represent an actual return to any investor in the Company. 3. Investment income yield is calculated as (a) the actual amount earned on earning investments, including interest and fee income, interest earned on cash, amortization of capitalized fees and discounts and accrued Payment in Kind (“PIK”)/non-cash dividend income, divided by (b) the daily average of total earning investments at fair value.
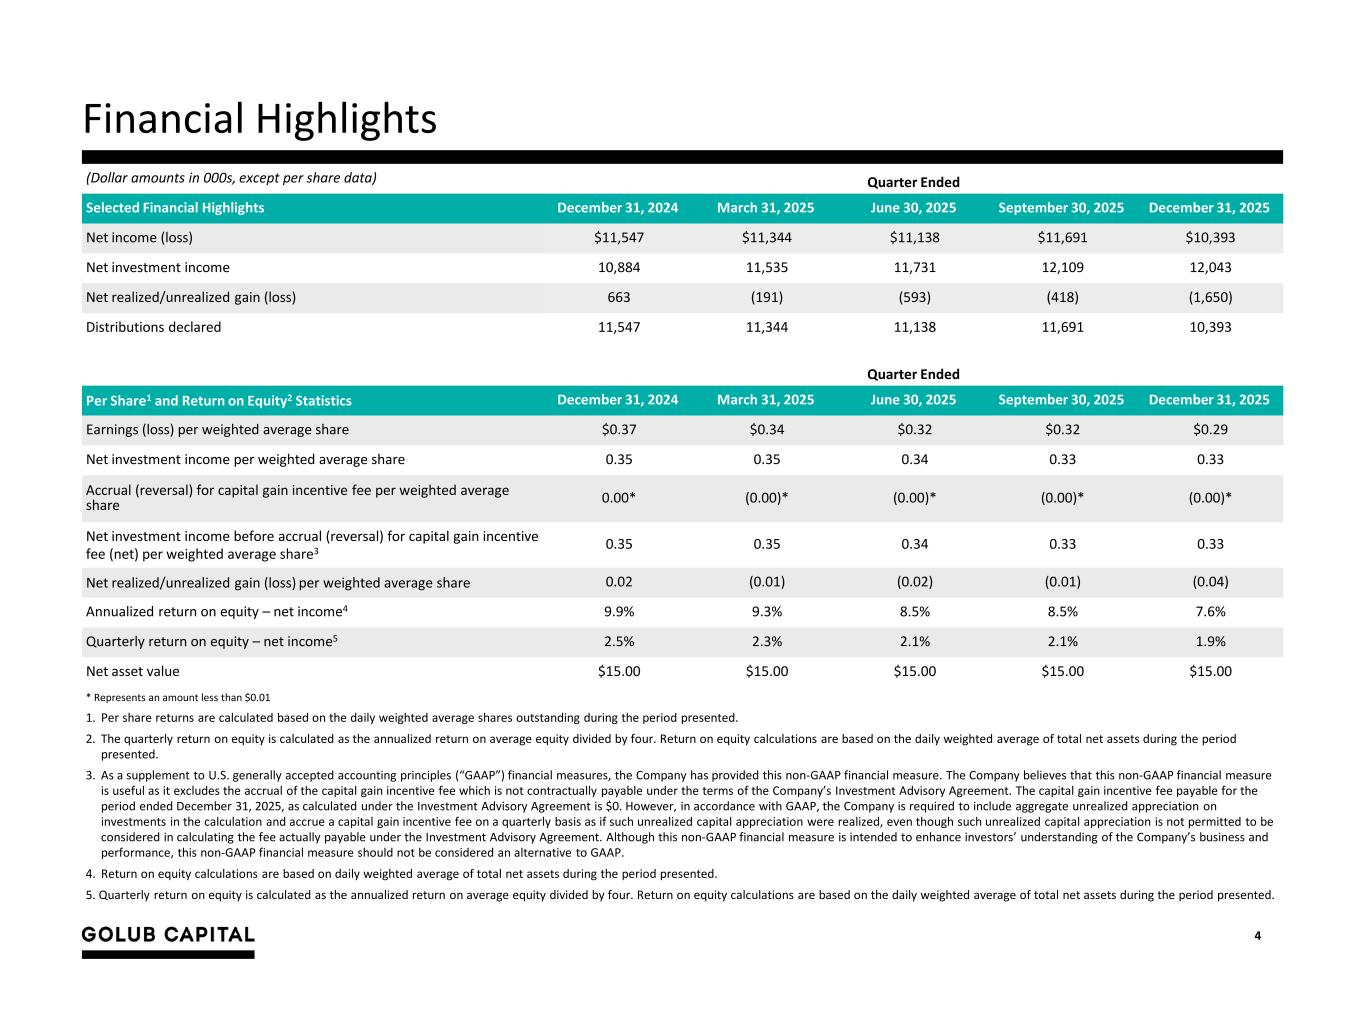
4 Financial Highlights (Dollar amounts in 000s, except per share data) Quarter Ended Selected Financial Highlights December 31, 2024 March 31, 2025 June 30, 2025 September 30, 2025 December 31, 2025 Net income (loss) $11,547 $11,344 $11,138 $11,691 $10,393 Net investment income 10,884 11,535 11,731 12,109 12,043 Net realized/unrealized gain (loss) 663 (191) (593) (418) (1,650) Distributions declared 11,547 11,344 11,138 11,691 10,393 Quarter Ended Per Share1 and Return on Equity2 Statistics December 31, 2024 March 31, 2025 June 30, 2025 September 30, 2025 December 31, 2025 Earnings (loss) per weighted average share $0.37 $0.34 $0.32 $0.32 $0.29 Net investment income per weighted average share 0.35 0.35 0.34 0.33 0.33 Accrual (reversal) for capital gain incentive fee per weighted average share 0.00* (0.00)* (0.00)* (0.00)* (0.00)* Net investment income before accrual (reversal) for capital gain incentive fee (net) per weighted average share3 0.35 0.35 0.34 0.33 0.33 Net realized/unrealized gain (loss) per weighted average share 0.02 (0.01) (0.02) (0.01) (0.04) Annualized return on equity – net income4 9.9% 9.3% 8.5% 8.5% 7.6% Quarterly return on equity – net income5 2.5% 2.3% 2.1% 2.1% 1.9% Net asset value $15.00 $15.00 $15.00 $15.00 $15.00 * Represents an amount less than $0.01 1. Per share returns are calculated based on the daily weighted average shares outstanding during the period presented. 2. The quarterly return on equity is calculated as the annualized return on average equity divided by four. Return on equity calculations are based on the daily weighted average of total net assets during the period presented. 3. As a supplement to U.S. generally accepted accounting principles (“GAAP”) financial measures, the Company has provided this non-GAAP financial measure. The Company believes that this non-GAAP financial measure is useful as it excludes the accrual of the capital gain incentive fee which is not contractually payable under the terms of the Company’s Investment Advisory Agreement. The capital gain incentive fee payable for the period ended December 31, 2025, as calculated under the Investment Advisory Agreement is $0. However, in accordance with GAAP, the Company is required to include aggregate unrealized appreciation on investments in the calculation and accrue a capital gain incentive fee on a quarterly basis as if such unrealized capital appreciation were realized, even though such unrealized capital appreciation is not permitted to be considered in calculating the fee actually payable under the Investment Advisory Agreement. Although this non-GAAP financial measure is intended to enhance investors’ understanding of the Company’s business and performance, this non-GAAP financial measure should not be considered an alternative to GAAP. 4. Return on equity calculations are based on daily weighted average of total net assets during the period presented. 5. Quarterly return on equity is calculated as the annualized return on average equity divided by four. Return on equity calculations are based on the daily weighted average of total net assets during the period presented.
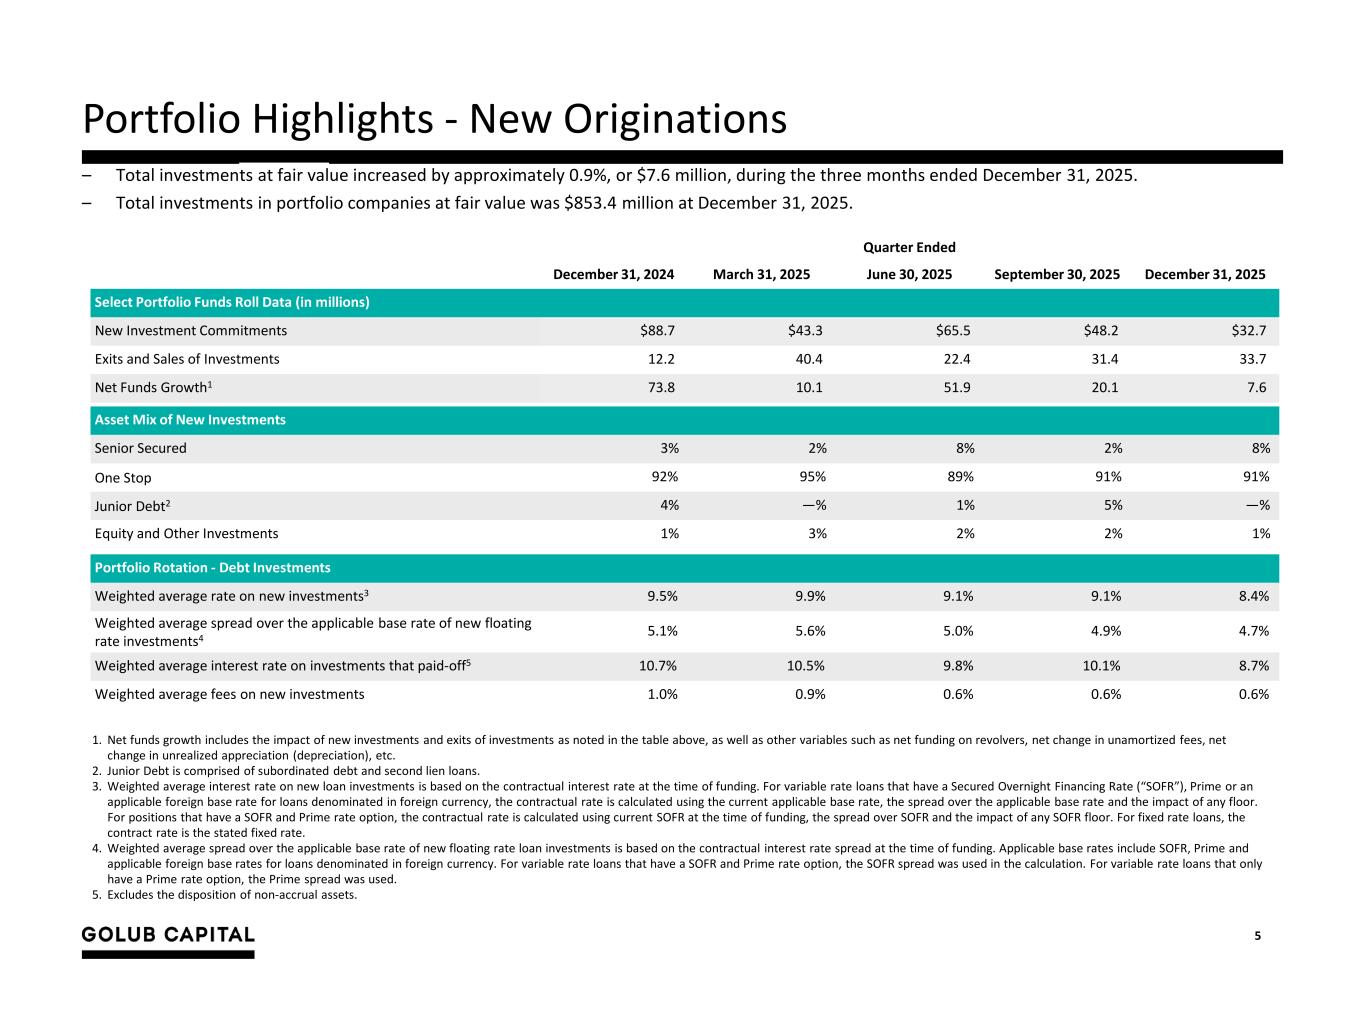
5 Portfolio Highlights - New Originations Quarter Ended December 31, 2024 March 31, 2025 June 30, 2025 September 30, 2025 December 31, 2025 Select Portfolio Funds Roll Data (in millions) New Investment Commitments $88.7 $43.3 $65.5 $48.2 $32.7 Exits and Sales of Investments 12.2 40.4 22.4 31.4 33.7 Net Funds Growth1 73.8 10.1 51.9 20.1 7.6 Asset Mix of New Investments Senior Secured 3% 2% 8% 2% 8% One Stop 92% 95% 89% 91% 91% Junior Debt2 4% —% 1% 5% —% Equity and Other Investments 1% 3% 2% 2% 1% Portfolio Rotation - Debt Investments Weighted average rate on new investments3 9.5% 9.9% 9.1% 9.1% 8.4% Weighted average spread over the applicable base rate of new floating rate investments4 5.1% 5.6% 5.0% 4.9% 4.7% Weighted average interest rate on investments that paid-off5 10.7% 10.5% 9.8% 10.1% 8.7% Weighted average fees on new investments 1.0% 0.9% 0.6% 0.6% 0.6% 1. Net funds growth includes the impact of new investments and exits of investments as noted in the table above, as well as other variables such as net funding on revolvers, net change in unamortized fees, net change in unrealized appreciation (depreciation), etc. 2. Junior Debt is comprised of subordinated debt and second lien loans. 3. Weighted average interest rate on new loan investments is based on the contractual interest rate at the time of funding. For variable rate loans that have a Secured Overnight Financing Rate (“SOFR”), Prime or an applicable foreign base rate for loans denominated in foreign currency, the contractual rate is calculated using the current applicable base rate, the spread over the applicable base rate and the impact of any floor. For positions that have a SOFR and Prime rate option, the contractual rate is calculated using current SOFR at the time of funding, the spread over SOFR and the impact of any SOFR floor. For fixed rate loans, the contract rate is the stated fixed rate. 4. Weighted average spread over the applicable base rate of new floating rate loan investments is based on the contractual interest rate spread at the time of funding. Applicable base rates include SOFR, Prime and applicable foreign base rates for loans denominated in foreign currency. For variable rate loans that have a SOFR and Prime rate option, the SOFR spread was used in the calculation. For variable rate loans that only have a Prime rate option, the Prime spread was used. 5. Excludes the disposition of non-accrual assets. – Total investments at fair value increased by approximately 0.9%, or $7.6 million, during the three months ended December 31, 2025. – Total investments in portfolio companies at fair value was $853.4 million at December 31, 2025.
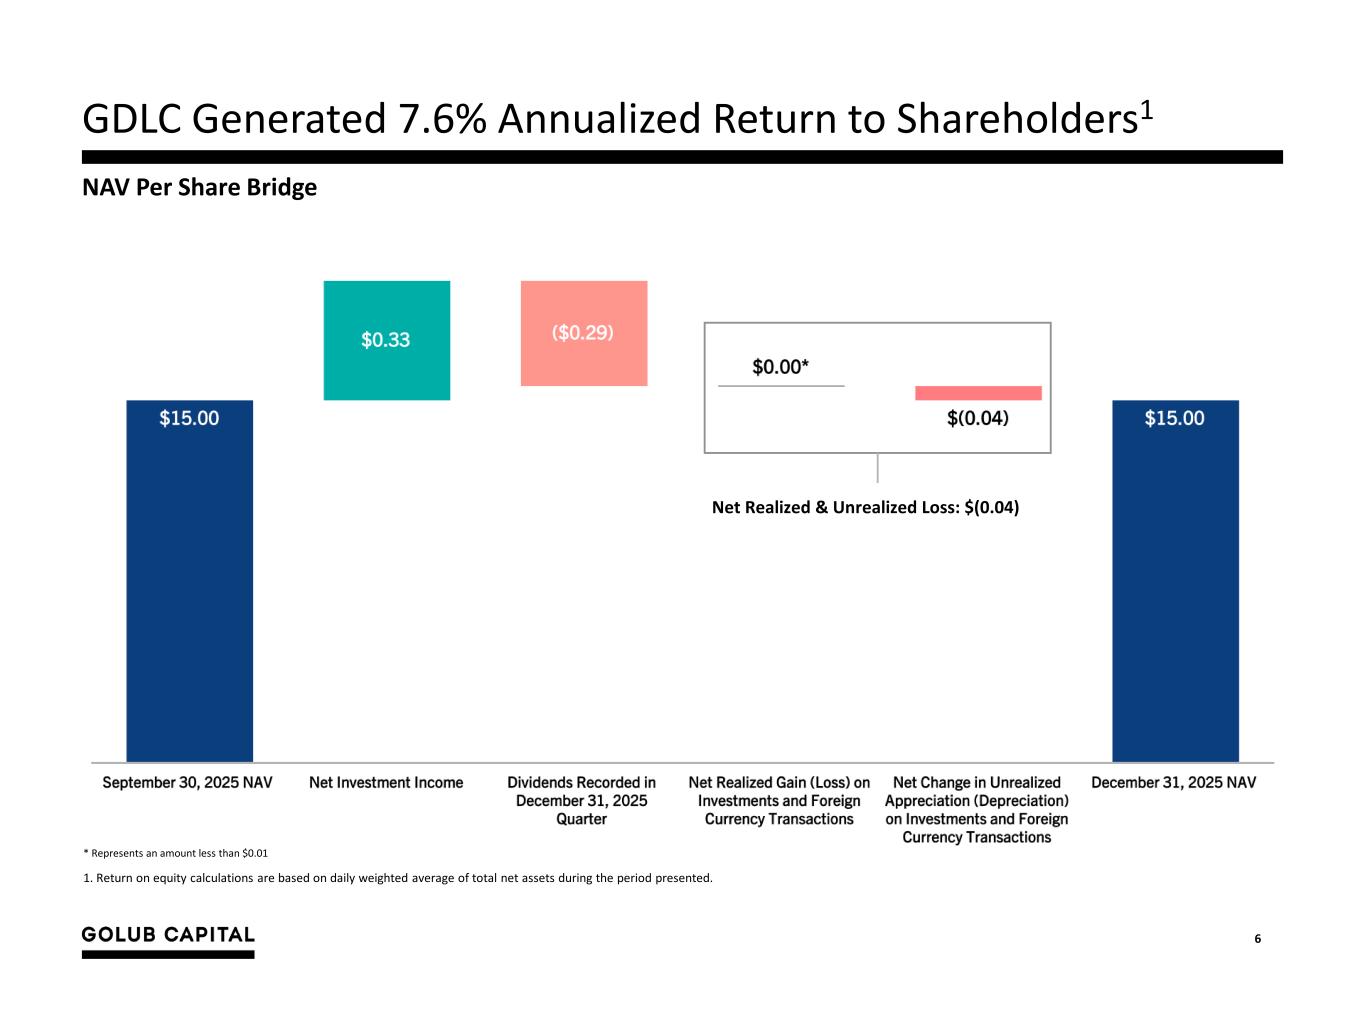
6 GDLC Generated 7.6% Annualized Return to Shareholders1 1. Return on equity calculations are based on daily weighted average of total net assets during the period presented. Net Realized & Unrealized Loss: $(0.04) NAV Per Share Bridge * Represents an amount less than $0.01
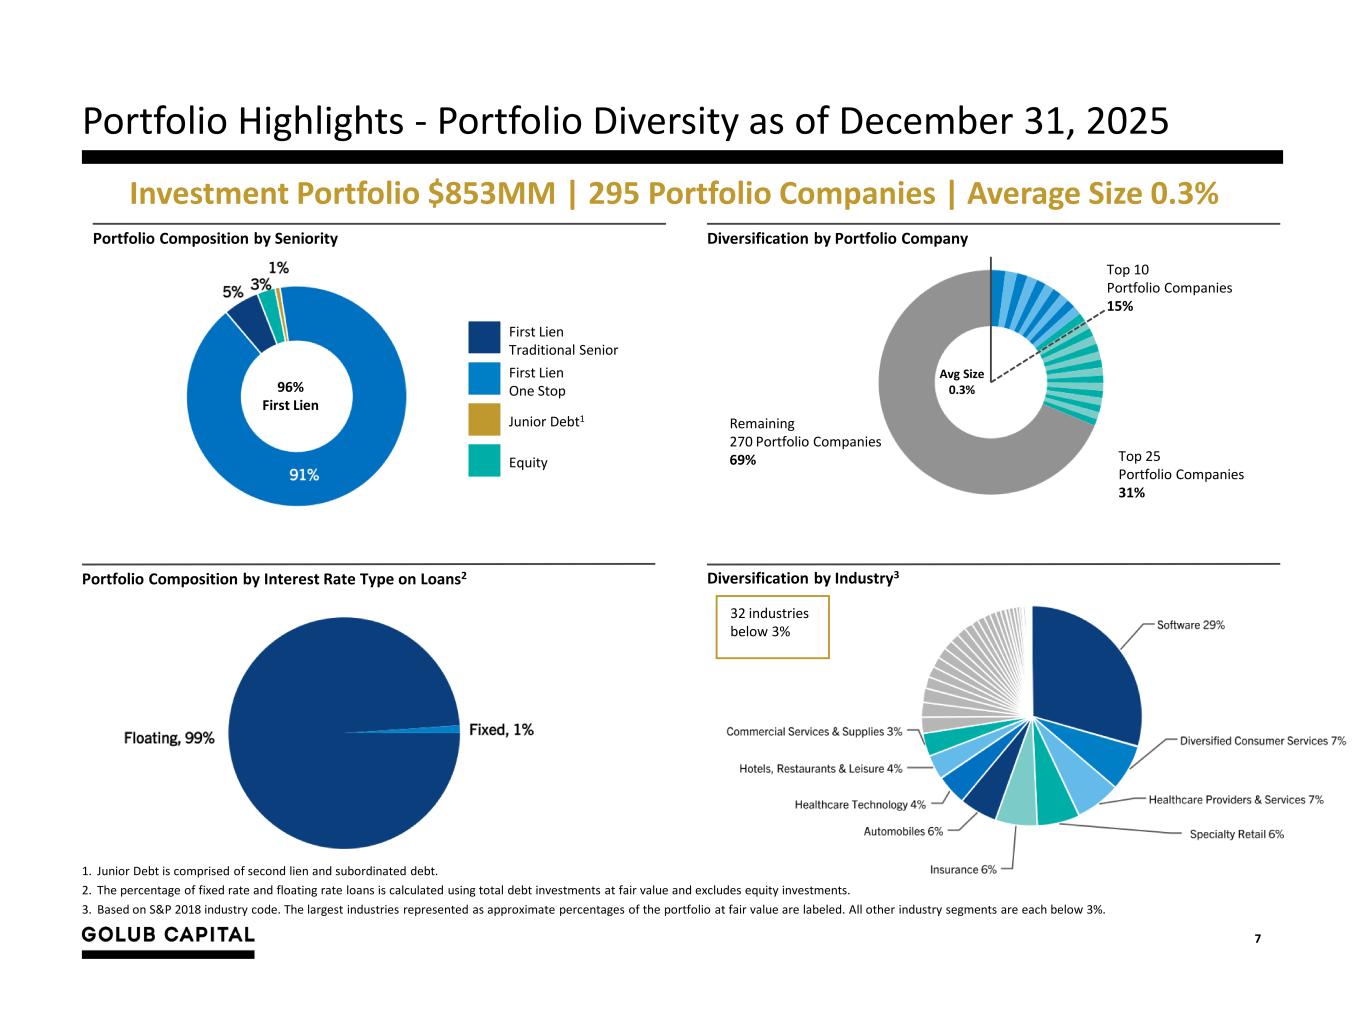
7 Portfolio Highlights - Portfolio Diversity as of December 31, 2025 Investment Portfolio $853MM | 295 Portfolio Companies | Average Size 0.3% Portfolio Composition by Seniority 96% First Lien Diversification by Portfolio Company Top 10 Portfolio Companies 15% Top 25 Portfolio Companies 31% Remaining 270 Portfolio Companies 69% Avg Size 0.3% Portfolio Composition by Interest Rate Type on Loans2 Diversification by Industry3 32 industries below 3% First Lien Traditional Senior First Lien One Stop Junior Debt1 Equity 1. Junior Debt is comprised of second lien and subordinated debt. 2. The percentage of fixed rate and floating rate loans is calculated using total debt investments at fair value and excludes equity investments. 3. Based on S&P 2018 industry code. The largest industries represented as approximate percentages of the portfolio at fair value are labeled. All other industry segments are each below 3%.
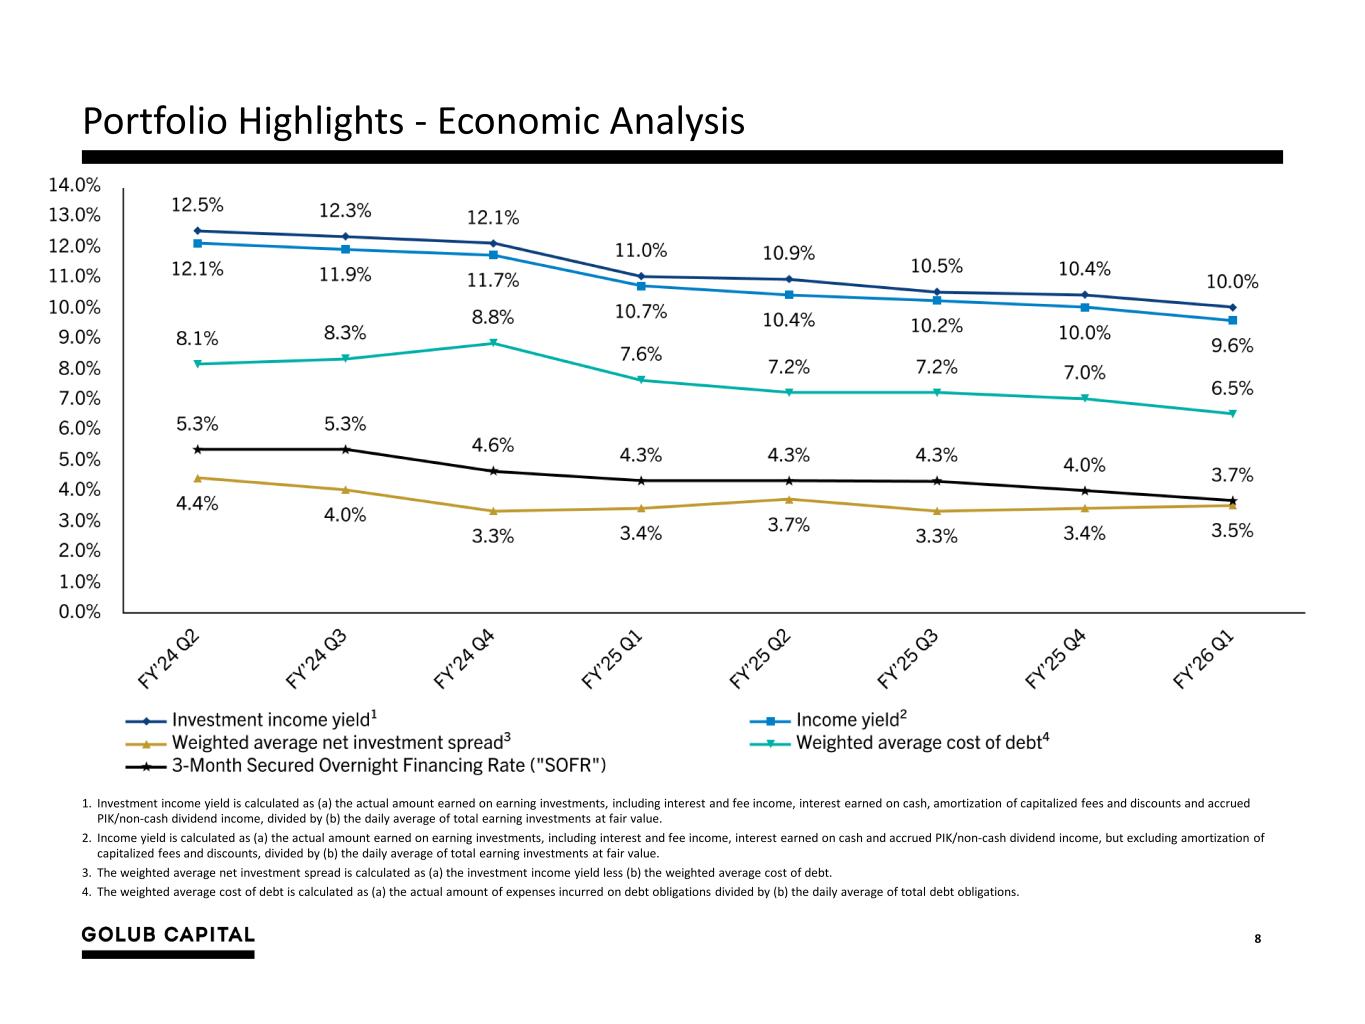
8 Portfolio Highlights - Economic Analysis 1. Investment income yield is calculated as (a) the actual amount earned on earning investments, including interest and fee income, interest earned on cash, amortization of capitalized fees and discounts and accrued PIK/non-cash dividend income, divided by (b) the daily average of total earning investments at fair value. 2. Income yield is calculated as (a) the actual amount earned on earning investments, including interest and fee income, interest earned on cash and accrued PIK/non-cash dividend income, but excluding amortization of capitalized fees and discounts, divided by (b) the daily average of total earning investments at fair value. 3. The weighted average net investment spread is calculated as (a) the investment income yield less (b) the weighted average cost of debt. 4. The weighted average cost of debt is calculated as (a) the actual amount of expenses incurred on debt obligations divided by (b) the daily average of total debt obligations.
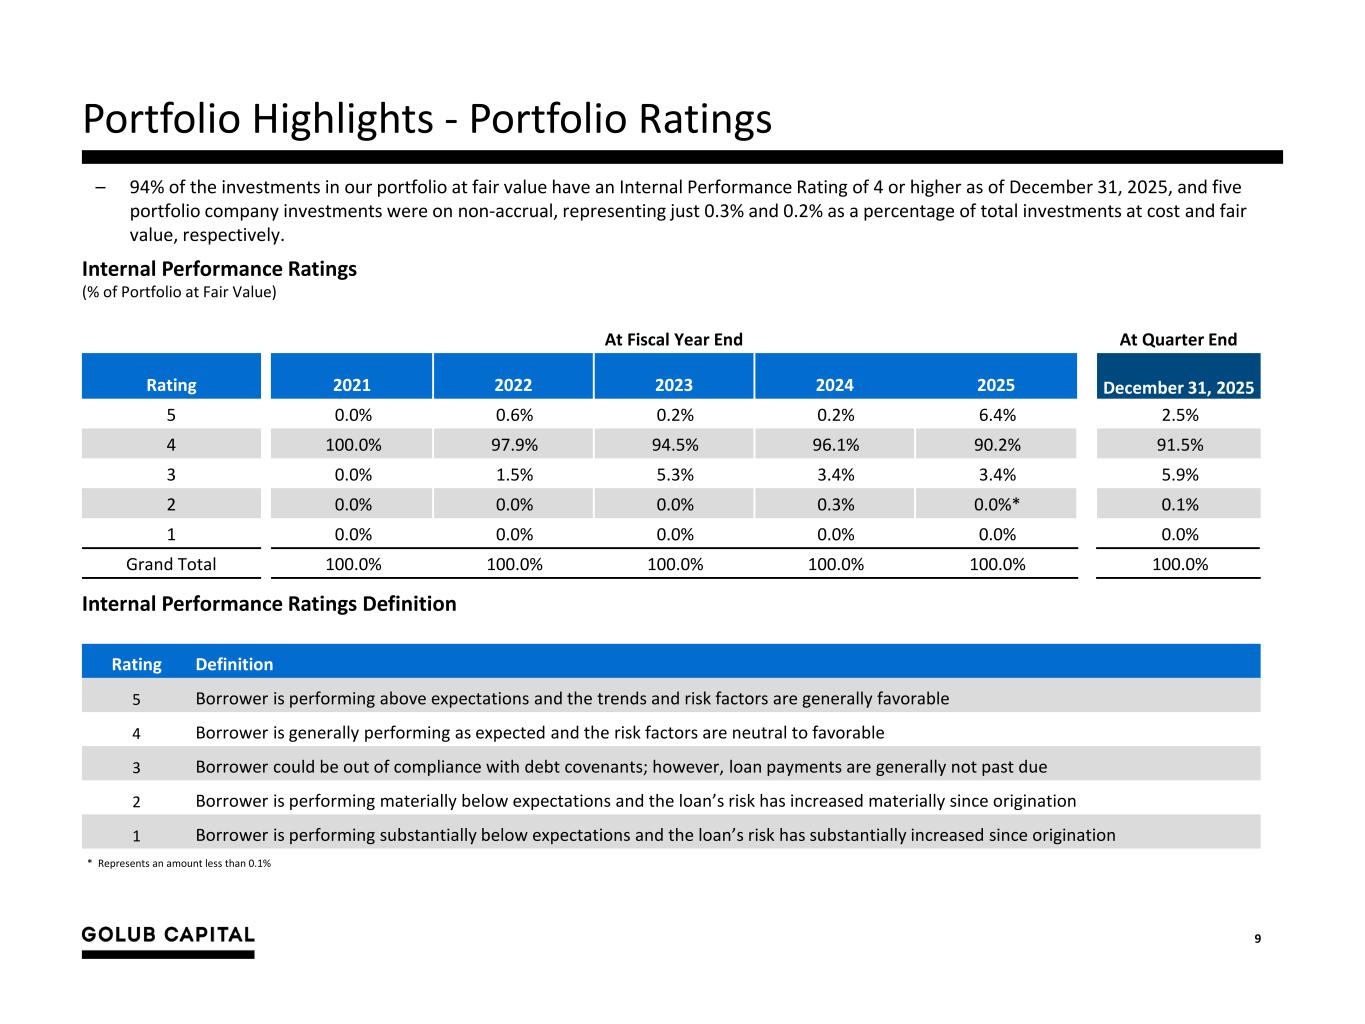
9 Portfolio Highlights - Portfolio Ratings – 94% of the investments in our portfolio at fair value have an Internal Performance Rating of 4 or higher as of December 31, 2025, and five portfolio company investments were on non-accrual, representing just 0.3% and 0.2% as a percentage of total investments at cost and fair value, respectively. Internal Performance Ratings (% of Portfolio at Fair Value) At Fiscal Year End At Quarter End Rating 2021 2022 2023 2024 2025 December 31, 2025 5 0.0% 0.6% 0.2% 0.2% 6.4% 2.5% 4 100.0% 97.9% 94.5% 96.1% 90.2% 91.5% 3 0.0% 1.5% 5.3% 3.4% 3.4% 5.9% 2 0.0% 0.0% 0.0% 0.3% 0.0%* 0.1% 1 0.0% 0.0% 0.0% 0.0% 0.0% 0.0% Grand Total 100.0% 100.0% 100.0% 100.0% 100.0% 100.0% Rating Definition 5 Borrower is performing above expectations and the trends and risk factors are generally favorable 4 Borrower is generally performing as expected and the risk factors are neutral to favorable 3 Borrower could be out of compliance with debt covenants; however, loan payments are generally not past due 2 Borrower is performing materially below expectations and the loan’s risk has increased materially since origination 1 Borrower is performing substantially below expectations and the loan’s risk has substantially increased since origination Internal Performance Ratings Definition * Represents an amount less than 0.1%
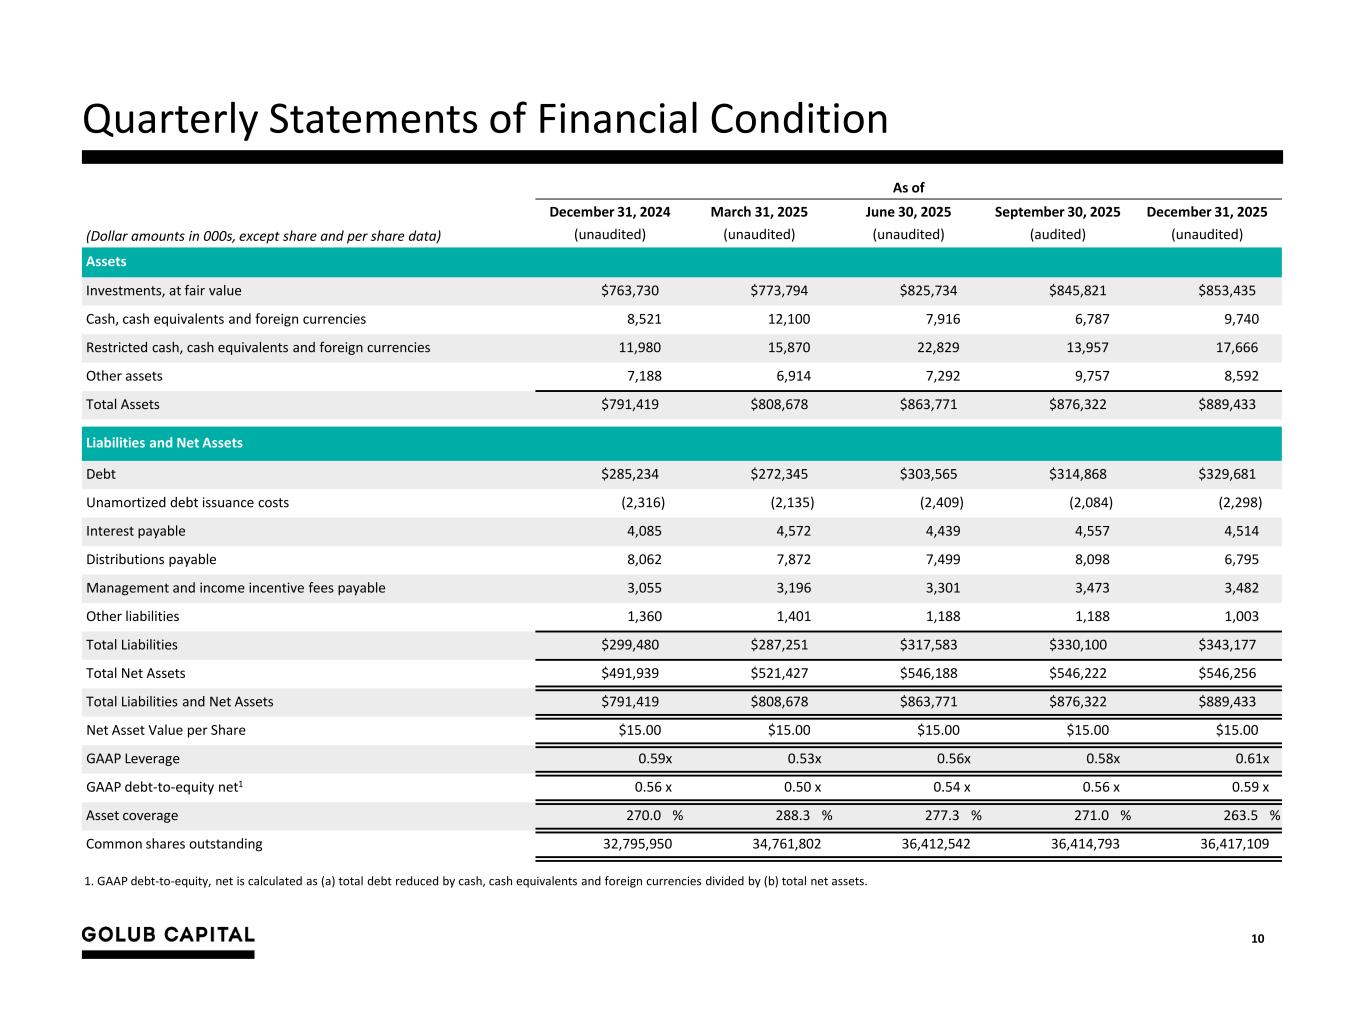
10 Quarterly Statements of Financial Condition As of (Dollar amounts in 000s, except share and per share data) December 31, 2024 March 31, 2025 June 30, 2025 September 30, 2025 December 31, 2025 (unaudited) (unaudited) (unaudited) (audited) (unaudited) Assets Investments, at fair value $763,730 $773,794 $825,734 $845,821 $853,435 Cash, cash equivalents and foreign currencies 8,521 12,100 7,916 6,787 9,740 Restricted cash, cash equivalents and foreign currencies 11,980 15,870 22,829 13,957 17,666 Other assets 7,188 6,914 7,292 9,757 8,592 Total Assets $791,419 $808,678 $863,771 $876,322 $889,433 Liabilities and Net Assets Debt $285,234 $272,345 $303,565 $314,868 $329,681 Unamortized debt issuance costs (2,316) (2,135) (2,409) (2,084) (2,298) Interest payable 4,085 4,572 4,439 4,557 4,514 Distributions payable 8,062 7,872 7,499 8,098 6,795 Management and income incentive fees payable 3,055 3,196 3,301 3,473 3,482 Other liabilities 1,360 1,401 1,188 1,188 1,003 Total Liabilities $299,480 $287,251 $317,583 $330,100 $343,177 Total Net Assets $491,939 $521,427 $546,188 $546,222 $546,256 Total Liabilities and Net Assets $791,419 $808,678 $863,771 $876,322 $889,433 Net Asset Value per Share $15.00 $15.00 $15.00 $15.00 $15.00 GAAP Leverage 0.59x 0.53x 0.56x 0.58x 0.61x GAAP debt-to-equity net1 0.56 x 0.50 x 0.54 x 0.56 x 0.59 x Asset coverage 270.0 % 288.3 % 277.3 % 271.0 % 263.5 % Common shares outstanding 32,795,950 34,761,802 36,412,542 36,414,793 36,417,109 1. GAAP debt-to-equity, net is calculated as (a) total debt reduced by cash, cash equivalents and foreign currencies divided by (b) total net assets.
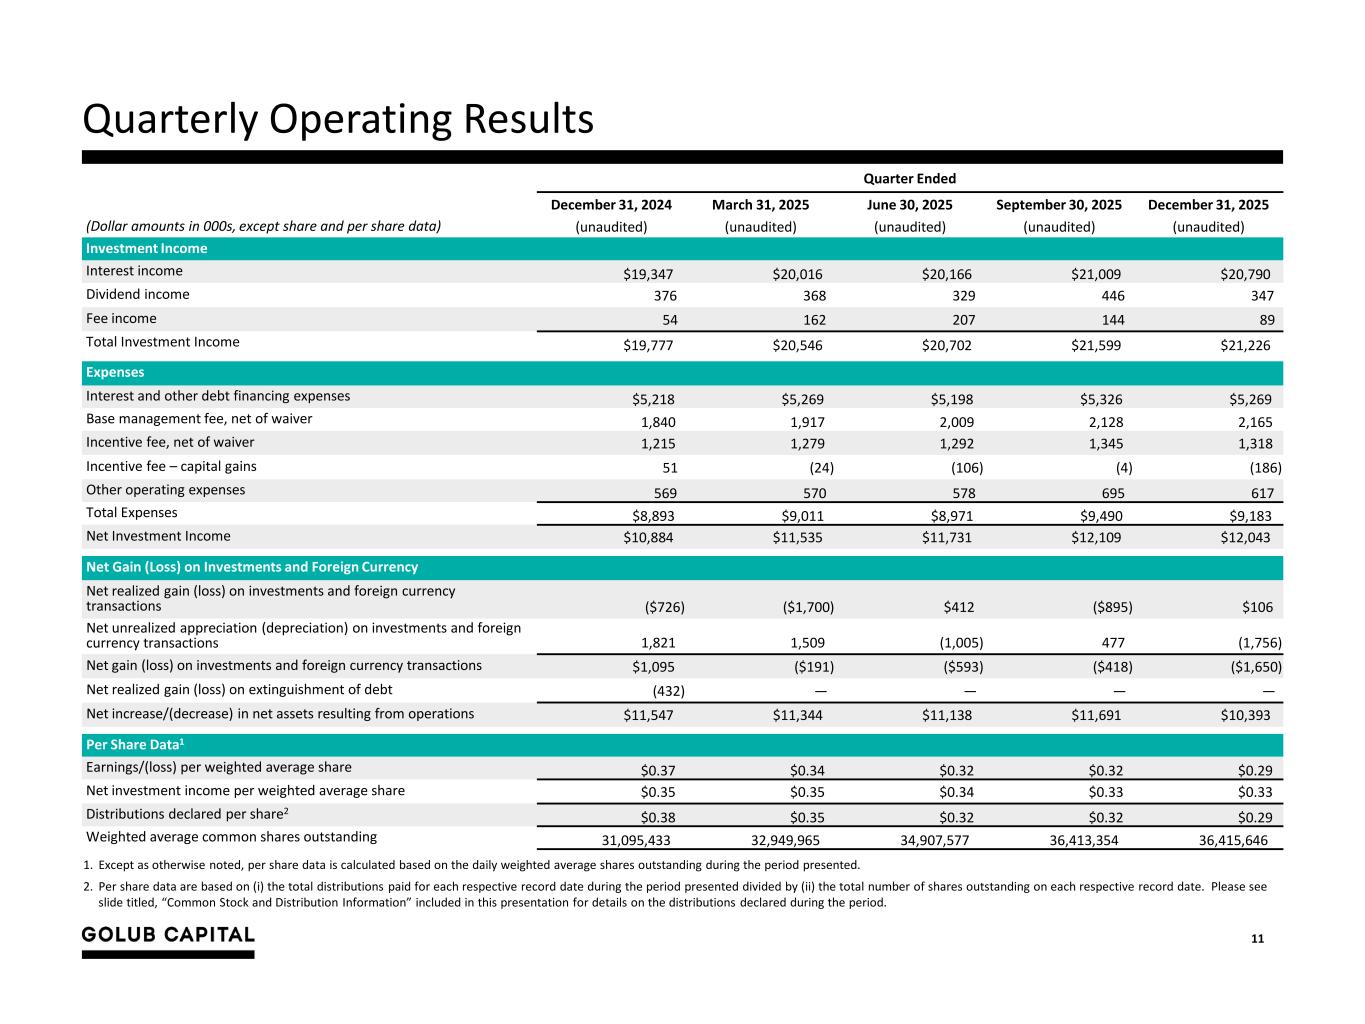
11 Quarterly Operating Results Quarter Ended (Dollar amounts in 000s, except share and per share data) December 31, 2024 March 31, 2025 June 30, 2025 September 30, 2025 December 31, 2025 (unaudited) (unaudited) (unaudited) (unaudited) (unaudited) Investment Income Interest income $19,347 $20,016 $20,166 $21,009 $20,790 Dividend income 376 368 329 446 347 Fee income 54 162 207 144 89 Total Investment Income $19,777 $20,546 $20,702 $21,599 $21,226 Expenses Interest and other debt financing expenses $5,218 $5,269 $5,198 $5,326 $5,269 Base management fee, net of waiver 1,840 1,917 2,009 2,128 2,165 Incentive fee, net of waiver 1,215 1,279 1,292 1,345 1,318 Incentive fee – capital gains 51 (24) (106) (4) (186) Other operating expenses 569 570 578 695 617 Total Expenses $8,893 $9,011 $8,971 $9,490 $9,183 Net Investment Income $10,884 $11,535 $11,731 $12,109 $12,043 Net Gain (Loss) on Investments and Foreign Currency Net realized gain (loss) on investments and foreign currency transactions ($726) ($1,700) $412 ($895) $106 Net unrealized appreciation (depreciation) on investments and foreign currency transactions 1,821 1,509 (1,005) 477 (1,756) Net gain (loss) on investments and foreign currency transactions $1,095 ($191) ($593) ($418) ($1,650) Net realized gain (loss) on extinguishment of debt (432) — — — — Net increase/(decrease) in net assets resulting from operations $11,547 $11,344 $11,138 $11,691 $10,393 Per Share Data1 Earnings/(loss) per weighted average share $0.37 $0.34 $0.32 $0.32 $0.29 Net investment income per weighted average share $0.35 $0.35 $0.34 $0.33 $0.33 Distributions declared per share2 $0.38 $0.35 $0.32 $0.32 $0.29 Weighted average common shares outstanding 31,095,433 32,949,965 34,907,577 36,413,354 36,415,646 1. Except as otherwise noted, per share data is calculated based on the daily weighted average shares outstanding during the period presented. 2. Per share data are based on (i) the total distributions paid for each respective record date during the period presented divided by (ii) the total number of shares outstanding on each respective record date. Please see slide titled, “Common Stock and Distribution Information” included in this presentation for details on the distributions declared during the period.
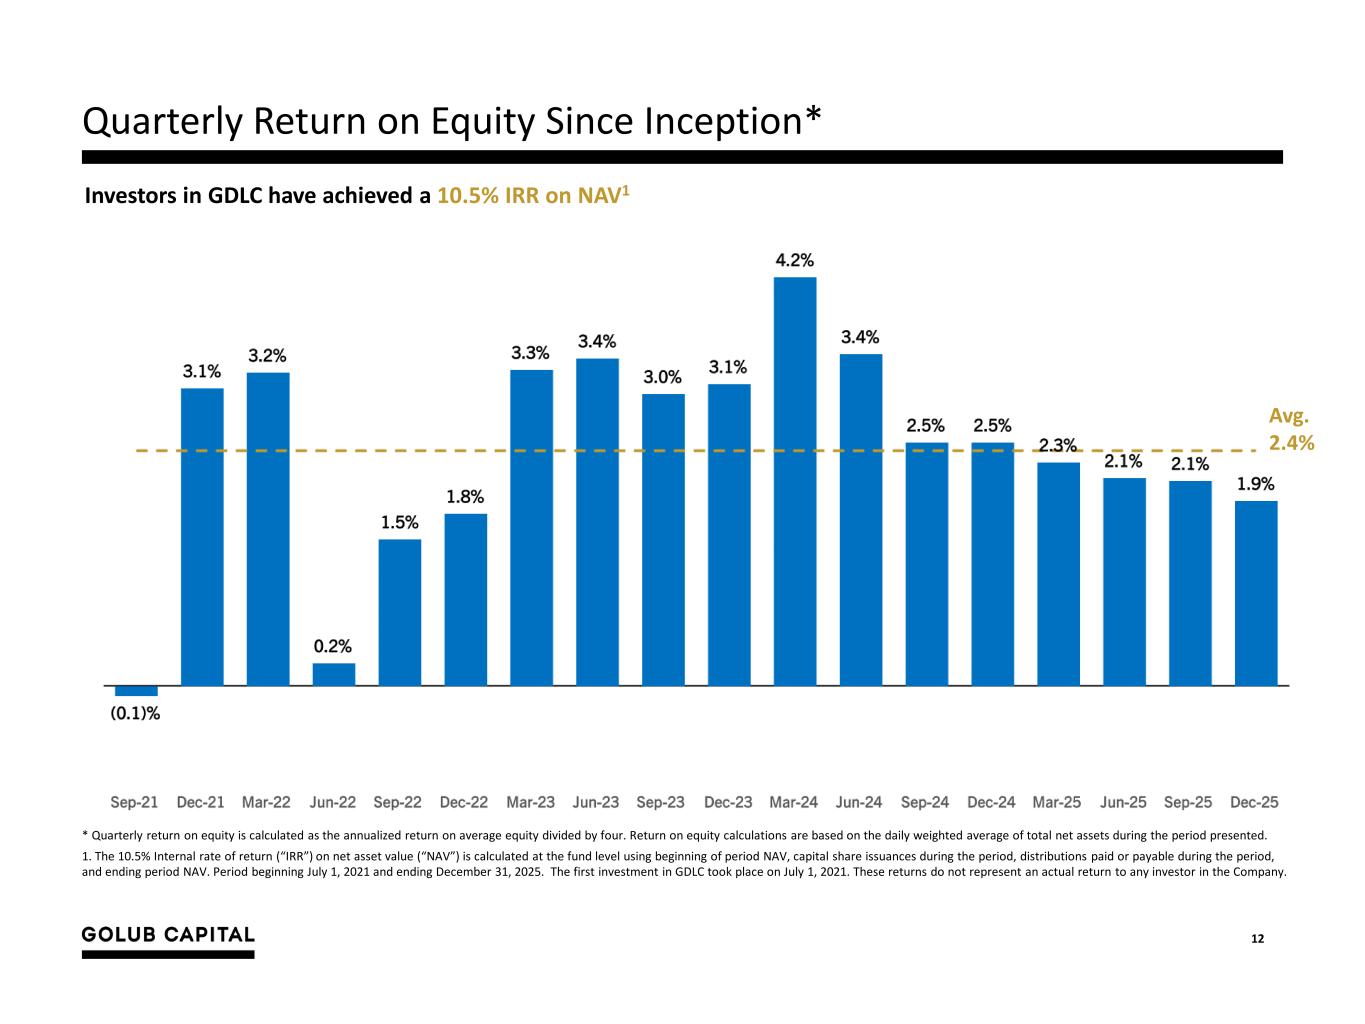
12 Quarterly Return on Equity Since Inception* * Quarterly return on equity is calculated as the annualized return on average equity divided by four. Return on equity calculations are based on the daily weighted average of total net assets during the period presented. 1. The 10.5% Internal rate of return (“IRR”) on net asset value (“NAV”) is calculated at the fund level using beginning of period NAV, capital share issuances during the period, distributions paid or payable during the period, and ending period NAV. Period beginning July 1, 2021 and ending December 31, 2025. The first investment in GDLC took place on July 1, 2021. These returns do not represent an actual return to any investor in the Company. Avg. 2.4% Investors in GDLC have achieved a 10.5% IRR on NAV1
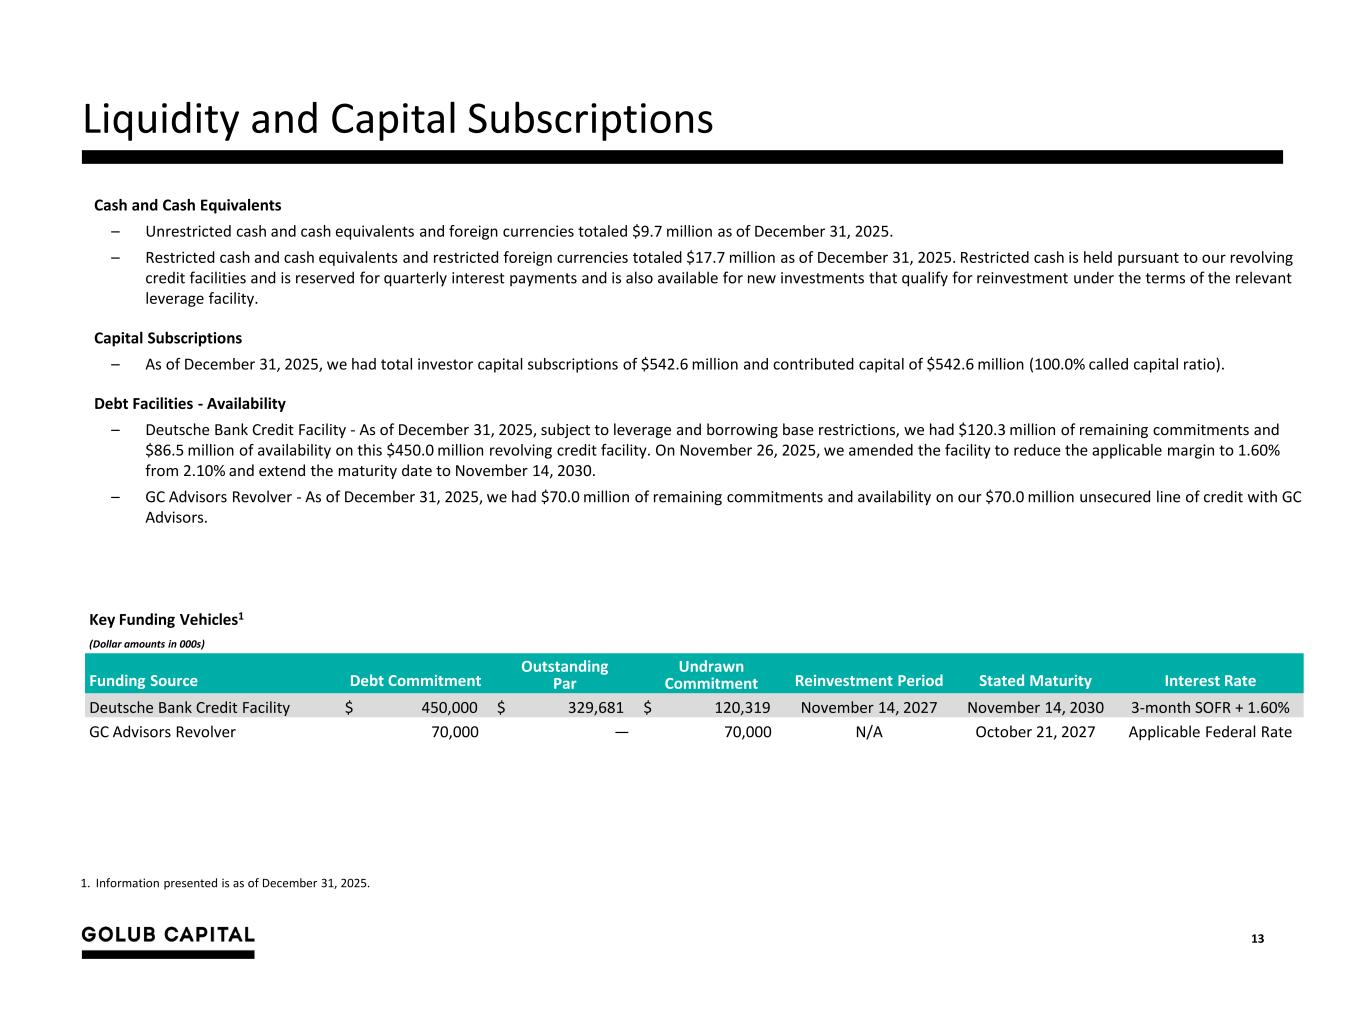
13 Liquidity and Capital Subscriptions Cash and Cash Equivalents – Unrestricted cash and cash equivalents and foreign currencies totaled $9.7 million as of December 31, 2025. – Restricted cash and cash equivalents and restricted foreign currencies totaled $17.7 million as of December 31, 2025. Restricted cash is held pursuant to our revolving credit facilities and is reserved for quarterly interest payments and is also available for new investments that qualify for reinvestment under the terms of the relevant leverage facility. Capital Subscriptions – As of December 31, 2025, we had total investor capital subscriptions of $542.6 million and contributed capital of $542.6 million (100.0% called capital ratio). Debt Facilities - Availability – Deutsche Bank Credit Facility - As of December 31, 2025, subject to leverage and borrowing base restrictions, we had $120.3 million of remaining commitments and $86.5 million of availability on this $450.0 million revolving credit facility. On November 26, 2025, we amended the facility to reduce the applicable margin to 1.60% from 2.10% and extend the maturity date to November 14, 2030. – GC Advisors Revolver - As of December 31, 2025, we had $70.0 million of remaining commitments and availability on our $70.0 million unsecured line of credit with GC Advisors. Key Funding Vehicles1 (Dollar amounts in 000s) Funding Source Debt Commitment Outstanding Par Undrawn Commitment Reinvestment Period Stated Maturity Interest Rate Deutsche Bank Credit Facility $ 450,000 $ 329,681 $ 120,319 November 14, 2027 November 14, 2030 3-month SOFR + 1.60% GC Advisors Revolver 70,000 — 70,000 N/A October 21, 2027 Applicable Federal Rate 1. Information presented is as of December 31, 2025.
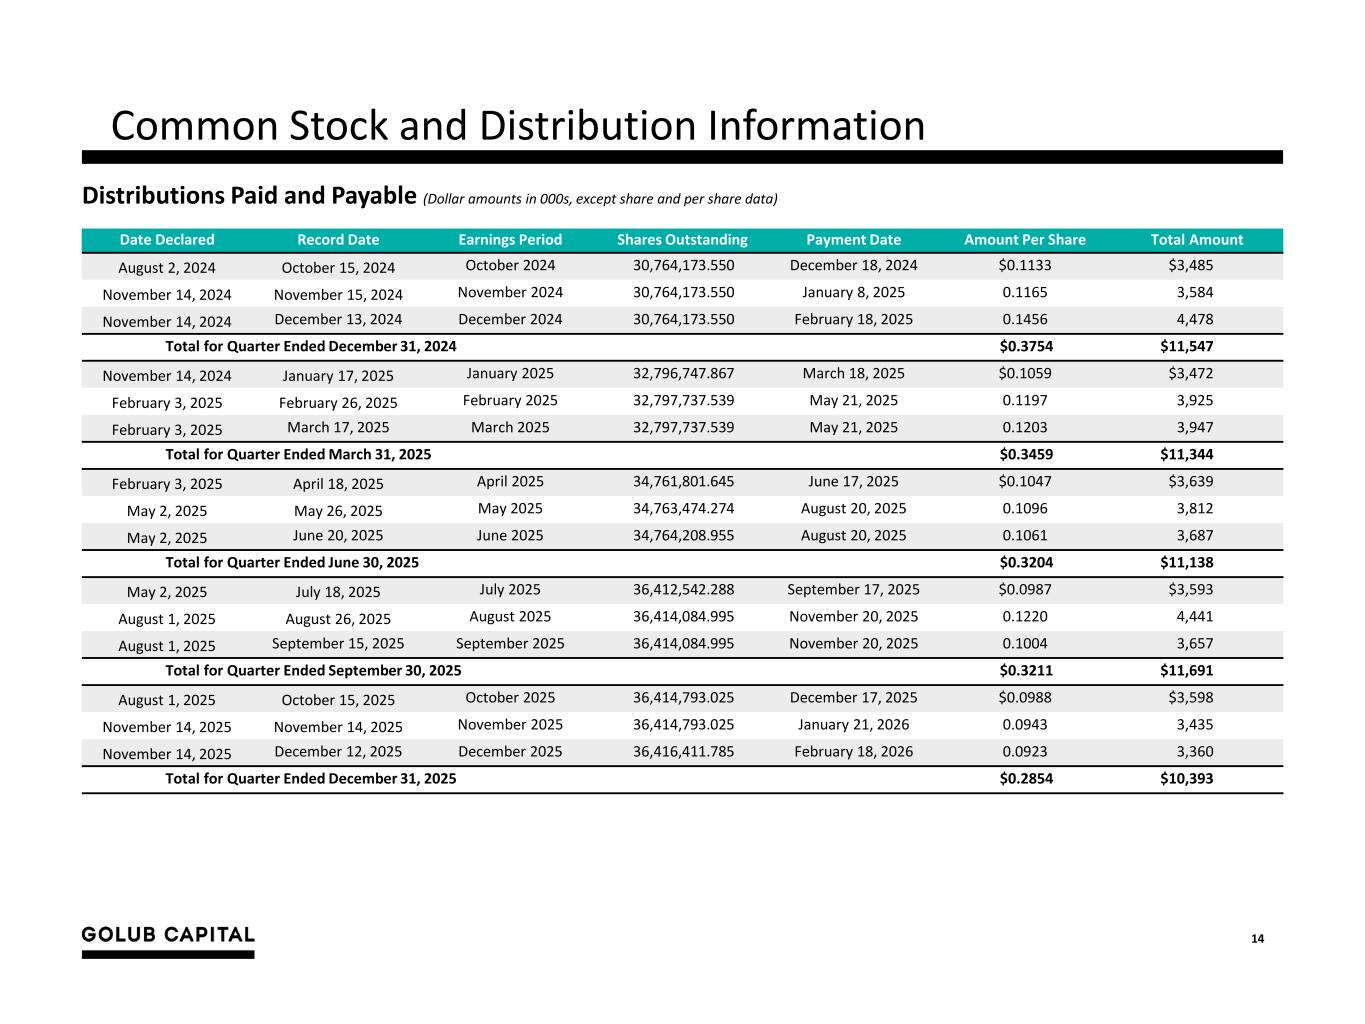
14 Common Stock and Distribution Information Distributions Paid and Payable (Dollar amounts in 000s, except share and per share data) Date Declared Record Date Earnings Period Shares Outstanding Payment Date Amount Per Share Total Amount August 2, 2024 October 15, 2024 October 2024 30,764,173.550 December 18, 2024 $0.1133 $3,485 November 14, 2024 November 15, 2024 November 2024 30,764,173.550 January 8, 2025 0.1165 3,584 November 14, 2024 December 13, 2024 December 2024 30,764,173.550 February 18, 2025 0.1456 4,478 Total for Quarter Ended December 31, 2024 $0.3754 $11,547 November 14, 2024 January 17, 2025 January 2025 32,796,747.867 March 18, 2025 $0.1059 $3,472 February 3, 2025 February 26, 2025 February 2025 32,797,737.539 May 21, 2025 0.1197 3,925 February 3, 2025 March 17, 2025 March 2025 32,797,737.539 May 21, 2025 0.1203 3,947 Total for Quarter Ended March 31, 2025 $0.3459 $11,344 February 3, 2025 April 18, 2025 April 2025 34,761,801.645 June 17, 2025 $0.1047 $3,639 May 2, 2025 May 26, 2025 May 2025 34,763,474.274 August 20, 2025 0.1096 3,812 May 2, 2025 June 20, 2025 June 2025 34,764,208.955 August 20, 2025 0.1061 3,687 Total for Quarter Ended June 30, 2025 $0.3204 $11,138 May 2, 2025 July 18, 2025 July 2025 36,412,542.288 September 17, 2025 $0.0987 $3,593 August 1, 2025 August 26, 2025 August 2025 36,414,084.995 November 20, 2025 0.1220 4,441 August 1, 2025 September 15, 2025 September 2025 36,414,084.995 November 20, 2025 0.1004 3,657 Total for Quarter Ended September 30, 2025 $0.3211 $11,691 August 1, 2025 October 15, 2025 October 2025 36,414,793.025 December 17, 2025 $0.0988 $3,598 November 14, 2025 November 14, 2025 November 2025 36,414,793.025 January 21, 2026 0.0943 3,435 November 14, 2025 December 12, 2025 December 2025 36,416,411.785 February 18, 2026 0.0923 3,360 Total for Quarter Ended December 31, 2025 $0.2854 $10,393
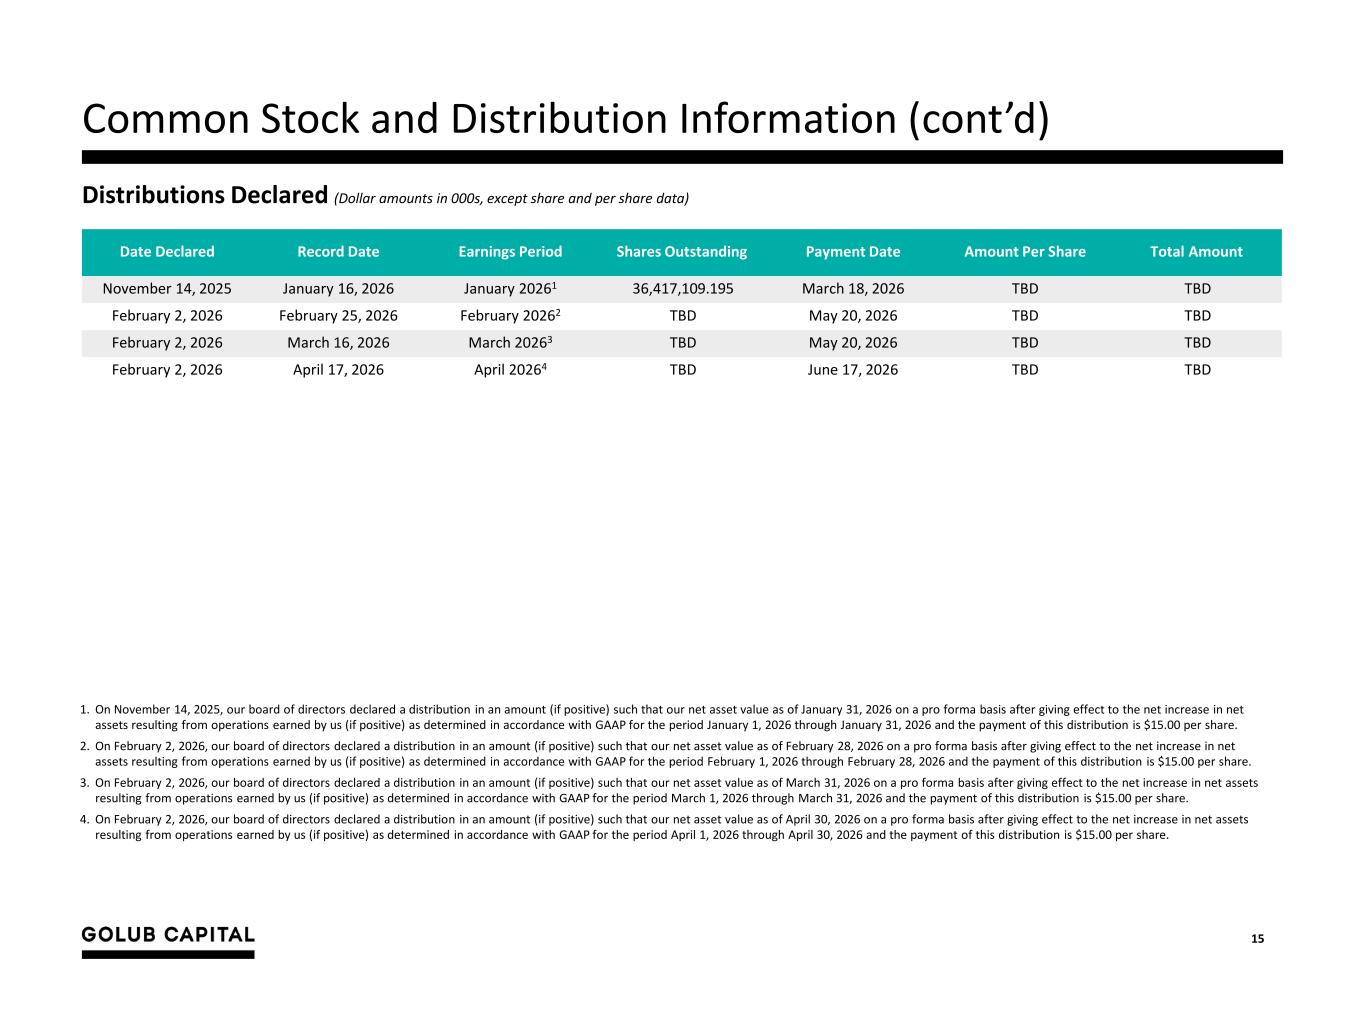
15 Common Stock and Distribution Information (cont’d) Distributions Declared (Dollar amounts in 000s, except share and per share data) Date Declared Record Date Earnings Period Shares Outstanding Payment Date Amount Per Share Total Amount November 14, 2025 January 16, 2026 January 20261 36,417,109.195 March 18, 2026 TBD TBD February 2, 2026 February 25, 2026 February 20262 TBD May 20, 2026 TBD TBD February 2, 2026 March 16, 2026 March 20263 TBD May 20, 2026 TBD TBD February 2, 2026 April 17, 2026 April 20264 TBD June 17, 2026 TBD TBD 1. On November 14, 2025, our board of directors declared a distribution in an amount (if positive) such that our net asset value as of January 31, 2026 on a pro forma basis after giving effect to the net increase in net assets resulting from operations earned by us (if positive) as determined in accordance with GAAP for the period January 1, 2026 through January 31, 2026 and the payment of this distribution is $15.00 per share. 2. On February 2, 2026, our board of directors declared a distribution in an amount (if positive) such that our net asset value as of February 28, 2026 on a pro forma basis after giving effect to the net increase in net assets resulting from operations earned by us (if positive) as determined in accordance with GAAP for the period February 1, 2026 through February 28, 2026 and the payment of this distribution is $15.00 per share. 3. On February 2, 2026, our board of directors declared a distribution in an amount (if positive) such that our net asset value as of March 31, 2026 on a pro forma basis after giving effect to the net increase in net assets resulting from operations earned by us (if positive) as determined in accordance with GAAP for the period March 1, 2026 through March 31, 2026 and the payment of this distribution is $15.00 per share. 4. On February 2, 2026, our board of directors declared a distribution in an amount (if positive) such that our net asset value as of April 30, 2026 on a pro forma basis after giving effect to the net increase in net assets resulting from operations earned by us (if positive) as determined in accordance with GAAP for the period April 1, 2026 through April 30, 2026 and the payment of this distribution is $15.00 per share.