UNITED STATES
SECURITIES AND EXCHANGE COMMISSION
Washington, D.C. 20549
___________________________________________
FORM
CERTIFIED SHAREHOLDER REPORT OF
REGISTERED MANAGEMENT
INVESTMENT COMPANIES
Investment Company Act file number 811-23715
___________________________________________
(Exact name of registrant as specified in charter)
___________________________________________
Brookfield Place
225 Liberty Street, 35th Floor
New York, New York 10281
(Address of principal executive offices) (Zip code)
Brian F. Hurley, Esq.
Oaktree Diversified Income Fund Inc.
Brookfield Place
225 Liberty Street, 35th Floor
New York, New York 10281
(Name and address of agent for service)
___________________________________________
(855) 777-8001
Registrant’s telephone number, including area code
Date of fiscal year end: December 31
Date of reporting period:
Item 1. Reports to Stockholders.
(a)
|
|
|
|
|
IN PROFILE Oaktree Fund Advisors, LLC (the “Adviser”), a Delaware limited liability company and a registered investment adviser under the Investment Advisers Act of 1940, as amended, serves as the investment adviser to Oaktree Diversified Income Fund Inc. (the “Fund”). The Adviser is an affiliate of Oaktree Capital Management, L.P. (“OCM”), a leading global investment management firm headquartered in Los Angeles, California focused on less efficient markets and alternative investments, and is a subsidiary of Brookfield Oaktree Holdings, LLC (formerly, Oaktree Capital Group, LLC) (collectively with OCM and the Adviser, “Oaktree”). Oaktree was founded in April 1995 and is a leader among global investment managers specializing in alternative investments. Oaktree manages assets across a wide range of investment strategies within four asset classes: Credit, Private Equity, Real Assets, and Listed Equities. As of December 31, 2025, Oaktree had $223 billion in assets under management. Brookfield Public Securities Group LLC (“PSG”) serves as the Administrator to the Fund. PSG is an indirect wholly-owned subsidiary of Brookfield Asset Management ULC (“BAM ULC”), an unlimited liability company formed under the laws of British Columbia, Canada. BAM ULC is a wholly owned subsidiary of Brookfield Asset Management Ltd. (“BAM Ltd.”), a publicly traded company (NYSE: BAM; TSX: BAMA). Brookfield Corporation, a publicly traded company (NYSE: BN; TSX: BN), holds a 73% interest in BAM Ltd. The Fund uses its website as a channel of distribution of material company information. Financial and other material information regarding the Fund is routinely posted on and accessible at https://privatewealth.brookfield.com/fund/oaktree-diversified-income-fund-inc. |

|
|
|
|
|
TABLE OF CONTENTS |
|
1 |
||
|
3 |
||
|
7 |
||
|
8 |
||
|
53 |
||
|
54 |
||
|
55 |
||
|
56 |
||
|
57 |
||
|
58 |
||
|
73 |
||
|
74 |
||
|
75 |
||
|
79 |
||
|
80 |
This report is for shareholder information. This is not a Prospectus intended for use in the purchase or sale of Fund shares.
|
NOT FDIC INSURED |
MAY LOSE VALUE |
NOT BANK GUARANTEED |
[THIS PAGE IS INTENTIONALLY LEFT BLANK]
Dear Shareholders,
We are pleased to provide the Annual Report for the Oaktree Diversified Income Fund Inc. (the “Fund”) for the year ended December 31, 2025.
Risk assets generally performed well in the second half of 2025 despite periods of volatility in the fourth quarter. The bid for risk was strong throughout the third quarter, supported by lower rate expectations, tighter credit spreads and an uptick in economic data surprises. Despite an initial beat for the June jobs data released in July, significant negative revisions and weaker headline numbers in July and August shifted investors’ expectations for multiple interest rate cuts over the coming months. Without a significant uptick in inflation, the Federal Open Market Committee (FOMC) implemented a 25 bps rate cut at its September meeting. Volatility returned in the fourth quarter of 2025, but risk assets ultimately ended the period with gains. Drivers of volatility included renewed threats of tariffs on China, a U.S. government shutdown and skepticism around the artificial intelligence (AI) narrative. Against this backdrop, yields on 2- and 10-year U.S. Treasurys fell by 24 bps and 6 bps, respectively, to end the year at 3.48% and 4.17%, respectively. Within fixed income markets, lower rates helped fixed-rate assets outperform: global high yield and investment grade bonds returned 3.76% and 3.07%, respectively, while global senior loans gained 2.89%.
The Fund’s diversified asset mix of both public and private debt investments resulted in a net return of 4.06% during the six-month period ending December 31, 2025, with all strategies contributing positively to performance. Structured credit was the top contributing asset class, led by higher-yielding BB-rated collateralized loan obligations (CLOs), non-agency residential mortgage-backed securities (RMBS), and commercial real estate (CRE) CLOs. Private credit benefited from strength in health care and information technology loans. Senior loans in the U.S. and Europe delivered strong returns, benefiting from coupon income and spread compression. High yield bonds also contributed to total return, benefiting from lower rates, coupon income and some spread compression. Finally, emerging markets debt contributed positively, supported by gains in Latin American corporates.
In December, the Fed indicated expectations for only one rate cut in 2026 alongside an outlook for higher growth, lower inflation and no change in unemployment. Meanwhile, futures markets are pricing in two to three rate cuts, reflecting the continued uncertainty and likely volatility in interest rates. We note that policy paths and leadership changes may influence market expectations; however, the direction, timing, and magnitude of interest rate moves remain uncertain. All this could provide some uncertainty to what happens with interest rates in 2026. In addition, economic conditions appear likely to start 2026 on relatively solid footing, supported by AI-related infrastructure spending and consumer tax benefits from last summer’s budget bill. While we monitor these variables, the Fund seeks to minimize macro forecasting risk; we continue to focus on assets that currently offer higher yields, given our desire for income to be the primary driver of portfolio performance rather than duration positioning.
Sub-investment grade credit currently continues to offer attractive coupons and relatively short duration, which can help insulate portfolios from rate volatility. The combination of credit spreads and interest rates remains above post-Global Financial Crisis medians across most credit markets, offering what we view as attractive compensation for risk. Current yields of 7-8% on fundamentally strong sub-investment-grade credit allow us to avoid stretching for risk, especially compared to lofty equity valuations. Meanwhile, investors can potentially earn a significant yield advantage over higher-quality investment grade assets, making sub-investment grade credit a compelling alternative for portfolios seeking diversification without sacrificing return potential. Defaults are expected to remain low in this supportive backdrop, particularly for high yield bonds and senior loans. We believe that markets currently offer sufficient compensation for this risk and positive security selection can add value through avoiding the losers. Structured credit and private credit are expected to remain key sources of potential alpha in our portfolio given the additional yield and spread we seek to source from those opportunities. Overall, we believe the portfolio is well-positioned with a yield-to-worst of 9.50%, an average price in the mid-90s and a duration of 1.38 years.
In addition to performance information and additional discussion of factors impacting the Fund, this report provides the Fund’s audited financial statements and schedule of investments as of December 31, 2025.
|
2025 Annual Report |
1 |
|
LETTER TO SHAREHOLDERS (continued) |
We welcome your questions and comments and encourage you to contact our Investor Relations team at 1-855-777-8001 or visit us at https://publicsecurities.brookfield.com/en for more information.
Thank you for your support.
Sincerely,
|
|
|
Brian F. Hurley |
|
President |

These views represent the opinions of Oaktree Fund Advisors, LLC and are not intended to predict or depict the performance of any investment. These views are primarily as of the close of business on December 31, 2025 and subject to change based on subsequent developments.
Must be preceded or accompanied by a Prospectus.
Past performance is no guarantee of future results.
Investing involves risk. Principal loss is possible. Real assets include real estate securities, infrastructure securities and natural resources securities. Property values may fall due to increasing vacancies or declining rents resulting from unanticipated economic, legal, cultural or technological developments. Infrastructure companies may be subject to a variety of factors that may adversely affect their business, including high interest costs, high leverage, regulation costs, economic slowdown, surplus capacity, increased competition, lack of fuel availability and energy conservation policies. Natural resources securities may be affected by numerous factors, including events occurring in nature, inflationary pressures and international politics.
Quasar Distributors, LLC is the distributor of Oaktree Diversified Income Fund Inc.
|
2 |
|
|
OAKTREE DIVERSIFIED INCOME FUND INC. |
MANAGEMENT DISCUSSION OF FUND PERFORMANCE
The Oaktree Diversified Income Fund (the “Fund”) Class D shares returned 7.94% (net of fees) for the year ended December 31, 2025.
The portfolio performed well in 2025, against a backdrop of tightening credit spreads and declining government yields. All strategies contributed positively to performance, with our alpha strategies providing diversification and incremental returns, though future results may differ. Our alpha strategies generated double-digit returns in aggregate, led by corporate structured credit, which returned over 13%, benefitting from superior yields and tightening spreads. Real estate debt also performed very well while enhancing diversification. Private credit delivered strong returns this year, led by loans in the health care and information technology sectors. Exposure to emerging markets corporate debt was additive but had a limited impact on overall performance due to its small allocation. Our core allocations to high yield bonds and senior loans across the U.S. and Europe also gained between 6.7% and 7.8%, helped by positive security selection and strong coupon income. The portfolio’s European bias, particularly in senior loans, proved accretive to performance and remains an area of focus for capital deployment.
The Fund’s five largest sector allocations at the end of 2025 were software (7.3%), healthcare providers & services (5.6%), hotels, restaurants & leisure (4.3%), health care technology (4.2%), and commercial services & supplies (3.6%). At the end of 2025, the Fund’s investments had a yield-to-worst of 9.50%, an average price in the mid-90s and a duration of 1.38 years. The portfolio may benefit from its current attractive income and short duration, although there can be no assurance such benefits will be realized. We remain highly optimistic about this environment for high-yielding sub-investment grade credit, which still offers the potential for equity-like returns with far less risk.
GLOBAL CREDIT MARKET OVERVIEW
Risk assets navigated a complex and volatile landscape in 2025, shaped by evolving trade policy, geopolitical developments, rapid technological advancements, and shifting monetary policy expectations. Despite these headline risks, markets demonstrated notable resilience with credit assets delivering positive returns supported by elevated income generation, declining interest rates, and spread tightening.
Enthusiasm around artificial intelligence continued to buoy equity markets, with the S&P 500 returning approximately 18.0% for the year despite tariffs and skepticism surrounding AI-related valuations contributing to bouts of volatility. While inflation moderated through the year, the pace and timing of Federal Reserve policy easing remained a central driver of market volatility.
The year began with uneven economic data and heightened uncertainty following the introduction of new U.S. tariffs and a weakening in consumer confidence. While growth showed early signs of slowing, the Federal Reserve held policy rates steady at 4.5% throughout the first half of the year. As labor market conditions softened and inflationary pressures eased, the Fed ultimately delivered three rate cuts of 25 bps each beginning in September. Against this backdrop, the yield curve modestly steepened over the year. Volatility increased again in the fourth quarter amid renewed tariff threats, a U.S. government shutdown, and skepticism around the AI narrative. Nonetheless, additional rate cuts, resilient economic growth, and spread tightening supported market performance, with shorter-duration, higher-yielding credit assets outperforming. Economic growth exceeded expectations at times, with U.S. GDP expanding at approximately 4.3% in the third quarter, the highest in two years, supported by consumer spending and AI investment.
OUTLOOK
While economic and credit fundamentals are in good shape, the volatile backdrop observed in 2025 could persist into 2026. A short duration, high income sub-investment grade allocation can help insulate investors relative to riskier asset classes, such as equities, while providing attractive risk-adjusted return potential.
|
2025 Annual Report |
3 |
|
OAKTREE DIVERSIFIED INCOME FUND INC. |
Yields in credit markets are still compelling, but with idiosyncratic risk persisting, security selection and risk control will likely be critical to capture those seeking to capture attractive all-in yields. We are in a credit-picker’s environment, and the ability to avoid defaults may be a key differentiator amongst managers, particularly in sub-investment grade credit. This is what the Oaktree Diversified Income Fund seeks to achieve, through an emphasis on rigorous credit underwriting and access to a diversified portfolio of higher yielding sub-investment grade assets, inclusive of both public and private credit sectors. Within our core high yield bond and senior loan allocations, we continue to favor Europe over the U.S. for incremental deployment, as we are still able to secure a yield pickup from these opportunities. While our portfolios remain tilted toward the U.S., reflecting the larger size of the opportunity set, our allocation to Europe is elevated relative to historical levels. Within our alpha strategies, we continue to find value in structured credit, particularly given the attractive carry and coupon income these instruments can offer. Corporate structured credit, particularly mezzanine CLO debt tranches, is among the areas within credit markets where spreads have not yet retraced to historic tights. Meanwhile, private credit continues to provide an attractive source of steady income. We also continue to hold onto some dry powder for future opportunistic deployment. Overall, while outcomes are uncertain, we believe the portfolio is positioned to benefit from its attractive income and short duration.
AVERAGE ANNUAL TOTAL RETURNS
|
As of Decemeber 31, 2025 |
1 Year |
3 Year |
Since Inception* |
|
Class D Shares |
7.94% |
10.59% |
5.53% |
|
S&P/LSTA Leveraged Loan Index |
7.24% |
9.69% |
6.79% |
* Class D Shares commenced operations on November 1, 2021.
CUMULATIVE RETURNS
The graph below illustrates a hypothetical investment of $10,000 in the Fund from the commencement of investment operations on November 1, 2021 to December 31, 2025 compared to the S&P/LSTA Leverage Loan Index.
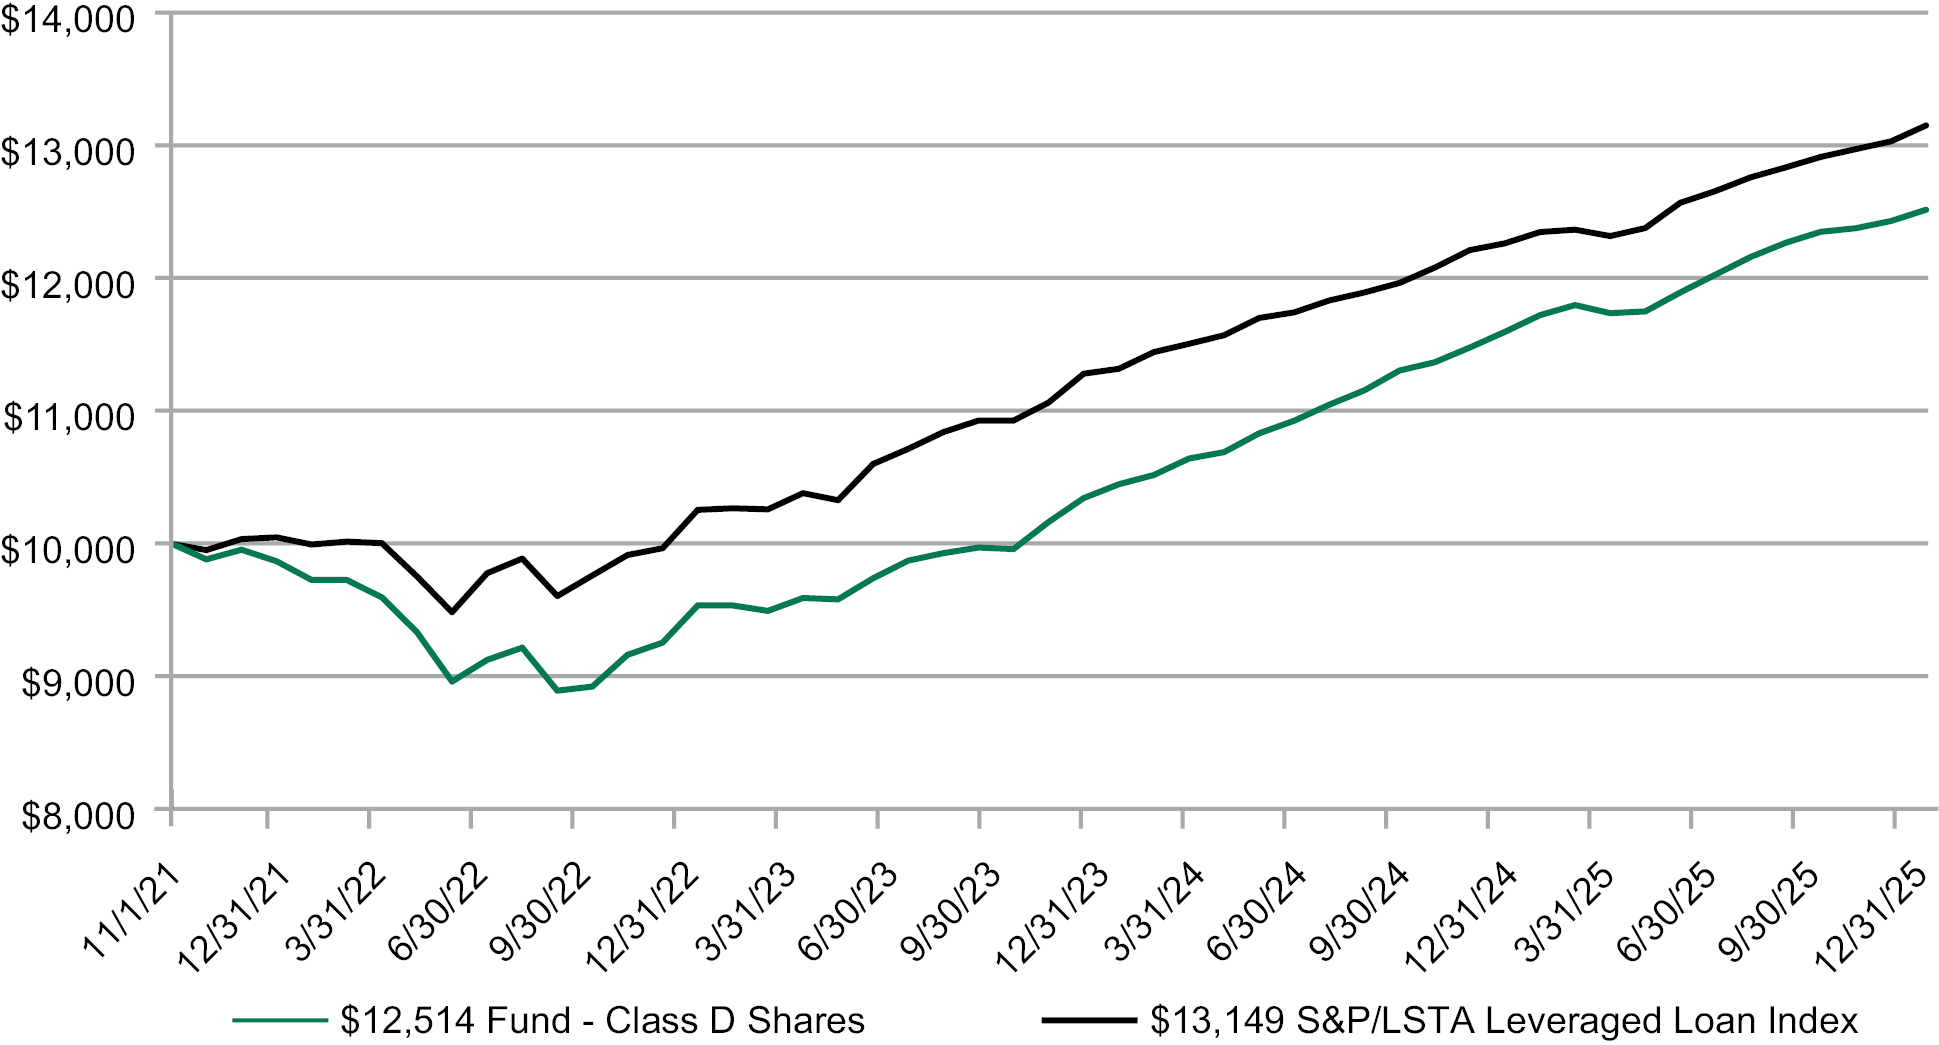
The table and graph do not reflect the deduction of taxes that a shareholder would pay on Fund distributions or the repurchase of Fund shares.
|
4 |
|
|
OAKTREE DIVERSIFIED INCOME FUND INC. |
Disclosure
All returns shown in USD.
S&P/LSTA (Loans Syndications and Trading Association) Leveraged Loan Index tracks the largest leveraged-loan-to-market facilities, considering market weightings, spreads and interest payments.
An index does not reflect any fees, expenses or sales charges. It is not possible to invest directly in an index. Index performance is shown for illustrative purposes only and does not predict or depict the performance of the Fund.
The Fund’s portfolio holdings are subject to change without notice. The mention of specific securities is not a recommendation or solicitation for any person to buy, sell or hold any particular security. There is no assurance that the Fund currently holds these securities. Please refer to the Schedule of Investments contained in this report for a full listing of Fund holdings.
Performance data quoted represents past performance and is no guarantee of future results. Investment return and principal value of an investment will fluctuate so that an investor’s shares, when redeemed, may be worth more or less than their original cost. Current performance may be lower or higher than the performance data quoted. Performance includes the reinvestment of income, dividends and capital gain distributions. To obtain performance information current to the most recent month-end, please call 1-855-862-5873. Performance reflects management fees and other fund expenses.
An investor should consider the Fund’s investment objectives, risks, charges and expenses carefully before investing.
The Fund is subject to investment risks, including the possible loss of principal invested. Investing involves risk, and principal loss is possible. The Adviser employs an active approach to allocation across multiple credit sectors, but there is no guarantee that such allocation techniques will produce the desired results. General interest rate fluctuations may have a substantial negative impact on the Fund’s investments and investment opportunities, and, accordingly, may have a material adverse effect on the Fund’s rate of return. The Fund may invest in foreign securities, including, but not limited to, risk related to exchange rate changes, political and economic upheaval, and relatively low market liquidity, all of which are magnified in emerging markets. The Fund intends to invest in illiquid investments which can face significant difficulties and delays associated with such transactions, and the Fund may be unable to sell other illiquid investments when it desires to do so, resulting in the Fund obtaining a lower price or being required to retain the investment. Investments in derivatives involve special risks including correlation, counterparty, liquidity, operational, accounting and tax risks. These risks, in certain cases, may be greater than the risks presented by more traditional investments.
High-yield debt securities rated below investment grade are commonly referred to as “junk bonds” and are considered speculative. Investment by the Fund in lower-rated and non-rated securities presents a greater risk of loss to principal and interest than higher-rated securities. Bank loans (including senior loans) are usually rated below investment grade, and the market for bank loans may be subject to irregular trading activity, wide bid/ask spreads, restrictions on resale, and extended trade settlement periods. The Fund’s investments in senior loans may be subject to greater levels of credit risk, call risk, settlement risk and liquidity risk than funds that do not invest in such securities. The Fund may invest in distressed securities of corporate issuers that are the subject of bankruptcy proceedings or otherwise in default as to the repayment of principal and/or interest or in significant risk of being in such default which is speculative and involves significant risk. Distressed Securities frequently do not produce income while they are outstanding and may require the Fund to bear certain extraordinary expenses in order to protect and recover its investment. The Fund may invest in loans that may be “covenant-lite,” generally loans that do not have financial maintenance covenants, which can cause the Fund to have fewer rights against a borrower and may have a greater risk of loss on such investments.
|
2025 Annual Report |
5 |
|
OAKTREE DIVERSIFIED INCOME FUND INC. |
The Fund may invest in a variety of mortgage related and other asset-backed securities, which are subject to greater price volatility in relation to interest rate movements. Residential mortgage backed securities (RMBS) may be subject to prepayment risk, meaning that securities may be paid off more quickly than originally anticipated and the Fund will have to invest the proceeds in securities with lower yields. Commercial mortgage backed securities (CMBS) may be subject to extension risk, meaning that the value of CMBS may be adversely affected in rising interest rate environments when payments on underlying mortgages do not occur as anticipated, resulting in the extension of the security’s effective maturity and the related increase in interest rate sensitivity of a longer-term instrument. Investments in collateralized loan obligations (CLOs) carry additional risks including, but not limited to: 1) the possibility that distributions from collateral securities will not be adequate to make interest or other payments; 2) the quality of the collateral may decline in value or default; 3) the possibility that the Fund may invest in CLOs that are subordinate to other classes; and 4) the complex structure of the security may produce disputes with the issuer or unexpected investment results.
Short-term performance in particular is not a good indication of the Fund’s future performance and an investment should not be made based solely on returns.
|
6 |
|
|
ASSETS BY SECTOR1 |
|
|
|
Corporate Credit |
||
|
— Senior Loans (Syndicated) |
26.9% |
|
|
— High Yield |
18.3% |
|
|
Total Corporate Credit |
45.2% |
|
|
Private Credit |
||
|
— Senior Loans |
22.3% |
|
|
— Senior Loans (Syndicated) |
2.0% |
|
|
— Preferred Stock |
0.8% |
|
|
— Private Placement Equity |
0.5% |
|
|
— Warrants |
0.0% |
|
|
— Common Stock |
0.0% |
|
|
Total Private Credit |
25.6% |
|
|
Structured Credit |
||
|
— Collateralized Loan Obligations |
10.9% |
|
|
— Asset-Backed Securities |
5.7% |
|
|
— Commercial Mortgage-Backed Securities |
3.5% |
|
|
— Residential Mortgage-Backed Securities |
2.5% |
|
|
— High Yield |
0.6% |
|
|
Total Structured Credit |
23.2% |
|
|
Emerging Market |
||
|
— High Yield |
2.6% |
|
|
Short-Term Investments |
||
|
— Money Market Funds |
2.7% |
|
|
— U.S Treasury Bills |
0.7% |
|
|
Total Short-Term Investments |
3.4% |
|
|
Total |
100.0% |
|
____________
1 Percentages are based on total market value of investments.
|
2025 Annual Report |
7 |
|
|
Par |
Value |
|||||
|
CORPORATE CREDIT – 58.8% |
|
||||||
|
Senior Loans (Syndicated) – 35.0% (a) |
|
||||||
|
Aerospace & Defense – 0.4% |
|
||||||
|
Bleriot US Bidco Inc, |
738,773 |
$ |
743,236 |
||||
|
TransDigm, Inc., |
507,815 |
|
510,295 |
||||
|
|
1,253,531 |
||||||
|
Air Freight & Logistics – 0.2% |
|
||||||
|
Radar Bidco Sarl, |
EUR |
410,000 |
|
488,630 |
|||
|
Automobiles – 0.2% |
|
||||||
|
MajorDrive Holdings IV LLC, |
683,646 |
|
622,497 |
||||
|
Beverages – 0.3% |
|
||||||
|
Pegasus Bidco BV, |
|
||||||
|
5.06% (3 mo. EURIBOR + 3.00%), 07/12/2029, (0.00% Floor) |
EUR |
434,985 |
|
517,809 |
|||
|
6.60% (3 mo. SOFR US + 2.75%), 07/12/2029, (0.00% Floor) |
556,842 |
|
559,626 |
||||
|
|
1,077,435 |
||||||
|
Building Products – 0.3% |
|
||||||
|
Aquiles Spain Bidco SA, |
EUR |
300,000 |
|
341,052 |
|||
|
BME Group Holding BV, |
EUR |
500,000 |
|
492,793 |
|||
|
|
833,845 |
||||||
|
Capital Markets – 0.3% |
|
||||||
|
DRW Holdings LLC, Senior |
990,000 |
|
978,556 |
||||
|
Chemicals – 2.0% |
|
||||||
|
Akzo Nobel Specialty Chemicals, |
EUR |
300,000 |
|
355,424 |
|||
|
INEOS Finance PLC, |
EUR |
247,403 |
|
241,255 |
|||
|
INEOS Quattro Holdings UK Ltd., |
|
||||||
|
6.21% (1 mo. EURIBOR + 4.25%), 01/29/2026, (0.00% Floor) |
EUR |
200,000 |
|
165,703 |
|||
|
6.40% (1 mo. EURIBOR + 4.50%), 03/29/2029, (0.00% Floor) |
EUR |
250,000 |
|
209,259 |
|||
|
INEOS US Finance LLC, |
987,500 |
|
803,889 |
||||
____________
See Notes to Consolidated Financial Statements.
|
8 |
|
|
OAKTREE DIVERSIFIED INCOME FUND INC. December 31, 2025 |
|
|
Par |
Value |
|||||
|
CORPORATE CREDIT (continued) |
|
||||||
|
Kersia, |
EUR |
500,000 |
$ |
594,944 |
|||
|
Nobian Finance BV, |
|
||||||
|
5.78% (3 mo. EURIBOR + 3.75%), 07/09/2029, (0.00% Floor) |
EUR |
185,000 |
|
211,161 |
|||
|
5.53% (3 mo. EURIBOR + 3.50%), 07/01/2030, (0.00% Floor) |
EUR |
425,000 |
|
479,606 |
|||
|
Rohm Holding GmbH, |
EUR |
485,580 |
|
543,119 |
|||
|
SCIH Salt Holdings, Inc., |
833,700 |
|
836,351 |
||||
|
SCIL IV, |
EUR |
500,000 |
|
591,025 |
|||
|
Touchdown Acquirer, Inc., |
818,006 |
|
821,757 |
||||
|
Windsor Holdings III LLC, |
293,302 |
|
294,357 |
||||
|
|
6,147,850 |
||||||
|
Commercial Services & Supplies – 2.0% |
|
||||||
|
Access CIG LLC, |
928,708 |
|
898,525 |
||||
|
Admiral Bidco GmbH, |
EUR |
198,875 |
|
236,834 |
|||
|
Admiral Bidco GmbH, |
EUR |
16,125 |
|
19,203 |
|||
|
Allied Universal Holdco LLC, |
1,097,250 |
|
1,104,278 |
||||
|
Atlas Luxco, |
EUR |
550,000 |
|
652,823 |
|||
|
DIOT-SIACI BidCo SAS, |
EUR |
100,962 |
|
0 |
|||
|
Garda World Security Corp., |
982,525 |
|
987,929 |
||||
|
Gategroup Finance International Sarl, |
EUR |
275,000 |
|
326,209 |
|||
|
Luna 2 5SARL, |
EUR |
500,000 |
|
594,169 |
|||
____________
See Notes to Consolidated Financial Statements.
|
2025 Annual Report |
9 |
|
OAKTREE DIVERSIFIED INCOME FUND INC. December 31, 2025 |
|
|
Par |
Value |
|||||
|
CORPORATE CREDIT (continued) |
|
||||||
|
Talbot Participation SAS, |
EUR |
335,000 |
$ |
397,197 |
|||
|
Trugreen LP, |
596,727 |
|
586,135 |
||||
|
TTD Holding IV GmbH, |
EUR |
500,000 |
|
588,398 |
|||
|
|
6,391,700 |
||||||
|
Communications Equipment – 0.2% |
|
||||||
|
Viasat, Inc., |
762,841 |
|
761,800 |
||||
|
Construction & Engineering – 0.6% |
|
||||||
|
ADB Companies LLC, |
923,653 |
|
877,471 |
||||
|
Artera Services LLC, |
312,647 |
|
254,548 |
||||
|
Tiger Acquisition LLC, |
893,935 |
|
897,846 |
||||
|
|
2,029,865 |
||||||
|
Consumer Staples Distribution & Retail – 0.2% |
|
||||||
|
Boots Group Bidco Ltd., |
EUR |
390,000 |
|
464,581 |
|||
|
Containers & Packaging – 0.4% |
|
||||||
|
Clydesdale Acquisition Holdings, Inc., |
494,864 |
|
495,040 |
||||
|
Proampac PG Borrower LLC, |
|
||||||
|
7.88% (3 mo. SOFR US + 4.00%), 09/15/2028, (0.75% Floor) |
392,857 |
|
394,163 |
||||
|
7.90% (3 mo. SOFR US + 4.00%), 09/15/2028, (0.75% Floor) |
502,554 |
|
504,225 |
||||
|
|
1,393,428 |
||||||
|
Distributors – 0.4% |
|
||||||
|
BradyPlus Holdings LLC, |
300,000 |
|
297,312 |
||||
|
Dealer Tire Financial LLC, |
890,083 |
|
892,308 |
||||
|
|
1,189,620 |
||||||
|
Diversified Consumer Services – 2.2% |
|
||||||
|
Adtalem Global Education, Inc., |
305,920 |
|
307,579 |
||||
____________
See Notes to Consolidated Financial Statements.
|
10 |
|
|
OAKTREE DIVERSIFIED INCOME FUND INC. December 31, 2025 |
|
|
Par |
Value |
|||||
|
CORPORATE CREDIT (continued) |
|
||||||
|
AI Aqua Merger Sub, Inc., |
|
||||||
|
6.85% (3 mo. SOFR US + 3.00%), 07/31/2028, (0.50% Floor) |
630,490 |
$ |
632,589 |
||||
|
6.87% (1 mo. SOFR US + 3.00%), 07/31/2028, (0.50% Floor) |
417,686 |
|
419,077 |
||||
|
Armorica Lux Sarl, |
EUR |
500,000 |
|
563,802 |
|||
|
Babilou, |
EUR |
455,000 |
|
496,467 |
|||
|
Cervantes Bidco SL, |
EUR |
300,000 |
|
356,332 |
|||
|
Fugue Finance LLC, |
843,636 |
|
847,643 |
||||
|
Galileo Global Education Operations SAS, |
EUR |
395,000 |
|
464,034 |
|||
|
Houghton Mifflin Harcourt Co., |
431,489 |
|
381,920 |
||||
|
KUEHG Corp., |
1,086,384 |
|
1,057,486 |
||||
|
Renaissance Holdings Corp., |
881,270 |
|
772,164 |
||||
|
University Support Services LLC, |
675,779 |
|
654,869 |
||||
|
|
6,953,962 |
||||||
|
Diversified Telecommunication Services – 0.5% |
|
||||||
|
Cincinnati Bell, Inc., |
712,749 |
|
714,591 |
||||
|
Iridium Satellite LLC, |
750,000 |
|
732,608 |
||||
|
Windstream Services LLC, |
110,849 |
|
111,403 |
||||
|
|
1,558,602 |
||||||
|
Electric Utilities – 0.1% |
|
||||||
|
Cornerstone Generation LLC, |
399,000 |
|
403,311 |
||||
|
Electronic Equipment, Instruments & Components – 0.5% |
|
||||||
|
LTI Holdings, Inc., |
1,135,625 |
|
1,144,040 |
||||
____________
See Notes to Consolidated Financial Statements.
|
2025 Annual Report |
11 |
|
OAKTREE DIVERSIFIED INCOME FUND INC. December 31, 2025 |
|
|
Par |
Value |
|||||
|
CORPORATE CREDIT (continued) |
|
||||||
|
Project Aurora US Finco, Inc., |
EUR |
310,000 |
$ |
368,137 |
|||
|
|
1,512,177 |
||||||
|
Entertainment – 0.6% |
|
||||||
|
City Football Group Ltd., |
1,025,405 |
|
1,026,687 |
||||
|
Learfield Communications LLC, |
201,474 |
|
202,212 |
||||
|
StubHub Holdco Sub LLC, |
790,746 |
|
785,310 |
||||
|
|
2,014,209 |
||||||
|
Financial Services – 0.3% |
|
||||||
|
Apex Group Treasury, |
EUR |
105,000 |
|
118,901 |
|||
|
Dynamo Newco II GmbH, |
EUR |
120,000 |
|
142,081 |
|||
|
Galaxy Bidco Ltd., |
EUR |
500,000 |
|
595,996 |
|||
|
|
856,978 |
||||||
|
Food Products – 1.0% |
|
||||||
|
Fiesta Purchaser, Inc., |
|
||||||
|
6.47% (1 mo. SOFR US + 2.75%), 02/12/2031, (0.00% Floor) |
281,762 |
|
282,003 |
||||
|
6.67% (1 mo. SOFR US + 2.75%), 02/12/2031, (0.00% Floor) |
333,906 |
|
334,191 |
||||
|
Flora Food Management US Corp., |
693,989 |
|
673,028 |
||||
|
Froneri US, Inc., |
500,000 |
|
500,698 |
||||
|
POP Bidco SAS, |
EUR |
510,000 |
|
606,951 |
|||
|
Upfield (Flora Food), |
GBP |
500,000 |
|
667,182 |
|||
|
|
3,064,053 |
||||||
|
Ground Transportation – 0.1% |
|
||||||
|
Kenan Advantage Group, Inc., |
398,987 |
|
396,194 |
||||
____________
See Notes to Consolidated Financial Statements.
|
12 |
|
|
OAKTREE DIVERSIFIED INCOME FUND INC. December 31, 2025 |
|
|
Par |
Value |
|||||
|
CORPORATE CREDIT (continued) |
|
||||||
|
Health Care Equipment & Supplies – 0.2% |
|
||||||
|
Bausch & Lomb, |
100,000 |
$ |
101,175 |
||||
|
Sebia, |
EUR |
500,000 |
|
592,888 |
|||
|
|
694,063 |
||||||
|
Health Care Providers & Services – 3.5% |
|
||||||
|
Almaviva Sante, |
EUR |
500,000 |
|
586,865 |
|||
|
Baart Programs, Inc., |
701,679 |
|
613,759 |
||||
|
Baart Programs, Inc., |
225,208 |
|
196,990 |
||||
|
Baart Programs, Inc., |
|
||||||
|
12.70% (3 mo. SOFR US + 8.50%), 06/11/2028, (1.00% Floor) (c) |
475,131 |
|
90,275 |
||||
|
12.96% (3 mo. SOFR US + 8.50%), 06/11/2028, (1.00% Floor) (c) |
109,025 |
|
20,715 |
||||
|
First Lien Revolver, |
19,837 |
|
17,166 |
||||
|
CHG Healthcare Services, Inc., |
977,543 |
|
983,154 |
||||
|
Covetrus, Inc., |
888,995 |
|
801,327 |
||||
|
Electron Bidco, Inc., |
786,957 |
|
791,966 |
||||
|
Elsan SAS, |
EUR |
500,000 |
|
574,704 |
|||
|
Euromedic, |
EUR |
235,000 |
|
279,796 |
|||
|
Global Medical Response, Inc., |
639,649 |
|
644,398 |
||||
|
HomeVi SASU, |
EUR |
500,000 |
|
587,112 |
|||
|
Independent Vetcare, |
GBP |
215,000 |
|
291,512 |
|||
|
IVI America LLC, |
543,139 |
|
548,402 |
||||
____________
See Notes to Consolidated Financial Statements.
|
2025 Annual Report |
13 |
|
OAKTREE DIVERSIFIED INCOME FUND INC. December 31, 2025 |
|
|
Par |
Value |
|||||
|
CORPORATE CREDIT (continued) |
|
||||||
|
Schoen Klinik SE, |
EUR |
285,000 |
$ |
339,257 |
|||
|
Southern Veterinary Partners LLC, |
1,094,507 |
|
1,094,414 |
||||
|
Takecare Bidco SAS, |
EUR |
500,000 |
|
594,430 |
|||
|
US Renal Care, Inc., |
646,684 |
|
610,712 |
||||
|
VetStrategy Canada Holdings, Inc., |
786,131 |
|
791,732 |
||||
|
Vivalto Sante Investissement SA, |
EUR |
475,000 |
|
561,203 |
|||
|
|
11,019,889 |
||||||
|
Health Care Technology – 1.0% |
|
||||||
|
athenaHealth Group, Inc., |
1,172,578 |
|
1,176,242 |
||||
|
Cotiviti, Inc., |
396,985 |
|
382,430 |
||||
|
PointClickCare Technologies, Inc., |
794,010 |
|
796,658 |
||||
|
Zelis Payments Buyer, Inc., |
853,380 |
|
848,046 |
||||
|
|
3,203,376 |
||||||
|
Hotels, Restaurants & Leisure – 1.5% |
|
||||||
|
Alterra Mountain Co., |
731,749 |
|
735,408 |
||||
|
Betclic Everest Group SAS, |
EUR |
500,000 |
|
594,515 |
|||
|
Flynn Restaurant Group LP, |
870,427 |
|
875,010 |
||||
|
Kingpin Intermediate Holdings LLC, |
1,100,000 |
|
1,080,750 |
||||
|
Tacala Investment Corp., |
560,879 |
|
565,436 |
||||
|
Whatabrands LLC, |
768,689 |
|
771,583 |
||||
|
|
4,622,702 |
||||||
____________
See Notes to Consolidated Financial Statements.
|
14 |
|
|
OAKTREE DIVERSIFIED INCOME FUND INC. December 31, 2025 |
|
|
Par |
Value |
|||||
|
CORPORATE CREDIT (continued) |
|
||||||
|
Household Durables – 0.2% |
|
||||||
|
Hunter Douglas, Inc., |
763,844 |
$ |
769,027 |
||||
|
Independent Power and Renewable Electricity Producers – 0.4% |
|
||||||
|
EFS Cogen Holdings I LLC, |
811,558 |
|
819,020 |
||||
|
Talen Energy Supply LLC, |
343,107 |
|
344,931 |
||||
|
Talen Energy Supply LLC, |
173,250 |
|
174,278 |
||||
|
|
1,338,229 |
||||||
|
Insurance – 1.1% |
|
||||||
|
Acrisure LLC, |
497,487 |
|
497,721 |
||||
|
Acropole Holding SAS, |
EUR |
424,038 |
|
505,005 |
|||
|
Amynta Agency Borrower, Inc., |
990,776 |
|
994,179 |
||||
|
Asurion LLC, |
629,393 |
|
630,891 |
||||
|
Asurion LLC, |
350,000 |
|
349,400 |
||||
|
Asurion LLC, |
99,494 |
|
99,791 |
||||
|
CRC Insurance Group LLC, |
210,526 |
|
213,772 |
||||
|
|
3,290,759 |
||||||
|
Interactive Media & Services – 1.1% |
|
||||||
|
GoodRx, Inc., |
742,500 |
|
744,590 |
||||
|
Neptune Bidco US, Inc., |
778,030 |
|
771,125 |
||||
|
X Corp., |
1,733,000 |
|
1,730,210 |
||||
|
X Corp., |
298,918 |
|
294,329 |
||||
|
|
3,540,254 |
||||||
____________
See Notes to Consolidated Financial Statements.
|
2025 Annual Report |
15 |
|
OAKTREE DIVERSIFIED INCOME FUND INC. December 31, 2025 |
|
|
Par |
Value |
|||||
|
CORPORATE CREDIT (continued) |
|
||||||
|
Leisure Products – 0.3% |
|
||||||
|
Peloton Interactive, Inc., |
986,980 |
$ |
996,850 |
||||
|
Life Sciences Tools & Services – 0.8% |
|
||||||
|
PAREXEL International Corp., |
794,000 |
|
797,640 |
||||
|
Sotera Health Holdings LLC, |
830,126 |
|
835,838 |
||||
|
Star Parent, Inc., |
776,643 |
|
778,433 |
||||
|
|
2,411,911 |
||||||
|
Machinery – 0.5% |
|
||||||
|
Delachaux Group SA, |
EUR |
220,509 |
|
262,688 |
|||
|
SPX FLOW, Inc., |
400,212 |
|
401,809 |
||||
|
TK Elevator Midco GmbH, |
EUR |
460,000 |
|
546,824 |
|||
|
TSG Solutions Holding SACA, |
EUR |
300,000 |
|
356,306 |
|||
|
|
1,567,627 |
||||||
|
Media – 1.4% |
|
||||||
|
Aragorn Parent Corp., |
638,759 |
|
644,016 |
||||
|
Century DE Buyer LLC, |
345,642 |
|
345,482 |
||||
|
CSC Holdings LLC, |
100,000 |
|
87,642 |
||||
|
Directv Financing LLC, |
686,104 |
|
689,336 |
||||
|
Directv Financing LLC, |
115,667 |
|
116,028 |
||||
|
McGraw-Hill Education, Inc., |
437,017 |
|
441,271 |
||||
____________
See Notes to Consolidated Financial Statements.
|
16 |
|
|
OAKTREE DIVERSIFIED INCOME FUND INC. December 31, 2025 |
|
|
Par |
Value |
|||||
|
CORPORATE CREDIT (continued) |
|
||||||
|
Univision Communications, Inc., |
|
||||||
|
7.20% (1 mo. SOFR US + 3.25%), 01/31/2029, (0.75% Floor) |
593,830 |
$ |
590,490 |
||||
|
7.92% (3 mo. SOFR US + 4.25%), 06/25/2029, (0.50% Floor) |
484,925 |
|
486,379 |
||||
|
Virgin Media Bristol LLC, |
185,000 |
|
183,581 |
||||
|
Virgin Media, Ltd., |
EUR |
115,000 |
|
136,401 |
|||
|
WideOpenWest Finance LLC, |
|
||||||
|
11.43% (3 mo. SOFR US + 7.00%), 12/11/2028, (1.50% Floor) |
336,370 |
|
343,237 |
||||
|
7.43% (3 mo. SOFR US + 3.00%), 12/11/2028, (1.50% Floor) |
472,825 |
|
431,453 |
||||
|
|
4,495,316 |
||||||
|
Metals & Mining – 0.1% |
|
||||||
|
Arsenal AIC Parent LLC, |
171,552 |
|
172,250 |
||||
|
Oil, Gas & Consumable Fuels – 0.4% |
|
||||||
|
Freeport LNG Investments LLLP, |
807,426 |
|
811,717 |
||||
|
Traverse Midstream Partners LLC, |
500,000 |
|
501,875 |
||||
|
|
1,313,592 |
||||||
|
Pharmaceuticals – 0.8% |
|
||||||
|
AI Sirona Luxembourg Acquisition Sarl, |
EUR |
250,000 |
|
295,401 |
|||
|
AI Sirona Luxembourg Acquisition Sarl, |
EUR |
250,000 |
|
295,355 |
|||
|
Althea Acquisition Bidco SARL, |
EUR |
550,000 |
|
651,511 |
|||
|
Curium Bidco Sarl, |
|
||||||
|
6.67% (3 mo. SOFR US + 3.00%), 08/07/2031, (0.00% Floor) |
773,936 |
|
782,643 |
||||
|
7.00% (3 mo. SOFR US + 3.00%), 08/07/2031, (0.00% Floor) |
138,815 |
|
140,377 |
||||
|
Ethypharm, |
EUR |
250,000 |
|
295,064 |
|||
|
Pharmanovia Bidco Ltd., |
EUR |
300,000 |
|
190,971 |
|||
|
|
2,651,322 |
||||||
____________
See Notes to Consolidated Financial Statements.
|
2025 Annual Report |
17 |
|
OAKTREE DIVERSIFIED INCOME FUND INC. December 31, 2025 |
|
|
Par |
Value |
|||||
|
CORPORATE CREDIT (continued) |
|
||||||
|
Professional Services – 2.1% |
|
||||||
|
Advantage Sales & Marketing, Inc., |
502,323 |
$ |
420,193 |
||||
|
Blackhawk Network Holdings, Inc., |
936,788 |
|
942,422 |
||||
|
Dawn Bidco LLC, |
400,000 |
|
399,288 |
||||
|
DTI Holdco, Inc., |
576,792 |
|
540,125 |
||||
|
Eisner Advisory Group LLC, |
566,675 |
|
571,370 |
||||
|
Element Materials Technology Group US Holdings, Inc., |
770,060 |
|
777,761 |
||||
|
Grant Thornton Advisors LLC, |
592,530 |
|
594,385 |
||||
|
Planet US Buyer LLC, |
615,625 |
|
620,405 |
||||
|
Project Alpha Intermediate Holding, |
987,381 |
|
986,956 |
||||
|
Skopima Consilio Parent LLC, |
695,940 |
|
637,655 |
||||
|
|
6,490,560 |
||||||
|
Semiconductors & Semiconductor Equipment – 0.2% |
|
||||||
|
Gryphon Acquire NewCo LLC, |
500,000 |
|
504,012 |
||||
|
Software – 4.9% |
|
||||||
|
Athena BidCo GmbH, |
EUR |
500,000 |
|
595,955 |
|||
|
Avalara, Inc., |
1,074,607 |
|
1,080,501 |
||||
|
Boxer Parent Co., Inc., |
128,033 |
|
127,850 |
||||
|
Capstone Borrower, Inc., |
373,758 |
|
374,008 |
||||
|
Castle US Holding Corp., |
EUR |
218,319 |
|
125,902 |
|||
____________
See Notes to Consolidated Financial Statements.
|
18 |
|
|
OAKTREE DIVERSIFIED INCOME FUND INC. December 31, 2025 |
|
|
Par |
Value |
|||||
|
CORPORATE CREDIT (continued) |
|
||||||
|
Castle US Holding Corp., |
|
||||||
|
8.06% (3 mo. EURIBOR + 6.00%) (or 1.00% PIK), 04/29/2030, (2.00% Floor) |
EUR |
33,422 |
$ |
40,063 |
|||
|
8.07% (3 mo. EURIBOR + 6.00%) (or 1.00% PIK), 04/29/2030, (2.00% Floor) |
EUR |
174 |
|
209 |
|||
|
Cloud Software Group, Inc., |
|
||||||
|
6.92% (1 mo. SOFR US + 3.25%), 03/24/2031, (0.00% Floor) |
2,260 |
|
2,266 |
||||
|
6.92% (3 mo. SOFR US + 3.25%), 03/24/2031, (0.00% Floor) |
899,578 |
|
901,755 |
||||
|
Cloud Software Group, Inc., |
|
||||||
|
6.92% (1 mo. SOFR US + 3.25%), 08/16/2032, (0.00% Floor) |
1,578 |
|
1,582 |
||||
|
6.92% (3 mo. SOFR US + 3.25%), 08/16/2032, (0.00% Floor) |
627,927 |
|
629,450 |
||||
|
ConnectWise LLC, |
53,169 |
|
52,339 |
||||
|
Epicor Software Corp., |
550,302 |
|
552,723 |
||||
|
Finastra USA, Inc., |
100,000 |
|
98,081 |
||||
|
Icon Parent, Inc., |
899,745 |
|
902,390 |
||||
|
Kaseya, Inc., |
1,124,299 |
|
1,126,615 |
||||
|
Leia Finco US LLC, |
305,000 |
|
303,379 |
||||
|
Leia Finco US LLC, |
971,174 |
|
975,947 |
||||
|
Marcel Bidco GmbH, |
EUR |
300,000 |
|
357,804 |
|||
|
McAfee Corp., |
886,022 |
|
820,576 |
||||
|
McAfee Corp., |
EUR |
242,555 |
|
276,144 |
|||
|
Mermaid Bidco, Inc., |
EUR |
450,000 |
|
534,236 |
|||
|
Mitchell International, Inc., |
641,875 |
|
644,767 |
||||
|
Mitchell International, Inc., |
310,000 |
|
308,799 |
||||
____________
See Notes to Consolidated Financial Statements.
|
2025 Annual Report |
19 |
|
OAKTREE DIVERSIFIED INCOME FUND INC. December 31, 2025 |
|
|
Par |
Value |
|||||
|
CORPORATE CREDIT (continued) |
|
||||||
|
Polaris Newco LLC, |
EUR |
240,000 |
$ |
268,574 |
|||
|
Project Boost Purchaser LLC, |
742,519 |
|
745,210 |
||||
|
Proofpoint, Inc., |
1,290,699 |
|
1,299,483 |
||||
|
Storable, Inc., |
182,620 |
|
183,723 |
||||
|
team.blue Finco SARL, |
EUR |
300,000 |
|
354,819 |
|||
|
UKG, Inc., |
1,060,721 |
|
1,063,060 |
||||
|
X.AI (Twitter), |
199,000 |
|
197,028 |
||||
|
X.AI (Twitter), |
199,000 |
|
209,593 |
||||
|
Zodiac Purchaser LLC, |
239,400 |
|
238,907 |
||||
|
|
15,393,738 |
||||||
|
Specialty Retail – 1.3% |
|
||||||
|
EG America LLC, |
1,119,082 |
|
1,124,794 |
||||
|
LS Group OpCo Acquistion LLC, |
|
||||||
|
6.22% (1 mo. SOFR US + 2.50%), 04/23/2031, (0.00% Floor) |
78,206 |
|
78,408 |
||||
|
6.32% (3 mo. SOFR US + 2.50%), 04/23/2031, (0.00% Floor) |
662,447 |
|
664,156 |
||||
|
Motor Fuel Group, |
GBP |
350,000 |
|
476,499 |
|||
|
Petco Health & Wellness Co., Inc., |
228,797 |
|
226,838 |
||||
|
PetSmart LLC, |
796,800 |
|
794,561 |
||||
|
Wand NewCo 3, Inc., |
563,477 |
|
564,711 |
||||
|
|
3,929,967 |
||||||
____________
See Notes to Consolidated Financial Statements.
|
20 |
|
|
OAKTREE DIVERSIFIED INCOME FUND INC. December 31, 2025 |
|
|
Par |
Value |
|||||
|
CORPORATE CREDIT (continued) |
|
||||||
|
Technology Hardware, Storage & Peripherals – 0.1% |
|
||||||
|
CoreWeave Compute, |
606,982 |
$ |
84,158 |
||||
|
CoreWeave Compute, |
593,018 |
|
82,222 |
||||
|
Sandisk Corp., |
197,889 |
|
199,373 |
||||
|
|
365,753 |
||||||
|
Trading Companies & Distributors – 0.2% |
|
||||||
|
Renta Group, |
EUR |
500,000 |
|
595,679 |
|||
|
Transportation Infrastructure – 0.1% |
|
||||||
|
Boluda Towage, |
EUR |
300,000 |
|
356,951 |
|||
|
Total Senior Loans (Syndicated) |
|
|
|
110,116,651 |
|||
|
High Yield – 23.8% (a) |
|
||||||
|
Aerospace & Defense – 0.1% |
|
||||||
|
Bombardier, Inc., |
120,000 |
|
126,947 |
||||
|
TransDigm, Inc., |
115,000 |
|
119,867 |
||||
|
|
246,814 |
||||||
|
Automobile Components – 0.4% |
|
||||||
|
Dana Financing Luxembourg Sarl, |
EUR |
275,000 |
|
346,493 |
|||
|
IHO Verwaltungs GmbH, |
EUR |
305,000 |
|
388,126 |
|||
|
Valeo SE, |
EUR |
400,000 |
|
470,888 |
|||
|
|
1,205,507 |
||||||
|
Automobiles – 0.5% |
|
||||||
|
JB Poindexter & Company, Inc., |
575,000 |
|
603,018 |
||||
|
Nissan Motor Co. Ltd., |
745,000 |
|
792,324 |
||||
|
|
1,395,342 |
||||||
|
Broadline Retail – 0.3% |
|
||||||
|
B&M European Value Retail SA, |
GBP |
295,000 |
|
393,242 |
|||
|
QVC, Inc., |
1,163,000 |
|
509,307 |
||||
|
|
902,549 |
||||||
____________
See Notes to Consolidated Financial Statements.
|
2025 Annual Report |
21 |
|
OAKTREE DIVERSIFIED INCOME FUND INC. December 31, 2025 |
|
|
Par |
Value |
|||||
|
CORPORATE CREDIT (continued) |
|
||||||
|
Building Products – 0.1% |
|
||||||
|
LBM Acquisition LLC, |
395,000 |
$ |
355,866 |
||||
|
Chemicals – 1.1% |
|
||||||
|
Celanese US Holdings LLC |
160,000 |
|
163,913 |
||||
|
6.75%, 04/15/2033 |
645,000 |
|
642,200 |
||||
|
INEOS Finance PLC, |
EUR |
100,000 |
|
103,791 |
|||
|
INEOS Quattro Finance 2 PLC, |
EUR |
335,000 |
|
293,386 |
|||
|
Inversion Escrow Issuer LLC, |
479,000 |
|
478,771 |
||||
|
Kronos International, Inc., |
EUR |
155,000 |
|
170,615 |
|||
|
Olympus Water US Holding Corp. |
315,000 |
|
306,804 |
||||
|
7.25%, 06/15/2031 (d) |
275,000 |
|
282,511 |
||||
|
6.13%, 02/15/2033 |
EUR |
154,000 |
|
180,138 |
|||
|
Perimeter Holdings LLC, |
310,000 |
|
308,177 |
||||
|
Windsor Holdings III LLC, |
622,000 |
|
657,832 |
||||
|
|
3,588,138 |
||||||
|
Commercial Services & Supplies – 1.0% |
|
||||||
|
Allied Universal Holdco LLC |
|
||||||
|
3.63%, 06/01/2028 |
EUR |
305,000 |
|
356,185 |
|||
|
7.88%, 02/15/2031 (d) |
900,000 |
|
949,026 |
||||
|
Amber Finco PLC, |
EUR |
300,000 |
|
371,544 |
|||
|
Garda World Security Corp., |
445,000 |
|
453,935 |
||||
|
Luna 2 5SARL, |
EUR |
375,000 |
|
450,220 |
|||
|
TMS International Corp., |
640,000 |
|
621,031 |
||||
|
|
3,201,941 |
||||||
|
Communications Equipment – 0.3% |
|
||||||
|
CommScope LLC |
|
||||||
|
4.75%, 09/01/2029 (d) |
524,000 |
|
523,672 |
||||
|
9.50%, 12/15/2031 (d) |
291,000 |
|
294,172 |
||||
|
|
817,844 |
||||||
|
Construction & Engineering – 0.2% |
|
||||||
|
Assemblin Caverion, |
EUR |
331,000 |
|
405,897 |
|||
|
Great Lakes Dredge & Dock Corp., |
340,000 |
|
333,192 |
||||
|
|
739,089 |
||||||
____________
See Notes to Consolidated Financial Statements.
|
22 |
|
|
OAKTREE DIVERSIFIED INCOME FUND INC. December 31, 2025 |
|
|
Par |
Value |
|||||
|
CORPORATE CREDIT (continued) |
|
||||||
|
Consumer Finance – 0.2% |
|
||||||
|
goeasy Ltd. |
|
||||||
|
6.88%, 05/15/2030 (d) |
275,000 |
$ |
262,757 |
||||
|
7.38%, 10/01/2030 (d) |
190,000 |
|
182,999 |
||||
|
OneMain Finance Corp., |
150,000 |
|
152,082 |
||||
|
|
597,838 |
||||||
|
Consumer Staples Distribution & Retail – 0.1% |
|
||||||
|
Boots Group Finco LP, |
EUR |
320,000 |
|
389,248 |
|||
|
Containers & Packaging – 0.6% |
|
||||||
|
Cascades, Inc., |
420,000 |
|
437,854 |
||||
|
Graham Packaging Company, Inc., |
285,000 |
|
285,815 |
||||
|
Guala Closures SpA, |
EUR |
250,000 |
|
295,601 |
|||
|
Owens-Brockway Glass Container, Inc., |
785,000 |
|
802,291 |
||||
|
|
1,821,561 |
||||||
|
Diversified Consumer Services – 0.3% |
|
||||||
|
Aegis Lux 1a Sarl, |
EUR |
394,000 |
|
469,943 |
|||
|
Verisure Midholding AB, |
EUR |
310,000 |
|
366,202 |
|||
|
|
836,145 |
||||||
|
Diversified Telecommunication Services – 1.3% |
|
||||||
|
Cogent Communications Group, Inc. |
|
||||||
|
7.00%, 06/15/2027 (d) |
325,000 |
|
326,318 |
||||
|
6.50%, 07/01/2032 (d) |
685,000 |
|
641,473 |
||||
|
eircom Finance DAC, |
EUR |
363,000 |
|
434,709 |
|||
|
Iliad Holding SAS |
|
||||||
|
5.38%, 04/15/2030 |
EUR |
125,000 |
|
151,991 |
|||
|
6.88%, 04/15/2031 |
EUR |
255,000 |
|
320,727 |
|||
|
Level 3 Financing, Inc. |
|
||||||
|
7.00%, 03/31/2034 (d) |
860,000 |
|
886,980 |
||||
|
8.50%, 01/15/2036 (d) |
160,000 |
|
164,054 |
||||
|
Telefonica Europe BV, |
EUR |
200,000 |
|
260,287 |
|||
|
VZ Secured Financing BV, |
EUR |
379,000 |
|
438,252 |
|||
|
Zayo Group Holdings, Inc., |
313,339 |
|
297,970 |
||||
|
|
3,922,761 |
||||||
|
Electric Utilities – 0.2% |
|
||||||
|
VoltaGrid LLC, 7.38%, |
645,000 |
|
639,344 |
||||
____________
See Notes to Consolidated Financial Statements.
|
2025 Annual Report |
23 |
|
OAKTREE DIVERSIFIED INCOME FUND INC. December 31, 2025 |
|
|
Par |
Value |
|||||
|
CORPORATE CREDIT (continued) |
|
||||||
|
Energy Equipment & Services – 0.2% |
|
||||||
|
Nabors Industries, Inc., |
308,000 |
$ |
298,999 |
||||
|
Weatherford International Ltd., |
320,000 |
|
327,886 |
||||
|
|
626,885 |
||||||
|
Entertainment – 0.2% |
|
||||||
|
Warnermedia Holdings, Inc., |
1,015,000 |
|
716,844 |
||||
|
Financial Services – 0.8% |
|
||||||
|
CrossCountry Intermediate HoldCo LLC, |
305,000 |
|
311,469 |
||||
|
Freedom Mortgage Holdings LLC, |
457,000 |
|
491,415 |
||||
|
GTCR LLC, |
GBP |
250,000 |
|
360,778 |
|||
|
NCR Atleos Corp., |
710,000 |
|
771,029 |
||||
|
PennyMac Financial Services, Inc., |
300,000 |
|
313,396 |
||||
|
Stonebriar ABF Issuer LLC, |
305,000 |
|
314,138 |
||||
|
|
2,562,225 |
||||||
|
Food Products – 0.8% |
|
||||||
|
Fiesta Purchaser, Inc. |
|
||||||
|
7.88%, 03/01/2031 (d) |
585,000 |
|
612,771 |
||||
|
9.63%, 09/15/2032 (d) |
290,000 |
|
304,650 |
||||
|
Flora Food Management BV, |
EUR |
160,000 |
|
187,138 |
|||
|
Irca SpA, |
EUR |
500,000 |
|
598,547 |
|||
|
Post Holdings, Inc. |
|
||||||
|
6.25%, 10/15/2034 (d) |
320,000 |
|
322,077 |
||||
|
6.50%, 03/15/2036 (d) |
290,000 |
|
290,634 |
||||
|
Roquette Freres SA, |
EUR |
100,000 |
|
120,465 |
|||
|
Sammontana Italia SpA, |
EUR |
175,000 |
|
208,094 |
|||
|
|
2,644,376 |
||||||
|
Gas Utilities – 0.5% |
|
||||||
|
CQP Holdco LP |
|
||||||
|
5.50%, 06/15/2031 (d) |
165,000 |
|
163,346 |
||||
|
7.50%, 12/15/2033 (d) |
515,000 |
|
554,304 |
||||
|
Suburban Propane Partners LP |
|
||||||
|
5.00%, 06/01/2031 (d) |
835,000 |
|
803,573 |
||||
|
6.50%, 12/15/2035 (d) |
120,000 |
|
120,102 |
||||
|
|
1,641,325 |
||||||
____________
See Notes to Consolidated Financial Statements.
|
24 |
|
|
OAKTREE DIVERSIFIED INCOME FUND INC. December 31, 2025 |
|
|
Par |
Value |
|||||
|
CORPORATE CREDIT (continued) |
|
||||||
|
Health Care Providers & Services – 1.5% |
|
||||||
|
Acadia Healthcare Co., Inc., |
1,078,000 |
$ |
1,090,132 |
||||
|
Community Health Systems, Inc. |
|
||||||
|
10.88%, 01/15/2032 (d) |
256,000 |
|
279,729 |
||||
|
9.75%, 01/15/2034 (d) |
480,000 |
|
504,758 |
||||
|
LifePoint Health, Inc., |
755,000 |
|
820,144 |
||||
|
Mehilainen Yhtiot Oy, |
EUR |
425,000 |
|
508,367 |
|||
|
Nidda Healthcare Holding GmbH, |
EUR |
420,000 |
|
498,519 |
|||
|
Nidda Healthcare Holding GmbH |
|
||||||
|
5.63%, 02/21/2030 |
EUR |
225,000 |
|
272,101 |
|||
|
5.38%, 10/23/2030 |
EUR |
160,000 |
|
192,467 |
|||
|
RAY Financing LLC, |
EUR |
410,000 |
|
491,954 |
|||
|
|
4,658,171 |
||||||
|
Health Care REITs – 0.0% (e) |
|
||||||
|
MPT Operating Partnership LP, |
55,000 |
|
53,308 |
||||
|
Hotel & Resort REITs – 0.3% |
|
||||||
|
Service Properties Trust, |
1,000,000 |
|
1,052,446 |
||||
|
Hotels, Restaurants & Leisure – 1.8% |
|
||||||
|
Bloomin’ Brands, Inc., |
1,015,000 |
|
926,168 |
||||
|
Cirsa Finance International Sarl, |
EUR |
292,000 |
|
352,747 |
|||
|
CPUK Finance Ltd., |
GBP |
329,000 |
|
443,522 |
|||
|
Hilton Grand Vacations Borrower Escrow LLC, |
675,000 |
|
656,092 |
||||
|
LHMC Finco 2 Sarl, |
EUR |
104,766 |
|
128,255 |
|||
|
Marriott Ownership Resorts, Inc., |
800,000 |
|
769,713 |
||||
|
Motel One GmbH, |
EUR |
315,000 |
|
395,968 |
|||
|
NCL Corp. Ltd., |
315,000 |
|
315,015 |
||||
|
Sani/Ikos Financial Holdings, |
EUR |
325,000 |
|
401,785 |
|||
|
Six Flags Entertainment Corp, |
1,095,000 |
|
1,051,515 |
||||
|
TUI Cruises GmbH, |
EUR |
285,000 |
|
349,154 |
|||
|
|
5,789,934 |
||||||
____________
See Notes to Consolidated Financial Statements.
|
2025 Annual Report |
25 |
|
OAKTREE DIVERSIFIED INCOME FUND INC. December 31, 2025 |
|
|
Par |
Value |
|||||
|
CORPORATE CREDIT (continued) |
|
||||||
|
Household Durables – 0.3% |
|
||||||
|
Miller Homes Group Finco PLC, |
GBP |
330,000 |
$ |
449,466 |
|||
|
Weekley Homes LLC, |
345,000 |
|
349,754 |
||||
|
|
799,220 |
||||||
|
Independent Power and Renewable Electricity Producers – 0.5% |
|
||||||
|
California Buyer Ltd., |
EUR |
372,000 |
|
447,609 |
|||
|
Lightning Power LLC, |
735,000 |
|
781,978 |
||||
|
XPLR Infrastructure Operating Partners LP, |
305,000 |
|
310,206 |
||||
|
|
1,539,793 |
||||||
|
Insurance – 0.4% |
|
||||||
|
Alliant Holdings LP, |
200,000 |
|
207,624 |
||||
|
Ardonagh Finco Ltd, |
EUR |
410,000 |
|
498,605 |
|||
|
HUB International Ltd. |
|
||||||
|
5.63%, 12/01/2029 (d) |
120,000 |
|
120,069 |
||||
|
7.38%, 01/31/2032 (d) |
380,000 |
|
399,068 |
||||
|
|
1,225,366 |
||||||
|
Life Sciences Tools & Services – 0.5% |
|
||||||
|
Eurofins Scientific SE, |
EUR |
320,000 |
|
395,560 |
|||
|
Sotera Health Holdings LLC, |
1,045,000 |
|
1,097,325 |
||||
|
|
1,492,885 |
||||||
|
Machinery – 0.2% |
|
||||||
|
Alstom SA, |
EUR |
300,000 |
|
374,067 |
|||
|
IMA Industria Macchine Automatiche SpA, |
EUR |
220,000 |
|
262,299 |
|||
|
|
636,366 |
||||||
|
Media – 2.2% |
|
||||||
|
AMC Networks, Inc. |
|
||||||
|
10.25%, 01/15/2029 (d) |
325,000 |
|
341,020 |
||||
|
4.25%, 02/15/2029 |
11,000 |
|
9,785 |
||||
|
10.50%, 07/15/2032 (d) |
777,000 |
|
859,094 |
||||
|
Block Communications, Inc., |
310,000 |
|
289,811 |
||||
|
Cablevision Lightpath LLC, |
415,000 |
|
407,698 |
||||
|
CCO Holdings LLC |
|
||||||
|
6.38%, 09/01/2029 (d) |
140,000 |
|
141,995 |
||||
|
4.75%, 03/01/2030 (d) |
190,000 |
|
181,577 |
||||
|
4.25%, 02/01/2031 (d) |
170,000 |
|
156,307 |
||||
|
4.50%, 06/01/2033 (d) |
494,000 |
|
432,990 |
||||
____________
See Notes to Consolidated Financial Statements.
|
26 |
|
|
OAKTREE DIVERSIFIED INCOME FUND INC. December 31, 2025 |
|
|
Par |
Value |
|||||
|
CORPORATE CREDIT (continued) |
|
||||||
|
Clear Channel Outdoor Holdings, Inc., |
631,000 |
$ |
667,044 |
||||
|
CSC Holdings LLC, |
1,045,000 |
|
896,771 |
||||
|
Directv Financing LLC |
|
||||||
|
5.88%, 08/15/2027 (d) |
214,000 |
|
215,376 |
||||
|
8.88%, 02/01/2030 (d) |
95,000 |
|
96,239 |
||||
|
Gray Media, Inc. |
|
||||||
|
9.63%, 07/15/2032 (d) |
310,000 |
|
321,942 |
||||
|
7.25%, 08/15/2033 (d) |
370,000 |
|
378,299 |
||||
|
Sirius XM Radio LLC, |
160,000 |
|
152,278 |
||||
|
Sirius XM Radio, Inc., |
1,060,000 |
|
976,884 |
||||
|
Univision Communications, Inc., |
40,000 |
|
41,458 |
||||
|
Virgin Media Financing PLC, |
EUR |
235,000 |
|
278,579 |
|||
|
Virgin Media Secured Finance PLC, |
GBP |
140,000 |
|
183,091 |
|||
|
|
7,028,238 |
||||||
|
Metals & Mining – 0.8% |
|
||||||
|
Cleveland-Cliffs, Inc., |
810,000 |
|
843,131 |
||||
|
Mineral Resources Ltd. |
|
||||||
|
9.25%, 10/01/2028 (d) |
380,000 |
|
399,152 |
||||
|
8.50%, 05/01/2030 (d) |
705,000 |
|
733,791 |
||||
|
7.00%, 04/01/2031 (d) |
150,000 |
|
156,556 |
||||
|
Novelis Corp., |
375,000 |
|
389,565 |
||||
|
|
2,522,195 |
||||||
|
Oil, Gas & Consumable Fuels – 0.7% |
|
||||||
|
Comstock Resources, Inc. |
|
||||||
|
6.75%, 03/01/2029 (d) |
635,000 |
|
634,223 |
||||
|
5.88%, 01/15/2030 (d) |
16,000 |
|
15,574 |
||||
|
Northern Oil & Gas, Inc., |
630,000 |
|
613,799 |
||||
|
Sunoco LP, |
300,000 |
|
307,450 |
||||
|
Venture Global LNG, Inc., |
97,000 |
|
96,516 |
||||
|
Venture Global Plaquemines LNG LLC |
|
||||||
|
6.50%, 06/15/2034 (d) |
225,000 |
|
230,012 |
||||
|
6.75%, 01/15/2036 (d) |
245,000 |
|
251,066 |
||||
|
|
2,148,640 |
||||||
|
Paper & Forest Products – 0.2% |
|
||||||
|
Mercer International, Inc., |
550,000 |
|
353,075 |
||||
|
WEPA Hygieneprodukte GmbH, |
EUR |
337,000 |
|
397,738 |
|||
|
|
750,813 |
||||||
____________
See Notes to Consolidated Financial Statements.
|
2025 Annual Report |
27 |
|
OAKTREE DIVERSIFIED INCOME FUND INC. December 31, 2025 |
|
|
Par |
Value |
|||||
|
CORPORATE CREDIT (continued) |
|
||||||
|
Passenger Airlines – 0.6% |
|
||||||
|
Spirit Airlines Pass Through Trust, |
2,000,000 |
$ |
1,900,000 |
||||
|
Personal Care Products – 0.1% |
|
||||||
|
Opal Bidco SAS, |
EUR |
335,000 |
|
407,249 |
|||
|
Pharmaceuticals – 1.0% |
|
||||||
|
1261229 BC Ltd., |
930,000 |
|
967,913 |
||||
|
Cheplapharm Arzneimittel GmbH |
|
||||||
|
6.81% (3 mo. EURIBOR + 4.75%), 05/15/2030, (0.00% Floor) (d) |
EUR |
210,000 |
|
247,633 |
|||
|
7.50%, 05/15/2030 |
EUR |
300,000 |
|
366,074 |
|||
|
7.13%, 06/15/2031 |
EUR |
100,000 |
|
120,512 |
|||
|
Dolcetto Holdco SpA, |
EUR |
420,000 |
|
502,218 |
|||
|
Endo Finance Holdings, Inc., |
725,000 |
|
767,188 |
||||
|
|
2,971,538 |
||||||
|
Real Estate Management & Development – 0.4% |
|
||||||
|
Hunt Companies, Inc., |
765,000 |
|
750,137 |
||||
|
Kennedy-Wilson, Inc., |
515,000 |
|
485,826 |
||||
|
|
1,235,963 |
||||||
|
Software – 0.8% |
|
||||||
|
Cedacri SpA, |
EUR |
200,000 |
|
238,372 |
|||
|
Cloud Software Group, Inc., |
219,000 |
|
222,011 |
||||
|
Dye & Durham Ltd., |
921,000 |
|
869,342 |
||||
|
ION Platform Finance SARL, |
EUR |
103,000 |
|
115,963 |
|||
|
NCR Voyix Corp., |
175,000 |
|
174,299 |
||||
|
TeamSystem SpA |
|
||||||
|
5.00%, 07/01/2031 |
EUR |
365,000 |
|
433,699 |
|||
|
5.28% (3 mo. EURIBOR + 3.25%), 07/01/2032, (0.00% Floor) (d) |
EUR |
500,000 |
|
591,712 |
|||
|
|
2,645,398 |
||||||
|
Specialty Retail – 1.3% |
|
||||||
|
Advance Auto Parts, Inc. |
|
||||||
|
7.00%, 08/01/2030 (d) |
315,000 |
|
317,888 |
||||
|
7.38%, 08/01/2033 (d) |
470,000 |
|
472,199 |
||||
|
CD&R Firefly Bidco, |
GBP |
320,000 |
|
452,971 |
|||
|
EG Global Finance PLC, |
EUR |
155,000 |
|
197,785 |
|||
____________
See Notes to Consolidated Financial Statements.
|
28 |
|
|
OAKTREE DIVERSIFIED INCOME FUND INC. December 31, 2025 |
|
|
Par |
Value |
|||||
|
CORPORATE CREDIT (continued) |
|
||||||
|
LCM Investments Holdings II LLC, |
870,000 |
$ |
920,720 |
||||
|
PetSmart LLC, |
644,000 |
|
656,165 |
||||
|
Wand NewCo 3, Inc., |
1,025,000 |
|
1,085,301 |
||||
|
|
4,103,029 |
||||||
|
Textiles, Apparel & Luxury Goods – 0.1% |
|
||||||
|
Afflelou SAS, |
EUR |
250,000 |
|
306,657 |
|||
|
Trading Companies & Distributors – 0.7% |
|
||||||
|
Equipmentshare.Com Inc. |
|
||||||
|
9.00%, 05/15/2028 (d) |
995,000 |
|
1,035,229 |
||||
|
8.00%, 03/15/2033 (d) |
302,000 |
|
318,151 |
||||
|
FTAI Aviation Investors LLC, |
874,000 |
|
932,692 |
||||
|
|
2,286,072 |
||||||
|
Transportation Infrastructure – 0.1% |
|
||||||
|
Heathrow Finance PLC, |
GBP |
175,000 |
|
237,578 |
|||
|
Water Utilities – 0.1% |
|
||||||
|
WBI Operating LLC, |
320,000 |
|
318,959 |
||||
|
Total High Yield |
|
|
|
74,961,460 |
|||
|
TOTAL CORPORATE CREDIT |
|
|
|
185,078,111 |
|||
|
PRIVATE CREDIT – 33.4% |
|
||||||
|
Senior Loans – 29.1% (a) |
|
||||||
|
Aerospace & Defense – 1.7% |
|
||||||
|
Galileo Parent, Inc., |
2,323,290 |
|
2,312,138 |
||||
|
Galileo Parent, Inc., |
|
||||||
|
10.34% (1 mo. SOFR US + 5.75%), 05/03/2029, (1.00% Floor) (b)(c) |
3,072 |
|
2,008 |
||||
|
9.42% (3 mo. SOFR US + 5.75%), 05/03/2029, (1.00% Floor) (b)(c) |
366,928 |
|
239,798 |
||||
|
GASL Bermuda, |
3,100,000 |
|
1,830,384 |
||||
|
WP CPP Holdings, |
|
||||||
|
6.90% (3 mo. SOFR US + 3.13%), 11/28/2029, (0.00% Floor) (c) |
840,675 |
|
840,507 |
||||
|
6.90% (3 mo. SOFR US + 3.13%) (or 4.13% PIK), 11/28/2029, (0.00% Floor) (c) |
62,421 |
|
62,408 |
||||
|
WP CPP Holdings, |
90,000 |
|
0 |
||||
|
|
5,287,243 |
||||||
|
Biotechnology – 0.4% |
|
||||||
|
ADC Therapeutics, Inc., |
1,135,543 |
|
1,121,803 |
||||
____________
See Notes to Consolidated Financial Statements.
|
2025 Annual Report |
29 |
|
OAKTREE DIVERSIFIED INCOME FUND INC. December 31, 2025 |
|
|
Par |
Value |
|||||
|
PRIVATE CREDIT (continued) |
|
||||||
|
Building Products – 0.6% |
|
||||||
|
Geotechnical Merger Sub, |
1,682,000 |
$ |
1,671,067 |
||||
|
Geotechnical Merger Sub, Delay Draw Term Loan, |
623,000 |
|
303,286 |
||||
|
Geotechnical Merger Sub, Revolver, |
234,000 |
|
54,245 |
||||
|
|
2,028,598 |
||||||
|
Commercial Services & Supplies – 0.9% |
|
||||||
|
Kings Buyer LLC, |
472,406 |
|
163,672 |
||||
|
NFM & J LP, |
485,526 |
|
482,418 |
||||
|
NFM & J LP, |
|
||||||
|
10.94% (1 mo. SOFR US + 5.75%), 11/30/2027, (1.00% Floor) (b)(c) |
11,665 |
|
4,058 |
||||
|
11.50% (Prime Rate + 4.75%), 11/30/2027, (1.00% Floor) (b)(c) |
98,698 |
|
34,330 |
||||
|
NFM & J LP, |
30,446 |
|
30,252 |
||||
|
USIC Holdings, |
1,419,660 |
|
1,419,944 |
||||
|
USIC Holdings, |
526,337 |
|
529,706 |
||||
|
USIC Holdings, |
84,662 |
|
48,437 |
||||
|
USIC Holdings, Senior Secured First Lien Revolver |
|
||||||
|
8.97% (3 mo. SOFR US + 5.25%), 09/10/2031, (0.00% Floor) (b)(c) |
55,488 |
|
26,000 |
||||
|
9.04% (3 mo. SOFR US + 5.25%), 09/10/2031, (0.00% Floor) (b)(c) |
44,390 |
|
20,800 |
||||
|
9.07% (3 mo. SOFR US + 5.25%), 09/10/2031, (0.00% Floor) (b)(c) |
82,122 |
|
38,480 |
||||
|
|
2,798,097 |
||||||
|
Communications Equipment – 0.5% |
|
||||||
|
Sorenson Communications, |
1,615,844 |
|
1,591,444 |
||||
|
Sorenson Communications, |
198,000 |
|
0 |
||||
|
|
1,591,444 |
||||||
|
Consumer Finance – 0.6% |
|
||||||
|
CPS Mezzanine, Tranche B Revolver, 10.73%, 07/15/2027 (b)(c) |
3,750,000 |
|
2,017,618 |
||||
|
Consumer Staples Distribution & Retail – 0.6% |
|
||||||
|
Blazing Star Parent, |
1,856,325 |
|
1,815,300 |
||||
____________
See Notes to Consolidated Financial Statements.
|
30 |
|
|
OAKTREE DIVERSIFIED INCOME FUND INC. December 31, 2025 |
|
|
Par |
Value |
|||||
|
PRIVATE CREDIT (continued) |
|
||||||
|
Containers & Packaging – 0.5% |
|
||||||
|
ASP-r-pac Acquisition Company LLC, |
344,940 |
$ |
340,594 |
||||
|
ASP-r-pac Acquisition Company LLC, |
205,745 |
|
158,443 |
||||
|
Charter Next Generation, Inc., |
971,873 |
|
975,105 |
||||
|
|
1,474,142 |
||||||
|
Diversified Consumer Services – 1.6% |
|
||||||
|
AVSC Holding, |
3,822,118 |
|
3,753,702 |
||||
|
AVSC Holding, |
412,000 |
|
0 |
||||
|
Legends Hospitality Holding Co., |
1,323,744 |
|
1,300,976 |
||||
|
Legends Hospitality Holding Co., |
|
||||||
|
8.72% (1 mo. SOFR US + 5.00%), 08/22/2031, (0.00% Floor) (b)(c) |
19,202 |
|
15,653 |
||||
|
8.73% (1 mo. SOFR US + 5.00%), 08/22/2031, (0.00% Floor) (b)(c) |
56,549 |
|
46,098 |
||||
|
Legends Hospitality Holding Co., |
|
||||||
|
0.00% (Fixed Rate), 08/22/2030, (0.00% Floor) (b)(c) |
1,518 |
|
486 |
||||
|
8.72% (1 mo. SOFR US + 5.00%), 08/22/2030, (0.00% Floor) (b)(c) |
46,302 |
|
14,819 |
||||
|
8.73% (1 mo. SOFR US + 5.00%), 08/22/2030, (0.00% Floor) (b)(c) |
104,180 |
|
33,344 |
||||
|
|
5,165,078 |
||||||
|
Electrical Equipment – 0.3% |
|
||||||
|
Inventus Power, Inc. |
|
||||||
|
0.00%, 01/15/2026 (b)(c)(g) |
94,000 |
|
0 |
||||
|
11.53%, 01/15/2026 (c) |
808,275 |
|
807,224 |
||||
|
|
807,224 |
||||||
|
Financial Services – 2.2% |
|
||||||
|
Hertz Vehicle Financing III, |
3,000,000 |
|
3,000,900 |
||||
|
Minotaur Acquisition, |
2,624,000 |
|
2,597,760 |
||||
|
Minotaur Acquisition, |
1,019,097 |
|
1,008,906 |
||||
|
Minotaur Acquisition, |
336,630 |
|
333,263 |
||||
|
MTC Holdings, First Lien Revolver, |
103,000 |
|
0 |
||||
|
|
6,940,829 |
||||||
____________
See Notes to Consolidated Financial Statements.
|
2025 Annual Report |
31 |
|
OAKTREE DIVERSIFIED INCOME FUND INC. December 31, 2025 |
|
|
Par |
Value |
|||||
|
PRIVATE CREDIT (continued) |
|
||||||
|
Food Products – 0.3% |
|
||||||
|
Protein For Pets Opco, |
979,090 |
$ |
959,704 |
||||
|
Protein For Pets Opco, |
103,000 |
|
20,190 |
||||
|
|
979,894 |
||||||
|
Health Care Equipment & Supplies – 2.5% |
|
||||||
|
Bayou Intermediate II, |
4,218,000 |
|
4,178,773 |
||||
|
Bayou Intermediate II, |
|
||||||
|
8.42% (3 mo. SOFR US + 4.75%), 09/30/2032, (0.75% Floor) (b)(c) |
956,723 |
|
375,971 |
||||
|
8.48% (1 mo. SOFR US + 4.75%), 09/30/2032, (0.75% Floor) (b)(c) |
193,277 |
|
75,954 |
||||
|
Bayou Intermediate II, |
614,000 |
|
0 |
||||
|
Spruce Bidco II, |
|
||||||
|
7.00% (TCOR (3 months) + 4.75%), 01/30/2032, (0.75% Floor) (c) |
CAD |
492,670 |
|
355,606 |
|||
|
8.45% (6 mo. SOFR US + 4.75%), 01/30/2032, (0.75% Floor) (c) |
2,710,380 |
|
2,685,173 |
||||
|
8.91% (SOFR + 5.25%), 01/30/2032, (0.75% Floor) (c) |
JPY |
52,678,643 |
|
333,176 |
|||
|
Spruce Bidco II, |
614,000 |
|
0 |
||||
|
|
8,004,653 |
||||||
|
Health Care Providers & Services – 1.5% |
|
||||||
|
ACESO HOLDING, |
EUR |
1,529,000 |
|
1,776,215 |
|||
|
ACESO HOLDING, |
EUR |
382,000 |
|
443,763 |
|||
|
LSL Holdco LLC, |
2,307,795 |
|
2,228,637 |
||||
|
LSL Holdco LLC, |
268,757 |
|
259,539 |
||||
|
LSL Holdco RC, |
266,412 |
|
154,348 |
||||
|
Petvet Care Centers LLC, |
307,000 |
|
28,496 |
||||
|
|
4,890,998 |
||||||
____________
See Notes to Consolidated Financial Statements.
|
32 |
|
|
OAKTREE DIVERSIFIED INCOME FUND INC. December 31, 2025 |
|
|
Par |
Value |
|||||
|
PRIVATE CREDIT (continued) |
|
||||||
|
Health Care Technology – 2.8% |
|
||||||
|
Establishment Labs Holdings, Inc., |
1,247,716 |
$ |
1,272,670 |
||||
|
Establishment Labs Holdings, Inc., |
199,823 |
|
203,819 |
||||
|
Establishment Labs Holdings, Inc., |
184,290 |
|
187,976 |
||||
|
Establishment Labs Holdings, Inc., |
184,289 |
|
187,975 |
||||
|
Next Holdco LLC, |
213,000 |
|
0 |
||||
|
Next Holdco LLC, |
80,000 |
|
0 |
||||
|
NextGen Healthcare, Inc., |
815,475 |
|
808,136 |
||||
|
Premium Parent, |
6,172,186 |
|
6,050,594 |
||||
|
Premium Parent, |
|
||||||
|
10.23% (1 mo. SOFR US + 6.50%), 11/25/2032, (0.00% Floor) (b)(c) |
406,319 |
|
97,366 |
||||
|
10.27% (3 mo. SOFR US + 6.50%), 11/25/2032, (0.00% Floor) (b)(c) |
338,600 |
|
81,138 |
||||
|
|
8,889,674 |
||||||
|
Hotels, Restaurants & Leisure – 2.9% |
|
||||||
|
ASP-r-pac Acquisition Company LLC, |
1,663,445 |
|
1,642,320 |
||||
|
Grove Hotel Parcel Owner LLC, |
1,696,772 |
|
1,651,807 |
||||
|
Grove Hotel Parcel Owner LLC, |
350,754 |
|
341,459 |
||||
|
Grove Hotel Parcel Owner LLC, |
175,377 |
|
85,365 |
||||
|
Intralot Capital Lux, |
GBP |
4,057,000 |
|
5,367,990 |
|||
|
|
9,088,941 |
||||||
____________
See Notes to Consolidated Financial Statements.
|
2025 Annual Report |
33 |
|
OAKTREE DIVERSIFIED INCOME FUND INC. December 31, 2025 |
|
|
Par |
Value |
|||||
|
PRIVATE CREDIT (continued) |
|
||||||
|
Insurance – 1.1% |
|
||||||
|
Integrity Marketing Acquisition LLC, |
|
||||||
|
8.82% (3 mo. SOFR US + 5.00%), 08/25/2028, (0.75% Floor) (c) |
2,488,973 |
$ |
2,485,986 |
||||
|
8.88% (3 mo. SOFR US + 5.00%), 08/25/2028, (0.75% Floor) (c) |
315 |
|
315 |
||||
|
Integrity Marketing Acquisition LLC, |
519,866 |
|
0 |
||||
|
Integrity Marketing Acquisition LLC, |
234,995 |
|
0 |
||||
|
THG Acquisition, |
1,061,975 |
|
1,052,630 |
||||
|
THG Acquisition, |
|
||||||
|
8.51% (1 mo. SOFR US + 4.75%), 10/31/2031, (0.75% Floor) (b)(c) |
56,289 |
|
16,204 |
||||
|
8.67% (1 mo. SOFR US + 4.75%), 10/31/2031, (0.75% Floor) (b)(c) |
182,421 |
|
52,513 |
||||
|
THG Acquisition, |
|
||||||
|
8.47% (1 mo. SOFR US + 4.75%), 10/31/2031, (0.75% Floor) (b)(c) |
102,786 |
|
13,390 |
||||
|
8.47% (1 mo. SOFR US + 4.75%), 10/31/2031, (0.75% Floor) (b)(c) |
15,418 |
|
2,008 |
||||
|
9.07% (Fixed Rate), 10/31/2031, (0.75% Floor) (b)(c) |
797 |
|
104 |
||||
|
|
3,623,150 |
||||||
|
Life Sciences Tools & Services – 1.5% |
|
||||||
|
Creek Parent, |
3,262,348 |
|
3,210,150 |
||||
|
Creek Parent, |
471,000 |
|
0 |
||||
|
Europa Biosite, |
SEK |
7,540,000 |
|
803,754 |
|||
|
Europa Biosite, |
GBP |
584,527 |
|
773,334 |
|||
|
Europa Biosite, |
SEK |
9,158,000 |
|
0 |
|||
|
|
4,787,238 |
||||||
|
Machinery – 0.7% |
|
||||||
|
ProFrac Holdings II LLC, |
1,045,000 |
|
1,030,684 |
||||
|
Truck-Lite Company, |
1,024,540 |
|
1,014,499 |
||||
|
Truck-Lite Company, |
37,745 |
|
21,779 |
||||
|
Truck-Lite Company, |
105,000 |
|
0 |
||||
|
|
2,066,962 |
||||||
____________
See Notes to Consolidated Financial Statements.
|
34 |
|
|
OAKTREE DIVERSIFIED INCOME FUND INC. December 31, 2025 |
|
|
Par |
Value |
|||||
|
PRIVATE CREDIT (continued) |
|
||||||
|
Personal Care Products – 0.6% |
|
||||||
|
Suave Brands, |
1,693,000 |
$ |
1,676,239 |
||||
|
Suave Brands, |
113,000 |
|
111,882 |
||||
|
|
1,788,121 |
||||||
|
Pharmaceuticals – 0.4% |
|
||||||
|
Bioxcel Therapeutics, Inc., |
992,667 |
|
867,988 |
||||
|
Bioxcel Therapeutics, Inc., |
411,467 |
|
359,787 |
||||
|
Bioxcel Therapeutics, Inc., |
375,585 |
|
0 |
||||
|
Bioxcel Therapeutics, Inc., |
625,975 |
|
0 |
||||
|
|
1,227,775 |
||||||
|
Professional Services – 0.3% |
|
||||||
|
Kite Midco II, |
877,000 |
|
869,107 |
||||
|
Kite Midco II, |
216,000 |
|
0 |
||||
|
|
869,107 |
||||||
|
Real Estate Management & Development – 1.6% |
|
||||||
|
CVS Lane, |
AUD |
8,830,641 |
|
3,758,670 |
|||
|
Lightbox Intermediate, Term Loan, |
1,188,023 |
|
1,176,499 |
||||
|
Lightbox Intermediate, |
77,000 |
|
0 |
||||
|
|
4,935,169 |
||||||
|
Software – 3.0% |
|
||||||
|
CentralSquare Technologies, |
66,000 |
|
0 |
||||
|
Evergreen IX Borrower, |
|
||||||
|
8.42% (3 mo. SOFR US + 4.75%), 09/29/2030, (0.75% Floor) (c) |
1,124,060 |
|
1,124,060 |
||||
|
8.42% (3 mo. SOFR US + 4.75%), 09/29/2030, (0.00% Floor) (c) |
283,912 |
|
283,912 |
||||
____________
See Notes to Consolidated Financial Statements.
|
2025 Annual Report |
35 |
|
OAKTREE DIVERSIFIED INCOME FUND INC. December 31, 2025 |
|
|
Par |
Value |
|||||
|
PRIVATE CREDIT (continued) |
|
||||||
|
Evergreen IX Borrower, |
127,000 |
$ |
0 |
||||
|
Finastra USA, Inc., |
399,760 |
|
399,760 |
||||
|
ICIMS, Inc., |
1,779,695 |
|
1,735,737 |
||||
|
ICIMS, Inc., |
|
||||||
|
5.75% (3 mo. SOFR US + 5.75%), 08/15/2028, (1.00% Floor) (b)(c) |
14,125 |
|
4,546 |
||||
|
9.59% (3 mo. SOFR US + 5.75%), 08/15/2028, (1.00% Floor) (b)(c) |
121,695 |
|
39,168 |
||||
|
9.61% (3 mo. SOFR US + 5.75%), 08/15/2028, (1.00% Floor) (b)(c) |
21,731 |
|
6,994 |
||||
|
Icon Parent, Inc., |
150,000 |
|
150,680 |
||||
|
Monotype Imaging Holdings, |
116,636 |
|
29,933 |
||||
|
Monotype Imaging Holdings, |
176,000 |
|
0 |
||||
|
Monotype Imaging Holdings, |
1,387,865 |
|
1,387,587 |
||||
|
MRI Software LLC, |
218,949 |
|
217,657 |
||||
|
Optimizely North America, |
|
||||||
|
7.13% (1 mo. EURIBOR + 5.25%), 10/30/2031, (0.00% Floor) (c) |
EUR |
551,230 |
|
634,849 |
|||
|
8.72% (1 mo. SOFR US + 5.00%), 10/30/2031, (0.00% Floor) (c) |
1,540,360 |
|
1,509,553 |
||||
|
9.22% (SONIA + 5.50%), 10/30/2031, (0.00% Floor) (c) |
GBP |
184,075 |
|
243,161 |
|||
|
Optimizely North America, |
231,000 |
|
0 |
||||
|
Pluralsight Inc, |
|
||||||
|
11.83% (3 mo. SOFR US + 7.50%), 08/22/2029, (0.00% Floor) (c) |
125,373 |
|
98,794 |
||||
|
11.83%(3 mo. SOFR US) (or 12.01% PIK), 08/22/2029, (0.00% Floor) (c) |
20,577 |
|
16,214 |
||||
|
Pluralsight Inc, |
|
||||||
|
6.82% (3 mo. SOFR US + 3.00%), 08/22/2029, (0.00% Floor) (c) |
83,164 |
|
83,164 |
||||
|
6.82% (3 mo. SOFR US + 3.00%) (or 1.50% PIK), 08/22/2029, (0.00% Floor) (c) |
1,625 |
|
1,625 |
||||
|
Pluralsight Inc, |
60,308 |
|
0 |
||||
____________
See Notes to Consolidated Financial Statements.
|
36 |
|
|
OAKTREE DIVERSIFIED INCOME FUND INC. December 31, 2025 |
|
|
Par |
Value |
|||||
|
PRIVATE CREDIT (continued) |
|
||||||
|
Pluralsight Inc, |
24,123 |
$ |
0 |
||||
|
Pluralsight Restructure, |
|
||||||
|
6.82% (3 mo. SOFR US + 3.00%), 08/22/2031, (0.00% Floor) (c) |
48,005 |
|
48,005 |
||||
|
6.82% (3 mo. SOFR US + 3.00%) (or 1.50% PIK), 08/22/2031, (0.00% Floor) (c) |
938 |
|
938 |
||||
|
User Zoom Technologies 2nd Amendment, |
1,348,000 |
|
1,321,714 |
||||
|
|
9,338,051 |
||||||
|
Total Senior Loans |
|
|
|
91,537,109 |
|||
|
Senior Loans (Syndicated) – 2.6% (a) |
|
||||||
|
Commercial Services & Supplies – 0.7% |
|
||||||
|
Kings Buyer LLC, |
2,190,071 |
|
2,070,055 |
||||
|
Health Care Providers & Services – 0.7% |
|
||||||
|
Petvet Care Centers LLC, |
2,308,880 |
|
2,118,167 |
||||
|
Interactive Media & Services – 0.5% |
|
||||||
|
Ancestry.com, Inc., |
1,608,353 |
|
1,608,352 |
||||
|
Software – 0.7% |
|
||||||
|
CentralSquare Technologies, |
|
||||||
|
9.67% (1 mo. SOFR US + 5.75%), 04/12/2031, (0.00% Floor) (c) |
571,762 |
|
571,076 |
||||
|
9.67% (1 mo. SOFR US + 5.75%) (or 3.50% PIK), 04/12/2031, (0.00% Floor) (c) |
31,545 |
|
31,507 |
||||
|
ICIMS, Inc., |
253,659 |
|
250,615 |
||||
|
MRI Software LLC, |
1,402,128 |
|
1,393,856 |
||||
|
MRI Software LLC, |
166,000 |
|
33,004 |
||||
|
|
2,280,058 |
||||||
|
Total Senior Loans (Syndicated) |
|
|
|
8,076,632 |
|||
____________
See Notes to Consolidated Financial Statements.
|
2025 Annual Report |
37 |
|
OAKTREE DIVERSIFIED INCOME FUND INC. December 31, 2025 |
|
|
Shares |
Value |
|||||
|
PRIVATE CREDIT (continued) |
|
||||||
|
Preferred Stock – 1.0% |
|
||||||
|
Health Care Providers & Services – 0.1% |
|
||||||
|
Petvet, Inc., |
203 |
$ |
231,526 |
||||
|
Health Care Technology – 0.9% |
|
||||||
|
athenahealth, Inc., |
2,033 |
|
3,014,329 |
||||
|
Total Preferred Stock |
|
3,245,855 |
|||||
|
Private Placement Equity – 0.7% |
|
||||||
|
Distributors – 0.1% |
|
||||||
|
RelaDyne |
2,000 |
|
286,940 |
||||
|
Ground Transportation – 0.1% |
|
||||||
|
OUTGO, INC. (c)(i) |
288,620 |
|
288,620 |
||||
|
Health Care Technology – 0.5% |
|
||||||
|
Ipi Legacy Liquidation Co. (c)(i) |
754,923 |
|
1,592,888 |
||||
|
Software – 0.0% (e) |
|
||||||
|
Pluralsight Inc (c)(i) |
41,791 |
|
0 |
||||
|
Total Private Placement Equity |
|
|
|
2,168,448 |
|||
|
Warrants – 0.0% (e) |
|
||||||
|
Biotechnology – 0.0% (e) |
|
||||||
|
ADC Therapeutics – (Exercise price: $8.30, Expiration: 08/15/2032), |
4,988 |
|
5,686 |
||||
|
Mesoblast, Inc. – (Exercise Price: $7.26, Expiration: 11/19/2026), |
23,222 |
|
169,521 |
||||
|
Seres Therapeutics, Inc. – (Exercise price: $6.69, Expiration: 04/27/2030), |
237 |
|
1,358 |
||||
|
|
176,565 |
||||||
|
Pharmaceuticals – 0.0% (e) |
|
||||||
|
Bioxcel Therapeutics, Inc. – (Exercise price: $3.07, Expiration: 04/19/2029), |
78 |
|
73 |
||||
|
Bioxcel Therapeutics, Inc. – (Exercise price: $3.65, Expiration: 04/19/2029), |
274 |
|
258 |
||||
|
|
331 |
||||||
|
Total Warrants |
|
|
|
176,896 |
|||
|
Common Stock – 0.0% (e) |
|
||||||
|
Containers & Packaging – 0.0% (e) |
|
||||||
|
Ardagh Holdings USA Inc. (i) |
EUR |
10,329 |
|
90,530 |
|||
|
Pharmaceuticals – 0.0% (e) |
|
||||||
|
Bioxcel Therapeutics, Inc. (i) |
3,557 |
|
5,691 |
||||
|
Real Estate Management & Development – 0.0% (e) |
|
||||||
|
Country Garden Holdings Co. Ltd. (i) |
HKD |
2,400 |
|
128 |
|||
|
Total Common Stock |
|
|
|
96,349 |
|||
|
TOTAL PRIVATE CREDIT |
|
|
|
105,301,289 |
|||
____________
See Notes to Consolidated Financial Statements.
|
38 |
|
|
OAKTREE DIVERSIFIED INCOME FUND INC. December 31, 2025 |
|
|
Par |
Value |
|||||
|
STRUCTURED CREDIT – 30.3% |
|
||||||
|
Collateralized Loan Obligations – 14.2% |
|
||||||
|
Adagio CLO, |
EUR |
1,000,000 |
$ |
1,155,715 |
|||
|
Anchorage Capital CLO Ltd., |
2,000,000 |
|
1,959,622 |
||||
|
Anchorage Credit Funding Ltd. |
|
||||||
|
Series 2019-7A, Class SUB1, |
1,000,000 |
|
586,000 |
||||
|
Series 2020-12A, Class D, |
750,000 |
|
749,287 |
||||
|
Ares European CLO, |
EUR |
1,000,000 |
|
1,164,162 |
|||
|
Birch Grove CLO, |
1,000,000 |
|
968,443 |
||||
|
Carlyle Global Market Strategies, |
1,000,000 |
|
1,022,720 |
||||
|
CBAM Ltd., |
1,300,000 |
|
1,308,984 |
||||
|
Dryden CLO, |
EUR |
500,000 |
|
576,778 |
|||
|
Elmwood CLO Ltd., |
1,750,000 |
|
1,750,042 |
||||
|
Fortress Credit BSL Ltd. |
|
||||||
|
Series 2022-1A, Class E, |
500,000 |
|
498,878 |
||||
|
Series 2022-2A, Class DR, |
1,000,000 |
|
991,737 |
||||
|
Gallatin CLO Ltd., |
1,000,000 |
|
1,012,746 |
||||
|
Generate CLO Ltd., |
1,200,000 |
|
1,162,362 |
||||
|
Halsey Point CLO Ltd., |
1,000,000 |
|
1,013,244 |
||||
|
Harvest CLO, |
EUR |
500,000 |
|
586,355 |
|||
|
ICG US CLO Ltd. |
|
||||||
|
Series 2020-1A, Class DR, |
1,000,000 |
|
988,104 |
||||
|
Series 2020-1A, Class ER, |
1,000,000 |
|
964,453 |
||||
____________
See Notes to Consolidated Financial Statements.
|
2025 Annual Report |
39 |
|
OAKTREE DIVERSIFIED INCOME FUND INC. December 31, 2025 |
|
|
Par |
Value |
|||||
|
STRUCTURED CREDIT (continued) |
|
||||||
|
Marble Point CLO Ltd., |
1,750,000 |
$ |
1,737,766 |
||||
|
Monroe Capital MML CLO Ltd., |
1,000,000 |
|
952,556 |
||||
|
Mountain View CLO Ltd. |
|
||||||
|
Series 2019-2A, Class DR, |
1,000,000 |
|
1,007,023 |
||||
|
Series 2024-1A, Class E, |
1,000,000 |
|
1,017,703 |
||||
|
Neuberger Berman CLO Ltd., |
2,000,000 |
|
1,989,296 |
||||
|
Oak Hill European Credit Partners |
|
||||||
|
Series 2016-5A, Class ER, |
EUR |
1,750,000 |
|
2,076,927 |
|||
|
Series 2016-5A, Class FR, |
EUR |
1,000,000 |
|
1,182,082 |
|||
|
Octagon Investment Partners Ltd. |
|
||||||
|
Series 2016-1A, Class ERR, |
1,000,000 |
|
969,776 |
||||
|
Series 2017-1A, Class ER3, |
1,000,000 |
|
1,022,071 |
||||
|
Palmer Square European CLO |
|
||||||
|
Series 2022-1A, Class E, |
EUR |
1,200,000 |
|
1,414,097 |
|||
|
Series 2022-1A, Class F, |
EUR |
1,250,000 |
|
1,474,124 |
|||
|
Penta CLO, |
EUR |
500,000 |
|
592,171 |
|||
|
Rockford Tower CLO Ltd., |
EUR |
500,000 |
|
590,216 |
|||
|
RR Ltd., |
1,000,000 |
|
994,856 |
||||
|
Symphony CLO Ltd., |
438,000 |
|
373,360 |
||||
|
TCW CLO Ltd. |
|
||||||
|
Series 2019-2A, Class ER2, |
1,250,000 |
|
1,223,780 |
||||
|
Series 2021-1A, Class ER1, |
1,000,000 |
|
989,598 |
||||
|
Toro European CLO, |
EUR |
1,500,000 |
|
1,701,246 |
|||
|
Trimaran Cavu Ltd., |
900,000 |
|
897,344 |
||||
____________
See Notes to Consolidated Financial Statements.
|
40 |
|
|
OAKTREE DIVERSIFIED INCOME FUND INC. December 31, 2025 |
|
|
Par |
Value |
|||||
|
STRUCTURED CREDIT (continued) |
|
||||||
|
Trinitas CLO Ltd. |
|
||||||
|
Series 2021-18A, Class D, |
2,000,000 |
$ |
1,969,374 |
||||
|
Series 2022-21A, Class ER, |
1,000,000 |
|
987,208 |
||||
|
Wind River CLO Ltd., |
1,000,000 |
|
1,005,214 |
||||
|
Total Collateralized Loan Obligations |
|
|
|
44,627,420 |
|||
|
Asset-Backed Securities – 7.5% |
|
||||||
|
Financials – 7.5% |
|
||||||
|
Adams Outdoor Advertising LP, |
2,000,000 |
|
2,072,949 |
||||
|
Castlelake Aircraft Securitization Trust, |
16,505 |
|
16,504 |
||||
|
CPS Auto Trust, |
1,000,000 |
|
1,024,724 |
||||
|
GAIA Aviation Ltd., |
2,265,373 |
|
1,978,351 |
||||
|
Helios Issuer LLC, |
919,548 |
|
836,035 |
||||
|
Hertz Corp. |
|
||||||
|
Series 2023-4A, Class D, |
1,000,000 |
|
1,050,505 |
||||
|
Series 2024-2A, Class D, |
1,000,000 |
|
1,037,859 |
||||
|
Horizon Aircraft Finance Ltd. |
|
||||||
|
Series 2018-1, Class A, |
319,814 |
|
317,607 |
||||
|
Series 2019-2, Class A, |
934,394 |
|
901,503 |
||||
|
Lunar Aircraft Ltd., |
41,764 |
|
41,376 |
||||
|
METAL Ltd. |
|
||||||
|
Series 2017-1, Class A, |
1,207,862 |
|
863,742 |
||||
|
Series 2017-1, Class B, |
284,797 |
|
79,772 |
||||
|
Mosaic Solar Loan Trust, |
1,500,000 |
|
1,126,094 |
||||
|
Pioneer Aircraft Finance Ltd., |
364,518 |
|
359,669 |
||||
____________
See Notes to Consolidated Financial Statements.
|
2025 Annual Report |
41 |
|
OAKTREE DIVERSIFIED INCOME FUND INC. December 31, 2025 |
|
|
Par |
Value |
|||||
|
STRUCTURED CREDIT (continued) |
|
||||||
|
PMCIT |
|
||||||
|
Series 2024-1, 10.05%, |
513,000 |
$ |
511,204 |
||||
|
Series 2024-1, 14.64%, |
685,000 |
|
686,507 |
||||
|
Series 2024-1, 7.15%, |
491,000 |
|
492,277 |
||||
|
Sunnova Energy International, Inc., |
903,029 |
|
857,313 |
||||
|
Thunderbolt Aircraft Lease, |
159,202 |
|
157,897 |
||||
|
Uniti Group LP, |
2,000,000 |
|
2,096,340 |
||||
|
VistaJet Pass Through Trust, |
675,000 |
|
658,969 |
||||
|
VSTJET, |
1,462,641 |
|
1,462,641 |
||||
|
WAVE USA, |
2,708,264 |
|
2,336,690 |
||||
|
Zayo Group LLC, |
2,500,000 |
|
2,606,900 |
||||
|
Total Asset-Backed Securities |
|
|
|
23,573,428 |
|||
|
Commercial Mortgage-Backed Securities – 4.5% |
|
||||||
|
Arbor Realty Collateralized Loan Obligation Ltd., |
905,000 |
|
917,363 |
||||
|
AREIT Trust, |
109,000 |
|
108,540 |
||||
|
Banc of America Commercial Mortgage Trust, |
10,000,000 |
|
1,090 |
||||
|
BBCMS Mortgage Trust, |
877,000 |
|
824,161 |
||||
|
Benchmark Mortgage Trust, |
36,000 |
|
32,988 |
||||
|
BSPRT, |
278,000 |
|
273,942 |
||||
|
BX Trust |
|
||||||
|
Series 2019-IMC, Class G, |
1,131,000 |
|
1,096,711 |
||||
|
Series 2025-OMG, Class F, |
251,000 |
|
251,006 |
||||
____________
See Notes to Consolidated Financial Statements.
|
42 |
|
|
OAKTREE DIVERSIFIED INCOME FUND INC. December 31, 2025 |
|
|
Par |
Value |
|||||
|
STRUCTURED CREDIT (continued) |
|
||||||
|
Caister Finance DAC |
|
||||||
|
Series 1A, Class D, |
GBP |
481,000 |
$ |
649,172 |
|||
|
Series 1A, Class E, |
GBP |
993,000 |
|
1,337,171 |
|||
|
CD Mortgage Trust, |
489,000 |
|
455,442 |
||||
|
COMM Mortgage Trust, |
11,810,741 |
|
24,157 |
||||
|
CSAIL Commercial Mortgage Trust, |
190,000 |
|
140,409 |
||||
|
DBGS Mortgage Trust, |
1,000,000 |
|
856,639 |
||||
|
Extended Stay America Trust |
|
||||||
|
Series 2025-ESH, Class E, |
195,000 |
|
196,310 |
||||
|
Series 2025-ESH, Class F, |
145,000 |
|
146,327 |
||||
|
FS RIALTO, |
187,000 |
|
186,913 |
||||
|
HAVN Trust, |
651,000 |
|
651,207 |
||||
|
Hilton USA Trust |
|
||||||
|
Series 2016-SFP, Class C, |
105,000 |
|
34,094 |
||||
|
Series 2016-SFP, Class D, |
584,000 |
|
584 |
||||
|
Life Mortgage Trust, |
89,600 |
|
87,437 |
||||
|
MF1 LLC, |
232,000 |
|
232,413 |
||||
|
Natixis Commercial Mortgage Securities Trust, |
493,500 |
|
493,570 |
||||
|
ONE Mortgage Trust, |
645,000 |
|
641,909 |
||||
|
PRM Trust, |
222,000 |
|
223,181 |
||||
|
Stellar Management, |
824,000 |
|
847,982 |
||||
____________
See Notes to Consolidated Financial Statements.
|
2025 Annual Report |
43 |
|
OAKTREE DIVERSIFIED INCOME FUND INC. December 31, 2025 |
|
|
Par |
Value |
|||||
|
STRUCTURED CREDIT (continued) |
|
||||||
|
UK Logistics |
|
||||||
|
Series 2024-1A, Class D, |
GBP |
62,209 |
$ |
83,951 |
|||
|
Series 2024-1A, Class E, |
GBP |
121,978 |
|
164,708 |
|||
|
Series 2025-1A, Class E, |
GBP |
265,615 |
|
358,982 |
|||
|
Series 2025-2A, Class E, |
GBP |
322,000 |
|
434,527 |
|||
|
VMC Finance LLC |
|
||||||
|
Series 2021-FL4, Class C, |
901,000 |
|
880,277 |
||||
|
Series 2021-FL4, Class D, |
147,000 |
|
141,337 |
||||
|
Wells Fargo Commercial Mortgage Trust, |
874,000 |
|
650,943 |
||||
|
WHARF Trust, |
867,000 |
|
902,047 |
||||
|
Total Commercial Mortgage-Backed Securities |
|
|
|
14,327,490 |
|||
|
Residential Mortgage-Backed Securities – 3.3% |
|
||||||
|
ACRA Trust |
|
||||||
|
Series 2024-NQM1, Class B1, |
110,000 |
|
112,631 |
||||
|
Series 2024-NQM1, Class M1B, |
200,000 |
|
202,591 |
||||
|
Adamas Trust, Inc., |
145,000 |
|
146,430 |
||||
|
Angel Oak Mortgage Trust LLC, |
125,000 |
|
127,145 |
||||
|
Bellemeade Re Ltd., |
161,000 |
|
165,965 |
||||
|
BRAVO Residential Funding Trust, |
128,000 |
|
131,195 |
||||
|
CFST Mortgage Trust, |
300,000 |
|
302,604 |
||||
|
CHNGE Mortgage Trust, |
891,000 |
|
895,077 |
||||
|
COLT Funding LLC, |
363,000 |
|
376,177 |
||||
|
Credit Suisse Mortgage Capital Certificates, |
159,000 |
|
136,810 |
||||
____________
See Notes to Consolidated Financial Statements.
|
44 |
|
|
OAKTREE DIVERSIFIED INCOME FUND INC. December 31, 2025 |
|
|
Par |
Value |
|||||
|
STRUCTURED CREDIT (continued) |
|
||||||
|
Deephaven Residential Mortgage Trust, |
229,000 |
$ |
187,774 |
||||
|
EASY Trust, |
741,000 |
|
753,160 |
||||
|
Freddie Mac Seasoned Credit Risk Transfer Trust, |
560,937 |
|
535,981 |
||||
|
GCAT, |
279,000 |
|
278,319 |
||||
|
GCAT Trust, |
476,000 |
|
374,083 |
||||
|
Imperial Fund Mortgage Trust, |
332,000 |
|
284,724 |
||||
|
JP Morgan Mortgage Trust |
|
||||||
|
Series 2022-DSC1, Class B2, |
433,000 |
|
363,691 |
||||
|
Series 2023-DSC1, Class B1, |
292,000 |
|
256,055 |
||||
|
Series 2023-DSC1, Class B2, |
280,000 |
|
225,235 |
||||
|
Series 2024-CES1, Class B1, |
100,000 |
|
100,336 |
||||
|
Series 2025-CES5, Class B1, |
195,000 |
|
195,813 |
||||
|
Knock Issuer Trust, |
224,000 |
|
226,874 |
||||
|
Mello Mortgage Capital Acceptance, |
208,135 |
|
167,411 |
||||
|
MFA Trust, |
251,000 |
|
209,647 |
||||
|
New Residential Mortgage Loan Trust, |
160,000 |
|
161,850 |
||||
|
PRKCM Trust |
|
||||||
|
Series 2021-AFC1, Class B1, |
278,000 |
|
211,710 |
||||
|
Series 2022-AFC2, Class B1, |
204,000 |
|
202,963 |
||||
|
Series 2023-AFC2, Class B1, |
100,000 |
|
100,136 |
||||
|
Series 2023-AFC4, Class B1, |
293,000 |
|
295,233 |
||||
|
Series 2024-AFC1, Class B1, |
176,000 |
|
178,548 |
||||
____________
See Notes to Consolidated Financial Statements.
|
2025 Annual Report |
45 |
|
OAKTREE DIVERSIFIED INCOME FUND INC. December 31, 2025 |
|
|
Par |
Value |
|||||
|
STRUCTURED CREDIT (continued) |
|
||||||
|
RCKT Mortgage Trust |
|
||||||
|
Series 2024-CES1, Class M2, |
100,000 |
$ |
101,005 |
||||
|
Series 2024-CES2, Class M2, |
100,000 |
|
101,387 |
||||
|
Series 2024-CES6, Class B2, |
140,000 |
|
141,112 |
||||
|
RCO Mortgage LLC, |
277,000 |
|
277,635 |
||||
|
Seasoned Credit Risk Transfer Trust, |
226,000 |
|
202,068 |
||||
|
Starwood Mortgage Residential Trust |
|
||||||
|
Series 2021-3, Class B1, |
210,000 |
|
171,981 |
||||
|
Series 2022-SFR3, Class F, |
80,769 |
|
81,010 |
||||
|
Toorak Mortgage Trust, |
71,000 |
|
71,336 |
||||
|
TVC Mortgage Trust, |
295,000 |
|
296,982 |
||||
|
Verus Securitization Trust, |
100,000 |
|
99,631 |
||||
|
Western Alliance Bancorp, |
718,869 |
|
784,016 |
||||
|
Total Residential Mortgage-Backed Securities |
|
|
|
10,234,331 |
|||
|
High Yield – 0.8% (a) |
|
||||||
|
Financial Services – 0.6% |
|
||||||
|
Mexico Remittances Funding Fiduciary Estate Management Sarl, |
1,850,000 |
|
1,910,125 |
||||
|
Household Durables – 0.2% |
|
||||||
|
Adams Homes, Inc., |
572,000 |
|
598,731 |
||||
|
Total High Yield |
|
|
|
2,508,856 |
|||
|
TOTAL STRUCTURED CREDIT |
|
|
|
95,271,525 |
|||
|
EMERGING MARKETS – 3.4% |
|
||||||
|
Building Products – 0.1% (a) |
|
||||||
|
Limak Cimento Sanayi ve Ticaret AS, |
250,000 |
|
253,042 |
||||
|
Chemicals – 0.3% (a) |
|
||||||
|
Braskem Netherlands Finance BV |
|
||||||
|
4.50%, 01/31/2030 |
47,400 |
|
18,562 |
||||
|
7.25%, 02/13/2033 |
987,300 |
|
383,205 |
||||
____________
See Notes to Consolidated Financial Statements.
|
46 |
|
|
OAKTREE DIVERSIFIED INCOME FUND INC. December 31, 2025 |
|
|
Par |
Value |
|||||
|
EMERGING MARKETS (continued) |
|
||||||
|
8.00%, 10/15/2034 |
826,600 |
$ |
320,837 |
||||
|
8.50% to 01/23/2026 then 5 yr. CMT Rate + 8.22%, 01/23/2081 |
472,000 |
|
82,600 |
||||
|
|
805,204 |
||||||
|
Diversified Telecommunication Services – 0.2% (a) |
|
||||||
|
Telecom Argentina, Term Loan, |
473,524 |
|
473,524 |
||||
|
Telecom Argentina SA, |
260,000 |
|
272,054 |
||||
|
|
745,578 |
||||||
|
Food Products – 0.3% (a) |
|
||||||
|
Grupo Nutresa SA, |
907,000 |
|
1,025,551 |
||||
|
Metals & Mining – 1.2% (a) |
|
||||||
|
CSN Resources SA |
|
||||||
|
8.88%, 12/05/2030 |
731,000 |
|
679,680 |
||||
|
5.88%, 04/08/2032 |
335,000 |
|
264,223 |
||||
|
Samarco Mineracao SA, |
1,109,111 |
|
1,124,794 |
||||
|
Vedanta Resources Finance II PLC, |
1,489,000 |
|
1,572,302 |
||||
|
|
3,640,999 |
||||||
|
Oil, Gas & Consumable Fuels – 1.2% (a) |
|
||||||
|
Azule Energy Finance PLC, |
1,727,000 |
|
1,730,972 |
||||
|
Ecopetrol SA, |
1,178,000 |
|
1,213,094 |
||||
|
Petroleos Mexicanos, |
1,133,000 |
|
932,310 |
||||
|
|
3,876,376 |
||||||
|
Real Estate Management & Development – 0.1% (a) |
|
||||||
|
CIFI Holdings Group Co. Ltd. |
|
||||||
|
0.00%, 06/30/2029 (g) |
723,465 |
|
52,451 |
||||
|
2.75% (or 2.75% PIK), 12/30/2029 |
361,732 |
|
28,939 |
||||
|
RKPF Overseas Ltd. |
|
||||||
|
5.90%, 09/05/2028 (m) |
441,811 |
|
87,062 |
||||
|
6.00%, 03/04/2029 (m) |
441,488 |
|
86,920 |
||||
|
Shimao Group Holdings Ltd. |
|
||||||
|
5.00% (or 6.00% PIK), 07/21/2031 (d) |
1,365,829 |
|
48,487 |
||||
|
2.00% (or 3.00% PIK), 07/21/2032 (d) |
249,481 |
|
8,108 |
||||
|
2.00% (or 3.00% PIK), 07/21/2033 (d) |
374,224 |
|
10,291 |
||||
|
2.00% (or 3.00% PIK), 01/21/2034 (d) |
374,224 |
|
9,018 |
||||
|
|
331,276 |
||||||
|
TOTAL EMERGING MARKETS |
|
|
|
10,678,026 |
|||
____________
See Notes to Consolidated Financial Statements.
|
2025 Annual Report |
47 |
|
OAKTREE DIVERSIFIED INCOME FUND INC. December 31, 2025 |
|
Shares |
Value |
||||
|
SHORT-TERM INVESTMENTS – 4.4% |
|
||||
|
MONEY MARKET FUNDS – 3.5% |
|
||||
|
First American Government Obligations Fund – Class X, 3.67% (n) |
10,903,519 |
$ |
10,903,519 |
||
|
|
Par |
|
||||
|
U.S. TREASURY BILLS – 0.9% |
|
|
||||
|
3.23%, 01/22/2026 (o) |
3,000,000 |
|
2,994,086 |
|
||
|
TOTAL SHORT-TERM INVESTMENTS |
|
13,897,605 |
|
|||
|
TOTAL INVESTMENTS – 130.3% |
|
410,226,556 |
|
|||
|
Liabilities in Excess of Other Assets – (30.3)% |
|
|
(95,288,651 |
) |
||
|
TOTAL NET ASSETS – 100.0% |
|
$ |
314,937,905 |
|
||
|
Par amount is in USD unless otherwise indicated. |
||||
|
Percentages are stated as a percent of net assets. |
||||
|
CMT |
— |
Constant Maturity Treasury |
||
|
EURIBOR |
— |
Euro Interbank Offered Rate |
||
|
LIBOR |
— |
London Interbank Offered Rate |
||
|
LLC |
— |
Limited Liability Company |
||
|
LP |
— |
Limited Partnership |
||
|
PIK |
— |
Payment in Kind |
||
|
PLC |
— |
Public Limited Company |
||
|
REIT |
— |
Real Estate Investment Trust |
||
|
SOFR |
— |
Secured Overnight Financing Rate |
||
|
SONIA |
— |
Sterling Overnight Index Average |
||
|
AUD |
— |
Australian Dollar |
||
|
CAD |
— |
Canadian Dollar |
||
|
EUR |
— |
Euro |
||
|
GBP |
— |
British Pound |
||
|
HKD |
— |
Hong Kong Dollar |
||
|
JPY |
— |
Japanese Yen |
||
|
SEK |
— |
Swedish Krona |
||
(a) To the extent that the Fund invests more heavily in a particular industries or sectors of the economy, its performance will be especially sensitive to developments that significantly affect those industries or sectors.
(b) As of December 31, 2025, the Fund had entered into the following commitments to fund various revolving and delayed draw senior secured and subordinated loans. Such commitments are subject to the satisfaction of certain conditions set forth in the documents governing these loans and there can be no assurance that such conditions will be satisfied. All values are reflected at par.
|
Company |
Investment Type |
Total revolving |
Less: |
Total |
|||||||
|
ASP-r-pac Acquisition Company LLC |
First Lien Revolver |
$ |
205,745 |
$ |
160,481 |
$ |
45,264 |
||||
|
AVSC Holding |
First Lien Revolver |
|
412,000 |
|
0 |
|
412,000 |
||||
|
Bayou Intermediate II |
First Lien Delay Draw Term Loan |
|
193,277 |
|
76,666 |
|
116,611 |
||||
|
Bayou Intermediate II |
First Lien Delay Draw Term Loan |
|
956,723 |
|
379,499 |
|
577,224 |
||||
|
Bayou Intermediate II |
First Lien Revolver |
|
614,000 |
|
0 |
|
614,000 |
||||
|
Bioxcel Therapeutics, Inc. |
First Lien Tranche C Delay Draw Term Loan |
|
375,585 |
|
0 |
|
375,585 |
||||
|
Bioxcel Therapeutics, Inc. |
Tranche D Delay Draw Term Loan |
|
625,975 |
|
0 |
|
625,975 |
||||
|
CentralSquare Technologies |
First Lien Revolver |
|
66,000 |
|
0 |
|
66,000 |
||||
|
CoreWeave Compute |
First Lien Delay Draw Term Loan |
|
593,018 |
|
81,813 |
|
511,205 |
||||
____________
See Notes to Consolidated Financial Statements.
|
48 |
|
|
OAKTREE DIVERSIFIED INCOME FUND INC. December 31, 2025 |
|
Company |
Investment Type |
Total revolving |
Less: |
Total |
|||||||
|
CoreWeave Compute |
Term Loan |
$ |
606,982 |
$ |
83,739 |
$ |
523,243 |
||||
|
CPS Mezzanine |
Tranche B Revolver |
|
3,750,000 |
|
2,019,840 |
|
1,730,160 |
||||
|
Creek Parent |
First Lien Revolver |
|
471,000 |
|
0 |
|
471,000 |
||||
|
CVS Lane |
Delay Draw Term Loan |
|
8,830,641 |
|
5,636,727 |
|
3,193,914 |
||||
|
DIOT-SIACI BidCo SAS |
First Lien Tranche DD Delay Draw Term Loan |
|
100,962 |
|
0 |
|
100,962 |
||||
|
Europa Biosite |
Tranche 3 Delay Draw Term Loan |
|
9,158,000 |
|
0 |
|
9,158,000 |
||||
|
Evergreen IX Borrower |
First Lien Revolver |
|
127,000 |
|
0 |
|
127,000 |
||||
|
Galileo Parent, Inc. |
First Lien Revolver |
|
366,928 |
|
241,124 |
|
125,804 |
||||
|
Galileo Parent, Inc. |
First Lien Revolver |
|
3,072 |
|
2,019 |
|
1,053 |
||||
|
GASL Bermuda |
Tranche B1 Revolver |
|
3,100,000 |
|
1,830,384 |
|
1,269,616 |
||||
|
Geotechnical Merger Sub |
Delay Draw Term Loan |
|
623,000 |
|
305,270 |
|
317,730 |
||||
|
Geotechnical Merger Sub |
Revolver |
|
234,000 |
|
54,600 |
|
179,400 |
||||
|
Grove Hotel Parcel Owner LLC |
Revolver |
|
175,377 |
|
87,688 |
|
87,689 |
||||
|
ICIMS, Inc. |
First Lien Revolver |
|
14,125 |
|
4,661 |
|
9,464 |
||||
|
ICIMS, Inc. |
First Lien Revolver |
|
21,731 |
|
7,171 |
|
14,560 |
||||
|
ICIMS, Inc. |
First Lien Revolver |
|
121,695 |
|
40,159 |
|
81,536 |
||||
|
Integrity Marketing Acquisition LLC |
First Lien Delay Draw Term Loan |
|
519,866 |
|
0 |
|
519,866 |
||||
|
Integrity Marketing Acquisition LLC |
First Lien Revolver |
|
234,995 |
|
0 |
|
234,995 |
||||
|
Inventus Power, Inc. |
|
94,000 |
|
0 |
|
94,000 |
|||||
|
Kings Buyer LLC |
First Lien Revolver |
|
472,406 |
|
173,216 |
|
299,190 |
||||
|
Kite Midco II |
Delay Draw Term Loan |
|
216,000 |
|
0 |
|
216,000 |
||||
|
Legends Hospitality Holding Co. |
First Lien Delay Draw Term Loan |
|
19,202 |
|
15,927 |
|
3,275 |
||||
|
Legends Hospitality Holding Co. |
First Lien Delay Draw Term Loan |
|
56,549 |
|
46,905 |
|
9,644 |
||||
|
Legends Hospitality Holding Co. |
First Lien Revolver |
|
46,302 |
|
15,048 |
|
31,254 |
||||
|
Legends Hospitality Holding Co. |
First Lien Revolver |
|
104,180 |
|
33,859 |
|
70,321 |
||||
|
Legends Hospitality Holding Co. |
First Lien Revolver |
|
1,518 |
|
493 |
|
1,025 |
||||
|
Lightbox Intermediate |
Revolver |
|
77,000 |
|
0 |
|
77,000 |
||||
|
LSL Holdco RC |
First Lien Revolver |
|
266,412 |
|
159,847 |
|
106,565 |
||||
|
MedMark Services |
First Lien Revolver |
|
19,837 |
|
19,625 |
|
212 |
||||
|
Monotype Imaging Holdings |
First Lien Delay Draw Term Loan |
|
116,636 |
|
29,939 |
|
86,697 |
||||
|
Monotype Imaging Holdings |
First Lien Revolver |
|
176,000 |
|
0 |
|
176,000 |
||||
|
MRI Software LLC |
First Lien Revolver |
|
166,000 |
|
33,200 |
|
132,800 |
||||
|
MTC Holdings |
First Lien Revolver |
|
103,000 |
|
0 |
|
103,000 |
||||
|
Next Holdco LLC |
First Lien Delay Draw Term Loan |
|
213,000 |
|
0 |
|
213,000 |
||||
|
Next Holdco LLC |
First Lien Revolver |
|
80,000 |
|
0 |
|
80,000 |
||||
|
NFM & J LP |
First Lien Revolver |
|
11,665 |
|
4,083 |
|
7,582 |
||||
|
NFM & J LP |
First Lien Revolver |
|
98,698 |
|
34,544 |
|
64,154 |
||||
|
Optimizely North America |
First Lien Revolver |
|
231,000 |
|
0 |
|
231,000 |
||||
|
Petvet Care Centers LLC |
First Lien Revolver |
|
307,000 |
|
30,700 |
|
276,300 |
||||
|
Pluralsight Inc |
First Lien Delay Draw Term Loan |
|
60,308 |
|
0 |
|
60,308 |
||||
|
Pluralsight Inc |
First Lien Revolver |
|
24,123 |
|
0 |
|
24,123 |
||||
|
Premium Parent |
First Lien Revolver |
|
406,319 |
|
99,322 |
|
306,997 |
||||
|
Premium Parent |
First Lien Revolver |
|
338,600 |
|
82,769 |
|
255,831 |
||||
|
Protein For Pets Opco |
First Lien Revolver |
|
103,000 |
|
20,600 |
|
82,400 |
||||
____________
See Notes to Consolidated Financial Statements.
|
2025 Annual Report |
49 |
|
OAKTREE DIVERSIFIED INCOME FUND INC. December 31, 2025 |
|
Company |
Investment Type |
Total revolving |
Less: |
Total |
|||||||
|
Sorenson Communications |
Revolver |
$ |
198,000 |
$ |
0 |
$ |
198,000 |
||||
|
Spruce Bidco II |
First Lien Revolver |
|
614,000 |
|
0 |
|
614,000 |
||||
|
THG Acquisition |
First Lien Delay Draw Term Loan |
|
29,317 |
|
8,514 |
|
20,803 |
||||
|
THG Acquisition |
First Lien Delay Draw Term Loan |
|
56,289 |
|
16,348 |
|
39,941 |
||||
|
THG Acquisition |
First Lien Delay Draw Term Loan |
|
48,544 |
|
14,098 |
|
34,446 |
||||
|
THG Acquisition |
First Lien Delay Draw Term Loan |
|
11,668 |
|
3,388 |
|
8,280 |
||||
|
THG Acquisition |
First Lien Delay Draw Term Loan |
|
4,084 |
|
1,186 |
|
2,898 |
||||
|
THG Acquisition |
First Lien Delay Draw Term Loan |
|
10,385 |
|
3,016 |
|
7,369 |
||||
|
THG Acquisition |
First Lien Delay Draw Term Loan |
|
19,936 |
|
5,790 |
|
14,146 |
||||
|
THG Acquisition |
First Lien Delay Draw Term Loan |
|
58,487 |
|
16,986 |
|
41,501 |
||||
|
THG Acquisition |
First Lien Revolver |
|
102,786 |
|
13,509 |
|
89,277 |
||||
|
THG Acquisition |
First Lien Revolver |
|
797 |
|
105 |
|
692 |
||||
|
THG Acquisition |
First Lien Revolver |
|
15,418 |
|
2,027 |
|
13,391 |
||||
|
Truck-Lite Company |
First Lien Revolver |
|
105,000 |
|
0 |
|
105,000 |
||||
|
Truck-Lite Company |
First Lien Tranche A Delay Draw Term Loan |
|
37,745 |
|
21,995 |
|
15,750 |
||||
|
USIC Holdings |
First Lien Delay Draw Term Loan |
|
67,304 |
|
38,499 |
|
28,805 |
||||
|
USIC Holdings |
First Lien Delay Draw Term Loan |
|
17,358 |
|
9,929 |
|
7,429 |
||||
|
USIC Holdings |
First Lien Revolver |
|
55,488 |
|
26,000 |
|
29,488 |
||||
|
USIC Holdings |
First Lien Revolver |
|
44,390 |
|
20,800 |
|
23,590 |
||||
|
USIC Holdings |
First Lien Revolver |
|
82,122 |
|
38,480 |
|
43,642 |
||||
|
WP CPP Holdings |
First Lien Revolver |
|
90,000 |
|
0 |
|
90,000 |
||||
|
$ |
37,979,570 |
$ |
12,052,588 |
$ |
25,926,982 |
||||||
(c) Fair value determined using significant unobservable inputs in accordance with procedures established by and under the supervision of the Adviser, acting as Valuation Designee. These securities represented $110,215,331 or 35.0% of net assets as of December 31, 2025.
(d) Security is exempt from registration pursuant to Rule 144A under the Securities Act of 1933, as amended. These securities may only be resold in transactions exempt from registration to qualified institutional investors. As of December 31, 2025, the value of these securities total $148,408,773 or 47.1% of the Fund’s net assets.
(e) Represents less than 0.05% of net assets.
(f) These securities are pledged as collateral for the credit facility.
(g) Zero coupon bonds make no periodic interest payments.
(h) Restricted security purchased in a private placement transaction in which resale to the public may require registration. As of December 31, 2025, the value of these securities total $3,709,691 or 1.2% of the Fund’s net assets.
(i) Non-income producing security.
(j) Coupon rate is variable based on the weighted average coupon of the underlying collateral. To the extent the weighted average coupon of the underlying assets which comprise the collateral increases or decreases, the coupon rate of this security will increase or decrease correspondingly. The rate disclosed is as of December 31, 2025.
(k) Step coupon bond. The rate disclosed is as of December 31, 2025.
(l) Interest only security.
(m) Issuer is currently in default.
(n) The rate shown represents the 7-day annualized yield as of December 31, 2025.
(o) The rate shown is the annualized yield as of December 31, 2025.
____________
See Notes to Consolidated Financial Statements.
|
50 |
|
|
OAKTREE DIVERSIFIED INCOME FUND INC. December 31, 2025 |
Futures Contracts:
As of December 31, 2025, the following futures contracts were outstanding:
|
Description |
Contracts |
Expiration Date |
Notional Value |
Value/Unrealized |
||||||
|
U.S. Treasury 2 Year Note |
199 |
03/31/2026 |
$ |
41,549,023 |
$ |
35,360 |
||||
|
U.S. Treasury 5 Year Note |
(91) |
03/31/2026 |
|
9,946,726 |
|
0 |
||||
|
Net Unrealized Appreciation |
|
$ |
35,360 |
|||||||
Forward Currency Contracts:
As of December 31, 2025, the following forward currency contracts were outstanding:
|
Counterparty |
Settlement Date |
Currency Purchased |
Currency Sold |
|
Unrealized |
|||||||||||
|
State Street Bank & Trust Co. |
01/22/2026 |
CAD |
11,796 |
USD |
8,465 |
$ |
138 |
|
||||||||
|
State Street Bank & Trust Co. |
01/22/2026 |
EUR |
2,250,541 |
USD |
2,620,850 |
|
26,822 |
|
||||||||
|
State Street Bank & Trust Co. |
01/22/2026 |
GBP |
714,889 |
USD |
942,374 |
|
21,236 |
|
||||||||
|
State Street Bank & Trust Co. |
01/22/2026 |
USD |
345,942 |
JPY |
52,196,841 |
|
12,038 |
|
||||||||
|
State Street Bank & Trust Co. |
01/22/2026 |
USD |
3,689,030 |
AUD |
5,605,980 |
|
(52,620 |
) |
||||||||
|
State Street Bank & Trust Co. |
01/22/2026 |
USD |
355,573 |
CAD |
493,649 |
|
(4,455 |
) |
||||||||
|
State Street Bank & Trust Co. |
01/22/2026 |
USD |
11,914,355 |
EUR |
10,211,145 |
|
(98,652 |
) |
||||||||
|
State Street Bank & Trust Co. |
04/16/2026 |
USD |
48,278,114 |
EUR |
41,412,004 |
|
(630,832 |
) |
||||||||
|
State Street Bank & Trust Co. |
01/22/2026 |
USD |
14,130,953 |
GBP |
10,544,366 |
|
(81,960 |
) |
||||||||
|
State Street Bank & Trust Co. |
01/22/2026 |
USD |
776,427 |
SEK |
7,297,620 |
|
(17,182 |
) |
||||||||
|
Net Unrealized Depreciation |
$ |
(825,467 |
) |
|||||||||||||
|
AUD |
— |
Australian Dollars |
||
|
CAD |
— |
Canadian Dollar |
||
|
EUR |
— |
Euro |
||
|
GBP |
— |
British Pound |
||
|
JPY |
— |
Japanese Yen |
||
|
SEK |
— |
Swedish Krona |
||
|
USD |
— |
United States Dollar |
____________
See Notes to Consolidated Financial Statements.
|
2025 Annual Report |
51 |
|
OAKTREE DIVERSIFIED INCOME FUND INC. December 31, 2025 |
Credit Default Swap Contracts — Sell Protection (a):
As of December 31, 2025, the following credit default swap contracts were outstanding
|
Reference Obligation |
Financing |
Payment |
Maturity Date |
Notional |
Value (c) |
Upfront |
Unrealized |
||||||||||||
|
Sell Protection (a): |
|||||||||||||||||||
|
CDS Cobalt Series 1 |
4.95 |
% |
Quarterly |
08/07/2030 |
$ |
1,600,000 |
$ |
1,604,620 |
$ |
1,580,235 |
$ |
24,385 |
|||||||
Goldman Sachs is the counterparty for the swap.
(a) If the Fund is a seller of protection and a credit event occurs, as defined under the terms of that particular swap agreement, the Fund will either (i) pay to the buyer of protection an amount equal to the notional amount of the swap and take delivery of the referenced obligation or underlying securities comprising the referenced index or (ii) pay a net settlement amount in the form of cash or securities equal to the notional amount of the swap less the recovery value of the referenced obligation of underlying securities comprising the referenced index.
(b) The maximum potential amount the Fund could be required to pay as a seller of credit protection or receive as a buyer of credit protection if a credit event occurs as defined under the terms of that particular swap agreement.
(c) The prices and resulting values for credit default swap agreements on credit indices serve as an indicator of the current status of the payment/performance risk and represent the likelihood of an expected liability (or profit) for the credit derivative should the notional amount of the swap agreement be closed/sold as of the period end. Increasing market values, in absolute terms when compared to the notional amount of the swap, represent a deterioration of the referenced entity’s credit soundness and a greater likelihood or risk of default or other credit event occurring as defined under the terms of the agreement.
____________
See Notes to Consolidated Financial Statements.
|
52 |
|
|
OAKTREE DIVERSIFIED INCOME FUND INC. December 31, 2025 |
| Assets: |
|
| ||
| Investments in securities, at value (Cost $409,041,968) | $ | 410,226,556 |
| |
| Interest receivable |
| 5,056,936 |
| |
| Receivable for investments sold |
| 2,210,358 |
| |
| Foreign currency, at value (Cost $2,117,878) |
| 2,123,461 |
| |
| Premiums paid for swap contracts |
| 1,580,235 |
| |
| Cash |
| 494,510 |
| |
| Deposit at broker for future contracts |
| 352,522 |
| |
| Receivable for fund shares sold |
| 320,460 |
| |
| Unrealized appreciation on forward currency contracts (Note 3) |
| 60,234 |
| |
| Unrealized appreciation on unfunded loan commitments |
| 56,811 |
| |
| Unrealized appreciation on swap contracts (Note 3) |
| 24,385 |
| |
| Prepaid expenses |
| 48,532 |
| |
| Total assets |
| 422,555,000 |
| |
| Liabilities: |
|
| ||
| Payable for credit facility (Note 6) |
| 99,500,000 |
| |
| Deferred debt issuance costs, credit facility (Note 6) |
| (200,099 | ) | |
| Payable for investments purchased |
| 6,265,455 |
| |
| Unrealized depreciation on forward currency contracts (Note 3) |
| 885,701 |
| |
| Interest payable for credit facility (Note 6) |
| 377,087 |
| |
| Investment advisory fees payable, net (Note 4) |
| 193,771 |
| |
| Variation margin on futures contracts (Note 3) |
| 3,328 |
| |
| Accrued expenses |
| 591,852 |
| |
| Total liabilities |
| 107,617,095 |
| |
| Indemnifications, commitments and contingencies (Notes 4 and 10) |
|
|
| |
| Net Assets | $ | 314,937,905 |
| |
| Composition of Net Assets: |
|
| ||
| Paid-in capital |
| 324,720,380 |
| |
| Accumulated losses |
| (9,782,475 | ) | |
| Net Assets | $ | 314,937,905 |
| |
| Shares Outstanding and Net Asset Value Per Share: |
|
| ||
| |
| |
| |
| Net asset value per share | $ | 9.01 |
|
____________
See Notes to Consolidated Financial Statements.
|
2025 Annual Report |
53 |
|
OAKTREE DIVERSIFIED INCOME FUND INC. For the Year Ended December 31, 2025 |
|
Investment Income: |
|
|
||
|
Interest (net of foreign withholding tax of $297,961) |
$ |
36,540,453 |
|
|
|
Dividends and distributions |
|
233,146 |
|
|
|
Total investment income |
|
36,773,599 |
|
|
|
Expenses: |
|
|
||
|
Investment advisory fees (Note 4) |
|
4,893,977 |
|
|
|
Legal fees |
|
408,760 |
|
|
|
Fund accounting and sub-administration fees |
|
337,688 |
|
|
|
Audit and tax services |
|
268,590 |
|
|
|
Directors' fees |
|
216,922 |
|
|
|
Transfer agent fees |
|
139,140 |
|
|
|
Miscellaneous |
|
85,575 |
|
|
|
Reports to shareholders |
|
72,738 |
|
|
|
Registration fees |
|
70,585 |
|
|
|
Custodian fees |
|
66,245 |
|
|
|
Insurance |
|
14,776 |
|
|
|
Total operating expenses |
|
6,574,996 |
|
|
|
Interest expense and credit facility fees (Note 6) |
|
5,302,620 |
|
|
|
Less expenses reimbursed by the investment adviser (Note 4) |
|
(72,842 |
) |
|
|
Net expenses |
|
11,804,774 |
|
|
|
Net Investment income |
|
24,968,825 |
|
|
|
Net realized gain (loss) on: |
|
|
||
|
Investments |
|
(1,486,572 |
) |
|
|
Foreign currency transactions |
|
42,772 |
|
|
|
Forward currency contracts |
|
(1,616,863 |
) |
|
|
Futures contracts |
|
27,239 |
|
|
|
Swap contracts |
|
(19,765 |
) |
|
|
Net realized loss |
|
(3,053,189 |
) |
|
|
Net change in unrealized appreciation (depreciation) on: |
|
|
||
|
Investments |
|
5,309,785 |
|
|
|
Unfunded loan commitments |
|
16,222 |
|
|
|
Foreign currency |
|
8,297 |
|
|
|
Foreign currency translations |
|
(122,645 |
) |
|
|
Forward currency contracts |
|
(3,507,796 |
) |
|
|
Futures contracts |
|
73,567 |
|
|
|
Swap contracts |
|
24,385 |
|
|
|
Net change in unrealized appreciation |
|
1,801,815 |
|
|
|
Net realized and unrealized loss |
|
(1,251,374 |
) |
|
|
Net increase in net assets resulting from operations |
$ |
23,717,451 |
|
____________
See Notes to Consolidated Financial Statements.
|
54 |
|
|
For the |
For the |
|||||||
|
Increase (Decrease) in Net Assets Resulting from Operations: |
|
|
|
|
||||
|
Net investment income |
$ |
24,968,825 |
|
$ |
23,389,509 |
|
||
|
Net realized loss |
|
(3,053,189 |
) |
|
(3,463,435 |
) |
||
|
Net change in unrealized appreciation |
|
1,801,815 |
|
|
10,053,084 |
|
||
|
Net increase in net assets resulting from operations |
|
23,717,451 |
|
|
29,979,158 |
|
||
|
Distributions to Shareholders: |
|
|
|
|
||||
|
Distributable earnings |
|
(24,717,609 |
) |
|
(22,828,124 |
) |
||
|
Return of capital |
|
(3,709,846 |
) |
|
— |
|
||
|
Total distributions to shareholders |
|
(28,427,455 |
) |
|
(22,828,124 |
) |
||
|
Capital Share Transactions: |
|
|
|
|
||||
|
Proceeds from shares sold |
|
40,423,235 |
|
|
58,996,400 |
|
||
|
Reinvestment of distributions |
|
20,959,635 |
|
|
16,734,114 |
|
||
|
Repurchase of shares (Note 8) |
|
(34,333,503 |
) |
|
(20,399,804 |
) |
||
|
Net increase in net assets from capital share transactions |
|
27,049,367 |
|
|
55,330,710 |
|
||
|
Total increase in net assets |
|
22,339,363 |
|
|
62,481,744 |
|
||
|
Net Assets: |
|
|
|
|
||||
|
Beginning of year |
|
292,598,542 |
|
|
230,116,798 |
|
||
|
End of year |
$ |
314,937,905 |
|
$ |
292,598,542 |
|
||
|
Share Transactions: |
|
|
|
|
||||
|
Shares sold |
|
4,420,697 |
|
|
6,477,678 |
|
||
|
Shares reinvested |
|
2,318,159 |
|
|
1,845,541 |
|
||
|
Shares repurchased (Note 8) |
|
(3,764,652 |
) |
|
(2,232,689 |
) |
||
|
Net increase in shares outstanding |
|
2,974,204 |
|
|
6,090,530 |
|
||
____________
See Notes to Consolidated Financial Statements.
|
2025 Annual Report |
55 |
|
OAKTREE DIVERSIFIED INCOME FUND INC. For the Year Ended December 31, 2025 |
|
Increase (Decrease) in Cash: |
|
|
||
|
Cash flows provided by (used in) operating activities |
|
|
||
|
Net Increase in net assets resulting from operations |
$ |
23,717,451 |
|
|
|
Adjustments to reconcile net Increase in net assets resulting from operations to net cash used in operating activities |
|
|
||
|
Purchases of long-term portfolio investments and principal payups |
|
(196,965,782 |
) |
|
|
Proceeds from disposition of long-term portfolio investments and principal paydowns |
|
164,139,327 |
|
|
|
Net purchases and sales of short-term portfolio investments |
|
(6,795,773 |
) |
|
|
Premiums paid for swap contracts |
|
(1,580,235 |
) |
|
|
Amortization of deferred debt issuance costs |
|
(1,677 |
) |
|
|
Increase in interest receivable |
|
(449,387 |
) |
|
|
Decrease in prepaid expenses |
|
954 |
|
|
|
Increase in interest payable for credit facility |
|
253,803 |
|
|
|
Increase in payable for variation margin |
|
1,047 |
|
|
|
Decrease in investment advisory fees payable |
|
(10,726 |
) |
|
|
Increase in accrued expenses |
|
331,216 |
|
|
|
Net accretion of discount on investments and other adjustments to cost |
|
(3,205,545 |
) |
|
|
Net change in unrealized appreciation on investments |
|
(5,309,785 |
) |
|
|
Net change in unrealized appreciation on foreign currency |
|
(8,297 |
) |
|
|
Net change in unrealized appreciation on unfunded commitments |
|
(16,222 |
) |
|
|
Net change in unrealized appreciation on swap contracts |
|
(24,385 |
) |
|
|
Net change in unrealized appreciation on forward currency contracts |
|
3,507,796 |
|
|
|
Net realized loss on investment transactions |
|
1,486,572 |
|
|
|
Net cash used in operating activities |
|
(20,929,648 |
) |
|
|
Cash flows provided by (used for) financing activities: |
|
|
||
|
Proceeds from credit facility |
|
25,000,000 |
|
|
|
Proceeds from shares sold |
|
40,421,023 |
|
|
|
Repurchase of shares |
|
(34,333,503 |
) |
|
|
Distributions paid to shareholders, net of reinvestments |
|
(7,467,820 |
) |
|
|
Net cash provided by financing activities |
|
23,619,700 |
|
|
|
Effect of exchange rate changes on cash |
|
8,297 |
|
|
|
Net increase in cash |
|
2,698,349 |
|
|
|
Cash at beginning of year |
|
272,144 |
|
|
|
Cash at end of year |
$ |
2,970,493 |
|
|
|
Supplemental Disclosure of Cash Flow Information: |
|
|
||
|
Interest payments on the credit facility for the year ended December 31, 2025 totaled $5,050,494. |
|
|||
|
Non-cash financing activities not included consist of reinvestment of distributions for the year ended December 31, 2025 of $20,959,635. |
|
|||
|
Reconciliation of Cash at the End of Year to the Consolidated Statement of Assets and Liabilities: |
|
|||
|
Cash |
$ |
494,510 |
|
|
|
Foreign currency |
|
2,123,461 |
|
|
|
Cash on deposit with brokers for futures contracts |
|
352,522 |
|
|
|
Cash at end of year |
$ |
2,970,493 |
|
|
____________
See Notes to Consolidated Financial Statements.
|
56 |
|
| Class D |
| For the Period | ||||||||||||||||||
| 2025 | 2024 | 2023 | 2022 | |||||||||||||||||
| Per Share Operating Performance: |
|
|
|
|
|
|
|
|
|
| ||||||||||
| Net asset value, beginning of period | $ | |
| $ | |
| $ | |
| $ | |
| $ | |
| |||||
| Income from Investment Operations: |
|
|
|
|
|
|
|
|
|
| ||||||||||
| Net investment income2 |
| 0.74 |
|
| 0.81 |
|
| 0.78 |
|
| 0.50 |
|
| 0.02 |
| |||||
| Net realized and change in unrealized gain (loss)2 |
| (0.04 | ) |
| 0.23 |
|
| 0.20 |
|
| (1.20 | ) |
| (0.07 | ) | |||||
| Net increase (decrease) in net asset value resulting from operations |
| 0.70 |
|
| 1.04 |
|
| 0.98 |
|
| (0.70 | ) |
| (0.05 | ) | |||||
| Distributions to Shareholders: |
|
|
|
|
|
|
|
|
|
| ||||||||||
| From net investment income |
| (0.73 | ) |
| (0.77 | ) |
| (0.69 | ) |
| (0.65 | ) |
| (0.01 | ) | |||||
| From return of capital distributions |
| (0.11 | ) |
| — |
|
| — |
|
| — |
|
| — |
| |||||
| Total distributions paid* |
| (0.84 | ) |
| (0.77 | ) |
| (0.69 | ) |
| (0.65 | ) |
| (0.01 | ) | |||||
| Net asset value, end of period | $ | |
| $ | |
| $ | |
| $ | |
| $ | |
| |||||
| Total Investment Return†,3 |
| 7.94 | % |
| 12.11 | % |
| 11.76 | % |
| (7.03 | )% |
| (0.37 | )% | |||||
| Ratios to Average Net Assets/Supplementary Data: |
|
|
|
|
|
|
|
|
|
| ||||||||||
| Net assets, end of period (000s) | $ | 314,938 |
| $ | 292,599 |
| $ | 230,117 |
| $ | 151,702 |
| $ | 150,092 |
| |||||
| Gross operating expenses excluding |
| 2.12 | % |
| 2.11 | % |
| 2.03 | % |
| 1.96 | % |
| 5.55 | % | |||||
| Interest expense4 |
| 1.71 | % |
| 1.35 | % |
| 0.98 | % |
| 0.55 | % |
| — | % | |||||
| Gross operating expenses4 |
| 3.83 | % |
| 3.46 | % |
| 3.01 | % |
| 2.51 | % |
| 5.55 | % | |||||
| Net expenses, including fee waivers and reimbursement or recoupment and excluding interest expense4 |
| 2.10 | % |
| 2.10 | % |
| 2.10 | % |
| 2.10 | % |
| 2.10 | % | |||||
| Net expenses, including fee waivers and reimbursement or recoupment and interest expense4 |
| 3.81 | % |
| 3.45 | % |
| 3.08 | % |
| 2.65 | % |
| 2.10 | % | |||||
| Net investment income4 |
| 8.06 | % |
| 8.86 | % |
| 8.81 | % |
| 5.64 | % |
| 1.51 | % | |||||
| Net investment income (loss), excluding the effect of fee waivers and reimbursement or recoupment4 |
| 8.04 | % |
| 8.85 | % |
| 8.88 | % |
| 5.50 | % |
| (1.94 | )% | |||||
| Portfolio turnover rate3 |
| 41 | % |
| 39 | % |
| 24 | % |
| 25 | % |
| 4 | % | |||||
The following table sets forth information regarding the Fund’s outstanding senior securities as of the end of each of the Fund’s last ten fiscal years, as applicable.
| Fiscal or Period End | Total Amount | Asset Coverage | Involuntary | Average | Type of Senior | |||||||
| December 31, 2025 | $ | | $ | | N/A |
| Credit Facility | |||||
| December 31, 2024 |
| |
| | N/A |
| Credit Facility | |||||
| December 31, 2023 |
| |
| | N/A |
| Credit Facility | |||||
| December 31, 2022 |
| |
| | N/A |
| Credit Facility | |||||
| December 31, 20211 |
| N/A |
| N/A | N/A | N/A |
| |||||
____________
* Distributions for annual periods determined in accordance with federal income tax regulations.
† Total investment return is computed based upon the net asset value of the Fund’s shares and excludes the effects of sales charges or contingent deferred sales charges, if applicable. Distributions are assumed to be reinvested at the net asset value of the Class on the ex-date of the distribution.
1
2 Per share amounts presented are based on average shares outstanding throughout the period indicated.
3 Not annualized for periods less than one year.
4 Annualized for periods less than one year.
5
____________
See Notes to Consolidated Financial Statements.
|
2025 Annual Report |
57 |
1. Organization
Oaktree Diversified Income Fund Inc. (the “Fund”) was organized as a corporation under the laws of the State of Maryland on June 29, 2021. The Fund is registered under the Investment Company Act of 1940, as amended (the “1940 Act”), as a diversified, closed-end management investment company that continuously offers its shares of common stock, $0.001 par value per share (the “Common Shares”), and is operated as an “interval fund.” The Fund’s Class D shares commenced operations on November 1, 2021.
The Fund offers four classes of Shares: Class A Shares, Class D Shares, Class T Shares, and Class U Shares. The Fund was granted exemptive relief (the “Exemptive Relief”) from the Securities and Exchange Commission (the “SEC”), permitting the Fund to issue multiple classes of shares and to impose asset-based distribution fees and early-withdrawal fees.
Oaktree Fund Advisors, LLC (the “Adviser”), a Delaware limited liability company and a registered investment adviser under the Investment Advisers Act of 1940, as amended, serves as the investment adviser to the Fund. The Adviser is an affiliate of Oaktree Capital Management, L.P. (“OCM”), a leading global investment management firm headquartered in Los Angeles, California focused on less efficient markets and alternative investments, and is a subsidiary of Oaktree Capital Group, LLC (“OCG,” and collectively with OCM and the Adviser, “Oaktree”). Oaktree was founded in April 1995 and is a leader among global investment managers specializing in alternative investments. As of December 31, 2025, Brookfield owned 74% of Oaktree.
Brookfield Public Securities Group LLC (the “Administrator”), an indirect wholly-owned subsidiary of Brookfield Asset Management Ltd. (NYSE: BAM; TSX: BAMA) (“Brookfield” or “BAM”), is registered as an investment adviser under the Investment Advisers Act of 1940, as amended, and serves as Administrator to the Fund. In 2019, BAM acquired a majority interest in Oaktree.
The Fund’s investment objective is to seek current income and attractive total return. The Fund seeks to achieve its investment objective by investing globally in high-conviction opportunities across Oaktree’s performing credit platform of high-yield bonds, senior loans, structured credit, emerging markets debt and convertibles, inclusive of both public and private credit sectors. High-yield bonds are also referred to as “below-investment grade rated securities” or “junk bonds,” as described in the Fund’s Prospectus. The Fund seeks to add value through three sources: (1) providing exposure to asset classes that require specialized expertise; (2) performing well in each asset class through proprietary, bottom-up and credit research; and (3) allocating capital opportunistically among asset classes based on Oaktree’s assessment of relative value.
Oaktree Diversified Income Fund (Cayman) Ltd. (the “Subsidiary”), a Cayman Islands exempted company and wholly-owned subsidiary of the Fund, was formed on November 11, 2021. The Subsidiary was established for the purpose of investing in certain Regulation S securities. As a wholly-owned subsidiary of the Fund, the financial results of the Subsidiary are included in the consolidated financial statements and financial highlights of the Fund. All investments held by the Subsidiary are disclosed in the Consolidated Schedule of Investments. The Fund may invest up to 25% of its total assets in the Subsidiary. The net assets of the Subsidiary at December 31, 2025 were $9,828,527, or 3.1% of the Fund’s consolidated net assets. The accompanying consolidated financial statements include the accounts of the Subsidiary. All inter-company accounts and transactions have been eliminated in consolidation.
2. Significant Accounting Policies
The preparation of financial statements in conformity with accounting principles generally accepted in the United States of America (“GAAP”) requires management to make estimates and assumptions that affect the reported amounts of assets and liabilities and disclosure of contingent assets and liabilities at the date of the financial statements and the reported amounts of increases and decreases in net assets from operations during the reporting period. Actual results could differ from those estimates. The Fund is an investment company and follows accounting and reporting guidance under Financial Accounting Standards Board (“FASB”) Accounting Standards Codification (“ASC”) Topic 946, Financial Services-Investment Companies.
Valuation of Investments: The Fund’s Board of Directors (the “Board”) has adopted procedures for the valuation of the Fund’s securities. The Adviser oversees the day to day responsibilities for valuation determinations under these procedures. The Board regularly reviews the application of these procedures to the securities in the Fund’s portfolio. The Adviser’s Valuation Committee is comprised of senior members of the Adviser’s management team.
|
58 |
|
|
OAKTREE DIVERSIFIED INCOME FUND INC. December 31, 2025 |
The Board has designated the Adviser as the valuation designee pursuant to Rule 2a-5 under the 1940 Act to perform fair value determinations relating to any or all Fund investments. The Board oversees the Adviser in its role as the valuation designee in accordance with the requirements of Rule 2a-5 under the 1940 Act.
Investments in equity securities listed or traded on any securities exchange or traded in the over-the-counter market are valued at the last trade price as of the close of business on the valuation date. If the NYSE closes early, then the equity security will be valued at the last traded price before the NYSE close. Prices of foreign equities that are principally traded on certain foreign markets will generally be adjusted daily pursuant to a fair value pricing service approved by the Board in order to reflect an adjustment for the factors occurring after the close of certain foreign markets but before the NYSE close. When fair value pricing is employed, the value of the portfolio securities used to calculate the Fund’s net asset value (“NAV”) may differ from quoted or official closing prices. Investments in open-end registered investment companies, if any, are valued at the NAV as reported by those investment companies.
Debt securities, including U.S. government securities, listed corporate bonds, other fixed income and asset-backed securities, and unlisted securities and private placement securities, are generally valued at the bid prices furnished by an independent pricing service or, if not valued by an independent pricing service, using bid prices obtained from active and reliable market makers in any such security or a broker-dealer. Valuations from broker-dealers or pricing services consider appropriate factors such as market activity, market activity of comparable securities, yield, estimated default rates, timing of payments, underlying collateral, coupon rate, maturity date, and other factors. Short-term debt securities with remaining maturities of sixty days or less are valued at amortized cost of discount or premium to maturity, unless such valuation, in the judgment of the Adviser’s Valuation Committee, does not represent fair value.
Bank Loans, Assignments, and Participations. Loans (including “Senior Loans” (as described below), delayed funding loans and revolving credit facilities) may be fixed-or floating-rate obligations. Loan interests may take the form of direct interests acquired during a primary distribution and may also take the form of assignments of, novations of or participations in a bank loan acquired in secondary markets. Senior floating rate loans may be made to or issued by U.S. or non-U.S. banks or other corporations (“Senior Loans”). Senior Loans include senior floating rate loans and institutionally traded senior floating rate debt obligations issued by asset-backed pools and other issuers, and interests therein. Loan interests may be acquired from U.S. or foreign commercial banks, insurance companies, finance companies or other financial institutions who have made loans or are members of a lending syndicate or from other holders of loan interests.
Senior Loans typically pay interest at rates which are re-determined periodically on the basis of a floating base lending rate (such as the Secured Overnight Financial Rate, “SOFR,” or a similar reference rate) plus a premium. Senior Loans are typically of below investment grade quality. Senior Loans generally (but not always) hold the most senior position in the capital structure of a borrower and are often secured with collateral. A Senior Loan is typically originated, negotiated and structured by a U.S. or foreign commercial bank, insurance company, finance company or other financial institution (an “Agent”) for a lending syndicate of financial institutions (“Lenders”). The Agent typically administers and enforces the Senior Loan on behalf of the other Lenders in the syndicate. In addition, an institution, typically but not always the Agent, holds any collateral on behalf of the Lenders.
Over-the-counter financial derivative instruments, such as forward currency contracts, options contracts, or swap agreements, derive their values from underlying asset prices, indices, reference rates, other inputs or a combination of these factors. These instruments are normally valued on the basis of evaluations provided by independent pricing services or broker dealer quotations. Depending on the instrument and the terms of the transaction, the value of the derivative instruments can be estimated by a pricing service provider using a series of techniques, such as simulation pricing models. The pricing models use issuer details and other inputs that are observed from actively quoted markets such as indices, spreads, interest rates, curves, dividends and exchange rates.
|
2025 Annual Report |
59 |
|
OAKTREE DIVERSIFIED INCOME FUND INC. December 31, 2025 |
Securities for which market prices are not readily available, cannot be determined using the sources described above, or the Adviser’s Valuation Committee determines that the quotation or price for a portfolio security provided by a broker-dealer or an independent pricing service is inaccurate will be valued at a fair value determined by the Adviser’s Valuation Committee following the procedures adopted by the Adviser under the supervision of the Board. The Adviser’s valuation policy establishes parameters for the sources, methodologies, and inputs the Adviser’s Valuation Committee uses in determining fair value.
Non-publicly traded debt and equity securities and other securities or instruments for which reliable market quotations are not available are valued by the Adviser using valuation methodologies applied on a consistent basis. These securities may initially be valued at the acquisition price as the best indicator of fair value. The Adviser reviews the significant unobservable inputs, valuations of comparable investments and other similar transactions for investments valued at acquisition price to determine whether another valuation methodology should be utilized. Subsequent valuations will depend on facts and circumstances known as of the valuation date and the application of valuation methodologies further described below. The fair value may also be based on a pending transaction expected to close after the valuation date. These valuation methodologies involve a significant degree of management judgment. Accordingly, valuations do not necessarily represent the amounts which may eventually be realized from sales or other dispositions of investments in the future. Fair values may differ from the values that would have been used had a ready market for the investment existed, and the differences could be material to the consolidated financial statements.
The fair valuation methodology may include or consider the following guidelines, as appropriate: (1) evaluation of all relevant factors, including but not limited to, pricing history, current market level, supply and demand of the respective security; (2) comparison to the values and current pricing of securities that have comparable characteristics; (3) knowledge of historical market information with respect to the security; and (4) other factors relevant to the security which would include, but not be limited to, duration, yield, fundamental analytical data, the Treasury yield curve, and credit quality. The fair value may be difficult to determine and thus judgment plays a greater role in the valuation process. Imprecision in estimating fair value can also impact the amount of unrealized appreciation or depreciation recorded for a particular portfolio security and differences in the assumptions used could result in a different determination of fair value, and those differences could be material. For those securities valued by fair valuations, the Adviser’s Valuation Committee reviews and affirms the reasonableness of the valuations based on such methodologies and fair valuation determinations on a regular basis after considering all relevant information that is reasonably available. There can be no assurance that the Fund could purchase or sell a portfolio security at the price used to calculate the Fund’s NAV.
A three-tier hierarchy has been established to maximize the use of observable market data and minimize the use of unobservable inputs and to establish classification of fair value measurements for disclosure purposes.
Observable inputs are inputs that reflect the assumptions market participants would use in pricing the asset or liability developed based on market data obtained from sources independent of the reporting entity. Unobservable inputs are inputs that reflect the reporting entity’s own assumptions about the assumptions market participants would use in pricing the asset or liability developed based on the best information available in the circumstances.
The three-tier hierarchy of inputs is summarized in the three broad levels listed below:
|
Level 1 |
— |
quoted prices in active markets for identical assets or liabilities |
||||
|
Level 2 |
— |
quoted prices in markets that are not active or other significant observable inputs (including, but not limited to: quoted prices for similar assets or liabilities, quoted prices based on recently executed transactions, interest rates, credit risk, etc.) |
||||
|
Level 3 |
— |
significant unobservable inputs (including the Fund’s own assumptions in determining the fair value of assets or liabilities) |
|
60 |
|
|
OAKTREE DIVERSIFIED INCOME FUND INC. December 31, 2025 |
The following table summarizes the Fund’s investments valuation inputs categorized in the disclosure hierarchy as of December 31, 2025:
|
Level 1 |
Level 2 |
Level 3 |
Total |
||||||||||||
|
Assets: |
|
|
|
|
|
|
|
||||||||
|
Investments: |
|
|
|
|
|
|
|
||||||||
|
Corporate Credit: |
|
|
|
|
|
|
|
||||||||
|
Senior Loans (Syndicated) |
$ |
— |
|
$ |
108,300,275 |
|
$ |
1,816,376 |
$ |
110,116,651 |
|
||||
|
High Yield |
|
— |
|
|
74,961,460 |
|
|
— |
|
74,961,460 |
|
||||
|
Corporate Credit – Total |
|
— |
|
|
183,261,735 |
|
|
1,816,376 |
|
185,078,111 |
|
||||
|
Private Credit: |
|
|
|
|
|
|
|
||||||||
|
Senior Loans |
$ |
— |
|
$ |
1,125,785 |
|
$ |
90,411,324 |
$ |
91,537,109 |
|
||||
|
Senior Loans (Syndicated) |
|
— |
|
|
— |
|
|
8,076,632 |
|
8,076,632 |
|
||||
|
Preferred Stock |
|
— |
|
|
— |
|
|
3,245,855 |
|
3,245,855 |
|
||||
|
Private Placement Equity |
|
— |
|
|
— |
|
|
2,168,448 |
|
2,168,448 |
|
||||
|
Warrants |
|
— |
|
|
— |
|
|
176,896 |
|
176,896 |
|
||||
|
Common Stock |
|
5,819 |
|
|
90,530 |
|
|
— |
|
96,349 |
|
||||
|
Private Credit – Total |
|
5,819 |
|
|
1,216,315 |
|
|
104,079,155 |
|
105,301,289 |
|
||||
|
Structured Credit: |
|
|
|
|
|
|
|
||||||||
|
Collateralized Loan Obligations |
$ |
— |
|
$ |
44,627,420 |
|
$ |
— |
$ |
44,627,420 |
|
||||
|
Asset-Backed Securities |
|
— |
|
|
19,761,830 |
|
|
3,811,598 |
|
23,573,428 |
|
||||
|
Commercial Mortgage-Backed Securities |
|
— |
|
|
14,292,812 |
|
|
34,678 |
|
14,327,490 |
|
||||
|
Residential Mortgage-Backed Securities |
|
— |
|
|
10,234,331 |
|
|
— |
|
10,234,331 |
|
||||
|
High Yield |
|
— |
|
|
2,508,856 |
|
|
— |
|
2,508,856 |
|
||||
|
Structured Credit – Total |
|
— |
|
|
91,425,249 |
|
|
3,846,276 |
|
95,271,525 |
|
||||
|
Emerging Markets: |
|
|
|
|
|
|
|
||||||||
|
High Yield |
$ |
— |
|
$ |
10,204,502 |
|
$ |
473,524 |
$ |
10,678,026 |
|
||||
|
Emerging Markets – Total |
|
— |
|
|
10,204,502 |
|
|
473,524 |
|
10,678,026 |
|
||||
|
Money Market Funds |
|
10,903,519 |
|
|
— |
|
|
— |
|
10,903,519 |
|
||||
|
U.S. Treasury Bills |
|
— |
|
|
2,994,086 |
|
|
— |
|
2,994,086 |
|
||||
|
Total Investments |
$ |
10,909,338 |
|
$ |
289,101,887 |
|
$ |
110,215,331 |
$ |
410,226,556 |
|
||||
|
|
|
|
|
|
|
|
|||||||||
|
Other Financial Instruments: |
|
|
|
|
|
|
|
||||||||
|
Credit Default Swaps* |
$ |
— |
|
$ |
24,385 |
|
$ |
— |
$ |
24,385 |
|
||||
|
Forward Currency Contracts* |
|
— |
|
|
60,234 |
|
|
— |
|
60,234 |
|
||||
|
Unfunded Loan Commitments* |
|
— |
|
|
13,534 |
|
|
43,277 |
|
56,811 |
|
||||
|
Futures Contracts* |
|
35,360 |
|
|
— |
|
|
— |
|
35,360 |
|
||||
|
Total Other Financial Instruments |
$ |
35,360 |
|
$ |
98,153 |
|
$ |
43,277 |
$ |
176,790 |
|
||||
|
|
|
|
|
|
|
|
|||||||||
|
Liabilities: |
|
|
|
|
|
|
|
||||||||
|
Other Financial Instruments: |
|
|
|
|
|
|
|
||||||||
|
Forward Currency Contracts* |
$ |
— |
|
$ |
(885,701 |
) |
$ |
— |
$ |
(885,701 |
) |
||||
|
Futures Contracts* |
|
0 |
(a) |
|
— |
|
|
— |
|
0 |
(a) |
||||
|
Total Other Financial Instruments |
$ |
0 |
(a) |
$ |
(885,701 |
) |
$ |
— |
$ |
(885,701 |
) |
||||
____________
* The fair value of the Fund’s investment represents the unrealized appreciation (depreciation) as of December 31, 2025.
(a) Rounds to zero.
|
2025 Annual Report |
61 |
|
OAKTREE DIVERSIFIED INCOME FUND INC. December 31, 2025 |
The Fund used valuation approaches consistent with the income approach and market approach to determine fair value of certain Level 3 assets as of December 31, 2025. The valuation methodologies utilized by the Fund included discounted cash flows analysis, recent transaction analysis, market yield analysis and market comparable analysis and are described below.
The discounted cash flows analysis utilizes a discounted cash flow method that incorporates expected timing and level of cash flows, as well as assumptions in determining growth rates, income and expense projections, discount rates, capital structure, terminal values and other factors. The applicability and weight assigned to the income technique is determined based on the availability of reliable projections and comparable companies and transactions.
The recent transaction analysis utilizes recent or expected future transactions of the investment to determine fair value, to the extent applicable.
The market yield analysis utilizes expected future cash flows, discounted using estimated current market rates. Discounted cash flow calculations may be adjusted to reflect current market conditions and/or the perceived credit risk of the borrowers. Consideration is also given to a borrower’s ability to meet principal and interest obligations; this may include an evaluation of collateral or the underlying value of the borrower, utilizing either the market or income techniques.
The market comparable analysis utilizes valuations of comparable public companies or transactions and generally seeks to establish the enterprise value of the portfolio company using a market multiple technique. This technique takes into account a specific financial measure (such as earnings before interest, taxes, depreciation and amortization (“EBITDA”), adjusted EBITDA, free cash flow, net operating income, net income, book value or net asset value) believed to be most relevant for the given company. Consideration may also be given to such factors as acquisition price of the security, historical and projected operational and financial results for the portfolio company, the strengths and weaknesses of the portfolio company relative to its comparable companies, industry trends, general economic and market conditions and other factors deemed relevant. The applicability and weight assigned to the market technique is determined based on the availability of reliable projections and comparable companies and transactions.
The Fund may estimate the fair value of privately held warrants using a Black Scholes pricing model, which includes an analysis of various factors and subjective assumptions, including the current stock price (by using an enterprise value analysis as described above), the expected period until exercise, expected volatility of the underlying stock price, expected dividends and the risk-free rate. Changes in the subjective input assumptions can materially affect the fair value estimates.
The fair value of the Fund’s credit facility, which qualifies as a financial instrument under ASC Topic 825, Disclosures about Fair Values of Financial Instruments, approximates the carrying amount of $99,500,000 for the credit facility presented in the Consolidated Statement of Assets and Liabilities. As of December 31, 2025, this financial instrument is categorized as Level 2 within the disclosure hierarchy.
|
62 |
|
|
OAKTREE DIVERSIFIED INCOME FUND INC. December 31, 2025 |
The table below shows the significant unobservable valuation inputs that were used by the Adviser’s Valuation Committee to fair value the Level 3 investments as of December 31, 2025.
Quantitative Information about Level 3 Fair Value Measurement
|
|
Value as of |
Valuation |
Valuation |
Unobservable |
Amount or |
Impact to |
|||||||
|
Corporate Credit |
|
||||||||||||
|
Senior Loans (Syndicated) |
$ |
1,816,376 |
Income Approach |
Discounted Cash Flow |
Yield (Discount Rate of Cash Flows) |
19.0%-22.0% |
Decrease |
||||||
|
|
Market Approach |
Comparable Companies |
Earnings Multiple |
1.5x-1.7x |
Increase |
||||||||
|
Private Credit |
|
||||||||||||
|
Senior Loans |
$ |
90,411,324 |
Income Approach |
Discounted Cash Flow |
Yield (Discount Rate of Cash Flows) |
5.0%-28.0% |
Decrease |
||||||
|
|
Market Approach |
Comparable Companies |
Earnings Multiple |
1.5x-1.8x |
Increase |
||||||||
|
Senior Loans (Syndicated) |
$ |
8,076,632 |
Income Approach |
Discounted Cash Flow |
Yield (Discount Rate of Cash Flows) |
8.0%-14.0% |
Decrease |
||||||
|
Preferred Stock |
$ |
3,245,855 |
Income Approach |
Discounted Cash Flow |
Yield (Discount Rate of Cash Flows) |
11.0%-21.0% |
Decrease |
||||||
|
Private Placement Equity |
$ |
2,168,448 |
Market Approach |
Comparable Companies |
Earnings Multiple |
5.8x-7.8x |
Increase |
||||||
|
|
Income Approach |
Discounted Cash Flow |
Yield (Discount Rate of Cash Flows) |
10.0%-12.0% |
Decrease |
||||||||
|
|
Asset-Based Approach |
Recent Transaction |
Recent Transaction Price |
— |
Increase |
||||||||
|
Warrants |
$ |
176,896 |
Other |
Black Scholes |
Volatility |
75.0%-120.0% |
Increase |
||||||
|
Structured Credit |
|
||||||||||||
|
Asset-Backed Securities |
$ |
3,811,598 |
Market Approach |
Market Comparables |
Market Quotes |
$97.6-$100.3 |
Increase |
||||||
|
|
Income Approach |
Discounted Cash Flow |
Yield (Discount Rate of Cash Flows) |
2.0%-12.0% |
Decrease |
||||||||
|
Commercial Mortgage-Backed Securities |
$ |
34,678 |
Market Approach |
Market Comparables |
Market Quotes |
$0.1-$32.5 |
Increase |
||||||
|
Emerging Markets |
|
||||||||||||
|
High Yield |
$ |
473,524 |
Asset-Based Approach |
Recent Transaction |
Recent Transaction Price |
— |
Increase |
||||||
|
Total |
$ |
110,215,331 |
|||||||||||
____________
(1) The impact represents the expected directional change in the fair value of the Level 3 investments that would result from an increase in the corresponding input. A decrease to the unobservable input would have the opposite effect. Significant changes in these inputs could result in significantly higher or lower fair value measurements.
|
2025 Annual Report |
63 |
|
OAKTREE DIVERSIFIED INCOME FUND INC. December 31, 2025 |
The following is a reconciliation of the assets in which significant unobservable inputs (Level 3) were used in determining fair value:
|
|
Corporate |
Structured |
Private |
Emerging |
Total |
|||||||||||||||
|
Balance as of December 31, 2024 |
$ |
2,902,688 |
|
$ |
1,702,777 |
|
$ |
77,836,993 |
|
$ |
— |
|
$ |
82,442,458 |
|
|||||
|
Accrued discounts (premiums) |
|
14,056 |
|
|
22,765 |
|
|
146,454 |
|
|
1,099 |
|
|
184,374 |
|
|||||
|
Realized gain (loss) |
|
(299,582 |
) |
|
2,494 |
|
|
95,238 |
|
|
7,722 |
|
|
(194,128 |
) |
|||||
|
Change in unrealized appreciation (depreciation) |
|
2,637 |
|
|
(69,103 |
) |
|
1,686,465 |
|
|
6,224 |
|
|
1,626,223 |
|
|||||
|
Purchases at cost/corporate actions |
|
339,516 |
|
|
655,594 |
|
|
47,666,688 |
|
|
987,955 |
|
|
49,649,753 |
|
|||||
|
Sales proceeds |
|
(1,142,939 |
) |
|
(158,239 |
) |
|
(23,352,683 |
) |
|
(529,476 |
) |
|
(25,183,337 |
) |
|||||
|
Transfers into Level 3 |
|
— |
|
|
1,689,988 |
|
|
|
|
|
— |
|
|
1,689,988 |
(1) |
|||||
|
Balance as of December 31, 2025 |
$ |
1,816,376 |
|
$ |
3,846,276 |
|
$ |
104,079,155 |
|
$ |
473,524 |
|
$ |
110,215,331 |
|
|||||
|
Change in unrealized appreciation (depreciation) for Level 3 assets still held at the reporting date |
$ |
(302,737 |
) |
$ |
(69,103 |
) |
$ |
1,642,144 |
|
$ |
6,224 |
|
$ |
1,276,528 |
|
|||||
____________
(1) Securities transferred into Level 3 at year end market value due to a decrease in observable inputs
For further information regarding the security characteristics of the Fund, see the Consolidated Schedule of Investments.
Investment Transactions and Investment Income: Securities transactions are recorded on trade date. Realized gains and losses from securities transactions are calculated on the identified cost basis. Interest income is recorded on the accrual basis. Discounts and premiums on securities are accreted and amortized on a daily basis using the effective yield to maturity and yield to next methods, respectively and might be adjusted based on management’s assessment of the collectability of such interest. Dividend income is recorded on the ex-dividend date.
Foreign Currency Transactions: Securities and other assets and liabilities denominated in foreign currencies are translated into U.S. dollar amounts at the date of valuation. Purchases and sales of securities and income and expense items denominated in foreign currencies are translated into U.S. dollar amounts on the respective dates of such transactions. The Fund does not isolate the portion of gains or losses resulting from changes in foreign exchange rates on securities from the fluctuations arising from changes in market prices.
Reported net realized foreign exchange gains or losses arise from sales of securities, currency gains or losses realized between the trade and settlement dates on securities transactions and the difference between the amounts of dividends, interest and foreign withholding taxes recorded on the Fund’s books and the U.S. dollar equivalent of the amounts actually received or paid.
Expenses: Expenses directly attributable to the Fund are charged directly to the Fund, while expenses that are attributable to the Fund and other investment companies advised by the Adviser or its affiliates are allocated among the respective investment companies, including the Fund, based either upon relative average net assets, evenly, or a combination of average net assets and evenly.
Certain intermediaries such as banks, broker-dealers, financial advisers or other financial institutions charge a fee for sub-administration, sub-transfer agency and other shareholder services associated with shareholders whose shares are held in omnibus, other group accounts or accounts traded through registered securities clearing agents. The portion of this fee paid by the Fund is included within “Transfer agent fees” in the Consolidated Statement of Operations.
Distributions to Shareholders: The Fund declares and pays dividends quarterly from net investment income. To the extent these distributions exceed net investment income, they may be classified as return of capital. The Fund also pays distributions at least annually from its net realized capital gains, if any. Dividends and distributions are recorded on the ex-dividend date. All common shares have equal dividend and other distribution rights. A notice disclosing the source(s) of a distribution is provided after a payment is made from any source other than net investment income.
|
64 |
|
|
OAKTREE DIVERSIFIED INCOME FUND INC. December 31, 2025 |
This notice is available on the Adviser’s website at https://www.brookfieldoaktree.com/fund/oaktree-diversified-income-fund-inc. Any such notice is provided only for informational purposes in order to comply with the requirements of Section 19(a) of the 1940 Act and not for tax reporting purposes. The tax composition of the Fund’s distributions for each calendar year is reported on IRS Form 1099-DIV.
Dividends from net investment income and distributions from realized gains from investment transactions have been determined in accordance with Federal income tax regulations and may differ from net investment income and realized gains recorded by the Fund for financial reporting purposes. These differences, which could be temporary or permanent in nature, may result in reclassification of distributions; however, net investment income, net realized gains and losses and net assets are not affected.
When Issued, Delayed Delivery Securities and Forward Commitments: The Fund may enter into forward commitments for the purchase or sale of securities, including on a “when issued” or “delayed delivery” basis, in excess of customary settlement periods for the type of security involved. In some cases, a forward commitment may be conditioned upon the occurrence of a subsequent event, such as approval and consummation of a merger, corporate reorganization or debt restructuring (i.e., a when, as and if issued security). When such transactions are negotiated, the price is fixed at the time of the commitment, with payment and delivery taking place in the future, generally a month or more after the date of the commitment. While it will only enter into a forward commitment with the intention of actually acquiring the security, the Fund may sell the security before the settlement date if it is deemed advisable. Securities purchased under a forward commitment are subject to market fluctuation, and no interest (or dividends) accrues to the Fund prior to the settlement date. The Fund will segregate with its custodian cash or liquid securities in an aggregate amount at least equal to the amount of its outstanding forward commitments.
Investments in Real Estate: The Fund may invest a portion of its assets in public and/or private debt investments and other real estate assets or real estate-related securities and obligations. The value of these debt investments and whether and to what extent such investments perform as expected will depend, in part, on the prevailing conditions in the market for real estate investment generally and, in particular, on the value of the underlying real estate asset collateral or real estate-related companies to which such debt investments relate. The real estate industry is cyclical in nature, and a deterioration of real estate fundamentals in the markets in which the Fund invests will have an adverse effect on the performance of the Fund’s investments. The value of real estate assets and real estate-related investments can fluctuate for various reasons. Real estate values can be seriously affected by interest rate fluctuations, changes in general and local economic conditions, bank liquidity, the availability of financing, changes in environmental and zoning laws, overbuilding and increased competition, changes in supply and demand fundamentals, an increase in property taxes, casualty or condemnation losses, bankruptcy or financial difficulty of a major tenant, regulatory limitations on rent, increased mortgage defaults and the availability of mortgage funds which may render the sale or refinancing of properties difficult or impracticable. Reductions in value or cash flow could impair the Fund’s ability to make distributions to Common Shareholders, adversely impact its ability to effectively achieve its investment objective and reduce overall returns on investments.
Investments in Real Estate Loans: While the Fund intends to invest primarily in “performing” real estate debt securities, real estate loans underlying the securities acquired by the Fund may be non-performing at the time of their acquisition and/or may become non-performing following their acquisition for a wide variety of reasons. Such non-performing real estate loans may require a substantial amount of workout negotiations and/or restructuring, which may entail, among other things, a substantial reduction in the interest rate and a substantial writedown of the principal of such loan. However, even if a restructuring were successfully accomplished, a risk exists that, upon maturity of such real estate loan, replacement “takeout” financing will not be available. Purchases of participations in real estate loans raise many of the same risks as investments in real estate loans and also carry risks of illiquidity and lack of control.
Collateralized Loan Obligations (“CLOs”): The Fund may invest in CLOs and other securitizations, which are generally limited recourse obligations of the issuer (“Securitization Vehicles”) payable solely from the underlying assets (“Securitization Assets”) of the issuer or proceeds thereof. Holders of equity or other securities issued by Securitization Vehicles must rely solely on distributions on the Securitization Assets or proceeds thereof for payment in respect thereof. Consequently, the Fund will typically not have any direct rights against the issuer of, or the entity that sold, assets underlying the securitization. The Securitization Assets may include, without limitation, broadly syndicated leverage loans, middle-market bank loans, CDO debt tranches, trust preferred securities, insurance
|
2025 Annual Report |
65 |
|
OAKTREE DIVERSIFIED INCOME FUND INC. December 31, 2025 |
surplus notes, asset-backed securities, mortgages, REITs, high-yield bonds, mezzanine debt, second-lien leverage loans, credit default swaps and emerging market debt and corporate bonds, which are subject to liquidity, market value, credit, interest rate, reinvestment and certain other risks.
The Fund operates as a single operating segment. The Fund’s income, expenses, assets, and performance are regularly monitored and assessed as a whole by the President of the Fund, who is responsible for the oversight functions of the Fund, using the information presented in the consolidated financial statements and consolidated financial highlights.
The Fund adopted Financial Accounting Standards Board Update 2023-09, Income Taxes (Topic 740) — Improvements to Income Tax Disclosures (“ASU 2023-09”) during the period. ASU 2023-09 enhances income tax disclosures, including disclosures of income taxes paid disaggregated by jurisdiction. The Fund’s adoption of the new standard did not have a material impact on financial statement disclosures and did not affect the Fund’s financial position or results of operations.
3. Derivative Financial Instruments
The Fund may purchase and sell derivative instruments such as exchange-listed and over-the counter put and call options on securities, financial futures, equity, fixed-income and interest rate indices, and other financial instruments. It may purchase and sell financial futures contracts and options thereon. Moreover, the Fund may enter into various interest rate transactions such as swaps, caps, floors or collars and enter into various currency transactions such as forward currency contracts, currency futures contracts, currency swaps or options on currency or currency futures or credit transactions and credit default swaps. The Fund may also purchase derivative instruments that combine features of several of these instruments. The Fund may invest in, or enter into, derivatives for a variety of reasons including to hedge certain market risks, to provide a substitute for purchasing or selling particular securities or to increase potential income gain.
Forward Currency Contracts: A forward currency contract (“forward contract”) is an agreement between two parties to buy or sell a currency at an agreed upon price for settlement at a future date. During the period the forward contract is in existence, changes in the value of the forward contract will fluctuate with changes in the currency exchange rates. The forward contract is marked to market daily and these changes are recorded as an unrealized gain or loss. Gain or loss on the purchase or sale of a forward contract is realized on the settlement date.
The Fund invests in forward contracts to hedge against fluctuations in the value of foreign currencies caused by changes in the prevailing currency exchange rates. The use of forward contracts involves the risk that the counterparties may be unable to meet the terms of their contracts and may be negatively impacted from unanticipated movements in the value of a foreign currency relative to the U.S. dollar.
The average quarterly U.S. dollar value of forward currency contracts to be delivered or received during the year ended December 31, 2025 was $113,618,028, which represents the volume of activity during the year.
Financial Futures Contracts: A futures contract is an agreement between two parties to buy and sell a financial instrument for a set price on a future date. Initial margin deposits are made upon entering into futures contracts and can be either cash or securities. During the period the futures contract is open, changes in the value of the contract are recognized as unrealized gains or losses by “marking-to-market” on a daily basis to reflect the market value of the contract at the end of each day’s trading. Variation margin payments are made or received, depending upon whether unrealized gains or losses are incurred. When the contract is closed, the Fund records a realized gain or loss equal to the difference between the proceeds from (or cost of) the closing transaction and the Fund’s basis in the contract.
The Fund invests in financial futures contracts to hedge against fluctuations in the value of portfolio securities caused by changes in prevailing market interest rates. Should interest rates move unexpectedly, the Fund may not achieve the anticipated benefits of the financial futures contracts and may realize a loss. The use of futures transactions involves the risk of imperfect correlation in movements in the price of futures contracts, interest rates and the underlying hedged assets. The Fund is at risk that it may not be able to close out a transaction because of an illiquid market.
|
66 |
|
|
OAKTREE DIVERSIFIED INCOME FUND INC. December 31, 2025 |
The average quarterly notional value of long and short futures contracts outstanding during the year ended December 31, 2025 were $38,563,899 and $(7,060,319), respectively, which represents the volume of activity during the year.
Credit Default Swap Agreements: Credit default swap agreements may involve greater risks than if the Fund had invested in the reference obligation directly since, in addition to general market risks, credit default swaps are subject to illiquidity risk, counterparty risk and credit risk. A buyer generally also will lose its investment and recover nothing should no credit event occur and the swap is held to its termination date. If a credit event were to occur, the value of any deliverable obligation received by the seller (if any), coupled with the upfront or periodic payments previously received, may be less than the full notional value it pays to the buyer, resulting in a loss of value to the seller. When the Fund acts as a seller of a credit default swap, it is exposed to many of the same risks of leverage described herein since if an event of default occurs, the seller must pay the buyer the full notional value of the reference obligation.
Although the Fund may seek to realize gains by selling credit default swaps that increase in value, to realize gains on selling credit default swaps, an active secondary market for such instruments must exist or the Fund must otherwise be able to close out these transactions at advantageous times. In addition to the risk of losses described above, if no such secondary market exists or the Fund is otherwise unable to close out these transactions at advantageous times, selling credit default swaps may not be profitable for the Fund.
The average monthly notional value of swap contracts outstanding during the year ended December 31, 2025 was $123,077, which represents the volume of activity during the year.
The following table sets forth the fair value of the Fund’s derivative instruments:
|
Derivatives |
Consolidated Statement of Assets and Liabilities |
Value as of December 31, |
||||
|
Forward currency contracts |
Unrealized appreciation on forward currency contracts (assets) |
$ |
60,234 |
|
||
|
Forward currency contracts |
Unrealized depreciation on forward currency contracts (liabilities) |
|
(885,701 |
) |
||
|
Futures contracts |
Variation margin on futures contracts (liabilities) |
|
(3,328 |
) |
||
|
Credit default swap contracts |
Premiums paid for swap contracts (assets) |
|
1,580,235 |
|
||
|
Credit default swap contracts |
Unrealized appreciation on swap contracts (assets) |
|
24,385 |
|
||
The following table sets forth the effect of derivative instruments on the Consolidated Statement of Operations for the year ended December 31, 2025:
|
Derivatives |
Location of Gains (Losses) on |
Net Realized Gain (Loss) |
Net Change in |
|||||||
|
Forward currency contracts |
Forward currency contracts |
$ |
(1,616,863 |
) |
$ |
(3,507,796 |
) |
|||
|
Futures contracts |
Futures contracts |
|
27,239 |
|
|
73,567 |
|
|||
|
Credit default swap contracts |
Swap contracts |
|
(19,765 |
) |
|
24,385 |
|
|||
The Fund has not offset derivative assets and liabilities or financial assets, including cash, that may be received or paid as part of collateral arrangements. There is no enforceable master netting agreement in place that provides the Fund, in the event of counterparty default, the right to liquidate collateral and the right to offset a counterparty’s rights and obligations.
|
2025 Annual Report |
67 |
|
OAKTREE DIVERSIFIED INCOME FUND INC. December 31, 2025 |
Below is the gross and net information about instruments and transactions eligible for offset in the Consolidated Statement of Assets and Liabilities as well as instruments and transactions subject to an agreement similar to a master netting arrangement:
|
Collateral |
|||||||||||||||||
|
|
Gross |
Gross |
Net Amounts |
Non-Cash |
Collateral |
Net Amount |
|||||||||||
|
Assets: |
|
|
|
|
|
||||||||||||
|
Forward currency contracts |
$ |
60,234 |
$ — |
$ |
60,234 |
|
$ — |
$ — |
$ |
60,234 |
|
||||||
|
Swap contracts |
$ |
24,385 |
$ — |
$ |
24,385 |
|
$ — |
$ — |
$ |
24,385 |
|
||||||
|
Liabilities: |
|
|
|
|
|
||||||||||||
|
Forward currency contracts |
$ |
885,701 |
$ — |
$ |
(885,701 |
) |
$ — |
$ — |
$ |
(885,701 |
) |
||||||
4. Investment Advisory Agreement and Transactions with Related Parties
The Fund has entered into an Investment Advisory Agreement (the “Advisory Agreement”) with the Adviser under which the Adviser is responsible for the management of the Fund’s portfolio and provides the necessary personnel, facilities, equipment and certain other services necessary to the operations of the Fund. The Advisory Agreement provides that the Fund shall pay the Adviser a monthly fee for its services at an annual rate of 1.25% of the Fund’s average daily net assets plus the amount of borrowing for investment purposes (“Managed Assets”).
Pursuant to an operating expense limitation agreement (the “Expense Limitation Agreement”), the Adviser has contractually agreed to waive all or a portion of its investment advisory fees and/or to reimburse certain expenses of the Fund, including organizational expenses and offering costs, to the extent necessary to maintain the Total Annual Fund Operating Expenses After Fee Waiver and/or Expense Reimbursement (excluding any front-end or contingent deferred sales loads, brokerage commissions and other transactional expenses, acquired fund fees and expenses, interest (including, “Interest Payments on Borrowed Funds”), taxes, and extraordinary expenses, such as litigation; and other expenses not incurred in the ordinary course of the Fund’s business) at no more than 2.10% for Class D shares and 2.85% for Class T shares, Class A shares and Class U shares. The Expense Limitation Agreement will continue until at least April 30, 2026 and may not be terminated by the Fund or the Adviser before such time. Thereafter, the Expense Limitation Agreement may only be terminated or amended to increase the expense cap, provided that in the case of a termination by the Adviser, the Adviser will provide the Board with written notice of its intention to terminate the arrangement prior to the expiration of its then current term. Any waivers and/or reimbursements made by the Adviser are subject to recoupment from the Fund for a period not to exceed three years after the occurrence of the waiver and/or reimbursement, provided that the Fund may only make repayments to the Adviser if such repayment does not cause the Fund’s expense ratio (after the repayment is taken into account) to exceed the lesser of: (1) the expense cap in place at the time such amounts were waived; and (2) the Fund’s current expense cap.
The amount of investment advisory fees waived and/or expenses reimbursed available to be recouped before expiration is $365,878, of which $110,149 and $255,729, will expire during the fiscal years ending December 31, 2027 and December 31, 2028, respectively. For the year ended December 31, 2025, the Adviser waived fees of $255,729 and recouped previously waived eligible expenses of $182,887, for a net expense reimbursement of $72,842 which is reflected on the Fund’s Consolidated Statement of Operations.
The Fund has entered into an administration agreement (“Administration Agreement”) with the Administrator and a sub-administration agreement with U.S. Bancorp Fund Services, LLC, doing business as U.S. Bank Global Fund Services (the “Sub-Administrator”). The Administrator and the Sub-Administrator perform administrative services necessary for the operation of the Fund, including maintaining certain books and records of the Fund and preparing reports and other documents required by federal, state and other applicable laws and regulations, and providing the Fund with administrative office facilities. The Adviser is responsible for any fees due to the Administrator and the Fund is responsible for any fees due to the Sub-Administrator.
|
68 |
|
|
OAKTREE DIVERSIFIED INCOME FUND INC. December 31, 2025 |
Certain officers and/or directors of the Fund are officers and/or employees of the Administrator.
5. Purchases and Sales of Investments
For the year ended December 31, 2025, purchases and sales of investments (including principal payups and paydowns), excluding short-term securities and U.S. government securities, were $200,079,653 and $161,981,713, respectively.
For the year ended December 31, 2025, there were no purchases and sales of long-term U.S. Government securities.
6.
Prior to December 5, 2025, the Fund had established a Senior Secured Revolving Credit Facility (the “Credit Facility”) in the aggregate principal amount of up to $
Effective December 5, 2025, the Fund has established a Credit Facility with PNC Bank, National Association for investment purposes subject to the limitations of the 1940 Act for borrowings by registered investment companies. The new Credit Facility stated maturity date is December 3, 2027. The maximum line of credit as of December 31, 2025 for the Fund is $125,000,000. The Fund pays interest in the amount of Base Rate as defined in the Credit Facility agreement plus 0.25% on Base Rate Loans or Adjusted Term SOFR Rate plus 1.25% on SOFR Loans on the amount outstanding and (i) 0.35% commitment fees if the average daily unused amount is greater or equal to 50% of the maximum amount or (ii) 0.25% commitment fees if the average daily unused amount is less than 50% of the maximum amount.
For the year ended December 31, 2025, the Fund amortized $217,502 in deferred debt issuance costs and is included in the interest expense on credit facility line on the Fund’s Consolidated Statement of Operations.
As of December 31, 2025, the Fund had outstanding borrowings of $99,500,000. For the year ended December 31, 2025, the components of interest and unused commitment fees expense, average stated interest rates (i.e., rate in effect plus the spread) and average outstanding balances for the Credit Facility were as follows:
|
Stated interest expense |
$ |
5,017,395 |
|
|
Unused commitment fees |
|
67,723 |
|
|
Amortization of debt issuance costs |
|
217,502 |
|
|
Total interest expense and credit facility fees |
$ |
5,302,620 |
|
|
Average stated interest rate |
|
6.02% |
|
|
Average outstanding balance |
$ |
82,157,534 |
According to terms of the Credit Facility agreement, the Fund is required to comply with various covenants, reporting requirements and other customary requirements for similar revolving credit facilities, including, without limitation, covenants related to maintaining a ratio of total assets (less total liabilities other than senior securities representing indebtedness) to senior securities representing indebtedness of the Fund of not less than 300%. These covenants are subject to important limitations and exceptions that are described in the documents governing the Credit Facility. As of December 31, 2025, the Fund was in compliance with the terms of the Credit Facility.
|
2025 Annual Report |
69 |
|
OAKTREE DIVERSIFIED INCOME FUND INC. December 31, 2025 |
7. Capital Shares
The Charter authorizes the Fund to issue up to 1,000,000,000 shares of
All common shares offered will be, upon issuance, duly authorized, fully paid and nonassessable.
8. Repurchase Offers
As a continuously offered, closed-end interval fund, the Fund has adopted a fundamental investment policy to make offers to repurchase Shares in order to provide liquidity to shareholders. No shareholder will have the right to require the Fund to repurchase its Shares, except as permitted by the Fund’s interval fund structure. No public market for the Shares exists, and none is expected to develop in the future. Consequently, shareholders generally will not be able to liquidate their investment other than as a result of repurchases of their Shares by the Fund, and then only on a limited basis.
The Fund has adopted, pursuant to Rule 23c-3 under the 1940 Act, a fundamental policy, which cannot be changed without shareholder approval, requiring the Fund to offer to repurchase at least 5% and up to 25% of its Shares at NAV on a quarterly basis.
During the year ended December 31, 2025, the Fund completed four quarterly repurchase offers in which the Fund offered to repurchase up to 10% of its outstanding shares. The results of the repurchase offers were as follows:
|
|
Repurchase Offer #1 |
Repurchase Offer #2 |
Repurchase Offer #3 |
Repurchase Offer #4 |
||||
|
Commencement Date |
January 6, 2025 |
April 7, 2025 |
July 7, 2025 |
October 6, 2025 |
||||
|
Repurchase Request Deadline |
February 10, 2025 |
May 12, 2025 |
August 11, 2025 |
November 10, 2025 |
||||
|
Repurchase Pricing Date |
February 10, 2025 |
May 12, 2025 |
August 11, 2025 |
November 10, 2025 |
||||
|
Dollar Amount Repurchased |
$2,396,464 |
$8,453,961 |
$4,166,584 |
$19,316,494 |
||||
|
Shares Repurchased |
259,077 |
929,007 |
453,876 |
2,122,692 |
9. Federal Income Tax Information
The Fund intends to meet the requirements of the Internal Revenue Code of 1986, as amended, applicable to regulated investment companies and to distribute substantially all of its taxable income to its shareholders. Therefore, no federal income or excise tax provision is required. The Fund may incur an excise tax to the extent it has not distributed all of its taxable income on a calendar year basis.
|
70 |
|
|
OAKTREE DIVERSIFIED INCOME FUND INC. December 31, 2025 |
GAAP provides guidance for how uncertain tax positions should be recognized, measured, presented and disclosed in the financial statements. An evaluation of tax positions taken in the course of preparing the Fund’s tax returns to determine whether the tax positions are “more-likely-than-not” of being sustained by the taxing authority is required. Tax benefits of positions not deemed to meet the more-likely-than-not threshold would be booked as a tax expense in the current year and recognized as: a liability for unrecognized tax benefits; a reduction of an income tax refund receivable; a reduction of a deferred tax asset; an increase in a deferred tax liability; or a combination thereof. As of December 31, 2025, the Fund has determined that there are no uncertain tax positions or tax liabilities required to be accrued.
The Fund has reviewed the taxable years open for examination (i.e. not barred by the applicable statute of limitations) by taxing authorities of all major jurisdictions, including the Internal Revenue Service. As of December 31, 2025, open taxable periods consisted of the taxable periods ended December 31, 2022 through December 31, 2025. No examination of the Fund’s tax returns is currently in progress.
Income and capital gain distributions are determined in accordance with federal income tax regulations, which may differ from GAAP.
The tax character of distributions paid for the periods shown below were as follows:
|
Year Ended |
Year Ended |
|||||
|
Ordinary income |
$ |
24,717,609 |
$ |
22,828,124 |
||
|
Return of capital |
|
3,709,846 |
|
— |
||
|
Total |
$ |
28,427,455 |
$ |
22,828,124 |
||
At December 31, 2025, the Fund’s most recently completed tax year-end, the components of net assets (excluding paid-in capital) on a tax basis were as follows:
|
Capital loss carryforwards(1) |
$ |
(9,960,989 |
) |
|
|
Distributable earnings |
|
— |
|
|
|
Late year ordinary losses |
|
(1,154,337 |
) |
|
|
Other accumulated gains |
|
27,641 |
|
|
|
Tax basis unrealized appreciation on investments and foreign currency |
|
1,305,210 |
|
|
|
Total tax basis net accumulated losses |
$ |
(9,782,475 |
) |
____________
(1) To the extent that future capital gains are offset by capital loss carryforwards, such gains will not be distributed.
As of December 31, 2025, the Fund had short-term and long-term capital loss carryforwards of $3,352,533 and $6,608,456, respectively. The capital loss carryforwards will not expire. During the taxable year ended December 31, 2025, the Fund did not utilize any capital loss carryforwards.
Federal Income Tax Basis: The federal income tax basis of the Fund’s investments, not including foreign currency translations, at December 31, 2025 was as follows:
|
Cost of Investments |
Gross Unrealized Appreciation |
Gross Unrealized Depreciation |
Net Unrealized Appreciation |
|||
|
$408,921,346 |
$13,162,343 |
$(11,857,133) |
$1,305,210 |
Capital Account Reclassifications: Because federal income tax regulations differ in certain respects from GAAP, income and capital gain distributions, if any, determined in accordance with tax regulations may differ from net investment income and realized gains recognized for financial reporting purposes. These differences are primarily due to differing treatments for Section 988 currency. Permanent book and tax differences, if any, will result in reclassifications to paid-in capital or to undistributed capital gains. These reclassifications have no effect on net assets or NAV per share. Any undistributed net income and realized gain remaining at fiscal year end is distributed in the following year.
|
2025 Annual Report |
71 |
|
OAKTREE DIVERSIFIED INCOME FUND INC. December 31, 2025 |
10.Indemnifications, Commitments and Contingencies
Under the Fund’s organizational documents, its officers and directors are indemnified against certain liabilities arising out of the performance of their duties to the Fund. In addition, in the normal course of business, the Fund enters into contracts with its vendors and others that provide for indemnification. The Fund’s maximum exposure under these arrangements is unknown, since this would involve the resolution of certain claims, as well as future claims that may be made, against the Fund. Thus, an estimate of the financial impact, if any, of these arrangements cannot be made at this time. However, based on experience, the Fund expects the risk of loss due to these warranties and indemnities to be unlikely.
In conjunction with the ownership of senior loans, the Fund is party to certain credit agreements, which may require the Fund to extend additional loans to investee companies. Commitments to extend credit include loan proceeds the Fund is obligated to advance, such as delayed draws or revolving credit arrangements. Commitments generally have fixed expiration dates or other termination clauses. Unrealized gains or losses associated with unfunded commitments are recorded in the consolidated financial statements and reflected as an adjustment to the fair value of the related security in the Consolidated Schedule of Investments. The par amount of the unfunded commitments is not recognized by the Fund until it becomes funded. The Fund uses the same investment criteria in making these commitments as it does in making investments. The unfunded liability associated with these credit agreements is equal to the amount by which the contractual loan commitment exceeds the sum of the amount of funded debt and cash held in escrow, if any.
11.Subsequent Events
GAAP requires recognition in the financial statements of the effects of all subsequent events that provide additional evidence about conditions that existed at the date of the Consolidated Statement of Assets and Liabilities. For non-recognized subsequent events that must be disclosed to keep the financial statements from being misleading, the Fund is required to disclose the nature of the event as well as an estimate of its financial effect, or a statement that such an estimate cannot be made.
The Fund completed a quarterly repurchase offer in which the Fund offered to repurchase a portion of its outstanding shares on February 9, 2026. The result of the repurchase offer was as follows:
|
Repurchase Offer |
||
|
Commencement Date |
January 5, 2026 |
|
|
Repurchase Request Deadline |
February 9, 2026 |
|
|
Repurchase Pricing Date |
February 9, 2026 |
|
|
Dollar Amount Repurchased |
$33,045,985 |
|
|
Shares Repurchased |
3,647,460 |
Management has evaluated subsequent events in the preparation of the Fund’s consolidated financial statements through the date the financial statements were issued and has determined that there are no additional events that require recognition or disclosure in the consolidated financial statements.
|
72 |
|
To the shareholders and the Board of Directors of Oaktree Diversified Income Fund Inc.
Opinion on the Financial Statements and Financial Highlights
We have audited the accompanying consolidated statement of assets and liabilities of Oaktree Diversified Income Fund Inc. and subsidiary (the “Fund”), including the consolidated schedule of investments, as of December 31, 2025, the related consolidated statements of operations and cash flows for the year then ended, consolidated statements of changes in net assets for each of the two years in the period then ended, consolidated financial highlights for the years ended December 31, 2025, 2024, 2023, 2022, and for the period from November 1, 2021 (commencement of operations) through December 31, 2021, and the related notes to the consolidated financial statements (collectively referred to as the “financial statements and financial highlights”). In our opinion, the financial statements and financial highlights present fairly, in all material respects, the financial position of the Fund as of December 31, 2025, and the results of its operations and its cash flows for the year then ended, the changes in its net assets for each of the two years in the period then ended, and the financial highlights for the years ended December 31, 2025, 2024, 2023, 2022, and for the period from November 1, 2021 (commencement of operations) through December 31, 2021 in conformity with accounting principles generally accepted in the United States of America.
Basis for Opinion
These financial statements and financial highlights are the responsibility of the Fund’s management. Our responsibility is to express an opinion on the Fund’s financial statements and financial highlights based on our audits. We are a public accounting firm registered with the Public Company Accounting Oversight Board (United States) (PCAOB) and are required to be independent with respect to the Fund in accordance with the U.S. federal securities laws and the applicable rules and regulations of the Securities and Exchange Commission and the PCAOB.
We conducted our audits in accordance with the standards of the PCAOB. Those standards require that we plan and perform the audit to obtain reasonable assurance about whether the financial statements and financial highlights are free of material misstatement, whether due to error or fraud. The Fund is not required to have, nor were we engaged to perform, an audit of its internal control over financial reporting. As part of our audits we are required to obtain an understanding of internal control over financial reporting but not for the purpose of expressing an opinion on the effectiveness of the Fund’s internal control over financial reporting. Accordingly, we express no such opinion.
Our audits included performing procedures to assess the risks of material misstatement of the financial statements and financial highlights, whether due to error or fraud, and performing procedures that respond to those risks. Such procedures included examining, on a test basis, evidence regarding the amounts and disclosures in the financial statements and financial highlights. Our audits also included evaluating the accounting principles used and significant estimates made by management, as well as evaluating the overall presentation of the financial statements and financial highlights. Our procedures included confirmation of securities owned as of December 31, 2025, by correspondence with the custodian, agent banks and brokers; when replies were not received from agent banks and brokers, we performed other auditing procedures. We believe that our audits provide a reasonable basis for our opinion.
Deloitte & Touche LLP
Chicago, Illinois
February 27, 2026
We have served as the auditor of one or more Brookfield Public Securities Group LLC’s investment companies since 2011.
|
2025 Annual Report |
73 |
For the year ended December 31, 2025, certain dividends paid by the Fund may be subject to a maximum tax rate of 23.8%, as provided for by the Tax Cuts and Jobs Act of 2017. The percentage of dividends declared from ordinary income designated as qualified dividend income was 0.00%.
For corporate shareholders, the percent of ordinary income distributions qualifying for the corporate dividends received deduction for the fiscal year ended December 31, 2025 was 0.00%.
The percentage of taxable ordinary income distributions that are designated as short-term capital gain distributions under Internal Revenue Section 871(k)(2)(C) was 0.00%.
|
74 |
|
MANAGEMENT OF THE FUND
Directors and Officers
The business and affairs of the Fund are managed under the direction of the Board of Directors. The Board of Directors approves all significant agreements between the Fund and the companies that furnish the Fund with services, including agreements with the Adviser, the Fund’s Custodian and the Fund’s Transfer Agent. The day-to-day operations of the Fund are delegated to the Adviser, subject to the supervision of the Board of Directors.
The names and business addresses of the Directors and principal officers of the Fund are set forth in the following table, together with their positions and their principal occupations during the past five years and, in the case of the Directors, their positions with certain other organizations and companies.
|
Name, position(s), |
Term of office and |
Number of funds |
Principal occupation(s) |
Other directorships held |
||||
|
INDEPENDENT DIRECTORS:(5) |
||||||||
|
Edward A. Kuczmarski Born: 1949 |
Since inception (2021) |
9 |
Retired. |
Director/Trustee of the investment companies in the Fund Complex (2011-Present). |
||||
|
Stuart A. McFarland Born: 1947 |
Since inception (2021) |
9 |
Retired; Managing Partner of Federal City Capital Advisors (1997-2021). |
Director/Trustee of the investment companies in the Fund Complex (2006-Present); Director of Drive Shack Inc. (formerly, New Castle Investment Corp.) (2002-2023); Director of New America High Income Fund (2013-Present); Director of New Senior Investment Group, Inc. (2014-2021); Director of Steward Partners (2017-2020). |
||||
|
Heather S. Goldman Born: 1967 |
Since inception (2021) |
9 |
CFO of My Flex, Inc., an EQBR Holdings affiliate, developing and commercializing Web 3.0 blockchain technologies (2022-2023); Executive in Residence, Global Digital Finance (2025-Present). |
Director/Trustee of the investment companies in the Fund Complex (2013-Present). |
|
2025 Annual Report |
75 |
|
OAKTREE DIVERSIFIED INCOME FUND INC. |
|
Name, position(s), |
Term of office and |
Number of funds |
Principal occupation(s) |
Other directorships held |
||||
|
William H. Wright II Born: 1960 |
Since inception (2021) |
9 |
Retired. |
Director/Trustee of the investment companies in the Fund Complex (2020-Present); Director of the Carlyle Group, TCG BDC I, Inc. and TCG BDC II, Inc. and Carlyle Secured Lending III (2021-Present); Trustee of Doris Duke Charitable Foundation (2017-Present); Vestryman and Chairman of the Investment Committee of Trinity Church Wall Street (2022-Present); Director of Mount Sinai Health System (1998-Present); Director of New York City Ballet (2005-Present); Trustee and Treasurer of Historic Hudson Valley (2000-Present). |
||||
|
Betty A. Whelchel Born: 1956 |
Since January 1, 2024 |
9 |
Retired. |
Director/Trustee of the investment companies in the Fund Complex (2024-Present). |
||||
|
Susan Schauffert-Tam Born: 1968 |
Since November 20, 2024 |
9 |
Retired; Managing Director, BMO Capital Markets (1999-2024). |
Director/Trustee of the investment companies in the Fund Complex (2024-Present); Independent Director of Forum Asset Management Real Estate and Impact Fund and FMS Trust Fund (September 2025-Present). |
____________
(1) Address: Brookfield Place, 225 Liberty Street, 35th Floor, New York, New York, 10281, unless otherwise noted.
(2) The term of office of the Independent Directors is indefinite.
(3) The Fund Complex is comprised of the Fund, Brookfield Investment Funds (five series of underlying portfolios), Brookfield Infrastructure Income Fund Inc., Brookfield Real Assets Income Fund Inc. and Oaktree Asset-Backed Income Fund Inc.
(4) This column generally includes only directorships of companies required to report to the SEC under the 1934 Act (i.e., public companies), or other investment companies registered under the 1940 Act.
(5) Directors who are not considered to be “interested persons” of the Fund as defined in the 1940 Act are considered to be “Independent Directors.”
|
76 |
|
|
OAKTREE DIVERSIFIED INCOME FUND INC. |
|
Name, position(s), |
Term of office and |
Number of funds |
Principal occupation(s) |
Other directorships held |
||||
|
INTERESTED |
||||||||
|
Brian F. Hurley Born: 1977 |
Director since March 29, 2024; President since inception (2021) |
9 |
President of the investment companies in the Fund Complex, except Brookfield Infrastructure Income Fund Inc. (2014-Present); Secretary of Brookfield Infrastructure Income Fund Inc. (2023-Present); General Counsel of the Brookfield Public Securities Group LLC (“PSG”) (2017-2024); General Counsel of Brookfield Private Wealth, formerly Brookfield Oaktree Wealth Solutions (“Wealth”) (2021-Present); Managing Partner of Brookfield Asset Management Inc. (2016-Present). |
Director/Trustee of the investment companies in the Fund Complex (2024-Present). |
||||
|
Casey P. Tushaus Born: 1982 |
Since inception (2021) |
N/A |
Treasurer of the investment companies in the Fund Complex (2021-Present); Assistant Treasurer of the investment companies in the Fund Complex (2016-2021); Director of the Administrator (2021-Present); Vice President of the Administrator (2014-2021). |
N/A |
||||
|
Craig A. Ruckman Born: 1977 |
Since inception (2021) |
N/A |
Secretary of the investment companies in the Fund Complex, except for Brookfield Infrastructure Income Fund Inc. (2022-Present); Assistant Secretary of Brookfield Infrastructure Income Fund Inc. (2023-Present); Managing Director of the Adviser (2022-2024); Managing Director of Wealth (2025-Present); Director of Allianz Global Investors U.S. Holdings LLC (2016-2022); and Chief Legal Officer of Allianz Global Investors Distributors LLC (2019-2022). |
N/A |
|
2025 Annual Report |
77 |
|
OAKTREE DIVERSIFIED INCOME FUND INC. |
|
Name, position(s), |
Term of office and |
Number of funds |
Principal occupation(s) |
Other directorships held |
||||
|
Adam R. Sachs Born: 1984 |
Since inception (2021) |
N/A |
CCO of the investment companies in the Fund Complex (2017-Present); Director of the Administrator (2017-2024); Senior Vice President of Wealth (2025-Present); and CCO of Brookfield Investment Management (Canada) Inc. (2017-2023). |
N/A |
||||
|
Mohamed S. Rasul Born: 1981 |
Since inception (2021) |
N/A |
Assistant Treasurer of the investment companies in the Fund Complex (2016-Present); Vice President of the Administrator (2019-2024); Vice President of Wealth (2025-Present). |
N/A |
____________
(1) Address: Brookfield Place, 225 Liberty Street, 35th Floor, New York, New York, 10281, unless otherwise noted.
(2) Mr. Hurley will hold office as Director for an indefinite term until the earliest of: (i) the next meeting of stockholders, if any, called for the purpose of considering the election or re-election of Mr. Hurley and until the election and qualification of his successor, if any, elected at such meeting; or (ii) the date Mr. Hurley resigns or retires, or is removed by the Board or stockholders, in accordance with the Fund’s Charter and Bylaws. Each officer will hold office for an indefinite term or until the date he or she resigns or retires until his or her successor is elected and qualified.
(3) The Fund Complex is comprised of the Fund, Brookfield Investment Funds (five series of underlying portfolios), Brookfield Infrastructure Income Fund Inc., Brookfield Real Assets Income Fund Inc. and Oaktree Asset-Backed Income Fund Inc.
(4) This column generally includes only directorships of companies required to report to the SEC under the Securities and Exchange Act of 1934 (the “1934 Act”) (i.e., public companies) or other investment companies registered under the 1940 Act.
(5) Directors who are not considered to be “interested persons” of the Fund as defined in the 1940 Act are considered to be “Independent Directors.”
|
78 |
|
The Fund intends to distribute substantially all of its net investment income to shareholders in the form of dividends. The Fund intends to declare and pay distributions quarterly from net investment income. In addition, the Fund intends to distribute any net capital gains earned from the sale of portfolio securities to shareholders no less frequently than annually. Net short-term capital gains may be paid more frequently. Unless Common Shareholders specify otherwise, dividends will be reinvested in Shares of the Fund in accordance with the Fund’s dividend reinvestment plan. The Fund may pay distributions from sources that may not be available in the future and that are unrelated to the Fund’s performance, such as from offering proceeds and/or borrowings.
The Fund has adopted a Dividend Reinvestment Plan (the “Plan”) that provides that, unless Common Shareholders elect to receive their distributions in cash, they will be automatically reinvested by U.S. Bancorp Fund Services, LLC (the “Plan Administrator”), in additional Shares. If Common Shareholders elect to receive distributions in cash, they will receive them paid by check mailed directly to them by the Plan Administrator. The Plan Administrator can be contacted through mail by writing to U.S. Bancorp Fund Services, LLC, P.O. Box 701, Milwaukee, Wisconsin 53201-0701 or by phone at 1-855-862-5873.
Shares received under the Plan will be issued to Common Shareholders at their NAV on the ex-dividend date; there is no sales or other charge for reinvestment. Common Shareholders are free to withdraw from the Plan and elect to receive cash at any time by giving written notice to the Plan Administrator or by contacting the broker or dealer, who will inform the Fund.
The Plan Administrator provides written confirmation of all transactions in the shareholder accounts in the Plan, including information Common Shareholders may need for tax records. Any proxy Common Shareholders receive will include all Shares received under the Plan.
Automatically reinvested dividends and distributions are taxed in the same manner as cash dividends and distributions.
The Fund and the Plan Administrator reserve the right to amend or terminate the Plan. There is no direct service charge to participants in the Plan; however, the Fund reserves the right to amend the Plan to include a service charge payable by the participants. If the Plan is amended to include such service charges, the Plan Administrator will include a notification to registered holders of Shares with the Plan Administrator.
Additional information about the Plan may be obtained from the Plan Administrator.
|
2025 Annual Report |
79 |
Oaktree Fund Advisors, LLC, on its own behalf and on behalf of the funds managed by Oaktree Fund Advisors, LLC and its affiliates, recognizes and appreciates the importance of respecting the privacy of our clients and shareholders. Our relationships are based on integrity and trust and we maintain high standards to safeguard your non-public personal information (“Personal Information”) at all times. This privacy policy (“Policy”) describes the types of Personal Information we collect about you, the steps we take to safeguard that information and the circumstances in which it may be disclosed.
If you hold shares of the Fund through a financial intermediary, such as a broker, investment adviser, bank or trust company, the privacy policy of your financial intermediary will also govern how your Personal Information will be shared with other parties.
WHAT INFORMATION DO WE COLLECT?
We collect the following Personal Information about you:
• Information we receive from you in applications or other forms, correspondence or conversations, including but not limited to name, address, phone number, social security number, assets, income and date of birth.
• Information about transactions with us, our affiliates, or others, including but not limited to account number, balance and payment history, parties to transactions, cost basis information, and other financial information.
• Information we may receive from our due diligence, such as your creditworthiness and your credit history.
WHAT IS OUR PRIVACY POLICY?
We may share your Personal Information with our affiliates in order to provide products or services to you or to support our business needs. We will not disclose your Personal Information to nonaffiliated third parties unless 1) we have received proper consent from you; 2) we are legally permitted to do so; or 3) we reasonably believe, in good faith, that we are legally required to do so. For example, we may disclose your Personal Information with the following in order to assist us with various aspects of conducting our business, to comply with laws or industry regulations, and/or to effect any transaction on your behalf;
• Unaffiliated service providers (e.g. transfer agents, securities broker-dealers, administrators, investment advisors or other firms that assist us in maintaining and supporting financial products and services provided to you);
• Government agencies, other regulatory bodies and law enforcement officials (e.g. for reporting suspicious transactions);
• Other organizations, with your consent or as directed by you; and
• Other organizations, as permitted or required by law (e.g. for fraud protection).
When we share your Personal Information, the information is made available for limited purposes and under controlled circumstances designed to protect your privacy. We require third parties to comply with our standards for security and confidentiality.
HOW DO WE PROTECT CLIENT INFORMATION?
We restrict access to your Personal Information to those persons who require such information to assist us with providing products or services to you. It is our practice to maintain and monitor physical, electronic, and procedural safeguards that comply with federal standards to guard client nonpublic personal information. We regularly train our employees on privacy and information security and on their obligations to protect client information.
CONTACT INFORMATION
For questions concerning our Privacy Policy, please contact our client services representative at 1-855-777-8001.
|
80 |
|
|
CORPORATE INFORMATION |
Investment Adviser
Oaktree Fund Advisors, LLC
333 South Grand Avenue, 28th Floor
Los Angeles, California 90071
www.oaktreefunds.com
Administrator
Brookfield Public Securities Group LLC
Brookfield Place
225 Liberty Street, 35th Floor
New York, New York 10281
www.brookfield.com
Please direct your inquiries to:
Investor Relations
Phone: 1-855-777-8001
E-mail: info@brookfieldoaktree.com
Transfer Agent
Shareholder inquiries relating to distributions, address changes and shareholder account information should be directed to the Fund’s transfer agent:
U.S. Bancorp Fund Services, LLC
615 East Michigan Street
Milwaukee, Wisconsin 53202
1-855-862-5873
Fund Accounting Agent & Sub-Administrator
U.S. Bancorp Fund Services, LLC
615 East Michigan Street
Milwaukee, Wisconsin 53202
Independent Registered Public Accounting Firm
Deloitte & Touche LLP
111 South Wacker Drive
Chicago, Illinois 60606
Legal Counsel
Paul Hastings LLP
200 Park Avenue
New York, New York 10166
Custodian
U.S. Bank National Association
1555 North RiverCenter Drive, Suite 302
Milwaukee, Wisconsin 53212
Distributor
Quasar Distributors, LLC
190 Middle Street, Suite 301
Portland, ME 04101
|
Directors of the Fund |
Chair of Board of Directors |
|
Officers of the Fund |
President |
The Fund files its complete schedule of portfolio holdings with the SEC for the first and third quarters of each fiscal year on Form N-PORT. The Fund’s Forms N-PORT are available on the SEC’s website at www.sec.gov.
You may obtain a description of the Fund’s proxy voting policies and procedures and information regarding how the Fund voted proxies relating to portfolio securities during the most recent 12-month period ended June 30, without charge, upon request by calling 1-855-777-8001, or go to the SEC’s website at www.sec.gov.

(b) Not applicable.
Item 2. Code of Ethics.
The registrant has adopted a code of ethics that applies to the registrant’s principal executive officer and principal financial officer. The registrant has not made any substantive amendments to its code of ethics during the period covered by this report. The registrant has not granted any waivers from any provisions of the code of ethics during the period covered by this report.
The registrant undertakes to provide to any person without charge, upon request, a copy of its code of ethics by contacting Investor Relations at (855) 777-8001 or by writing to Secretary, Oaktree Diversified Income Fund Inc., Brookfield Place, 225 Liberty Street, 35th Floor, New York, NY 10281.
Item 3. Audit Committee Financial Expert.
The registrant’s Board of Directors has determined that there is at least one audit committee financial expert serving on its audit committee. Stuart A. McFarland, Edward A. Kuczmarski, William H. Wright II, Heather S. Goldman and Susan Schauffert-Tam each qualify as “audit committee financial experts” and are considered to be “independent” as each term is defined in Item 3 of Form N-CSR.
Item 4. Principal Accountant Fees and Services.
The registrant has engaged its principal accountant to perform audit services, audit-related services, tax services and other services during the past two fiscal years. “Audit services” refer to performing an audit of the registrant’s annual financial statements or services that are normally provided by the accountant in connection with statutory and regulatory filings or engagements for those fiscal years. “Audit-related services” refer to the assurance and related services by the principal accountant that are reasonably related to the performance of the audit. “Tax services” refer to professional services rendered by the principal accountant for tax compliance, tax advice, and tax planning. The following table details the aggregate fees billed or expected to be billed for each of the last two fiscal years for audit fees, audit-related fees, tax fees and other fees by the principal accountant.
|
FYE 12/31/2025 |
FYE 12/31/2024 |
|||||
|
(a) Audit Fees |
$ |
223,000 |
$ |
229,100 |
||
|
(b) Audit-Related Fees |
$ |
0 |
$ |
0 |
||
|
(c) Tax Fees |
$ |
11,600 |
$ |
11,600 |
||
|
(d) All Other Fees |
$ |
0 |
$ |
0 |
||
(e)(1) The audit committee has adopted pre-approval policies and procedures that require the audit committee to pre-approve all audit and non-audit services of the registrant, including services provided to any entity affiliated with the registrant.
(e)(2) The percentage of fees billed by Deloitte & Touche LLP (“Deloitte”) applicable to non-audit services pursuant to waiver of pre-approval requirement were as follows:
|
FYE 12/31/2025 |
FYE 12/31/2024 |
|||||
|
Audit-Related Fees |
0 |
% |
0 |
% |
||
|
Tax Fees |
0 |
% |
0 |
% |
||
|
All Other Fees |
0 |
% |
0 |
% |
||
(f) All of the principal accountant’s hours spent on auditing the registrant’s financial statements were attributed to work performed by full-time permanent employees of the principal accountant.
(g) The aggregate fees billed by Deloitte for the fiscal years ended December 31, 2025 and December 31, 2024, for non-audit services rendered to the registrant and the registrant’s investment adviser and administrator were $11,600 and $11,600, respectively. For the fiscal years ended December 31, 2025 and December 31, 2024, these amounts reflect the amounts disclosed above in (b), (c) and (d), plus $0 and $0, respectively, in fees billed to the registrant’s investment adviser for non-audit services that did not relate directly to the operations and financial reporting of the registrant.
(h) The audit committee of the Board of Directors has considered whether the provision of non-audit services that were rendered to the registrant’s investment adviser is compatible with maintaining the principal accountant’s independence and has concluded that the provision of such non-audit services by the accountant has not compromised the accountant’s independence.
(i) Not applicable.
(j) Not applicable.
Item 5. Audit Committee of Listed Registrants.
(a) Not applicable.
(b) Not applicable.
Item 6. Investments.
(a) Schedule of Investments is included as part of the report to shareholders filed under Item 1(a) of this Form.
(b) Not applicable.
Item 7. Financial Statements and Financial Highlights for Open-End Management Investment Companies.
Not applicable to closed-end investment companies.
Item 8. Changes in and Disagreements with Accountants for Open-End Management Investment Companies.
Not applicable to closed-end investment companies.
Item 9. Proxy Disclosure for Open-End Management Investment Companies.
Not applicable to closed-end investment companies.
Item 10. Remuneration Paid to Directors, Officers, and Others of Open-End Management Investment Companies.
Not applicable to closed-end investment companies.
Item 11. Statement Regarding Basis for Approval of Investment Advisory Contract.
Not applicable.
Item 12. Disclosure of Proxy Voting Policies and Procedures for Closed-End Management Investment Companies.
Clients often grant Oaktree Fund Advisors, LLC (“Oaktree”) the authority to vote proxies on their behalf. Proxy statements increasingly contain controversial issues involving shareholder rights and corporate governance, among others, which deserve careful review and consideration. Oaktree has adopted and implemented policies and procedures that are reasonably designed to ensure that proxies are voted in the best interest of investors and clients, in accordance with our fiduciary duties and SEC Rule 206(4)6 under the Advisers Act. Our authority to vote the proxies of our clients is established by the investment management agreements or similar documents.
Oaktree maintains written proxy voting guidelines, which are amended as necessary. The proxy voting guidelines address a broad range of issues, including the selection of directors, executive compensation, proxy contests and tender offer defenses. We generally vote in the manner as noted within the guidelines, unless a different vote is deemed prudent under the specific circumstances, taking into consideration the contractual obligations under any investment management agreement, or other comparable document, and all other relevant facts and circumstances at the time of the vote. It is our policy to perform a detailed review of each proxy statement when considering the voting recommendations of the guidelines.
1. Delegation of Voting Responsibility and Account Set Up
It is the responsibility of the Legal personnel who prepares or reviews an investment management agreement, or other comparable document, to ensure that such agreement, prior to, or at the time of execution, assigns responsibility of voting proxies, whether it be retained by the client or delegated to Oaktree.
There may be certain instances in which Oaktree’s authority to vote proxies may be limited and as such the proxy voting guidelines may not be followed or a vote may not be placed. Such occasions may include, but are not limited to, when (i) the client has mandated that Oaktree vote in accordance with their proxy voting guidelines; or (ii) the client has chosen to participate in a securities lending program that may result in voting authority being lost if a particular security is out on loan on the record date. In the case where a Managed Account client has requested that Oaktree vote proxies in accordance with their guidelines, the Legal personnel reviewing the investment management agreement shall ensure that such guidelines are received from the client prior to funding of the account. Additionally, Oaktree may in its discretion, under certain limited facts and circumstances, abstain from voting proxies on behalf of its clients. Such facts and circumstances are documented and maintained as evidence for abstaining from the proxy vote.
Upon receipt of an investment management agreement, or other comparable document, the Legal department reviews the materials. The Corporate Actions department is responsible for preparing the Proxy Account Guidelines Matrix which details the voting responsibility for each Managed Account/Managed Fund and any other relevant details. The Corporate Actions department ensures that, for those Managed Accounts/Managed Funds for which Oaktree has been delegated voting authority, contact is made with the appropriate custodian bank and/or benefit plan trustee in order to receive proxy statements.
2. Voting Procedures
Determination of Vote
Proxies are generally considered by the investment professional responsible for monitoring the security being voted. The Corporate Actions personnel responsible for proxies (with the exception of the Emerging Markets Equities strategy, which handles the proxies relating to their investments) deliver to such investment professional the proxy statement, the proxy voting guidelines and the Proxy Voting Form. The Proxy Voting Form serve as Oaktree’s record of the following information:
(i) whether the investment was held as a passive investment or considered a significant holding;
(ii) whether any material conflict of interest existed in connection with the vote (see further discussion below for description of the procedures to be followed in the instance of such occurrence);
(iii) documentation of the vote for each proposal, including any additional document created or utilized, if any, that was material to arriving at such a determination; and
(iv) documentation of the basis and rationale of the vote when the proxy voting guidelines were not followed, including the reasons why such guidelines were not used.
Once the investment professional has completed his or her analysis, documented the vote, the basis for such vote and signed the form, it should be forwarded to designated Compliance personnel for review. Such personnel ensure that all required documentation has been included, the vote is in accordance with the proxy voting guidelines, or if not, documentation supporting such exception has been created. The information is then sent to Compliance personnel for a final review, which is evidenced in the proxy documentation.
Corporate Actions personnel (with the exception of the Emerging Markets Equities investment strategy, which handles the proxies relating to their investments) then takes the recommended vote from the Proxy Voting Form and submit/transmit such vote(s) online unless the securities are held in physical form. If they are held in physical form, the custodian banks will provide the physical proxy ballots to Oaktree for approval and election. Oaktree will then forward the completed proxy ballots to the agent by mail in a timely manner. Copies of all such documents must be maintained to evidence submission of each proxy vote (see discussion under record- keeping below for additional guidance).
The Emerging Markets Equities investment strategy follows a similar process in which proxies are processed by the relevant Operations personnel and forwarded to the investment professional for consideration. Once the investment professional has completed his or her analysis, documented the vote, the rationale for such vote, and completed the Proxy Voting Form and received approval as necessary, the documentation is forwarded to designated Compliance personnel for review and approval. Once approval is received, the relevant Operations personnel then takes the recommended vote from the approved Proxy Voting Form and submit/transmit such vote(s) online.
Oaktree endeavors, on a best efforts basis, to vote all proxies for which it has proxy voting authority in accordance with the applicable deadlines. Nevertheless, from time to time, proxies may not be voted or are not voted in a timely manner due to various factors, for example receiving proxy notices late or after the cut-off time for voting, not receiving sufficient information regarding proxy matters or certain custodian policies and restrictions.
Conflicts of Interest
Occasions may arise where a person or organization involved in the proxy voting process may have a conflict of interest. A conflict of interest may exist, for example if Oaktree has a business relationship with (or is actively soliciting business from) either the company soliciting the proxy, a third party that has a material interest in the outcome of a proxy vote or that is actively lobbying for a particular outcome of a proxy vote. Any person with knowledge of a personal conflict of interest (e.g. familial relationship with company management) regarding a particular proxy vote must notify Legal or Compliance personnel.
Appropriate members of the Legal and/or Compliance department review such circumstances to determine if a material conflict exists and address any such conflict by: (i) identifying the potential material conflict of interest on the proxy voting form; and (ii) implementing appropriate procedures to address such material conflict of interest. Such procedures may include, but not limited to: (i) having the investment professional remove him or herself from the voting process to be replaced with another research analyst not directly involved; (ii) disclose the conflict to the client and obtain their consent prior to voting; or (iii) a determination that the conflict is not material as neither Oaktree nor Managed Accounts/Managed Funds owns more than 5% of the outstanding class of securities subject to the vote.
3. Tracking Procedures
The Corporate Actions or Trade Support/Operations personnel in each investment strategy in charge of proxies have been delegated the responsibility of communicating with each Managed Account/Managed Fund” custodian bank, prime broker and/or benefit plan trustee to ensure that all proxies are received and for the correct amount of holdings. In addition, such personnel are responsible for ensuring that proxies are responded to in a timely manner and for transmitting appropriate voting instructions to the correct party. Information is documented on a Proxy Tracking Form as follows:
(i) Matching proxies received with stock holdings on the record date as indicated on the proxy card to internal holding reports;
(ii) Documenting reasons as to why proxies were not received for any stock holdings; and
(iii) Recording the dates on which votes were submitted for each Managed Account/Managed Fund.
In addition to the above, Compliance personnel confirms whether the shares subject to the proxy are held by more than one investment strategy. If the position is cross-held, Compliance personnel may instruct coordination of the vote between the various investment strategies where the combined position is material (more than 5% of the outstanding class of securities subject to the vote). The ultimate decision to coordinate voting requires an evaluation of the relevant facts and circumstances with the relevant portfolio managers and Legal personnel.
4. Disclosure to Clients
Oaktree clients that request additional information regarding our proxy voting policies and procedures, or details on how we have voted specific proxies, can forward their written requests to the attention of the Chief Compliance Officer at Oaktree Capital Management, L.P., 333 South Grand Avenue, Los Angeles, California, 90071, or via facsimile at (213) 8306296. Disclosure of this option to clients is made through our Form ADV Part 2A. It is Oaktree’s policy not to release proxy voting information to third parties.
In the event a request is received, the Compliance department will forward such requests from clients to the appropriate Corporate Actions personnel or Trade Support/Operations personnel in charge of proxies to facilitate and maintain the requested information.
5. Recordkeeping
Documentation that Oaktree has voted all proxies for Managed Accounts/Managed Funds for which it has proxy voting authority is maintained by the Corporate Actions or Trade Support/Operations personnel responsible for proxies. Such documentation includes for each proxy voted:
(i) The proxy statement;
(ii) Proxy Voting Form indicating voting response, the basis and rationale for such vote, and any documentation or materials used in determining the vote;
(iii) Proxy Tracking Form indicating Managed Accounts/Managed Funds’ names, shares owned on record date, date voted, method of voting; and if Oaktree did not vote for a particular Managed Account/Managed Fund the reasons behind such action; and
(iv) List of client requests for proxy voting information.
Item 13. Portfolio Managers of Closed-End Management Investment Companies.
Portfolio Managers
Bruce Karsh, Wayne Dahl, Armen Panossian, Danielle Poli, and David Rosenberg manage the Fund. Bruce Karsh is the lead portfolio manager for the Fund. Their professional backgrounds are below.
Bruce Karsh — Co-Founder & Chief Executive Officer, Portfolio Manager
Mr. Karsh is Oaktree’s Co-Chairman and one of the firm’s co-founders. He also is Chief Investment Officer and serves as portfolio manager for Oaktree’s Opportunities, Value Opportunities and Global Credit strategies, including the Oaktree Diversified Income Fund. Prior to co-founding Oaktree, Mr. Karsh was a managing director of TCW Asset Management Company, and the portfolio manager of the Special Credits Funds from 1988 until 1995. Prior to joining TCW, Mr. Karsh worked as Assistant to the Chairman of SunAmerica, Inc. Prior to that, he was an attorney with the law firm of O’Melveny & Myers. Before working at O’Melveny & Myers, Mr. Karsh clerked for the Honorable Anthony M. Kennedy, then of the U.S. Court of Appeals for the Ninth Circuit and retired Associate Justice of the U.S. Supreme Court. Mr. Karsh holds an A.B. degree in economics summa cum laude from Duke University, where he was elected to Phi Beta Kappa. He went on to earn a J.D. from the University of Virginia School of Law, where he served as Notes Editor of the Virginia Law Review and was a member of the Order of the Coif. Mr. Karsh serves on the boards of a number of privately held companies. He is a member of the investment committee of the Broad Foundations. Mr. Karsh is Trustee Emeritus of Duke University, having served as Trustee from 2003 to 2015, and as Chairman of the Board of DUMAC, LLC, the entity that managed Duke’s endowment, from 2005 to 2014.
Wayne Dahl — Managing Director, Co-Portfolio Manager
Mr. Dahl serves as a portfolio manager within our Global Credit and Investment Grade strategies and is a founding member of the Global Credit Investment Committee. Mr. Dahl joined Oaktree in 2016 from Prosiris Capital Management in New York, where he was the Chief Risk Officer. Prior thereto, Mr. Dahl was Head of Risk Management for Canyon Capital Advisors in Los Angeles for nine years where he developed, implemented and managed the firm’s risk measurement and reporting systems across all investment strategies. Mr. Dahl began his career at Rumson Capital in quantitative research and development focused on the convertible arbitrage strategy. He received his B.A. degree in economics with a minor in mathematics from Brigham Young University and his Master of Science in Mathematics in Finance degree from New York University’s Courant Institute of Mathematical Science.
Armen Panossian — Co-Chief Executive Officer, Head of Performing Credit and Co-Portfolio Manager
Mr. Panossian serves as co-Chief Executive Officer, primarily focused on overseeing the organization and performance of Oaktree’s investment teams. He is also Head of Performing Credit, where his responsibilities include oversight of the firm’s liquid and private credit strategies and as a portfolio manager within the Global Private Debt and Global Credit strategies. Mr. Panossian joined Oaktree’s Global Opportunities group in 2007. In January 2014, he joined the U.S. Senior Loans team to assume co-portfolio management responsibilities and lead the development of Oaktree’s CLO business. He became head of all performing credit in 2019. Mr. Panossian joined Oaktree from Pequot Capital Management, where he worked on their distressed debt strategy. Mr. Panossian holds a B.A. degree in economics with honors and distinction from Stanford University, where he was elected to Phi Beta Kappa; an M.S. degree in health services research from Stanford Medical School; a J.D. degree from Harvard Law School; and an M.B.A. from Harvard Business School. Mr. Panossian serves on the Advisory Board of the Stanford Institute for Economic Policy Research. He is a member of the State Bar of California.
David Rosenberg — Managing Director, Co-Portfolio Manager
Mr. Rosenberg serves as Oaktree’s Head of Liquid Performing Credit and a co-portfolio manager of Oaktree’s U.S. High Yield Bond, Global High Yield Bond, Global Credit Investment Grade and Global Credit strategies. He is also a founding member of the Global Credit Investment Committee. Mr. Rosenberg joined Oaktree in 2004 following graduation from the University
of Southern California with an M.B.A. in business administration. Before attending graduate school, he served as an associate in the Franchise Systems Finance Group at J.P. Morgan. Mr. Rosenberg also holds an M.P.A. in professional accounting with a concentration in finance and a B.A. degree in business administration from the University of Texas at Austin. He is a Certified Public Accountant (inactive).
Danielle Poli — Managing Director, Co-Portfolio Manager
Ms. Poli is a portfolio manager within Oaktree’s Global Credit strategy, which is the firm’s flagship multi-asset credit offering. She is a founding member of its Investment Committee. Ms. Poli is also a regular commentator for mainstream and financial media and has been to Barron’s list of 100 Most Influential Women in U.S. Finance.
Management of Other Accounts
The table below identifies the number of accounts (other than the Fund) for which the Fund’s portfolio managers have day-to-day management responsibilities and the total assets in such accounts, within each of the following categories: registered investment companies, other pooled investment vehicles, and other accounts. For each category, the number of accounts and total assets in the accounts where fees are based on performance is also indicated as of December 31, 2025.
|
Portfolio Manager |
Number of |
Beneficial Ownership |
Number of |
Number of |
||||
|
Bruce Karsh |
— |
— |
12/$48,145 |
28/$10,947 |
||||
|
Wayne Dahl |
— |
— |
— |
— |
||||
|
Armen Panossian |
— |
— |
14/$27,485 |
45/$18,066 |
||||
|
Danielle Poli |
— |
— |
— |
— |
||||
|
David Rosenberg |
1/$52 |
— |
8/$11,375 |
66/$26,550 |
____________
1 Assets in $ millions
2 Represents separate accounts
Share Ownership
The following table indicates the dollar range of securities of the Registrant owned by the Registrant’s portfolio managers as of December 31, 2025.
|
Dollar Range of |
||
|
Bruce Karsh |
None |
|
|
Wayne Dahl |
None |
|
|
Armen Panossian |
None |
|
|
Danielle Poli |
None |
|
|
David Rosenberg |
None |
Potential Conflicts of Interest
In the course of providing investment management services, Oaktree and all principals, partners, officers, employees of Oaktree, as well as certain consultants and other external service providers, and its affiliates (collectively, “Oaktree Representatives”), likely will come into possession of material, nonpublic information which, if disclosed, might affect an investor’s decision to buy, sell or hold a security. Under applicable law, Oaktree and Oaktree Representatives may be prohibited from improperly disclosing or using such information for their personal benefit or for the benefit of any other person, including the Fund. In addition, certain accounts have acquired, and may in the future acquire, interests in companies that provide services to one or more other accounts. The payment of fees by accounts to a service provider owned in whole or in part by other accounts may give rise to potential conflicts of interest to the extent Oaktree directed or initiated such transaction. If Oaktree believes such instances may give rise to a conflict of interest, Oaktree will address such conflicts based on the facts and circumstances
presented by each situation and attempt to employ measures to ensure that the accounts using the company’s services are charged arm’s-length prices for the services they receive. Such measures may include, where appropriate, having the company’s management control the negotiation of fees with the accounts to which services are provided and/or obtaining a “most favored nations” clause so that the accounts will automatically receive the benefit of the most favorable fees charged by the service provider to similarly situated clients. Oaktree and its employees may also receive certain benefits, such as discounts on products or services from companies in which an Oaktree account holds a significant ownership interest.
Conflicts Relating to Brookfield Asset Management. In 2019, Brookfield acquired a majority interest in Oaktree. Oaktree is a wholly owned subsidiary of Brookfield. Together, Brookfield and Oaktree provide investors with one of the most comprehensive offerings of alternative investment products available today. While partnering to leverage one another’s strengths, Oaktree operates as an independent business within the Brookfield family, with its own product offerings and investment, marketing, and support teams. Brookfield and Oaktree have continued to operate their respective investment businesses largely independently, with each remaining under its own brand and led by its own management and investment teams. Brookfield and Oaktree manage their investment team independently of each other pursuant to an information barrier. Oaktree accounts and their portfolio companies sometimes engage in activities and have business relationships that give rise to conflicts (and potential conflicts) of interest between them, on the one hand, and, Brookfield and Brookfield’s clients (together, “Brookfield Accounts”) and their portfolio companies on the other hand. For so long as Brookfield and Oaktree manage their investment teams independently of each other pursuant to an information barrier, Oaktree,
Oaktree accounts and their respective portfolio companies generally will not be treated as affiliates of Brookfield, Brookfield Accounts and their portfolio companies, and conflicts (and potential conflicts) considerations, including in connection with allocation of investment opportunities, investment and trading activities, and agreements, transactions and other arrangements entered into with Oaktree, Oaktree accounts and their portfolio companies, generally will be managed in accordance with disclosures set out in the governing documents and independently.
There is (and in the future will continue to be) overlap in investment strategies and investments pursued by Oaktree and Brookfield. Nevertheless, Oaktree generally does not coordinate or consult with Brookfield with respect to investment decisions of Oaktree accounts. While this absence of coordination and consultation, and the information barrier described above, in some respects serves to mitigate conflicts of interests between Oaktree and Brookfield, these same factors also give rise to certain conflicts and risks in connection with Brookfield’s and Oaktree’s investment activities, and make it more difficult to mitigate, ameliorate or avoid such situations. For example, because neither Brookfield nor Oaktree generally coordinate or consult with the other about investment activities and/or decisions made by the other, and neither Brookfield nor Oaktree is subject to any internal approvals over its respective investment activities and decisions by any person who would have knowledge and/or decision-making control of the investment decisions of the other, Brookfield will pursue investment opportunities for Brookfield Accounts which would also be suitable for Oaktree accounts, but which are not made available to such Oaktree accounts. Brookfield Accounts and Oaktree accounts compete, from time to time, for the same investment opportunities. Such competition could, under certain circumstances, adversely impact the purchase price of investments. Brookfield has no obligation to, and generally will not, share investment opportunities that would also be suitable for the Oaktree accounts, and Oaktree and Oaktree accounts have no rights with respect to any such opportunities.
In addition, Brookfield is not restricted from forming or establishing new Brookfield Accounts, such as additional funds or successor funds, which directly compete with Oaktree accounts for investment opportunities. Brookfield Accounts also are not restricted from pursuing investment opportunities based in whole or in part on information, support and knowledge provided directly or indirectly by Oaktree. For example, Oaktree may provide Brookfield, from time to time, with access to marketing-related support, including, for example, introductions to investor relationships and other marketing facilitation activities. Such Brookfield Accounts could compete with or otherwise conduct their affairs without regard to any adverse impact on Oaktree accounts. In addition, Brookfield Accounts are permitted to make investments suitable for Oaktree accounts without the consent of the Oaktree accounts or Oaktree. From time to time, Brookfield Accounts and Oaktree accounts may purchase or sell an investment from or to each other, as well as jointly pursue investments.
In addition, from time to time, Brookfield Accounts hold interests in investments held by Oaktree accounts (or potential Oaktree account investments) and/or subsequently purchase (or sell) an interest in an investment held by Oaktree accounts (or potential Oaktree account investments). In such situations, Brookfield Accounts could benefit from Oaktree accounts’ activities. Conversely, Oaktree accounts could be adversely impacted by Brookfield’s activities. In addition, as a result of different investment objectives, views and/or interests in investments, Brookfield may manage certain Brookfield Accounts’ investments in particular issuers in a way that is different from Oaktree accounts’ investments in the same issuers (including, for example, by investing in different portions of the issuer’s capital structure, short selling securities, voting securities or exercising rights it holds in a different manner and/or buying or selling its interests at different times than the Oaktree accounts), which
could adversely impact Oaktree accounts’ interests. Brookfield and its affiliates may take positions, give advice and provide recommendations that are different from, and potentially contrary to, those which are taken by, given or provided to Oaktree accounts, and are expected to hold interests that potentially are adverse to those held by Oaktree accounts. Brookfield has no obligation or duty to make available for the benefit of Oaktree accounts any information regarding its activities, strategies and/or views.
Brookfield and Oaktree are likely to be deemed to be affiliates of each other for purposes of certain laws and regulations, notwithstanding their operational independence and the existence of an information barrier between them, and from time to time Brookfield Accounts and Oaktree accounts will have positions (which in some cases will be significant) in the same issuers. In those cases Brookfield and Oaktree will frequently need to aggregate their investment holdings, including holdings of Brookfield Accounts and Oaktree accounts, for certain securities law purposes (including trading restrictions under Rule 144 under the Securities Act, reporting obligations under Section 13 of the Exchange Act and reporting and short-swing.
Portfolio Manager Compensation
The compensation structure of the Portfolio Managers is determined by Oaktree in accordance with its own internal policies. All other Portfolio Managers receive a salary that is capped so that a significant portion of their compensation is derived from their bonus, which is a function of Oaktree’s profitability and the Portfolio Manager’s responsibilities and performance, and equity participation as one of the most senior employees. No Portfolio Manager’s compensation is specifically dependent on the performance of the Fund that they manage, on an absolute basis or relative to a specific benchmark. No Portfolio Manager is compensated based on the growth of the Fund’s, or any other clients’, assets except to the extent that such growth contributes to Oaktree’s overall asset growth, which in turn contributes to its overall profitability. Portfolio Managers do not receive a percentage of the revenue earned on any client portfolios, and their compensation is not increased or decreased specifically as a result of any performance fee that may be earned by Oaktree with respect to the funds or accounts they manage.
Item 14. Purchases of Equity Securities by Closed-End Management Investment Company and Affiliated Purchasers.
Not applicable.
Item 15. Submission of Matters to a Vote of Security Holders.
There have been no material changes to the procedures by which shareholders may recommend nominees to the Registrant’s Board of Directors.
Item 16. Controls and Procedures.
(a) The Registrant’s Principal Executive Officer and Principal Financial Officer have reviewed the Registrant’s disclosure controls and procedures (as defined in Rule 30a-3(c) under the Investment Company Act of 1940 (the “Act”)) as of a date within 90 days of the filing of this report, as required by Rule 30a-3(b) under the Act and Rules 13a-15(b) or 15d-15(b) under the Securities Exchange Act of 1934, as amended (the “Exchange Act”). Based on their review, such officers have concluded that the disclosure controls and procedures are effective in ensuring that information required to be disclosed in this report is appropriately recorded, processed, summarized and reported and made known to them by others within the Registrant and by the Registrant’s service provider.
(b) There were no changes in the Registrant’s internal control over financial reporting (as defined in Rule 30a-3(d) under the Act) that occurred during the period covered by this report that have materially affected, or are reasonably likely to materially affect, the Registrant’s internal control over financial reporting.
Item 17. Disclosure of Securities Lending Activities for Closed-End Management Investment Companies
Not applicable.
Item 18. Recovery of Erroneously Awarded Compensation.
(a) Not applicable.
(b) Not applicable.
Item 19. Exhibits.
(a) (1) Any code of ethics or amendment thereto, that is the subject of the disclosure required by Item 2, to the extent that the registrant intends to satisfy Item 2 requirements through filing an exhibit. Not applicable.
(2) Any policy required by the listing standards adopted pursuant to Rule 10D-1 under the Exchange Act (17 CFR 240.10D-1) by the registered national securities exchange or registered national securities association upon which the registrant’s securities are listed. Not applicable.
(4) Any written solicitation to purchase securities under Rule 23c-1 under the Act sent or given during the period covered by the report by or on behalf of the registrant to 10 or more persons. Not applicable.
(5) Change in the registrant’s independent public accountant. Provide the information called for by Item 4 of Form 8-K under the Exchange Act (17 CFR 249.308). Unless otherwise specified by Item 4, or related to and necessary for a complete understanding of information not previously disclosed, the information should relate to events occurring during the reporting period. Not applicable.
(b) Certifications pursuant to Section 906 of the Sarbanes-Oxley Act of 2002. Filed herewith.
SIGNATURES
Pursuant to the requirements of the Securities Exchange Act of 1934 and the Investment Company Act of 1940, the registrant has duly caused this report to be signed on its behalf by the undersigned, thereunto duly authorized.
|
(Registrant) |
Oaktree Diversified Income Fund Inc. |
|||||
|
By (Signature and Title)* |
/s/ Brian F. Hurley |
|||||
|
Brian F. Hurley, Principal Executive Officer |
||||||
|
Date |
March 6, 2026 |
|||||
Pursuant to the requirements of the Securities Exchange Act of 1934 and the Investment Company Act of 1940, this report has been signed below by the following persons on behalf of the registrant and in the capacities and on the dates indicated.
|
By (Signature and Title)* |
/s/ Brian F. Hurley |
|||
|
Brian F. Hurley, Principal Executive Officer |
||||
|
Date |
March 6, 2026 |
|||
|
By (Signature and Title)* |
/s/ Casey P. Tushaus |
|||
|
Casey P. Tushaus, Principal Financial Officer |
||||
|
Date |
March 6, 2026 |
|||