
1 May 22, 2025 New York, New York Analyst & Investor Day

2 2 Pravesh Khandelwal Vice President, Investor Relations Welcome to Analyst & Investor Day
3 Forward-looking statements Safe Harbor Statement Regarding Forward-Looking Statements This presentation contains express or implied "forward-looking statements" as that term is defined in the Private Securities Litigation Reform Act of 1995 and other securities laws. These forward-looking statements concern our current expectations regarding our future results from operations, performance, financial condition, goals, strategies, plans and achievements. These forward-looking statements are subject to various known and unknown risks, uncertainties and other factors, and you should not rely upon them except as statements of our present intentions and of our present expectations, which may or may not occur. When we use words such as "believes,“ “may,” “might,” “could,” “predict,” “seek,” “look,” “next,” “project,” “potential,” “continue,” “expand,” “objective,” “grow,” “goal,” "expects," "anticipates," "estimates," "plans," "intends," “pursue,” “should,” “would,” “will,” “target,” “create,” “opportunity,” “capability,” “position,” “strategy,” or similar expressions, we are making forward-looking statements. For example, embecta is using forward-looking statements when discussing our future operations and financial performance and statements regarding our business strategy, key market and portfolio expectations, U.S. and International business and strategy, manufacturing and supply chain expectations, execution of our brand transition plan, expectations for value creation, our financial profile and long-term financial objectives, including our fiscal 2025 financial guidance and over the course of our long- range plan, expectations related to the impact of incremental tariffs, our plans to discontinue our patch pump program, increasing our financial flexibility and our ability to reduce costs, streamline operations and enhance profitability, our expected savings and expenses from our organizational restructuring and the timing thereof, our expectations with respect to strengthening our core business, separating and standing up embecta as an independent company, expansion of our product portfolio, and opportunities to transition into a broad-based medical supplies company. Although we believe that our forward-looking statements are based on reasonable assumptions, our expected results may not be achieved, and actual results may differ materially from our expectations. In addition, important factors that could cause actual results to differ from expectations include, among others: (i) competitive factors that could adversely affect embecta’s operations; (ii) any inability to replace the services provided by Becton, Dickinson and Company (“BD”) under the transaction documents; (iii) any failure by BD to perform its obligations under the various separation agreements entered into in connection with the separation and distribution; (iv) any events that adversely affect the sale or profitability of embecta’s products or the revenues delivered from sales to its customers; (v) increases in operating costs, including costs incurred from newly instituted tariffs by the U.S. government and certain foreign governments on raw materials and products, fluctuations in the cost and availability of raw materials or components used in embecta’s products, the ability to maintain favorable supplier arrangements and relationships, and the potential adverse effects of any disruption in the availability of such items; (vi) the impact of the global trade environment resulting from newly instituted tariffs causing certain foreign governments, private purchasers and others to consider transitioning away from products originating from certain countries (including the U.S.) in favor of buying “local” products; (vii) changes in reimbursement practices of governments or private payers or other cost containment measures; (viii) the adverse financial impact resulting from unfavorable changes in foreign currency exchange rates, as well as regional, national and foreign economic factors, including inflation, deflation, and fluctuations in interest rates; (ix) the impact of changes in U.S. federal laws and policy that could affect fiscal and tax policies, healthcare and international trade, including import and export regulation and international trade agreements; (x) any new pandemic or any geopolitical instability, including disruptions in its operations and supply chains; (xi) new or changing laws and regulations, or changes in enforcement practices, including laws relating to healthcare, environmental protection, trade, monetary and fiscal policies, taxation and licensing and regulatory requirements for products; (xii) the expected benefits of the separation from BD; (xiii) risks associated with embecta’s indebtedness; (xiv) the risk that ongoing dis-synergy costs, costs of restructuring and other costs incurred in connection with the separation from BD will exceed our estimates of these costs; (xv) the risk that it will be more difficult than expected to effect embecta’s full separation from BD; (xvi) the risks related to timely and successfully completing the brand transition, including any resulting regulatory registration and license delays and interruptions in the transition of the rebranded products into commercial operations, networks, administrative operations and end-to-end product flow and user access; (xvii) expectations related to the costs, profitability, timing and the estimated financial impact of, and charges and savings associated with, the restructuring plans we announced; (xviii) risks associated with not completing strategic collaborative partnerships and acquisitions for innovative technologies, complementary product lines, and new markets; and (xix) the other risks described in our periodic reports filed with the Securities and Exchange Commission, including under the caption “Risk Factors” in our most recent Annual Report on Form 10-K, as further updated by our Quarterly Reports on Form 10-Q we have filed or will file hereafter. Except as required by law, we undertake no obligation to update any forward-looking statements appearing in this presentation.
4 Agenda I. Executive summary II. Market and business overview • Market trends and portfolio highlights • U.S. business and strategy • International business and strategy • Manufacturing and supply chain overview Q&A session III. Value creation and financial overview • Value creation opportunities • Financial overview Q&A session
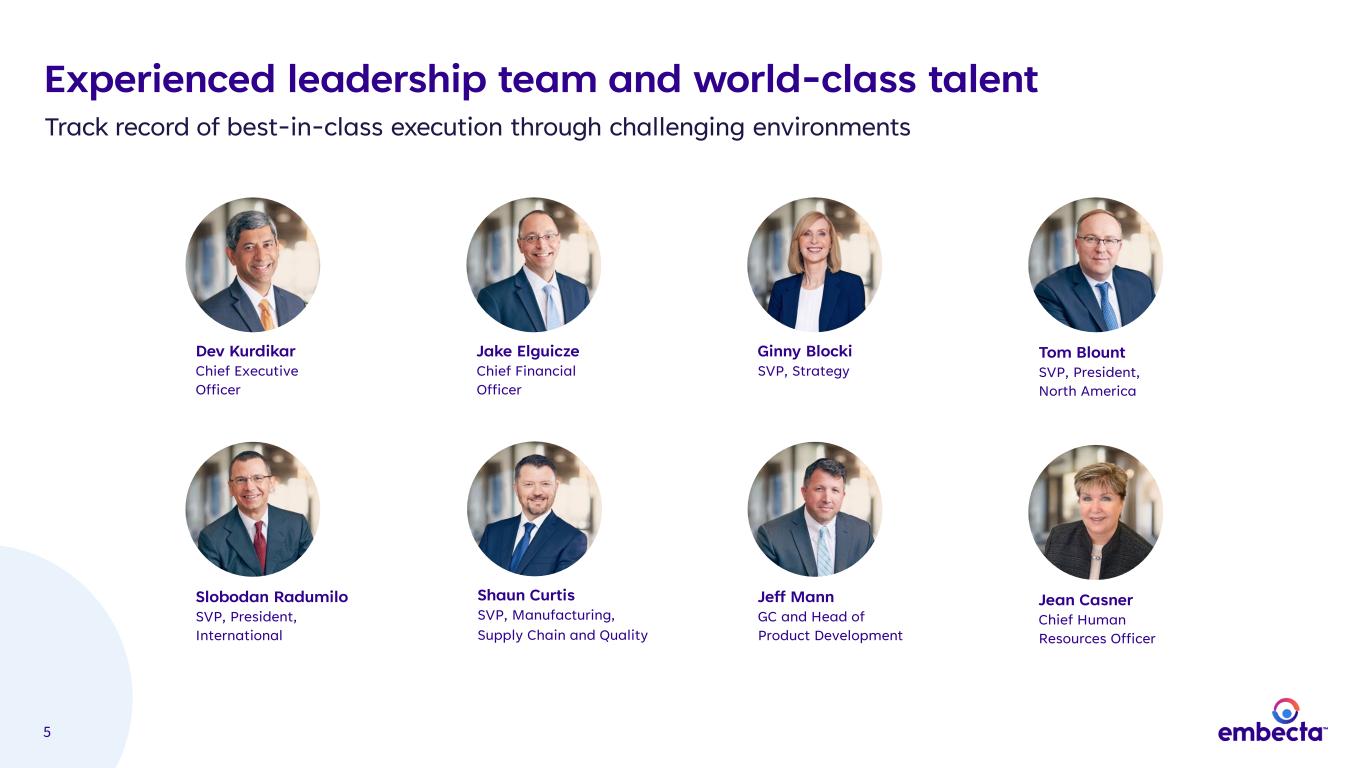
5 Experienced leadership team and world-class talent Dev Kurdikar Chief Executive Officer Jake Elguicze Chief Financial Officer Tom Blount SVP, President, North America Slobodan Radumilo SVP, President, International Shaun Curtis SVP, Manufacturing, Supply Chain and Quality Ginny Blocki SVP, Strategy Jeff Mann GC and Head of Product Development Jean Casner Chief Human Resources Officer Track record of best-in-class execution through challenging environments

6 6 Dev Kurdikar President & Chief Executive Officer Executive summary
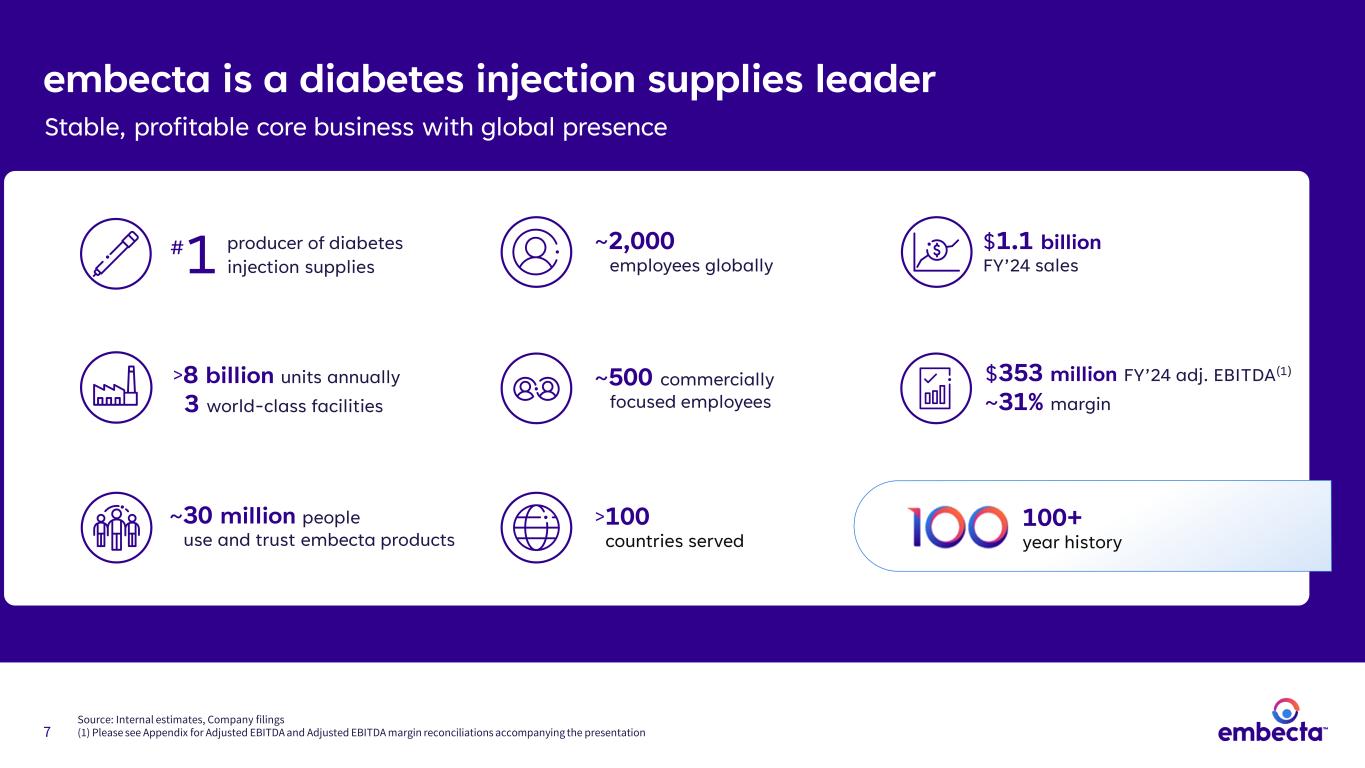
7 embecta is a diabetes injection supplies leader Stable, profitable core business with global presence ~2,000 employees globally ~500 commercially focused employees ~30 million people use and trust embecta products >100 countries served $1.1 billion FY’24 sales $353 million FY’24 adj. EBITDA(1) ~31% margin 1 producer of diabetes injection supplies # 100+ year history >8 billion units annually 3 world-class facilities Source: Internal estimates, Company filings (1) Please see Appendix for Adjusted EBITDA and Adjusted EBITDA margin reconciliations accompanying the presentation
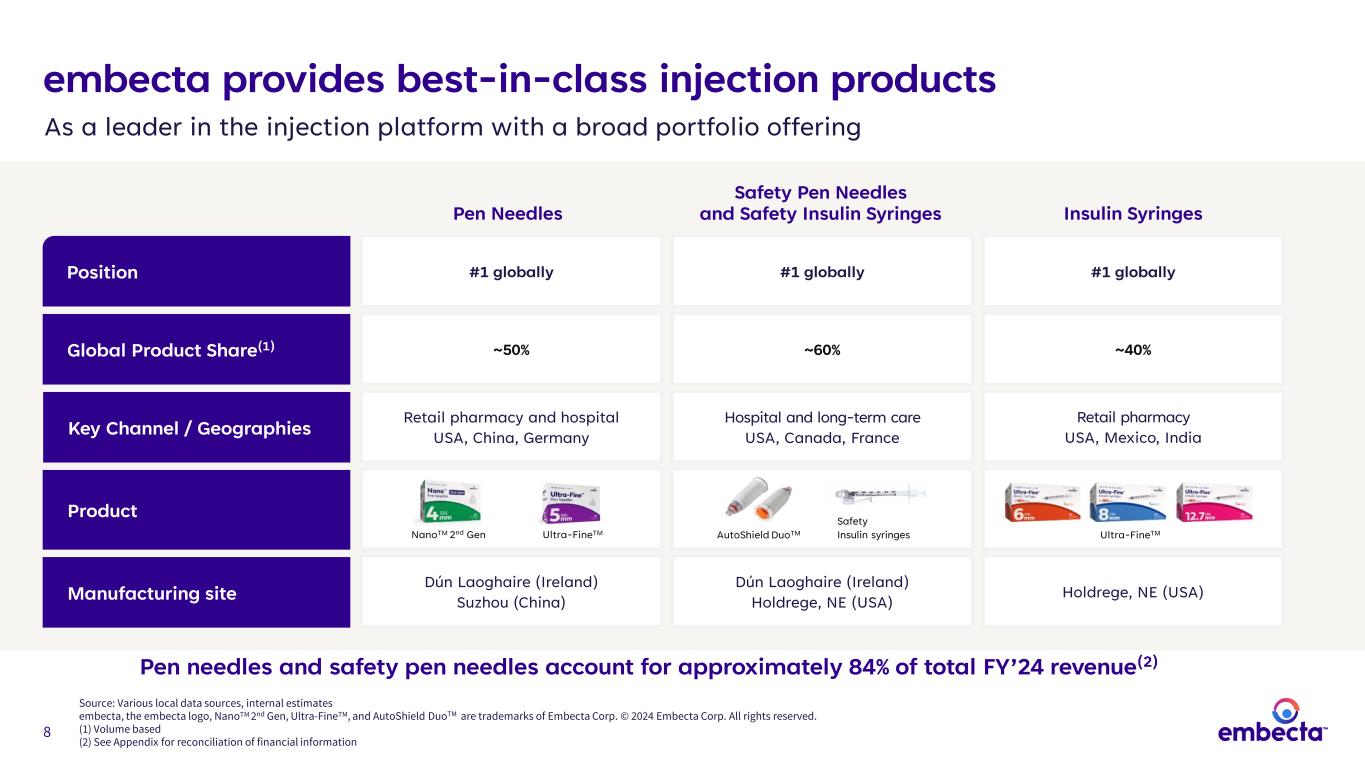
8 embecta provides best-in-class injection products Position Key Channel / Geographies #1 globally #1 globally#1 globally Global Product Share(1) ~50% ~40%~60% Retail pharmacy and hospital USA, China, Germany Hospital and long-term care USA, Canada, France Retail pharmacy USA, Mexico, India Manufacturing site Product Dún Laoghaire (Ireland) Suzhou (China) Holdrege, NE (USA) Dún Laoghaire (Ireland) Holdrege, NE (USA) As a leader in the injection platform with a broad portfolio offering Source: Various local data sources, internal estimates embecta, the embecta logo, NanoTM 2nd Gen, Ultra-FineTM, and AutoShield DuoTM are trademarks of Embecta Corp. © 2024 Embecta Corp. All rights reserved. (1) Volume based (2) See Appendix for reconciliation of financial information Pen needles and safety pen needles account for approximately 84% of total FY’24 revenue(2) Pen Needles NanoTM 2nd Gen Insulin Syringes Safety Pen Needles and Safety Insulin Syringes Ultra-FineTM Safety Insulin syringes AutoShield DuoTM Ultra-FineTM
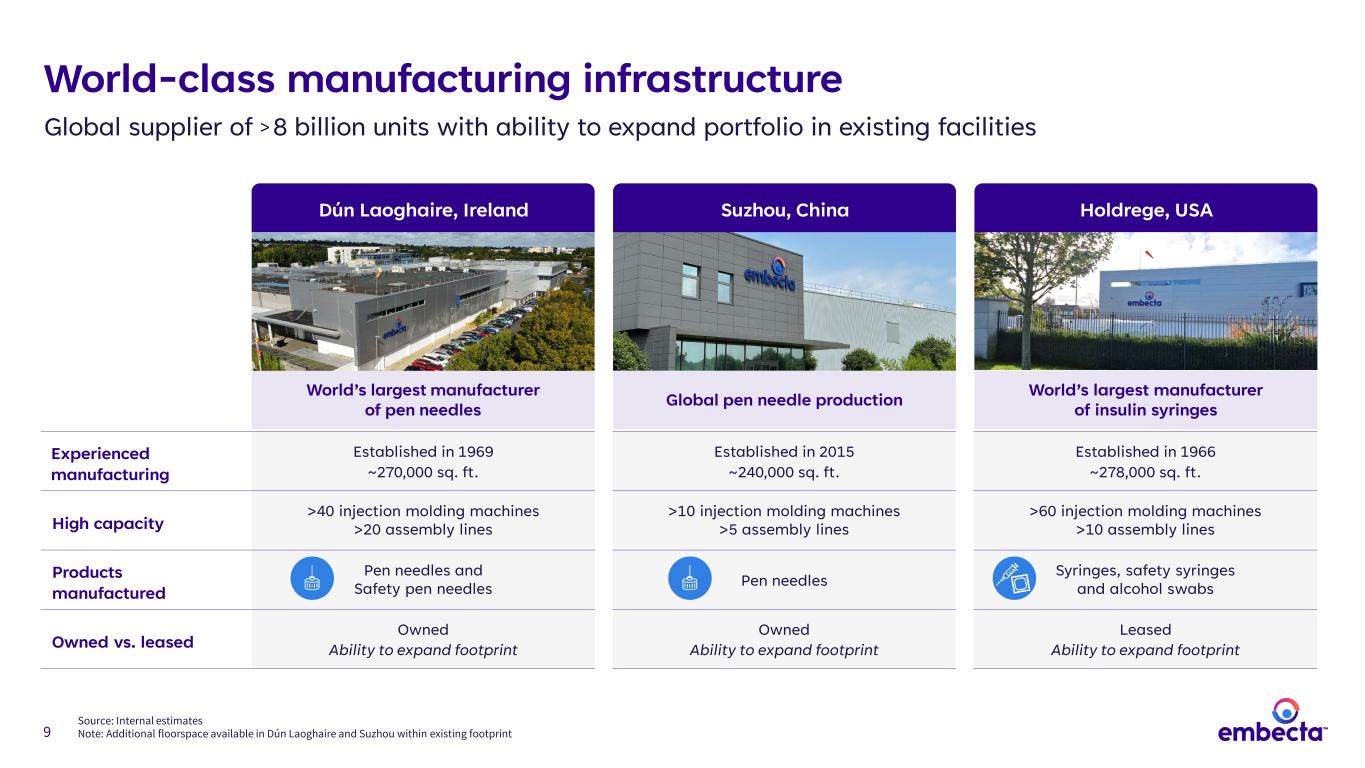
9 Experienced manufacturing Established in 1969 ~270,000 sq. ft. Established in 2015 ~240,000 sq. ft. Established in 1966 ~278,000 sq. ft. High capacity >40 injection molding machines >20 assembly lines >10 injection molding machines >5 assembly lines >60 injection molding machines >10 assembly lines Products manufactured Pen needles and Safety pen needles Pen needles Syringes, safety syringes and alcohol swabs Owned vs. leased Owned Ability to expand footprint Owned Ability to expand footprint Leased Ability to expand footprint World-class manufacturing infrastructure Global supplier of > 8 billion units with ability to expand portfolio in existing facilities Source: Internal estimates Note: Additional floorspace available in Dún Laoghaire and Suzhou within existing footprint World’s largest manufacturer of pen needles World’s largest manufacturer of insulin syringesGlobal pen needle production Dún Laoghaire, Ireland Holdrege, USASuzhou, China
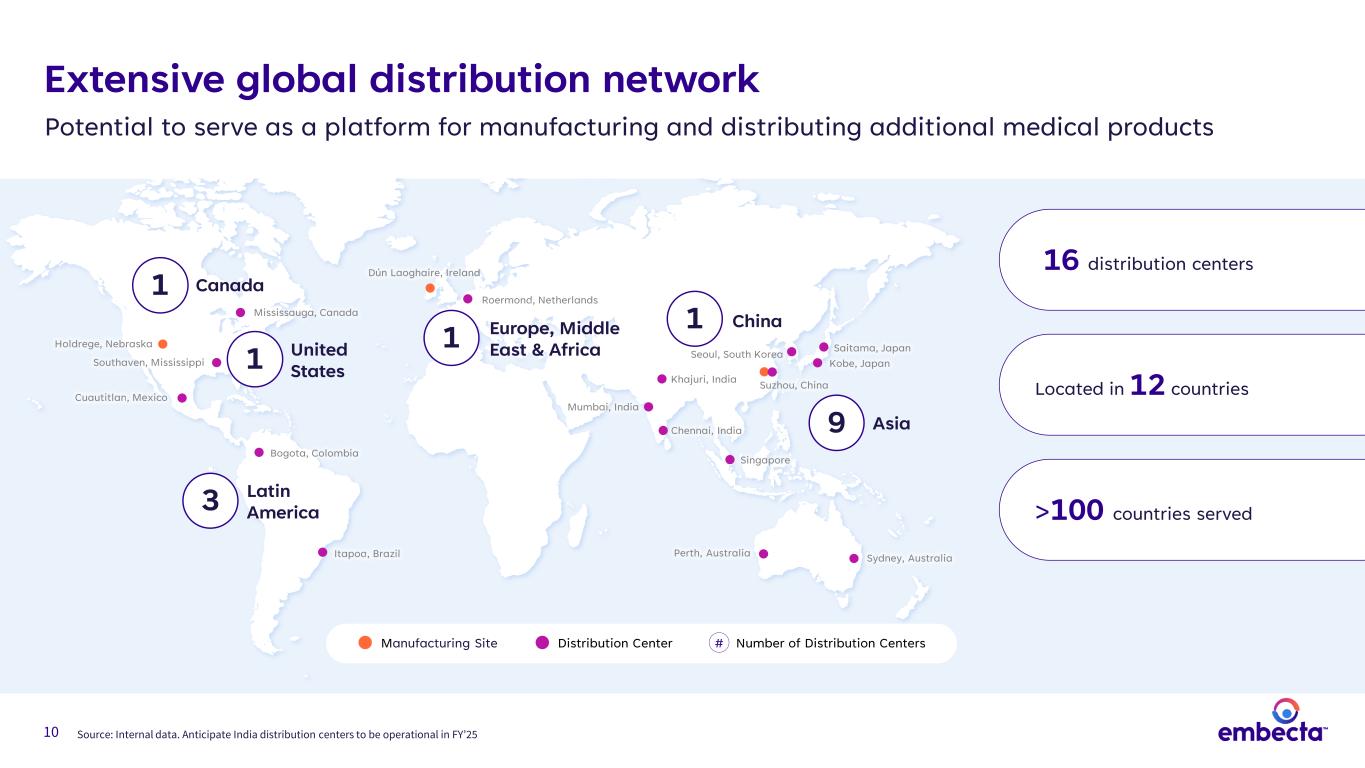
10 Source: Internal data. Anticipate India distribution centers to be operational in FY’25 Itapoa, Brazil Bogota, Colombia 3 Latin America Sydney, AustraliaPerth, Australia Kobe, Japan Saitama, Japan1 Europe, Middle East & Africa Dún Laoghaire, Ireland Roermond, Netherlands Mumbai, India Chennai, India Khajuri, India Singapore Seoul, South Korea 9 Asia 1 China Suzhou, China Southaven, Mississippi Mississauga, Canada Cuautitlan, Mexico Holdrege, Nebraska Manufacturing Site Distribution Center Number of Distribution Centers# 16 distribution centers >100 countries served Located in 12 countries Extensive global distribution network Potential to serve as a platform for manufacturing and distributing additional medical products 1 United States Canada1
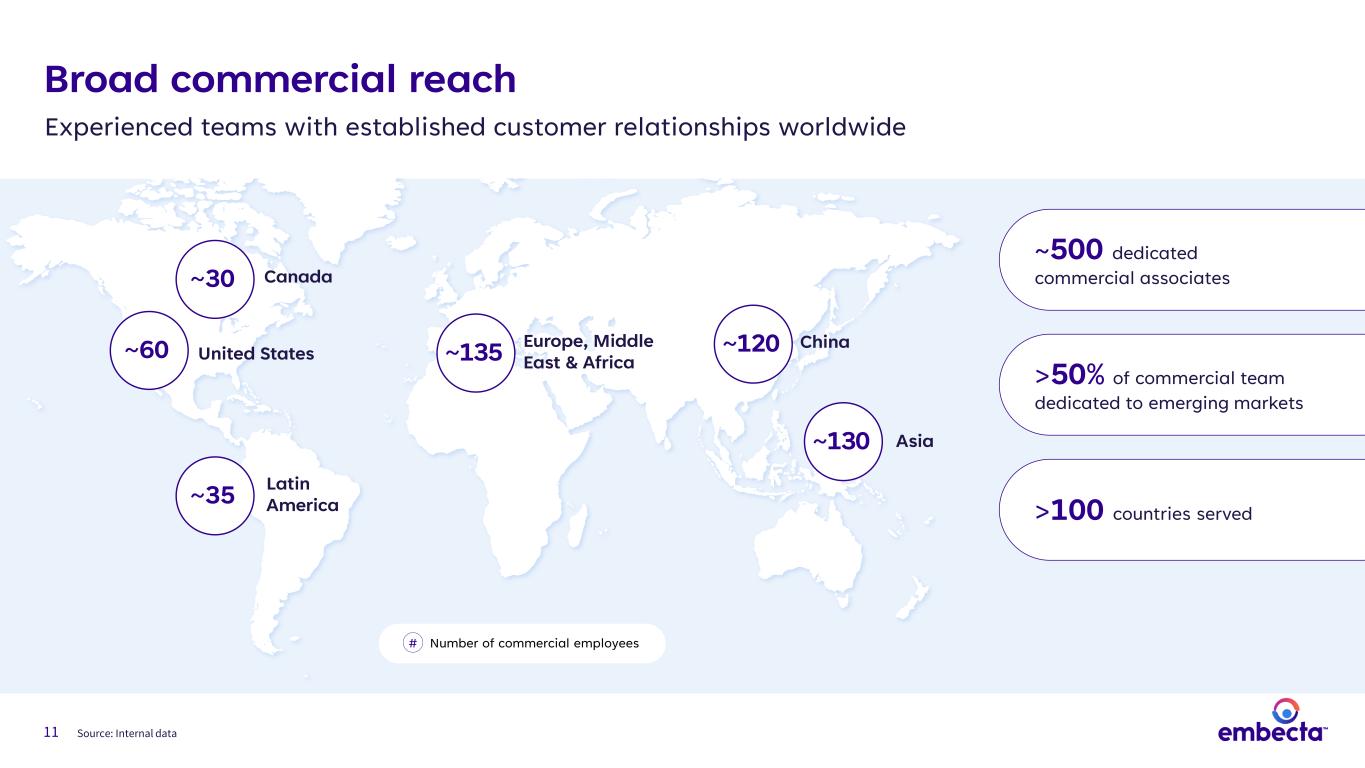
11 ~500 dedicated commercial associates >100 countries served >50% of commercial team dedicated to emerging markets ~60 United States ~30 Canada ~35 Latin America ~135 China ~130 Broad commercial reach Experienced teams with established customer relationships worldwide Asia Europe, Middle East & Africa ~120 Number of commercial employees# Source: Internal data
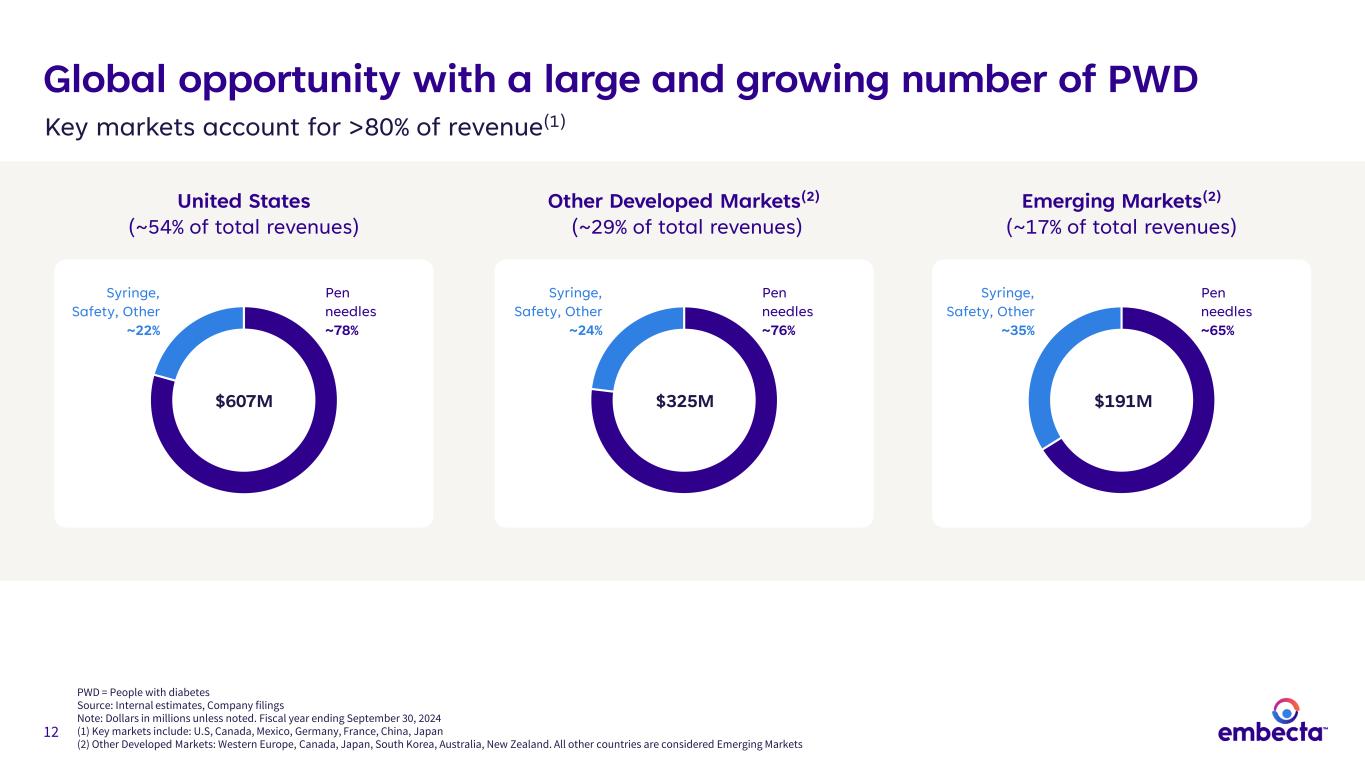
12 Global opportunity with a large and growing number of PWD PWD = People with diabetes Source: Internal estimates, Company filings Note: Dollars in millions unless noted. Fiscal year ending September 30, 2024 (1) Key markets include: U.S, Canada, Mexico, Germany, France, China, Japan (2) Other Developed Markets: Western Europe, Canada, Japan, South Korea, Australia, New Zealand. All other countries are considered Emerging Markets $607M Pen needles ~78% $325M $191M United States (~54% of total revenues) Other Developed Markets(2) (~29% of total revenues) Emerging Markets(2) (~17% of total revenues) Syringe, Safety, Other ~24% Pen needles ~76% Syringe, Safety, Other ~35% Pen needles ~65% Syringe, Safety, Other ~22% Key markets account for >80% of revenue(1)
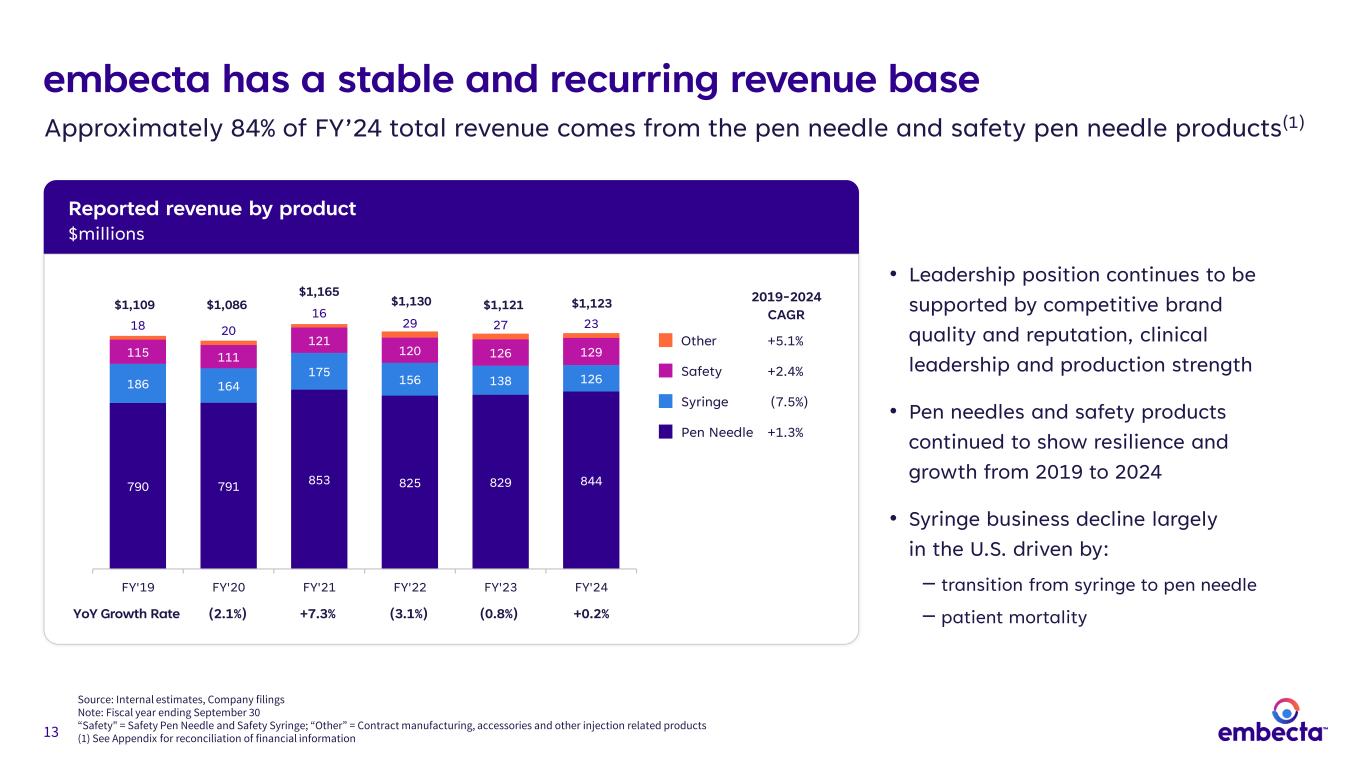
13 Reported revenue by product $millions embecta has a stable and recurring revenue base Source: Internal estimates, Company filings Note: Fiscal year ending September 30 “Safety" = Safety Pen Needle and Safety Syringe; “Other” = Contract manufacturing, accessories and other injection related products (1) See Appendix for reconciliation of financial information Approximately 84% of FY’24 total revenue comes from the pen needle and safety pen needle products(1) • Leadership position continues to be supported by competitive brand quality and reputation, clinical leadership and production strength • Pen needles and safety products continued to show resilience and growth from 2019 to 2024 • Syringe business decline largely in the U.S. driven by: ‒ transition from syringe to pen needle ‒ patient mortality 2019-2024 CAGR Pen Needle +1.3% Syringe (7.5%) Safety +2.4% Other +5.1% $1,109 $1,086 $1,165 $1,130 $1,121 $1,123 790 791 853 825 829 844 186 164 175 156 138 126 115 111 121 120 126 129 18 20 16 29 27 23 FY'19 FY'20 FY'21 FY'22 FY'23 FY'24 (2.1%) +7.3% (3.1%) (0.8%) +0.2%YoY Growth Rate
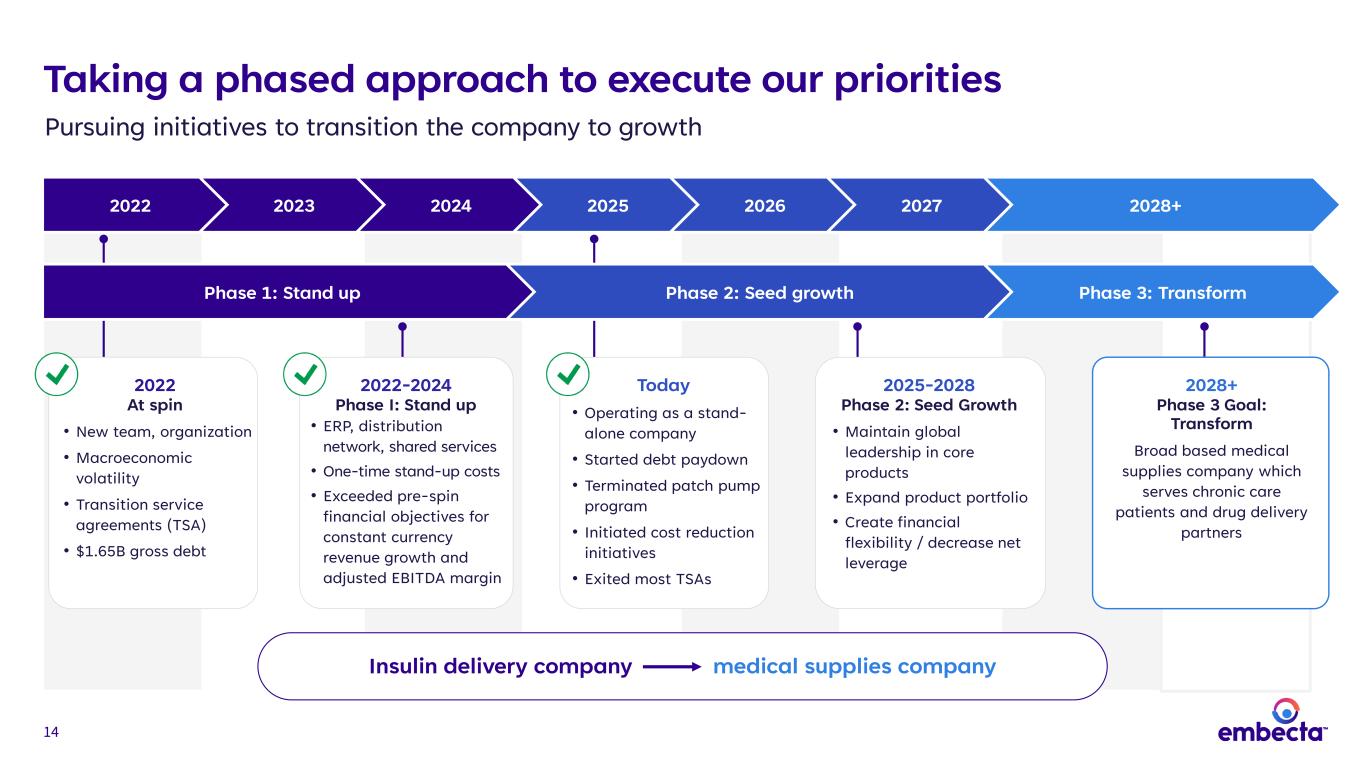
14 Taking a phased approach to execute our priorities Pursuing initiatives to transition the company to growth 2022 2023 2024 2025 2026 2027 2028+ Insulin delivery company medical supplies company 2022 At spin • New team, organization • Macroeconomic volatility • Transition service agreements (TSA) • $1.65B gross debt 2022-2024 Phase I: Stand up • ERP, distribution network, shared services • One-time stand-up costs • Exceeded pre-spin financial objectives for constant currency revenue growth and adjusted EBITDA margin Today • Operating as a stand- alone company • Started debt paydown • Terminated patch pump program • Initiated cost reduction initiatives • Exited most TSAs 2025-2028 Phase 2: Seed Growth • Maintain global leadership in core products • Expand product portfolio • Create financial flexibility / decrease net leverage 2028+ Phase 3 Goal: Transform Broad based medical supplies company which serves chronic care patients and drug delivery partners Phase 1: Stand up Phase 2: Seed growth Phase 3: Transform
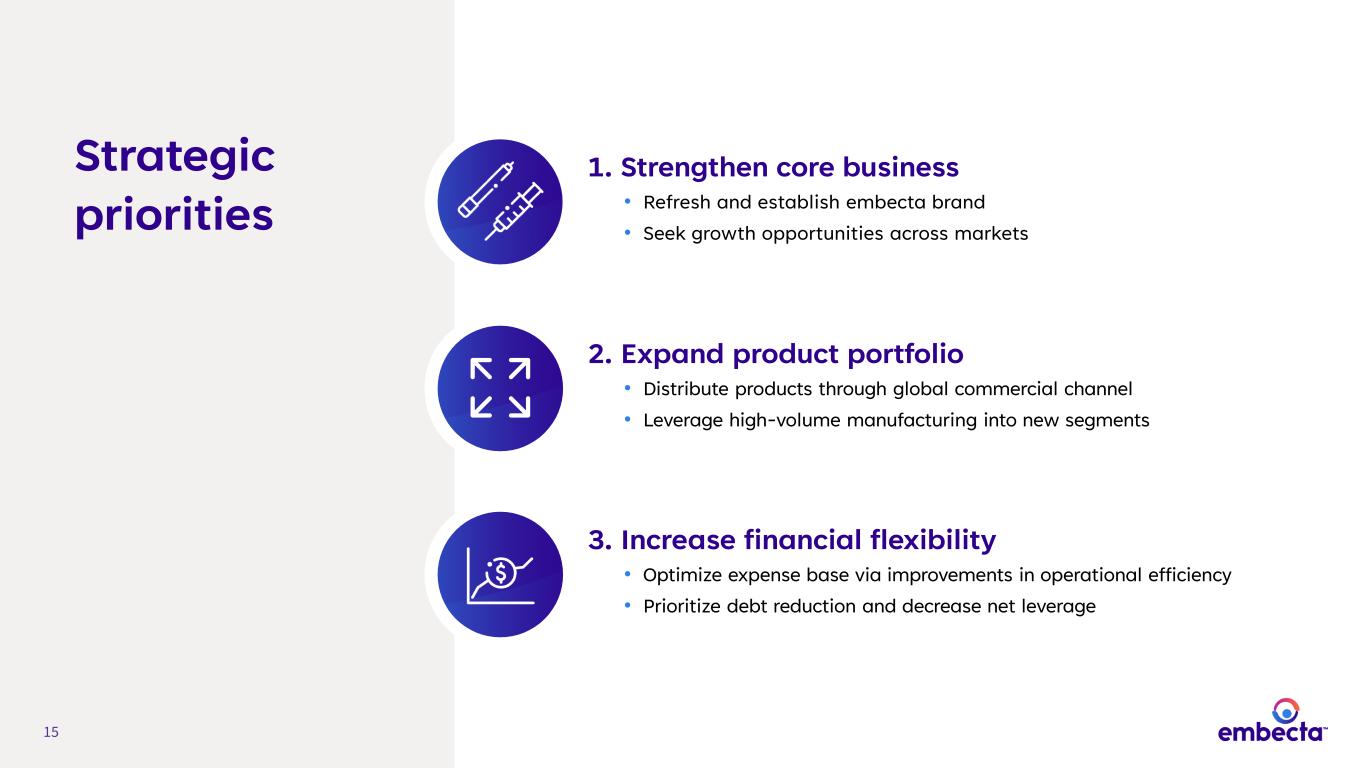
15 Strategic priorities 1. Strengthen core business • Refresh and establish embecta brand • Seek growth opportunities across markets 2. Expand product portfolio • Distribute products through global commercial channel • Leverage high-volume manufacturing into new segments 3. Increase financial flexibility • Optimize expense base via improvements in operational efficiency • Prioritize debt reduction and decrease net leverage

16 16 Ginny Blocki Senior Vice President, Strategy Market trends and portfolio highlights
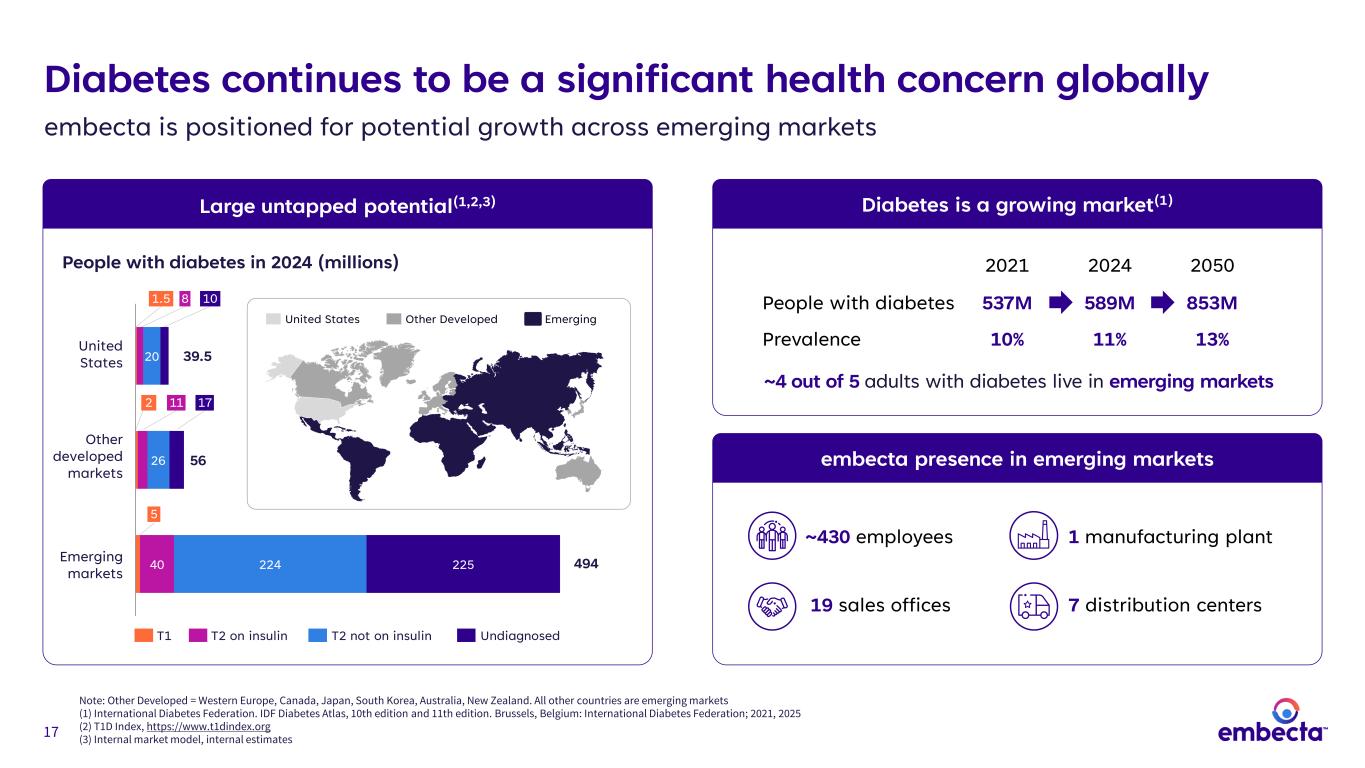
17 Diabetes continues to be a significant health concern globally embecta is positioned for potential growth across emerging markets Note: Other Developed = Western Europe, Canada, Japan, South Korea, Australia, New Zealand. All other countries are emerging markets (1) International Diabetes Federation. IDF Diabetes Atlas, 10th edition and 11th edition. Brussels, Belgium: International Diabetes Federation; 2021, 2025 (2) T1D Index, https://www.t1dindex.org (3) Internal market model, internal estimates Large untapped potential(1,2,3) T1 T2 on insulin T2 not on insulin Undiagnosed United States Other Developed Emerging Other developed markets Emerging markets 56 494 1.5 8 10 2 United States 11 39.5 17 embecta presence in emerging markets ~430 employees 19 sales offices 5 1 manufacturing plant 7 distribution centers People with diabetes in 2024 (millions) 40 20 26 224 225 Diabetes is a growing market(1) ~4 out of 5 adults with diabetes live in emerging markets 2021 2024 2050 People with diabetes 537M 589M 853M Prevalence 10% 11% 13%
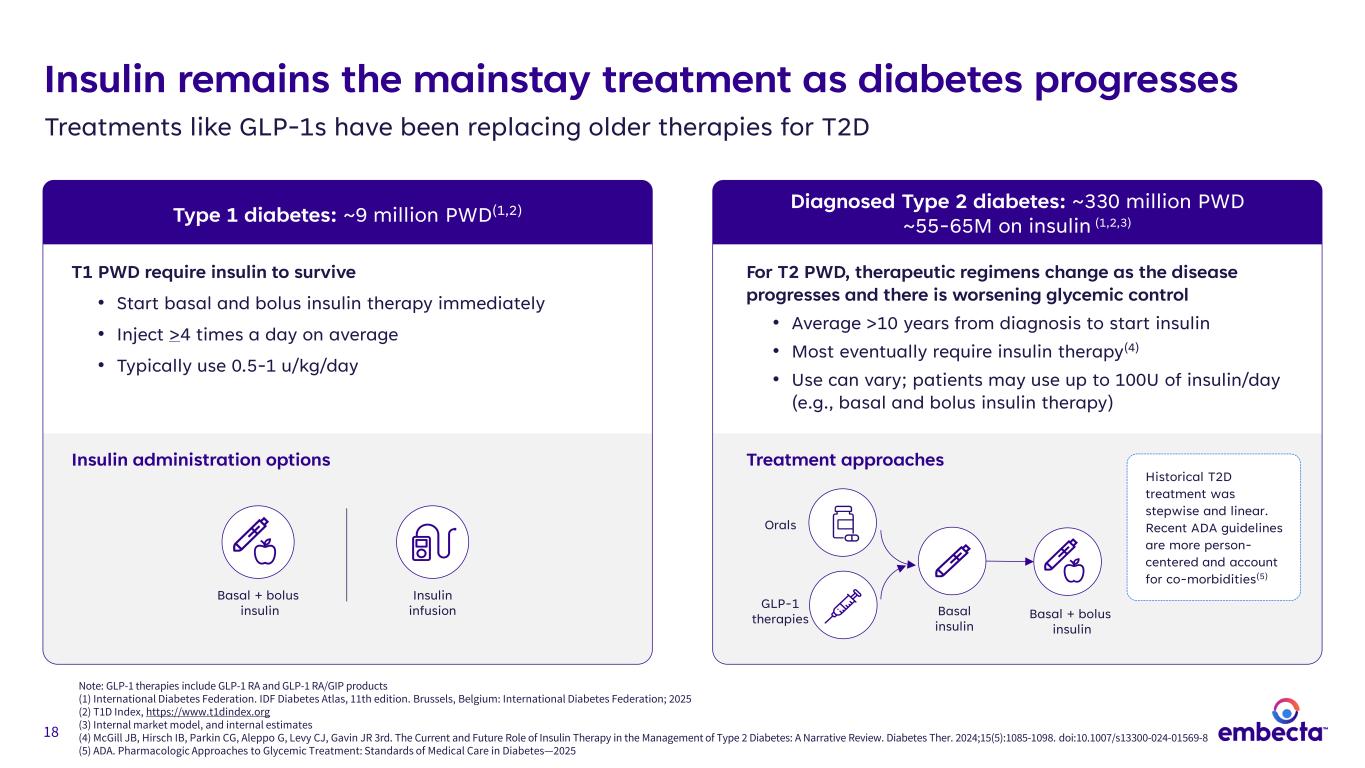
18 Insulin remains the mainstay treatment as diabetes progresses Treatments like GLP-1s have been replacing older therapies for T2D Note: GLP-1 therapies include GLP-1 RA and GLP-1 RA/GIP products (1) International Diabetes Federation. IDF Diabetes Atlas, 11th edition. Brussels, Belgium: International Diabetes Federation; 2025 (2) T1D Index, https://www.t1dindex.org (3) Internal market model, and internal estimates (4) McGill JB, Hirsch IB, Parkin CG, Aleppo G, Levy CJ, Gavin JR 3rd. The Current and Future Role of Insulin Therapy in the Management of Type 2 Diabetes: A Narrative Review. Diabetes Ther. 2024;15(5):1085-1098. doi:10.1007/s13300-024-01569-8 (5) ADA. Pharmacologic Approaches to Glycemic Treatment: Standards of Medical Care in Diabetes—2025 Diagnosed Type 2 diabetes: ~330 million PWD ~55-65M on insulin (1,2,3)Type 1 diabetes: ~9 million PWD(1,2) T1 PWD require insulin to survive • Start basal and bolus insulin therapy immediately • Inject >4 times a day on average • Typically use 0.5-1 u/kg/day For T2 PWD, therapeutic regimens change as the disease progresses and there is worsening glycemic control • Average >10 years from diagnosis to start insulin • Most eventually require insulin therapy(4) • Use can vary; patients may use up to 100U of insulin/day (e.g., basal and bolus insulin therapy) Insulin administration options Basal + bolus insulin Insulin infusion Treatment approaches Basal + bolus insulin Basal insulin GLP-1 therapies Orals Historical T2D treatment was stepwise and linear. Recent ADA guidelines are more person- centered and account for co-morbidities(5)
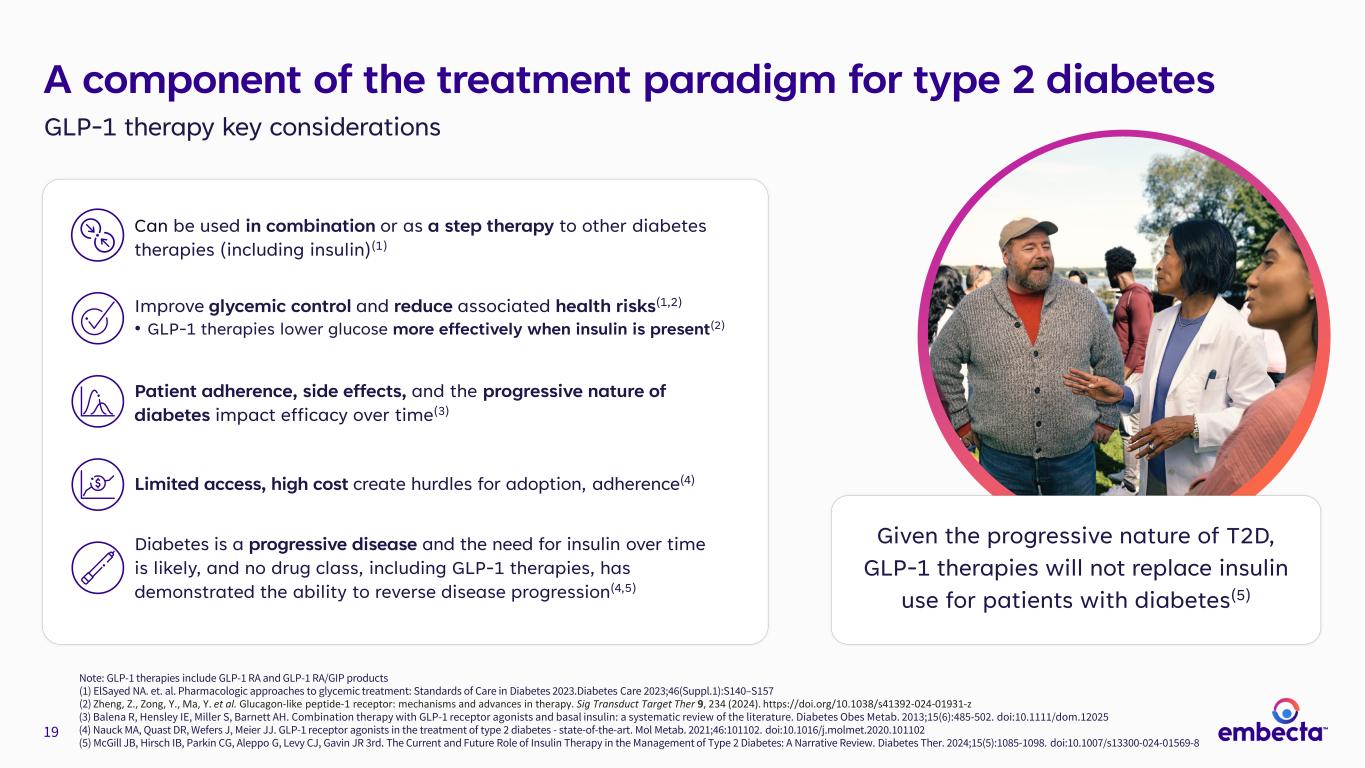
19 A component of the treatment paradigm for type 2 diabetes GLP-1 therapy key considerations Can be used in combination or as a step therapy to other diabetes therapies (including insulin)(1) Patient adherence, side effects, and the progressive nature of diabetes impact efficacy over time(3) Improve glycemic control and reduce associated health risks(1,2) • GLP-1 therapies lower glucose more effectively when insulin is present(2) Limited access, high cost create hurdles for adoption, adherence(4) Diabetes is a progressive disease and the need for insulin over time is likely, and no drug class, including GLP-1 therapies, has demonstrated the ability to reverse disease progression(4,5) Note: GLP-1 therapies include GLP-1 RA and GLP-1 RA/GIP products (1) ElSayed NA. et. al. Pharmacologic approaches to glycemic treatment: Standards of Care in Diabetes 2023.Diabetes Care 2023;46(Suppl.1):S140–S157 (2) Zheng, Z., Zong, Y., Ma, Y. et al. Glucagon-like peptide-1 receptor: mechanisms and advances in therapy. Sig Transduct Target Ther 9, 234 (2024). https://doi.org/10.1038/s41392-024-01931-z (3) Balena R, Hensley IE, Miller S, Barnett AH. Combination therapy with GLP-1 receptor agonists and basal insulin: a systematic review of the literature. Diabetes Obes Metab. 2013;15(6):485-502. doi:10.1111/dom.12025 (4) Nauck MA, Quast DR, Wefers J, Meier JJ. GLP-1 receptor agonists in the treatment of type 2 diabetes - state-of-the-art. Mol Metab. 2021;46:101102. doi:10.1016/j.molmet.2020.101102 (5) McGill JB, Hirsch IB, Parkin CG, Aleppo G, Levy CJ, Gavin JR 3rd. The Current and Future Role of Insulin Therapy in the Management of Type 2 Diabetes: A Narrative Review. Diabetes Ther. 2024;15(5):1085-1098. doi:10.1007/s13300-024-01569-8 Given the progressive nature of T2D, GLP-1 therapies will not replace insulin use for patients with diabetes(5)
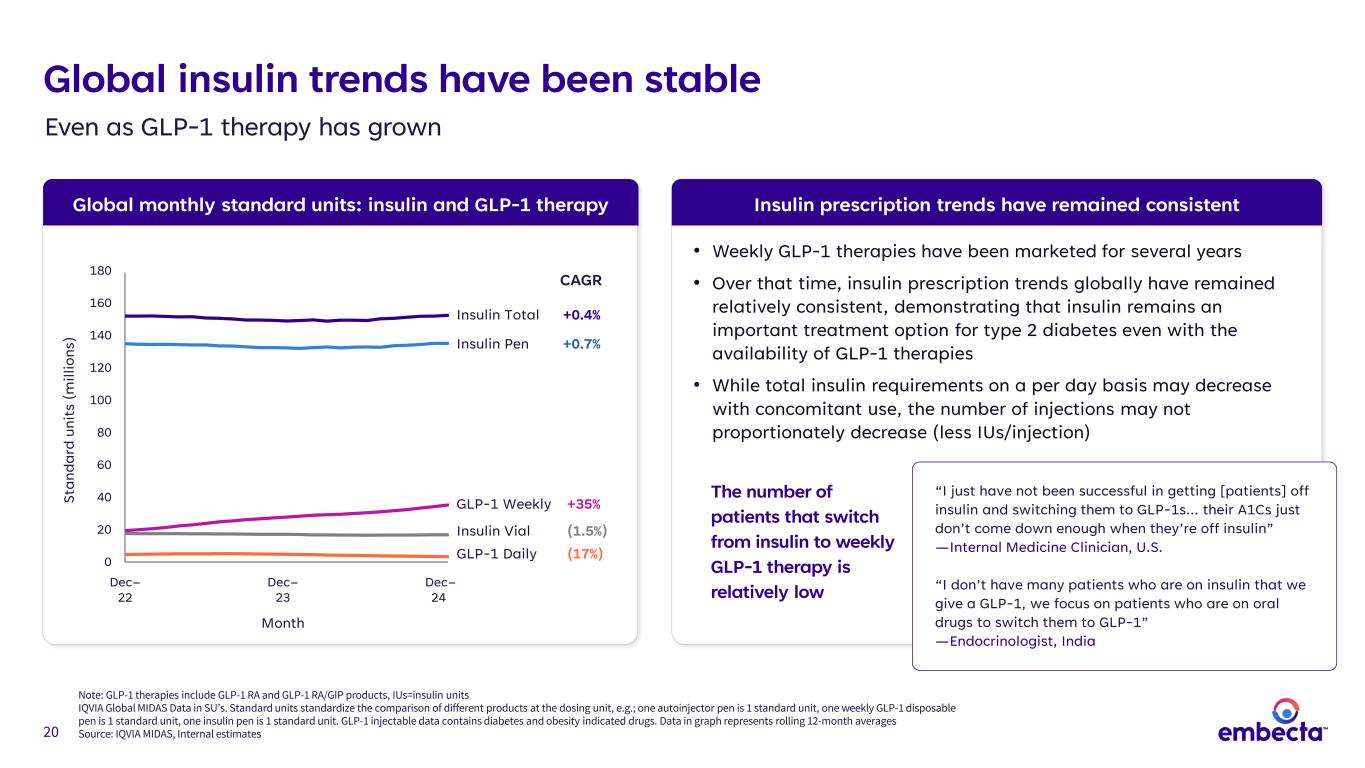
20 Global monthly standard units: insulin and GLP-1 therapy Global insulin trends have been stable Even as GLP-1 therapy has grown Note: GLP-1 therapies include GLP-1 RA and GLP-1 RA/GIP products, IUs=insulin units IQVIA Global MIDAS Data in SU’s. Standard units standardize the comparison of different products at the dosing unit, e.g.; one autoinjector pen is 1 standard unit, one weekly GLP-1 disposable pen is 1 standard unit, one insulin pen is 1 standard unit. GLP-1 injectable data contains diabetes and obesity indicated drugs. Data in graph represents rolling 12-month averages Source: IQVIA MIDAS, Internal estimates Insulin prescription trends have remained consistent • Weekly GLP-1 therapies have been marketed for several years • Over that time, insulin prescription trends globally have remained relatively consistent, demonstrating that insulin remains an important treatment option for type 2 diabetes even with the availability of GLP-1 therapies • While total insulin requirements on a per day basis may decrease with concomitant use, the number of injections may not proportionately decrease (less IUs/injection) The number of patients that switch from insulin to weekly GLP-1 therapy is relatively low “I just have not been successful in getting [patients] off insulin and switching them to GLP-1s… their A1Cs just don’t come down enough when they’re off insulin” —Internal Medicine Clinician, U.S. “I don’t have many patients who are on insulin that we give a GLP-1, we focus on patients who are on oral drugs to switch them to GLP-1” —Endocrinologist, India 180 160 140 120 100 80 60 40 20 0 Dec– 22 Dec– 23 Dec– 24 Month St an da rd u ni ts ( m ill io ns ) GLP-1 Daily (17%) Insulin Total +0.4% Insulin Vial (1.5%) Insulin Pen +0.7% GLP-1 Weekly +35% CAGR
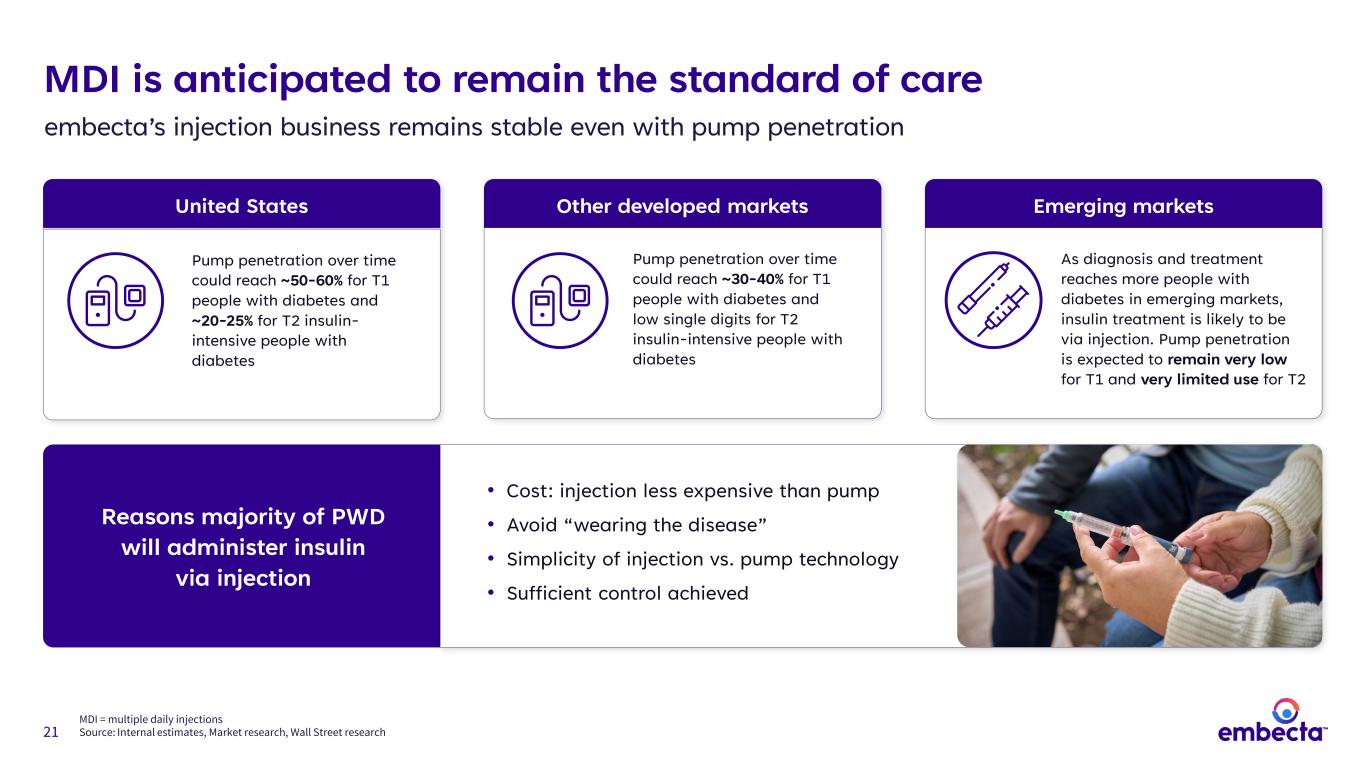
21 Reasons majority of PWD will administer insulin via injection MDI is anticipated to remain the standard of care embecta’s injection business remains stable even with pump penetration United States Pump penetration over time could reach ~50-60% for T1 people with diabetes and ~20-25% for T2 insulin- intensive people with diabetes Other developed markets Pump penetration over time could reach ~30-40% for T1 people with diabetes and low single digits for T2 insulin-intensive people with diabetes Emerging markets As diagnosis and treatment reaches more people with diabetes in emerging markets, insulin treatment is likely to be via injection. Pump penetration is expected to remain very low for T1 and very limited use for T2 • Cost: injection less expensive than pump • Avoid “wearing the disease” • Simplicity of injection vs. pump technology • Sufficient control achieved MDI = multiple daily injections Source: Internal estimates, Market research, Wall Street research
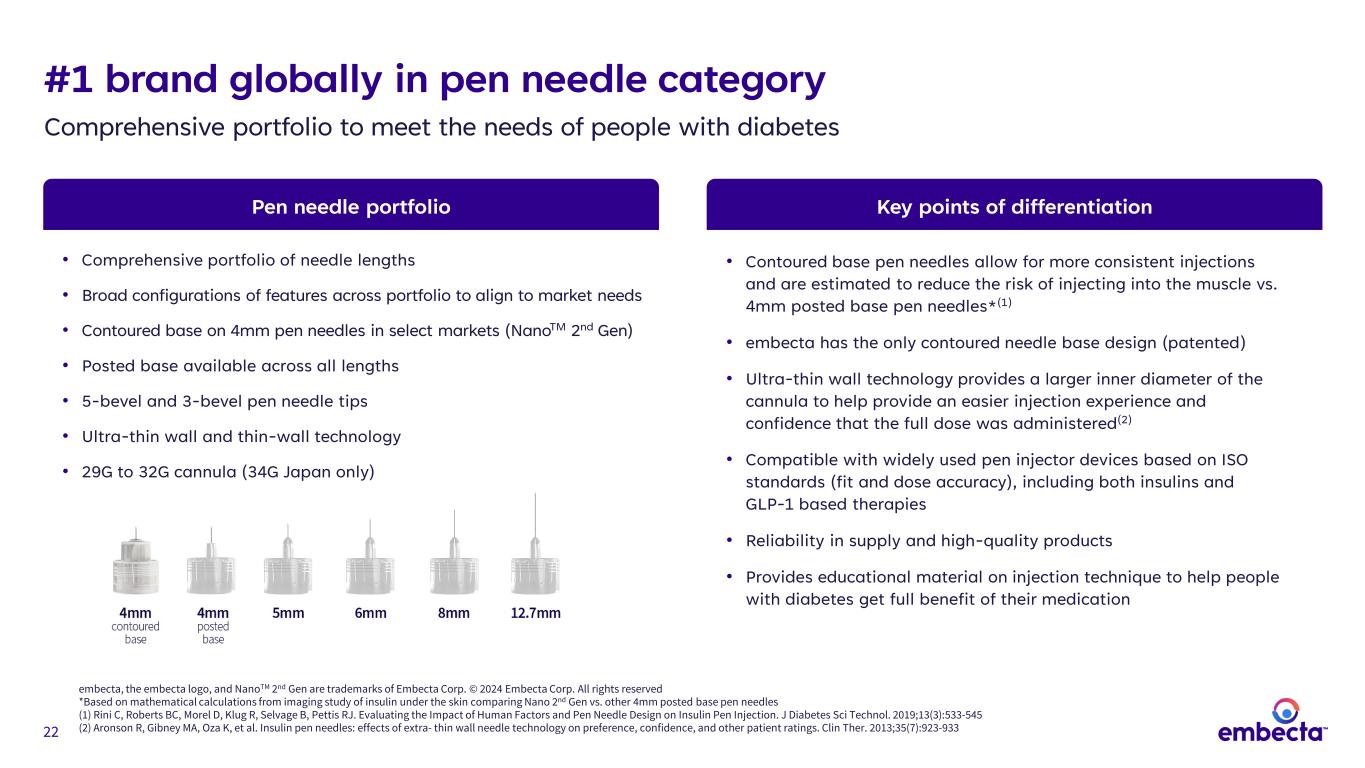
22 #1 brand globally in pen needle category Comprehensive portfolio to meet the needs of people with diabetes Pen needle portfolio • Comprehensive portfolio of needle lengths • Broad configurations of features across portfolio to align to market needs • Contoured base on 4mm pen needles in select markets (NanoTM 2nd Gen) • Posted base available across all lengths • 5-bevel and 3-bevel pen needle tips • Ultra-thin wall and thin-wall technology • 29G to 32G cannula (34G Japan only) Key points of differentiation • Contoured base pen needles allow for more consistent injections and are estimated to reduce the risk of injecting into the muscle vs. 4mm posted base pen needles*(1) • embecta has the only contoured needle base design (patented) • Ultra-thin wall technology provides a larger inner diameter of the cannula to help provide an easier injection experience and confidence that the full dose was administered(2) • Compatible with widely used pen injector devices based on ISO standards (fit and dose accuracy), including both insulins and GLP-1 based therapies • Reliability in supply and high-quality products • Provides educational material on injection technique to help people with diabetes get full benefit of their medication embecta, the embecta logo, and NanoTM 2nd Gen are trademarks of Embecta Corp. © 2024 Embecta Corp. All rights reserved *Based on mathematical calculations from imaging study of insulin under the skin comparing Nano 2nd Gen vs. other 4mm posted base pen needles (1) Rini C, Roberts BC, Morel D, Klug R, Selvage B, Pettis RJ. Evaluating the Impact of Human Factors and Pen Needle Design on Insulin Pen Injection. J Diabetes Sci Technol. 2019;13(3):533-545 (2) Aronson R, Gibney MA, Oza K, et al. Insulin pen needles: effects of extra- thin wall needle technology on preference, confidence, and other patient ratings. Clin Ther. 2013;35(7):923-933
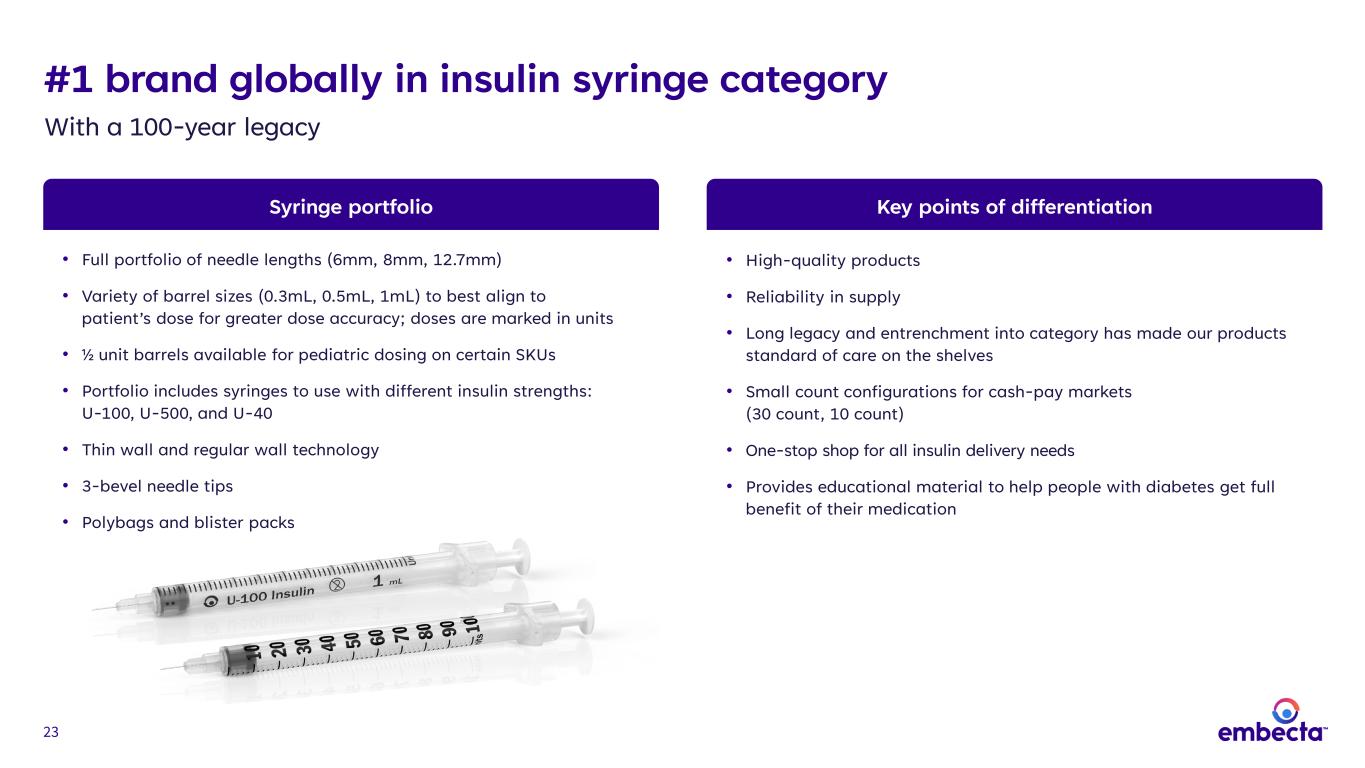
23 #1 brand globally in insulin syringe category With a 100-year legacy Syringe portfolio Key points of differentiation • High-quality products • Reliability in supply • Long legacy and entrenchment into category has made our products standard of care on the shelves • Small count configurations for cash-pay markets (30 count, 10 count) • One-stop shop for all insulin delivery needs • Provides educational material to help people with diabetes get full benefit of their medication • Full portfolio of needle lengths (6mm, 8mm, 12.7mm) • Variety of barrel sizes (0.3mL, 0.5mL, 1mL) to best align to patient’s dose for greater dose accuracy; doses are marked in units • ½ unit barrels available for pediatric dosing on certain SKUs • Portfolio includes syringes to use with different insulin strengths: U-100, U-500, and U-40 • Thin wall and regular wall technology • 3-bevel needle tips • Polybags and blister packs
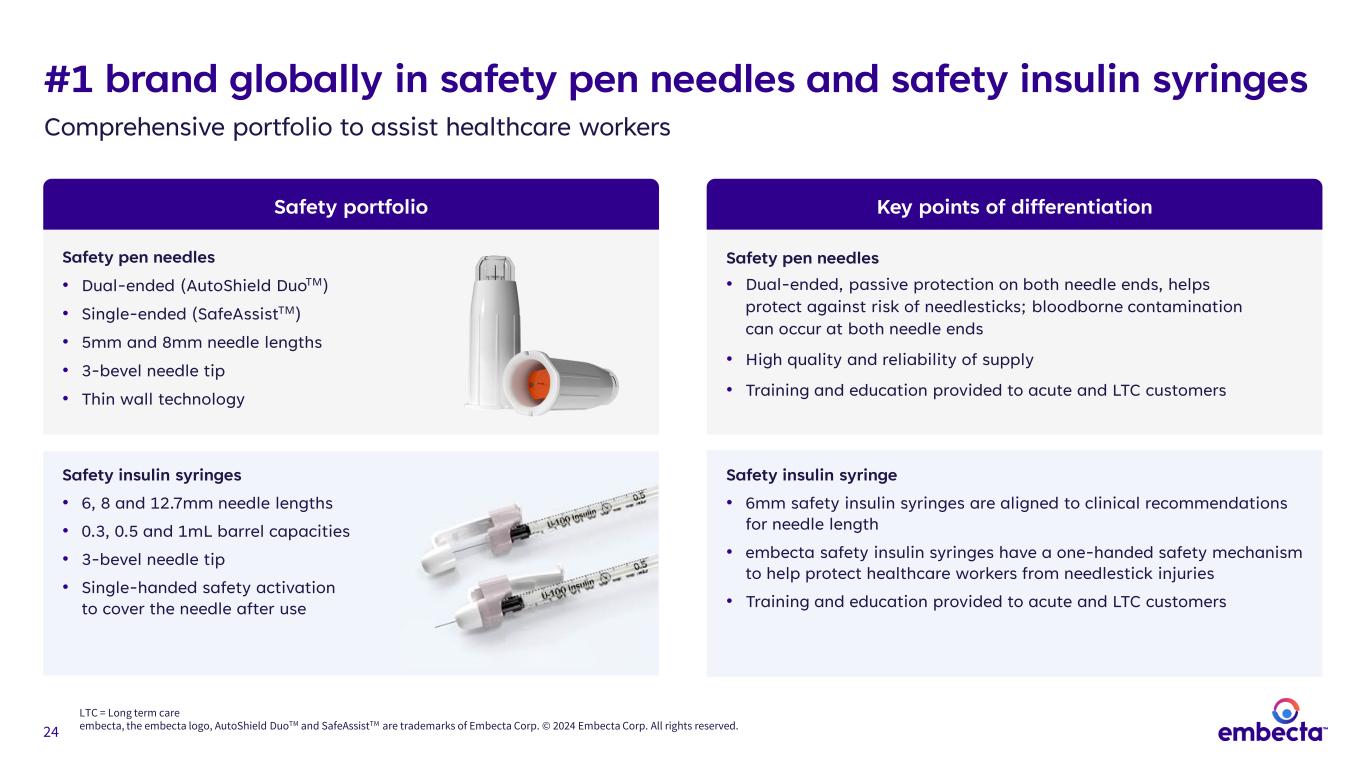
24 #1 brand globally in safety pen needles and safety insulin syringes Comprehensive portfolio to assist healthcare workers LTC = Long term care embecta, the embecta logo, AutoShield DuoTM and SafeAssistTM are trademarks of Embecta Corp. © 2024 Embecta Corp. All rights reserved. Safety portfolio Key points of differentiation Safety pen needles • Dual-ended (AutoShield DuoTM) • Single-ended (SafeAssistTM) • 5mm and 8mm needle lengths • 3-bevel needle tip • Thin wall technology Safety pen needles • Dual-ended, passive protection on both needle ends, helps protect against risk of needlesticks; bloodborne contamination can occur at both needle ends • High quality and reliability of supply • Training and education provided to acute and LTC customers Safety insulin syringes • 6, 8 and 12.7mm needle lengths • 0.3, 0.5 and 1mL barrel capacities • 3-bevel needle tip • Single-handed safety activation to cover the needle after use Safety insulin syringe • 6mm safety insulin syringes are aligned to clinical recommendations for needle length • embecta safety insulin syringes have a one-handed safety mechanism to help protect healthcare workers from needlestick injuries • Training and education provided to acute and LTC customers
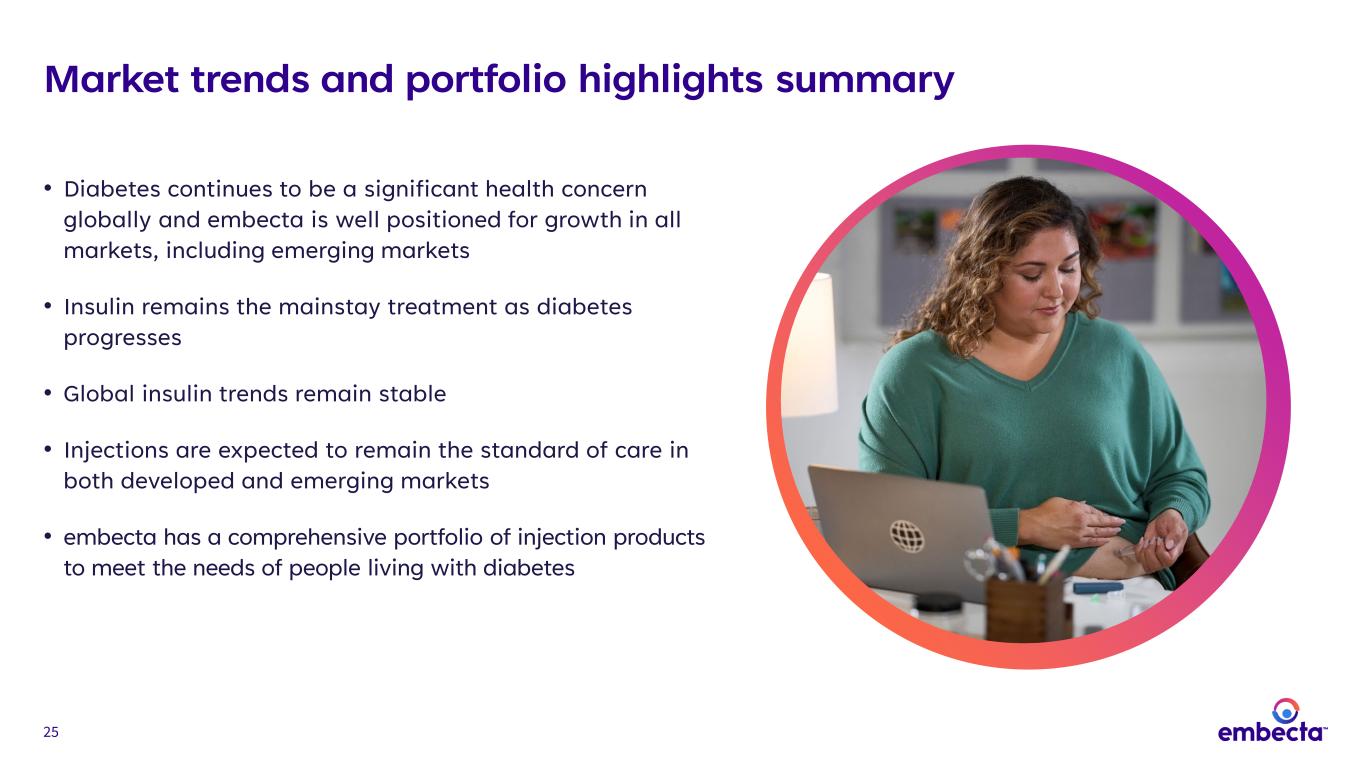
25 Market trends and portfolio highlights summary • Diabetes continues to be a significant health concern globally and embecta is well positioned for growth in all markets, including emerging markets • Insulin remains the mainstay treatment as diabetes progresses • Global insulin trends remain stable • Injections are expected to remain the standard of care in both developed and emerging markets • embecta has a comprehensive portfolio of injection products to meet the needs of people living with diabetes
26 26 Tom Blount Senior Vice President, President North America U.S. business and strategy
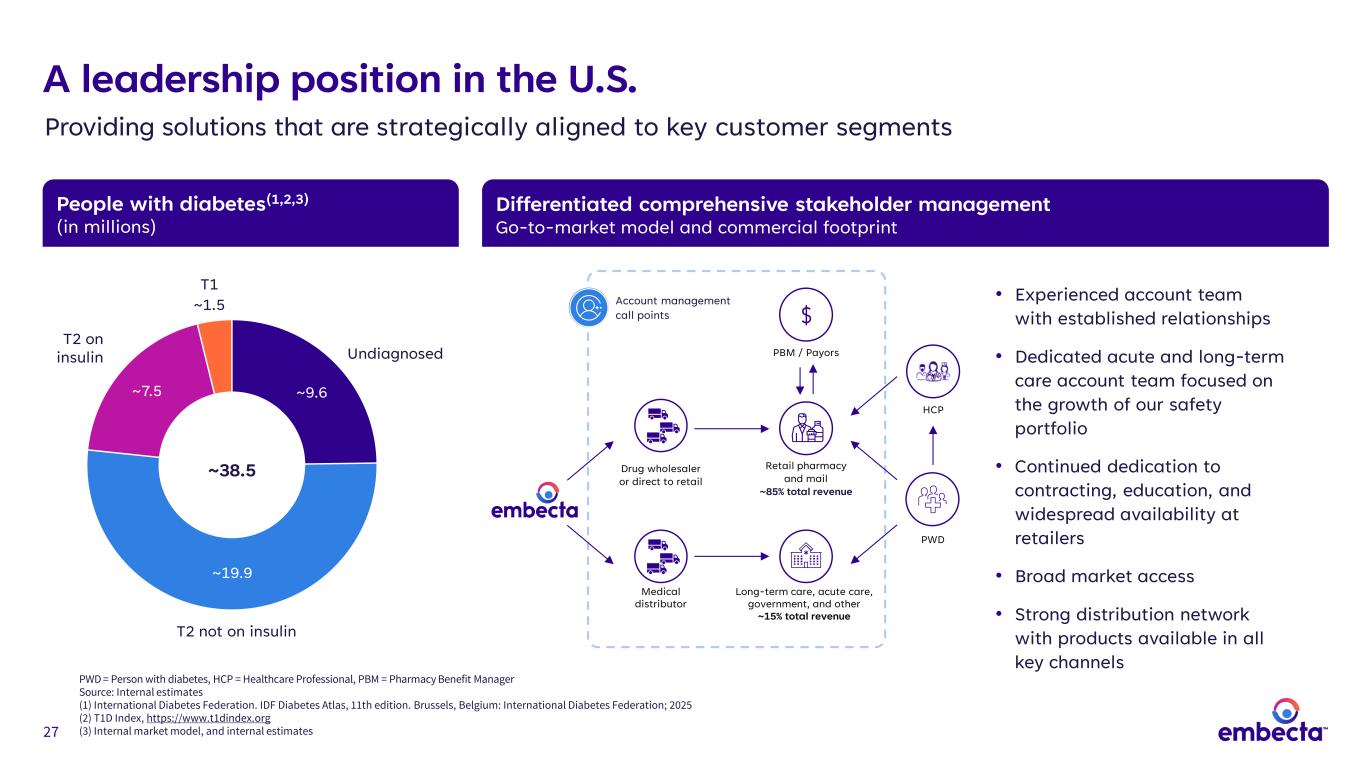
27 People with diabetes(1,2,3) (in millions) Differentiated comprehensive stakeholder management Go-to-market model and commercial footprint PWD = Person with diabetes, HCP = Healthcare Professional, PBM = Pharmacy Benefit Manager Source: Internal estimates (1) International Diabetes Federation. IDF Diabetes Atlas, 11th edition. Brussels, Belgium: International Diabetes Federation; 2025 (2) T1D Index, https://www.t1dindex.org (3) Internal market model, and internal estimates • Experienced account team with established relationships • Dedicated acute and long-term care account team focused on the growth of our safety portfolio • Continued dedication to contracting, education, and widespread availability at retailers • Broad market access • Strong distribution network with products available in all key channels A leadership position in the U.S. Providing solutions that are strategically aligned to key customer segments ~9.6 ~19.9 ~7.5 T1 ~1.5 ~38.5 T2 on insulin T2 not on insulin Undiagnosed PWD Long-term care, acute care, government, and other ~15% total revenue Retail pharmacy and mail ~85% total revenue PBM / Payors HCP Drug wholesaler or direct to retail Medical distributor Account management call points
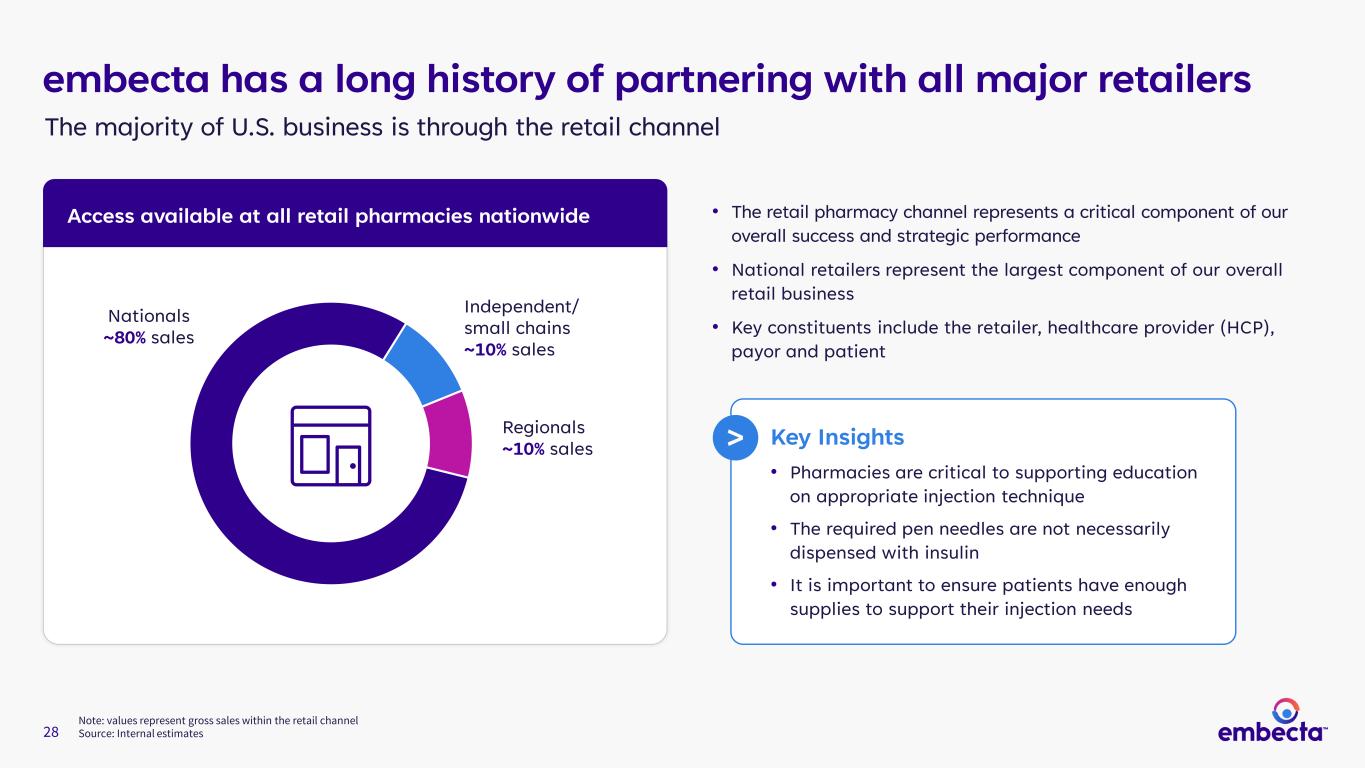
28 Note: values represent gross sales within the retail channel Source: Internal estimates Nationals ~80% sales Independent/ small chains ~10% sales Regionals ~10% sales embecta has a long history of partnering with all major retailers • The retail pharmacy channel represents a critical component of our overall success and strategic performance • National retailers represent the largest component of our overall retail business • Key constituents include the retailer, healthcare provider (HCP), payor and patient The majority of U.S. business is through the retail channel Access available at all retail pharmacies nationwide Key Insights • Pharmacies are critical to supporting education on appropriate injection technique • The required pen needles are not necessarily dispensed with insulin • It is important to ensure patients have enough supplies to support their injection needs >
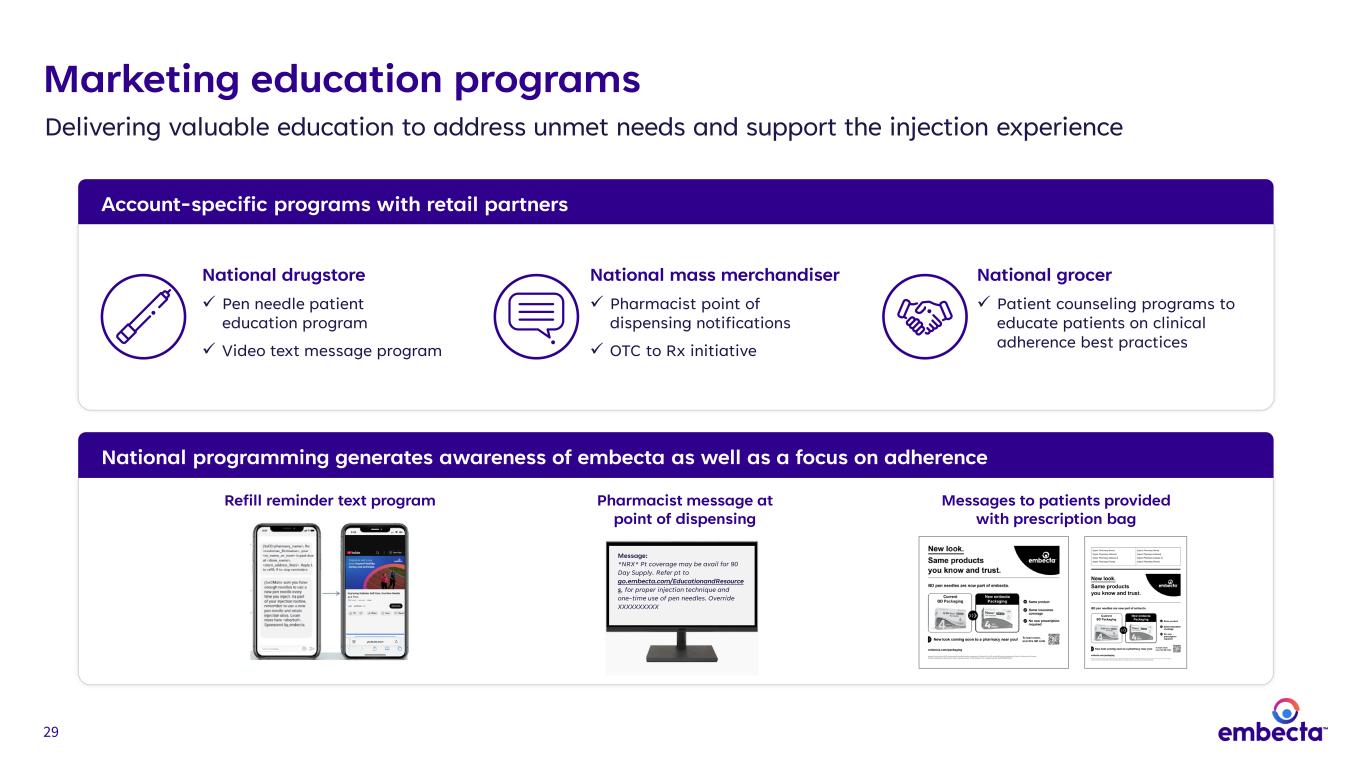
29 Marketing education programs Account-specific programs with retail partners Delivering valuable education to address unmet needs and support the injection experience Refill reminder text program Messages to patients provided with prescription bag Message: *NRX* Pt coverage may be avail for 90 Day Supply. Refer pt to go.embecta.com/EducationandResource s, for proper injection technique and one-time use of pen needles. Override XXXXXXXXXX Pharmacist message at point of dispensing National programming generates awareness of embecta as well as a focus on adherence National drugstore Pen needle patient education program Video text message program National mass merchandiser Pharmacist point of dispensing notifications OTC to Rx initiative National grocer Patient counseling programs to educate patients on clinical adherence best practices
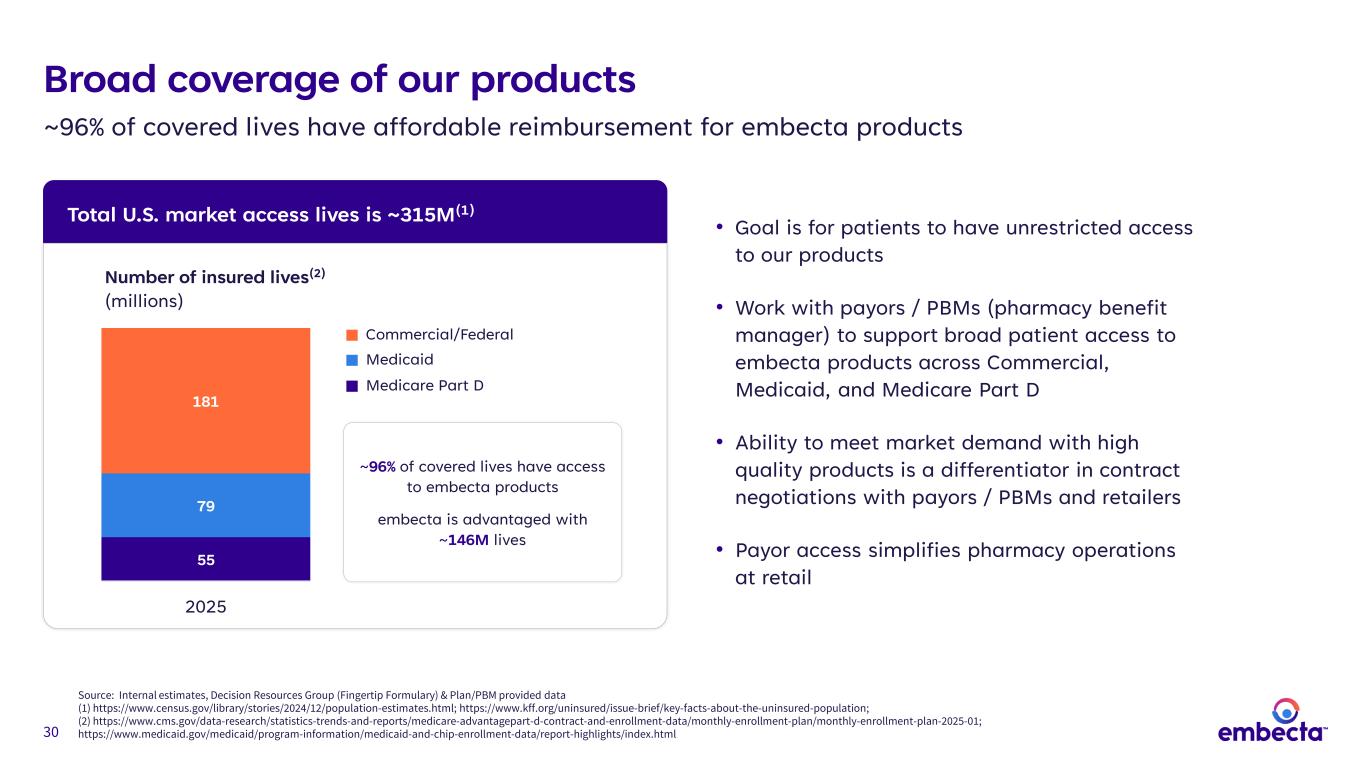
30 Broad coverage of our products Total U.S. market access lives is ~315M(1) • Goal is for patients to have unrestricted access to our products • Work with payors / PBMs (pharmacy benefit manager) to support broad patient access to embecta products across Commercial, Medicaid, and Medicare Part D • Ability to meet market demand with high quality products is a differentiator in contract negotiations with payors / PBMs and retailers • Payor access simplifies pharmacy operations at retail 55 79 181 2025 Number of insured lives(2) (millions) ~96% of covered lives have access to embecta products embecta is advantaged with ~146M lives Medicare Part D Medicaid Commercial/Federal ~96% of covered lives have affordable reimbursement for embecta products Source: Internal estimates, Decision Resources Group (Fingertip Formulary) & Plan/PBM provided data (1) https://www.census.gov/library/stories/2024/12/population-estimates.html; https://www.kff.org/uninsured/issue-brief/key-facts-about-the-uninsured-population; (2) https://www.cms.gov/data-research/statistics-trends-and-reports/medicare-advantagepart-d-contract-and-enrollment-data/monthly-enrollment-plan/monthly-enrollment-plan-2025-01; https://www.medicaid.gov/medicaid/program-information/medicaid-and-chip-enrollment-data/report-highlights/index.html
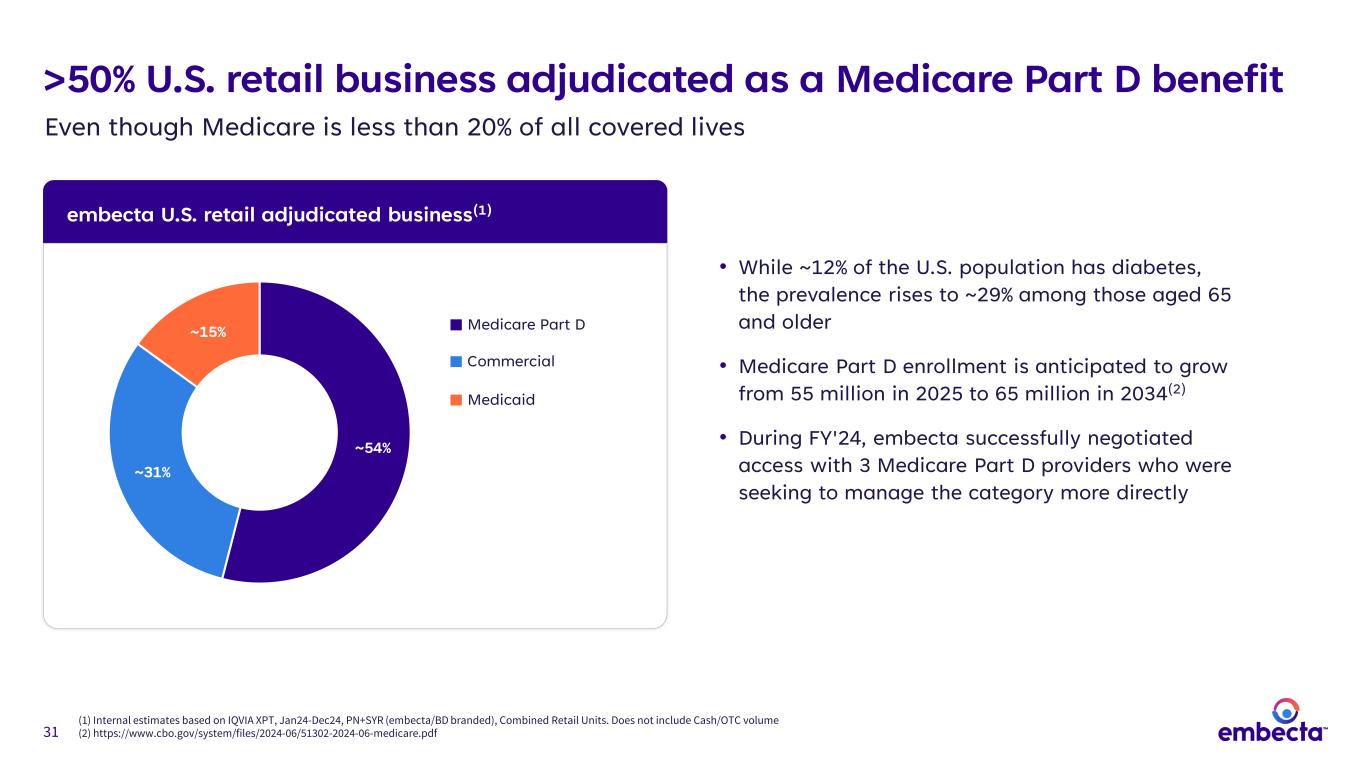
31 embecta U.S. retail adjudicated business(1) (1) Internal estimates based on IQVIA XPT, Jan24-Dec24, PN+SYR (embecta/BD branded), Combined Retail Units. Does not include Cash/OTC volume (2) https://www.cbo.gov/system/files/2024-06/51302-2024-06-medicare.pdf >50% U.S. retail business adjudicated as a Medicare Part D benefit • While ~12% of the U.S. population has diabetes, the prevalence rises to ~29% among those aged 65 and older • Medicare Part D enrollment is anticipated to grow from 55 million in 2025 to 65 million in 2034(2) • During FY'24, embecta successfully negotiated access with 3 Medicare Part D providers who were seeking to manage the category more directly ~54% ~31% ~15% Medicare Part D Commercial Medicaid Even though Medicare is less than 20% of all covered lives
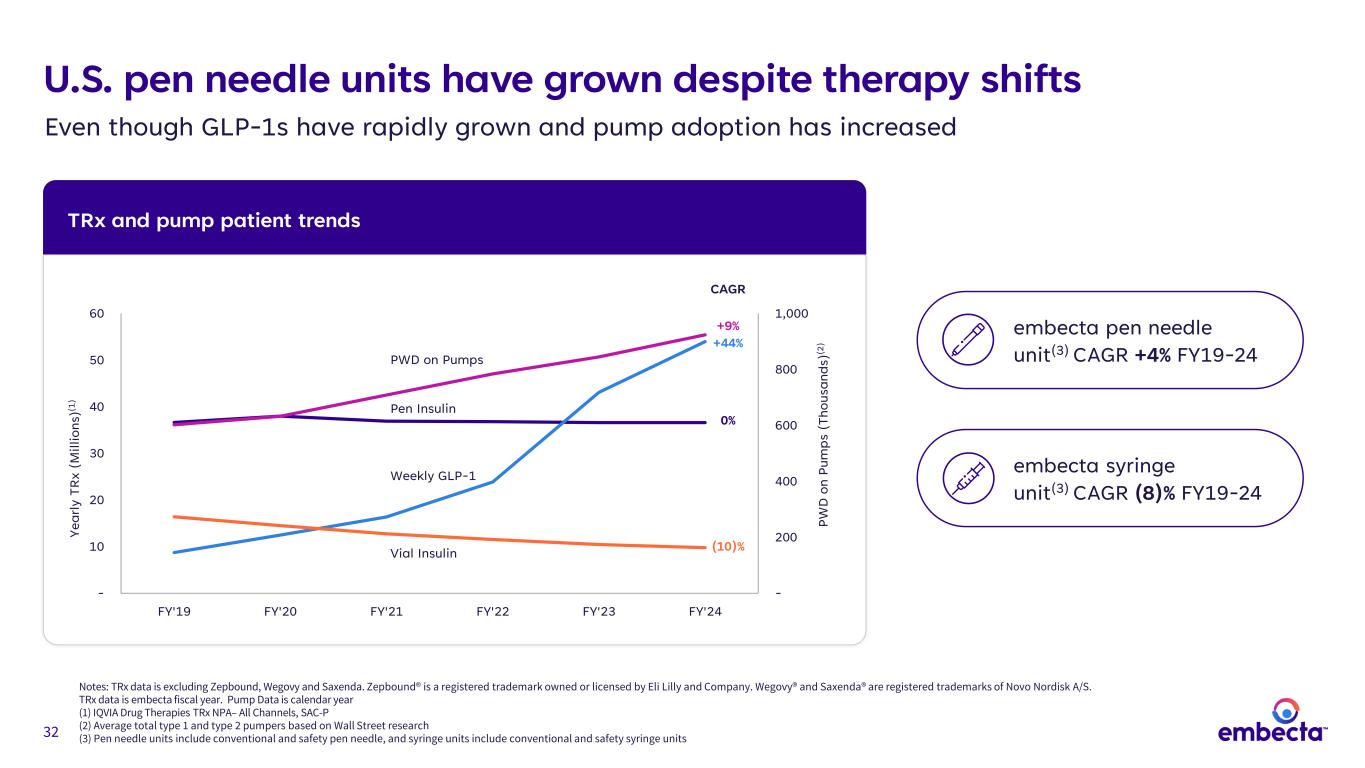
32 U.S. pen needle units have grown despite therapy shifts Even though GLP-1s have rapidly grown and pump adoption has increased TRx and pump patient trends Notes: TRx data is excluding Zepbound, Wegovy and Saxenda. Zepbound® is a registered trademark owned or licensed by Eli Lilly and Company. Wegovy® and Saxenda® are registered trademarks of Novo Nordisk A/S. TRx data is embecta fiscal year. Pump Data is calendar year (1) IQVIA Drug Therapies TRx NPA– All Channels, SAC-P (2) Average total type 1 and type 2 pumpers based on Wall Street research (3) Pen needle units include conventional and safety pen needle, and syringe units include conventional and safety syringe units - 200 400 600 800 1,000 - 10 20 30 40 50 60 FY'19 FY'20 FY'21 FY'22 FY'23 FY'24 PW D o n Pu m ps ( Th ou sa nd s) (2 ) Ye ar ly T R x (M ill io ns )(1 ) +44% 0% CAGR PWD on Pumps Weekly GLP-1 (10)% Pen Insulin Vial Insulin +9% embecta pen needle unit(3) CAGR +4% FY19-24 embecta syringe unit(3) CAGR (8)% FY19-24
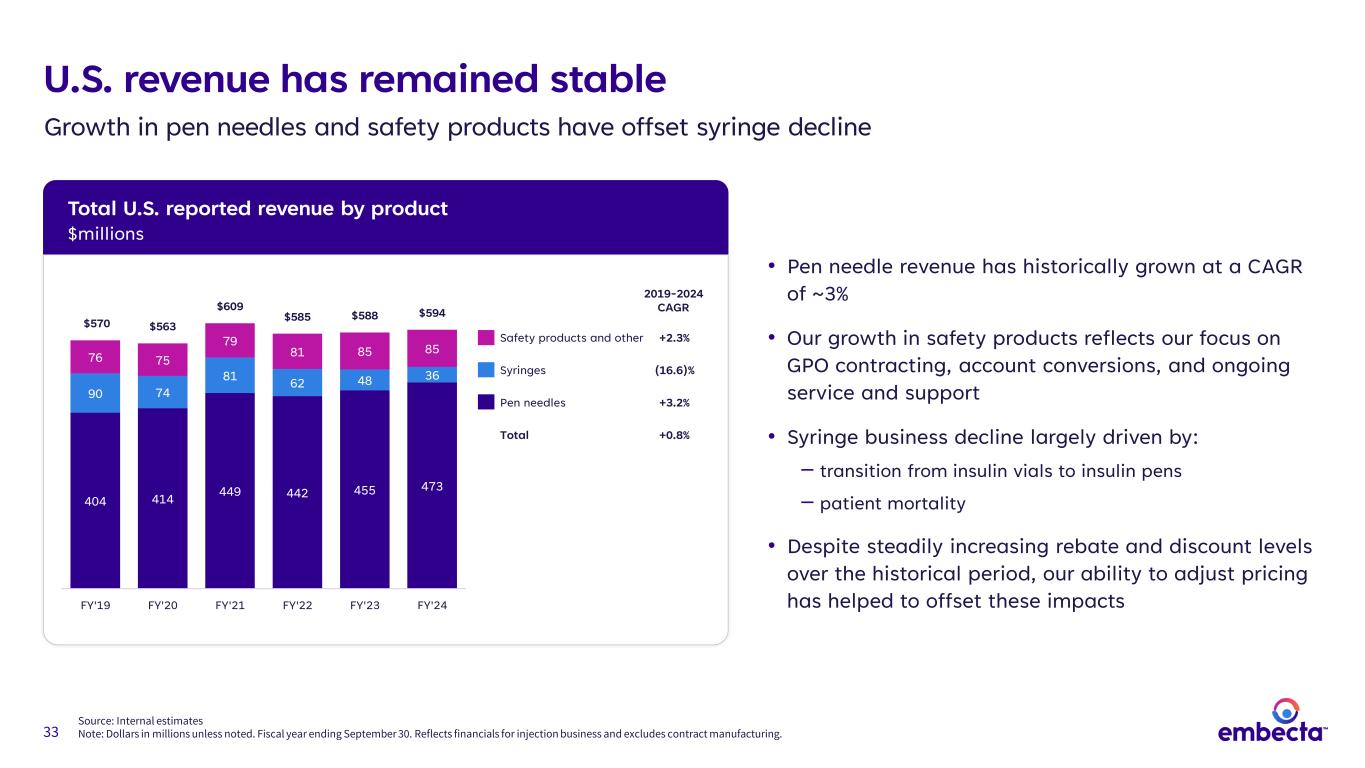
33 Source: Internal estimates Note: Dollars in millions unless noted. Fiscal year ending September 30. Reflects financials for injection business and excludes contract manufacturing. U.S. revenue has remained stable Growth in pen needles and safety products have offset syringe decline • Pen needle revenue has historically grown at a CAGR of ~3% • Our growth in safety products reflects our focus on GPO contracting, account conversions, and ongoing service and support • Syringe business decline largely driven by: ‒ transition from insulin vials to insulin pens ‒ patient mortality • Despite steadily increasing rebate and discount levels over the historical period, our ability to adjust pricing has helped to offset these impacts 404 414 449 442 455 473 90 74 81 62 48 36 76 75 79 81 85 85 $570 $563 $609 $585 $588 $594 FY'19 FY'20 FY'21 FY'22 FY'23 FY'24 2019-2024 CAGR Safety products and other +2.3% Syringes (16.6)% Pen needles +3.2% Total +0.8% Total U.S. reported revenue by product $millions
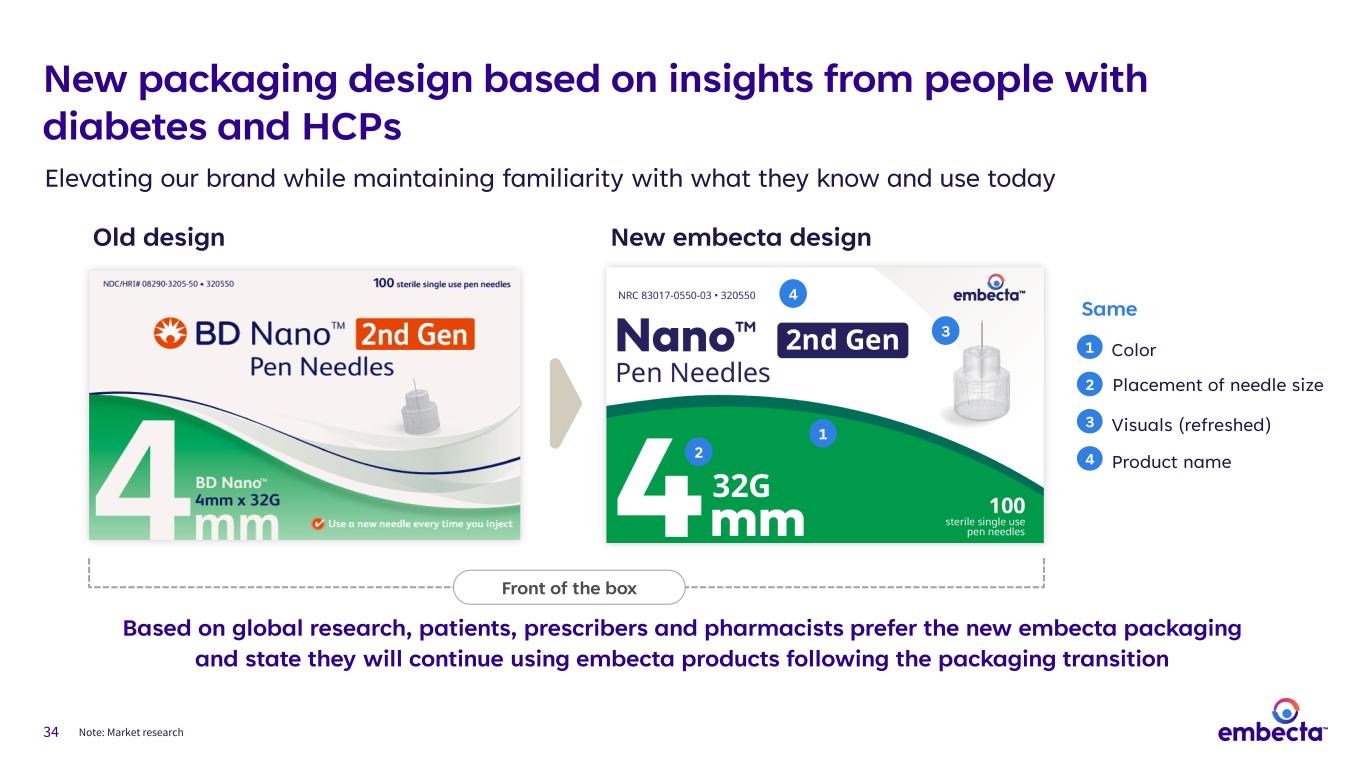
34 Elevating our brand while maintaining familiarity with what they know and use today Note: Market research Old design New embecta design Based on global research, patients, prescribers and pharmacists prefer the new embecta packaging and state they will continue using embecta products following the packaging transition 1 2 3 4 Same 1 2 3 4 Color Product name Visuals (refreshed) Placement of needle size Front of the box New packaging design based on insights from people with diabetes and HCPs
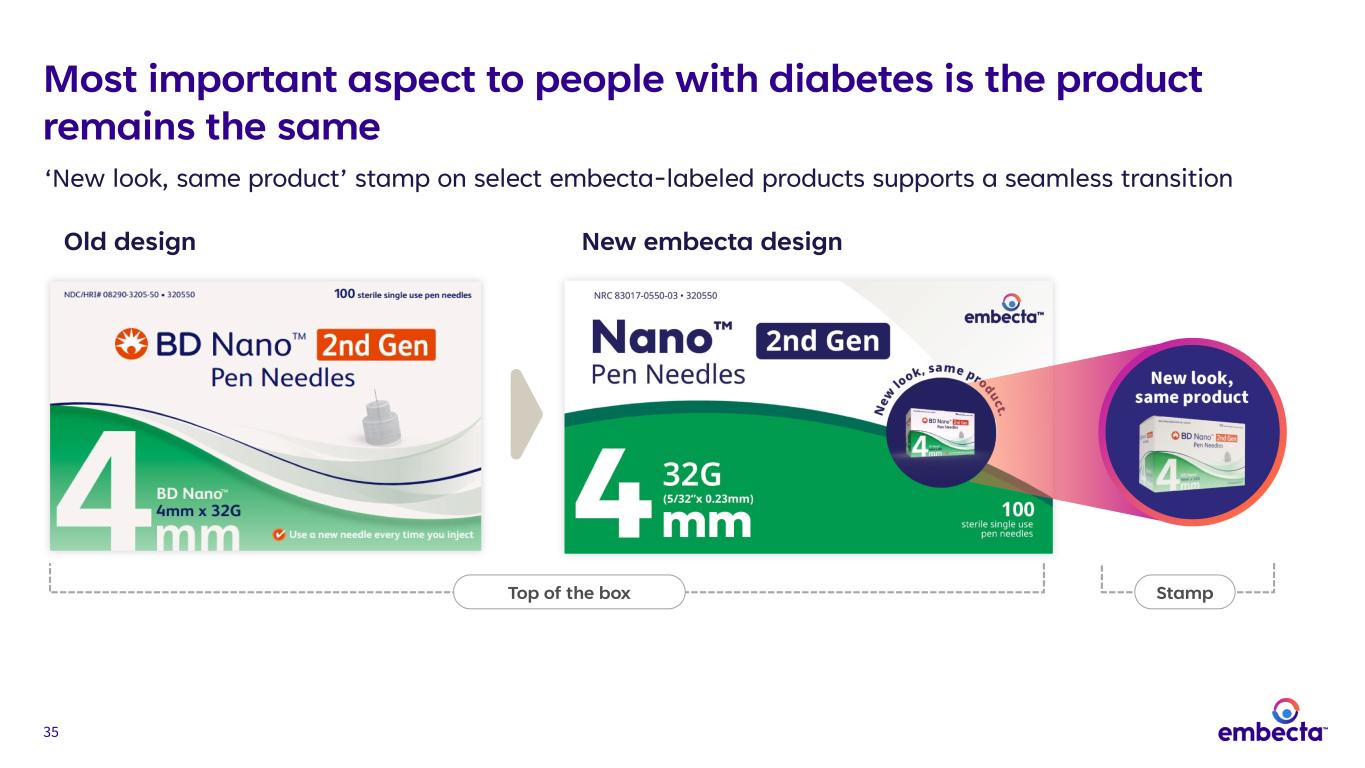
35 Stamp Old design New embecta design Top of the box ‘New look, same product’ stamp on select embecta-labeled products supports a seamless transition Most important aspect to people with diabetes is the product remains the same
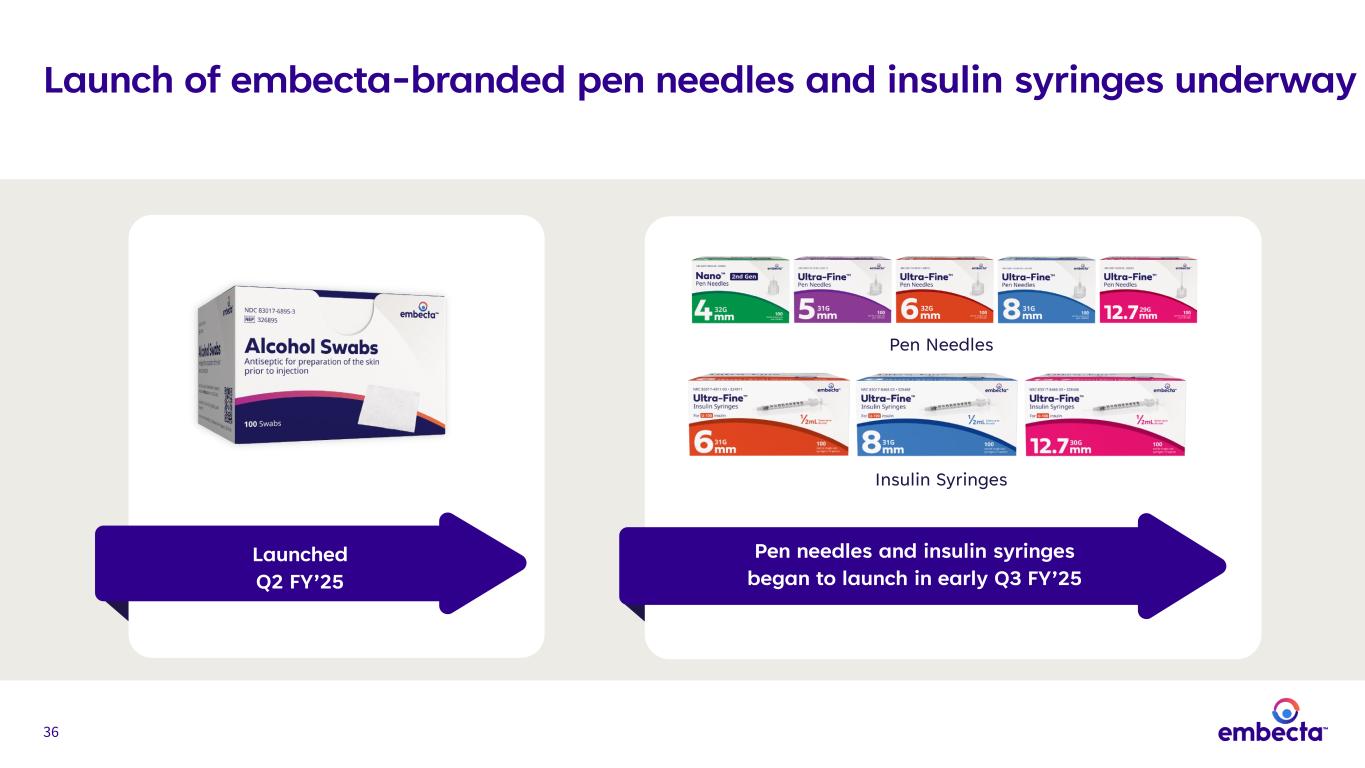
36 Launch of embecta-branded pen needles and insulin syringes underway Launched Q2 FY’25 Pen needles and insulin syringes began to launch in early Q3 FY’25 Pen Needles Insulin Syringes
37 U.S. business and strategy summary • U.S. revenue has remained stable, with growth in pen needles and safety products offsetting declines in syringes • Our products are widely available across all key channels supported by world-class manufacturing and distribution • The majority of U.S. business is through the retail channel, where we have a long history of partnerships • Our business is bolstered through broad payor coverage, driven by our ability to supply and meet demand • Launch of embecta-branded products is underway • We are actively pursuing growth opportunities through distribution agreements and commercial partnerships

38 38 Slobodan Radumilo Senior Vice President, President International International business and strategy
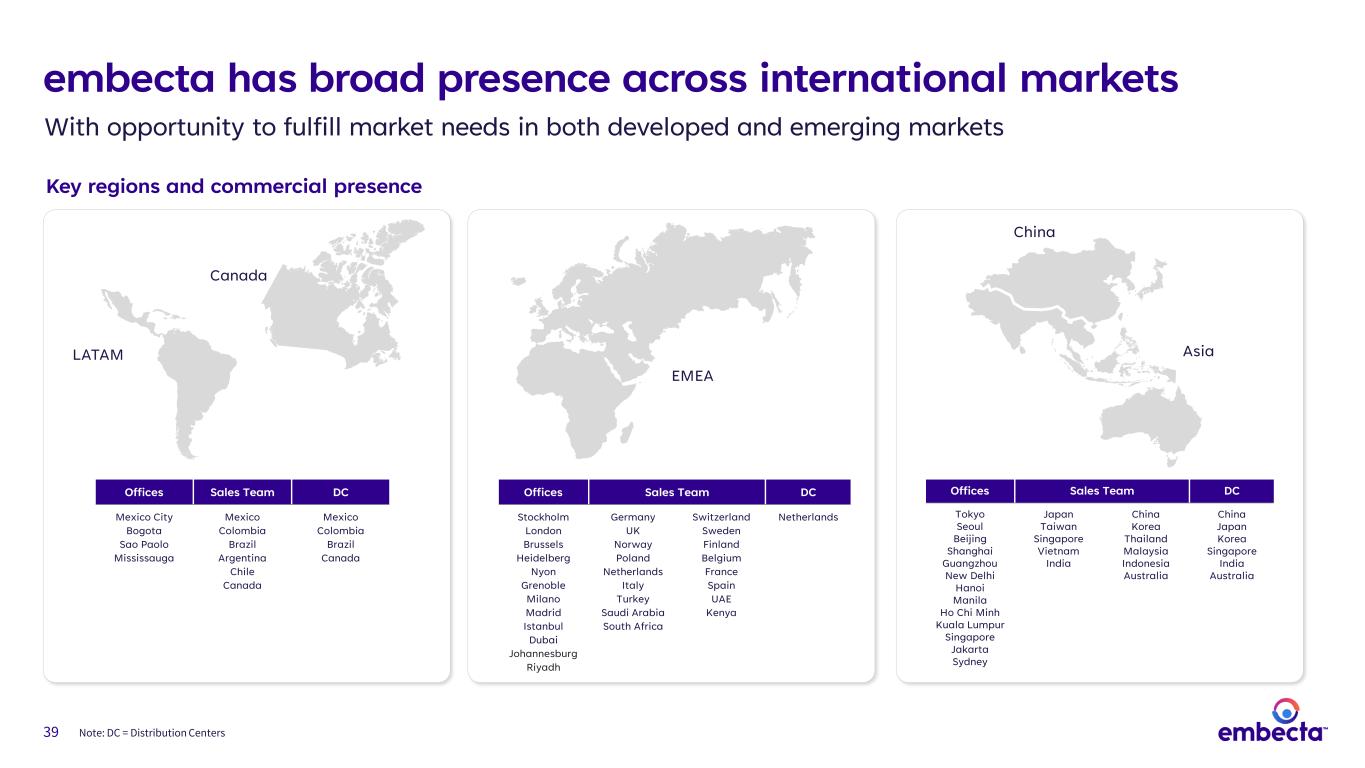
39 embecta has broad presence across international markets Note: DC = Distribution Centers With opportunity to fulfill market needs in both developed and emerging markets Offices Sales Team DC Mexico City Bogota Sao Paolo Mississauga Mexico Colombia Brazil Argentina Chile Canada Mexico Colombia Brazil Canada Offices Sales Team DC Stockholm London Brussels Heidelberg Nyon Grenoble Milano Madrid Istanbul Dubai Johannesburg Riyadh Germany UK Norway Poland Netherlands Italy Turkey Saudi Arabia South Africa Switzerland Sweden Finland Belgium France Spain UAE Kenya Netherlands Offices Sales Team DC Tokyo Seoul Beijing Shanghai Guangzhou New Delhi Hanoi Manila Ho Chi Minh Kuala Lumpur Singapore Jakarta Sydney Japan Taiwan Singapore Vietnam India China Korea Thailand Malaysia Indonesia Australia China Japan Korea Singapore India Australia EMEA China Asia Key regions and commercial presence Canada LATAM

40 Developed markets
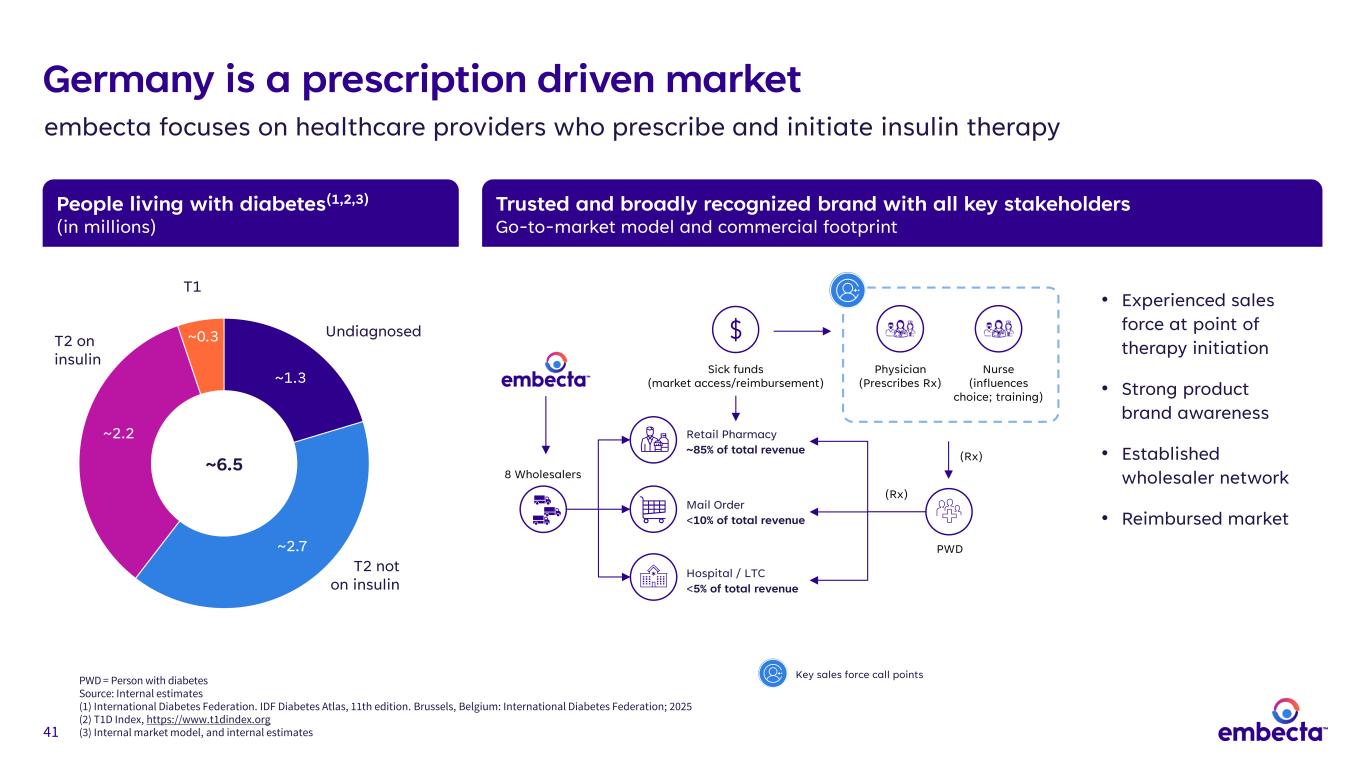
41 People living with diabetes(1,2,3) (in millions) Trusted and broadly recognized brand with all key stakeholders Go-to-market model and commercial footprint • Experienced sales force at point of therapy initiation • Strong product brand awareness • Established wholesaler network • Reimbursed market Germany is a prescription driven market embecta focuses on healthcare providers who prescribe and initiate insulin therapy ~1.3 ~2.7 ~2.2 ~0.3 ~6.5 T1 T2 on insulin T2 not on insulin Undiagnosed 8 Wholesalers Hospital / LTC <5% of total revenue Mail Order <10% of total revenue Retail Pharmacy ~85% of total revenue Sick funds (market access/reimbursement) Physician (Prescribes Rx) Nurse (influences choice; training) PWD (Rx) (Rx) PWD = Person with diabetes Source: Internal estimates (1) International Diabetes Federation. IDF Diabetes Atlas, 11th edition. Brussels, Belgium: International Diabetes Federation; 2025 (2) T1D Index, https://www.t1dindex.org (3) Internal market model, and internal estimates Key sales force call points
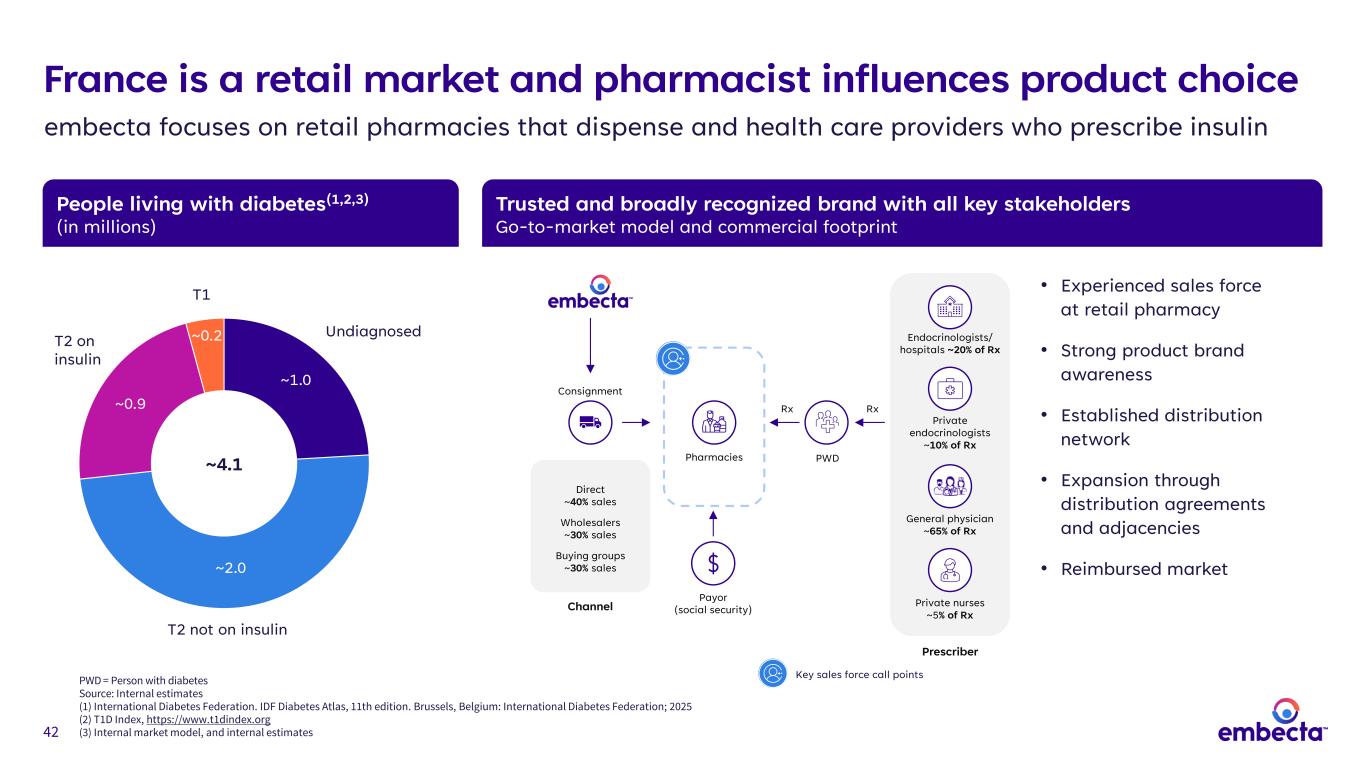
42 People living with diabetes(1,2,3) (in millions) Trusted and broadly recognized brand with all key stakeholders Go-to-market model and commercial footprint Prescriber Endocrinologists/ hospitals ~20% of Rx Private endocrinologists ~10% of Rx General physician ~65% of Rx Private nurses ~5% of Rx PWD Consignment Direct ~40% sales Wholesalers ~30% sales Buying groups ~30% sales Channel Pharmacies France is a retail market and pharmacist influences product choice embecta focuses on retail pharmacies that dispense and health care providers who prescribe insulin ~1.0 ~2.0 ~0.9 ~0.2 ~4.1 T1 T2 on insulin Undiagnosed T2 not on insulin RxRx • Experienced sales force at retail pharmacy • Strong product brand awareness • Established distribution network • Expansion through distribution agreements and adjacencies • Reimbursed market Payor (social security) Key sales force call pointsPWD = Person with diabetes Source: Internal estimates (1) International Diabetes Federation. IDF Diabetes Atlas, 11th edition. Brussels, Belgium: International Diabetes Federation; 2025 (2) T1D Index, https://www.t1dindex.org (3) Internal market model, and internal estimates
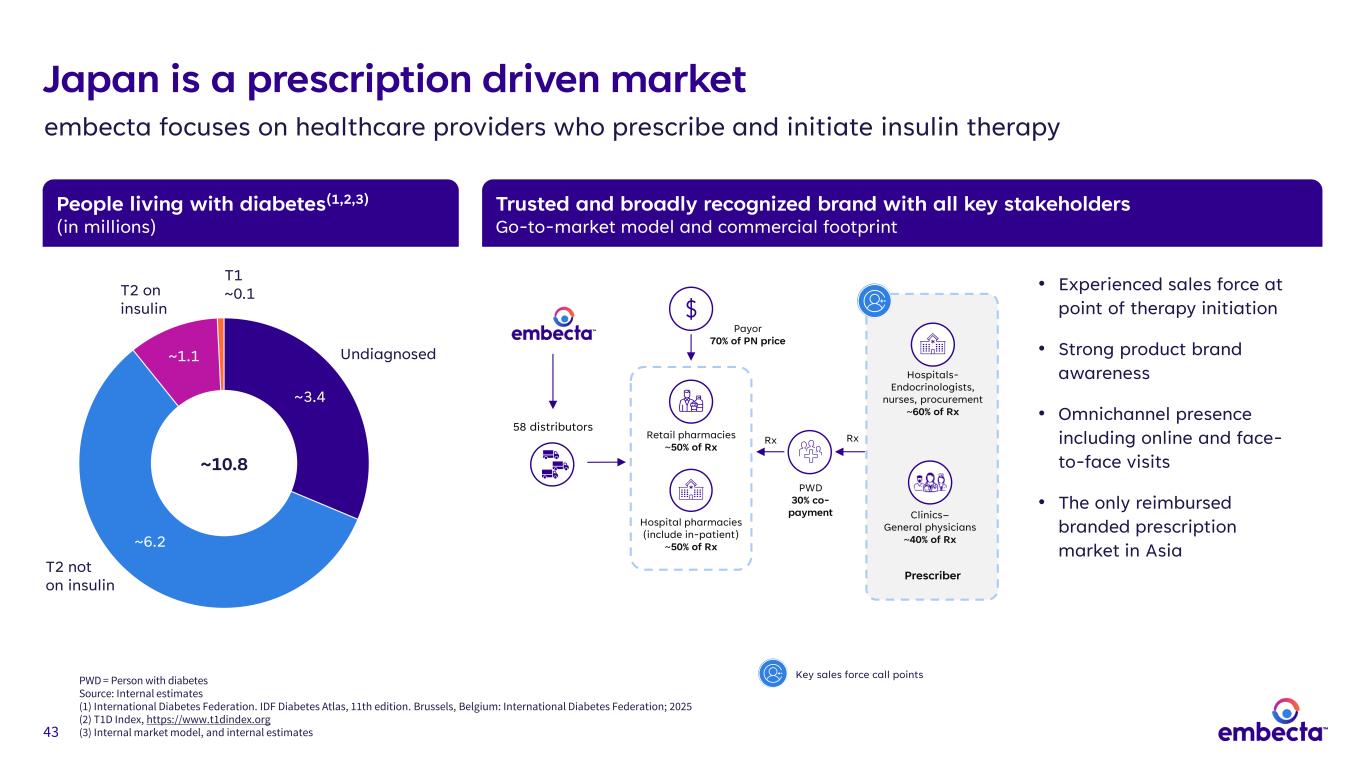
43 People living with diabetes(1,2,3) (in millions) Trusted and broadly recognized brand with all key stakeholders Go-to-market model and commercial footprint • Experienced sales force at point of therapy initiation • Strong product brand awareness • Omnichannel presence including online and face- to-face visits • The only reimbursed branded prescription market in Asia Japan is a prescription driven market embecta focuses on healthcare providers who prescribe and initiate insulin therapy T2 on insulin T2 not on insulin Undiagnosed T1 ~0.1 ~3.4 ~6.2 ~1.1 ~10.8 Prescriber Hospitals- Endocrinologists, nurses, procurement ~60% of Rx Clinics– General physicians ~40% of Rx PWD 30% co- payment Payor 70% of PN price Rx 58 distributors Retail pharmacies ~50% of Rx Hospital pharmacies (include in-patient) ~50% of Rx Rx Key sales force call pointsPWD = Person with diabetes Source: Internal estimates (1) International Diabetes Federation. IDF Diabetes Atlas, 11th edition. Brussels, Belgium: International Diabetes Federation; 2025 (2) T1D Index, https://www.t1dindex.org (3) Internal market model, and internal estimates
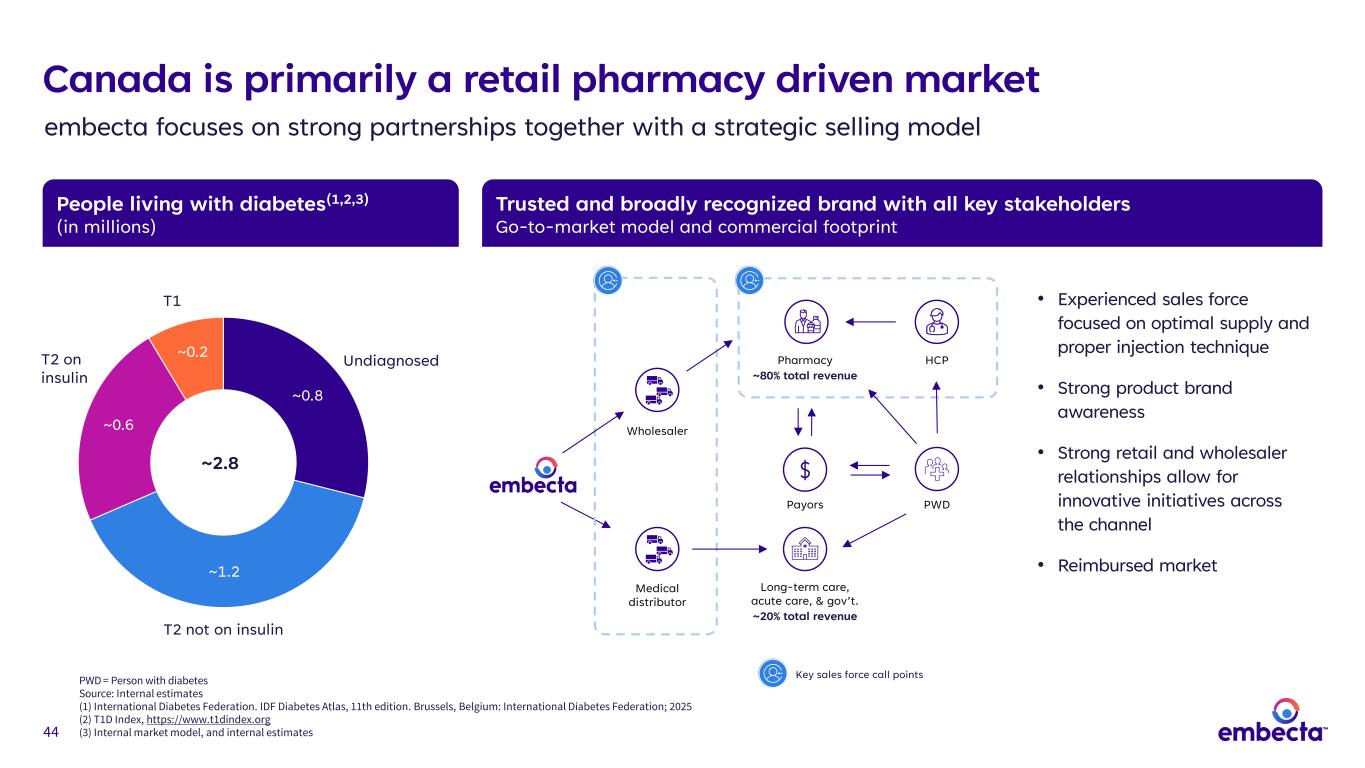
44 People living with diabetes(1,2,3) (in millions) Trusted and broadly recognized brand with all key stakeholders Go-to-market model and commercial footprint • Experienced sales force focused on optimal supply and proper injection technique • Strong product brand awareness • Strong retail and wholesaler relationships allow for innovative initiatives across the channel • Reimbursed market Wholesaler Medical distributor Canada is primarily a retail pharmacy driven market embecta focuses on strong partnerships together with a strategic selling model ~0.8 ~1.2 ~0.6 ~0.2 ~2.8 T2 on insulin T2 not on insulin Undiagnosed T1 PWD Long-term care, acute care, & gov’t. ~20% total revenue Pharmacy ~80% total revenue Payors HCP Key sales force call pointsPWD = Person with diabetes Source: Internal estimates (1) International Diabetes Federation. IDF Diabetes Atlas, 11th edition. Brussels, Belgium: International Diabetes Federation; 2025 (2) T1D Index, https://www.t1dindex.org (3) Internal market model, and internal estimates

45 Emerging markets
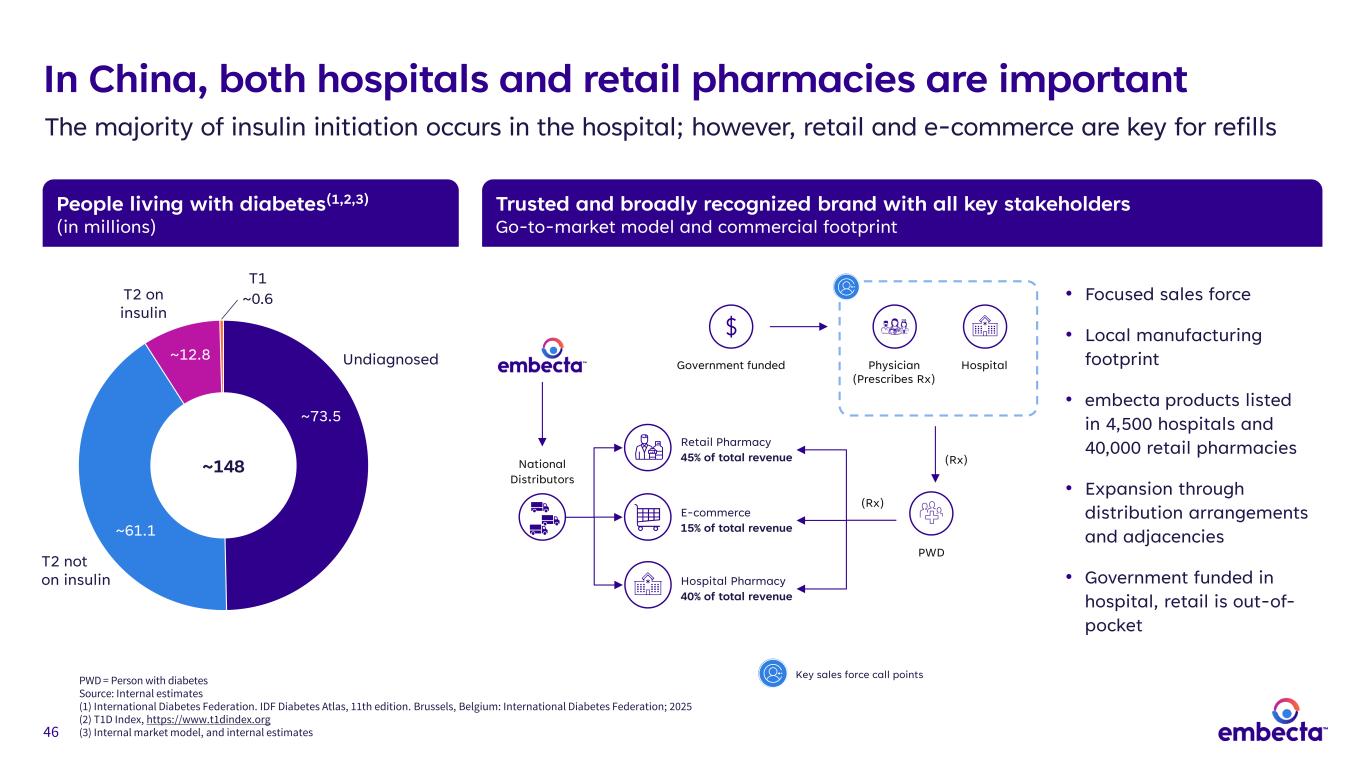
46 People living with diabetes(1,2,3) (in millions) Trusted and broadly recognized brand with all key stakeholders Go-to-market model and commercial footprint In China, both hospitals and retail pharmacies are important The majority of insulin initiation occurs in the hospital; however, retail and e-commerce are key for refills • Focused sales force • Local manufacturing footprint • embecta products listed in 4,500 hospitals and 40,000 retail pharmacies • Expansion through distribution arrangements and adjacencies • Government funded in hospital, retail is out-of- pocket ~73.5 ~61.1 ~12.8 ~148 T1 ~0.6T2 on insulin T2 not on insulin Undiagnosed National Distributors Government funded Physician (Prescribes Rx) Hospital PWD (Rx) (Rx) Hospital Pharmacy 40% of total revenue E-commerce 15% of total revenue Retail Pharmacy 45% of total revenue PWD = Person with diabetes Source: Internal estimates (1) International Diabetes Federation. IDF Diabetes Atlas, 11th edition. Brussels, Belgium: International Diabetes Federation; 2025 (2) T1D Index, https://www.t1dindex.org (3) Internal market model, and internal estimates Key sales force call points
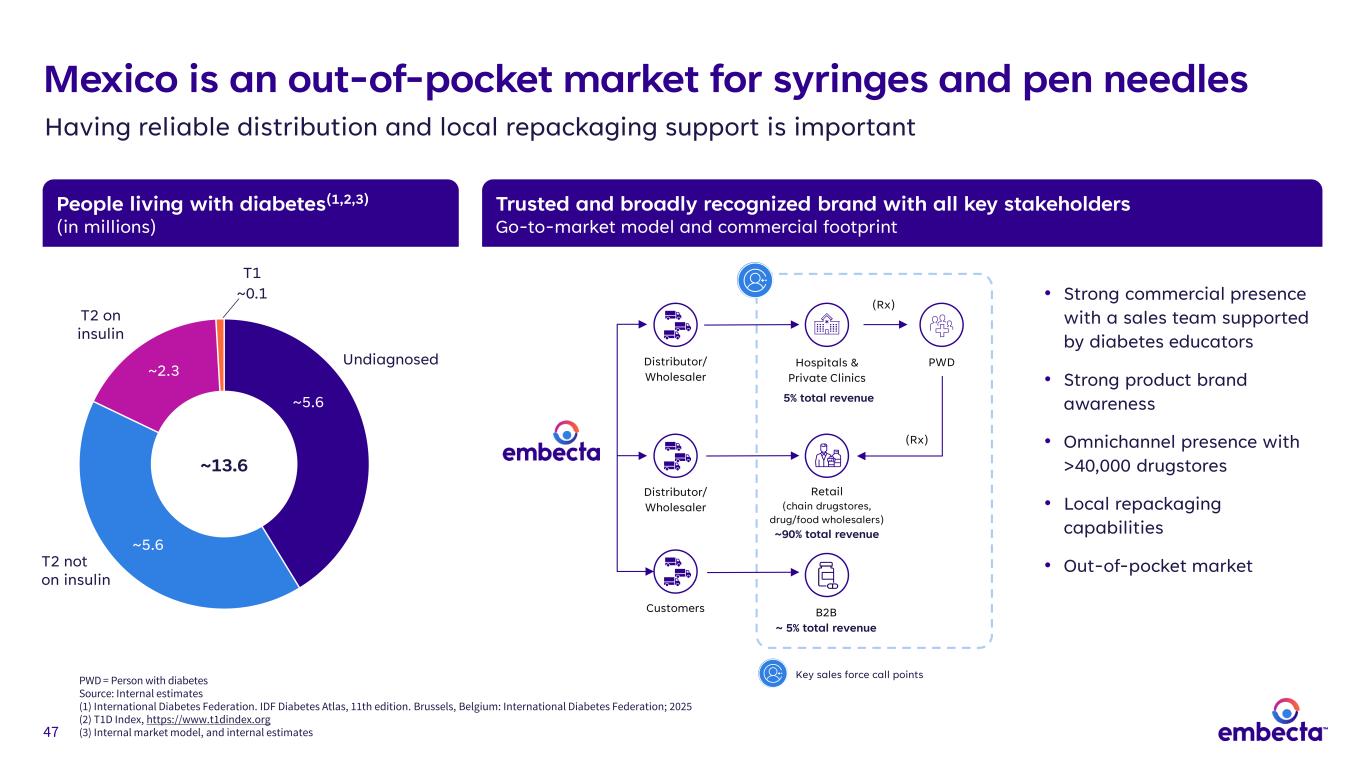
47 5% total revenue People living with diabetes(1,2,3) (in millions) Trusted and broadly recognized brand with all key stakeholders Go-to-market model and commercial footprint • Strong commercial presence with a sales team supported by diabetes educators • Strong product brand awareness • Omnichannel presence with >40,000 drugstores • Local repackaging capabilities • Out-of-pocket market Mexico is an out-of-pocket market for syringes and pen needles Having reliable distribution and local repackaging support is important ~5.6 ~5.6 ~2.3 ~13.6 T1 ~0.1 T2 on insulin T2 not on insulin Undiagnosed Hospitals & Private Clinics Retail (chain drugstores, drug/food wholesalers) ~90% total revenue B2B ~ 5% total revenue Customers PWD (Rx) (Rx) Distributor/ Wholesaler Distributor/ Wholesaler Key sales force call pointsPWD = Person with diabetes Source: Internal estimates (1) International Diabetes Federation. IDF Diabetes Atlas, 11th edition. Brussels, Belgium: International Diabetes Federation; 2025 (2) T1D Index, https://www.t1dindex.org (3) Internal market model, and internal estimates
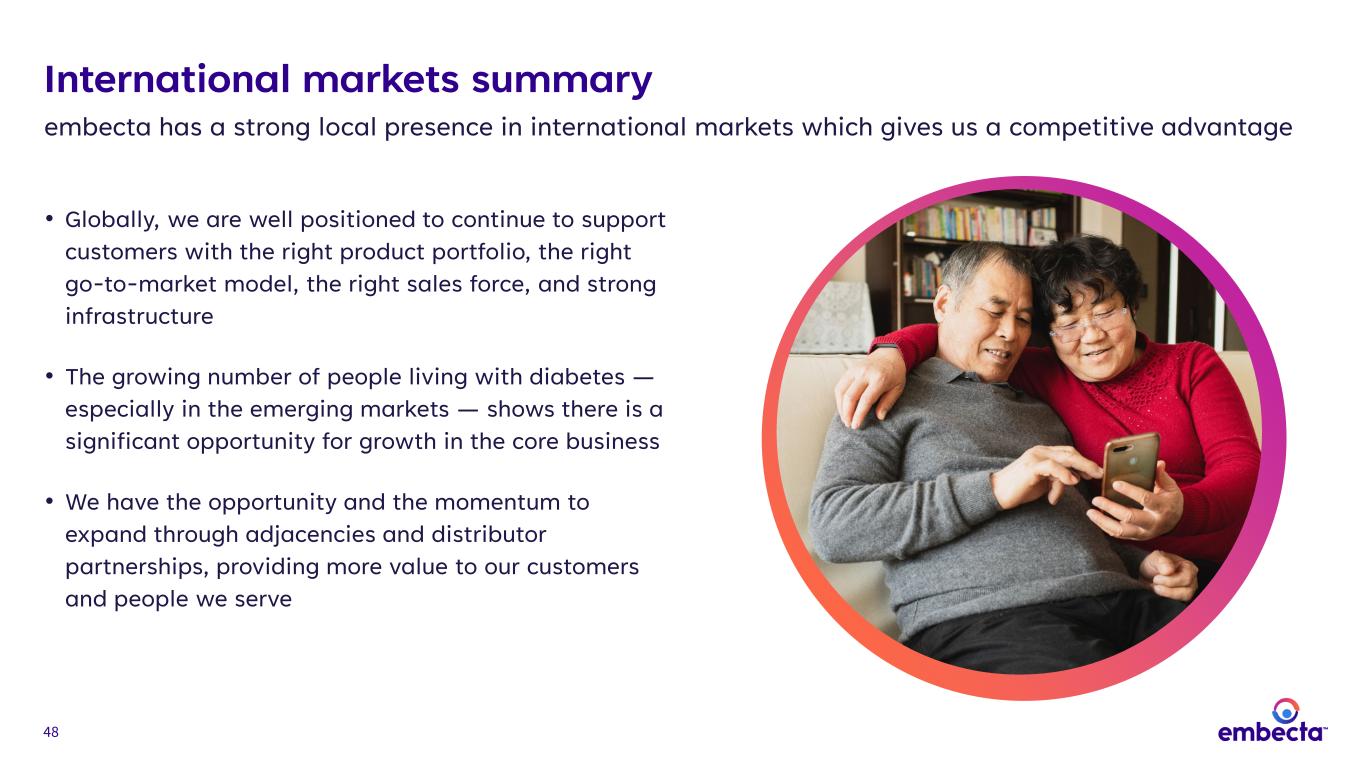
48 International markets summary • Globally, we are well positioned to continue to support customers with the right product portfolio, the right go-to-market model, the right sales force, and strong infrastructure • The growing number of people living with diabetes — especially in the emerging markets — shows there is a significant opportunity for growth in the core business • We have the opportunity and the momentum to expand through adjacencies and distributor partnerships, providing more value to our customers and people we serve embecta has a strong local presence in international markets which gives us a competitive advantage
49 49 Shaun Curtis Senior Vice President, Manufacturing, Supply Chain and Quality Manufacturing and supply chain overview
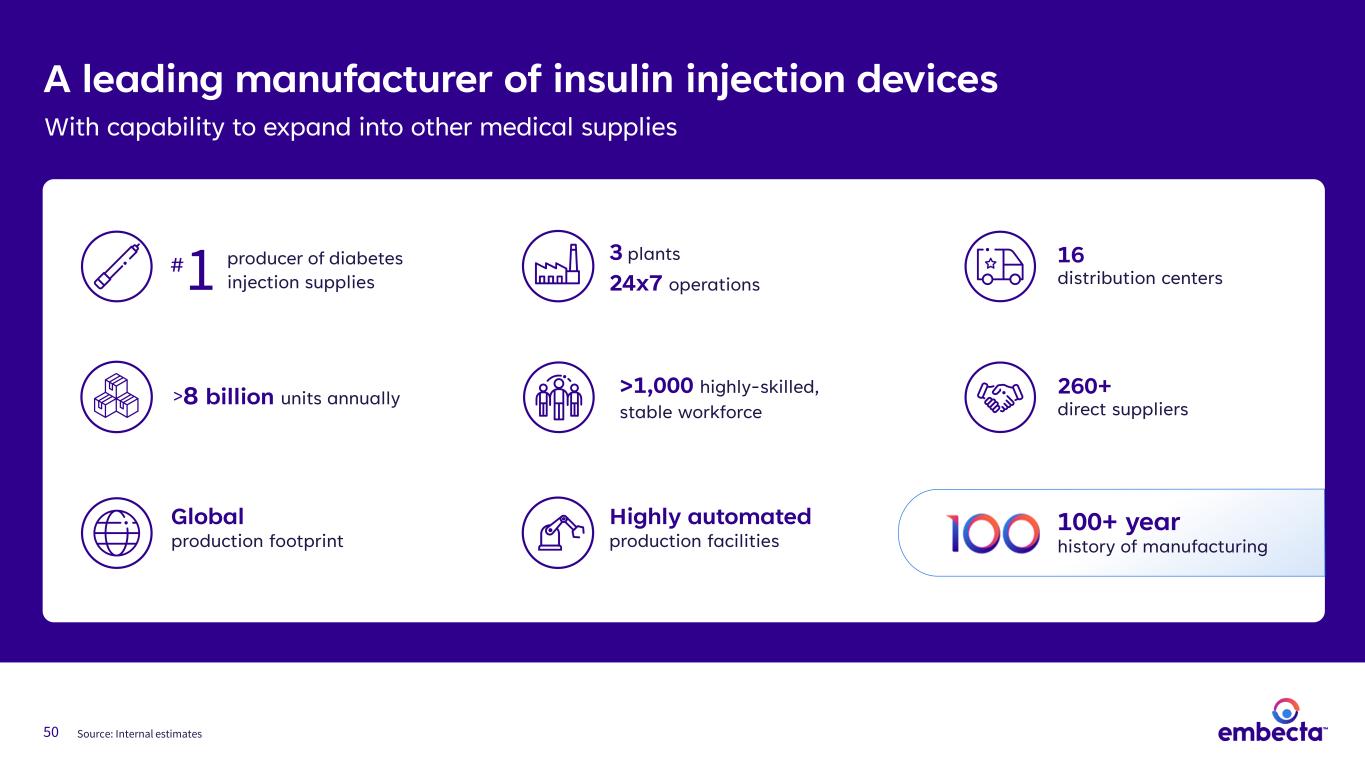
50 A leading manufacturer of insulin injection devices With capability to expand into other medical supplies 260+ direct suppliers 3 plants 24x7 operations 16 distribution centers 50 Source: Internal estimates 100+ year history of manufacturing Global production footprint >1,000 highly-skilled, stable workforce >8 billion units annually producer of diabetes injection supplies1# Highly automated production facilities
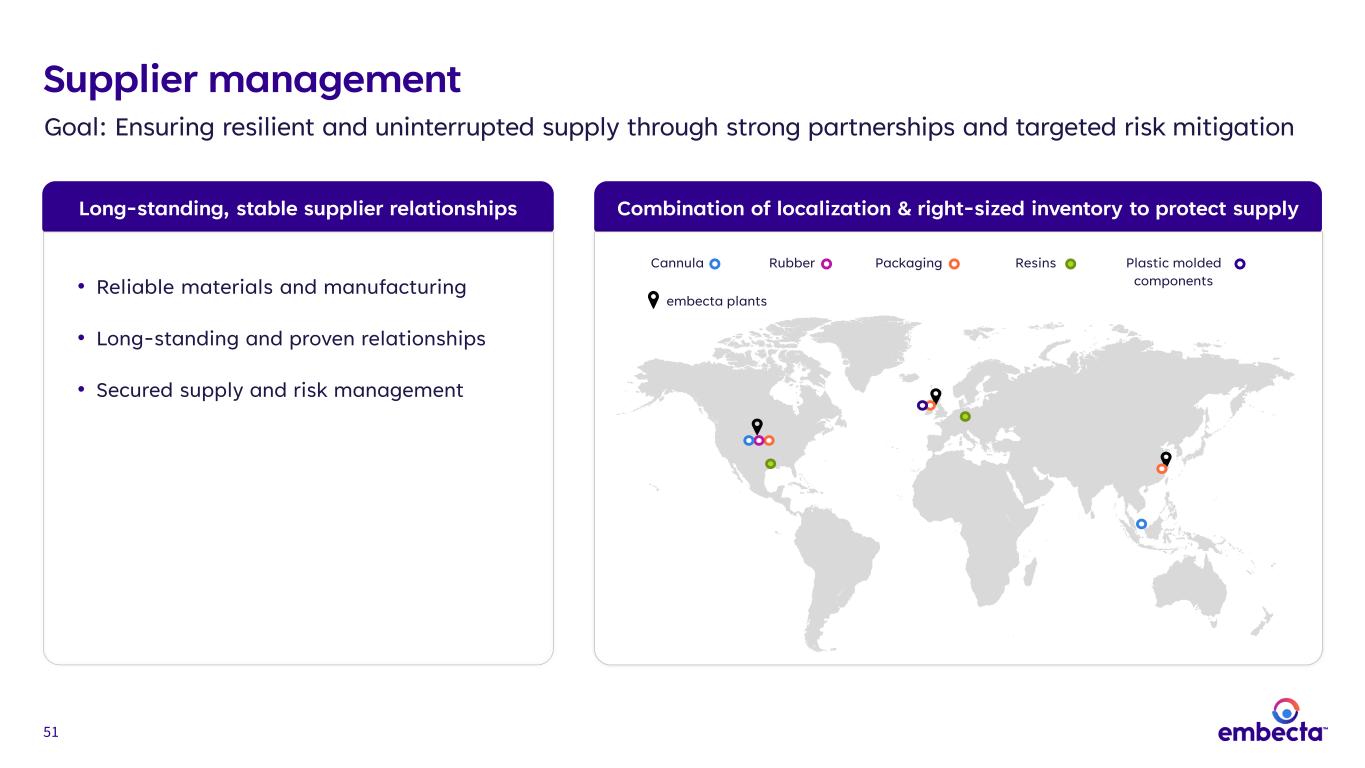
51 Combination of localization & right-sized inventory to protect supplyLong-standing, stable supplier relationships Supplier management Goal: Ensuring resilient and uninterrupted supply through strong partnerships and targeted risk mitigation Plastic molded components ResinsRubber PackagingCannula embecta plants • Reliable materials and manufacturing • Long-standing and proven relationships • Secured supply and risk management
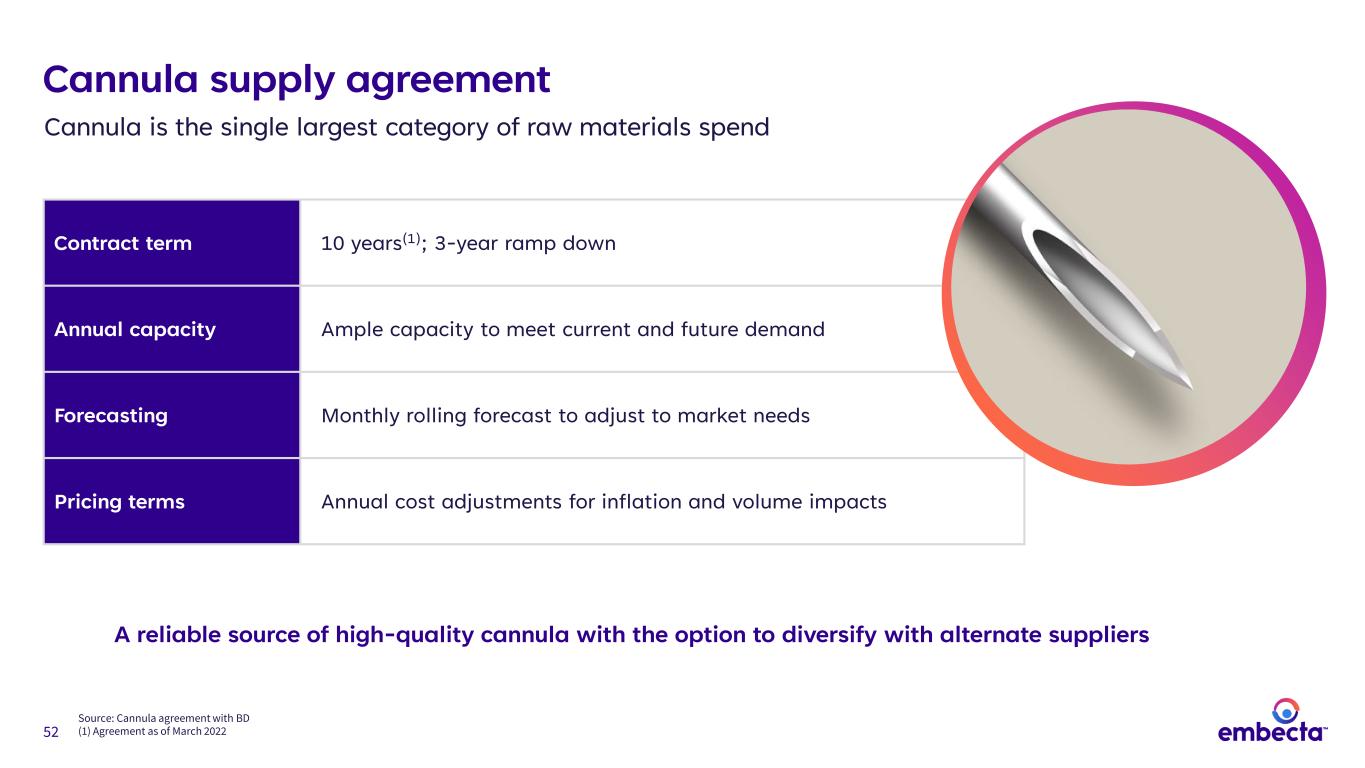
52 Cannula supply agreement Contract term 10 years(1); 3-year ramp down Annual capacity Ample capacity to meet current and future demand Forecasting Monthly rolling forecast to adjust to market needs Pricing terms Annual cost adjustments for inflation and volume impacts Cannula is the single largest category of raw materials spend Source: Cannula agreement with BD (1) Agreement as of March 2022 A reliable source of high-quality cannula with the option to diversify with alternate suppliers
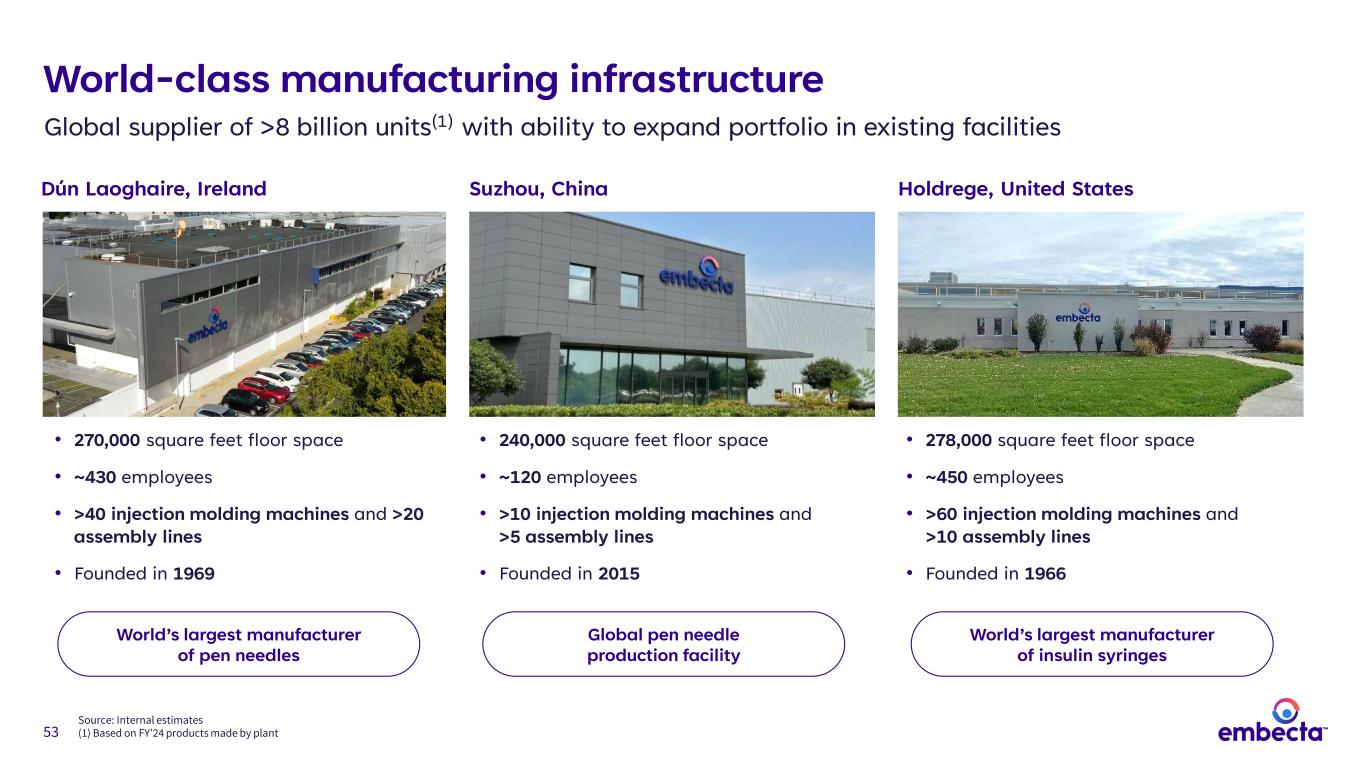
53 World-class manufacturing infrastructure Dún Laoghaire, Ireland • 270,000 square feet floor space • ~430 employees • >40 injection molding machines and >20 assembly lines • Founded in 1969 Suzhou, China Holdrege, United States • 240,000 square feet floor space • ~120 employees • >10 injection molding machines and >5 assembly lines • Founded in 2015 • 278,000 square feet floor space • ~450 employees • >60 injection molding machines and >10 assembly lines • Founded in 1966 World’s largest manufacturer of pen needles Global pen needle production facility World’s largest manufacturer of insulin syringes Source: Internal estimates (1) Based on FY’24 products made by plant Global supplier of >8 billion units(1) with ability to expand portfolio in existing facilities
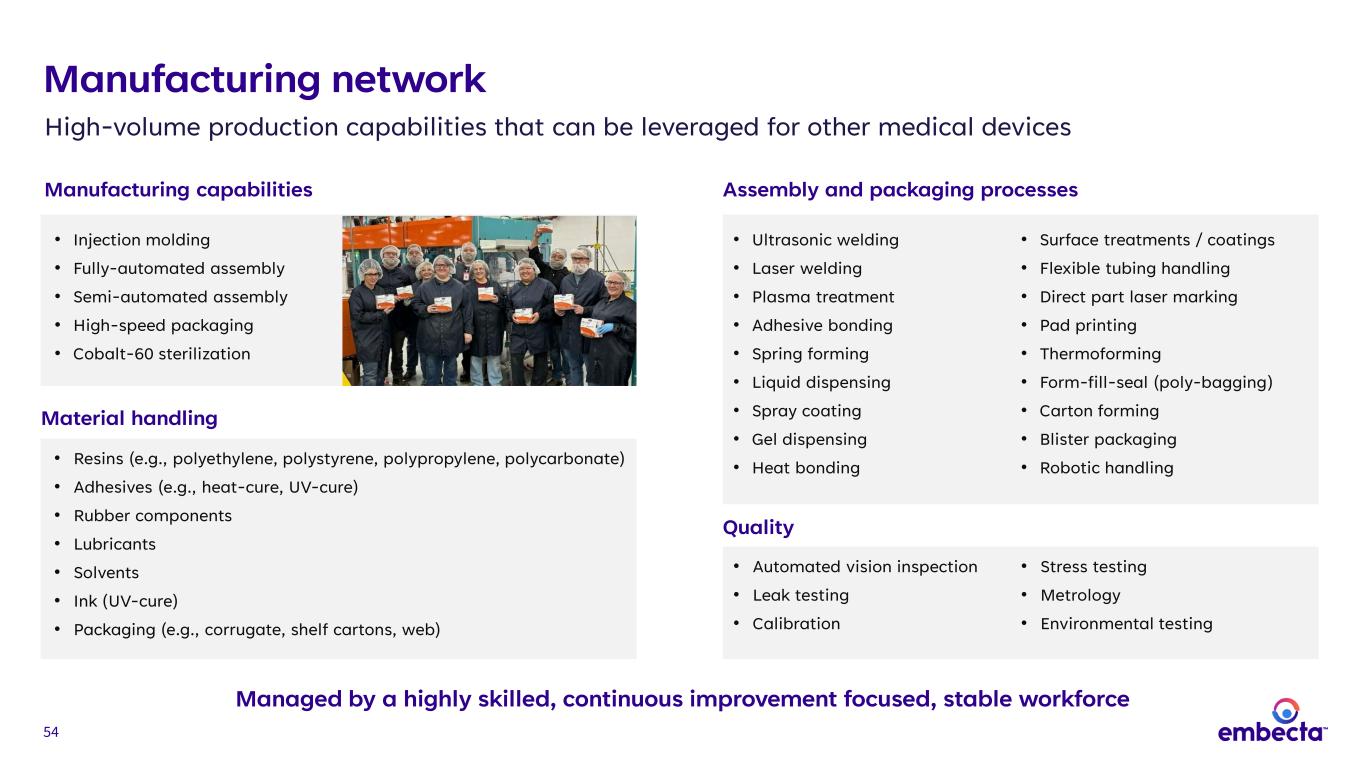
54 Manufacturing capabilities Material handling • Resins (e.g., polyethylene, polystyrene, polypropylene, polycarbonate) • Adhesives (e.g., heat-cure, UV-cure) • Rubber components • Lubricants • Solvents • Ink (UV-cure) • Packaging (e.g., corrugate, shelf cartons, web) Quality • Automated vision inspection • Leak testing • Calibration • Stress testing • Metrology • Environmental testing • Injection molding • Fully-automated assembly • Semi-automated assembly • High-speed packaging • Cobalt-60 sterilization • Ultrasonic welding • Laser welding • Plasma treatment • Adhesive bonding • Spring forming • Liquid dispensing • Spray coating • Gel dispensing • Heat bonding • Surface treatments / coatings • Flexible tubing handling • Direct part laser marking • Pad printing • Thermoforming • Form-fill-seal (poly-bagging) • Carton forming • Blister packaging • Robotic handling Manufacturing network High-volume production capabilities that can be leveraged for other medical devices Assembly and packaging processes Managed by a highly skilled, continuous improvement focused, stable workforce
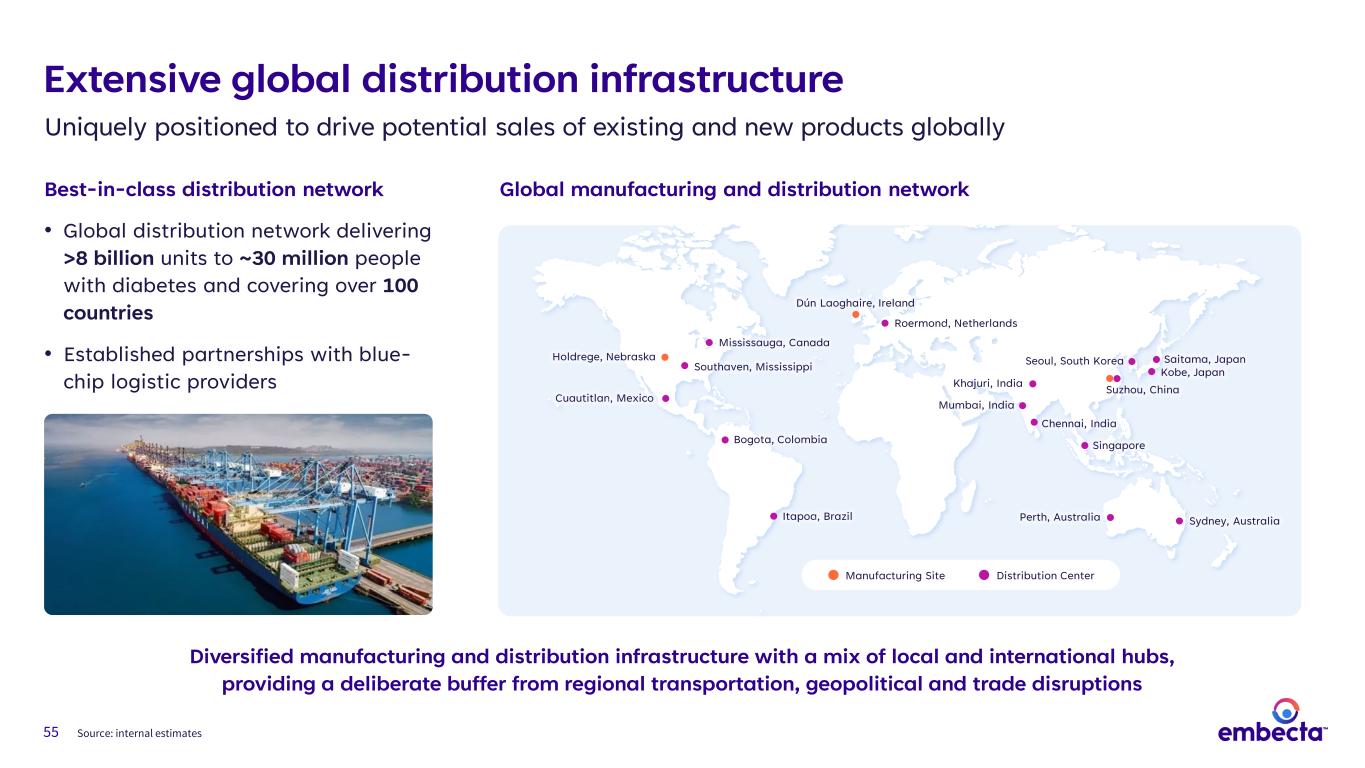
55 Extensive global distribution infrastructure Uniquely positioned to drive potential sales of existing and new products globally Best-in-class distribution network • Global distribution network delivering >8 billion units to ~30 million people with diabetes and covering over 100 countries • Established partnerships with blue- chip logistic providers Source: internal estimates Diversified manufacturing and distribution infrastructure with a mix of local and international hubs, providing a deliberate buffer from regional transportation, geopolitical and trade disruptions Itapoa, Brazil Bogota, Colombia Sydney, AustraliaPerth, Australia Kobe, Japan Saitama, Japan Dún Laoghaire, Ireland Roermond, Netherlands Mumbai, India Chennai, India Khajuri, India Singapore Seoul, South Korea Suzhou, China Southaven, Mississippi Mississauga, Canada Cuautitlan, Mexico Holdrege, Nebraska Manufacturing Site Distribution Center Global manufacturing and distribution network
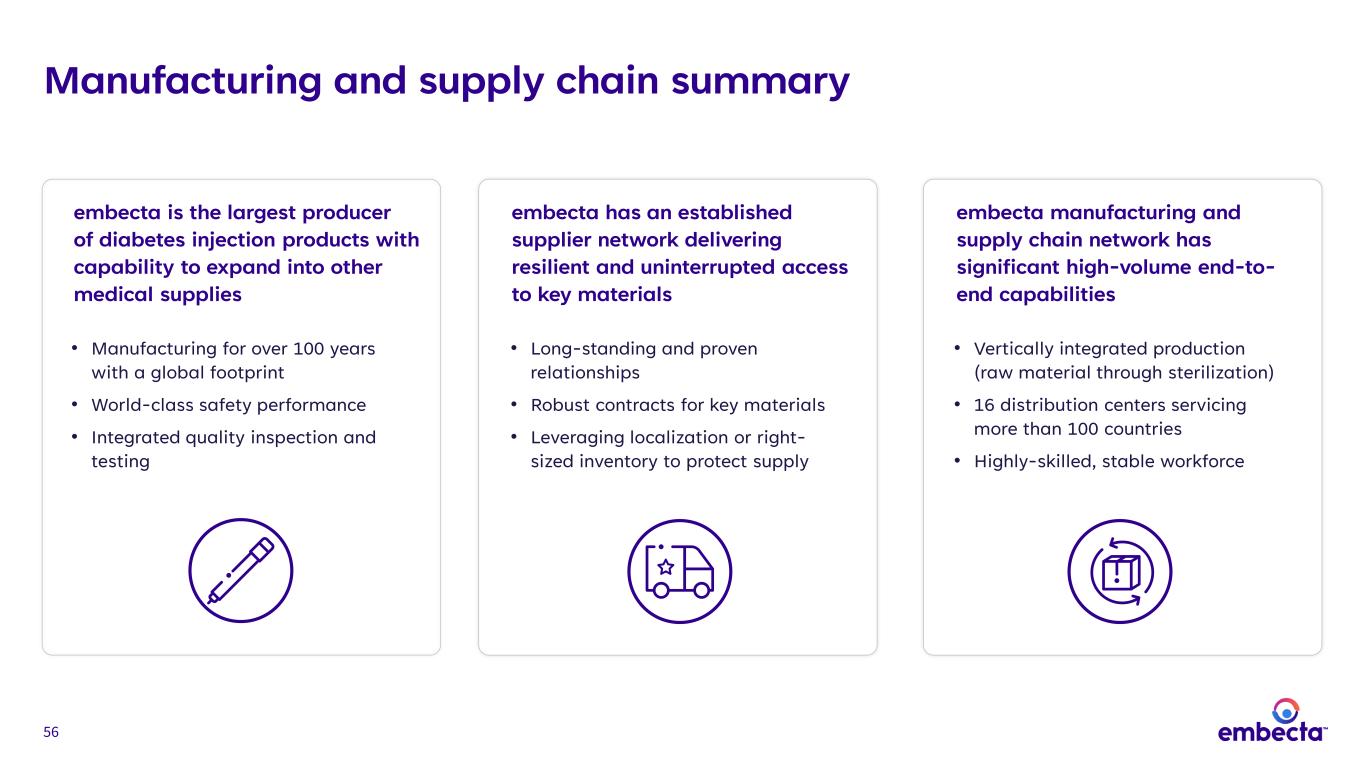
56 embecta is the largest producer of diabetes injection products with capability to expand into other medical supplies embecta manufacturing and supply chain network has significant high-volume end-to- end capabilities Manufacturing and supply chain summary • Manufacturing for over 100 years with a global footprint • World-class safety performance • Integrated quality inspection and testing • Vertically integrated production (raw material through sterilization) • 16 distribution centers servicing more than 100 countries • Highly-skilled, stable workforce embecta has an established supplier network delivering resilient and uninterrupted access to key materials • Long-standing and proven relationships • Robust contracts for key materials • Leveraging localization or right- sized inventory to protect supply

57 Q&A session

58 58 Dev Kurdikar, Chief Executive Officer Ginny Blocki, Senior Vice President, Strategy Value creation opportunities
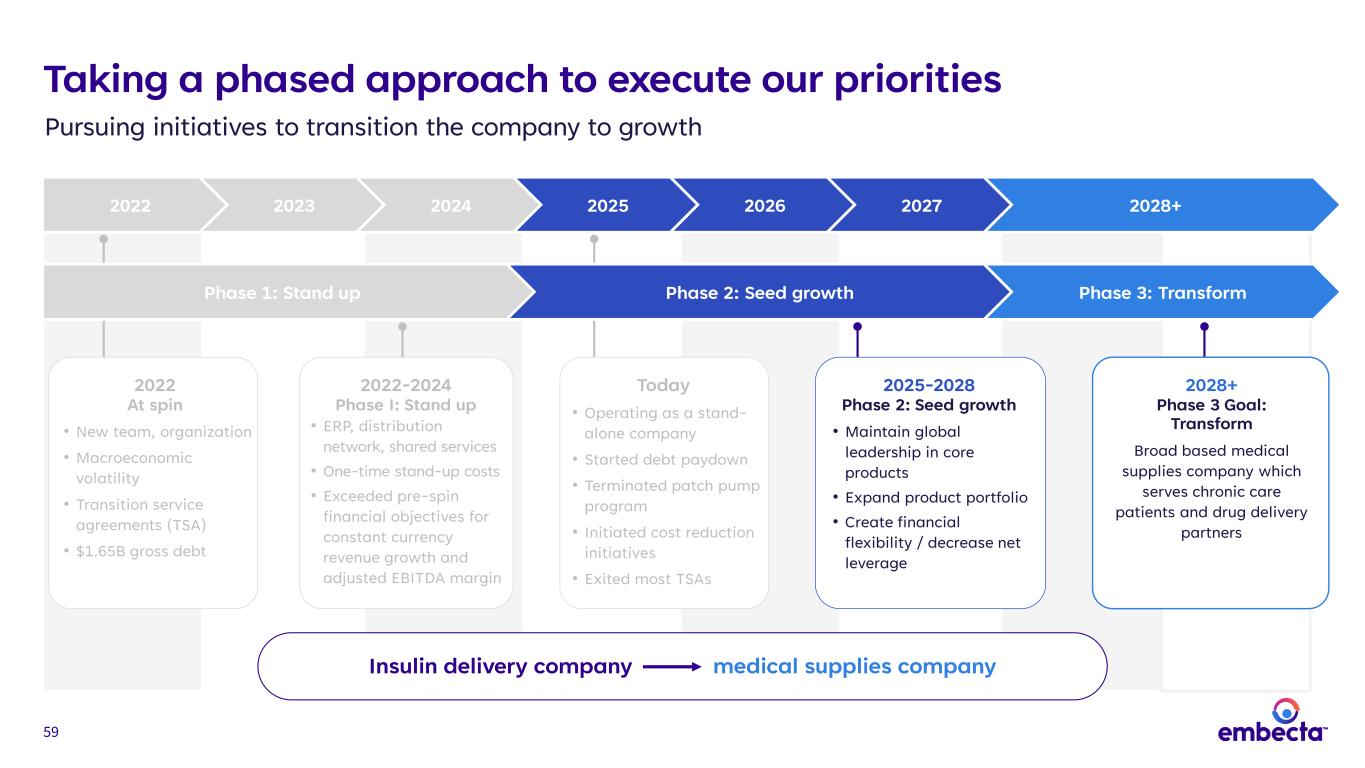
59 Taking a phased approach to execute our priorities Pursuing initiatives to transition the company to growth 2022 2023 2024 2025 2026 2027 2028+ Insulin delivery company medical supplies company 2022 At spin • New team, organization • Macroeconomic volatility • Transition service agreements (TSA) • $1.65B gross debt 2022-2024 Phase I: Stand up • ERP, distribution network, shared services • One-time stand-up costs • Exceeded pre-spin financial objectives for constant currency revenue growth and adjusted EBITDA margin Today • Operating as a stand- alone company • Started debt paydown • Terminated patch pump program • Initiated cost reduction initiatives • Exited most TSAs 2025-2028 Phase 2: Seed growth • Maintain global leadership in core products • Expand product portfolio • Create financial flexibility / decrease net leverage 2028+ Phase 3 Goal: Transform Broad based medical supplies company which serves chronic care patients and drug delivery partners Phase 1: Stand up Phase 2: Seed growth Phase 3: Transform
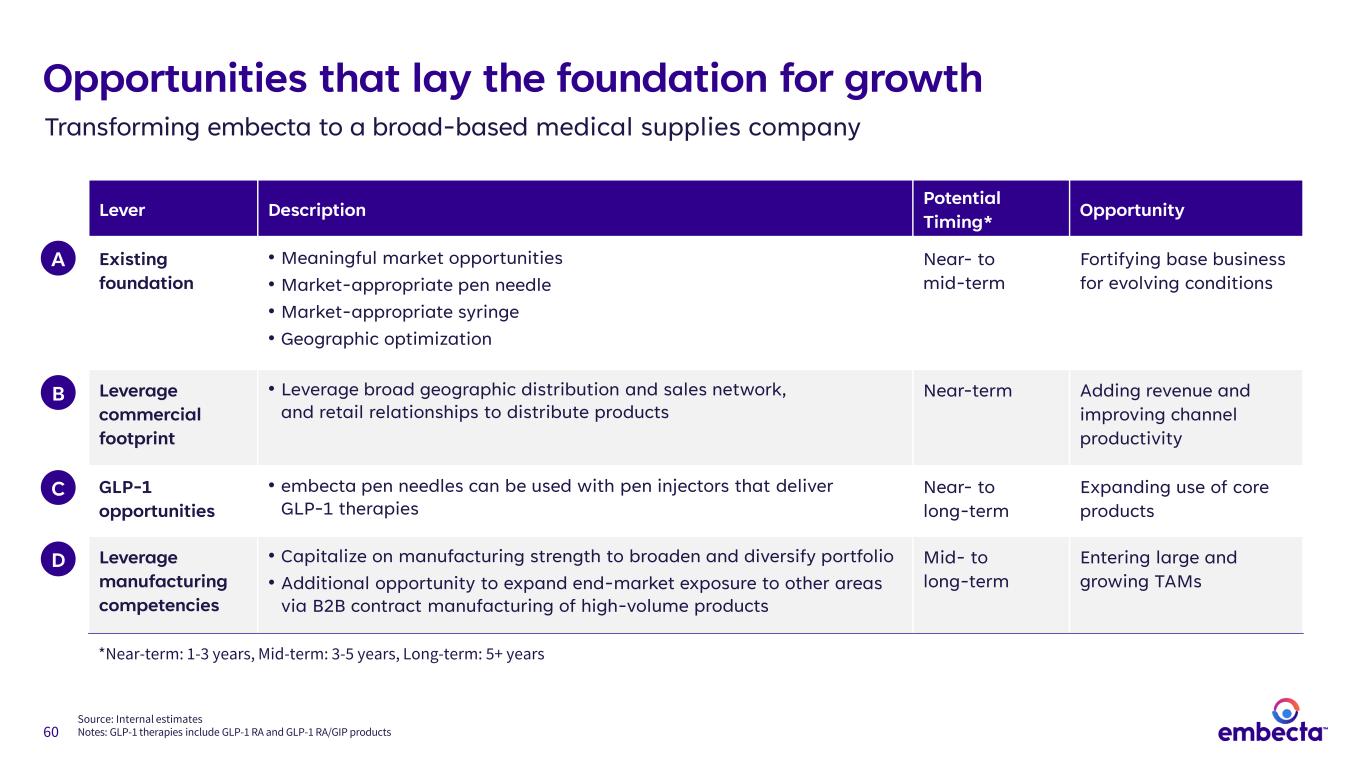
60 Opportunities that lay the foundation for growth Lever Description Potential Timing* Opportunity Existing foundation • Meaningful market opportunities • Market-appropriate pen needle • Market-appropriate syringe • Geographic optimization Near- to mid-term Fortifying base business for evolving conditions Leverage commercial footprint • Leverage broad geographic distribution and sales network, and retail relationships to distribute products Near-term Adding revenue and improving channel productivity GLP-1 opportunities • embecta pen needles can be used with pen injectors that deliver GLP-1 therapies Near- to long-term Expanding use of core products Leverage manufacturing competencies • Capitalize on manufacturing strength to broaden and diversify portfolio • Additional opportunity to expand end-market exposure to other areas via B2B contract manufacturing of high-volume products Mid- to long-term Entering large and growing TAMs *Near-term: 1-3 years, Mid-term: 3-5 years, Long-term: 5+ years Source: Internal estimates Notes: GLP-1 therapies include GLP-1 RA and GLP-1 RA/GIP products A B C D Transforming embecta to a broad-based medical supplies company
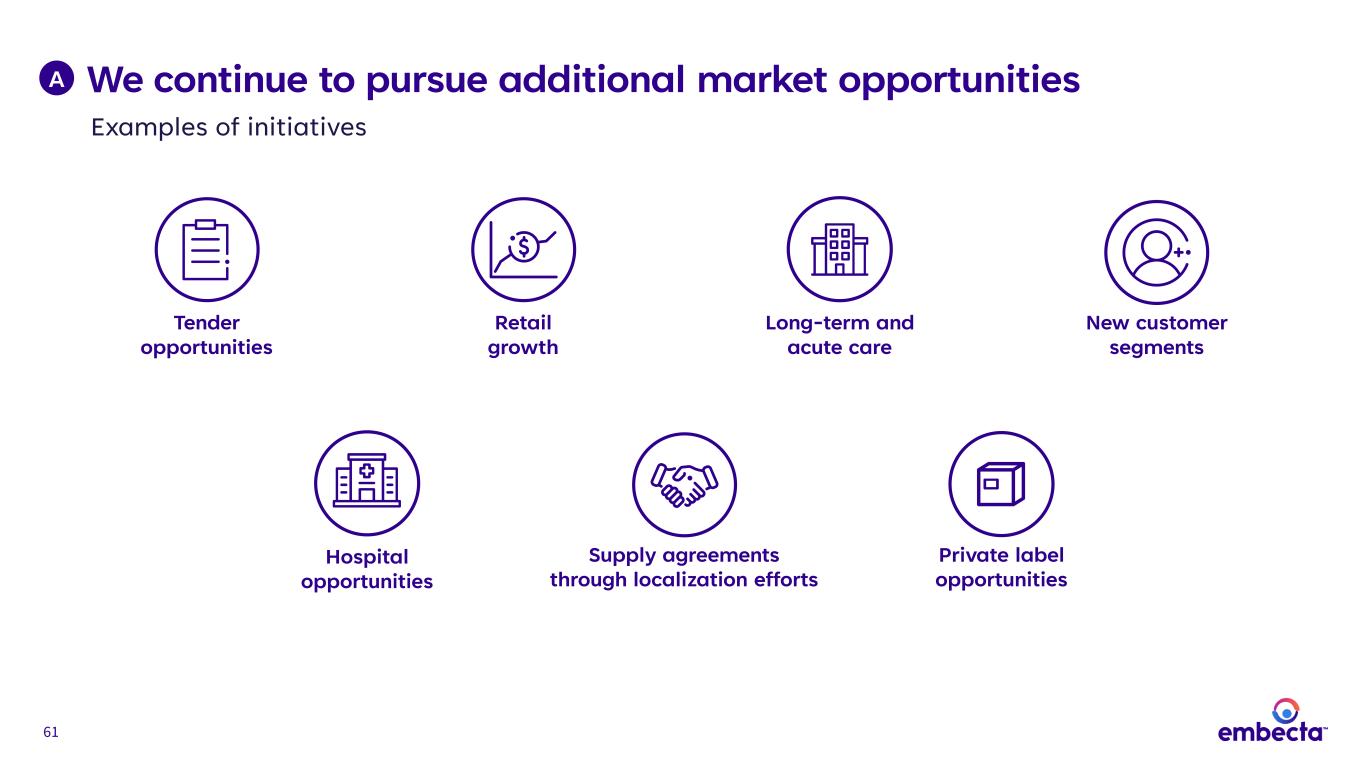
61 We continue to pursue additional market opportunitiesA Examples of initiatives Tender opportunities Retail growth Long-term and acute care Private label opportunities Hospital opportunities New customer segments Supply agreements through localization efforts
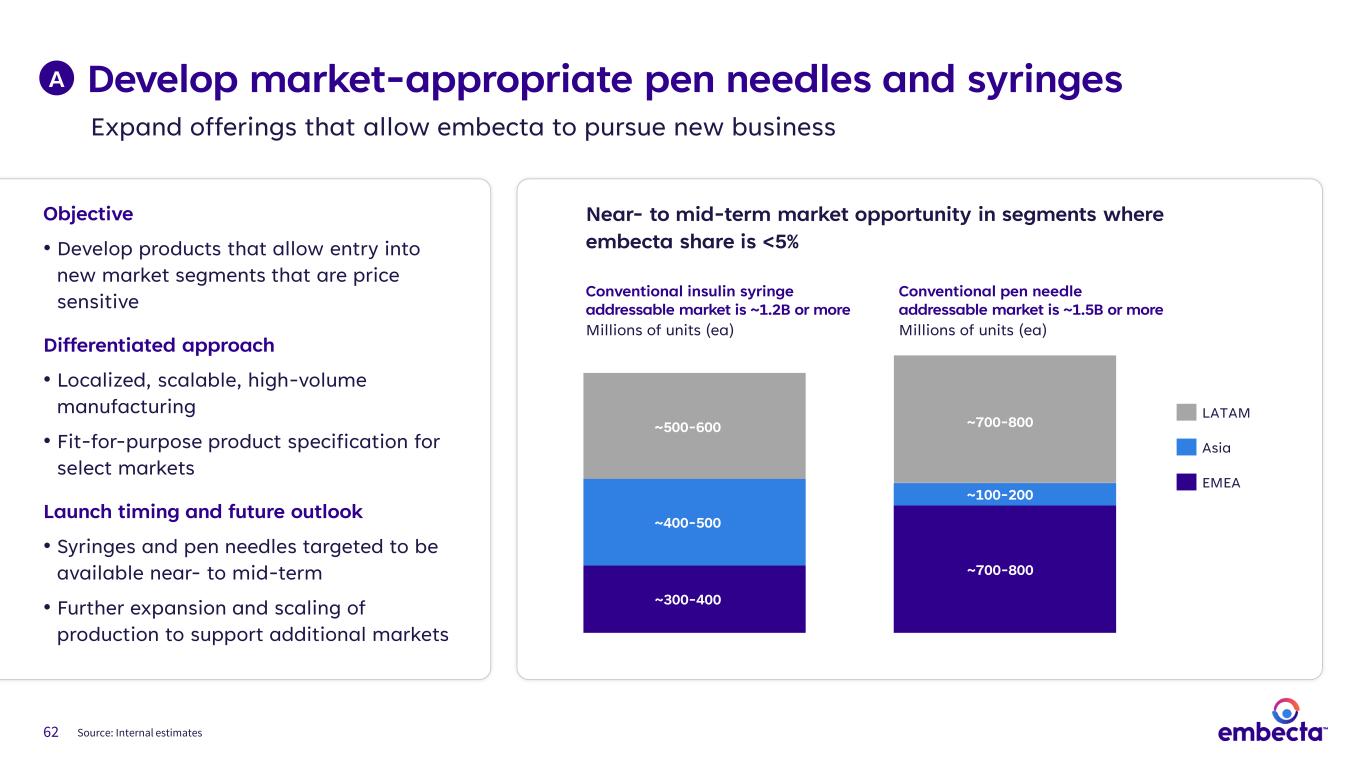
62 Objective • Develop products that allow entry into new market segments that are price sensitive Differentiated approach • Localized, scalable, high-volume manufacturing • Fit-for-purpose product specification for select markets Launch timing and future outlook • Syringes and pen needles targeted to be available near- to mid-term • Further expansion and scaling of production to support additional markets Near- to mid-term market opportunity in segments where embecta share is <5% Conventional insulin syringe addressable market is ~1.2B or more Millions of units (ea) Conventional pen needle addressable market is ~1.5B or more Millions of units (ea) LATAM Asia EMEA A ~300-400 ~400-500 ~500-600 ~700-800 ~100-200 ~700-800 Source: Internal estimates Expand offerings that allow embecta to pursue new business Develop market-appropriate pen needles and syringes
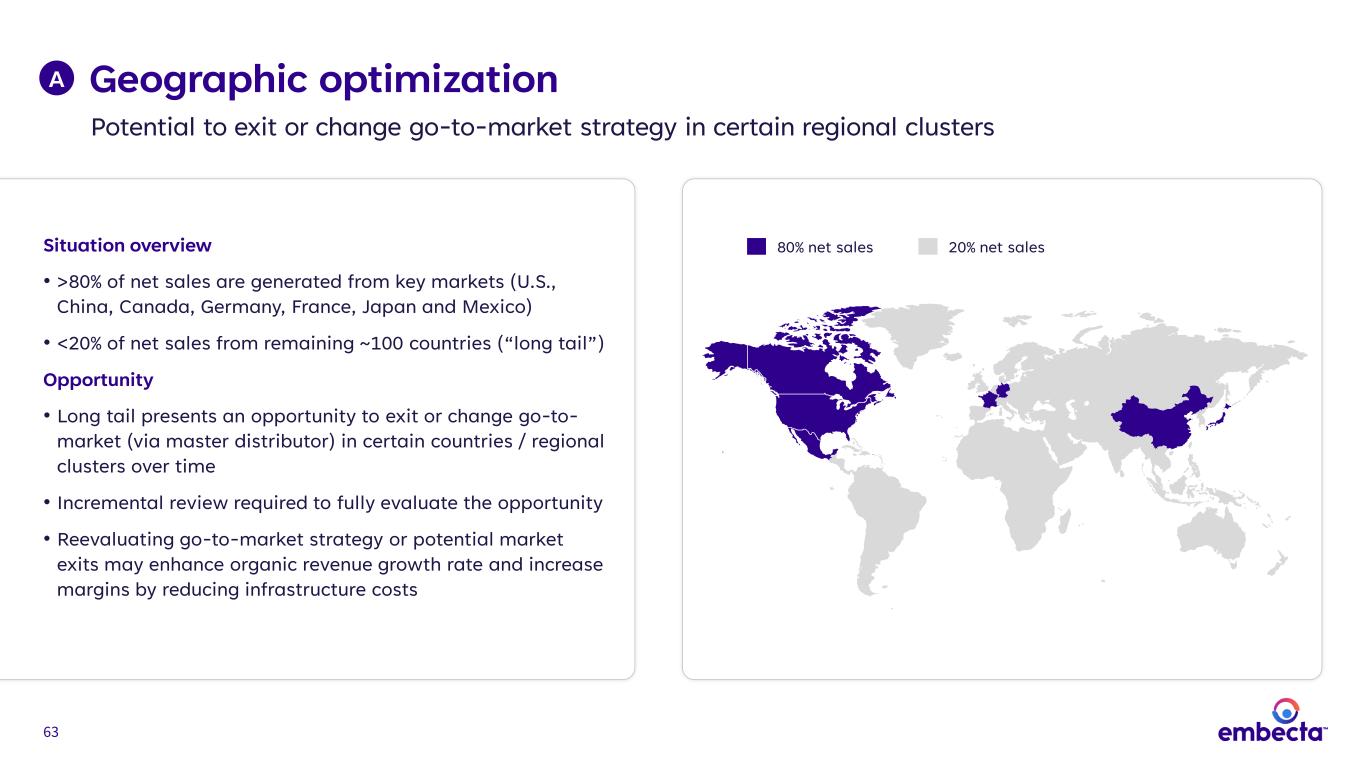
63 Geographic optimization Potential to exit or change go-to-market strategy in certain regional clusters A Situation overview • >80% of net sales are generated from key markets (U.S., China, Canada, Germany, France, Japan and Mexico) • <20% of net sales from remaining ~100 countries (“long tail”) Opportunity • Long tail presents an opportunity to exit or change go-to- market (via master distributor) in certain countries / regional clusters over time • Incremental review required to fully evaluate the opportunity • Reevaluating go-to-market strategy or potential market exits may enhance organic revenue growth rate and increase margins by reducing infrastructure costs 20% net sales80% net sales
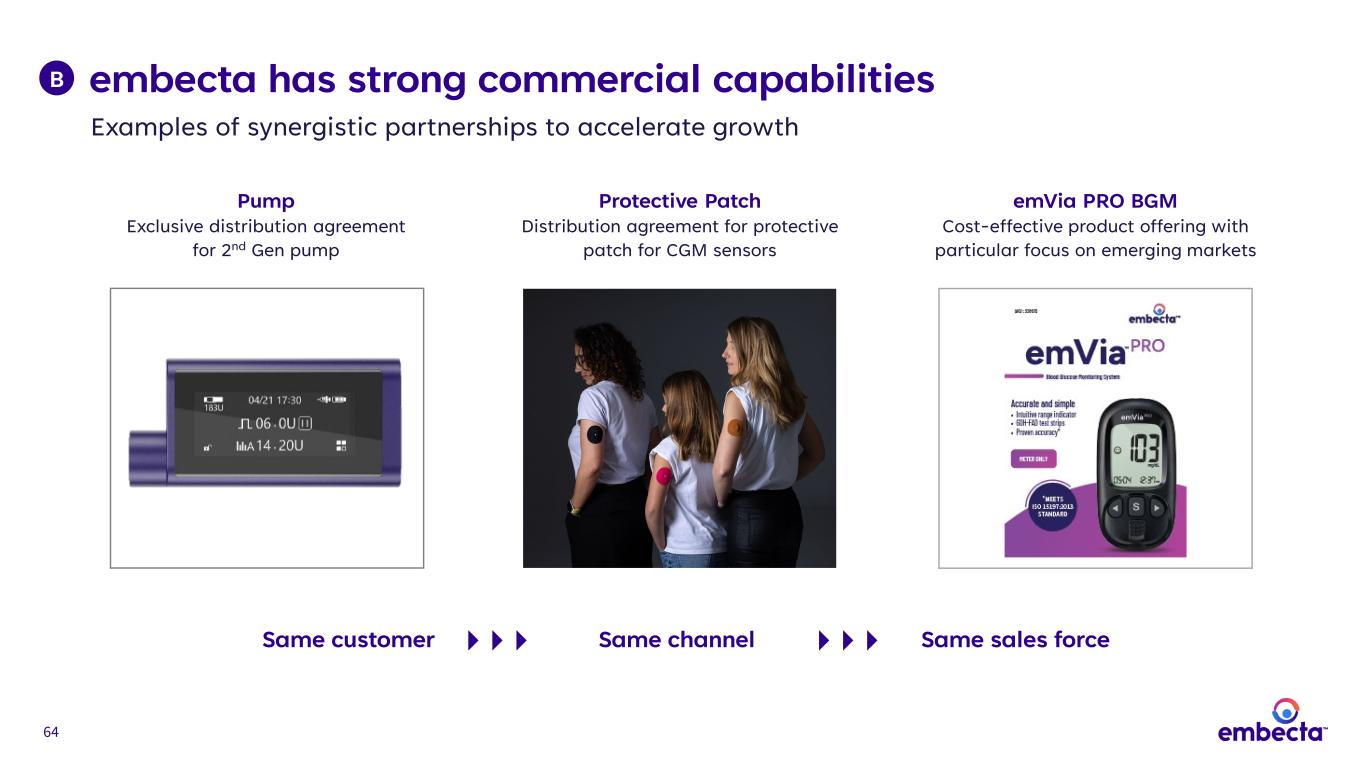
64 embecta has strong commercial capabilities Same customer Same channel Same sales force Protective Patch Distribution agreement for protective patch for CGM sensors Pump Exclusive distribution agreement for 2nd Gen pump Examples of synergistic partnerships to accelerate growth B emVia PRO BGM Cost-effective product offering with particular focus on emerging markets
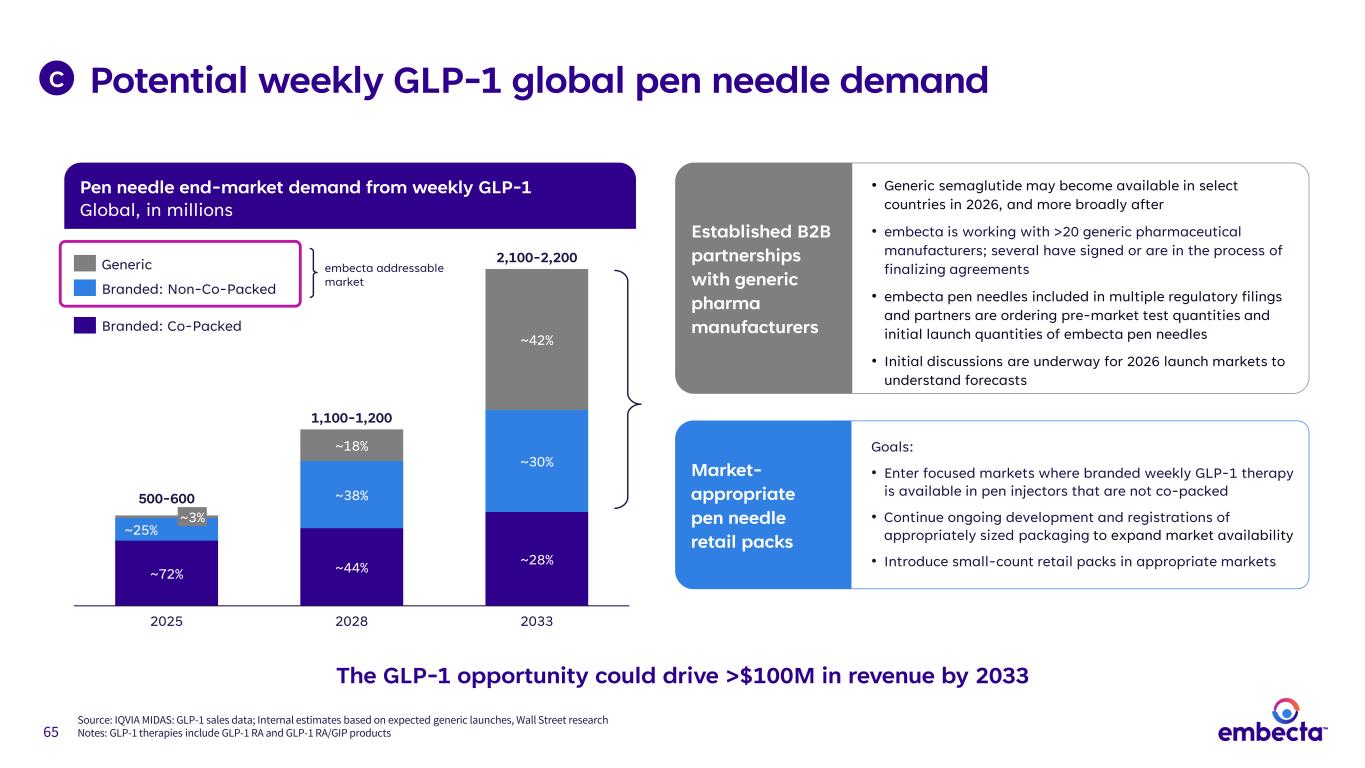
65 C Established B2B partnerships with generic pharma manufacturers • Generic semaglutide may become available in select countries in 2026, and more broadly after • embecta is working with >20 generic pharmaceutical manufacturers; several have signed or are in the process of finalizing agreements • embecta pen needles included in multiple regulatory filings and partners are ordering pre-market test quantities and initial launch quantities of embecta pen needles • Initial discussions are underway for 2026 launch markets to understand forecasts Market- appropriate pen needle retail packs Goals: • Enter focused markets where branded weekly GLP-1 therapy is available in pen injectors that are not co-packed • Continue ongoing development and registrations of appropriately sized packaging to expand market availability • Introduce small-count retail packs in appropriate markets The GLP-1 opportunity could drive >$100M in revenue by 2033 Potential weekly GLP-1 global pen needle demand Source: IQVIA MIDAS: GLP-1 sales data; Internal estimates based on expected generic launches, Wall Street research Notes: GLP-1 therapies include GLP-1 RA and GLP-1 RA/GIP products Pen needle end-market demand from weekly GLP-1 Global, in millions ~3% ~25% ~72% 2025 ~18% ~38% ~44% 2028 ~42% ~30% ~28% 2033 500-600 1,100-1,200 2,100-2,200Generic Branded: Non-Co-Packed Branded: Co-Packed embecta addressable market
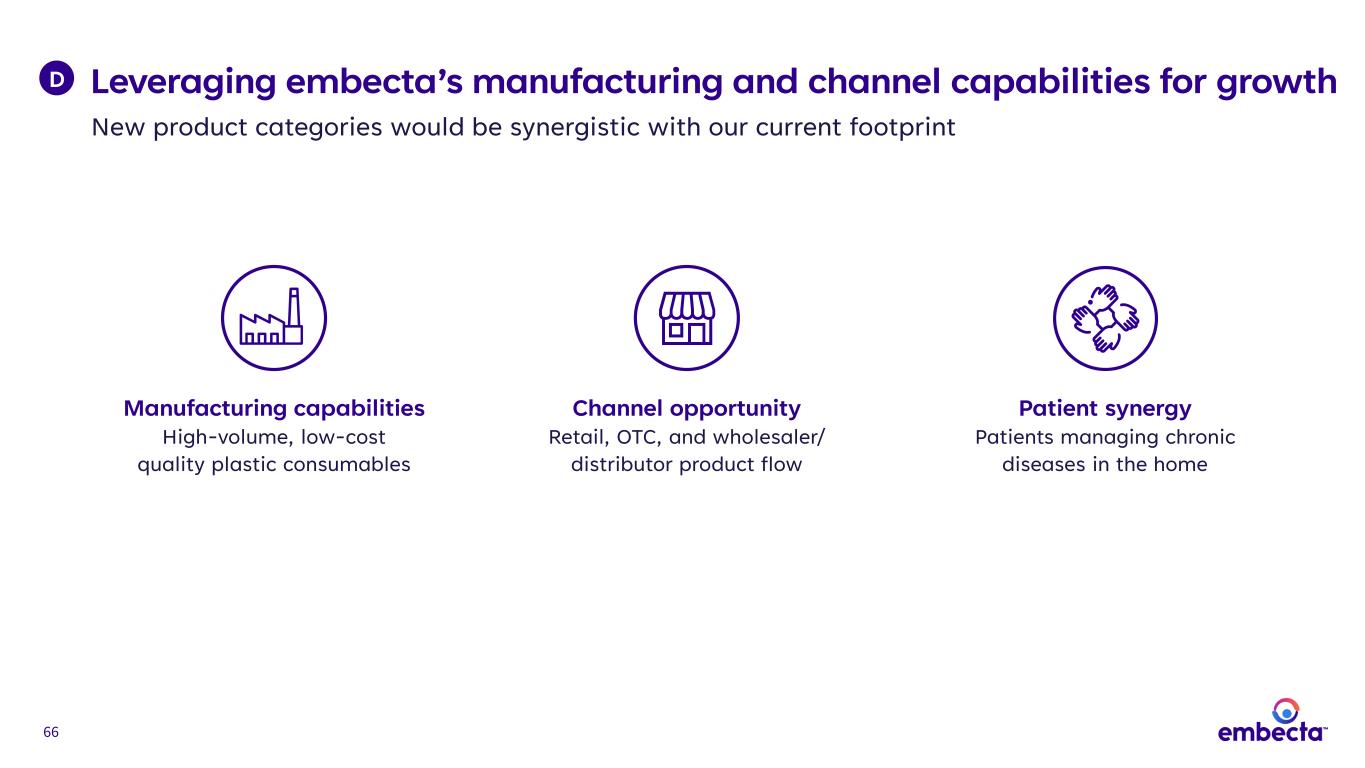
66 Leveraging embecta’s manufacturing and channel capabilities for growth New product categories would be synergistic with our current footprint D Manufacturing capabilities High-volume, low-cost quality plastic consumables Channel opportunity Retail, OTC, and wholesaler/ distributor product flow Patient synergy Patients managing chronic diseases in the home
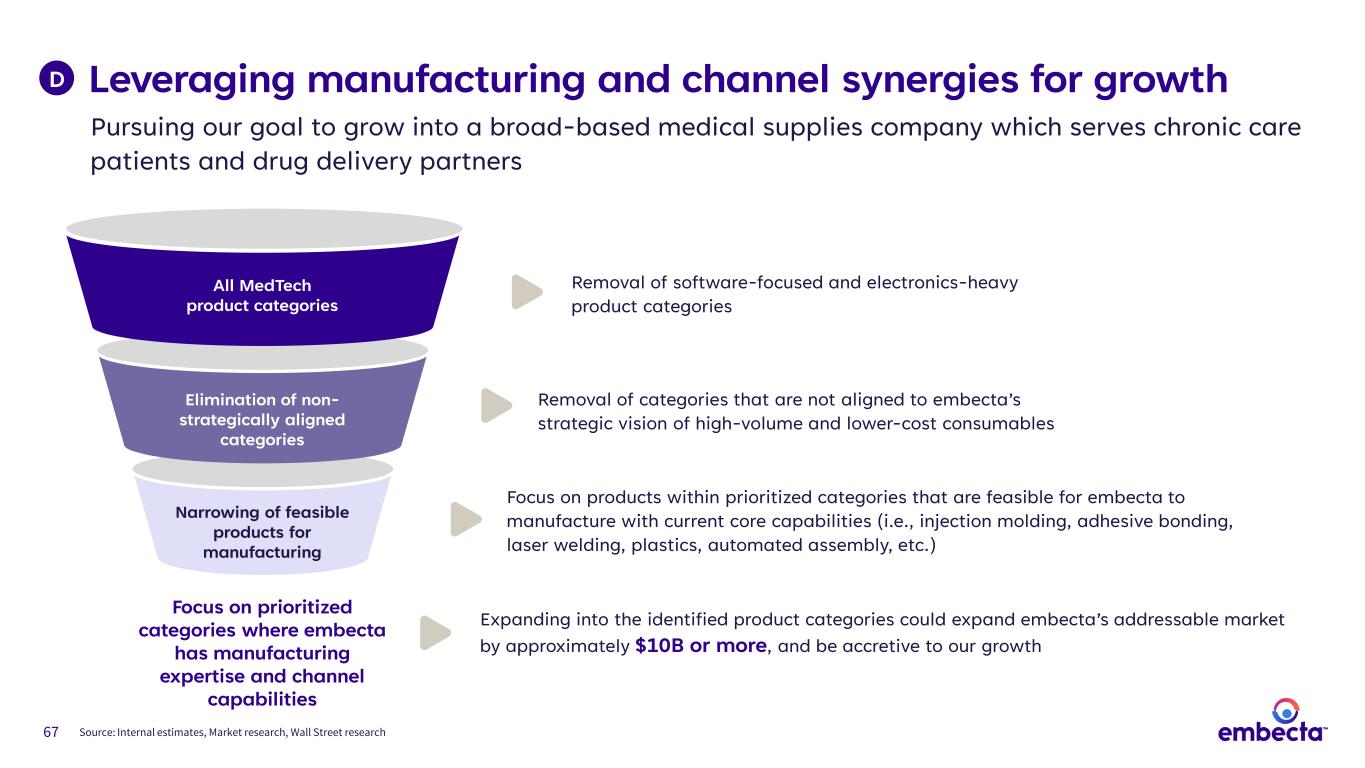
67 Leveraging manufacturing and channel synergies for growth D Pursuing our goal to grow into a broad-based medical supplies company which serves chronic care patients and drug delivery partners Narrowing of feasible products for manufacturing Elimination of non- strategically aligned categories All MedTech product categories Focus on prioritized categories where embecta has manufacturing expertise and channel capabilities Focus on products within prioritized categories that are feasible for embecta to manufacture with current core capabilities (i.e., injection molding, adhesive bonding, laser welding, plastics, automated assembly, etc.) Removal of categories that are not aligned to embecta’s strategic vision of high-volume and lower-cost consumables Removal of software-focused and electronics-heavy product categories Expanding into the identified product categories could expand embecta’s addressable market by approximately $10B or more, and be accretive to our growth Source: Internal estimates, Market research, Wall Street research
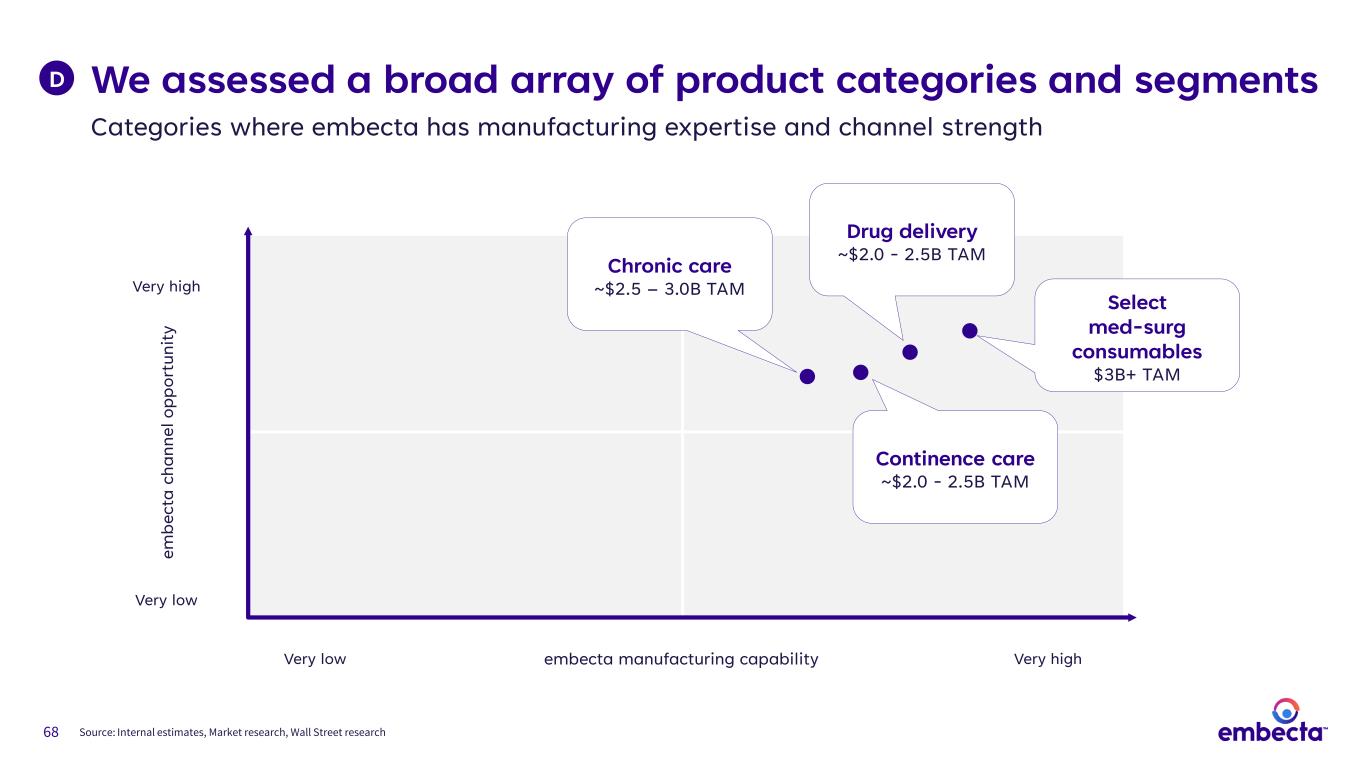
68 We assessed a broad array of product categories and segments Categories where embecta has manufacturing expertise and channel strength D embecta manufacturing capability em be ct a ch an ne l o pp or tu ni ty Very high Very low Very highVery low Continence care ~$2.0 - 2.5B TAM Chronic care ~$2.5 – 3.0B TAM Select med-surg consumables $3B+ TAM Drug delivery ~$2.0 - 2.5B TAM Source: Internal estimates, Market research, Wall Street research
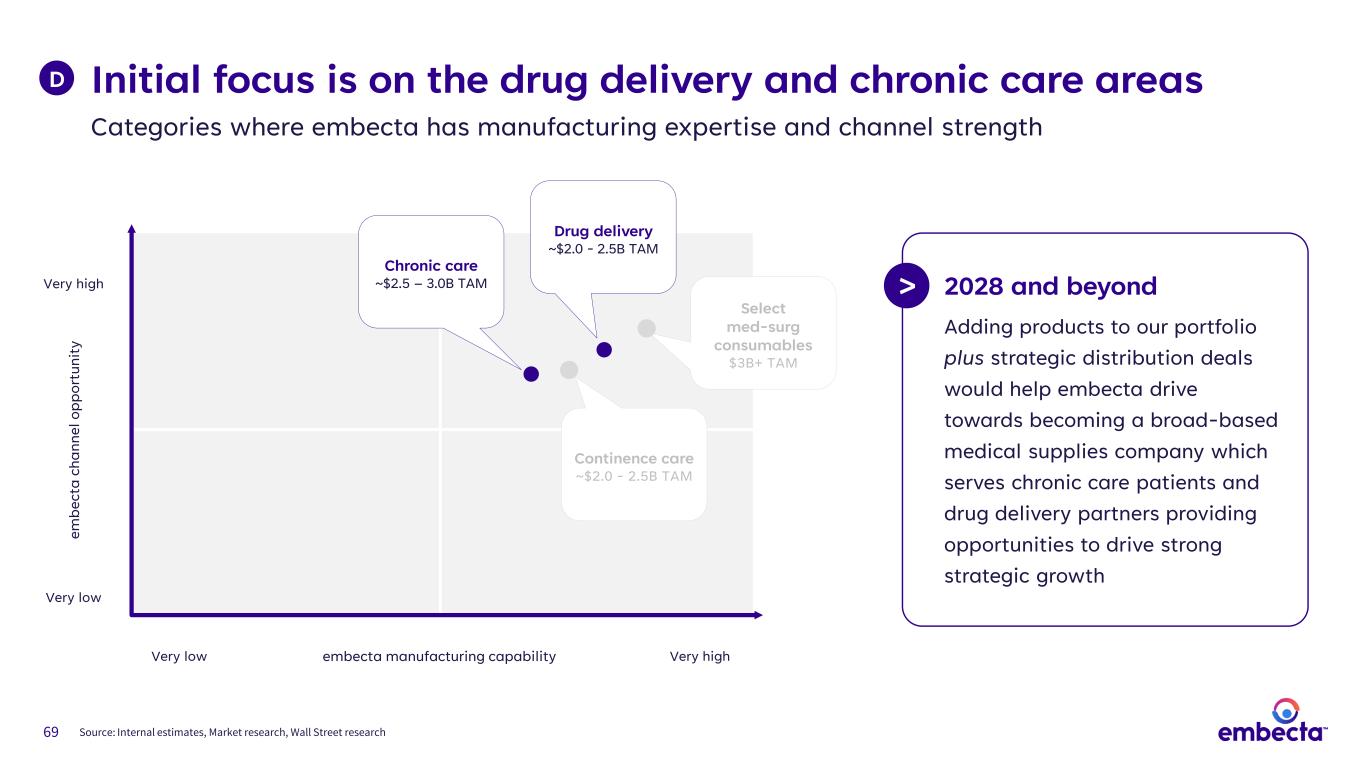
69 Initial focus is on the drug delivery and chronic care areas Categories where embecta has manufacturing expertise and channel strength D 2028 and beyond Adding products to our portfolio plus strategic distribution deals would help embecta drive towards becoming a broad-based medical supplies company which serves chronic care patients and drug delivery partners providing opportunities to drive strong strategic growth embecta manufacturing capability em be ct a ch an ne l o pp or tu ni ty Very high Very low Very highVery low Continence care ~$2.0 - 2.5B TAM Chronic care ~$2.5 – 3.0B TAM Select med-surg consumables $3B+ TAM Drug delivery ~$2.0 - 2.5B TAM > Source: Internal estimates, Market research, Wall Street research
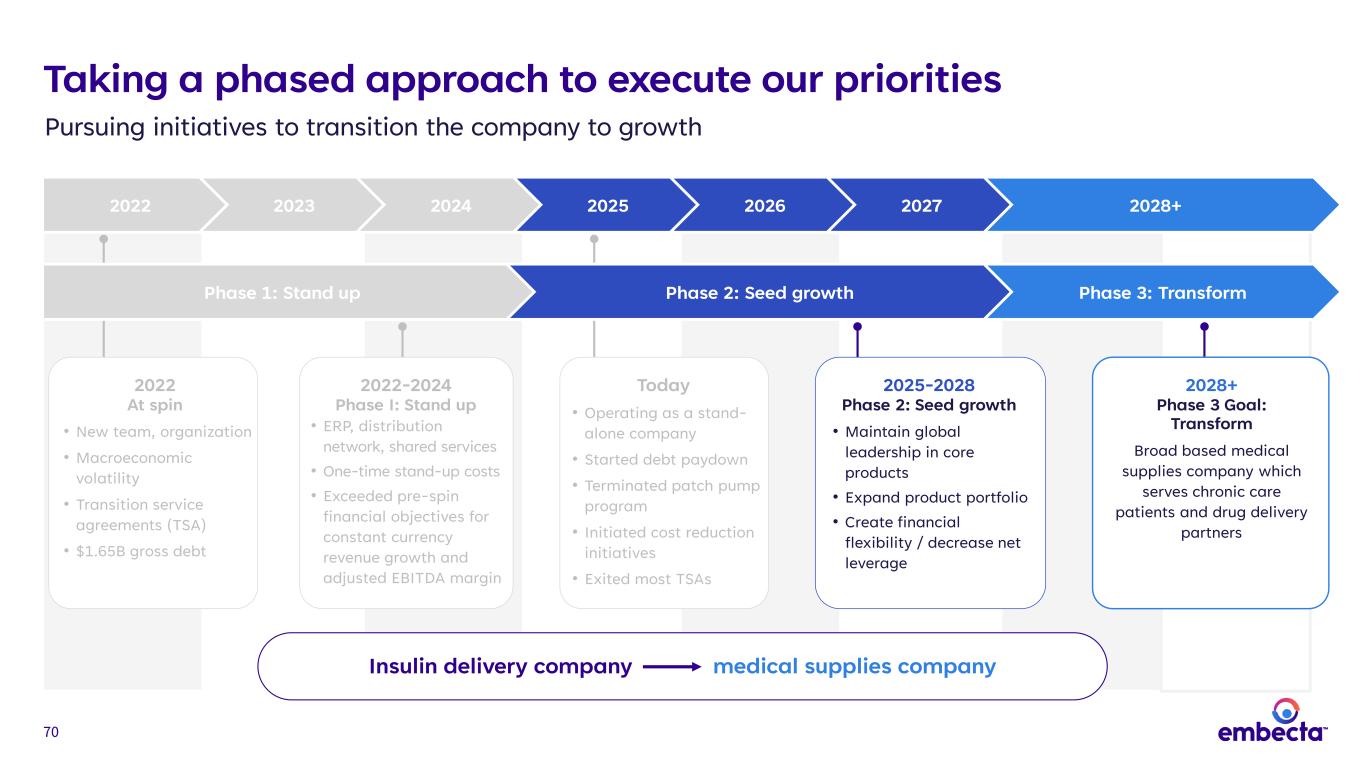
70 Taking a phased approach to execute our priorities Pursuing initiatives to transition the company to growth 2022 2023 2024 2025 2026 2027 2028+ Insulin delivery company medical supplies company 2022 At spin • New team, organization • Macroeconomic volatility • Transition service agreements (TSA) • $1.65B gross debt 2022-2024 Phase I: Stand up • ERP, distribution network, shared services • One-time stand-up costs • Exceeded pre-spin financial objectives for constant currency revenue growth and adjusted EBITDA margin Today • Operating as a stand- alone company • Started debt paydown • Terminated patch pump program • Initiated cost reduction initiatives • Exited most TSAs 2025-2028 Phase 2: Seed growth • Maintain global leadership in core products • Expand product portfolio • Create financial flexibility / decrease net leverage 2028+ Phase 3 Goal: Transform Broad based medical supplies company which serves chronic care patients and drug delivery partners Phase 1: Stand up Phase 2: Seed growth Phase 3: Transform

71 Empowering people with diabetes today… …while paving the way for a life unlimited for all

72 72 Jake Elguicze Chief Financial Officer Financial overview
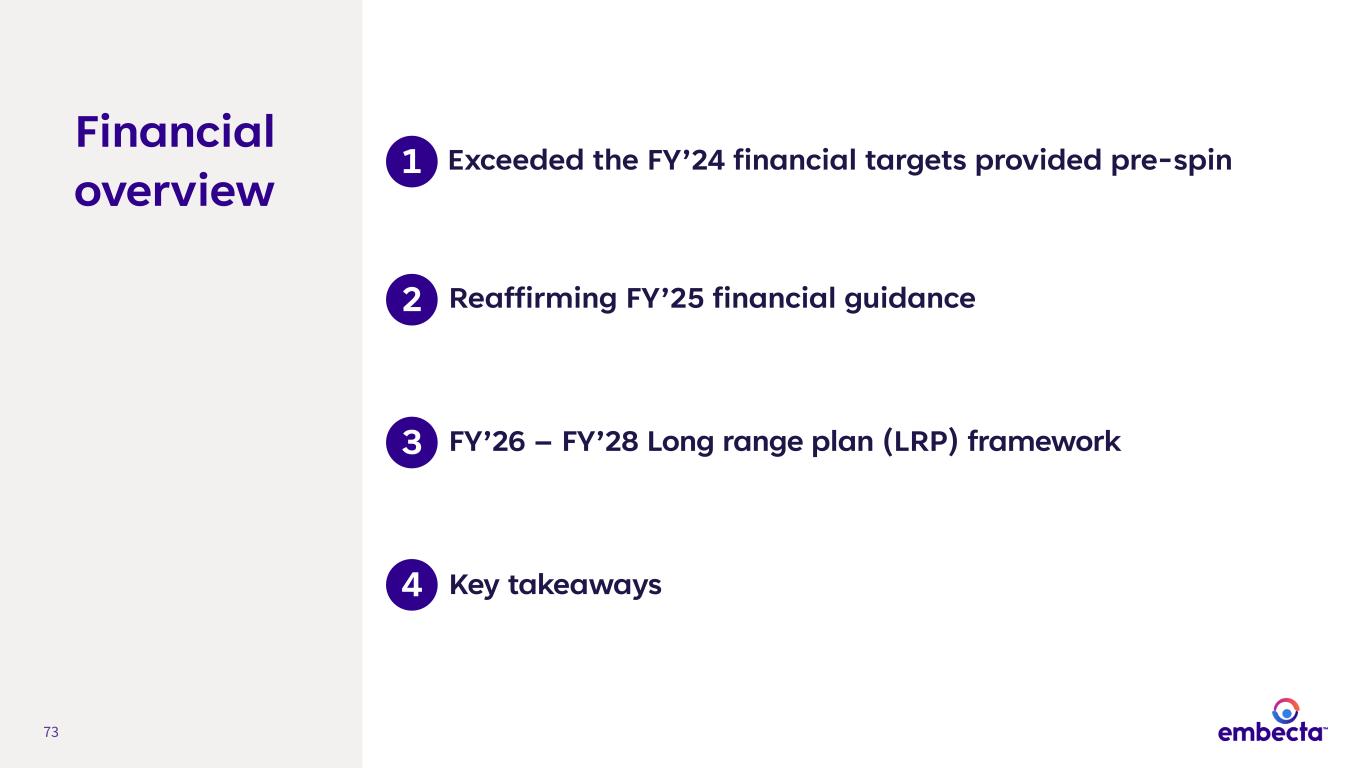
73 Financial overview Exceeded the FY’24 financial targets provided pre-spin FY’26 – FY’28 Long range plan (LRP) framework Key takeaways Reaffirming FY’25 financial guidance 1 2 3 4
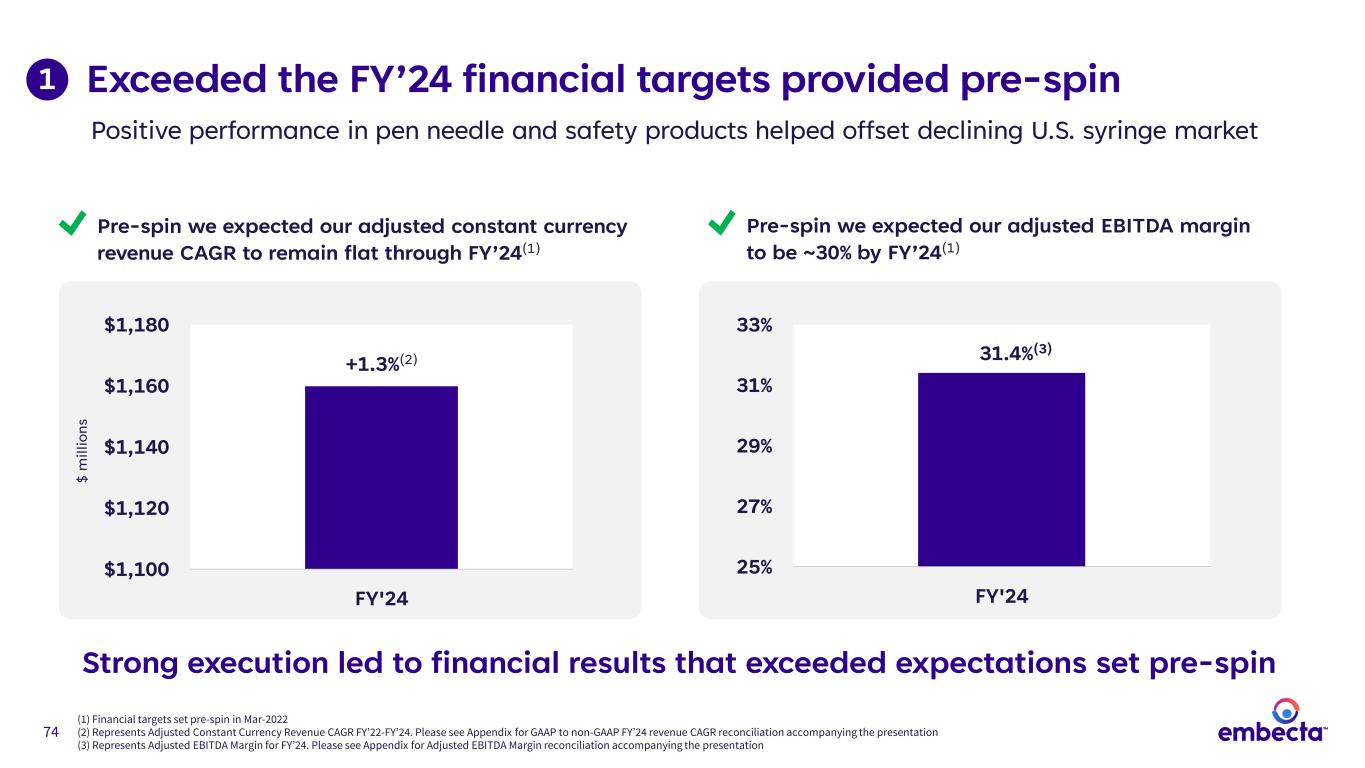
74 Exceeded the FY’24 financial targets provided pre-spin Positive performance in pen needle and safety products helped offset declining U.S. syringe market Strong execution led to financial results that exceeded expectations set pre-spin (1) Financial targets set pre-spin in Mar-2022 (2) Represents Adjusted Constant Currency Revenue CAGR FY’22-FY’24. Please see Appendix for GAAP to non-GAAP FY’24 revenue CAGR reconciliation accompanying the presentation (3) Represents Adjusted EBITDA Margin for FY’24. Please see Appendix for Adjusted EBITDA Margin reconciliation accompanying the presentation $1,100 $1,120 $1,140 $1,160 $1,180 FY'24 $ m ill io ns +1.3%(2) 25% 27% 29% 31% 33% FY'24 31.4%(3) Pre-spin we expected our adjusted EBITDA margin to be ~30% by FY’24(1) Pre-spin we expected our adjusted constant currency revenue CAGR to remain flat through FY’24(1) 1
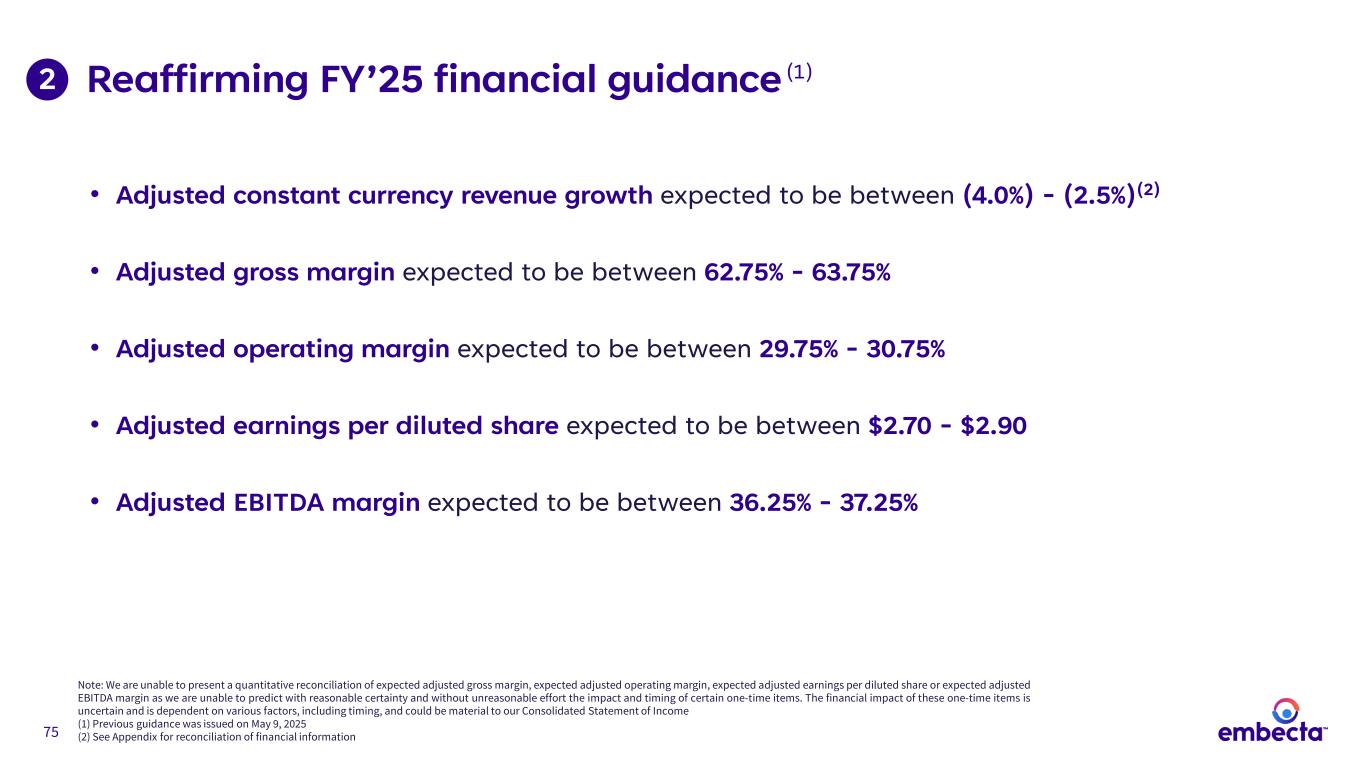
75 Reaffirming FY’25 financial guidance (1) • Adjusted constant currency revenue growth expected to be between (4.0%) - (2.5%)(2) • Adjusted gross margin expected to be between 62.75% - 63.75% • Adjusted operating margin expected to be between 29.75% - 30.75% • Adjusted earnings per diluted share expected to be between $2.70 - $2.90 • Adjusted EBITDA margin expected to be between 36.25% - 37.25% Note: We are unable to present a quantitative reconciliation of expected adjusted gross margin, expected adjusted operating margin, expected adjusted earnings per diluted share or expected adjusted EBITDA margin as we are unable to predict with reasonable certainty and without unreasonable effort the impact and timing of certain one-time items. The financial impact of these one-time items is uncertain and is dependent on various factors, including timing, and could be material to our Consolidated Statement of Income (1) Previous guidance was issued on May 9, 2025 (2) See Appendix for reconciliation of financial information 2
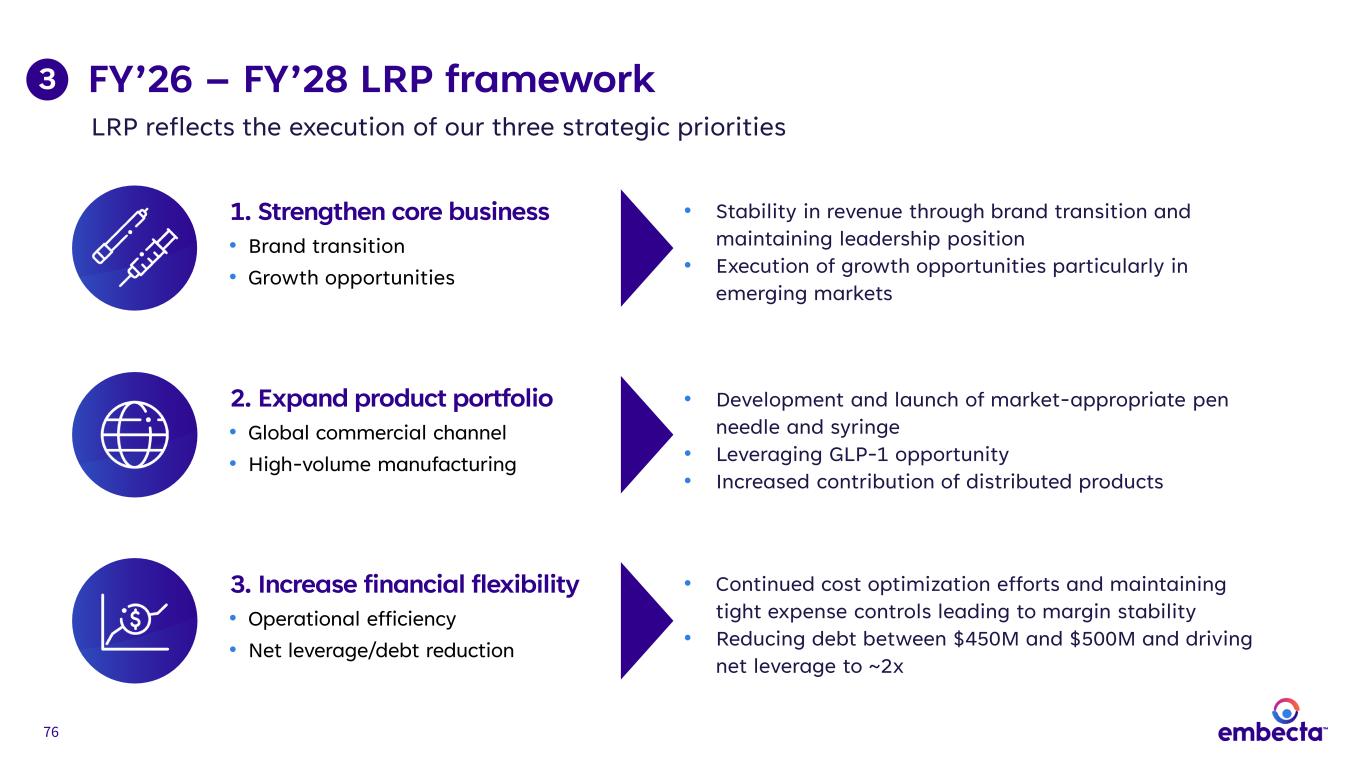
76 1. Strengthen core business • Brand transition • Growth opportunities 2. Expand product portfolio • Global commercial channel • High-volume manufacturing 3. Increase financial flexibility • Operational efficiency • Net leverage/debt reduction • Stability in revenue through brand transition and maintaining leadership position • Execution of growth opportunities particularly in emerging markets • Development and launch of market-appropriate pen needle and syringe • Leveraging GLP-1 opportunity • Increased contribution of distributed products • Continued cost optimization efforts and maintaining tight expense controls leading to margin stability • Reducing debt between $450M and $500M and driving net leverage to ~2x 3 FY’26 – FY’28 LRP framework LRP reflects the execution of our three strategic priorities
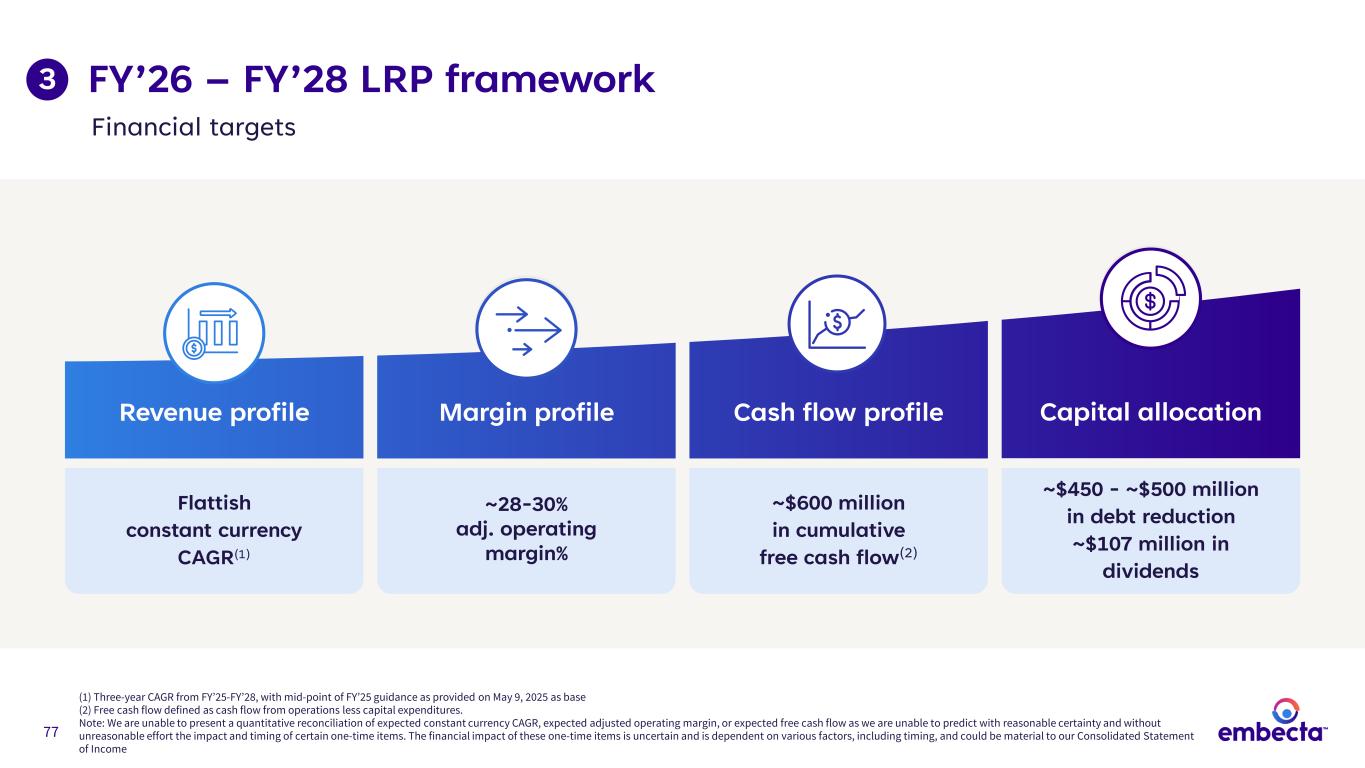
77 FY’26 – FY’28 LRP framework (1) Three-year CAGR from FY’25-FY’28, with mid-point of FY’25 guidance as provided on May 9, 2025 as base (2) Free cash flow defined as cash flow from operations less capital expenditures. Note: We are unable to present a quantitative reconciliation of expected constant currency CAGR, expected adjusted operating margin, or expected free cash flow as we are unable to predict with reasonable certainty and without unreasonable effort the impact and timing of certain one-time items. The financial impact of these one-time items is uncertain and is dependent on various factors, including timing, and could be material to our Consolidated Statement of Income Capital allocationCash flow profileMargin profileRevenue profile Flattish constant currency CAGR(1) ~28-30% adj. operating margin% ~$600 million in cumulative free cash flow(2) ~$450 - ~$500 million in debt reduction ~$107 million in dividends 3 Financial targets
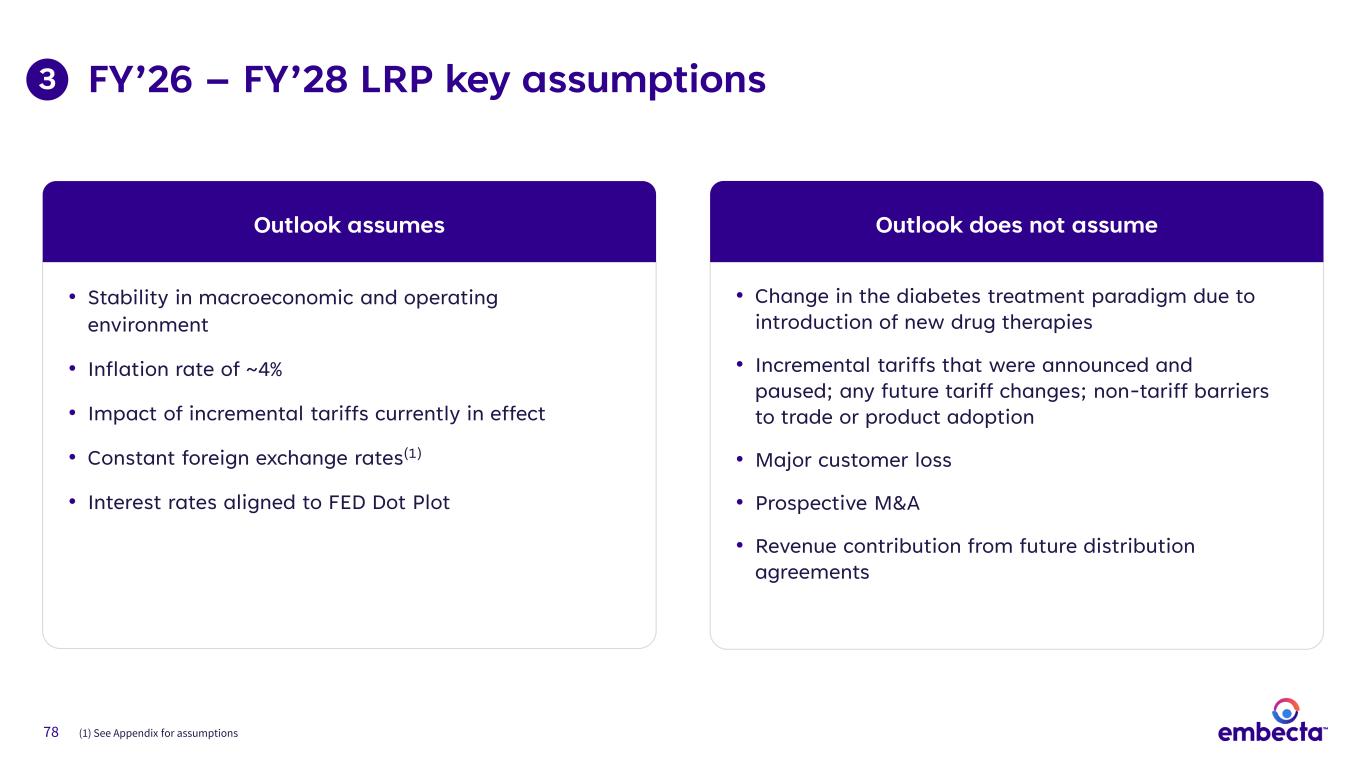
78 FY’26 – FY’28 LRP key assumptions • Stability in macroeconomic and operating environment • Inflation rate of ~4% • Impact of incremental tariffs currently in effect • Constant foreign exchange rates(1) • Interest rates aligned to FED Dot Plot Outlook assumes • Change in the diabetes treatment paradigm due to introduction of new drug therapies • Incremental tariffs that were announced and paused; any future tariff changes; non-tariff barriers to trade or product adoption • Major customer loss • Prospective M&A • Revenue contribution from future distribution agreements Outlook does not assume (1) See Appendix for assumptions 3
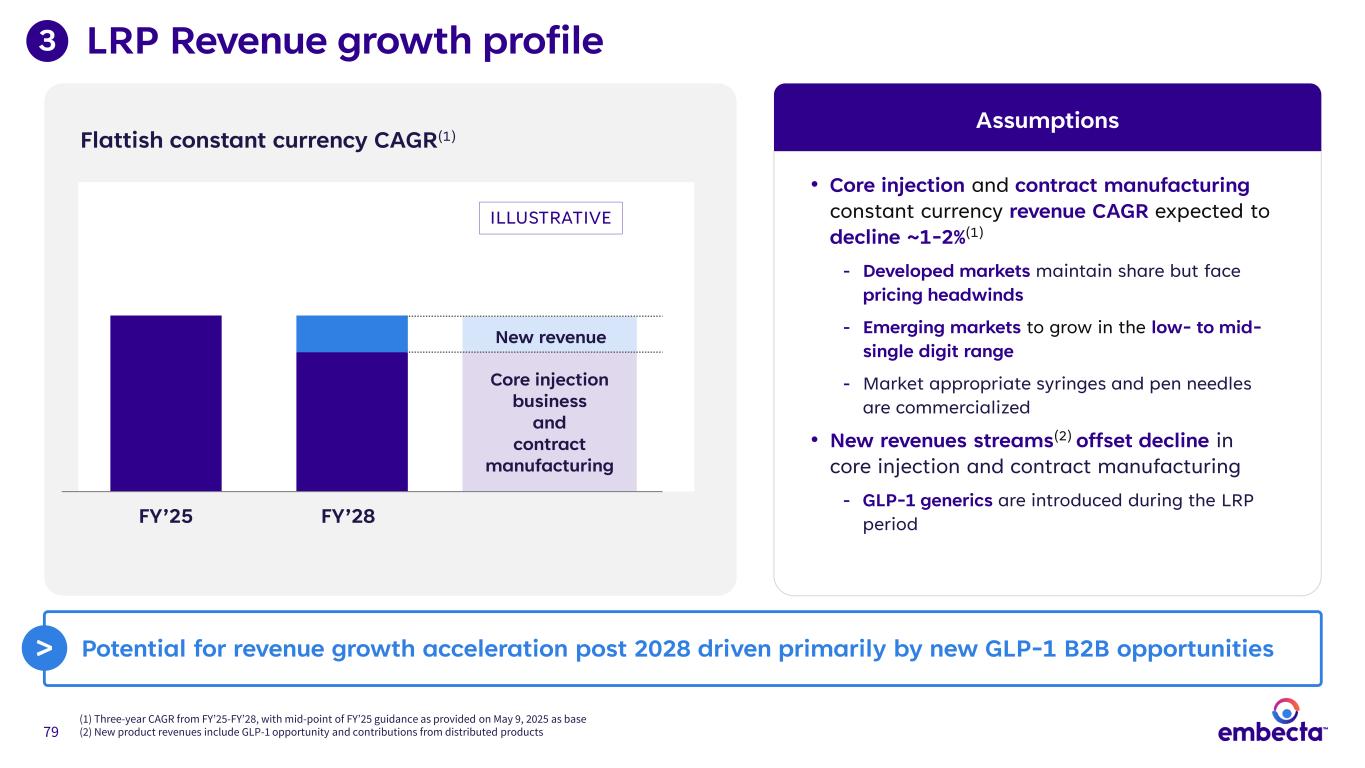
79 LRP Revenue growth profile (1) Three-year CAGR from FY’25-FY’28, with mid-point of FY’25 guidance as provided on May 9, 2025 as base (2) New product revenues include GLP-1 opportunity and contributions from distributed products 3 Flattish constant currency CAGR(1) FY’25 FY’28 New revenue Core injection business and contract manufacturing • Core injection and contract manufacturing constant currency revenue CAGR expected to decline ~1-2%(1) - Developed markets maintain share but face pricing headwinds - Emerging markets to grow in the low- to mid- single digit range - Market appropriate syringes and pen needles are commercialized • New revenues streams(2) offset decline in core injection and contract manufacturing - GLP-1 generics are introduced during the LRP period Assumptions Potential for revenue growth acceleration post 2028 driven primarily by new GLP-1 B2B opportunities> ILLUSTRATIVE
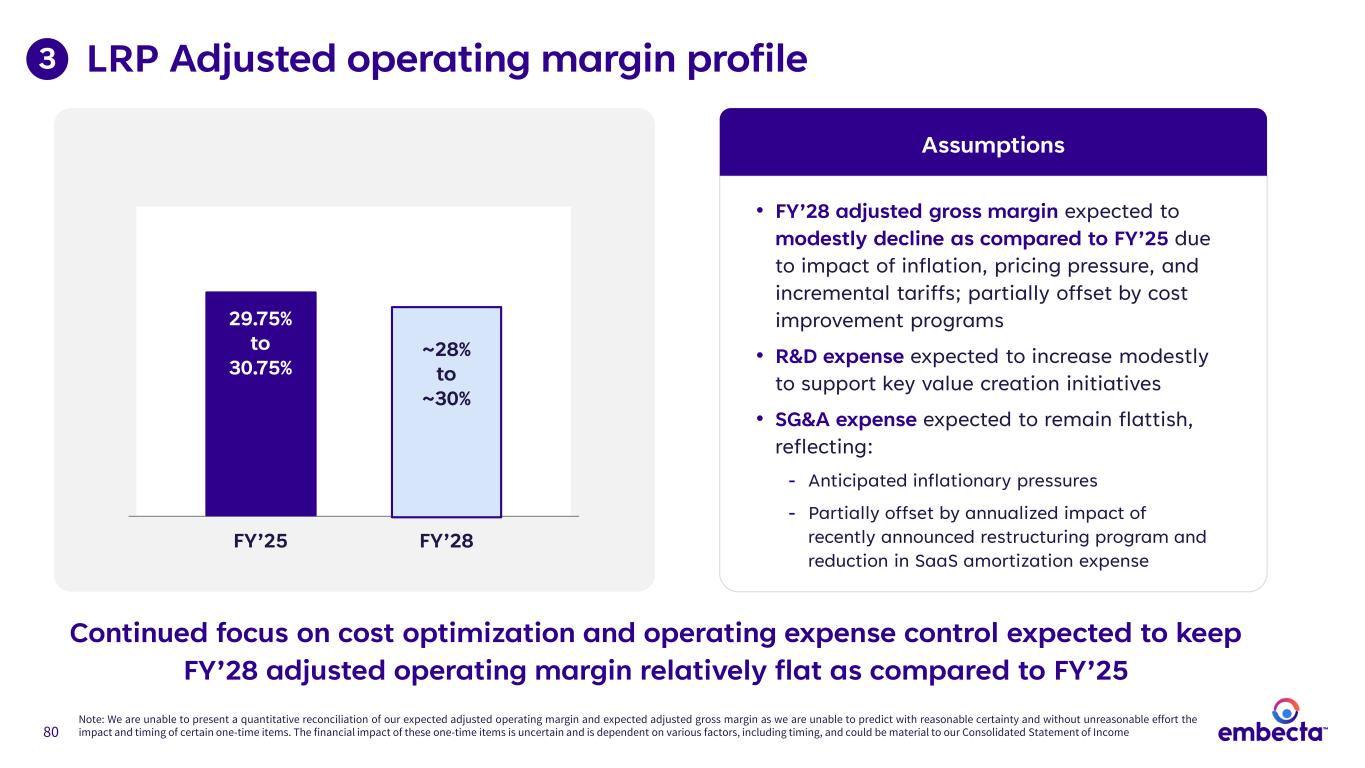
80 LRP Adjusted operating margin profile • FY’28 adjusted gross margin expected to modestly decline as compared to FY’25 due to impact of inflation, pricing pressure, and incremental tariffs; partially offset by cost improvement programs • R&D expense expected to increase modestly to support key value creation initiatives • SG&A expense expected to remain flattish, reflecting: - Anticipated inflationary pressures - Partially offset by annualized impact of recently announced restructuring program and reduction in SaaS amortization expense Assumptions 3 FY’25 FY’28 29.75% to 30.75% ~28% to ~30% Note: We are unable to present a quantitative reconciliation of our expected adjusted operating margin and expected adjusted gross margin as we are unable to predict with reasonable certainty and without unreasonable effort the impact and timing of certain one-time items. The financial impact of these one-time items is uncertain and is dependent on various factors, including timing, and could be material to our Consolidated Statement of Income Continued focus on cost optimization and operating expense control expected to keep FY’28 adjusted operating margin relatively flat as compared to FY’25
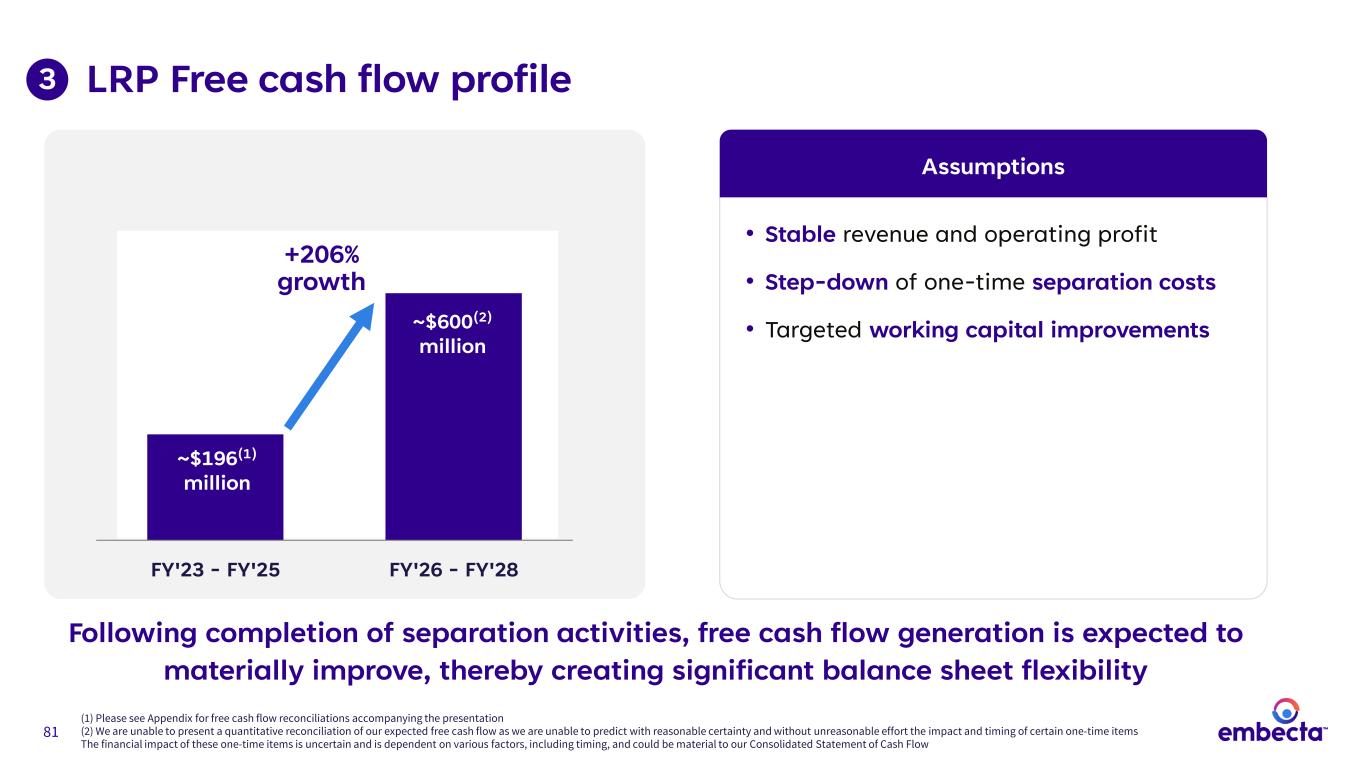
81 LRP Free cash flow profile • Stable revenue and operating profit • Step-down of one-time separation costs • Targeted working capital improvements Assumptions FY'23 - FY'25 FY'26 - FY'28 ~$196(1) million ~$600(2) million +206% growth 3 Following completion of separation activities, free cash flow generation is expected to materially improve, thereby creating significant balance sheet flexibility (1) Please see Appendix for free cash flow reconciliations accompanying the presentation (2) We are unable to present a quantitative reconciliation of our expected free cash flow as we are unable to predict with reasonable certainty and without unreasonable effort the impact and timing of certain one-time items The financial impact of these one-time items is uncertain and is dependent on various factors, including timing, and could be material to our Consolidated Statement of Cash Flow
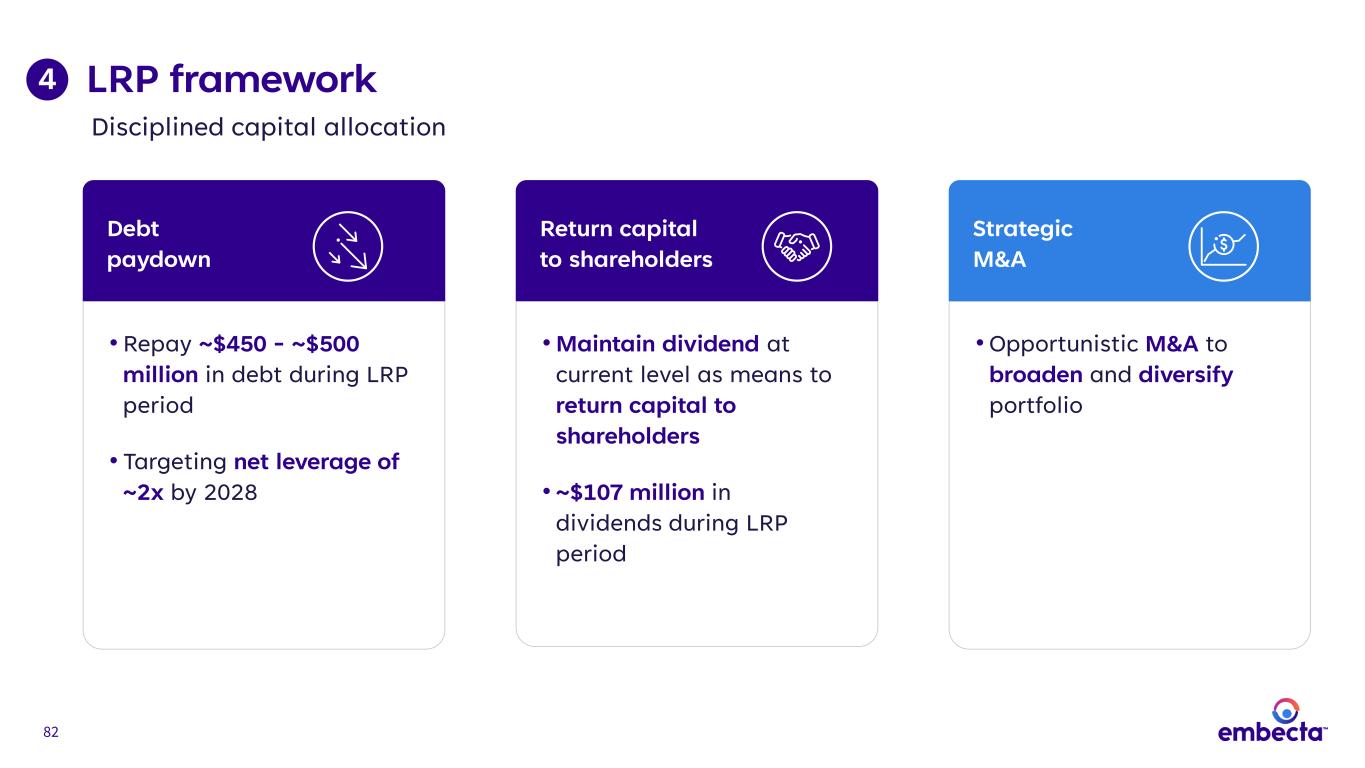
82 LRP framework4 Strategic M&A Debt paydown • Repay ~$450 - ~$500 million in debt during LRP period • Targeting net leverage of ~2x by 2028 • Opportunistic M&A to broaden and diversify portfolio Return capital to shareholders • Maintain dividend at current level as means to return capital to shareholders • ~$107 million in dividends during LRP period Disciplined capital allocation
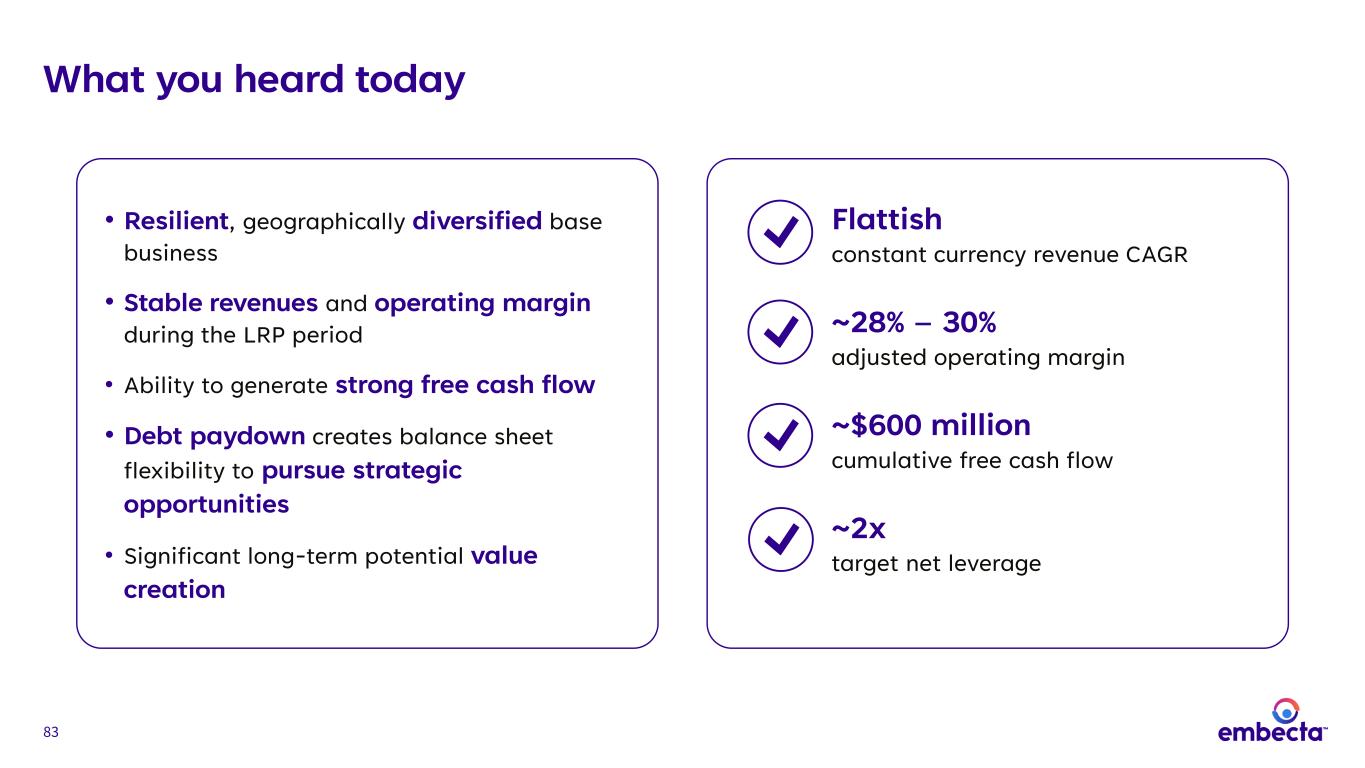
83 What you heard today Flattish constant currency revenue CAGR ~28% – 30% adjusted operating margin ~$600 million cumulative free cash flow ~2x target net leverage • Resilient, geographically diversified base business • Stable revenues and operating margin during the LRP period • Ability to generate strong free cash flow • Debt paydown creates balance sheet flexibility to pursue strategic opportunities • Significant long-term potential value creation

84 Q&A session

85 85 Appendix
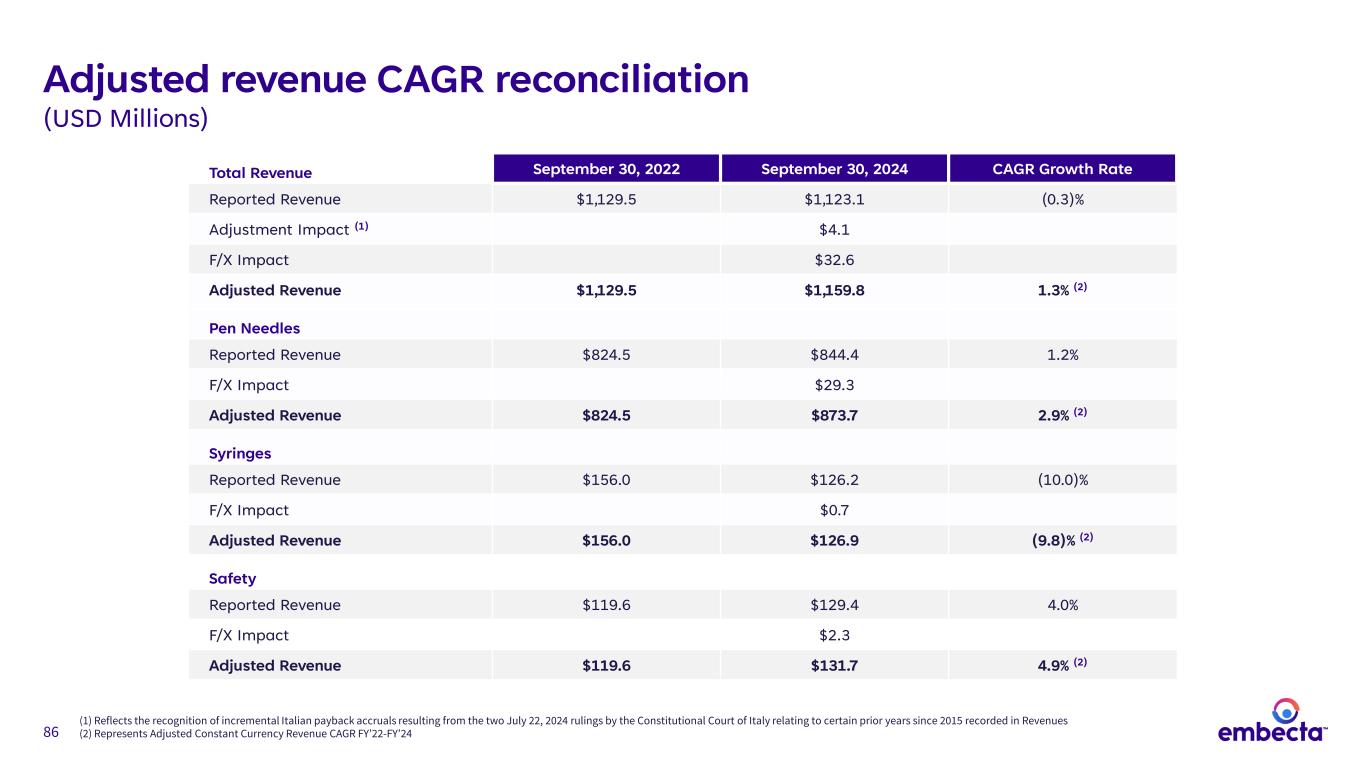
86 Adjusted revenue CAGR reconciliation (USD Millions) Total Revenue September 30, 2022 September 30, 2024 CAGR Growth Rate Reported Revenue $1,129.5 $1,123.1 (0.3)% Adjustment Impact (1) $4.1 F/X Impact $32.6 Adjusted Revenue $1,129.5 $1,159.8 1.3% (2) Pen Needles Reported Revenue $824.5 $844.4 1.2% F/X Impact $29.3 Adjusted Revenue $824.5 $873.7 2.9% (2) Syringes Reported Revenue $156.0 $126.2 (10.0)% F/X Impact $0.7 Adjusted Revenue $156.0 $126.9 (9.8)% (2) Safety Reported Revenue $119.6 $129.4 4.0% F/X Impact $2.3 Adjusted Revenue $119.6 $131.7 4.9% (2) (1) Reflects the recognition of incremental Italian payback accruals resulting from the two July 22, 2024 rulings by the Constitutional Court of Italy relating to certain prior years since 2015 recorded in Revenues (2) Represents Adjusted Constant Currency Revenue CAGR FY’22-FY’24
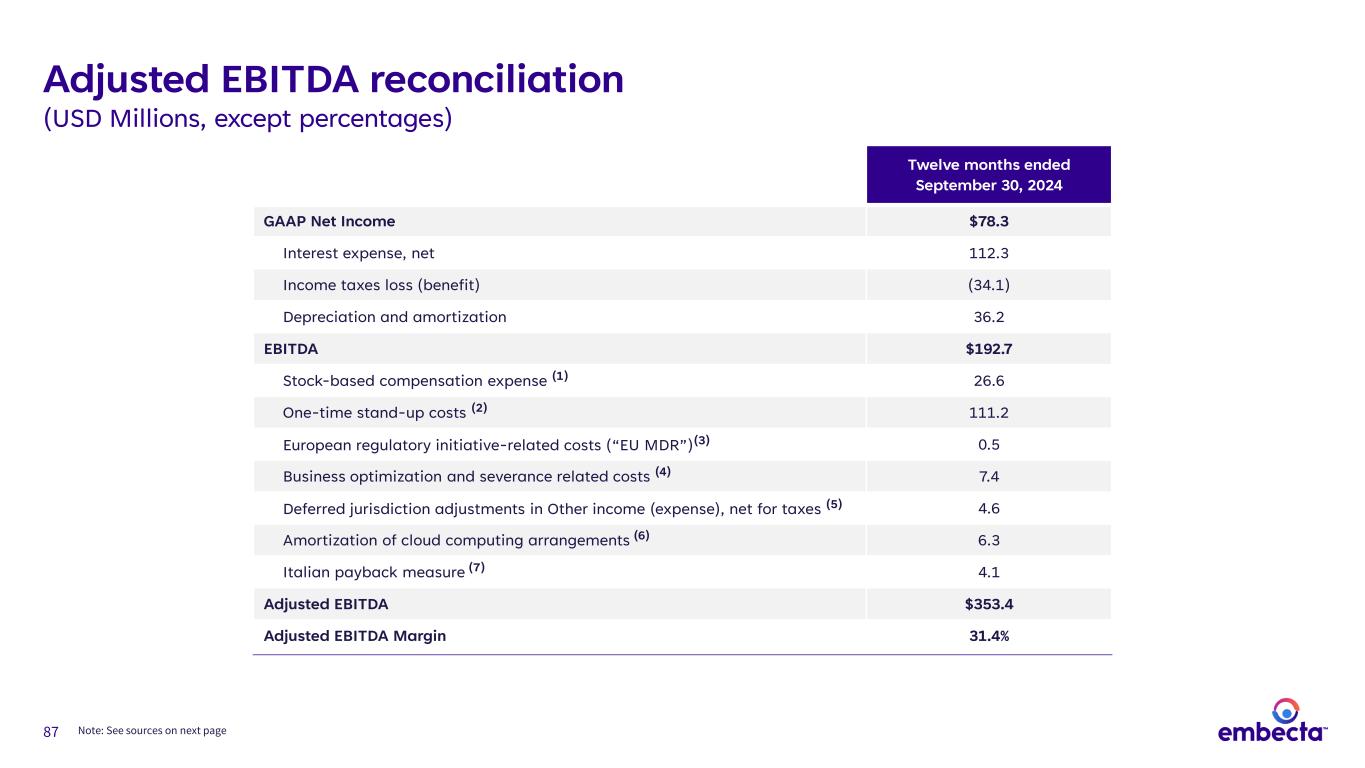
87 Twelve months ended September 30, 2024 GAAP Net Income $78.3 Interest expense, net 112.3 Income taxes loss (benefit) (34.1) Depreciation and amortization 36.2 EBITDA $192.7 Stock-based compensation expense (1) 26.6 One-time stand-up costs (2) 111.2 European regulatory initiative-related costs (“EU MDR”)(3) 0.5 Business optimization and severance related costs (4) 7.4 Deferred jurisdiction adjustments in Other income (expense), net for taxes (5) 4.6 Amortization of cloud computing arrangements (6) 6.3 Italian payback measure (7) 4.1 Adjusted EBITDA $353.4 Adjusted EBITDA Margin 31.4% Adjusted EBITDA reconciliation (USD Millions, except percentages) Note: See sources on next page
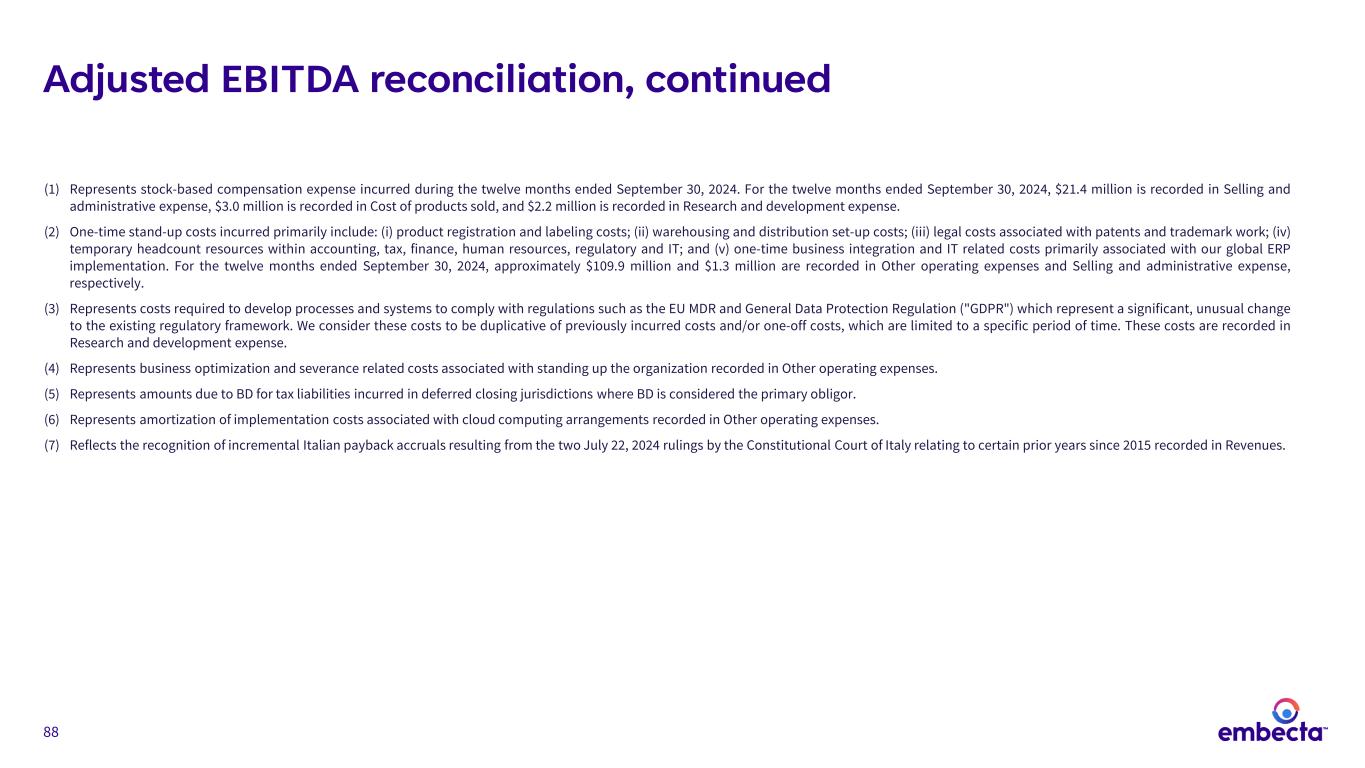
88 Adjusted EBITDA reconciliation, continued (1) Represents stock-based compensation expense incurred during the twelve months ended September 30, 2024. For the twelve months ended September 30, 2024, $21.4 million is recorded in Selling and administrative expense, $3.0 million is recorded in Cost of products sold, and $2.2 million is recorded in Research and development expense. (2) One-time stand-up costs incurred primarily include: (i) product registration and labeling costs; (ii) warehousing and distribution set-up costs; (iii) legal costs associated with patents and trademark work; (iv) temporary headcount resources within accounting, tax, finance, human resources, regulatory and IT; and (v) one-time business integration and IT related costs primarily associated with our global ERP implementation. For the twelve months ended September 30, 2024, approximately $109.9 million and $1.3 million are recorded in Other operating expenses and Selling and administrative expense, respectively. (3) Represents costs required to develop processes and systems to comply with regulations such as the EU MDR and General Data Protection Regulation ("GDPR") which represent a significant, unusual change to the existing regulatory framework. We consider these costs to be duplicative of previously incurred costs and/or one-off costs, which are limited to a specific period of time. These costs are recorded in Research and development expense. (4) Represents business optimization and severance related costs associated with standing up the organization recorded in Other operating expenses. (5) Represents amounts due to BD for tax liabilities incurred in deferred closing jurisdictions where BD is considered the primary obligor. (6) Represents amortization of implementation costs associated with cloud computing arrangements recorded in Other operating expenses. (7) Reflects the recognition of incremental Italian payback accruals resulting from the two July 22, 2024 rulings by the Constitutional Court of Italy relating to certain prior years since 2015 recorded in Revenues.
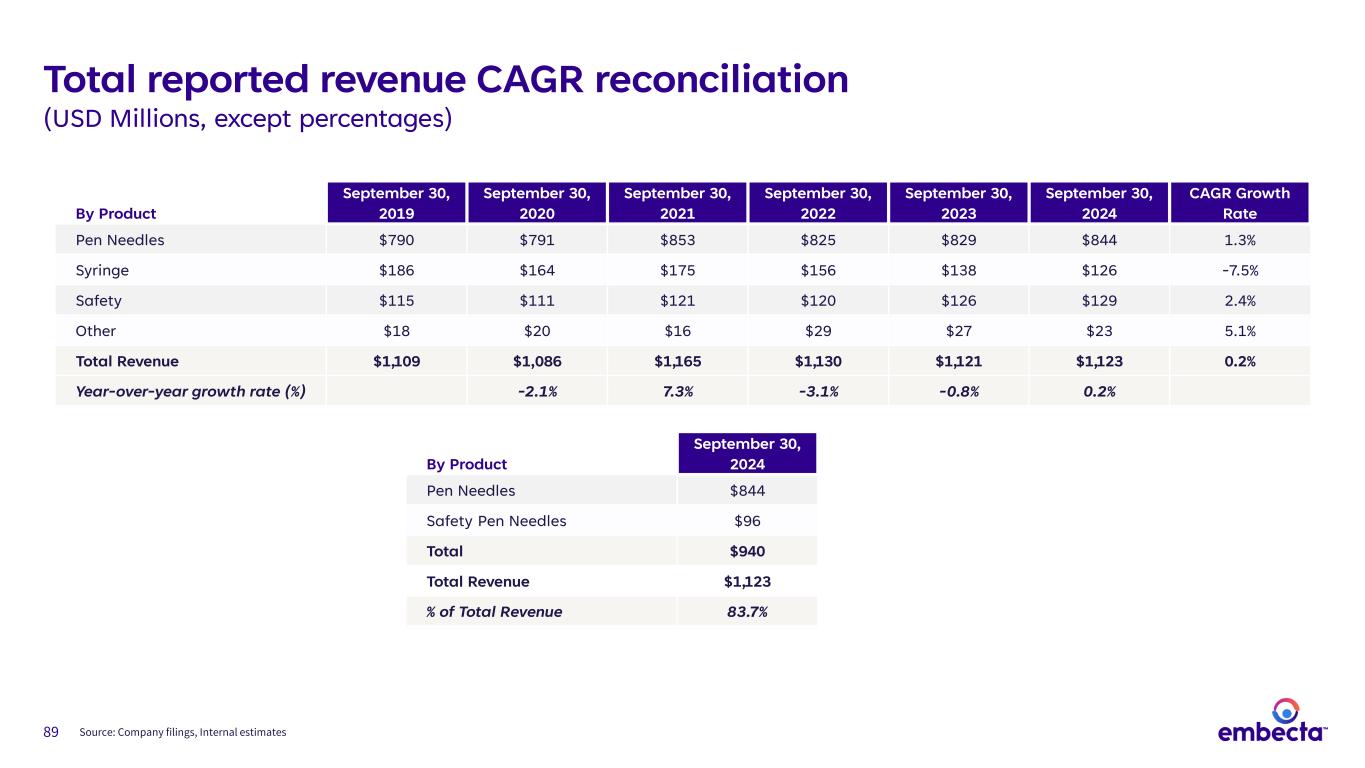
89 Total reported revenue CAGR reconciliation (USD Millions, except percentages) By Product September 30, 2019 September 30, 2020 September 30, 2021 September 30, 2022 September 30, 2023 September 30, 2024 CAGR Growth Rate Pen Needles $790 $791 $853 $825 $829 $844 1.3% Syringe $186 $164 $175 $156 $138 $126 -7.5% Safety $115 $111 $121 $120 $126 $129 2.4% Other $18 $20 $16 $29 $27 $23 5.1% Total Revenue $1,109 $1,086 $1,165 $1,130 $1,121 $1,123 0.2% Year-over-year growth rate (%) -2.1% 7.3% -3.1% -0.8% 0.2% Source: Company filings, Internal estimates By Product September 30, 2024 Pen Needles $844 Safety Pen Needles $96 Total $940 Total Revenue $1,123 % of Total Revenue 83.7%
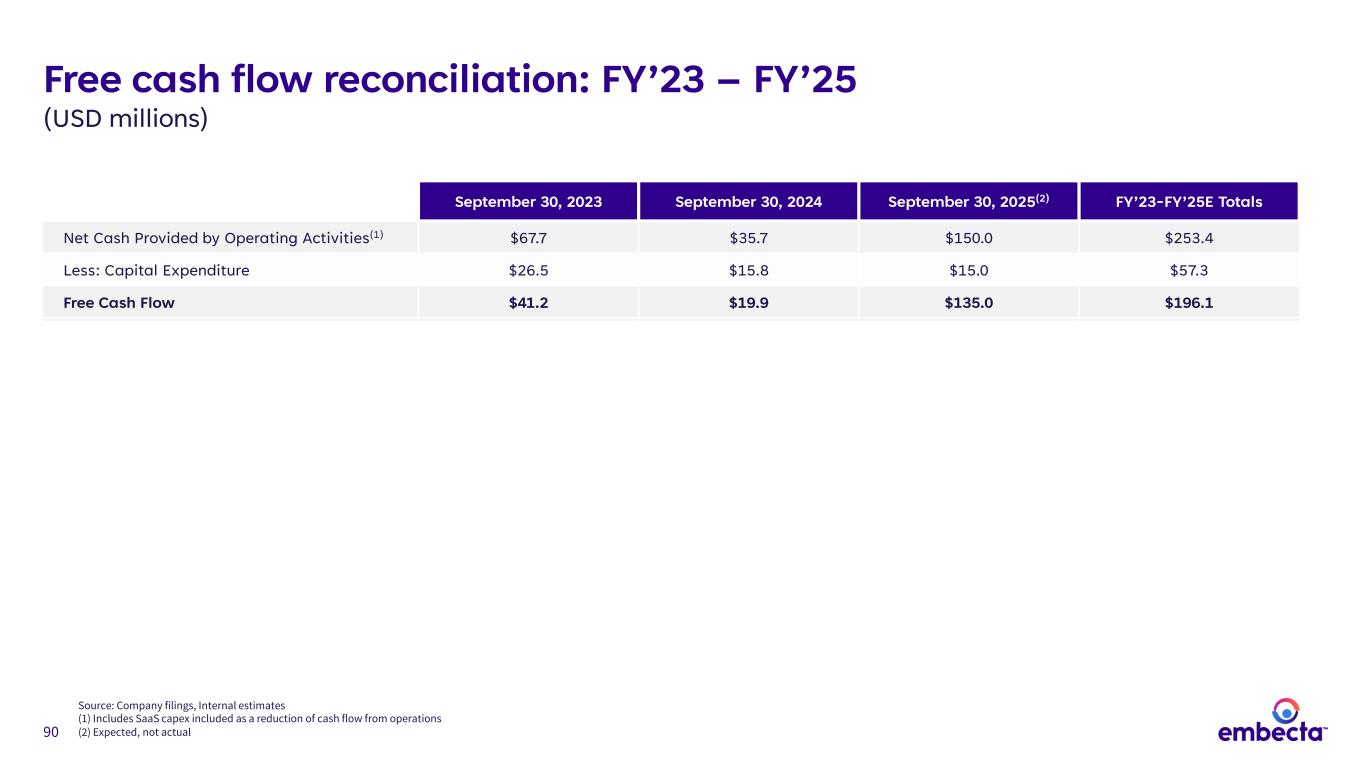
90 Free cash flow reconciliation: FY’23 – FY’25 (USD millions) September 30, 2023 September 30, 2024 September 30, 2025(2) FY’23-FY’25E Totals Net Cash Provided by Operating Activities(1) $67.7 $35.7 $150.0 $253.4 Less: Capital Expenditure $26.5 $15.8 $15.0 $57.3 Free Cash Flow $41.2 $19.9 $135.0 $196.1 Source: Company filings, Internal estimates (1) Includes SaaS capex included as a reduction of cash flow from operations (2) Expected, not actual
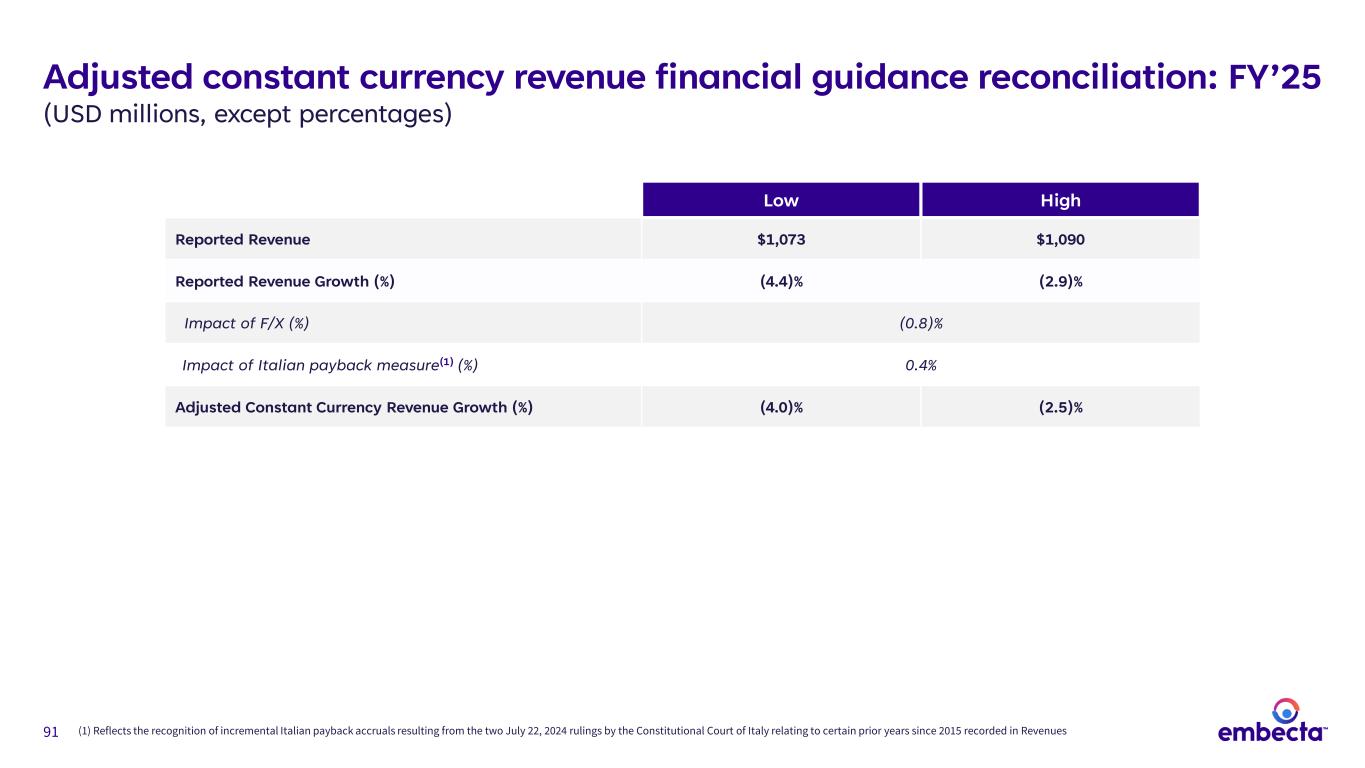
91 Adjusted constant currency revenue financial guidance reconciliation: FY’25 (USD millions, except percentages) Low High Reported Revenue $1,073 $1,090 Reported Revenue Growth (%) (4.4)% (2.9)% Impact of F/X (%) (0.8)% Impact of Italian payback measure(1) (%) 0.4% Adjusted Constant Currency Revenue Growth (%) (4.0)% (2.5)% (1) Reflects the recognition of incremental Italian payback accruals resulting from the two July 22, 2024 rulings by the Constitutional Court of Italy relating to certain prior years since 2015 recorded in Revenues
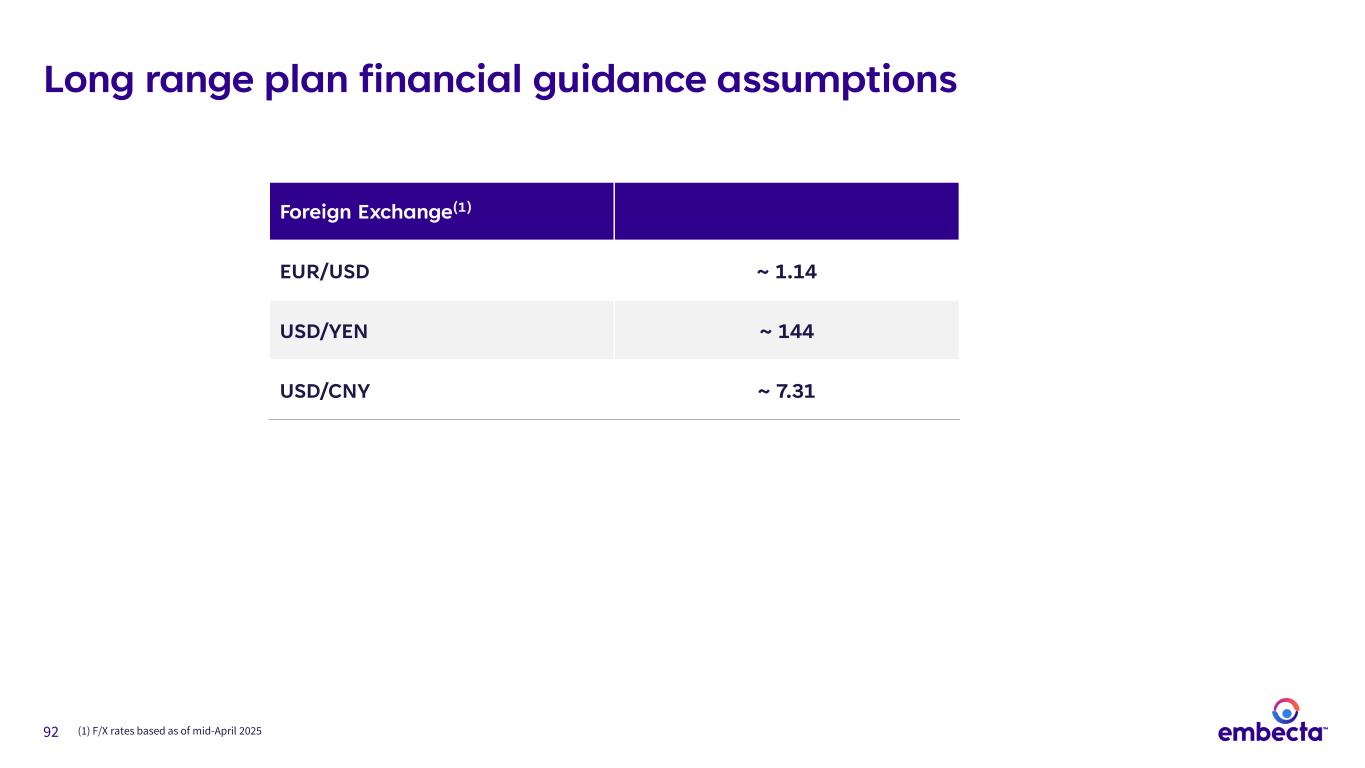
92 Foreign Exchange(1) EUR/USD ~ 1.14 USD/YEN ~ 144 USD/CNY ~ 7.31 Long range plan financial guidance assumptions (1) F/X rates based as of mid-April 2025